Article

The Impact of Local Chairpersons on Green Innovation: Evidence from China

School of Management, Yunnan Normal University, Kunming 650092, China
*
Author to whom correspondence should be addressed.
Sustainability 2025, 17(20), 9285; https://doi.org/10.3390/su17209285
Submission received: 8 September 2025 / Revised: 13 October 2025 / Accepted: 16 October 2025 / Published: 19 October 2025
(This article belongs to the Section Economic and Business Aspects of Sustainability)

Abstract

Drawing on prior research, this study analyzes panel data from listed companies (2013–2023) to examine how chairpersons’ local social connections affect corporate green innovation. Specifically, it explores how such networks provide access to resources and policy advantages through social capital, thereby shaping firms’ green innovation. The findings reveal that local chairpersons negatively affect firms’ green innovation. Firms led by local chairpersons undertake significantly fewer green innovation initiatives than those with non-local leaders. Moreover, ESG performance and a strong legal environment can mitigate the negative impact of local chairpersons on green innovation. In contrast, stable executive teams may alleviate the adverse effect of local chairpersons on corporate green innovation by curbing myopic managerial behavior and reinforcing a long-term strategic orientation.

1. Introduction

Environmental change is a major challenge faced globally. There is a broad consensus that advancing sustainable, green, and low-carbon development represents a collective pathway forward. China prioritizes green growth as a national objective, aiming to limit carbon emissions by 2030 and achieve carbon neutrality by 2060. The Chinese government has systematically institutionalized environmental governance through a tripartite policy framework that integrates pollution control, regulatory enhancement, and green innovation incentives [1]. Sustainable innovation plays a crucial role in advancing the goal of carbon neutrality. Under environmental regulatory pressure, companies are motivated to adopt green innovations as a strategic measure to boost shareholder returns [2]; mitigate compliance costs [3]; and ultimately improve financial performance [4], corporate reputation [5], and market valuation [6].
Prior studies have explored the diverse determinants of corporate green innovation, including the impact of sustainable fiscal measures [7], environmental regulations [8], and the institutional environment [9]. This study primarily examines the external influences and operational aspects that shape corporate green innovation. The role of executives’ local social capital at the internal micro-level remains a critical yet overlooked area in current scholarship.
This study examines internal corporate evidence while advancing the literature on green innovation. Specifically, we examine how the chairperson’s local social capital shapes corporate green innovation and investigate the underlying mediating mechanisms. We consider the chairperson’s social capital as the existing literature shows that it plays a critical role in corporate operations. For instance, research has shown that executives’ hometown ties represent a form of identity attachment and foster emotional embeddedness, serving as a source of social capital [10]. These connections can effectively stabilize and facilitate corporate business ties [11].
Our analysis empirically examines the hypotheses using extensive Chinese firm data from 2013 to 2023. The results indicate that there is a detrimental impact of local board chairpersons on corporate green innovation. In this study, three moderated models are constructed to integrate institutional pressures stemming from environmental, social, and governance (ESG) factors; the legal environment (LE); and senior management team stability (STMT). We further conduct heterogeneity tests based on relational networks, tenure, ownership, and industry regulation.
Our study significantly advances two key strands of the literature. First, it elucidates key drivers behind corporate environmental innovation. Prior studies have focused on external institutional forces (e.g., environmental regulations, government subsidies) [8,12,13], while our study addresses a critical gap by exploring how local chairpersons impact green innovation outcomes. We contribute to the green innovation literature by empirically demonstrating that firms with a local board chairperson exhibit significantly lower levels of green innovation. Second, our study expands the body of research on social capital, highlighting its variable impacts on corporate green innovation. Moreover, we reveal that senior executives leverage social capital strategically to minimize corporate green innovation costs. While the existing literature predominantly emphasizes the positive effects of hometown ties on corporate performance, our empirical evidence suggests that such social capital may engender negative externalities for environmental protection mechanisms.

2. Literature Review

2.1. Determinants of Green Innovation

Existing research indicates that green innovation is a key determinant in environmental pollution control. Notably, green intellectual property has generated significant financial returns in recent years [14]. In the corporate context, green innovation plays a pivotal role in achieving sustainable competitive advantage [15]. A substantial body of research has explored how environmental regulations externally influence green innovation. Nevertheless, empirical results reveal considerable inconsistencies. Certain analyses suggest that such regulatory measures may restrain the advancement of corporate green innovation [16]. In contrast, other studies indicate that establishing effective institutional green governance systems significantly promotes green innovation [17,18,19]. For instance, government subsidies can stimulate green innovation within companies [12,13], while green credit policies encourage innovation among both upstream and downstream firms in high-polluting industries [20]. Value-added tax rebate policies promote corporate green innovation [21], while institutional pressures exert significant constraints on green supply chain management, thereby driving green innovation activities [22]. Conversely, some scholars have found that reinforcing government environmental regulations does not improve green innovation quality [23]. In addition, regulatory pressure lacks incentive effects for green innovation in heavy-polluting industries [24].
Prior studies indicate that, alongside environmental policies, a company’s internal operational characteristics also significantly influence its adoption of green innovation: For instance, a company’s technological capability enhances its green innovation [25]. Drawing on Australian companies, export intensity and female leadership have been found to drive corporate green innovation [26]. Moreover, involving consumers encourages eco-friendly innovation within small and medium companies [27]. The adoption of digital tools in supply chains enables superior sustainability performance by increasing transparency and operational efficiency [28]. However, in institutionalized trust settings with quality human capital, greater supplier concentration may constrain green innovation due to reduced competitive pressures [29]. Digitalization exerts statistically significant effects on corporate green innovation [30]. Additionally, firms under ESG regulatory scrutiny exhibit stronger incentives for green innovation [31].
In China, studies indicate that artificial intelligence (AI) substantially enhances both the output and caliber of green innovation [32]. Conversely, green innovation may also introduce internal strategic ambiguity which, in turn, may result in discrepancies in debt maturity schedules [33]. The positive impact of government subsidies is more pronounced for non-green innovation compared to green innovation [34]. In addition, the advancement of green innovation is significantly restrained by managerial power [35]. In private firms, the proportion of state-owned equity exhibits a non-linear influence on green innovation, which is characterized by an initial increase followed by a decline. This curvilinear association is attenuated under administrative economic constraints, whereas environmental regulatory pressures markedly enhance it [36].

2.2. Local Social Capital for Executives

The existing literature elucidates the influence of executives’ native networks on corporate outcomes through the lens of social capital theory [37,38]. Chinese listed companies frequently employ guanxi-based business models, reflecting the characteristics of a typical “hometown society.” Long-term interactions founded on geographical proximity and kinship ties cultivate spatially embedded social capital among individuals. The local connections of executives represent their personal social capital, which can be used to leverage strategic resources for their companies. These endogenous endowments of social capital enable companies to secure improved financial accessibility [39], acquire additional government resources, and facilitate sustainable business model development [40]. In terms of resource mobilization, such hometown connections mitigate information asymmetry between firms and local financial intermediaries [41], thereby alleviating financing constraints and reducing effective borrowing costs [42]. According to executive social capital analysis, institutionalized relational capital significantly influences corporate innovation [43]. CEOs with prior green experience enhance stakeholder identification through visible green initiatives, thereby increasing the firm’s risk tolerance for green innovation [44]. Chairpersons with overseas experience demonstrate greater institutional capacity to drive corporate green innovation due to exposure to sustainable ideologies [45]. In the Chinese context, empirical evidence also exists. For instance, hometown ties can reduce initial public offering (IPO) underpricing by providing valuable information to investors [46]. Corporate environmental investment is positively influenced by CEOs who have hometown connections, as these leaders help ease financial limitations and strengthen the environmental commitment of their firms [47].
According to certain academic perspectives, social capital can have an adverse effect on green innovation [48,49], revealing its double-edged nature: while it facilitates access to resources, it may also impose constraints. This dualistic effect of social capital remains underexplored in the literature.

3. Research Hypotheses

Prior research shows that locally born chairpersons tend to access broader local social networks and accumulate more social capital than their foreign counterparts. In addition to this, the strong local social capital within a community plays a pivotal role in driving business expansion and professional development. According to Schutjens & Völker (2010), local social capital provides entrepreneurs with a significant advantage when launching new ventures [50]. Social capital can significantly influence a company’s business model [40]. Venture capitalists (VCs) located within five miles of a company’s headquarters are twice as likely to appoint board members to investee companies [51]. Zhu et al. (2018) found that a higher degree of connection between board members and the chairperson reduces the likelihood that the chairperson will be removed [42]. Moreover, familial ties embedded in a firm’s local networks (“home ties”) may weaken internal governance and increase favoritism toward chairpersons [52].
This study demonstrates that local chairpersons can acquire social capital more cost-effectively through kinship and friendship networks. Emotionally grounded trust in local connections typically fosters stronger relational bonds [52], and such ties enhance reputational capital [53], leading local partners to view corporate behavior more favorably [54].
China has implemented a tax-sharing fiscal system, in which the disparity between fiscal authority and financial resources results in distinctive regional characteristics within local economic structures. Local governments often function as both policymakers and policy implementers. Their revenue reliance on local firms exacerbates the tension between growth and environmental goals. Existing research indicates that local social connections often encourage opportunistic behavior.
Corporate misconduct has been explored in numerous studies regarding its connection with the social ties of top management [55]. For instance, hometown ties within executive teams significantly increase corporate tax avoidance [25]. Local chairpersons’ social capital mitigates green innovation pressure under environmental regulation through enhanced government communication channels. However, this regulatory leniency ultimately results in weaker green innovation performance.
H1. 
Local chairpersons have a negative impact on corporate green innovation.
Unlike conventional corporate innovation, green innovation aims to achieve both economic growth and ecological sustainability at the same time. As part of a non-market approach, strong ESG (environmental, social, and governance) performance encourages companies to focus more on environmental conservation, strengthen their social commitments, and improve governance. Robust ESG performance strengthens external confidence in corporate operations, thereby significantly enhancing green innovation [56,57]. However, research demonstrates that ESG divergence exacerbates managerial myopia, thereby creating green innovation bubbles and reducing innovation quality [58]. Under rigorous regulatory frameworks, positive ESG performance exerts an inverse moderating effect on the relationship between stringent environmental policies and progress in green innovation [59]. Firms with low ESG ratings exhibit greater green innovation engagement than higher-rated counterparts [60]. For companies already leading in ESG rankings, the marginal improvement from additional green innovation investment diminishes significantly. In this context, local chairpersons are more likely to utilize their social capital to prioritize local projects with immediate political or private benefits over highly uncertain, long-term green frontier research. This strategic choice exacerbates the detrimental effect of local ties on green innovation. In institutionally robust contexts where formal rules are flexibly implemented, firms leverage relational networks to manage institutional pressures [61]. In such institutionally robust contexts, local chairpersons’ social resources attain enhanced strategic value. High-ESG-rated firms are compelled to concurrently meet multi-dimensional environmental and social requirements, which already impose substantial resources. Under these circumstances, local chairpersons are more likely to leverage their social capital to redirect the company’s allocable resources to local government and business projects. Such reallocations displace green innovation investments, resulting in a more significant decline in innovative output.
H2. 
ESG performance can mitigate the negative impact of local chairpersons on corporate green innovation.
In contexts where property rights frameworks are underdeveloped and political governance mechanisms exhibit relative instability during institutional transitions, businesses are exposed to increased operational costs and heightened uncertainty. This situation is particularly pronounced for companies situated in regions with stronger legal environments, where regulations are more comprehensive and the enforcement of judicial and administrative laws is more stringent [62]. However, a strong property rights-based legal environment (LE) does not preclude the role of informal relationships. A local CEO’s social connections create “obligations and expectations” within the network, which incentivize heightened corporate social responsibility engagement. This engagement, however, is instrumentally motivated by reciprocity rather than genuine altruism [63]. Under a stringent legal environment where environmental compliance costs are significantly high, local chairpersons may leverage their influence to resist or circumvent strict regulations. Although such measures might safeguard regional economic interests in the near-term by delaying sustainable transitions, they essentially serve as a means of reciprocating social capital among involved actors. In these situations, existing social resources are leveraged to oppose environmental innovation initiatives, thereby reinforcing disincentives for the adoption of green technologies. Furthermore, in regions with high legal effectiveness, companies do not reduce their relational reliance but strategically utilize local resources to seek operational flexibility and secure scarce resources within the robust legal framework [64]. In a strong legal environment, the judiciary is highly credible, and the consequences of non-compliance are severe. Under these circumstances, the value of a local chairperson lies precisely in their ability to convert social capital into regulatory leniency. Consequently, companies exhibit greater reliance on these individuals rather than engage in costly green innovation.
H3. 
Legal Environment (LE) can effectively enhance the negative relationship between local chairpersons and corporate green innovation.
Drawing on upper echelons theory, existing research demonstrates that the demographic characteristics and cognitive bases of top management teams significantly influence strategic decision-making processes and overall organizational performance. A stable top management team exerts significant influence on a company’s sustainable innovation [65] and can mitigate agency costs between the chairperson and shareholders while ensuring the implementation of long-term strategies. The social connections of a local chairperson represent a “double-edged sword.”
High stability within the top management team (TMT) is positively associated with extended member tenure and enhanced strategic commitment to organizational objectives. This phenomenon stems from the cumulative effect of shared experiences and cognitive alignment among TMT members, which fosters institutional memory and reinforces strategic consistency over time. This, in turn, fosters a robust capacity to monitor [66] and counterbalance high-level decision-making [67]. A stable management team demonstrates a stronger commitment to executing a company’s long-term strategies (green innovation). Such a team can effectively channel the chairperson’s local social capital to support—rather than supplant—green innovation activities. For instance, this involves leveraging hometown ties to secure critical green technology information or policy support instead of seeking regulatory exemptions. In contrast, an unstable team lacks the requisite cohesion and long-term orientation. It is more likely to acquiesce to—or fail to constrain—the chairperson’s use of social connections for short-term rent-seeking behaviors.
H4. 
The stability of the executive team can mitigate the negative impact of local chairpersons on corporate green innovation.

4. Research Design

4.1. Data Source and Sample Selection

The initial dataset comprised all A-share enterprises listed on the Shanghai and Shenzhen stock exchanges from 2013 to 2023. Information on these publicly listed entities was sourced from the Chinese Research Data Services Platform (CNRDS), WIND, and the China Stock Market & Accounting Research (CSMAR) databases. To address missing data, additional information was collected from online sources, annual publications, and news outlets.
This study excludes the following: (1) companies lacking information on the chairperson’s hometown; (2) companies in the financial and real estate sectors; (3) companies under financial distress; and (4) companies with incomplete financial data. The final sample comprises 10,359 valid observations from 2013 to 2023, covering 1777 companies.

4.2. Model Specification

For testing hypotheses, we constructed the following model:
Multiple regression model 1 is used to examine the impact of local chairpersons on companies’ green innovation:
G P A T E N T i , t + 1   = β 0   +   β 1 L O C A L i , t + C o n t r o l s i , t + Y e a r + I n d u s t r y + ε i , t
Multiple regression model 2 includes an interaction term between local chairpersons and the ESG performance of listed companies to assess how ESG moderates the relationship between local chairpersons and companies’ green innovation:
G P A T E N T i , t + 1 = β 0 + β 1 L O C A L i , t + β 2 L O C A L i , t × E S G i , t + C o n t r o l s i , t + Y e a r + I n d u s t r y + ε i , t
Multiple regression model 3 includes an interaction term between the local chairperson and the legal environment (LE) to evaluate the moderating effect of the degree of legal improvement on the relationship between local chairpersons and a company’s green innovation:
G P A T E N T i , t + 1 = β 0 + β 1 L O C A L i , t + β 2 L O C A L i , t × L E i , t + C o n t r o l s i , t + Y e a r + I n d u s t r y + ε i , t
Multiple regression model 4 includes an interaction term for local chairpersons and executive team stability to examine the moderating effect of management stability on the relationship between local chairpersons and a company’s green innovation.
G P A T E N T i , t + 1 = β 0 + β 1 L O C A L i , t + β 2 L O C A L i , t × S T M T i , t + C o n t r o l s i , t + Y e a r + I n d u s t r y + ε i , t

4.3. Definition and Measurement of Variables

4.3.1. Dependent Variable

The corporate green innovation data used in this study are sourced from the CNRDS platform. This database adopts the “International Green Patent Classification” system—established by the World Intellectual Property Organization—to classify green patent applications. In this study, we aggregate green invention and utility patent applications following Pang & Wang (2020) [68]. To reduce the impact of zero values in firm-level data, we used the natural logarithm of the total number of green patent applications plus one.
To ensure logical consistency in causal relationships, green innovation was measured using patent applications from the preceding period, and it is denoted as GPATENTi,t+1.

4.3.2. Independent Variables

In the Chinese context, as the top executive of an enterprise, the chairperson exerts the most significant influence on the formulation of the company’s strategic decisions. Following the research of Fisman et al. (2023) [69], this study focuses on chairpersons as the primary research subject. We collect data on the birthplaces of chairpersons of listed companies using three approaches: first, using executive information disclosed in the Cathay Pacific financial database, extracting details of the chairperson’s birthplace from their resumes across various financial databases via web scraping and manually gathering information through Internet searches; second, querying the company’s profile on the Juchao Information Network to identify the company’s office location; third, matching the chairperson’s birthplace with the company’s office location. If the birthplace of the chairperson of company i in period t matches the location of the company’s headquarters, the variable LOCALi,t is set to 1; otherwise, it is set to 0.

4.3.3. Moderating Variables

Firstly, the model controls for the firm’s sustainability performance, using the ESG score from the China Securities Index Co., Ltd. (CSI ESG) (Firstly, the model controls for the firm’s sustainability performance by incorporating the ESG score provided by China Securities Index Co., Ltd. (CSI ESG). The ESG data were obtained from the CSMAR database.The CSI ESG Ratings constitute a comprehensive evaluation system assessing Chinese listed companies’ environmental (E), social (S), and governance (G) practices.) rating system to evaluate its ESG performance through a comprehensive framework covering three dimensions: environment (E), social (S), and governance (G) [70]. The CSI ESG evaluation segregates all listed entities into nine hierarchical categories—ranging from C to AAA and ordered from the lowest to the highest. In this study, a numerical scale ranging from 1 to 9 is applied to the grading system, where 1 corresponds to the minimum value and 9 corresponds to the maximum value. The yearly assessment result serves as the definitive ESG rating for the company in each respective year. To address potential endogeneity between ESG and green innovation, this study employs a one-period lagged ESG value, denoted as ESGi,t+1. The second is the legal environment (LE). With reference to Chen et al. (2018) [71] and Zeng et al. (2021) [72], this variable is assessed using the China Marketization Index (NERI Index), which reflects the market development level of various provinces in China. In the NERI index, the assessment of legal effectiveness incorporates the advancement of market intermediary organizations and the quality of the legal institutional framework [73]. A higher score indicates a greater degree of market orientation and a stronger legal framework. The third variable is the stability of the executive team (STMT). With reference to Zhang et al. (2018) [74], this is measured on a scale from 0 to 1. Values closer to 1 indicate greater company executive team stability.

4.3.4. Control Variables

This study follows Ren et al. (2021) [49,75]. We incorporate several control variables across three key categories: First, we examine chairperson attributes, such as age (AGE) and gender (GENDER). Second, this study examines a range of corporate-level indicators, such as firm size (SIZE), leverage ratio (LEV), profitability (ROA), operating income growth (GROWTH), cash flow patterns, and ownership concentration (STRU), whether the enterprise is state-controlled (SOE), and the company’s longevity (FIRM-AGE). Third, we consider geographic factors, such as the air quality index (AQI) and per capita GDP (PGDP). These variables are comprehensively presented in Table 1.

5. Empirical Analysis Results

5.1. Descriptive Statistics

Table 2 presents descriptive statistics that examine the association between the chairperson’s locality and corporate green innovation based on a sample of 10,359 observations.
From the results in Table 2, it is evident that the number of exclusions is minimal, which is reasonable given the multi-conditional sample screening process. The mean value of corporate green innovation is 0.995, with a standard deviation of 1.322, falling within a reasonable range. The mean value of the chairperson gender variable is 0.337, with a standard deviation of 0.473; the proportion of localized chairpersons ranges from 0% to 100%, with a mean of 33.7%. This indicates that it is relatively common for chairpersons of listed companies to be localized, meaning that this proportion should not be overlooked. The descriptive statistics of other variables also fall within a reasonable range.

5.2. Baseline Regression Results

This study employs a baseline regression approach to empirically assess how chairpersons affect corporate green innovation. The initial findings for Model (1) are derived by including industry and year fixed effects while excluding control variables in the regression analysis. Column (2) of Table 3 presents the regression results after including control variables. The regression coefficients for the board chair’s local presence in listed firms remain significantly negative at the 1% level, both with and without the addition of control variables, as evidenced by a comparison of the results. Furthermore, after incorporating the control variables into the model, the regression coefficient remains significantly negative at the 1% level. This indicates that companies with local chairpersons engage in less green innovation. In column (2), the value of LOCAL is −0.101, suggesting that—assuming that other factors are constant—a change in the chairperson’s origin from non-local to local is associated with an average reduction of 0.101 patents in the company’s green innovation level. Thus, H1 is supported.

5.3. Endogeneity Issues

Research examining how chairpersons’ hometown connections affect corporate environmental innovations highlights concerns about endogeneity arising from potentially omitted variables. For instance, local government policy orientations may simultaneously influence both the selection of chairpersons and companies’ green innovation efforts, potentially biasing the estimation results. To address these endogeneity concerns, this study employs the Heckman two-stage instrumental variable approach (IV-Heckit) and conducts difference-in-differences (DID) tests as robustness checks.

5.3.1. IV-Heckit

The Heckman two-stage instrumental variable model (IV-Heckit) effectively addresses sample selection bias and other general endogeneity issues. Our primary explanatory variable—chairperson localism—is relatively exogenous because chairpersons cannot influence their place of birth. However, to further mitigate potential endogeneity concerns that may affect the findings, we follow the method of Ren et al. (2021) [75] and employ the natural logarithm of the number of traditional Chinese religious temples and Taoist shrines in a province (Temp) as an instrumental variable. This enables us to address endogeneity through a two-stage regression analysis. In regions with a higher density of temples and Taoist monasteries, social mobility is generally lower, which results in more stable and closely knit local social networks. Consequently, companies are more likely to have chairpersons from their hometown. The establishment of temples is a historical event, and their numbers were determined decades before listed companies made contemporary green innovation decisions. As a predetermined variable, temple density cannot be reversely influenced by current corporate operational decisions—such as green innovation—or by contemporary socio-economic factors. Moreover, as hubs of traditional communities, temple density reflects the strength of geographical ties and local social bonds. This informal institution shapes the network structure of an “acquaintance society,” thus increasing the likelihood of local elites assuming leadership roles in enterprises—particularly in township enterprises controlled or transformed by local capital. However, the traditional religious and cultural foundations of a region are not directly linked, in theory, to corporate decisions regarding green technology R&D or emission reduction pressures in the modern market economy. They function mainly by influencing the selection of corporate executives, rather than directly affecting aspects related to “technology” and “investment.” Therefore, the nature of these religious institutions satisfies the theoretical requirement of exogeneity for empirical analysis, as they are unlikely to directly affect green innovation.
The two-stage regression estimates using the temple count as an instrumental variable are presented in Table 4. Column (1) provides the estimates where this variable serves as an instrument for local board chairpersons. The two-stage regression analysis employs the number of temples and Taoist temples as an instrumental variable. The results reveal statistically significant positive coefficients at the 1% level, supporting a positive association between the quantity of religious sites and local chairpersons. The first-stage F-statistic is 160.06 and statistically significant, suggesting no weak instrument problem. Additionally, the second-stage analysis reveals a statistically significant adverse impact of local chairpersons on green innovation at the 1% significance level. This outcome confirms that the inverse association persists after accounting for potential endogeneity issues.

5.3.2. Difference in Differences (DID)

This study employs chairperson turnover events in listed firms as a natural experiment to assess whether the appointment or departure of local chairpersons influences corporate green innovation, thereby mitigating potential endogeneity concerns related to omitted variables. Specifically, we define two categories of leadership transitions: (1) In the treatment group, firms transition from local to non-local chairpersons (LOCAL is 1-0), while the control group comprises firms that retain local chairpersons over the entire period (LOCAL remains 1). (2) In the second scenario, the treatment group consists of firms that switch from non-local to local chairpersons (LOCAL is 0-1), with the control group made up of firms that continuously employ non-local chairpersons (LOCAL stays at 0). To define the POST dummy variable, we use a seven-year observation period that covers three years preceding and following each chairperson’s turnover. Specifically, POST equals 1 if the observation falls within the three years after the turnover event, and it is 0 otherwise. According to the results presented in column (1) of Table 5, the coefficient for the interaction term TREAT × POST is statistically significant and positive at the 10% significance level, implying that companies increase green innovation after appointing non-local chairpersons. In contrast, column (2) shows a negative coefficient that is significant at the 5% level, suggesting that companies reduce green innovation after switching to local chairpersons. These results confirm that chairperson turnovers involving local and non-local executives are associated with significant differences in corporate green innovation. The observed patterns are consistent with our theoretical predictions in Hypothesis H1, confirming that the hometown identity of chairpersons systematically influences companies’ green innovation strategies.
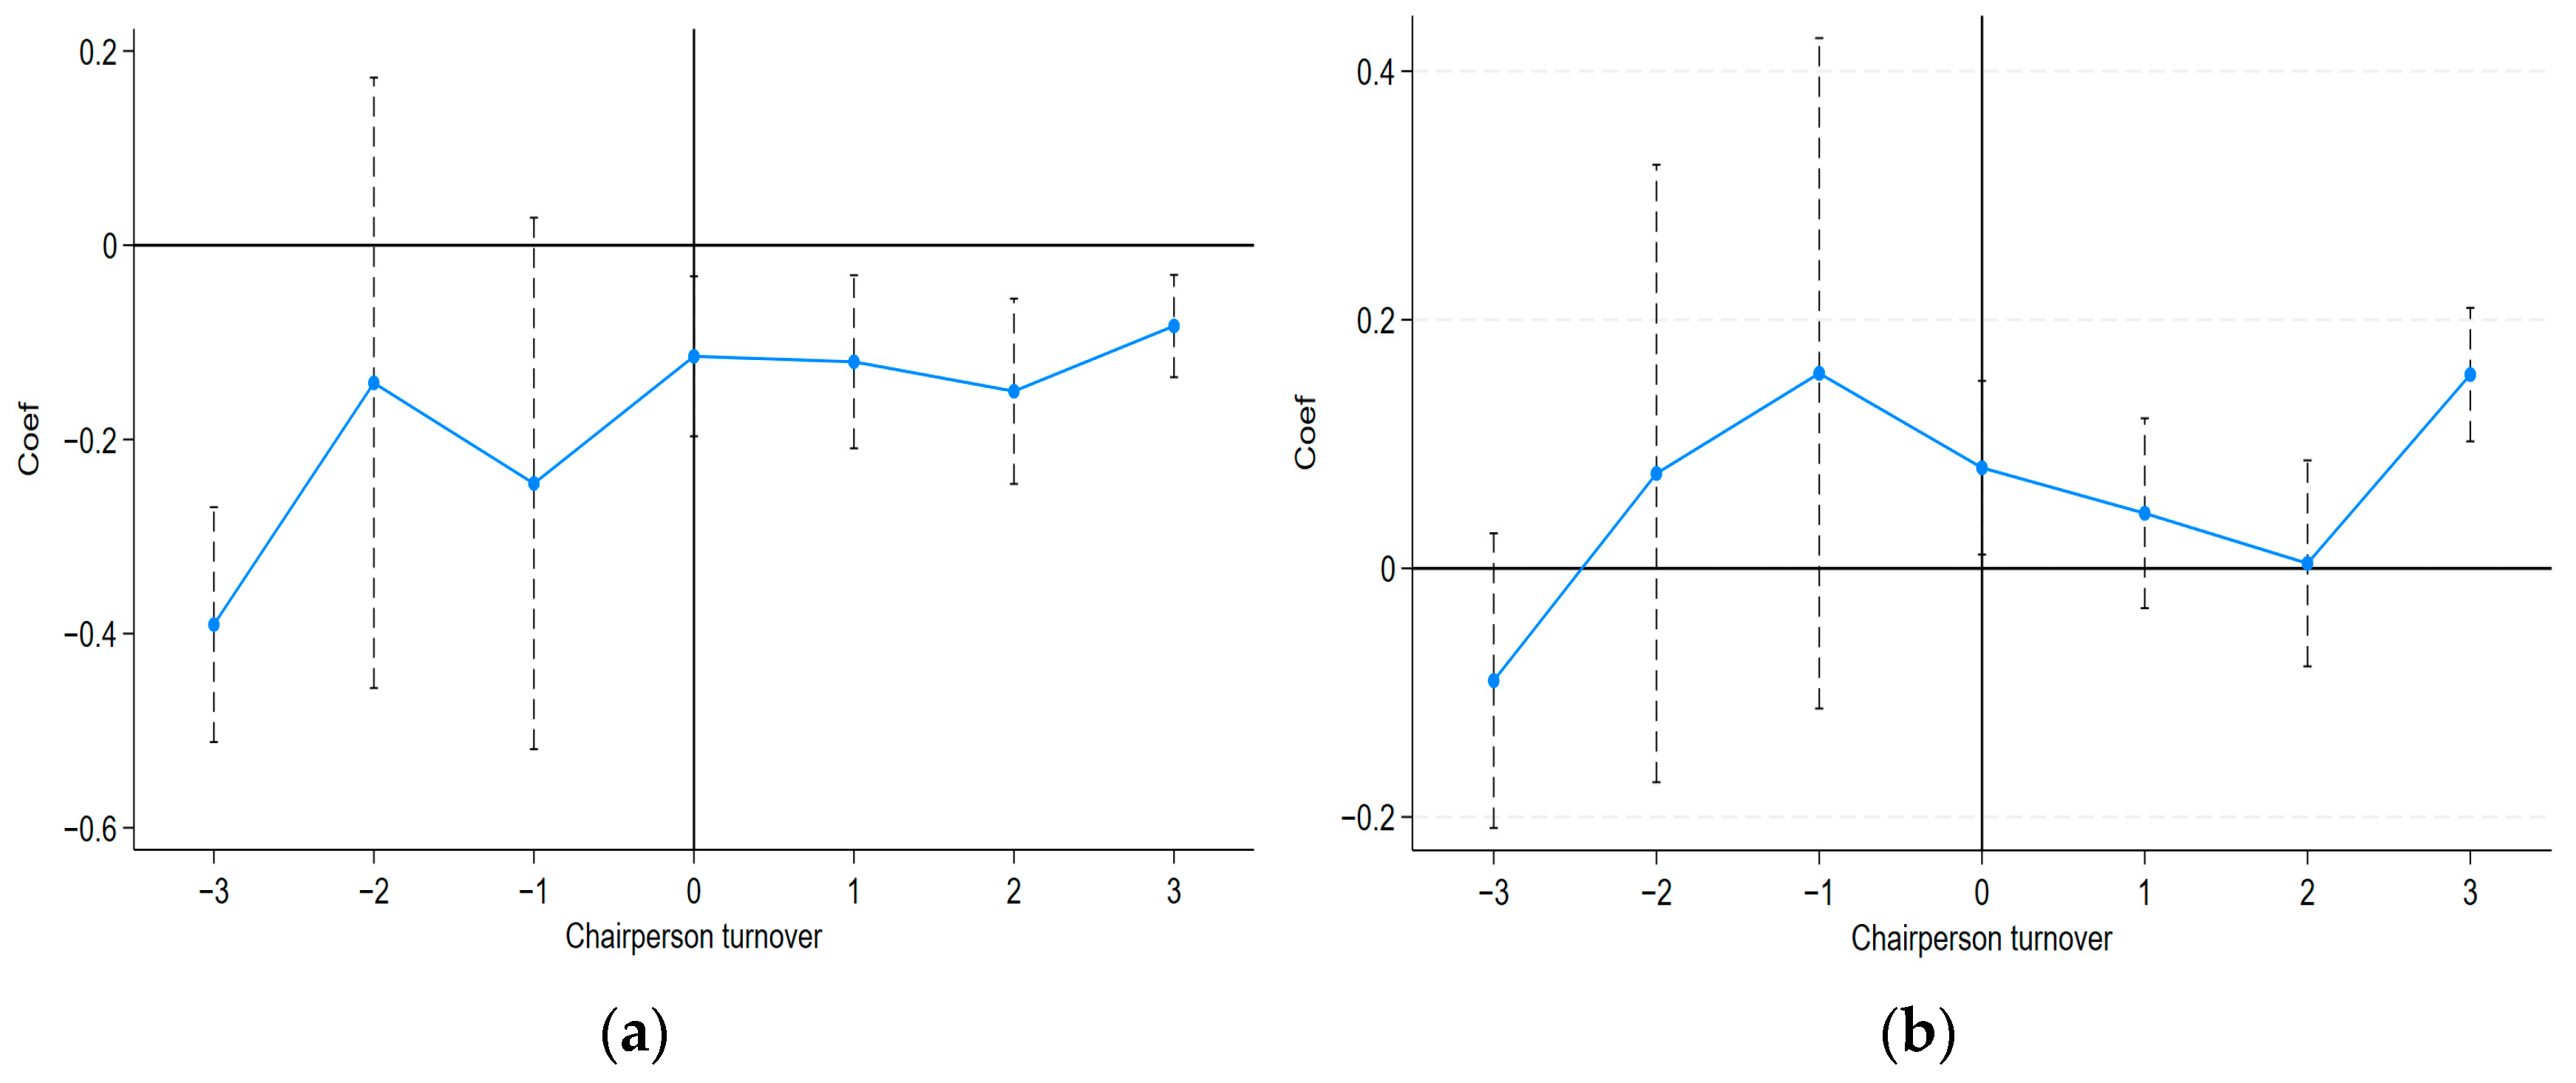
To evaluate whether the parallel trend assumption holds, we conducted an analysis using seven event-time dummy variables in place of the combined POST indicator. These variables cover the three years preceding and the three years following the chairperson’s transition, where the year of turnover is designated as T = 0. The estimated coefficients for these periods are plotted in Figure 1a,b. The results show no statistically significant pre-trends in green innovation prior to the event. Figure 1 illustrates the evolving trends in green innovation levels before and after the chairperson- turnover treatment event. Before the event (T < 0), no systematic differences in green innovation levels are observed between the treatment and control groups, and the coefficients fluctuate near zero and lack statistical significance—thus satisfying the parallel trend assumption. After the event (T ≥ 0), Figure 1a shows negative coefficients, indicating that local chairpersons suppress green innovation, which supports H1’s prediction of a negative effect. Figure 1b shows statistically significant positive estimates. Although the delayed nature of green innovation outcomes may explain the non-significant results in the immediate post-event periods (T = 1, T = 2), the significantly higher estimates via T = 3 indicate that replacing local chairpersons with non-local ones enhances corporate green innovation, with effects strengthening over time.
The research based on our difference-in-differences (DID) design helps address endogeneity arising from omitted variables and provides further support for our core conclusion: companies with a hometown chairperson exhibit lower levels of green innovation than those without a hometown chairperson.

5.4. Robustness Tests

Building on the benchmark results, this study mitigates the influence of related factors by incorporating robustness checks for variables such as the chairperson’s risk tolerance, variations in workplace environments, and alternative measures of key variables.

5.4.1. Impact of Chairperson’s Risk Tolerance

The high failure rate of innovation has long been a significant deterrent for companies reluctant to invest in innovative activities. The observed disparity in corporate involvement in green innovation may stem from differing risk exposures between companies led by local versus non-local chairpersons. Local chairpersons who possess strong local social ties may benefit from better facilitation in the enforcement of environmental protection policies. This advantage may reduce their engagement in high-risk green innovation initiatives. In contrast, non-local chairpersons, who attain senior management positions across different regions, may face challenges in accessing local social capital. However, their ability to assume leadership roles outside their hometowns suggests strong communication and coordination skills, in addition to specialized expertise, enabling them to tolerate higher risks in decision-making. To evaluate companies’ operational risk, consistent with prior research, the chairperson’s risk preference is measured by financial leverage (LEV) and return on assets (ROA) [76]. A regression analysis is conducted with LOCAL as the explanatory variable for both LEV and ROA.
According to the data in Table 6, the coefficient for LOCAL, which reflects the geographic proximity of a listed company’s chairperson, is statistically insignificant. The level of business risk appears comparable between firms led by locally based chairpersons and those with non-local chairs. Therefore, the finding in Table 3—that the impact of local chairpersons on green innovation is not attributable to the risk tolerance of local versus non-local chairpersons—remains valid.

5.4.2. Chairpersons’ Adaptability to the Local Environment

Given the higher concentration of listed companies in the economically prosperous coastal regions of eastern China, the representation of listed companies from the western regions—known for their lush greenery and pristine natural landscapes—is correspondingly lower. A potential reason could be that local officials have become accustomed to the environmental conditions in their area, leading them to overlook existing deficiencies. This could lessen their motivation to pursue green innovations. In contrast, chairpersons raised in areas with superior environmental conditions may experience significant discomfort in cities with poorer environmental quality. This acute awareness of environmental differences among chairpersons from more pristine regions may drive their companies to invest more in green innovation activities. A similar argument is advanced by Dong et al. (2021) [77], whose research demonstrated that analysts from heavily polluted cities were relatively insensitive to environmental pollution during fieldwork.
To explore this alternative perspective, this study utilizes city-level air quality index (AQI) data obtained from the Ministry of Environmental Protection. Observations related to chairpersons with foreign birthplaces are excluded from the analysis. A new variable, AQI_Difference, is developed, representing the AQI value at the chairperson’s birthplace minus the AQI value recorded at the location of their firm’s headquarters. A substantial AQI_Difference indicates a considerable disparity in air quality between these two locations. Thus, we incorporate AQI_Difference into the regression model, analyzing three scenarios with outcomes presented in Table 7:
(1)
Replace LOCAL with AQI_Difference: The coefficient is not significant in Table 7 (column (1)).
(2)
Upon including the AQI_Difference variable in the baseline regression, the outcome indicated that this variable did not reach statistical significance. In contrast, the coefficient associated with LOCAL maintained a strongly negative and statistically significant value, as presented in column (2) of Table 7.
(3)
The interaction between AQI_Difference and whether the chairperson is from a non-local headquarters city warrants examination. To identify this effect, a dummy variable labeled Non-LOCAL is introduced. This variable takes the value of 1 when the chairperson’s location differs from the headquarters city, and it takes 0 otherwise. The interaction term formed by multiplying AQI_Difference with Non-LOCAL helps disentangle the influence of the chairperson’s capacity to adapt to varying environmental contexts outside the headquarters region. Column (3) of Table 7 indicates that the AQI_Difference × Non-LOCAL coefficient lacks statistical significance.
The results from all three cases reveal that variations in the geographical origin and work environment of field chairpersons do not explain the baseline findings; our results remain robust.

5.4.3. Alternative Metrics of Green Innovation

In order to verify the reliability of the conclusions and assess the dedication to environmental innovation and its outcomes, in addition to using GPATENTt+1, this study utilizes multiple indicators: green patent filings with a two-year lag (GPATENTt+2), applications for green invention patents (GPATENT_INVt+1), applications for green utility patents (GPATENT_UTIt+1), and the number of green patents actually granted (GPATENT_GRTt+1). Table 8 demonstrates the continued negativity and 1% significance of the LOCAL coefficient. Therefore, the findings in Table 8 are robust across various measures of environmental innovation, supporting the integrity of this study.

5.5. Moderating Effects

5.5.1. ESG’s Moderating Effects

According to prior research, the hometown ties of chairpersons in listed companies affect green innovation. This relationship is empirically tested using ESG as a moderating variable. The results are shown in columns (1)–(2) of Table 9. Notably, the interaction coefficient between the key explanatory factor LOCAL and the moderating variable ESG (LOCAL × ESGi,t+1) stands at −0.095, which is statistically significant at the 1% confidence interval. This indicates that a one-level increase in the ESG score strengthens the negative effect of local chairpersons on green innovation by an additional 9.5%. This indicates that a company’s ESG performance amplifies the negative impact of chairperson localness on green innovation. In companies with high ESG performance, the resource crowding-out effect makes local chairpersons more likely to leverage their social capital to divert remaining allocable resources toward local government and business projects. Additionally, the short-term behavior of local chairpersons is more likely to be exposed. These two effects further exacerbate the crowding-out of green innovation investment, strengthening the negative influence of localness. In summary, H2 is supported.
We further constructed a simple slope plot at different levels of ESG, as shown in Figure 2. A pronounced difference in slopes is observed: The high-ESG group exhibits a steeper slope than the low-ESG group. The interaction effect between ESG and LOCAL on green innovation is significant (β = −0.095, p < 0.01). Specifically, among companies with high ESG performance, a local chairperson is negatively associated with green innovation. In contrast, this relationship is weaker among companies with low ESG performance. This pattern suggests that strong ESG performance amplifies the negative effect of a local chairperson on green innovation. Thus, H2 is supported.
We employ a one-period lagged ESG rating, and the interaction term LOCAL × ESGi,t+1 remains significantly negative at the 1% level. This indicates that even after mitigating the concern that current green innovation may inversely inflate ESG scores, superior ESG performance continues to amplify the adverse impact of locally entrenched chairpersons on corporate green innovation. Thus, reverse causality does not suffice to overturn this study’s conclusions.

5.5.2. LE’s Moderating Effects

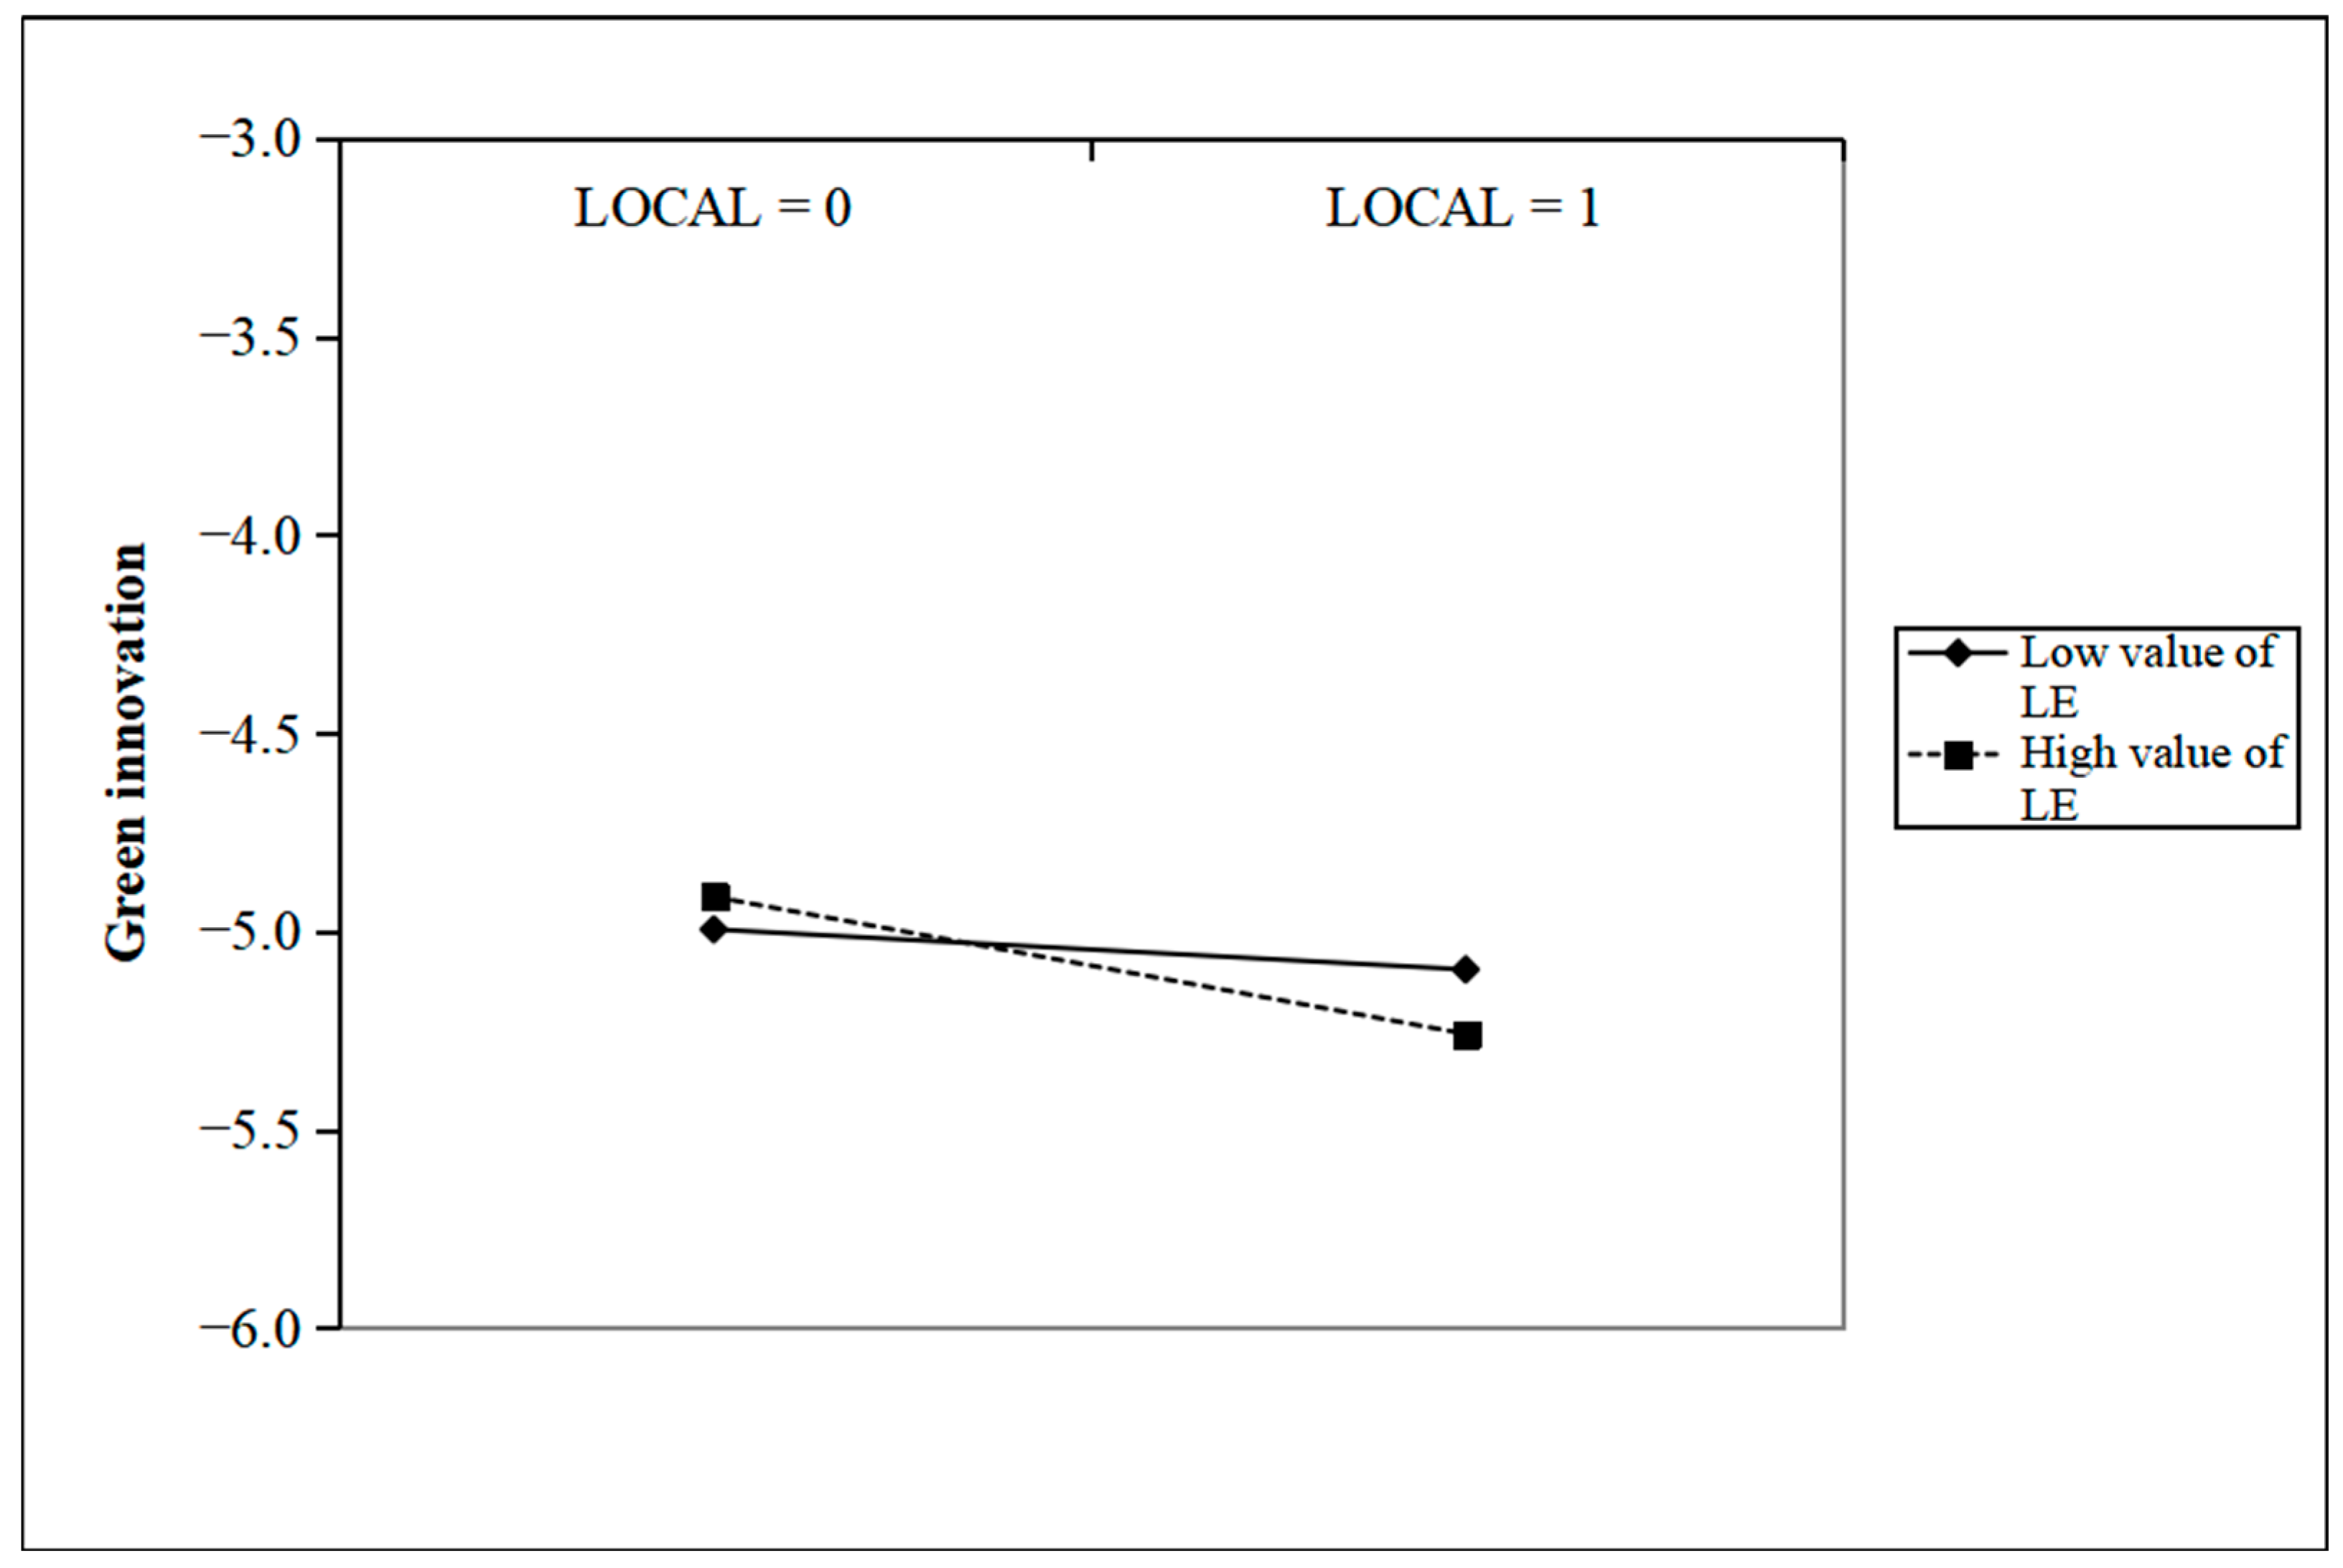
The preceding analysis indicates that the geographic location of the chairperson influences the extent of green innovation initiatives. At this stage, the legal environment (LE) is introduced as a moderating variable for empirical analysis. As indicated in Table 10, the interaction term LOCAL × LE—involving the core explanatory variable LOCAL and the moderator LE—exhibits a coefficient of −0.011. This estimate is statistically significant and negative at the 5% level. This indicates that, under a strong legal environment, the initial 10% inhibitory effect of a local chairperson is amplified to approximately 11%. This indicates that the legal environment (LE) acts as a moderating factor that intensifies the negative impact of a local chairperson on a company’s green innovation. Specifically, under a strong legal environment, local chairpersons may leverage their influence to circumvent stringent regulations aimed at supporting long-term green transformation, often in exchange for favors within their social networks. Furthermore, using social capital to secure a more lenient regulatory environment, companies tend to prioritize short-term gains, thereby reducing investment in green innovation. In summary, H3 is supported.
We further constructed a simple slope plot at different levels of LE, as shown in Figure 3. The slope for the high LE value is significantly greater than that for the low LE value. The interaction effect between LE and LOCAL on green innovation is statistically significant (β = −0.011, p < 0.05). In regions with robust legal enforcement, the inhibitory impact of local chairpersons on green innovation becomes particularly evident. In a strong legal environment, the social capital of a local chairperson plays a more substantial role. These chairpersons use their social capital to avoid long-term green transition investments, thus crowding out green innovation investment. These findings indicate that LE amplifies the adverse effect of a local chairperson on green innovation, thus supporting H3.

5.5.3. STMT’s Moderating Effects

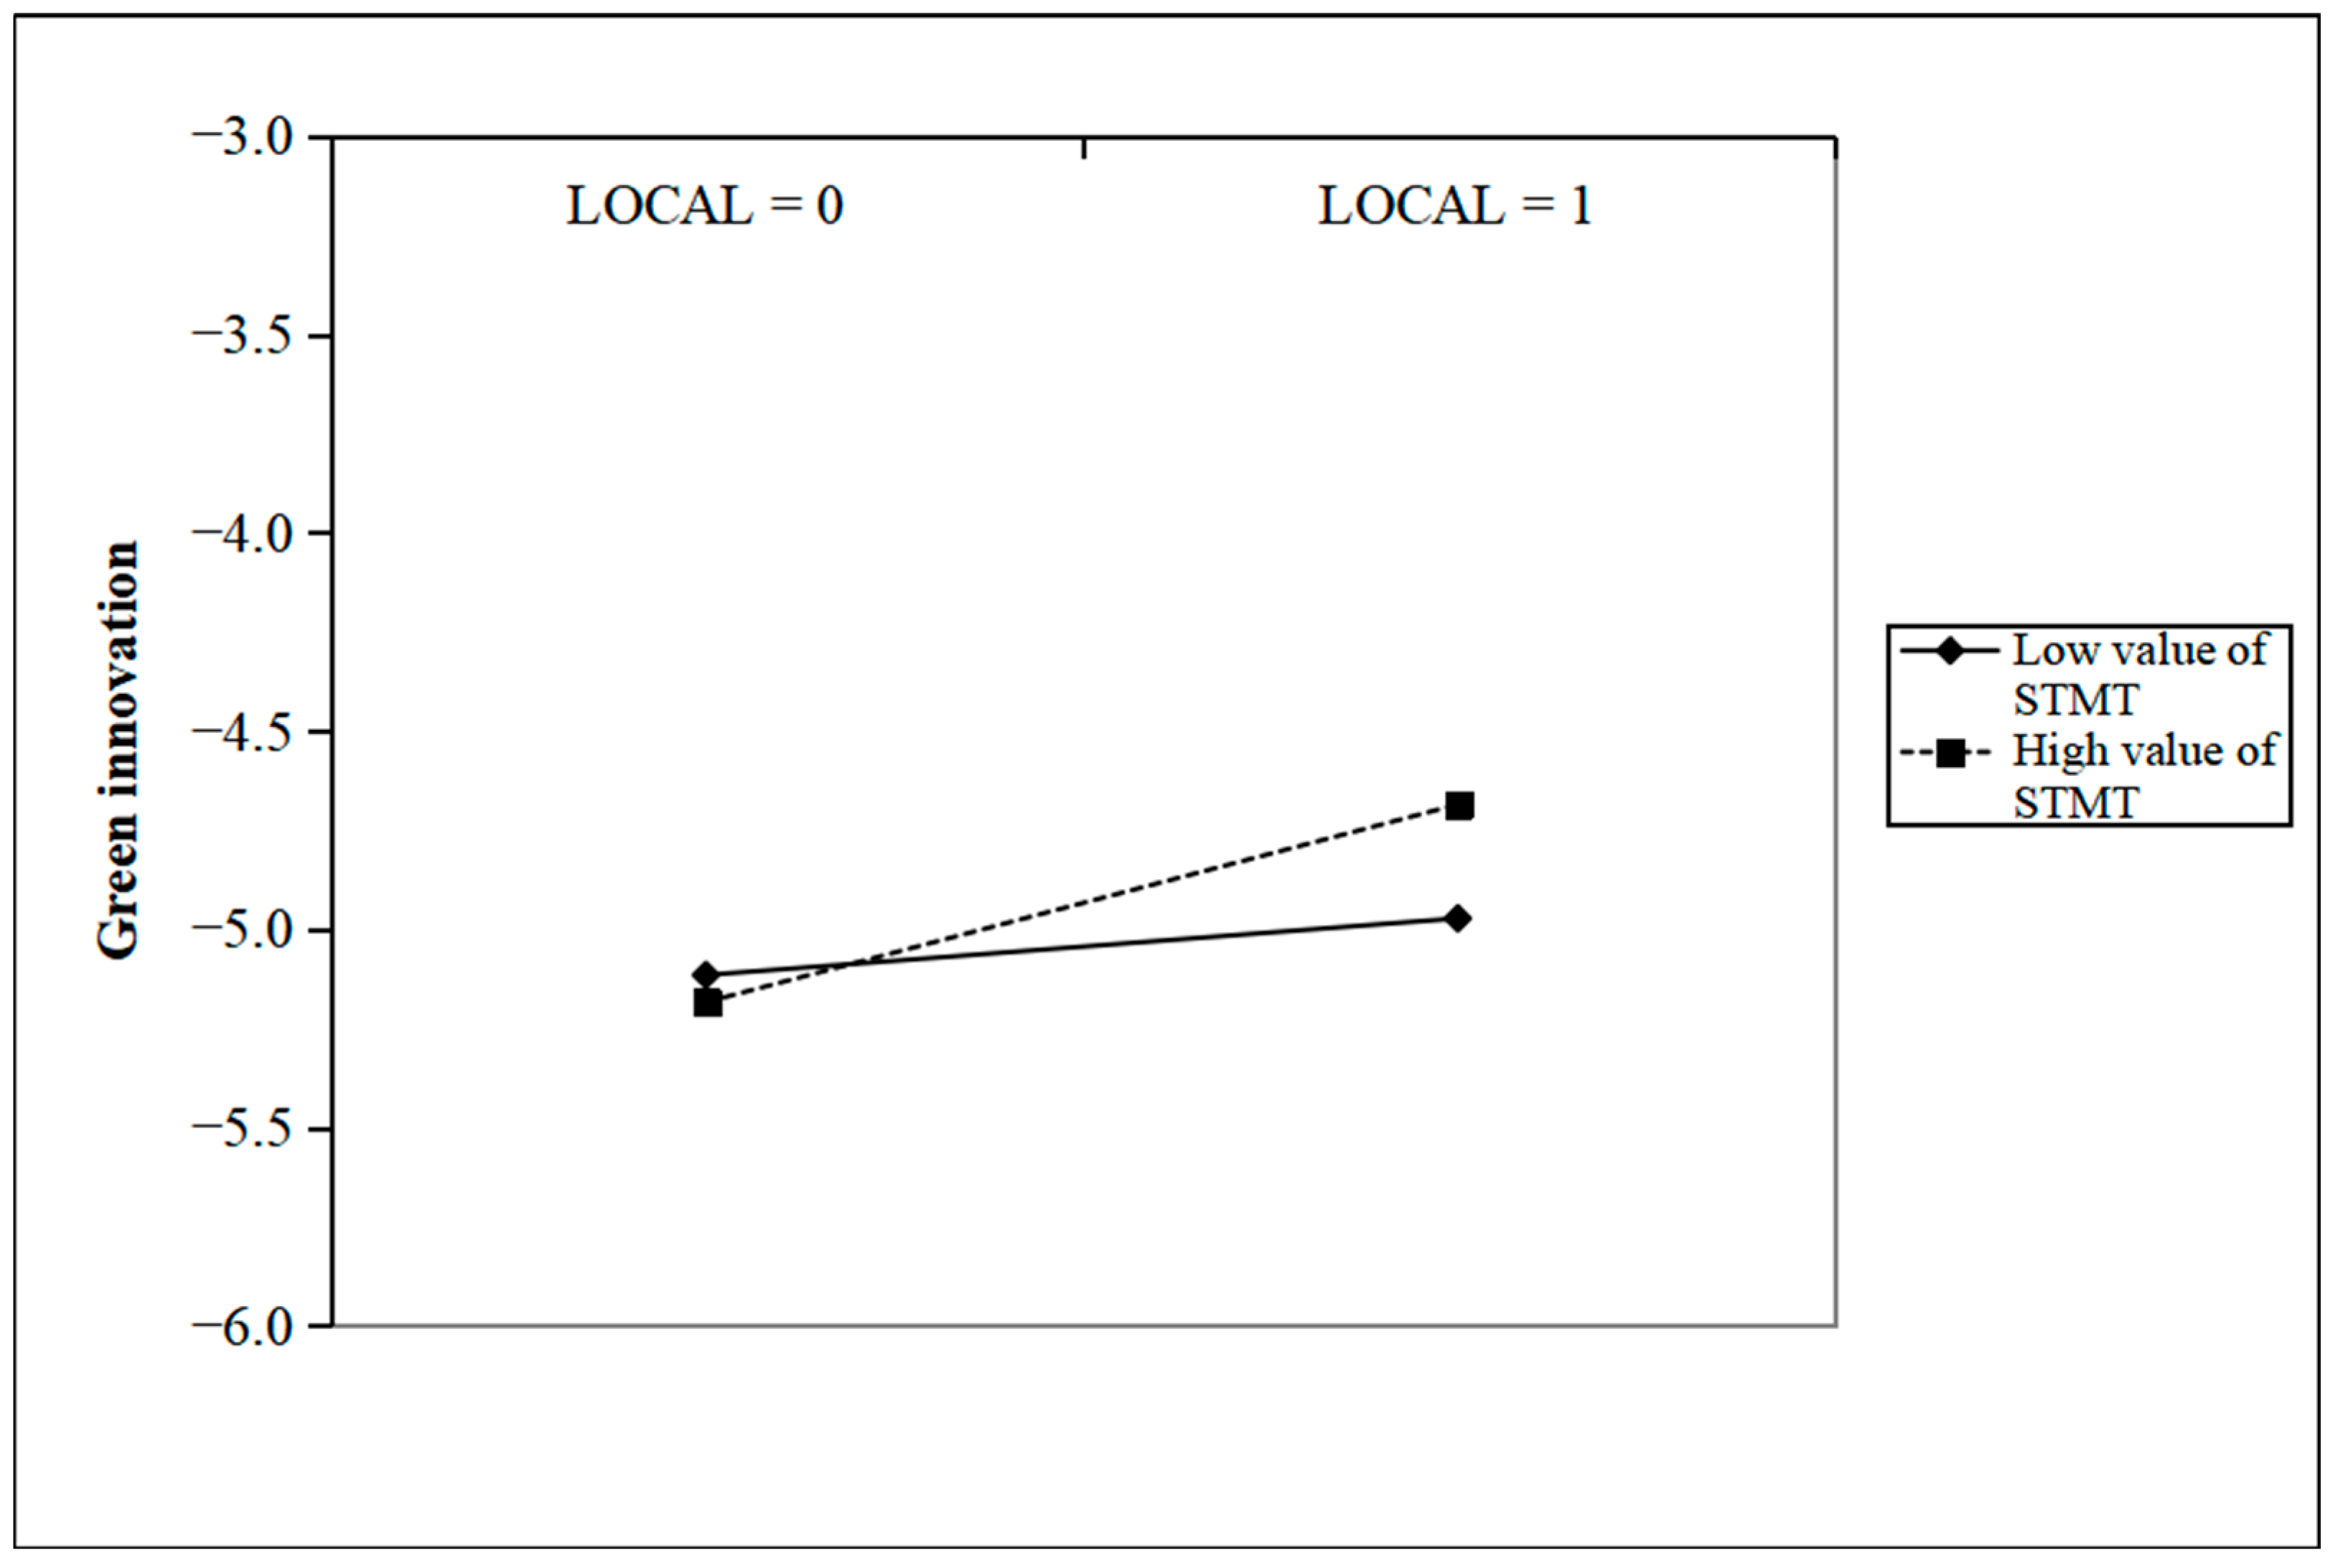
For the purpose of testing H4, a moderating effects model is constructed to assess the role of executive team stability. The results in Table 11 show that the interaction term between the core explanatory and moderating variables is positively significant at the 5% level. According to the results, a one unit increase in STMT reduces the negative influence of LOCAL by 63.1%. This implies that the presence of a stable top management team alleviates the adverse association between local chairpersons and green innovation. A possible explanation is that a stable management team exhibits stronger organizational commitment to long-term strategy implementation and can effectively restrain myopic behaviors exhibited by the chairperson. Consequently, the negative impact of local ties on green innovation is significantly reduced, supporting H4.
This study further constructed a simple slope graph under different levels of STMT, as shown in Figure 4. STMT significantly influences LOCAL’s impact on green innovation (β = 0.631, p < 0.05). The results show that in low-stability contexts, frequent executive turnover erodes organizational memory and long-term commitment. In such environments, a local chairperson tends to use social capital to divert resources toward short-cycle projects with quick returns. As a result, green R&D investments are crowded out, resulting in a strong negative effect. In contrast, in high-stability contexts, the management team develops a lasting strategic consensus and stronger supervisory capacity. This not only restrains the opportunistic tendencies of a local chairperson but also helps absorb the high uncertainties and long-cycle risks inherent in green innovation. As a result, the suppressive effect of a local chairperson on green innovation is reduced, thus supporting H4.

6. Further Analysis

To further validate the variations in the green innovation effects of localized chairpersons among listed companies, this study performed a heterogeneity assessment. The analysis focused on the chairpersons’ network relationships, tenure, ownership structure, and pollution levels.

6.1. Heterogeneity Analysis Based on Chairperson’s Network

Innovation investment, as a source of a company’s long-term core competitiveness, represents a transformation process characterized by high input, high risk, and high returns. This process requires continuously acquiring resources from various stakeholders [78]. Companies utilize their social networks to interact with external entities, which facilitates the effective integration and utilization of these resources. This demonstrates that social networks have become an increasingly vital mechanism for securing competitive advantage [79]. As the scale of a company’s specific social network expands moderately, the growing connections formed with entities inside and outside the network provide richer market information and broader access to opportunities. The accumulation of the organization’s social capital is facilitated by this process. Hence, the chairperson’s network ties play a pivotal role in resource acquisition [80]. Moreover, research indicates that the chairperson’s network ties can influence the company’s environmental governance performance [81].
In this study, we refer to Shi et al. (2019) [80] to evaluate the network relationships of chairpersons using betweenness centrality (Deg) and network structural holes (Str). Betweenness centrality measures the frequency with which a chairperson functions as an intermediary along the shortest paths connecting other chairpersons. A higher value indicates greater betweenness centrality. Structural holes refer to the number of disconnected positions a chairperson occupies; a higher number implies greater information advantages. We conduct regression analyses by dividing companies into high and low groups according to the annual industry median. The regression results, shown in columns (1) to (4) of Table 12, indicate that the negative effect of local chairpersons on green innovation is stronger in companies with higher betweenness centrality and more structural holes—that is, those with well-connected chairperson networks and abundant resources. This effect is statistically significant at the 1% level.

6.2. Heterogeneity Analysis Based on Chairperson Tenure

Over time, extended chairperson tenure can narrow the gap in green innovation impact between local and non-local chairs through two mechanisms. First, the length of a chairperson’s tenure affects their accumulation of social resources. Over time, social capital levels converge between locally and non-locally appointed chairpersons, reducing initial disparities in resource access and influence. Second, in the context of corporate sustainability, allocating resources toward green innovation frequently necessitates balancing immediate financial returns against future advantages. Although green innovation may reduce corporate value in the short term, it can maximize long-term profits. Longer tenures strengthen the long-term orientation in chairpersons’ decision-making, which applies to both local and non-local chairs. Flammer & Bansal (2017) [82] observed that executives driven by long-term incentives actively promote R&D investment and cultivate stakeholder relationships to counter short-termism in corporate management. Executive stability positively affects innovation performance [76]. Therefore, this study uses chairperson tenure length (TENURE) as a measure of board chairperson characteristics and conducts separate regression analyses for high-tenure and low-tenure groups based on the median value. According to the regression outcomes presented in columns (1) and (2) of the environmental challenges currently confronting China are closely linked to its industrial structure. Companies with high energy consumption, significant emissions, and heavy pollution are often the primary contributors to widespread environmental degradation. Due to differences in industrial sectors, environmental protection requirements vary, which may result in disparities in green innovation across industries with different attributes. Based on this analysis, this study assesses pollution levels and classifies industries into heavily polluting and non-heavily polluting categories according to their environmental characteristics. The statistical results in Table 13 (columns (5) and (6)) show that for companies in non-heavily polluting industries, the coefficient for green innovation is significantly negative at the 1% level. This indicates that companies in non-heavily polluting sectors face relatively lower environmental pressures in the market. Consequently, their reliance on the extensive and close social networks of a local chairperson tends to reduce green innovation activities. Therefore, under stringent environmental regulations, companies led by both local and non-local chairpersons will invest in green innovation to effectively promote pollution control and reverse ecological degradation.
Table 13, a shorter tenure tends to amplify the adverse influence of local chairmanship on green innovation.

6.3. Heterogeneity Analysis Based on Property Rights

From the perspective of property rights, state-owned enterprises (SOEs) and non-state-owned enterprises (non-SOEs) operate on fundamentally different wavelengths in terms of management approaches, strategic priorities, and available resources. This results in differences in their willingness to innovate, innovative capabilities, and mechanisms for acquiring innovative resources. SOEs inherently fulfill social functions and maintain strong institutional connections with government bodies, which provide them with better access to resources that support innovation. The regression results in columns (3) and (4) of the environmental challenges currently confronting China are closely linked to its industrial structure. Companies with high energy consumption, significant emissions, and heavy pollution are often the primary contributors to widespread environmental degradation. Due to differences in industrial sectors, environmental protection requirements vary, which may result in disparities in green innovation across industries with different attributes. Based on this analysis, this study assesses pollution levels and classifies industries into heavily polluting and non-heavily polluting categories according to their environmental characteristics.
Table 13 shows that the local chairpersons in SOEs have a more pronounced negative effect on companies’ green innovation, with a larger impact coefficient.

6.4. Heterogeneity Analysis Based on Pollution Levels

The environmental challenges currently confronting China are closely linked to its industrial structure. Companies with high energy consumption, significant emissions, and heavy pollution are often the primary contributors to widespread environmental degradation. Due to differences in industrial sectors, environmental protection requirements vary, which may result in disparities in green innovation across industries with different attributes. Based on this analysis, this study assesses pollution levels and classifies industries into heavily polluting and non-heavily polluting categories according to their environmental characteristics. The statistical results in Table 13 (columns (5) and (6)) show that for companies in non-heavily polluting industries, the coefficient for green innovation is significantly negative at the 1% level. This indicates that companies in non-heavily polluting sectors face relatively lower environmental pressures in the market. Consequently, their reliance on the extensive and close social networks of a local chairperson tends to reduce green innovation activities. Therefore, under stringent environmental regulations, companies led by both local and non-local chairpersons will invest in green innovation to effectively promote pollution control and reverse ecological degradation.

7. Conclusions and Implications

This study examined corporate green innovation as a critical approach to environmental pollution governance. It analyzed the influence of local chairpersons on green innovation in publicly listed companies, emphasizing how these chairpersons leverage their regional social capital to gain preferential treatment. Based on micro-level data from Chinese listed companies between 2013 and 2023, this study conducted robust empirical tests to examine this relationship. The findings show that local chairpersons negatively affect the level of corporate green innovation. Specifically, companies with local chairpersons engage in significantly fewer green innovation activities than those with non-local chairpersons. This conclusion remains robust after comprehensive sensitivity analyses, including instrumental variable approaches and difference-in-differences tests.
Based on the moderation effect analysis of ESG performance, this study observed that local chairpersons utilize local resources to buffer formal institutional pressures. They redirect remaining allocable resources toward local government–business projects, thereby crowding out green innovation investment. This result indicates that stronger ESG performance reinforces the negative relationship between local chairpersons and green innovation. The moderating effect of the legal environment (LE) reveals that in regions with more developed legal systems, local chairpersons more strategically leverage relationships to seek flexibility within the robust legal framework and obtain scarce resources. In such contexts, their social resources are transformed into “resistance” to green innovation policies, thus creating a stronger disincentive for green innovation. Furthermore, STMT demonstrates a stronger commitment to organizational strategy and develops a robust capacity to monitor and balance top-level decision-making. Such teams are more committed to implementing the company’s long-term strategies and curbing the chairperson’s myopic behaviors, thus mitigating the negative relationship between local chairpersons and green innovation.
Based on empirical research findings, targeted policy recommendations in two key domains are proposed. First, by understanding how the chairperson’s background influences corporate green innovation, a firm can make more targeted decisions. Long-term performance assessments and stable tenure arrangements are thus recommended. Specifically, the long-term benefits of green innovation should be integrated into core key performance indicators (KPIs). Simultaneously, a chairperson’s tenure should be extended to foster their sense of long-term commitment to corporate green transformation and their willingness to undertake strategic risks. Second, for policymakers, this study reveals that chairpersons may leverage their social connections to influence the supervision of their enterprises under environmental regulation policies, thereby concealing their enterprises’ deficiencies in green innovation. This finding underscores the need for local governments to attach greater importance to supervision, with the aim of preventing interference by corporate executives.
Author Contributions

Methodology, J.P.; Software, S.Z.; Data curation, Z.Y.; Writing—original draft, L.X.; Writing—review & editing, W.W.; Supervision, W.W. All authors have read and agreed to the published version of the manuscript.

Funding

This research received no external funding.

Institutional Review Board Statement

Not applicable.

Informed Consent Statement

Not applicable.

Data Availability Statement

The data presented in this study are available on request from the corresponding author.

Conflicts of Interest

The authors declare no conflict of interest.

References

  1. Liu, J.; Zhao, M.; Zhang, C.; Ren, F. Analysis of the Influence of Heterogeneous Environmental Regulation on Green Technology Innovation. Sustainability 2023, 15, 3649. [Google Scholar] [CrossRef]
  2. Inderst, R.; Opp, M.M. Sustainable finance versus environmental policy: Does greenwashing justify a taxonomy for sustainable investments? J. Financ. Econ. 2025, 163, 103954. [Google Scholar] [CrossRef]
  3. Hu, Y.; Sun, S.; Dai, Y. Environmental regulation, green innovation, and international competitiveness of manufacturing enterprises in China: From the perspective of heterogeneous regulatory tools. PLoS ONE 2021, 16, e0249169. [Google Scholar] [CrossRef]
  4. Cheng, Q.; Lin, A.P.; Yang, M. Green innovation and firms’ financial and environmental performance: The roles of pollution prevention versus control. J. Account. Econ. 2025, 79, 101706. [Google Scholar] [CrossRef]
  5. Chen, Z.; Hao, X.; Chen, F. Green innovation and enterprise reputation value. Bus. Strategy Environ. 2023, 32, 1698–1718. [Google Scholar] [CrossRef]
  6. Ba, S.; Lisic, L.L.; Liu, Q.; Stallaert, J. Stock market reaction to green vehicle innovation. Prod. Oper. Manag. 2013, 22, 976–990. [Google Scholar] [CrossRef]
  7. Tan, J.; Chan, K.C.; Chen, Y. The Impact of Air Pollution on the Cost of Debt Financing: Evidence from the Bond Market. Bus. Strategy Environ. 2022, 31, 464–482. [Google Scholar] [CrossRef]
  8. Petroni, G.; Bigliardi, B.; Galati, F. Rethinking the Porter Hypothesis: The Underappreciated Importance of Value Appropriation and Pollution Intensity. Rev. Policy Res. 2019, 36, 121–140. [Google Scholar] [CrossRef]
  9. Calel, R.; Dechezlepretre, A. Environmental Policy and Directed Technological Change: Evidence from the European Carbon Market. Rev. Econ. Stat. 2016, 98, 173–191. [Google Scholar] [CrossRef]
  10. Yonker, S.E. Do Managers Give Hometown Labor an Edge? Rev. Financ. Stud. 2017, 30, 3581–3604. [Google Scholar] [CrossRef]
  11. Ding, H.; Hu, Y.; Jiang, H.; Wu, J.; Zhang, Y. Social embeddedness and supply chains: Doing business with friends versus making friends in business. Prod. Oper. Manag. 2023, 32, 2154–2172. [Google Scholar] [CrossRef]
  12. An, J.; He, G.; Ge, S.; Wu, S. The impact of government green subsidies on corporate green innovation. Financ. Res. Lett. 2025, 71, 106378. [Google Scholar] [CrossRef]
  13. Liu, G.; Chen, J.; Li, Z.; Zhu, H. Green supply chain innovation strategies, considering government subsidy and altruistic preference. Math. Probl. Eng. 2022, 1, 5495374. [Google Scholar] [CrossRef]
  14. Pástor, Ľ.; Stambaugh, R.F.; Taylor, L.A. Dissecting green returns. J. Financ. Econ. 2022, 146, 403–424. [Google Scholar] [CrossRef]
  15. Li, Y.; Huang, N.; Zhao, Y. The Impact of Green Innovation on Enterprise Green Economic Efficiency. Int. J. Environ. Res. Public Health 2022, 19, 16464. [Google Scholar] [CrossRef] [PubMed]
  16. Clarkson, P.M.; Li, Y.; Richardson, G.D. The market valuation of environmental capital expenditures by pulp and paper companies. Account. Rev. 2004, 79, 329–353. [Google Scholar] [CrossRef]
  17. Berrone, P.; Fosfuri, A.; Gelabert, L.; Gomez-Mejia, L.R. Necessity as the mother of “green” inventions: Institutional pressures and environmental innovations. Strateg. Manag. J. 2013, 34, 891–909. [Google Scholar] [CrossRef]
  18. Fried, S. Climate policy and innovation: A quantitative macroeconomic analysis. Am. Econ. J. Macroecon. 2018, 10, 90–118. [Google Scholar] [CrossRef]
  19. Yu, X.; Xu, Y.; Zhang, J.; Sun, Y. The synergy green innovation effect of green innovation subsidies and carbon taxes. Sustainability 2022, 14, 3453. [Google Scholar] [CrossRef]
  20. Chen, L.; Wang, Y.; Jin, S. How green credit guidelines policy affect the green innovation in China? Environ. Eng. Manag. J. 2022, 21, 469. [Google Scholar] [CrossRef]
  21. Li, S.; Bai, T. The impact of tax reform on corporate green transformation—Evidence based on the value-added tax retained rebate. Financ. Res. Lett. 2024, 60, 104881. [Google Scholar] [CrossRef]
  22. Shahzad, F.; Du, J.; Khan, I.; Wang, J. Decoupling Institutional Pressure on Green Supply Chain Management Efforts to Boost Organizational Performance: Moderating Impact of Big Data Analytics Capabilities. Front. Environ. Sci. 2022, 10, 911392. [Google Scholar] [CrossRef]
  23. Xie, Z.; Ma, J.; Huang, S.; Zhu, J. Digital economy and inclusive green growth: The moderating effect of government environmental regulation. Environ. Sci. Pollut. Res. 2023, 30, 107938–107955. [Google Scholar] [CrossRef]
  24. Ren, S.; Wang, M. Institutional pressures as drivers of corporate green innovation: Do provincial officials and CEOs matter? Environ. Sci. Pollut. Res. 2023, 30, 40608–40629. [Google Scholar] [CrossRef]
  25. Chen, Y.S. The driver of green innovation and green image—Green core competence. J. Bus. Ethics 2008, 81, 531–543. [Google Scholar] [CrossRef]
  26. Galbreath, J. Drivers of Green Innovations: The Impact of Export Intensity, Women Leaders, and Absorptive Capacity. J. Bus. Ethics 2019, 158, 47–61. [Google Scholar] [CrossRef]
  27. Chen, J.; Liu, L. Customer participation, and green product innovation in SMEs: The mediating role of opportunity recognition and exploitation. J. Bus. Res. 2020, 119, 151–162. [Google Scholar] [CrossRef]
  28. Hasan, M.M.; Li, L. Do supply chain and digitalization Foster China’s advancement in green development? An evidence from wavelet quantile regression and wavelet quantile correlation analysis. Energy Econ. 2025, 142, 108099. [Google Scholar] [CrossRef]
  29. Ma, X.; He, J. The Deconcentration of Major Suppliers and Corporate Green Innovation in the Context of Knowledge Diffusion: Moderating Effects of Trust and Human Capital Quality. IEEE Trans. Eng. Manag. 2024, 71, 11758–11771. [Google Scholar] [CrossRef]
  30. Gao, S.; Li, W.; Meng, J.; Shi, J.; Zhu, J. A study on the impact mechanism of digitalization on corporate green innovation. Sustainability 2023, 15, 6407. [Google Scholar] [CrossRef]
  31. Lu, Y.; Zhao, Y.; Liu, L.; Shi, G. ESG Ratings and Green Innovation. Sustainability 2024, 16, 10869. [Google Scholar] [CrossRef]
  32. Guo, L.; Pei, H.; Liu, Y. Artificial intelligence and corporate green innovation: Evidence from China. Res. Int. Bus. Financ. 2025, 79, 103039. [Google Scholar] [CrossRef]
  33. Zhang, L.; Sun, X.; Guo, W.; Sun, R. Green innovation and maturity mismatch: Evidence from China. Financ. Res. Lett. 2025, 85, 108124. [Google Scholar] [CrossRef]
  34. Liu, Z.; Li, X.; Peng, X.; Lee, S. Green or nongreen innovation? Different strategic preferences among subsidized enterprises with different ownership types. J. Clean. Prod. 2020, 245, 118786. [Google Scholar] [CrossRef]
  35. Gao, K.; Wang, L.; Liu, T.; Zhao, H. Management Executive Power and Corporate Green Innovation—Empirical Evidence from China’s State-Owned Manufacturing Sector. Technol. Soc. 2022, 70, 102043. [Google Scholar] [CrossRef]
  36. Zhao, M.; Ren, G.; Li, J.; Liu, L. Navigating Dual Official Pressures: State-Owned Shares and the Green Innovation Trajectory of Private Enterprises. J. Clean. Prod. 2024, 470, 143277. [Google Scholar] [CrossRef]
  37. Acemoglu, D.; Aghion, P.; Bursztyn, L.; Hemous, D. The environment and directed technical change. Am. Econ. Rev. 2012, 102, 131–166. [Google Scholar] [CrossRef]
  38. Adler, P.S.; Kwon, S.W. Social capital: Prospects for a new concept. Acad. Manag. Rev. 2002, 27, 17–40. [Google Scholar] [CrossRef]
  39. Shen, Y.; Gao, D.; Bu, D.; Yan, L.; Chen, P. CEO hometown ties and tax avoidance-evidence from China’s listed firms. Account. Financ. 2019, 58, 1549–1580. [Google Scholar] [CrossRef]
  40. Kraft, P.S.; Bausch, A. Managerial Social Networks and Innovation: A Meta-Analysis of Bonding and Bridging Effects across Institutional Environments. J. Prod. Innov. Manag. 2018, 35, 865–889. [Google Scholar] [CrossRef]
  41. Kong, D.; Pan, Y.; Tian, G.G.; Zhang, P. CEOs’ hometown connections and access to trade credit: Evidence from China. J. Corp. Financ. 2020, 62, 101574. [Google Scholar] [CrossRef]
  42. Zhu, H.; Qiu, J.; Pan, Y.; Xiao, J. Hometown ties and favoritism in Chinese corporations: Evidence from CEO Dismissal. Acad. Manag. Proc. 2018, 1, 16770. [Google Scholar] [CrossRef]
  43. Fu, N. The role of relational resources in the knowledge management capability and innovation of professional service firms. Hum. Relat. 2015, 68, 731–764. [Google Scholar] [CrossRef]
  44. Stiglitz, J.E. Leaders and followers: Perspectives on the Nordic model and the economics of innovation. J. Public Econ. 2015, 127, 3–16. [Google Scholar] [CrossRef]
  45. Quan, X.; Ke, Y.; Qian, Y.; Zhang, Y. CEO Foreign Experience and Green Innovation: Evidence from China. J. Bus. Ethics 2023, 182, 535–557. [Google Scholar] [CrossRef]
  46. Guo, Z.; Sun, L.; Chan, K.C. CEO Hometown Ties and Initial Public Offering Underpricing: Evidence from China’s Listed Firms. Int. Rev. Financ. Anal. 2025, 97, 103851. [Google Scholar] [CrossRef]
  47. Xie, Q.; Wu, C.J.; Yu, Z. The Bright Side of Local CEO on Environmental Investment: Evidence from China. J. Manag. Gov. 2025, 1–33. [Google Scholar] [CrossRef]
  48. Xu, N.; Li, M.; Xie, R.; Chan, K.C. Double standards? The adverse impact of chairperson hometown ties on corporate green innovation. J. Corp. Financ. 2024, 88, 102640. [Google Scholar] [CrossRef]
  49. Ren, S.; Wang, Y.; Hu, Y.; Yan, J. CEO hometown identity and firm green innovation. Bus. Strategy Environ. 2021, 30, 756–774. [Google Scholar] [CrossRef]
  50. Schutjens, V.; Völker, B. Space and social capital: The degree of locality in entrepreneurs’ contacts and its consequences for firm success. Eur. Plan. Stud. 2010, 18, 941–963. [Google Scholar] [CrossRef]
  51. Lerner, J. Venture capitalists and the oversight of private firms. In Venture Capital, 1st ed.; Mike, W., Ken, R., Eds.; Routledge: London, UK, 1997; pp. 267–284. [Google Scholar] [CrossRef]
  52. Park, S.H.; Luo, Y. Guanxi and organizational dynamics: Organizational networking in Chinese firms. Strateg. Manag. J. 2001, 22, 455–477. [Google Scholar] [CrossRef]
  53. Chen, X.P.; Chen, C.C. On the intricacies of the Chinese guanxi: A process model of guanxi development. Asia Pac. J. Manag. 2004, 21, 305–324. [Google Scholar] [CrossRef]
  54. Uzzi, B. The sources and consequences of embeddedness for the economic performance of organizations: The network effect. Am. Sociol. Rev. 1996, 61, 674–698. [Google Scholar] [CrossRef]
  55. He, J. Executive Network Centrality and Corporate Reporting. Manag. Sci. 2022, 68, 1512–1536. [Google Scholar] [CrossRef]
  56. Pástor, Ľ.; Stambaugh, R.F.; Taylor, L.A. Sustainable investing in equilibrium. J. Financ. Econ. 2021, 142, 550–571. [Google Scholar] [CrossRef]
  57. Lu, C.; Wu, C.; Feng, L.; Zhan, J.; Shi, Y.; Chen, H. Does ESG Performance Enhance Corporate Green Technological Innovation? Micro Evidence from Chinese-Listed Companies. Sustainability 2025, 17, 636. [Google Scholar] [CrossRef]
  58. Geng, Y.; Chen, J.; Liu, R. ESG Rating Disagreement and Corporate Green Innovation Bubbles: Evidence from Chinese A-Share Listed Firms. Int. Rev. Financ. Anal. 2024, 95, 103495. [Google Scholar] [CrossRef]
  59. Wang, F.; Sun, Z. Does the Environmental Regulation Intensity and ESG Performance Have a Substitution Effect on the Impact of Enterprise Green Innovation: Evidence from China. Sustainability 2022, 19, 8558. [Google Scholar] [CrossRef]
  60. Wang, J.; Ma, M.; Dong, T.; Zhang, Z. Do ESG Ratings Promote Corporate Green Innovation? A Quasi-Natural Experiment Based on SynTao Green Finance’s ESG Ratings. Int. Rev. Financ. Anal. 2023, 87, 102623. [Google Scholar] [CrossRef]
  61. Peng, M.W.; Luo, Y. Managerial Ties and Firm Performance in a Transition Economy: The Nature of a Micro-Macro Link. Acad. Manag. J. 2000, 43, 486–501. [Google Scholar] [CrossRef]
  62. Deng, Y.; Chen, J.; Zhou, Y.; Lu, Q. How Do Director Networks Improve Digital Innovation in China An Explanation Grounded in Knowledge-based View. Int. J. Technol. Manag. 2023, 1, 242–274. [Google Scholar] [CrossRef]
  63. Chahine, S.; Fang, Y.; Hasan, I.; Mazboudi, M. Entrenchment through corporate social responsibility: Evidence from CEO network centrality. Int. Rev. Financ. Anal. 2019, 66, 101347. [Google Scholar] [CrossRef]
  64. Huang, C.; Du, S.; Tang, W. Rethinking Green Technology Interventions: Strategic Motivations under Uncertain Regulations. Eur. J. Oper. Res. 2025. [Google Scholar] [CrossRef]
  65. Tan, Z. Top Management Team Stability and Corporate Innovation Sustainability. Sustainability 2024, 16, 4496. [Google Scholar] [CrossRef]
  66. Hambrick, D.C.; Geletkanycz, M.A.; Fredrickson, J.W. Top Executive Commitment to the Status Quo: Some Tests of Its Determinants. Strateg. Manag. J. 1993, 14, 401–418. [Google Scholar] [CrossRef]
  67. Shen, W.; Cannella, A.A. Revisiting the Performance Consequences of CEO Succession: The Impacts of Successor Type, Postsuccession Senior Executive Turnover, and Departing CEO Tenure. Acad. Manag. J. 2002, 45, 717–733. [Google Scholar] [CrossRef]
  68. Pang, C.; Wang, Y. Stock pledge, risk of losing control and corporate innovation. J. Corp. Financ. 2020, 60, 101534. [Google Scholar] [CrossRef]
  69. Fisman, R.; Huang, W.; Ning, B.; Pan, Y.; Qiu, J.; Wang, Y. Superstition and risk taking: Evidence from “Zodiac Year” beliefs in China. Manag. Sci. 2023, 69, 5174–5188. [Google Scholar] [CrossRef]
  70. Ying, S. Design an ESG Rating System: A Case Study of the Chinese Dairy Industry. Adv. Econ. Manag. Political Sci. 2024, 72, 235–243. [Google Scholar] [CrossRef]
  71. Chen, X.; Yi, N.; Zhang, L.; Li, D. Does institutional pressure foster corporate green innovation? Evidence from China’s top 100 companies. J. Clean. Prod. 2018, 188, 304–311. [Google Scholar] [CrossRef]
  72. Zeng, W.; Li, L.; Huang, Y. Industrial collaborative agglomeration, marketization, and green innovation: Evidence from China’s provincial panel data. J. Clean. Prod. 2021, 279, 123598. [Google Scholar] [CrossRef]
  73. Hong, J.; Wang, C.; Kafouros, M. The role of the state in explaining the internationalization of emerging market enterprises. Br. J. Manag. 2015, 26, 45–62. [Google Scholar] [CrossRef]
  74. Zhang, Z.; Cao, D.; Zhang, C. Does TMT stability affect enterprise technological innovation performance?—The moderating effect of compensation incentive and human relationship. Account. Res. 2018, 374, 48–55. [Google Scholar] [CrossRef]
  75. Ren, S.; Cheng, Y.; Hu, Y.; Yin, C. Feeling right at home: Hometown CEOs and firm innovation. J. Corp. Financ. 2021, 66, 101815. [Google Scholar] [CrossRef]
  76. Faccio, M.; Marchica, M.T.; Mura, R. Large shareholder diversification and corporate risk-taking. Rev. Financ. Stud. 2011, 24, 3601–3641. [Google Scholar] [CrossRef]
  77. Dong, R.; Fisman, R.; Wang, Y.; Xu, N. Air pollution, affect, and forecasting bias: Evidence from Chinese financial analysts. J. Financ. Econ. 2021, 139, 971–984. [Google Scholar] [CrossRef]
  78. Gaur, A.S.; Ma, X.; Ding, Z. Home country supportiveness/unfavorableness and outward foreign direct investment from China. J. Int. Bus. Stud. 2018, 49, 324–345. [Google Scholar] [CrossRef]
  79. Frankort, H.T.W. When does knowledge acquisition in R&D alliances increase new product development? The moderating roles of technological relatedness and product-market competition. Res. Policy 2016, 45, 291–302. [Google Scholar] [CrossRef]
  80. Shi, J.; Yang, J.; Li, Y. Supply network position and firm performance: Evidence from Chinese listed manufacturing companies. J. Bus. Econ. Manag. 2019, 20, 1258–1277. [Google Scholar] [CrossRef]
  81. Feng, H.; Zhang, Z.; Wang, Q.; Yang, L. Does a Company’s position within the interlocking director network influence its ESG performance?—Empirical evidence from Chinese listed companies. Sustainability 2024, 16, 4190. [Google Scholar] [CrossRef]
  82. Flammer, C.; Bansal, P. Does a long-term orientation create value? Evidence from a regression discontinuity. Strateg. Manag. J. 2017, 38, 1827–1847. [Google Scholar] [CrossRef]
Figure 1. Figure for parallel trend test. (a) The case of chairperson transition from 0 to 1. (b) The case of chairperson transition from 1 to 0.
Sustainability 17 09285 g001
Figure 2. The moderating effect of ESG.
Sustainability 17 09285 g002
Figure 3. The moderating effect of LE.
Sustainability 17 09285 g003
Figure 4. The moderating effect of STMT.
Sustainability 17 09285 g004
Table 1. Variables and their descriptions.
ItemVariable Definitions
Dependent Variable
GPATENTThe natural logarithm of the number of green patent applications (green utility model patent + green invention patent) plus 1.
Independent Variable
LOCALA dummy variable was created: value = 1 if the company’s headquarters is located in the same city as the chairperson’s birthplace; otherwise, value = 0.
Moderation Variables
ESGAssign values 1–9 to the CSI ESG ratings sequentially, taking the composite annual assignment for each year, and these are lagged by one period.
LEInstitutional environment for the development and law of market intermediary organizations in marketization indices.
STMTThe stability of the executive team is measured using the number of executives who remained throughout the sample period, assuming a constant team size, with a range of values of [0, 1].
Control Variables
AGEThe age of the chairperson of the board of directors is taken as a natural logarithm.
GENDERMale individuals take a value of 1; female individuals take a value of 0.
SIZENatural logarithm of the number of employees.
LEVThe financial leverage.
ROAReturn on total assets.
GROWTHGrowth rate of operating income.
CASHFLOWCompany cash inflows and outflows.
STRUSum of the percentage of shares held by the top five shareholders.
FIRM-AGEState-controlled companies take a value of 1; otherwise, 0.
AQIThe year in which the company went public plus one takes the natural logarithm.
PGDPAnnual average of daily air quality indices for cities published by the Ministry of Environmental Protection.
Table 2. Descriptive statistics.
Variables(1)(2)(3)(4)(5)
NMeansdMinMax
LOCAL10,3590.3370.47301
GPATENTi,t+110,3590.9951.32207.305
LE10,35911.623.7740.46023.95
ESG10,3594.1731.08218
STMT10,3590.8880.0710.4041
TENURE10,3594.0931.0210.6935.680
POLLUTE10,3590.2630.44001
STR10,3590.3510.1150.0351.125
Deg10,35919.54011.7894180
SIZE10,3598.0481.3352.70813.46
LEV10,3590.4480.2050.0081.718
ROA10,3590.0360.074−1.1300.953
CASHFLOW10,3590.0520.071−0.6470.664
GROWTH10,3590.2604.626−0.964429.0
STRU10,3590.5200.1570.0080.992
SOE10,3590.3290.47001
FIRM-AGE10,3592.4290.6191.0993.466
GENDER10,3590.9650.18401
AGE10,3594.0090.1343.1784.454
PGDP10,35911.480.4934.57712.49
AQI10,35972.6630.6921.40500
Table 3. Regression results.
Variables(1)(2)
GPATENTi,t+1GPATENTi,t+1
LOCAL−0.176 ***−0.101 ***
(−7.53)(−4.79)
ControlsNOYES
Year FEYESYES
Industry FEYESYES
Constant1.055 ***−5.081 ***
Constant(72.16)(−11.89)
N10,35910,359
R a d j 2 0.2420.433
Notes: (1) t-values under robust standard errors are in parentheses. (2) *** denotes significance at 1% confidence levels.
Table 4. Fourth test results.
Variables(1)(2)
First-StageSecond-Stage
LOCALGPATENTi,t+1
Temple0.041 ***
(12.83)
LOCAL −0.954 ***
(−5.60)
ControlsYESYES
Year FEYESYES
Industry FEYESYES
N10,35910,359
R a d j 2 0.143
Partial F160.09 (p = 0.000)
Notes: (1) t-values under robust standard errors are in parentheses. (2) *** denotes significance at 1% confidence levels.
Table 5. DID test results.
Variables(1)(2)
GPATENTi,t+1GPATENTi,t+1
Chairperson TurnoverChairperson Turnover
(Local 1-0)(Local 0-1)
Treat × post0.124 *−0.170 **
(1.92)(−2.40)
Treat0.059−0.280 ***
(1.11)(−4.65)
ControlsYESYES
Year FEYESYES
Industry FEYESYES
Constant−4.391 ***−5.682 ***
(−5.91)(−10.64)
N36676721
R a d j 2 0.4070.463
Notes: (1) t-values under robust standard errors are in parentheses. (2) ***, **, and * denote significance at 1%, 5%, and 10% confidence levels, respectively.
Table 6. Exclude alternative interpretation—risk-taking.
Variables(1)(2)
LEVROA
LOCAL−0.006−0.000
(−0.79)(−0.19)
ControlsYESYES
Year FEYESYES
Industry FEYESYES
Constant0.081−0.101 **
(0.56)(−2.51)
N10,35910,359
R a d j 2 0.4310.297
Notes: (1) t-values under robust standard errors are in parentheses. (2) ** denotes significance at 5%, confidence levels.
Table 7. Chairpersons’ adaptability to air pollution.
Variables(1)(2)(3)
GPATENTi,t+1GPATENTi,t+1GPATENTi,t+1
AQI_Difference−0.000−0.001
(−0.52)(−0.89)
LOCAL −0.133 ***
(−6.16)
AQI_Difference
× Non-LOCAL
−0.001
(−0.66)
Non-LOCAL 0.130 ***
(5.98)
ControlsYESYESYES
Year FEYESYESYES
Industry FEYESYESYES
Constant−5.196 ***−5.137 ***−5.273 ***
(−11.41)(−11.28)(−11.56)
N973797379737
R a d j 2 0.4400.4420.442
Notes: (1) t-values under robust standard errors are in parentheses. (2) *** denotes significance at 1% confidence levels.
Table 8. Alternative metrics of green innovation.
Variables(1)(2)(3)(4)
GPATENTi,t+2GPATENT_INVt+1GPATENT_UTIt+1GPATENT_GRTt+1
LOCAL−0.090 ***−0.113 ***−0.053 ***−0.082 ***
(−4.45)(−5.92)(−3.06)(−4.36)
ControlsYESYESYESYES
Year FEYESYESYESYES
Industry FEYESYESYESYES
Constant−4.977 ***−4.358 ***−3.406 ***−4.255 ***
(−11.91)(−11.50)(−9.28)(−10.76)
N10,35910,35910,35910,359
R a d j 2 0.4220.3870.3970.421
Notes: (1) t-values under robust standard errors are in parentheses. (2) *** denotes significance at 1% confidence levels.
Table 9. ESG’s moderating effects.
Variables(1)(2)
GPATENTi,t+1GPATENTi,t+1
LOCAL−0.114 ***−0.112 ***
(−5.43)(−5.36)
ESGi,t+10.097 ***0.095 ***
(9.84)(9.65)
LOCAL × ESGi,t+1 −0.095 ***
(−4.82)
ControlsYESYES
Year FEYESYES
Industry FEYESYES
Constant−5.195 ***−5.182 ***
(−12.12)(−12.12)
N10,35910,359
R a d j 2 0.4380.439
Notes: (1) t-values under robust standard errors are in parentheses. (2) *** denotes significance at 1% confidence levels.
Table 10. LE’s moderating effects.
Variables(1)(2)
GPATENTi,t+1GPATENTi,t+1
LOCAL−0.102 ***−0.102 ***
(−4.82)(−4.82)
LE0.0020.002
(0.43)(0.45)
LOCAL × LE −0.011 **
(−2.08)
ControlsYESYES
Year FEYESYES
Industry FEYESYES
Constant−5.060 ***−5.010 ***
(−11.68)(−11.56)
N10,35910,359
R a d j 2 0.4330.433
Notes: (1) t-values under robust standard errors are in parentheses. (2) *** and ** denote significance at 1% and 5% confidence levels, respectively.
Table 11. STMT’s moderating effects.
Variables(1)(2)
GPATENTi,t+1GPATENTi,t+1
LOCAL−0.100 ***−0.104 ***
(−4.74)(−4.89)
STMT−0.053−0.029
(−0.36)(−0.20)
LOCAL × STMT 0.631 **
(2.13)
ControlsYESYES
Year FEYESYES
Industry FEYESYES
Constant−5.045 ***−5.083 ***
(−11.59)(−11.66)
N10,35910,359
R a d j 2 0.4330.433
Notes: (1) t-values under robust standard errors are in parentheses. (2) *** and ** denote significance at 1% and 5% confidence levels, respectively.
Table 12. Heterogeneity analysis of Chairperson’s Network.
Variables(1)(2)(3)(4)
GPATENTi,t+1GPATENTi,t+1GPATENTi,t+1GPATENTi,t+1
Low LevelHigh LevelLow LevelHigh Level
LOCAL−0.094 ***−0.106 ***−0.055−0.151 ***
(−3.21)(−3.44)(−1.07)(−2.79)
ControlsYESYESYESYES
Year FEYESYESYESYES
Industry FEYESYESYESYES
Constant−3.305 ***−6.727 ***−3.854 ***−6.126 ***
(−5.43)(−10.90)(−3.79)(−5.95)
N5427493251795180
R a d j 2 0.4090.4740.4080.466
Notes: (1) t-values under robust standard errors are in parentheses. (2) *** denotes significance at 1% confidence levels.
Table 13. Heterogeneity analysis results.
Variables(1)(2)(3)(4)(5)(6)
GPATENTi,t+1GPATENTi,t+1GPATENTi,t+1GPATENTi,t+1GPATENTi,t+1GPATENTi,t+1
Short-TermLong-TermSOE = 0SOE = 1POLLUTE = 0POLLUTE = 1
LOCAL−0.124 ***−0.096 ***−0.061 **−0.176 ***−0.122 ***0.007
(−4.01)(−3.27)(−2.43)(−4.39)(−4.82)(0.17)
ControlsYESYESYESYESYESYES
Year FEYESYESYESYESYESYES
Industry FEYESYESYESYESYESYES
Constant−5.971 ***−3.208 ***69553404−4.432 ***−6.878 ***
(−10.10)(−4.70)0.3800.552(−8.58)(−9.20)
N524051196955340476392720
R a d j 2 0.4550.4430.3800.5520.4500.425
Notes: (1) t-values under robust standard errors are in parentheses. (2) *** and ** denote significance at 1% and 5% confidence levels, respectively.
Disclaimer/Publisher’s Note: The statements, opinions and data contained in all publications are solely those of the individual author(s) and contributor(s) and not of MDPI and/or the editor(s). MDPI and/or the editor(s) disclaim responsibility for any injury to people or property resulting from any ideas, methods, instructions or products referred to in the content.