Article

Key Operational Variables in Mechanical Vapor Compression for Zero Liquid Discharge Processes: Performance and Efficiency Evaluation

by
Paula Hernández-Baño
1,
Pablo Calleja-Cayón
1,
Francisco Vera-García
1,* and
Angel Molina-García
2
1
Department of Thermal Engineering and Fluids, Universidad Politécnica de Cartagena Member of European University of Technology EUT+, C/ Dr. Fleming s/n, 30202 Cartagena, Spain
2
Department of Automatics, Electrical Engineering and Electronic Technology, Universidad Politécnica de Cartagena Member of European University of Technology EUT+, C/ Dr. Fleming s/n, 30202 Cartagena, Spain
*
Author to whom correspondence should be addressed.
Sustainability 2025, 17(20), 9212; https://doi.org/10.3390/su17209212
Submission received: 16 September 2025 / Revised: 9 October 2025 / Accepted: 13 October 2025 / Published: 17 October 2025

Abstract

The mechanical vapor compression (MVC) is an appealing technology for Zero Liquid Discharge (ZLD) processes, particularly in the context of the increasing global demand for freshwater and the protection of the natural environment. This approach supports the development of circular emerging technologies aligned with the Sustainable Development Goals. In this framework, an extended analysis is conducted to evaluate the performance of the MVC system under various operating conditions, with the objective of assessing the impact on energy consumption and distillate production. Reducing the consumption ratio is essential for enhancing process efficiency and advancing a more sustainable process. For this purpose, the paper examines how fluctuations in compressor boundary conditions affect temperatures and pressures. Moreover, feed brine concentration salinity is varied and related to the distillate flow. In the paper, a real ZLD process case study is provided, with experimental data collected. The real data correspond to four different operating conditions (scenarios), verifying that higher evaporation temperatures and lower compression ratio enhance the performance of such systems and lead to increased distillate production. In addition, the energy analysis reveals a consumption range of 165–214 kWh/m3 feed. Incoming electrical conductivities of up to 100 mS/cm are acceptable without scaling, with periodic HNO3 cleanings recommended. The proposed operating ranges can also be applied to other mechanical evaporation systems for wastewater treatment, desalination processes and ZLD technologies, or transferred to other locations.

1. Introduction

The scarcity of natural freshwater resources, combined with global population growth and climate change, highlights the need for more unconventional water sources. In this context, desalination emerges as a key solution to ensure sustainable water supply. The global desalination capacity stands at 109.22 million m3/day [1]. The most common processes are based on membrane or thermal technologies [2]. Currently, thermal technology has 11.50% of the worldly desalination capacity, while the other part is represented by membrane systems. The processes include multi-effect distillation (MED), multi-stage flash evaporation (MSF), thermal vapor compression (TVC), and mechanical vapor compression (MVC) [3]. However, these systems produce discharged brine into natural environments with salinity levels 1.6 to 2 times higher than seawater. This, combined with the use of chemicals can alter the ecological balance of the marine environment [4]. Consequently, proper management of this waste is essential to preserve natural resources and increase the availability of freshwater. One strategy is the valorization of brine for alternative applications, recovering freshwater and reusing the by-product. In line with the principles of the Sustainable Development Goals (SDGs), this approach supports Goals 6, 7, 12, and 14 [5]. The literature highlights progress toward these targets, emphasizing the development of sustainable and accessible strategies for the use brine. For example, Cui et al. [6] replaced water with the waste stream of seawater desalination in concrete production, ensuring acceptable mechanical properties. In parallel, other feasible techniques are the extraction of ions for industrial applications and the recovery of metals, salts, and energy [7]. M.Reig et al. [8] selectively separated and concentrated Mg2+ and Ca2+ from the brine produced in a seawater reverse osmosis plant with nanofiltration. The aim was to generate ion-rich brines to recover phosphates for use in fertilizers. Sanchis-Carbonell et al. [9] recovered calcium carbonate and saline solutions, which can be reused in industry, and hydrogen, produced during the electrochemical reduction of nitrates, to address energy demand. The process included a reverse electrodialysis process combined with ion exchange, reverse osmosis, and electrochemical reduction. Although these recovery methods offer significant advantages, they have some challenges, such as energy costs, membrane fouling, stability of the electrodes, limitation of pressure, membrane lifespan, etc [10]. So, the involvement of various technologies is necessary to handle the composition characteristics of the treated stream. Typically, membrane and thermal technologies are combined, resulting in configurations such as the Zero Liquid Discharge (ZLD) process, where liquid waste is eliminated and a solid is produced [11]. In the energy sector, ZLD systems have appeared as MVC-based brine concentrator and brine crystallizer technologies, which have been marketed and deployed in power plants [12]. In the desalination framework, MVC is a viable solution that can be integrated into the ZLD process in combination with reverse osmosis, denitrification, cooling tower, or Wind-Aided Intensified Evaporation (WAIV) technologies [13].
MVC is a robust system that revalorizes industrial wastewater or brine management [14]. The incoming stream is heated using the recovery of heat from the mechanically compressed vapor and the system operates under vacuum conditions. The technical fundamentals of the MVC system provide the basis for its successful application in ZLD configurations, and research studies have examined how operating conditions impact overall efficiency [15]. This is principally because it is necessary to understand its performance as a standalone system to be integrated later. As a consequence, the main working variables are presented in Table 1, highlighting the more relevant aspects in this section. This summary is conducted based on 73 documents from the Scopus database. After applying specific criteria (keywords, type of document, and period of time), a thorough analysis leads to the collection of 20 references. This preliminary literature analysis provides a solid foundation for understanding the general operating range of MVC systems. It also offers an overview of the state of the art in MVC applications, including theoretical and experimental approaches.
Analyzing these parameters, the temperature and pressure variables were included for their significant impact on system efficiency. Li et al. [16] evaluated two scenarios in a MVC for wastewater treatment applications under atmospheric and vacuum conditions. The boiling temperature ranged from 100.27 °C to 55.80 °C. Overall, the experimental results showed higher distillate production under atmospheric conditions. Yang et al. [17] studied the performance of a screw compressor under evaporating conditions from 70 °C to 110 °C, and Zhang et al. [18] analyzed a similar range for a roots vapor compressor, which was 90–105 °C. The MVC systems proved to be effective within these temperature ranges and compressors type. In addition, a lower temperature was registered in theoretical models, and specifically those that considered multiple effects (2–6), since the evaporation process occurs in several stages [19]. Compression ratio (CR) depends on the technical characteristics. Centrifugal vapor compressors and root blowers work with CR 1.2–2.2 and 1.2–3.5, respectively. Screw vapor compressors have a range of 1.5–10. Different values from the literature are collected in Table 1. Furthermore, performance can be evaluated with two possible approaches: (i) evaporation flow and (ii) energy consumption (kWh/m3). Precipitation issues can have a negative impact on process efficiency, and the characterization of the feed stream is important. Previous works reported higher energy demand for saturated solutions [20,21]. In a single effect system for desalination processes, Jamil et al. [22] experienced an oscillation 9.5–20 kWh/m3. Zhang et al. [23] evaluated the energy consumption in a MVC system for wastewater treatment, observing 75 kWh/m3, and Dahmardeh et al. [21], in a singular case of high salinity, registered 193 kWh/m3. Other approaches examined the technology with nanofiltration membranes and the hybrid proposal showed an energy consumption from 20 to 150 kWh/m3 depending on the salt rejection and recovery ratio [24].
The literature reveals that most contributions are primarily focused on the development of mathematical frameworks evaluated under simulated operating conditions. Moreover, these contributions generally tend to concentrate on individual operational variables without providing a comprehensive assessment of all these variables, and do not take into account their interactions and combined effects on system performance. Complex and detailed models commonly require a relevant number of parameters that are not usually available or are difficult to monitor. To overcome this drawback, this paper focused on an extensive analysis to evaluate the efficiency and performance of MVC systems under various operating conditions. The novelty of this paper is to examine how fluctuations in the compressor boundary conditions impact temperatures and pressures, including working flow rates, energy consumption, electrical conductivity, and performance under varying operating conditions. Furthermore, a distinctive feature of this work is the inclusion of experimental data, which sets it apart from theoretical simulations. This is mainly because it is the central element that limits the working conditions in these types of systems. Indeed, these independent insights are valuable for the MVC design. An experimental and extensive integrated analysis is thus necessary to achieve a global overview, estimating the performance and efficiency improvements for MVC technology.
Table 1. Contributions on operating conditions and energy consumption for MVC systems.
YearRefs.Data SourceNumber of EffectsBoiling Temp
(°C)
Compressor Vapor Temp
(°C)
CRFeed Flow
(kg/s)
Evaporation Flow
(kg/s)
Feed Composition
Solute/Solution (ppm)
Energy Demand
(kWh/m3 Evaporated)
2015[16]Real dataSingle effect561.270.0015–0.0052000120.87
2016[25]Real data276–81124–135350 (m3/day)
2016[17]Real dataSingle effect70–1101151.15–1.650.028–0.083
2017[20]Simulated data1–1260961.442.7830,000–300,000
2017[22]Simulated dataSingle effect55–9530,000–57,0009.5–20
2017–2018[19,26]Simulated data2–640–77721.35703535,0007.67–11.36
2018[27]Simulated data1–1475–901.40–25–1000 (m3/day)160,000–200,000
2019[28,29]Simulated data2–1050–601561.8539.2914.5336,00011.75–17
2020[23]Real/simulated dataSingle effect729230.0002875
2020[30]Simulated dataSingle effect601.3510–587.5–42.535,000
2020[31]Simulated dataSingle effect601412.1310.747.4468,00037.7
2021[24]Simulated dataSingle effect63811.26500 (m3/day)20–150 a
2022[32]Real/simulated dataSingle effect952.50.11400,000–500,000
2023[33]Real/simulated dataSingle effect881.25–1.710.058–0.089Co2+ 103.9
Sr2+ 83.9
Cs+ 57.8
2023[18]Real/simulated dataSingle effect90–1051.3–3.50.11
2023[34]Simulated dataSingle effect6367–811.25–2.410–609.88–13.5240,000
2023[35]Simulated data752–61921.56.761
2024[36]Simulated dataSingle effect75–551.15–1.510.520.64–36.06 b
a With Nanofiltration, b Hybrid system HDH-MED-MVC.

2. Methods

2.1. Preliminaries

A MVC system combines thermal and mechanical processes. Throughout this system, streams undergo changes in their composition and state. The enthalpy–entropy (H–s) diagram of the thermodynamic process is essential to understanding the energy transformations and phase changes [37]. Figure 1a shows the thermal process. The heated brine is continuously recirculated, receiving energy from the tubes of the heat exchanger. Part of the stream evaporates when introduced into the evaporation chamber ( 1 2 ). Before reaching the conditions of P1, the brine is preheated by recovering the sensible heat of the produced distillate. In the evaporator chamber, the brine attains this state (P1) by mixing with the existing liquid–vapor mixture. Recirculation through the heat exchanger allows the latent heat of the superheated vapor to be utilized, increasing the temperature and reaching saturation conditions (P2). In addition, the vacuum generated by the compressor in this evaporation chamber promotes the achievement of the boiling point. The process operates along the isobaric curves of approximately 0.5 and 1 bar. Both temperature and pressure increase as the vapor is drawn into the compressor ( 2 3 ). The superheated vapor transfers the condensation energy to the incoming brine to build a self-sufficient process ( 3 5 ) which does not depend on external thermal sources. In ideal processes, vapor condensation occurs at constant pressure and temperature. However, under real conditions, the fluid experiences a pressure drop as it passes through the heat exchanger, which causes a decrease in its temperature. This results in a reduction of the available energy. To clarify the identified streams, Figure 1b shows a schematic representation of the process, without including P4, which is an intermediate point.
This work aims to perform a comprehensive analysis to evaluate the efficiency and performance of the MVC system under various operating conditions. Firstly, a general methodology is proposed to examine an arbitrary MVC system. Fluctuations arise from modifications in the compressor boundary conditions, as it is considered the core unit. These fluctuations are analyzed depending on the input and output variables, such as pressure, temperature, evaporation flow, energy consumption, and electrical conductivity evolution. The proposed methodology is shown in Figure 2, where an iterative method is introduced to test the conditions, labeled as scenarios j = 1 n . In each scenario, input variables are defined, such as the maximum inlet and outlet temperature and pressure at the compressor. With this purpose, it is necessary to install a control system that manages: (i) the maximum compressor outlet temperature through a controllable pump that adjusts the cooling flow rate; (ii) the maximum compressed vapor pressure using automatic venting valves; (iii) a variable frequency drive to control the rotational speed according to the required work and the allowable saturation conditions at the compressor inlet; and (iv) the pressure before the compressor to prevent inadequate depressions according to the operating parameters of the system. Additionally, an external heating system is required for the startup and to compensate for temperature losses in the evaporator chamber. This system generates an additional vapor flow, ensuring that the compressor always operates within its performance curves, even if insufficient vapor is produced during transient states. Consequently, it is recommended to set a threshold temperature below which the external heating system is automatically activated. The experimental results lead to a comprehensive analysis and discussion, highlighting how the input conditions influence system performance. The main outputs considered are the following: outlet pressure and temperature of the vapor, heating element duty cycle, distillate flow, electrical requirements, and electrical conductivity evolution.

2.2. Operating Conditions

The process described in Figure 2 needs the definition of operating conditions as input. This definition is based on the literature review addressed in Section 1. The selected values for this work are collected in Table 2. Furthermore, the operating conditions must be selected within the compressor specifications to ensure the integrity of the prototype [38]. Some MVC systems operate at temperatures lower than 80 °C [39]. However, the authors report a decrease in compressor load at boiling temperatures [40,41]. In addition, the lower values apply when multiple effects are considered. For this reason, the paper examines a recommended working range for the compressor inlet temperature from 80 °C to 90 °C. The characteristics of the compressed vapor fluctuate depending on this inlet temperature, the cooling flow rate, and the compressor’s capacity [17]. Evaporating temperatures up to 135 °C could be reached, but such values would not be appropriate for the isentropic efficiency of the compressor [25]. Generally, for outlet pressures around 1 bar, the temperature exceeds 100 °C, which is lower than 135 °C. As a result, this paper defines a temperature interval of the compressed vapor from 100 °C to 130 °C for single effect compression units. In parallel, the compression ratio (CR) is another variable of interest. The specific literature provides different operating CR from 1.15 to 3 [17,20,22,42], but it is closely related to the technical specifications according to the manufacturer. This study considers a range of values: ( 1 , 2 ] . Moreover, this parameter is defined as the ratio of the outlet pressure to the inlet pressure of the compressor, by using absolute pressures. The overpressure issues are managed by the pressurization system, which allows the release of vapor. To avoid undesired losses a range is defined for this system. So, the maximum opening is set between 1.05 and 1.09 bar, following the determined CRs. The inlet pressure is also controlled and is fixed above 0.5 bar absolute.

3. Case Study

3.1. System Description

The MVC prototype is located in Cartagena, southern Spain, and is integrated into a ZLD process. The ZLD process aims to recover resources and minimize waste by treating the concentrate discharged from a reverse osmosis (RO) system with an influent of brackish water. This stream requires careful management, as traditional disposal methods are not suitable due to the proximity of the plant to a protected coastal lagoon, known as Mar Menor (Law 3/2020, of 27 July, on the Recovery and Protection of the Mar Menor). The ZLD process is integrated by various technologies: second RO, biological denitrification, cooling tower, MVC, and WAIV [13]. The experimental MVC unit receives rejected brine from a cooling tower, while crystallization occurs through WAIV-evaporation-pond technologies. In the prototype, the electrical conductivity is varied from 25 to 100 mS/cm. The composition of the salt precipitate from the rejected brine in the MVC system is collected in Table 3. The technique used for its determination is X-ray diffraction (XRD).
Given the complexity and robustness of the setup, each component is carefully specified. The experimental MVC is shown in Figure 3 with its key elements. Following the explanation of the process flow in Section 2.1 and Figure 1, Table 4 provides an overview of the main equipment involved: (i) auxiliary heating element (R0101, T-0103), (ii) heat exchanger (HE0102), (iii) compressor (C0101), (iv) evaporator (T-0102), (v) pre-heat exchanger (HE0101), and (vi) venting system located at the compressor outlet. Moreover, the experimental technology incorporates a valve for the recirculation of compressed vapor (FCV0101 in Figure 3), which is activated during the initial startup phase. In addition, if required, this valve can be programmed to recirculate vapor under specific temperature conditions. The removal of condensate at critical points is handled by automatic valves that open at regular intervals. In a real process, both compressed vapor energy and an auxiliary heating element are used to evaporate the incoming brine. The heating resistance has a duty cycle (ON–OFF) depending on the evaporation temperature values. At the inlet, the feed is preconditioned in HE0101, where the sensible heat from the produced distillate is transferred. The brine stream is then directed to T0102, where a liquid–vapor mixture is maintained. Continuous recirculation of the brine, facilitated by pump P0102 and through heat exchanger HE0102, aims to increase the temperature and speed of the fluid. This process leads to a pressure drop within the exchanger and the evaporation chamber T-0102, potentially causing cavitation. Part of the flow will subsequently undergo a phase change to vapor. As described, T-0102 achieves the necessary boiling conditions due to the compressor action, generating a vacuum on the side of the evaporation chamber. Finally, the vapor is compressed, recovering its heat in HE0102 or recirculating this stream in T-0102 through the FCV0101 valve. The concentrated brine is periodically discharged from the system every four minutes for four seconds. Furthermore, data are recorded with a sophisticated monitoring system that also allows the control of the evaporation plant. Pressure sensors can be measured under vacuum conditions, and the selected models are as follows: PX3524 (inlet) and PI2795 (outlet) IFM company, for liquid and gas. The measurement of temperature in the evaporation chamber and the outlet compressor is recorded with the PT1000, TD2251, and TD2241, respectively. Additional and detailed information on monitoring, elements, and devices is described in [43].

3.2. Scenario Definitions

Following the methodology proposed in Figure 2, four scenarios are defined to verify the influence of critical variables on system performance. It is important to mention that these scenarios are designed according to the ranges in Table 2 and the compressor boundary conditions. The experimental procedure is shown in Figure 4. One of the input variables used to control the evaporating temperature is the duty cycle of the electrical resistance. The device can either remain active throughout the full operation period or alternatively switch on and off according to a specific set point. In the last case, the selected interval ranges from 82 to 84 °C. External heat requirements are evaluated with respect to the overall system efficiency, taking into account the activation time of this heating element and distillate production. The corresponding duty cycle for Scenario 1 is 100%, whereas the remaining scenarios depend on the temperature set. Following the manufacturer’s instructions, the limit of the outlet compressor temperature is 130 °C [38]. However, 115 °C is established as the maximum temperature value to avoid potential overheating and extreme operating conditions. The authors tested temperatures higher than 115 °C and overpressure issues were registered, with undesired shutdowns. During the initial Scenarios, Scenarios 1 and 2, the maximum is set at 110 °C. Subsequently, in Scenarios 3 and 4 the value is increased (115 °C) to evaluate the energy balance in HE0102, studying the variation in the performance. Another critical input variable is the pressure limit at the compressor outlet. For safety conditions the upper limit is defined at 1.09 bar. Increasing this maximum outlet pressure prevents the release of compressed vapor to the environment, improving efficiency. Scenario 1, Scenario 2, and Scenario 3 operate with an open value of 1.05 bar. An increase to 1.07 bar is proposed to avoid continuous venting losses, according to observations during the tests. The concentrated brine is discharged from the system every 4 min for 4 s. Each discharge process results in an outlet volume of 3 L. Although the flow rate could vary by modifying this parameter, it remains constant in this study. The objective is to evaluate the influence of physical variables without introducing changes related to discharge time settings. Furthermore, the effect of compressed vapor recirculation through FCV101 is analyzed in Scenario 2, which means that the valve is not only activated during the startup phase. The output variables are presented in Section 4.1. Based on these results, an evaluation is conducted to thoroughly analyze the system performance, based on the following: the compressor inlet and outlet temperature, compression ratio, feed and distillate flow, and energy consumption.

4. Results and Discussion

4.1. Results

This section presents a detailed analysis of the results obtained. As previously mentioned, system performance is largely determined by the compressor boundary conditions and the predefined scenario designs. Data evaluation focuses on the temporal evolution of temperature, electric resistance duty cycle, and pressure in various scenarios. Table 5 shows the process variables. Physical parameters, specifically temperature and pressure at the compressor inlet and outlet, comprise an extended data set: Scenario 1 (1365 data points), Scenario 2 (7784 data points), Scenario 3 (486 data points), and Scenario 4 (82 data points), recording all measurements per variable. The monitoring system records the values at each minute. With respect to Scenario 1, an operational period of four hours is implemented for steady-state conditions. In Scenario 2, the operating time varies from 4 to 7 h due to the variation in temperature at the compressor inlet. This variation is depicted in Figure 5. Scenarios 3 and 4 operate close to the operational limits of the compressor. Consequently, lower data points are observed, corresponding to operating times of approximately 1.5 h. Additionally, Scenario 3 experienced shutdowns due to excessive pressure at the compressor outlet, which also reduced the number of available data points.

4.2. Temperature and Pressure Analysis

The evolution of temperature is represented in Figure 5. The progression of the inlet temperature is highly influenced by the duty cycle of the electric resistance, which produces an auxiliary vapor stream to maintain the evaporation conditions. The fluctuation is not pronounced in Scenario 1, where the electric resistance remains active for the entire duration of the operation. Scenario 2 presents a greater decrease in the inlet temperature to the compressor; the duty cycle is reduced by 50% compared to Scenario 1. Part of the compressed vapor is introduced into the evaporation chamber through the FCV0101 valve, as described in Section 3. The main objective is to minimize the external vapor requirements and achieve lower electrical consumption. However, the compressed vapor enters the evaporation chamber in a saturated state, reducing the energy of the superheated vapor before the compressor. The saturation conditions are mainly caused by external losses, producing a liquid–vapor mixture. Figure 6 illustrates the evolution of the duty cycle for the scenarios, providing a clearer view of these fluctuations and the behavior of the electric resistance duty cycle. As shown, despite the increase in outlet temperature (production of vapor with higher energy) in Scenarios 3 and 4 and the deactivation of FCV0101, heat recovery does not improve and the evaporating conditions are similar to Scenario 2, not reducing the duty cycle of the external heating element.
The maximum outlet temperature in the compressor is predefined by the technical characteristics of this element. The cooling system restricts the temperature between 110 and 130 °C. For the experimental procedure, temperatures are set at 110 and 115 °C, and the evolution is illustrated in Figure 5 with two regions. At the top, Scenarios 3 and 4, operating with a refrigerant flow rate of 4 L/h, reach a compressed vapor temperature of 110 °C. In contrast, Scenarios 1 and 2, working at 5 L/h, show slightly lower compressed vapor temperatures between 102 °C and 105 °C. In addition, Scenario 1 presents a lower outlet temperature than Scenario 2 due to its reduced compression ratio (Table 5).
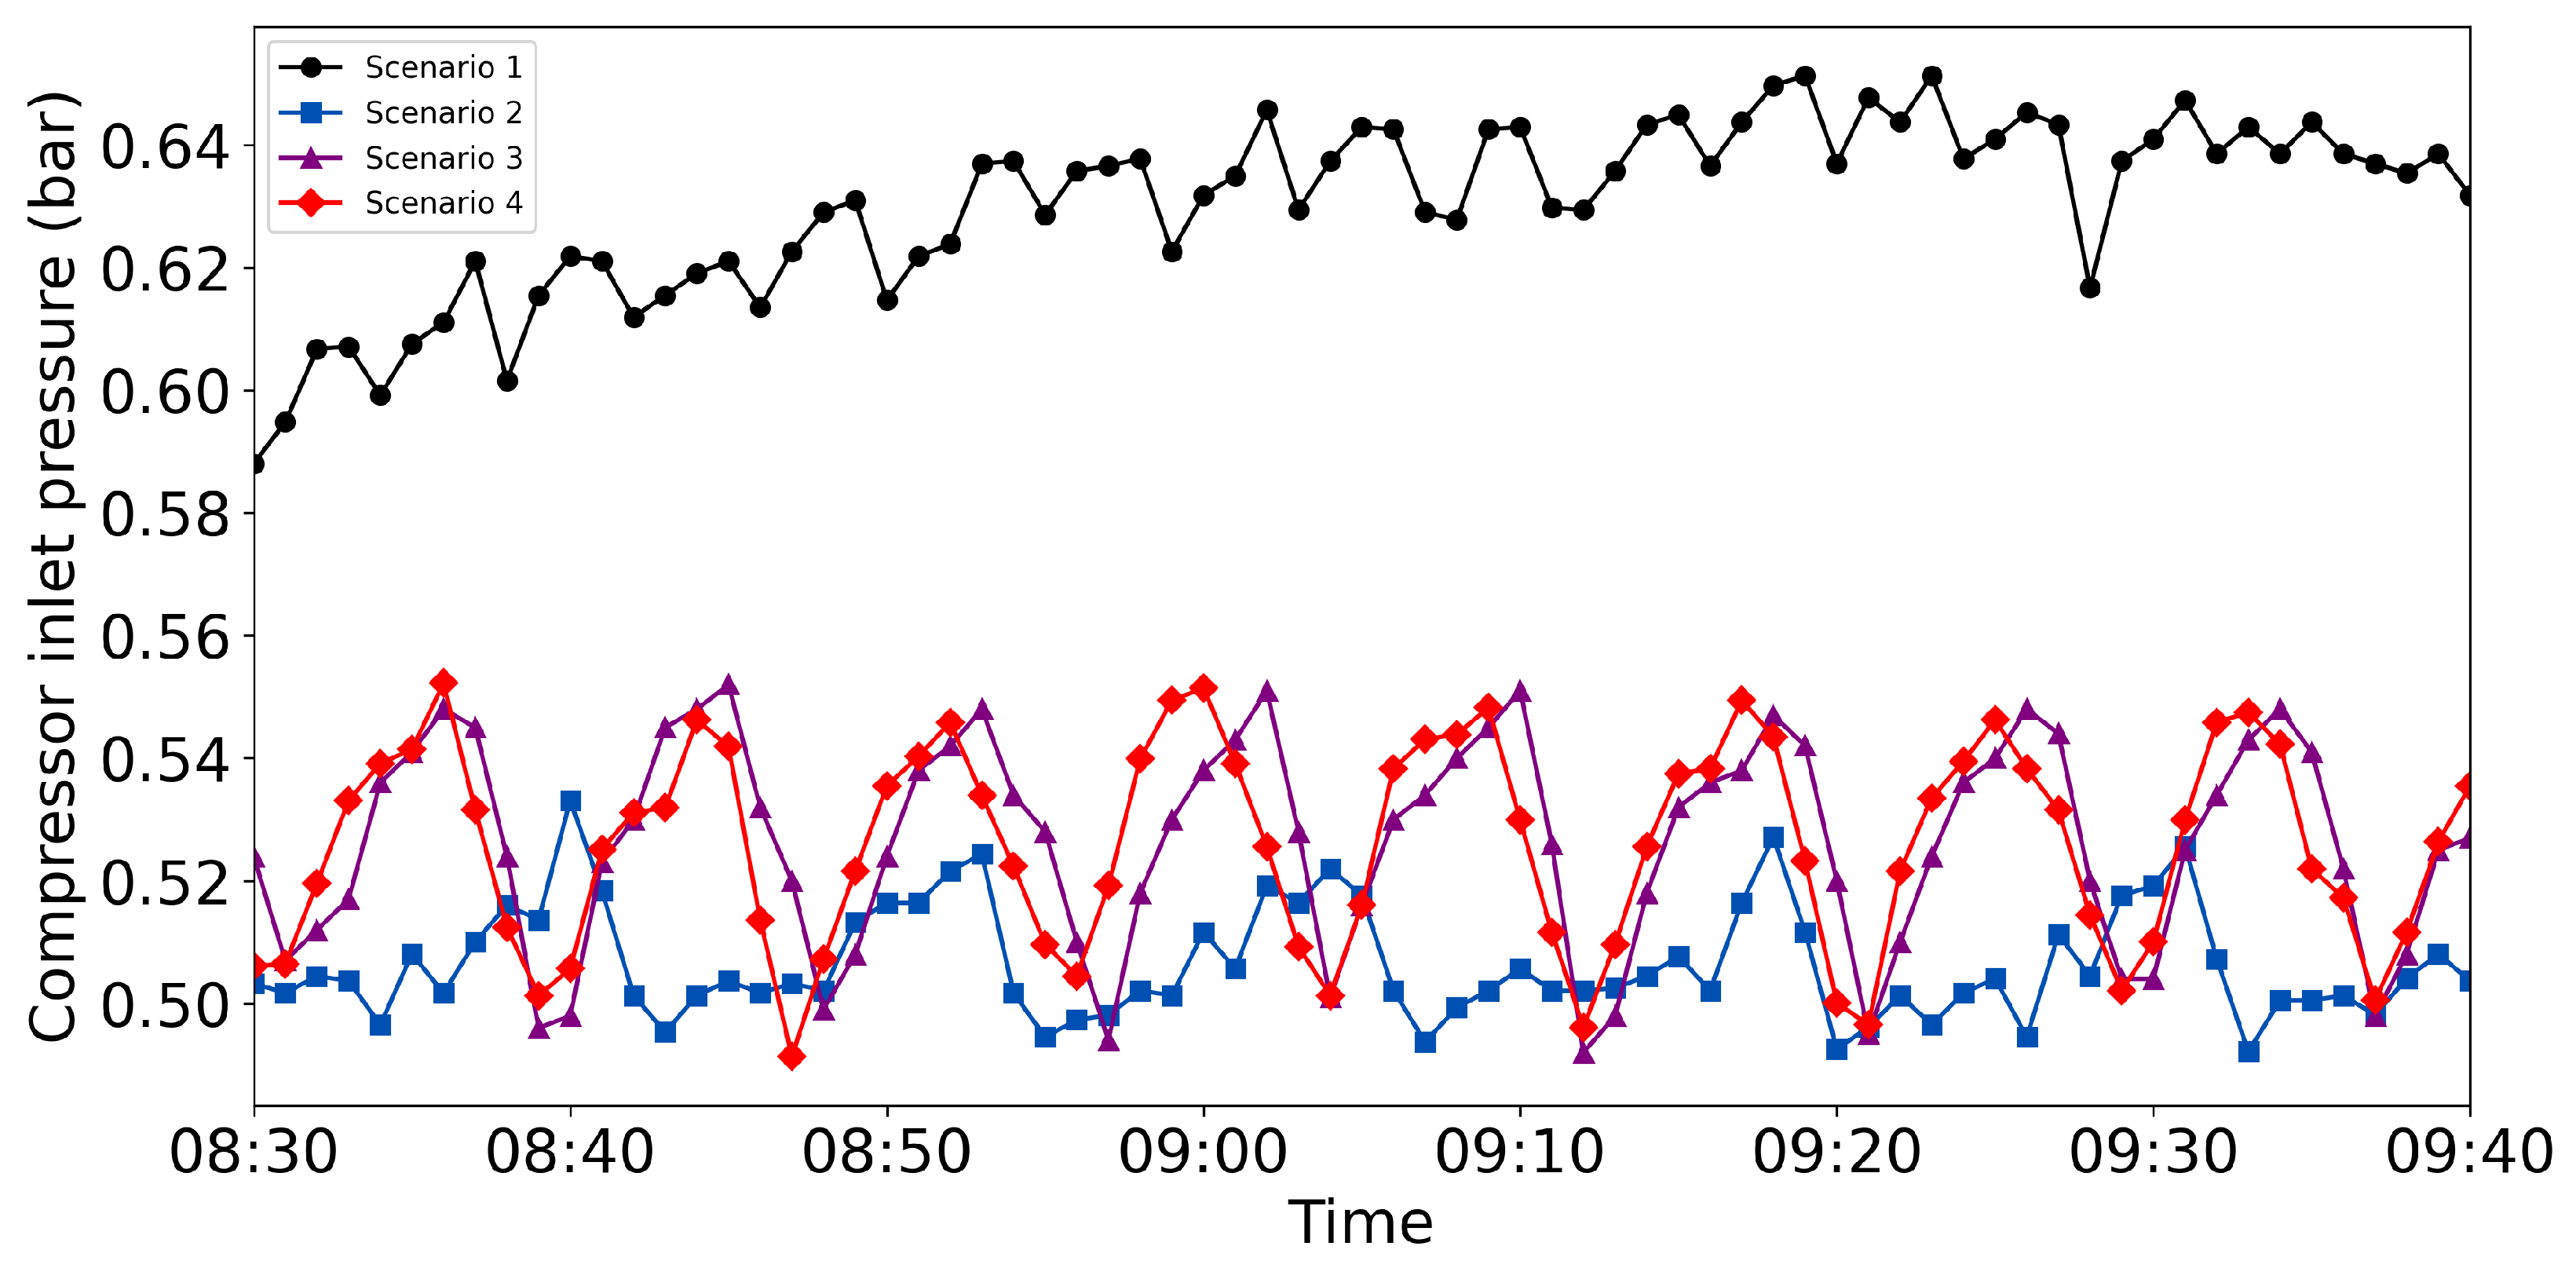
A MVC system works under specific vacuum conditions, depending on temperature. The system is limited to generating a vacuum that is not less than 0.5 bar absolute. Figure 7 shows the vapor pressure at the compressor inlet. These fluctuations are influenced by temperature, and the system is carefully monitored to regulate both parameters to maintain optimal evaporation conditions. Consequently, Scenarios 1 and 2 demonstrate more consistent behavior compared to Scenarios 3 and 4. In Scenario 1, this consistency results from the external heat source maintaining a constant temperature by operating continuously. In Scenario 2, operation occurs within a narrow pressure range near the minimum achievable vacuum due to the recirculation of saturated vapor, which causes a temperature drop.
The venting action is illustrated in Figure 8. The valves open and close depending on the set point, producing continuous fluctuations. Results are shown according to the outlet temperature. To provide a clearer explanation, Figure 8 is divided into Scenario 1–2 and 3–4. At higher outlet temperatures, the system exhibits more unstable behavior (see Figure 8b) due to the requirements for managing aspects of overpressure. Additionally, undesired shutdowns are observed from such results, mainly in Scenario 3.

4.3. Discussion

The assessment of temperature and pressure variables is conducted to examine their influence on output variables: energy consumption, distillate flow, and CR. Table 5 summarizes these output variables and results for feed brine with electrical conductivity lower than 100 mS/cm. In parallel, electrical conductivity higher than 100 mS/cm is related to distillate production because of its interest in performance, principally. Energy consumption includes the whole prototype, as well as auxiliary components such as the heating element R0101, recirculation pumps, and others.
For the scenarios described, electrical consumption ranges from 165 to 214 kWh/m3 feed, depending on the established operating conditions. The optimal energy consumption value is obtained for Scenario 1, which works at 88.30 °C. Under these conditions, the system produces more distillate flow, 40 L/h, resulting in the lowest rate, 165 kWh/m3 feed. The experimental system is programmed to increase the feed flow rate depending on the amount evaporated. For this reason, certain operating conditions promote higher brine renewal rates and, consequently, increase the intake flow rate. Scenarios 2 and 3 reduce the system performance with an electric heater duty cycle of 50–60% of the operating time. Despite this reduction, the production of distillate is insufficient to meet the energy ratio of Scenario 1. Moreover, in Scenario 2, the actuation results of FCV0101 are counterproductive. Recirculation of compressed vapor reduces the temperature in the evaporator (T-0102), reaching values of 78 °C lower than the saturation point at the working pressure. In Scenario 3, overpressure issues were not properly managed, observing a continuous release of vapor, so losses reduce the effective flow of this stream. The discharge occurs upstream of heat exchanger HE0101, thus its energy is not being utilized. In addition, for Scenario 4, increasing the maximum allowed temperature and pressure of compressed vapor leads to an increase in the incoming brine temperature, resulting in an output of 170 kWh/m3 feed. In general, the capacity of vapor production decreases when compressed and saturated vapor is introduced into the evaporation chamber, 28 L/h for Scenario 2, but increases with higher outlet temperature and pressure, 35 L/h for Scenario 4.
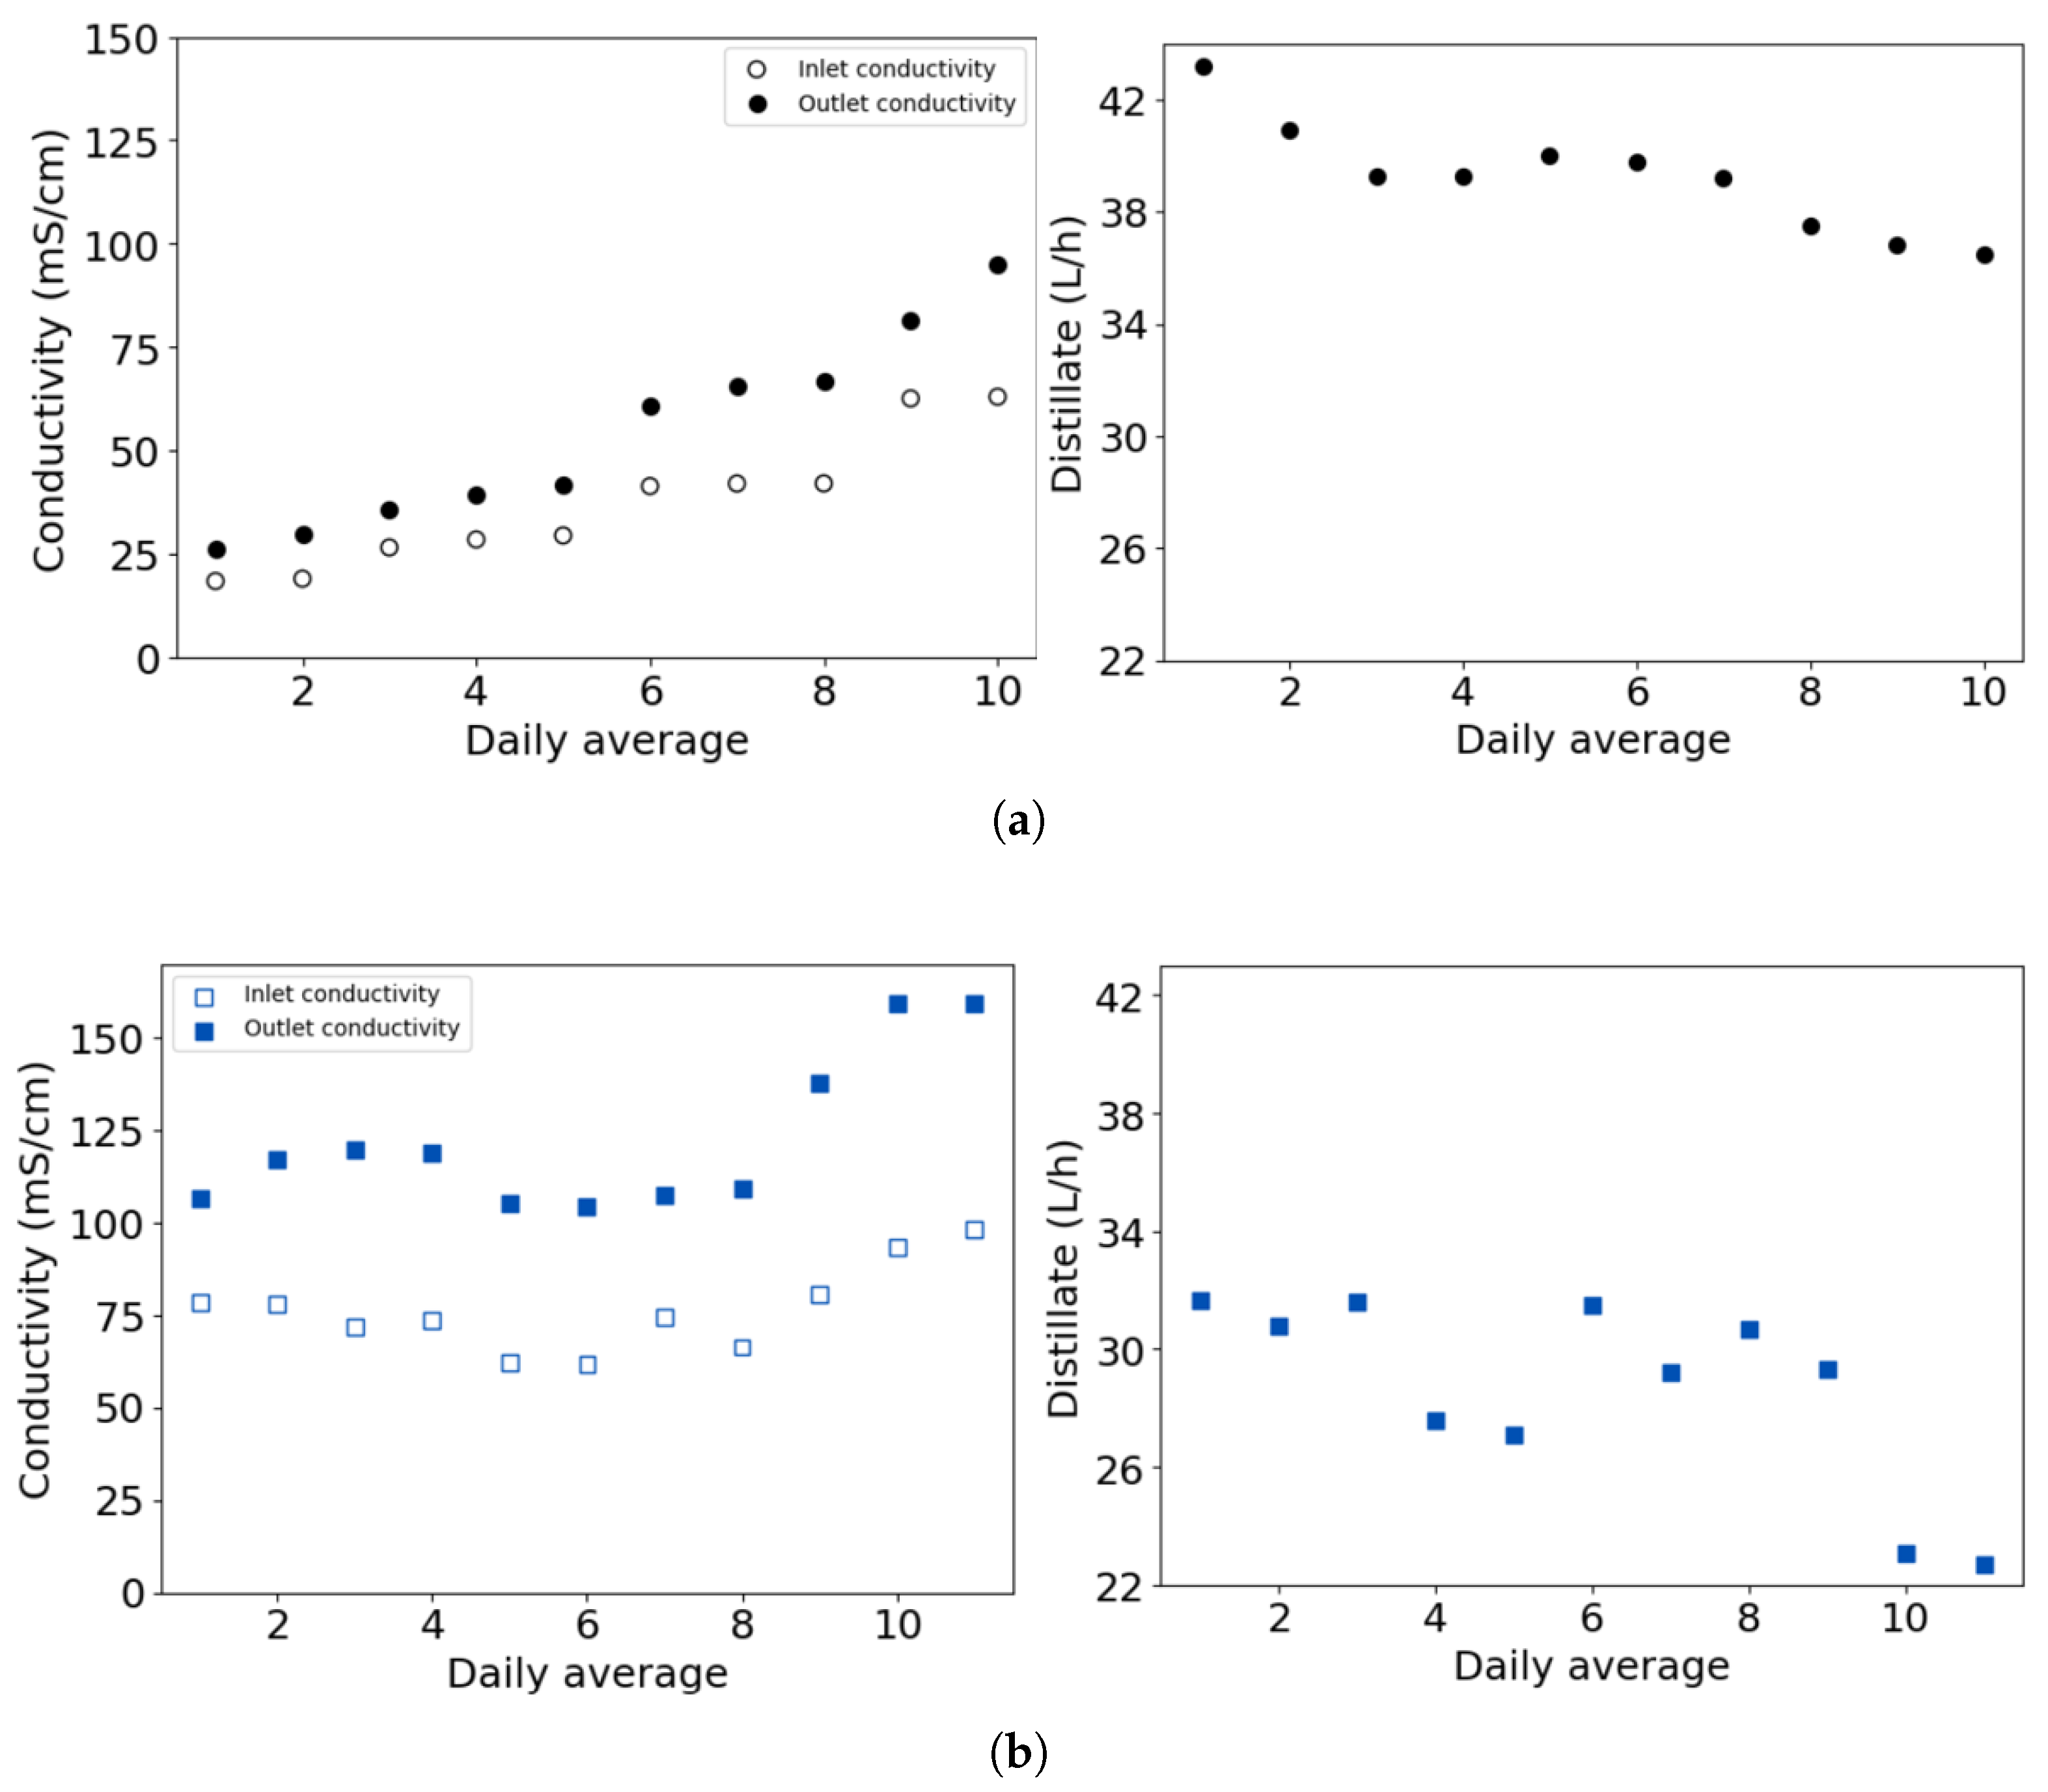
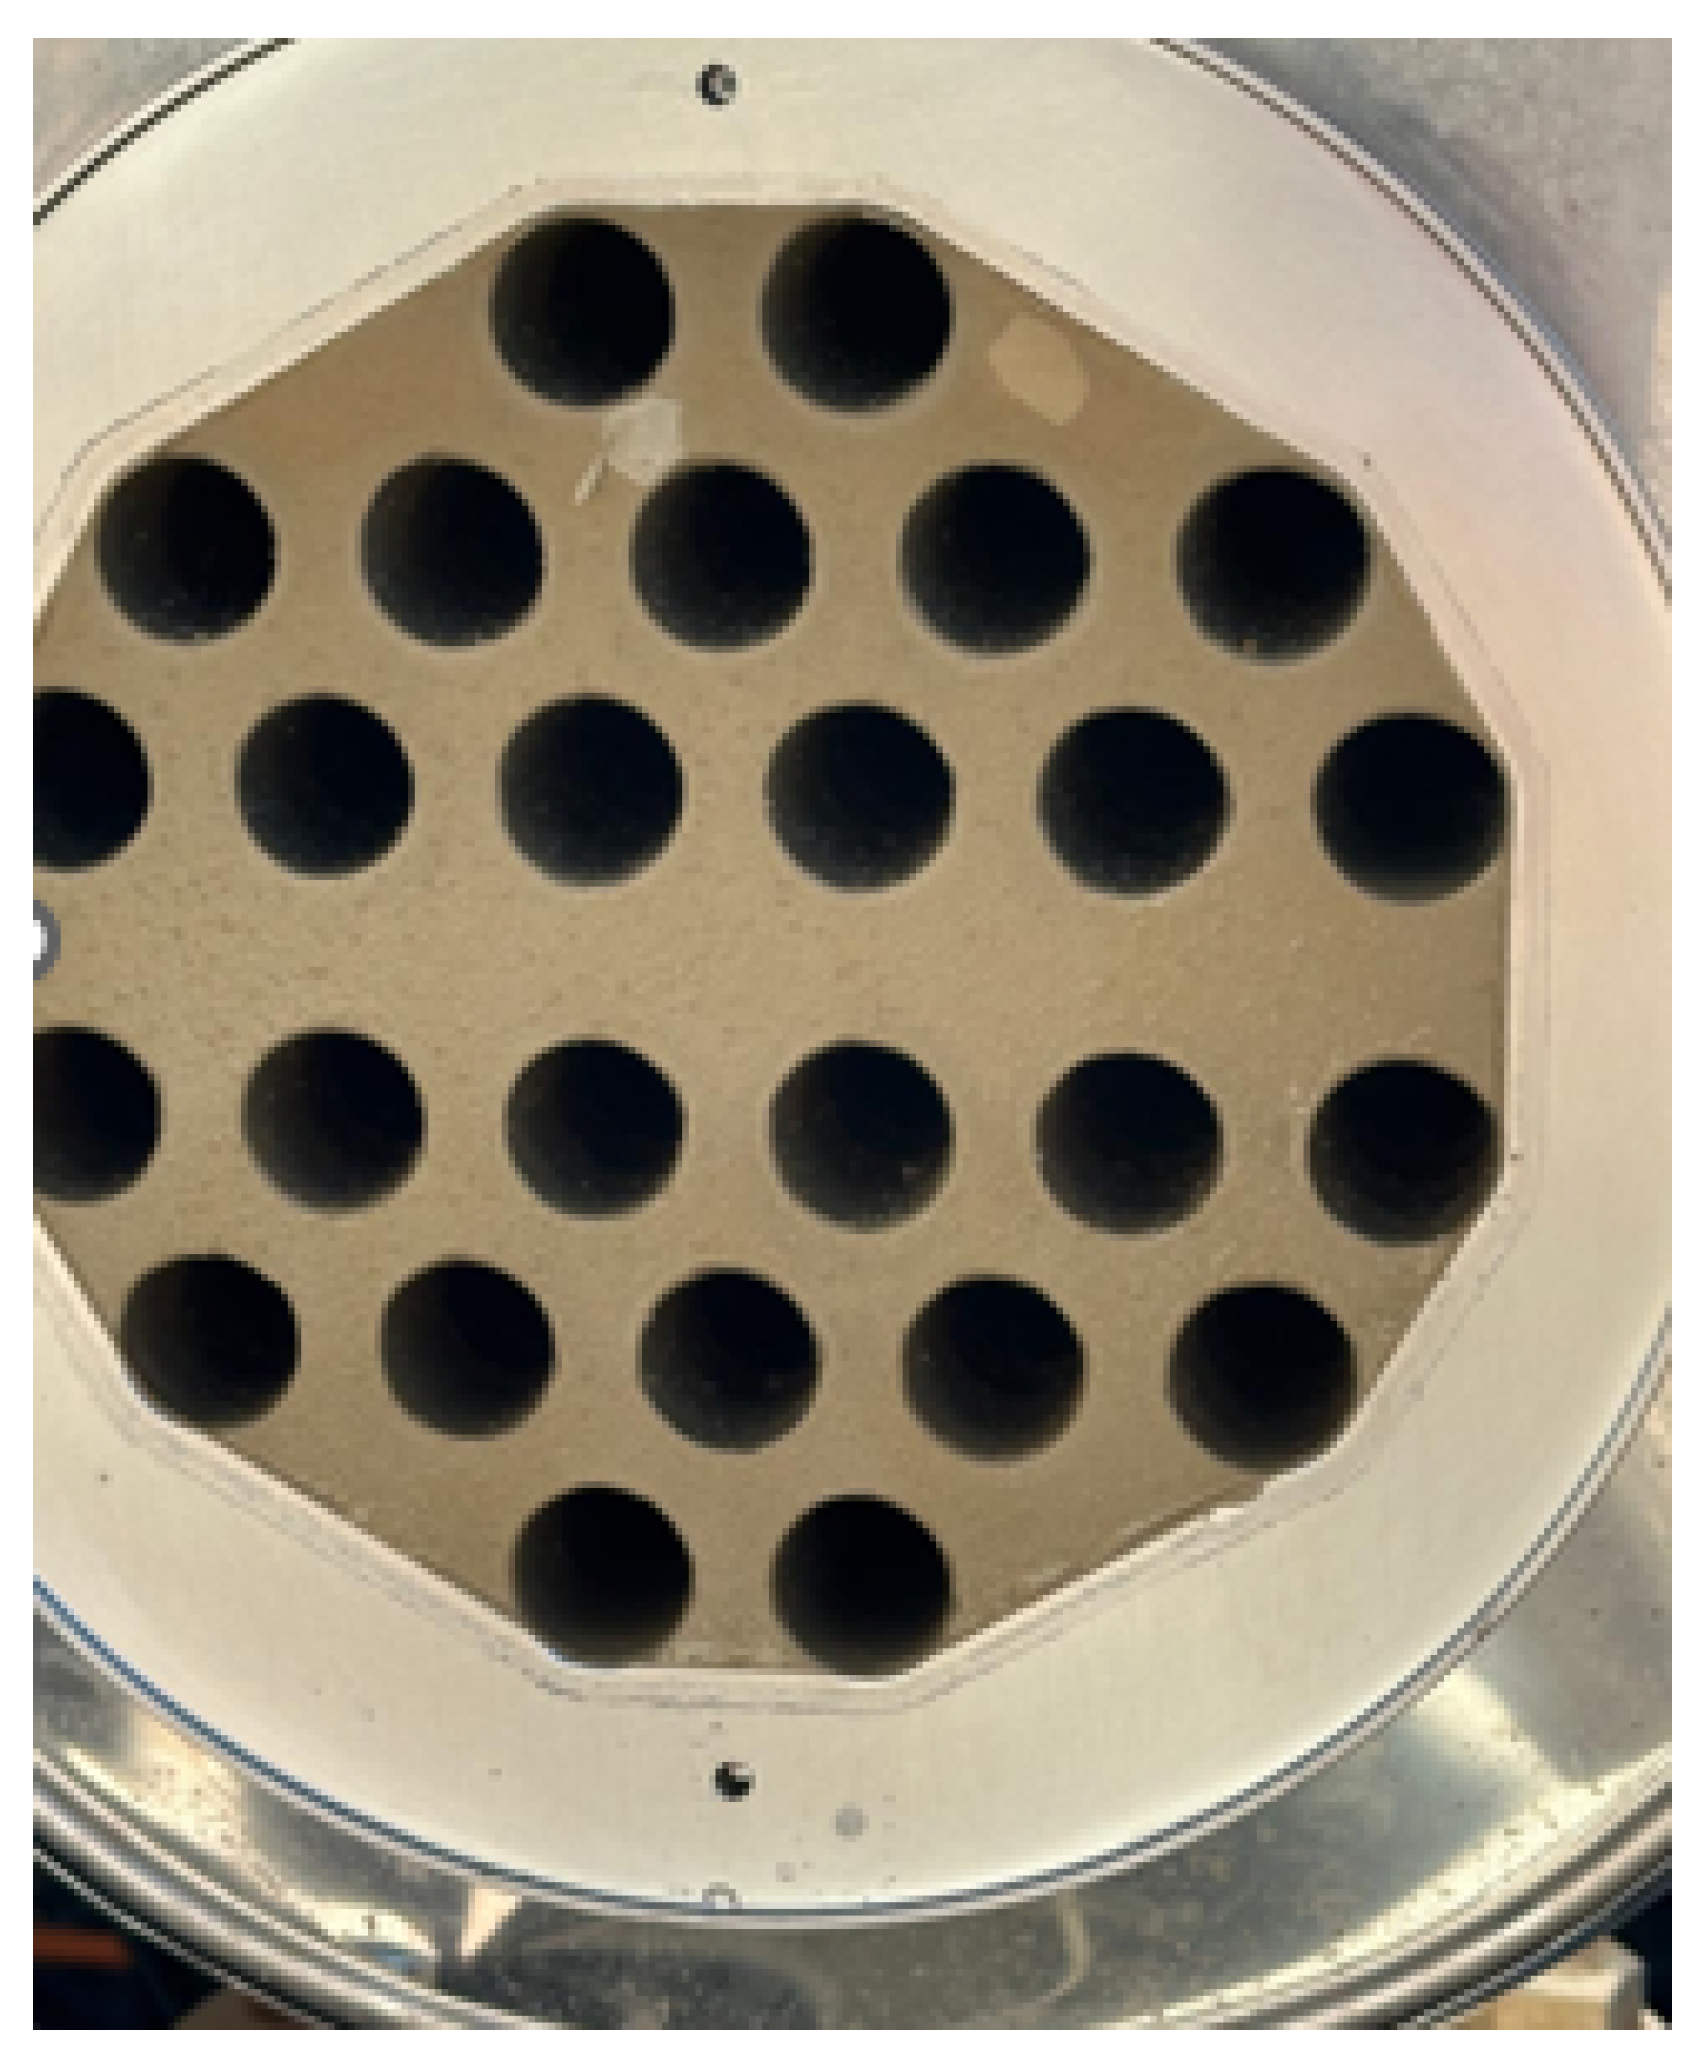
The electrical conductivity values are analyzed for Scenarios 1 and 2 due to the large data set available. Performance problems were not detected when the feed conductivity remained below 100 mS/cm. Figure 9a shows the evolution of both inlet and outlet conductivity, along with the distillate flow. For feed conductivity ranging from 20 to 60 mS/cm, no significant deviations are observed. However, Figure 9b illustrates that the system performance and distillate flow decrease from 32 to 22 L/h when conductivity increases from 75 to 100 mS/cm. This reduction affects the energy consumption ratio (kWh/m3 feed) negatively. Salt and organic matter deposits are observed from this point, as illustrated in Figure 10. Therefore, it is recommended to operate within an appropriate conductivity range up to 100 mS/cm, including regular cleanings with HNO3, weekly. The cleaning solution has a concentration of 1 wt% HNO3, prepared from 69 wt% HNO3 and mains water; the working temperature is 70–85 °C and the speed of 1.5 m/s.

5. Conclusions

Mechanical vapor compression is an attractive technology for ZLD processes. This system uses mechanical energy to compress the vapor and recover its thermal energy, offering a sustainable evaporation approach by reducing energy consumption. In the experimental prototype, MVC technology is integrated with other thermal and membrane-based processes, enabling the achievement of zero waste and by-product valorization. However, to develop an efficient process and combine MVC with other systems, this study analyzed in detail the influence of the compressor boundary conditions (temperature and pressure) based on the following output variables: temperature evolution, CR, distillate flow, and energy consumption. The proposed approach enables the assessment of performance and response range according to these output variables, which are mainly energy consumption and distillate production. In parallel, the study defined a recommended working range of temperatures and pressures for single effect systems. The system was tested in a boiling point range from 80 °C to 90 °C, obtaining the highest distillate flow at 88 °C, with a duty cycle of 100%. To maintain this evaporation temperature without external energy input, compressed vapor was recirculated to the evaporation chamber. However, this stream was under saturated conditions due to external losses and performance was not improved. The evaporator temperature reached 76 °C, a counterproductive value given the existing pressure of 0.5 bar. To address this situation, another scenario was evaluated, in which the maximum temperature of the compressed vapor was increased by 5 °C without vapor recirculation. The distillate production was more efficient (35 L/h), but the optimal performance was at 88 °C, producing 40 L/h. Moreover, operating at a compression ratio of 1.6 resulted in enhanced system behavior compared to values of 2. As a consequence of these modifications, the energy consumption ranged from 165 to 214 kWh/m3 feed, with temperature being the key parameter influencing energy performance. In addition, no significant variations in distillate production were observed when the feed brine was below 100 mS/cm. However, from this point on, the system did not operate properly due to pumping and scaling problems. Future work will focus on higher capacity heat recovery systems and compressors, together with enhancing the performance and competitiveness of such MVC technology. For its development, an initial stage with a robust system modeling approach is currently being developed by the authors.

Author Contributions

Conceptualization, F.V.-G. and P.H.-B.; methodology, A.M.-G., F.V.-G. and P.C.-C.; validation, P.H.-B. and F.V.-G.; formal analysis, P.H.-B.; resources, A.M.-G.; data curation, P.H.-B.; writing—original draft preparation, P.H.-B. and P.C.-C.; writing—review and editing, F.V.-G., P.C.-C. and P.H.-B. All authors have read and agreed to the published version of the manuscript.

Funding

Paula Hernández-Baño received a grant 22733/FPI/24 from the Seneca Foundation, which is co-funded by REGENERA LEVANTE S.L. Región of Murcia (Spain).

Institutional Review Board Statement

Not applicable.

Informed Consent Statement

Not applicable.

Data Availability Statement

The data presented in this study are available on request from the corresponding author.

Conflicts of Interest

The authors declare no conflicts of interest.

Abbreviations

The following abbreviations are used in this manuscript:
CR  Compression ratio
HDH  Humidification–dehumidification
HNO3Nitric acid
H-SEnthalpy–entropy
MDMembrane distillation
MEEMulti-effect evaporation
MEDMulti-effect distillation
MSFMulti-stage flash evaporation
MVCMechanical vapor compression
PPressure
RESRenewable energy sources
ROReverse osmosis
TTemperature
TVCThermal vapor compression
ZLDZero Liquid Discharge

References

  1. The Global Desalination and Water Reuse Community (IDRA). The Global Desalination and Water Reuse Community. 2024. Available online: https://idrawater.org/ (accessed on 1 September 2025).
  2. Prado de Nicolás, A.; Molina-Garcia, A.; García-Bermejo, J.T.; Vera-García, F. Desalination, minimal and zero liquid discharge powered by renewable energy sources: Current status and future perspectives. Renew. Sustain. Energy Rev. 2023, 187, 113733. [Google Scholar] [CrossRef]
  3. International Desalination Association (IDA). Desalination at a Glance; IDA: Alexandria, VA, USA, 2011. [Google Scholar]
  4. Panagopoulos, A.; Haralambous, K.J.; Loizidou, M. Desalination brine disposal methods and treatment technologies—A review. Sci. Total Environ. 2019, 693, 133545. [Google Scholar] [CrossRef] [PubMed]
  5. United Nations. The 17 Goals. 2015. Available online: https://sdgs.un.org/goals (accessed on 2 September 2025).
  6. Cui, Y.; Jiang, J.; Fu, T.; Liu, S. Feasibility of using Waste Brine/Seawater and Sea Sand for the Production of Concrete: An Experimental Investigation from Mechanical Properties and Durability Perspectives. Sustainability 2022, 14, 13340. [Google Scholar] [CrossRef]
  7. Panagopoulos, A.; Giannika, V. Decarbonized and circular brine management/valorization for water & valuable resource recovery via minimal/zero liquid discharge (MLD/ZLD) strategies. J. Environ. Manag. 2022, 324, 116239. [Google Scholar] [CrossRef]
  8. Reig, M.; Casas, S.; Gibert, O.; Valderrama, C.; Cortina, J. Integration of nanofiltration and bipolar electrodialysis for valorization of seawater desalination brines: Production of drinking and waste water treatment chemicals. Desalination 2016, 382, 13–20. [Google Scholar] [CrossRef]
  9. Sanchis-Carbonell, J.; Carrero-Ferrer, I.; Sáez-Fernández, A.; Pedro-Monzonís, M.; Campíns-Falcó, P.; Montiel, V. Towards a zero liquid discharge process from brine treatment: Water recovery, nitrate electrochemical elimination and potential valorization of hydrogen and salts. Sci. Total Environ. 2024, 926, 172060. [Google Scholar] [CrossRef]
  10. del Villar, A.; Melgarejo, J.; García-López, M.; Fernández-Aracil, P.; Montano, B. The economic value of the extracted elements from brine concentrates of Spanish desalination plants. Desalination 2023, 560, 116678. [Google Scholar] [CrossRef]
  11. Panagopoulos, A. Techno-economic assessment of zero liquid discharge (ZLD) systems for sustainable treatment, minimization and valorization of seawater brine. J. Environ. Manag. 2022, 306, 114488. [Google Scholar] [CrossRef]
  12. Tong, T.; Xu, L.; Horseman, T.; Westerhoff, P.; Xu, P.; Yao, Y.; Zhang, X.; Alghanayem, R.; Lin, S. Brine management with zero and minimal liquid discharge. Nat. Rev. Clean Technol. 2025, 1, 185–200. [Google Scholar] [CrossRef]
  13. De Nicolas, A.P.; Molina-Garcia, A.; Vera-Garcia, F.; Garcia-Bermejo, J.T. Sustainable Zero Liquid Discharge for Desalination and Denitrification Processes: Desirows Life European Project. In Proceedings of the 2022 IEEE International Conference on Environment and Electrical Engineering and 2022 IEEE Industrial and Commercial Power Systems Europe (EEEIC/I&CPS Europe), Prague, Czech Republic, 28 June–1 July 2022; IEEE: Piscataway, NJ, USA, 2022; pp. 1–5. [Google Scholar] [CrossRef]
  14. Calleja-Cayon, P.; Molina-Garcia, A.; Vera-Garcia, F. Mechanical vapor compression and renewable energy source integration into desalination process LIFE-Desirows case example. Therm. Sci. 2024, 28, 4395–4405. [Google Scholar] [CrossRef]
  15. Shamet, O.; Antar, M. Mechanical vapor compression desalination technology—A review. Renew. Sustain. Energy Rev. 2023, 187, 113757. [Google Scholar] [CrossRef]
  16. Li, Y.; Wu, H.; Liang, X.; Rong, C.; Chen, H. Experimental study of waste concentration by mechanical vapor compression technology. Desalination 2015, 361, 46–52. [Google Scholar] [CrossRef]
  17. Yang, J.; Zhang, C.; Zhang, Z.; Yang, L.; Lin, W. Study on mechanical vapor recompression system with wet compression single screw compressor. Appl. Therm. Eng. 2016, 103, 205–211. [Google Scholar] [CrossRef]
  18. Zhang, H.; Zhang, Z.; Tong, L.; Yang, J.; Wang, L.; Li, X.; Zhang, Y.; Xu, P.; Yu, Z.; Zhang, J. Experimental research and model optimization of a novel mechanical vapor compression evaporation system driven by Roots steam compressor. Int. J. Refrig. 2023, 150, 185–199. [Google Scholar] [CrossRef]
  19. Jamil, M.A.; Zubair, S.M. Design and analysis of a forward feed multi-effect mechanical vapor compression desalination system: An exergo-economic approach. Energy 2017, 140, 1107–1120. [Google Scholar] [CrossRef]
  20. Han, D.; He, W.; Yue, C.; Pu, W. Study on desalination of zero-emission system based on mechanical vapor compression. Appl. Energy 2017, 185, 1490–1496. [Google Scholar] [CrossRef]
  21. Dahmardeh, H.; Akhlaghi Amiri, H.; Nowee, S. Evaluation of mechanical vapor recompression crystallization process for treatment of high salinity wastewater. Chem. Eng. Process. Process Intensif. 2019, 145, 107682. [Google Scholar] [CrossRef]
  22. Jamil, M.A.; Zubair, S.M. On thermoeconomic analysis of a single-effect mechanical vapor compression desalination system. Desalination 2017, 420, 292–307. [Google Scholar] [CrossRef]
  23. Zhang, X.; Zhang, X.; Liao, R.; Shi, B.; Wu, L.; Liu, K. Experimental study on energy consumption of mechanical vapor recompression evaporation method for recovery of water from oily wastewater. Desalin. Water Treat. 2020, 179, 98–105. [Google Scholar] [CrossRef]
  24. Farahat, M.A.; Fath, H.E.; El-Sharkawy, I.I.; Ookawara, S.; Ahmed, M. Energy/exergy analysis of solar driven mechanical vapor compression desalination system with nano-filtration pretreatment. Desalination 2021, 509, 115078. [Google Scholar] [CrossRef]
  25. Shen, J.; Xing, Z.; Zhang, K.; He, Z.; Wang, X. Development of a water-injected twin-screw compressor for mechanical vapor compression desalination systems. Appl. Therm. Eng. 2016, 95, 125–135. [Google Scholar] [CrossRef]
  26. Jamil, M.A.; Zubair, S.M. Effect of feed flow arrangement and number of evaporators on the performance of multi-effect mechanical vapor compression desalination systems. Desalination 2018, 429, 76–87. [Google Scholar] [CrossRef]
  27. Ghazi, M.; Faqir, M.; Mada, M.; Essadiqi, E. Thermal analysis and optimization of mechanical vapour compression desalination process driven by renewable energy using genetic algorithm. Desalin. Water Treat. 2018, 135, 25–46. [Google Scholar] [CrossRef]
  28. Elsayed, M.L.; Mesalhy, O.; Mohammed, R.H.; Chow, L.C. Transient and thermo-economic analysis of MED-MVC desalination system. Energy 2019, 167, 283–296. [Google Scholar] [CrossRef]
  29. Elsayed, M.L.; Mesalhy, O.; Mohammed, R.H.; Chow, L.C. Performance modeling of MED-MVC systems: Exergy-economic analysis. Energy 2019, 166, 552–568. [Google Scholar] [CrossRef]
  30. Liu, C.; Bi, M.; Cui, G. Parameter optimization and economic analysis of a single-effect mechanical vapor compression (MVC) distillation system. Desalin. Water Treat. 2020, 201, 75–85. [Google Scholar] [CrossRef]
  31. Randon, A.; Rech, S.; Lazzaretto, A. Brine Management: Techno-economic Analysis of a Mechanical Vapor Compression Energy System for a Near-Zero Liquid Discharge Application. Int. J. Thermodyn. 2020, 23, 128–137. [Google Scholar] [CrossRef]
  32. Zhang, H.; Zhang, Z.; Tong, L.; Yang, J.; Wang, L.; Song, Y.; Yu, Z.; Zhang, Y.; Zhang, J. A mechanical vapor compression regeneration system of potassium formate solution: Model development, experimental verification and performance prediction. Desalination 2022, 539, 115940. [Google Scholar] [CrossRef]
  33. Zhang, H.; Tong, L.; Zhang, Z.; Song, Y.; Yang, J.; Yue, Y.; Wu, Z.; Wang, Y.; Yu, Z.; Zhang, J. A integrated mechanical vapor compression enrichment system of radioactive wastewater: Experimental study, model optimization and performance prediction. Energy 2023, 282, 128868. [Google Scholar] [CrossRef]
  34. Liu, C.; Xu, L.; Wang, Y. Comparative performance evaluation of two compression ways of a singleeffect mechanical vapor compression desalination system. Desalin. Water Treat. 2023, 316, 136–150. [Google Scholar] [CrossRef]
  35. Rostami, S.; Ghiasirad, H.; Rostamzadeh, H.; Kalan, A.S.; Maleki, A. A wind turbine driven hybrid HDH-MED-MVC desalination system towards minimal liquid discharge. S. Afr. J. Chem. Eng. 2023, 44, 356–369. [Google Scholar] [CrossRef]
  36. Yang, H.; Yang, C.; Geng, L. A heat pump-driven mechanical vapor compression desalination system and its operating characteristics. Water Resour. Ind. 2024, 32, 100264. [Google Scholar] [CrossRef]
  37. Gebel, J. Thermal Desalination Processes. In Desalination; Kucera, J., Ed.; Wiley: Hoboken, NJ, USA, 2014; pp. 39–154. [Google Scholar] [CrossRef]
  38. KAESER KOMPRESSOREN SE. Assembly and Service Manual for Blower Unit; Technical Report; KAESER KOMPRESSOREN SE: Coburg, Germany; Available online: https://au.kaeser.com/download.ashx?id=tcm:166-5944 (accessed on 1 September 2025).
  39. Lara, J.R.; Noyes, G.; Holtzapple, M.T. An investigation of high operating temperatures in mechanical vapor-compression desalination. Desalination 2008, 227, 217–232. [Google Scholar] [CrossRef]
  40. Zhou, Y.; Shi, C.; Dong, G. Analysis of a mechanical vapor recompression wastewater distillation system. Desalination 2014, 353, 91–97. [Google Scholar] [CrossRef]
  41. Aly, N.H.; El-Figi, A.K. Mechanical vapor compression desalination systems—A case study. Desalination 2003, 158, 143–150. [Google Scholar] [CrossRef]
  42. Nafey, A.; Fath, H.; Mabrouk, A. Thermoeconomic design of a multi-effect evaporation mechanical vapor compression (MEE–MVC) desalination process. Desalination 2008, 230, 1–15. [Google Scholar] [CrossRef]
  43. Hernández-Baño, P.; Molina-García, A.; Vera-García, F. Data-Monitoring Solution for Desalination Processes: Cooling Tower and Mechanical Vapor Compression Hybrid System. Sensors 2024, 24, 2909. [Google Scholar] [CrossRef] [PubMed]
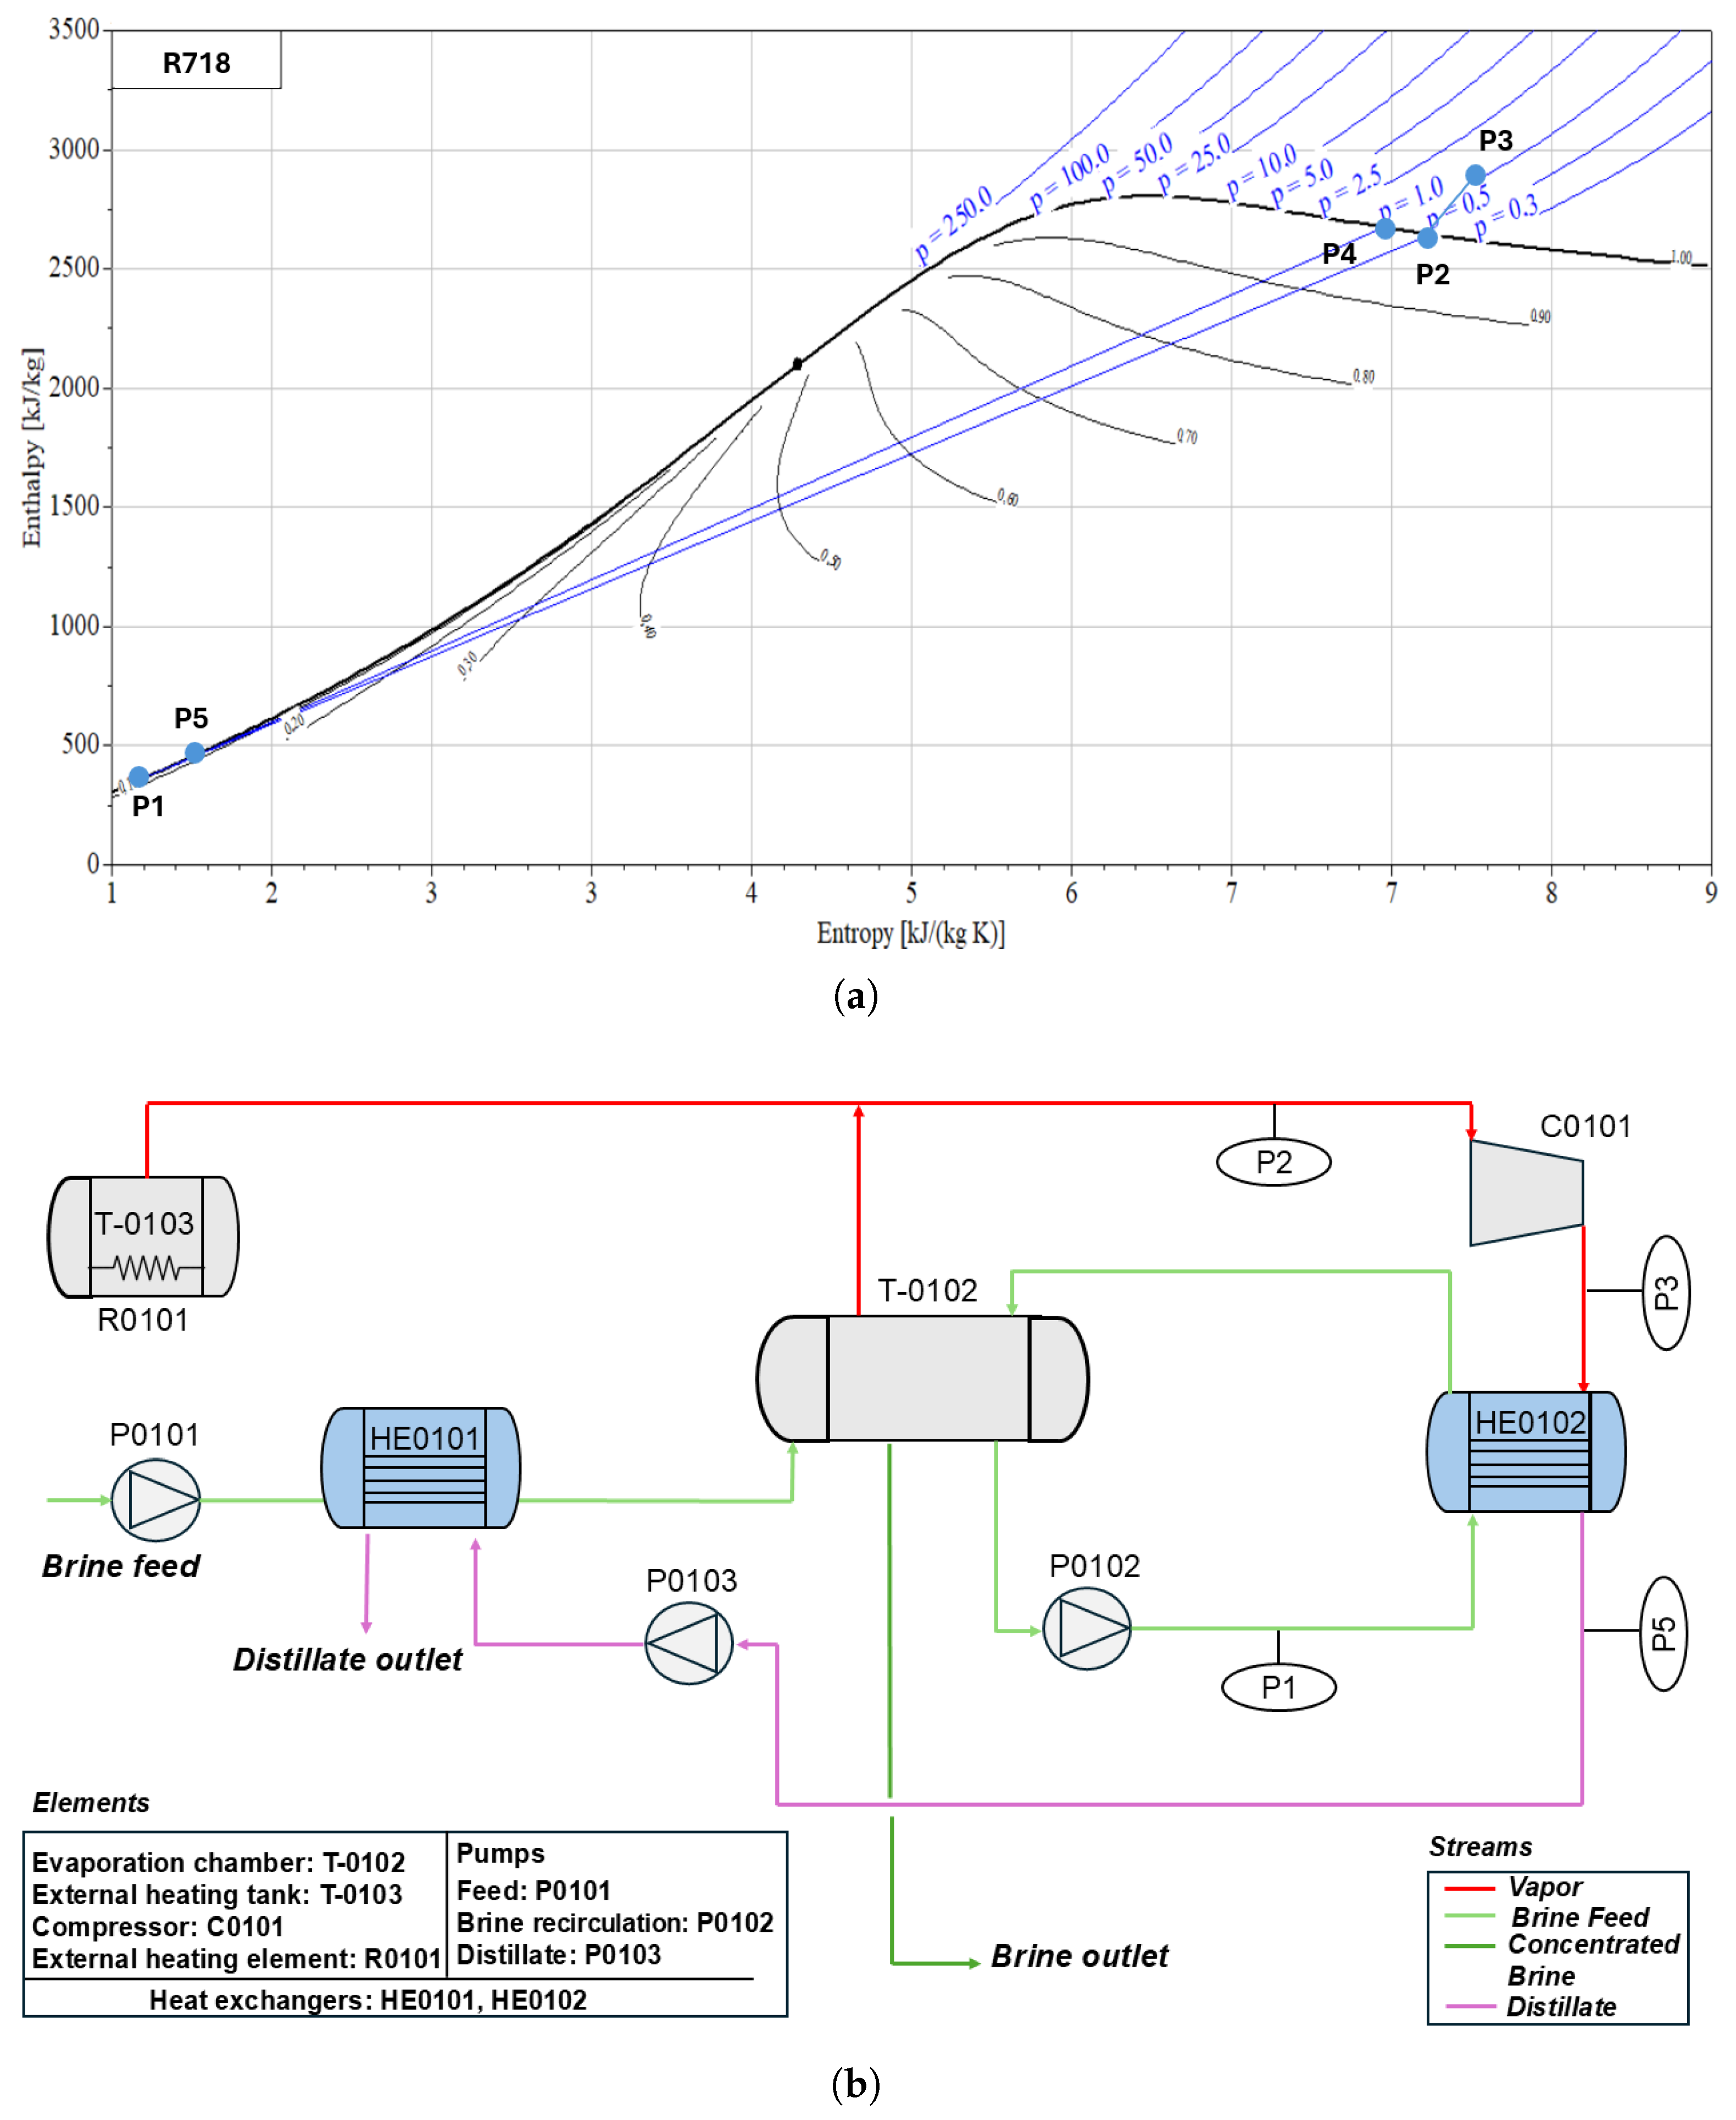
Figure 1. (a) H-s diagram of the mechanical vapor compression: Identification of interest streams. (b) Process diagram and streams.
Sustainability 17 09212 g001
Figure 2. Proposed methodology.
Sustainability 17 09212 g002
Figure 3. Experimental MVC system and main components.
Sustainability 17 09212 g003
Figure 4. Scenario overview and progression.
Sustainability 17 09212 g004
Figure 5. Measured temperatures of the scenarios.
Sustainability 17 09212 g005
Figure 6. Duty cycle of the electric resistance and compressor inlet temperature.
Sustainability 17 09212 g006
Figure 7. Vapor pressure at compressor inlet.
Sustainability 17 09212 g007
Figure 8. Vapor pressure at compressor outlet. (a) Scenarios 1 and 2. (b) Scenarios 3 and 4.
Sustainability 17 09212 g008
Figure 9. Evolution of the daily conductivity and distillate flow. Average of the day. (a) Scenario 1. (b) Scenario 2.
Sustainability 17 09212 g009
Figure 10. Salt and organic matter precipitation in MVC heat exchanger.
Sustainability 17 09212 g010
Table 2. Operating condition ranges.
VariableRange
Inlet temperature80–90 °C
Outlet temperature100–130 °C
Inlet pressure>0.5 bar
Outlet pressure1.05–1.09 bar
Table 3. Composition of the precipitated salts.
ComponentConcentration Level
Calcite, Mg-bearing (CaCO3-Mg)54%
Aragonite (CaCO3)22%
Halite (NaCl)14%
Gypsum (CaSO4 · 2H2O)10%
Table 4. Elements of the mechanical vapor compression system.
ElementSpecificationsAction
Compressor (C0101)KAESER OMEGA 21B model. Rotatory lobe type compressor-
Evaporation chamber (T-0102)European Directive 2014/68/EU. Capacity: 88 L-
External steam generation tank (T-0103)European Directive 2014/68/EU. Capacity: 57 L-
External heating element (R0101)TOPE company. Power: 13.5 kWBoiling temperature control
Recirculation pump (P0102)S. ROBUSCHI company. Centrifugal pump. Maximum flow rate: 16,000 L/h-
Cooling pump (P0104)GAMMA/X. Prominent company. Solenoid-driven diaphragm metering pumpCompressed vapor temperature
Venting systemBURKERT company. Angle Seat Valve
Vapor recirculation (FCV0101)BURKERT company. Straight-seated control valveCompressed vapor pressure
Heat Exchanger (HE0102)Shell and tube. Two-pass tube side. One-pass shell side. AISI 316L-
Pre-Heat Exchanger (HE0101)Double tube. AISI 316 L-
Temperature sensorTD2251—IFMTemperatures: Evaporation, outlet and heating tank temperature
Pressure sensorPX3524 and PI2795—IFMInlet and Outlet Pressure
Table 5. Outputvariables for the scenarios.
ScenarioFeed Flow
(L/h)
Distillate Flow
(L/h)
Consumption
(kWh/m3 Feed)
Inlet Temperature
(°C)
CR
Scenario 1854016587–881.62
Scenario 2602821476–832.10
Scenario 3603220081–841.98
Scenario 4703517082–841.99
Disclaimer/Publisher’s Note: The statements, opinions and data contained in all publications are solely those of the individual author(s) and contributor(s) and not of MDPI and/or the editor(s). MDPI and/or the editor(s) disclaim responsibility for any injury to people or property resulting from any ideas, methods, instructions or products referred to in the content.