Article

Enhancing Sustainable Fisheries Trade and Food Security Through CPEC in Pakistan

College of Fisheries, Ocean University of China, Qingdao 266003, China
*
Author to whom correspondence should be addressed.
Sustainability 2025, 17(20), 9121; https://doi.org/10.3390/su17209121
Submission received: 17 July 2025 / Revised: 21 September 2025 / Accepted: 23 September 2025 / Published: 15 October 2025

Abstract

Pakistan’s fisheries sector is vital for livelihoods, exports, and food security, yet growth has been constrained by weak infrastructure, limited compliance with sanitary standards, and underinvestment. The China–Pakistan Economic Corridor (CPEC) has been promoted as a driver of trade facilitation, but its actual effect on fisheries exports remains unclear. This study analyzes export performance to five leading Asian markets—China, Thailand, Vietnam, Saudi Arabia, and Japan—over 2005–2024 using Interrupted Time Series (ITS) and Difference-in-Differences (DiD) models. Results show that overall fisheries exports averaged 1.25 million metric tons (USD 728.7 million) annually, with Asia absorbing 59% of trade. ITS results show that after 2015, there are considerable structural discontinuities in export paths, mainly for China (coefficient = −1.42, p < 0.001) and Thailand (0.95, p = 0.071). DiD analysis confirmed that CPEC had a statistically significant positive impact: the treatment × post-2015 effect was 0.55 (p = 0.050), showing that exports to China and Thailand grew disproportionately compared with control markets (Malaysia, Indonesia). Importantly, value growth outpaced volume growth, suggesting early evidence of value-chain upgrading. By contrast, Vietnam and Saudi Arabia showed contraction, and Japan remained stable with weak significance (−1.16, p = 0.088). These results provide the first causal evidence that CPEC’s operational phase altered Pakistan’s fisheries export dynamics, though benefits remain uneven. The conclusions indicate the necessity to invest specifically in cold chains, certification, and aquaculture to generate corridor-led benefits in sustainable trade, food security, and long-term sectoral resiliency.

1. Introduction

Pakistan’s fisheries sector is a cornerstone of coastal livelihoods, inland food systems, and national exports, yet its share in the economy has gradually declined over the past two decades due to structural bottlenecks and weak policy support. At the same time, changing patterns in global seafood trade have created new opportunities for exporting countries, where competitiveness increasingly depends on infrastructure, logistics, and compliance with international standards. Within this context, the China–Pakistan Economic Corridor (CPEC), a flagship initiative of China’s Belt and Road Initiative (BRI), is frequently cited as a potential driver of improved trade facilitation and market access for Pakistan. What remains less clear is the extent to which CPEC-driven improvements in ports, transport networks, and connectivity have translated into measurable gains for fisheries exports, and how such shifts may also contribute to domestic food security.
The sector provides both direct and indirect livelihoods. Around 0.41 million people are directly employed—0.21 million full-time, 0.13 million part-time, and 0.07 million seasonal workers—while nearly 0.6 million others rely on supporting activities across the value chain [1,2]. These networks extend inland, linking small-scale fishers with processors, traders, and distributors [3,4]. Pakistan’s aquatic resources are substantial, including a continental shelf of 50,270 km2, an Exclusive Economic Zone of 224,899 km2, and a 1150-mile coastline [5,6], alongside diverse inland resources covering rivers, canals, lakes, reservoirs, and fish farms [7,8].
Production statistics reflect both steady growth and diversification. In 2018, Pakistan harvested about 0.777 million metric tons (MMT) of fish, of which 80% came from capture fisheries (62% marine and 38% inland) and 20% from aquaculture [9,10]. This marks a major shift from 1960, when national output stood at only 77,113 metric tons, almost entirely from capture fisheries. By 2018, aquaculture contributed nearly one-quarter of production, supported by better farming practices and wider adoption of farmed species. Marine capture alone yielded 0.347 MMT, including demersal species such as catfish (0.023 MMT), croakers (0.020 MMT), and ribbonfish (0.0196 MMT); small pelagic species like Indian mackerel (0.0296 MMT) and sardines (0.0269 MMT); large pelagic species such as tuna (0.0497 MMT) and Spanish mackerel (0.011 MMT); and shellfish and molluscs, which contributed 0.0227 MMT and 0.0121 MMT, respectively [11,12]. Figure 1 illustrates how total production has grown from 530,615 metric tons in 2005 to an estimated 791,000 metric tons in 2024.
Export performance has largely followed this production trend. The value of fisheries’ exports rose from USD 146.7 million in 2005 to USD 465.4 million in 2024, although year-to-year volatility reflected global market conditions, biosecurity risks, and compliance challenges [3,12]. Between 2005 and 2010, exports grew from USD 146.7 million to USD 231.0 million, reaching USD 328.7 million by 2015. Following the launch of CPEC in 2015, expectations for accelerated export growth were high. By 2024, exports had risen to USD 465.4 million—a 41.5% increase over nine years. However, this growth appears incremental rather than transformative, pointing to persistent barriers such as non-tariff restrictions, limited sanitary and phytosanitary (SPS) compliance, and weak cold-chain infrastructure [12,13].
Asian markets dominate Pakistan’s seafood exports. China, Thailand, and Vietnam have become the largest importers. Chinese purchases grew from 31,955 metric tons (USD 34.9 million) in 2005 to over 62,000 metric tons (USD 137.7 million) by 2018. Thailand’s imports rose from 13,545 metric tons (USD 11.7 million) to 74,144 metric tons (USD 161.6 million) between 2005 and 2019, while Vietnam expanded from just 159 metric tons (USD 0.365 million) to 20,433 metric tons (USD 42.4 million) during the same period. Saudi Arabia and Japan have remained relatively smaller markets, with Saudi imports declining due to disease-related restrictions and compliance issues, and Japan consistently importing about 2500 tons annually [12,14,15].
Despite these regional gains, Pakistan’s penetration into high-value Western markets has been limited. The European Union banned Pakistani seafood in 2007 over food safety concerns, and although some progress has been made, full reinstatement has not yet occurred [16,17]. As a result, exports remain concentrated in bulk, low-value items such as frozen and dried fish, with little presence in processed or ready-to-eat categories. This contrasts sharply with regional competitors such as China (USD 12.4 billion), Japan (USD 11.7 billion), Vietnam (USD 6.2 billion), South Korea (USD 4.3 billion), and Thailand (USD 3.2 billion), whose seafood exports far surpass Pakistan’s USD 465.4 million in 2024 [18,19,20,21,22,23].
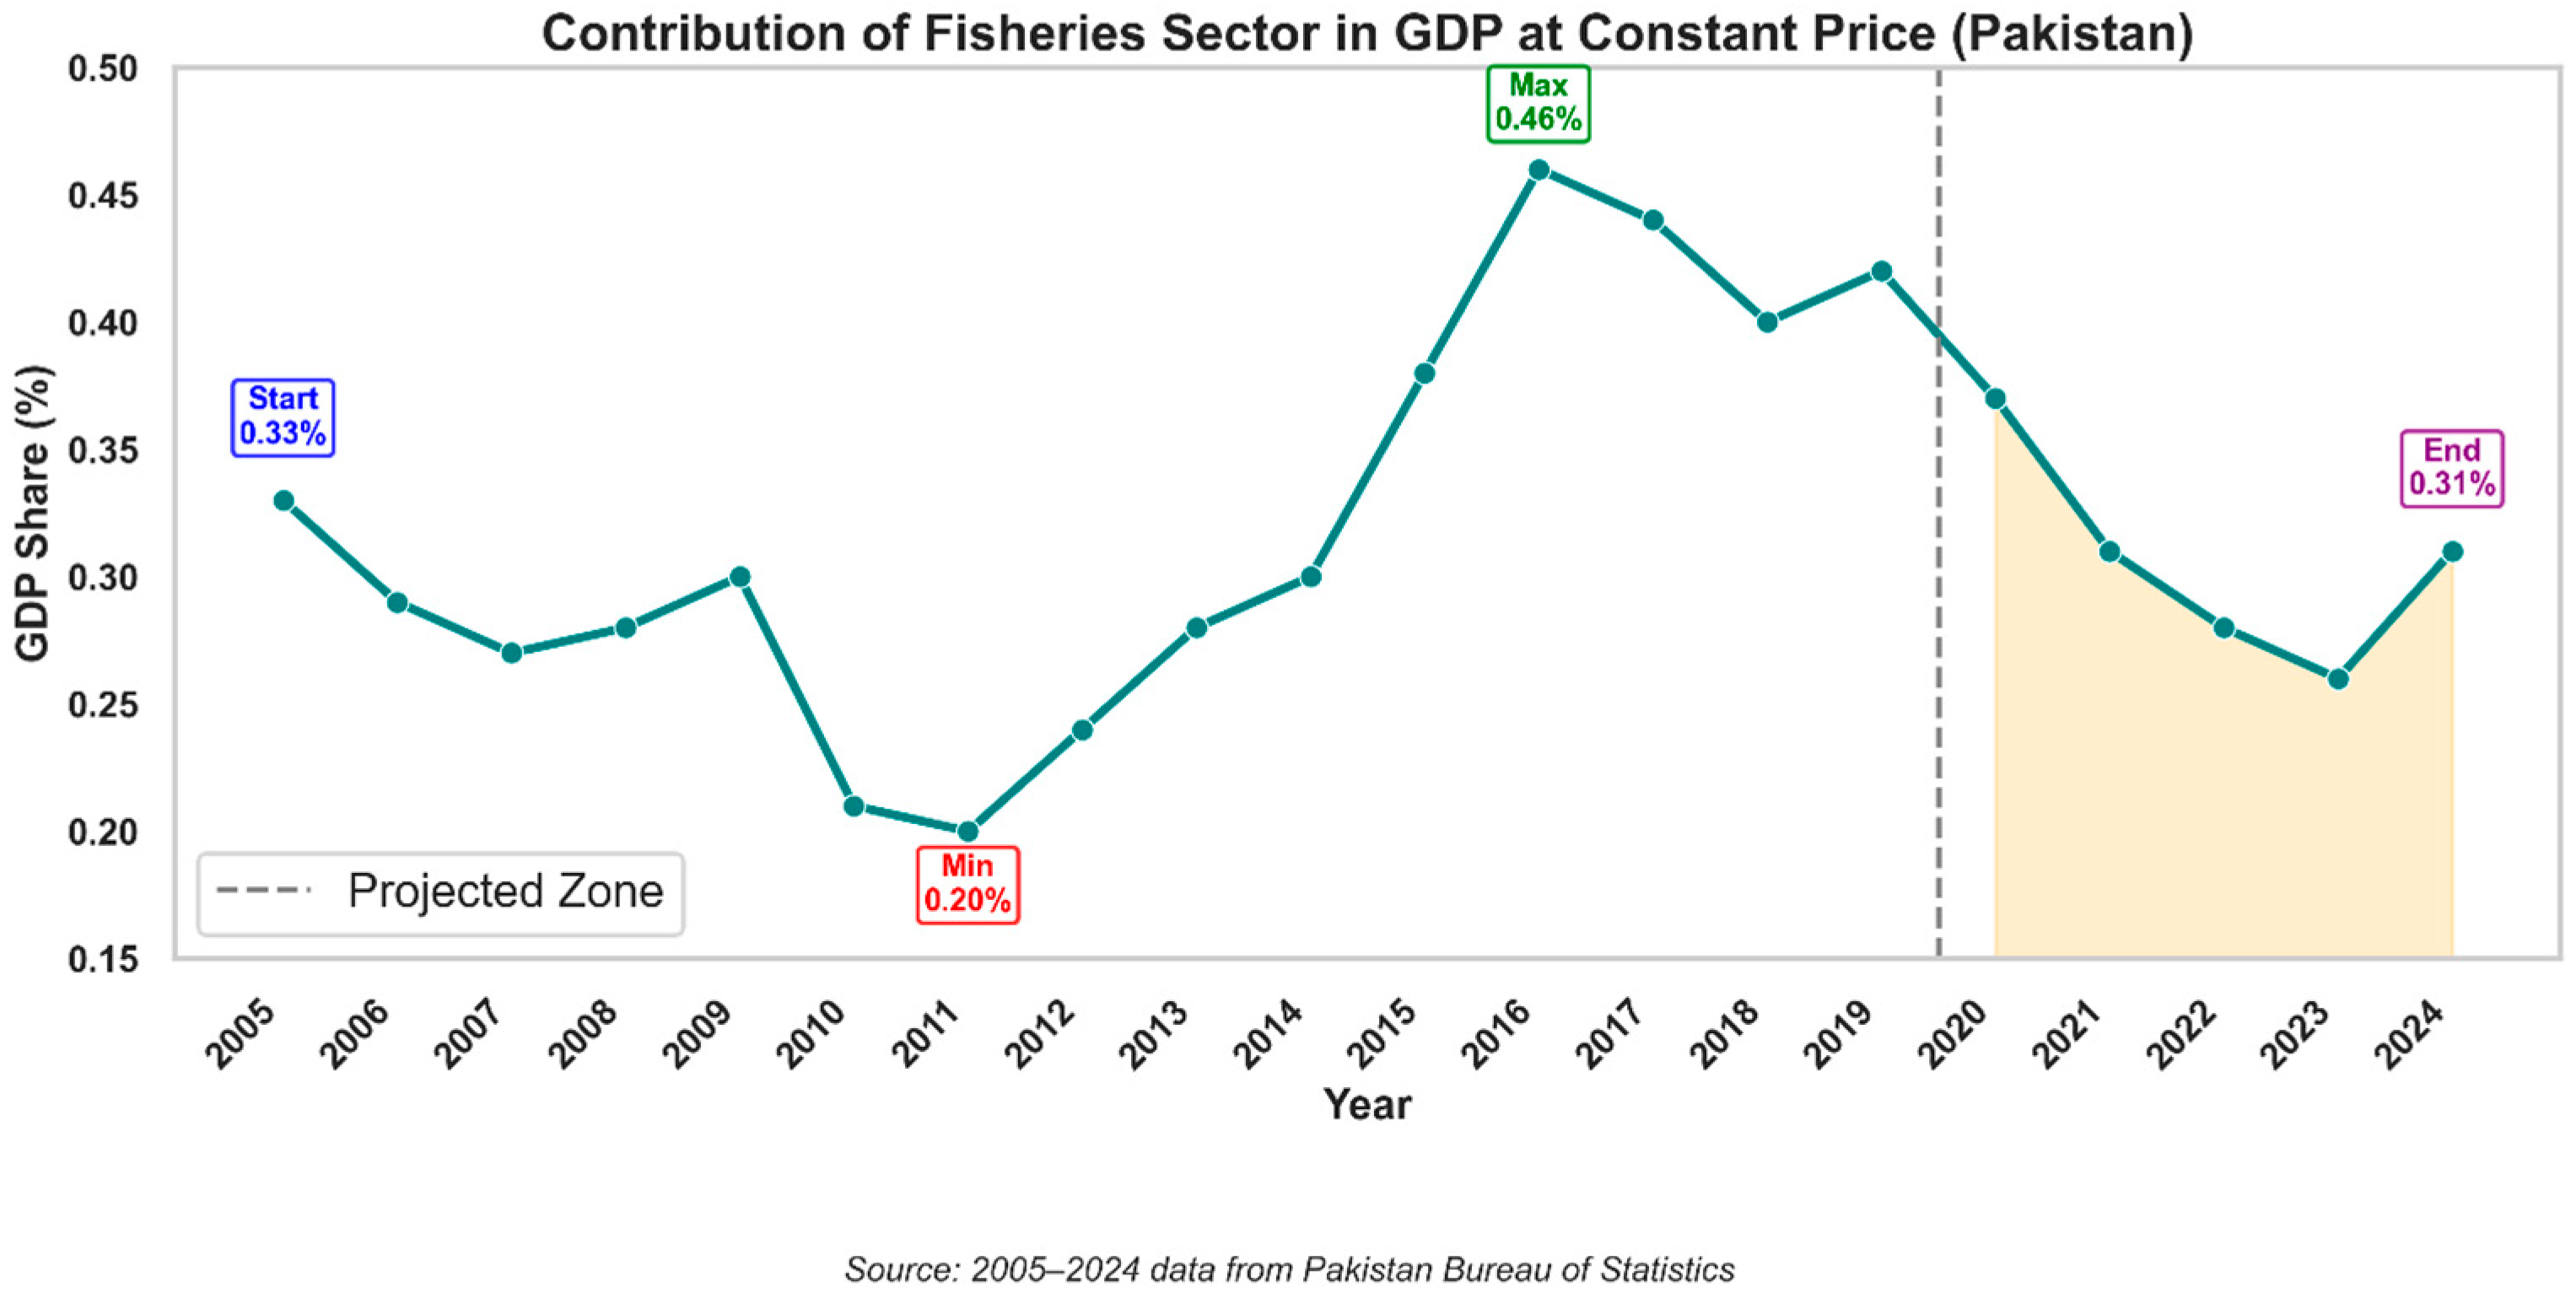
Pakistan has been undergoing a varied yet deteriorating proportion of national GDP at constant prices in the fisheries sector in the last 20 years. Its contribution declined to 0.31% in 2024, down from 0.68% in 2000 and 0.33% in 2005, as shown in Figure 2, with especially large troughs of 0.20% in 2011 and 0.46% in 2016. This negative trend is not the case to dismiss the economic and social relevance of the sector, as it sustains livelihoods, promotes food security, and generates foreign exchange resources. During FY 2024–25, fisheries contributed about 0.31% of the total GDP and 1.31% of agricultural GDP, with a growth rate of 1.42% recorded [24]. These statistics indicate that there are new developments in resources management and investment, although the full economic potential of the sector has not been realized. At the same time, shifting patterns in global seafood trade increasingly reward exporters that can deliver reliable supply chains, quality assurance, and value-added products [25,26,27].
Against this backdrop, Pakistan’s long-standing partnership with China provides a strategic opportunity. Since its launch in 2013, CPEC has expanded port capacity, improved road and rail infrastructure, and enhanced energy supply [28,29]. Whether these changes have translated into tangible benefits for fisheries exports, however, remains an open empirical question. This study addresses that gap by examining export patterns to Asia’s five leading destinations—China, Thailand, Vietnam, Saudi Arabia, and Japan—between 2005 and 2024. The objectives are threefold: (i) to quantify long-term export trends, (ii) to assess the impact of CPEC on fisheries exports using econometric techniques, i.e., ITS and DiD model, and (iii) to identify policy shortcomings that constrain Pakistan’s competitiveness in Asian and global seafood markets.

2. Materials and Methods

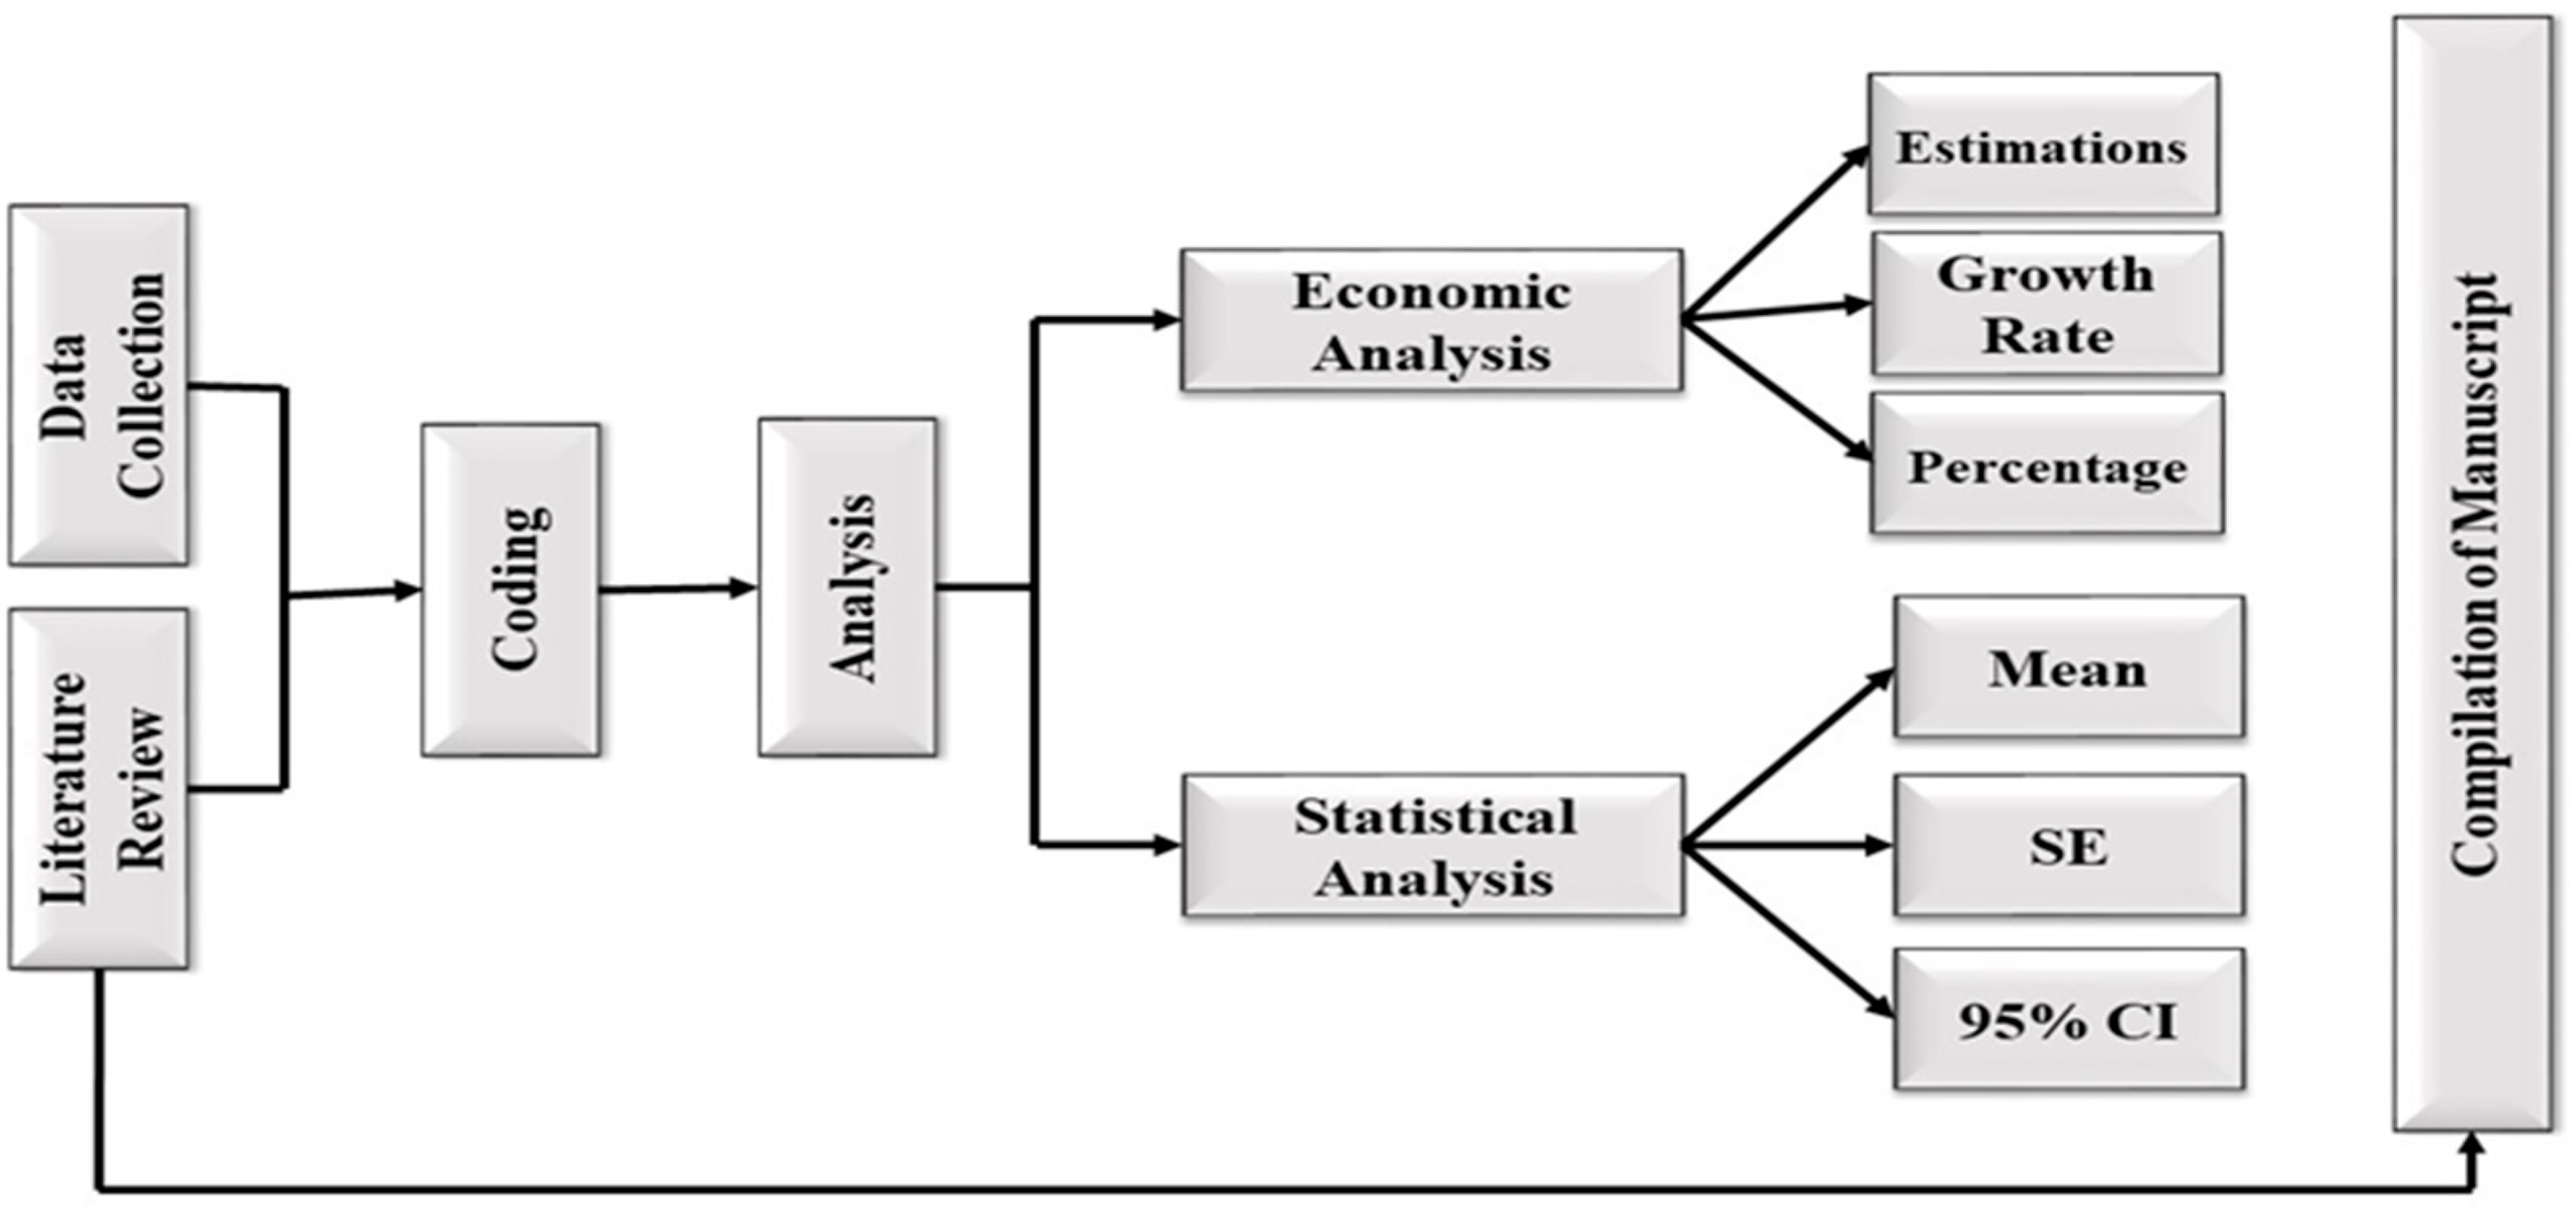
This study analyzed the growth, performance, and variability of Pakistan’s fisheries exports to its top five Asian importing countries (China, Thailand, Vietnam, Saudi Arabia, and Japan) during 2005–2024. Together, these destinations account for the majority of Pakistan’s regional seafood trade. The 20-year period was divided into four phases (2005–2009, 2010–2014, 2015–2019, and (2020–2024) to compare export dynamics before and after the operationalization of the China–Pakistan Economic Corridor (CPEC) in 2015, which was expected to influence trade flows through improved logistics, cold chain capacity, and port connectivity (Figure 3).

2.1. Data Collection

Data on fisheries production were obtained from the Handbooks of Fisheries Statistics of Pakistan published by the Marine Fisheries Department (MFD) and cross-validated with Food and Agriculture Organization (FAO) sources. Trade data on annual export volumes (metric tons) and values (USD) were retrieved from the International Trade Centre (ITC) Trade Map and disaggregated by destination country. These datasets were harmonized across years, with supplementary background data used to contextualize production and trade dynamics.

2.2. Hypothesis

Two hypothesis guided the analysis:
H1: 
CPEC significantly boosted Pakistan’s fisheries exports after 2015.
H2: 
The impact is greater in China and Thailand than in other markets.

2.3. Analytical Framework

The analysis combined descriptive indicators, Interrupted Time Series (ITS), and Difference-in-Differences (DiD) models (detailed specifications are provided in Appendix A).
  • Descriptive statistics (growth rates, percentages, and variability measures) were computed using Microsoft Excel and Python 3.13.5 to provide baseline trends.
  • Interrupted Time Series (ITS) models were applied to detect structural breaks in export trajectories around 2015. The specification included time trends, a post-2015 intervention dummy, and their interaction to test for changes in level and slope.
  • Difference-in-Difference (DiD) models compared exports to treatment countries (China and Thailand, which are directly connected through CPEC routes) with control countries (e.g., Malaysia and Indonesia, which trade with Pakistan but are not directly affected by CPEC). The interaction term captured the differential post-2015 effect attributable to CPEC. Robust standard errors were used to address heteroscedasticity.

2.4. Analytical Rationale

This mixed framework ensured both descriptive and causal insights. Descriptive summaries highlighted broad trade patterns, ITS identified structural changes in trajectories, and DiD provided a counterfactual benchmark to distinguish CPEC-related effects from global seafood market dynamics.

2.5. Data Limitations and Assumptions

The analysis relied on official secondary data (MFD, FAO, ITC), which may contain reporting gaps, classification inconsistencies, or underestimation of informal exports. Missing values were rare and handled cautiously through interpolation. Export values were log-transformed in regressions to stabilize variance and ease interpretation in percentage terms. Country-level trade data, while useful for aggregate patterns, do not capture product-level heterogeneity (e.g., shrimp vs. tuna) or compliance-related shipment rejections. Finally, ITS assumes pre-2015 trends would have continued absent CPEC, and DiD assumes parallel trends between treatment and control groups; while reasonable, these assumptions may not hold perfectly in practice. Results should therefore be viewed as indicative rather than definitive, with future product- and firm-level studies needed for deeper insights.

3. Results

3.1. Statistical Analysis of Fish Export to Top Five Asian Countries from 2005 to 2024

3.1.1. Descriptive Trends

From 2005 to 2024, China consistently emerged as the leading importer of Pakistani fish and fisheries products (Table 1). The mean annual export volume to China was 87,239.65 metric tons (MT), with a standard error (SE) of 13,478.63 and a 95% confidence interval (CI) ranging from 59,028.55 to 115,450.75 MT.
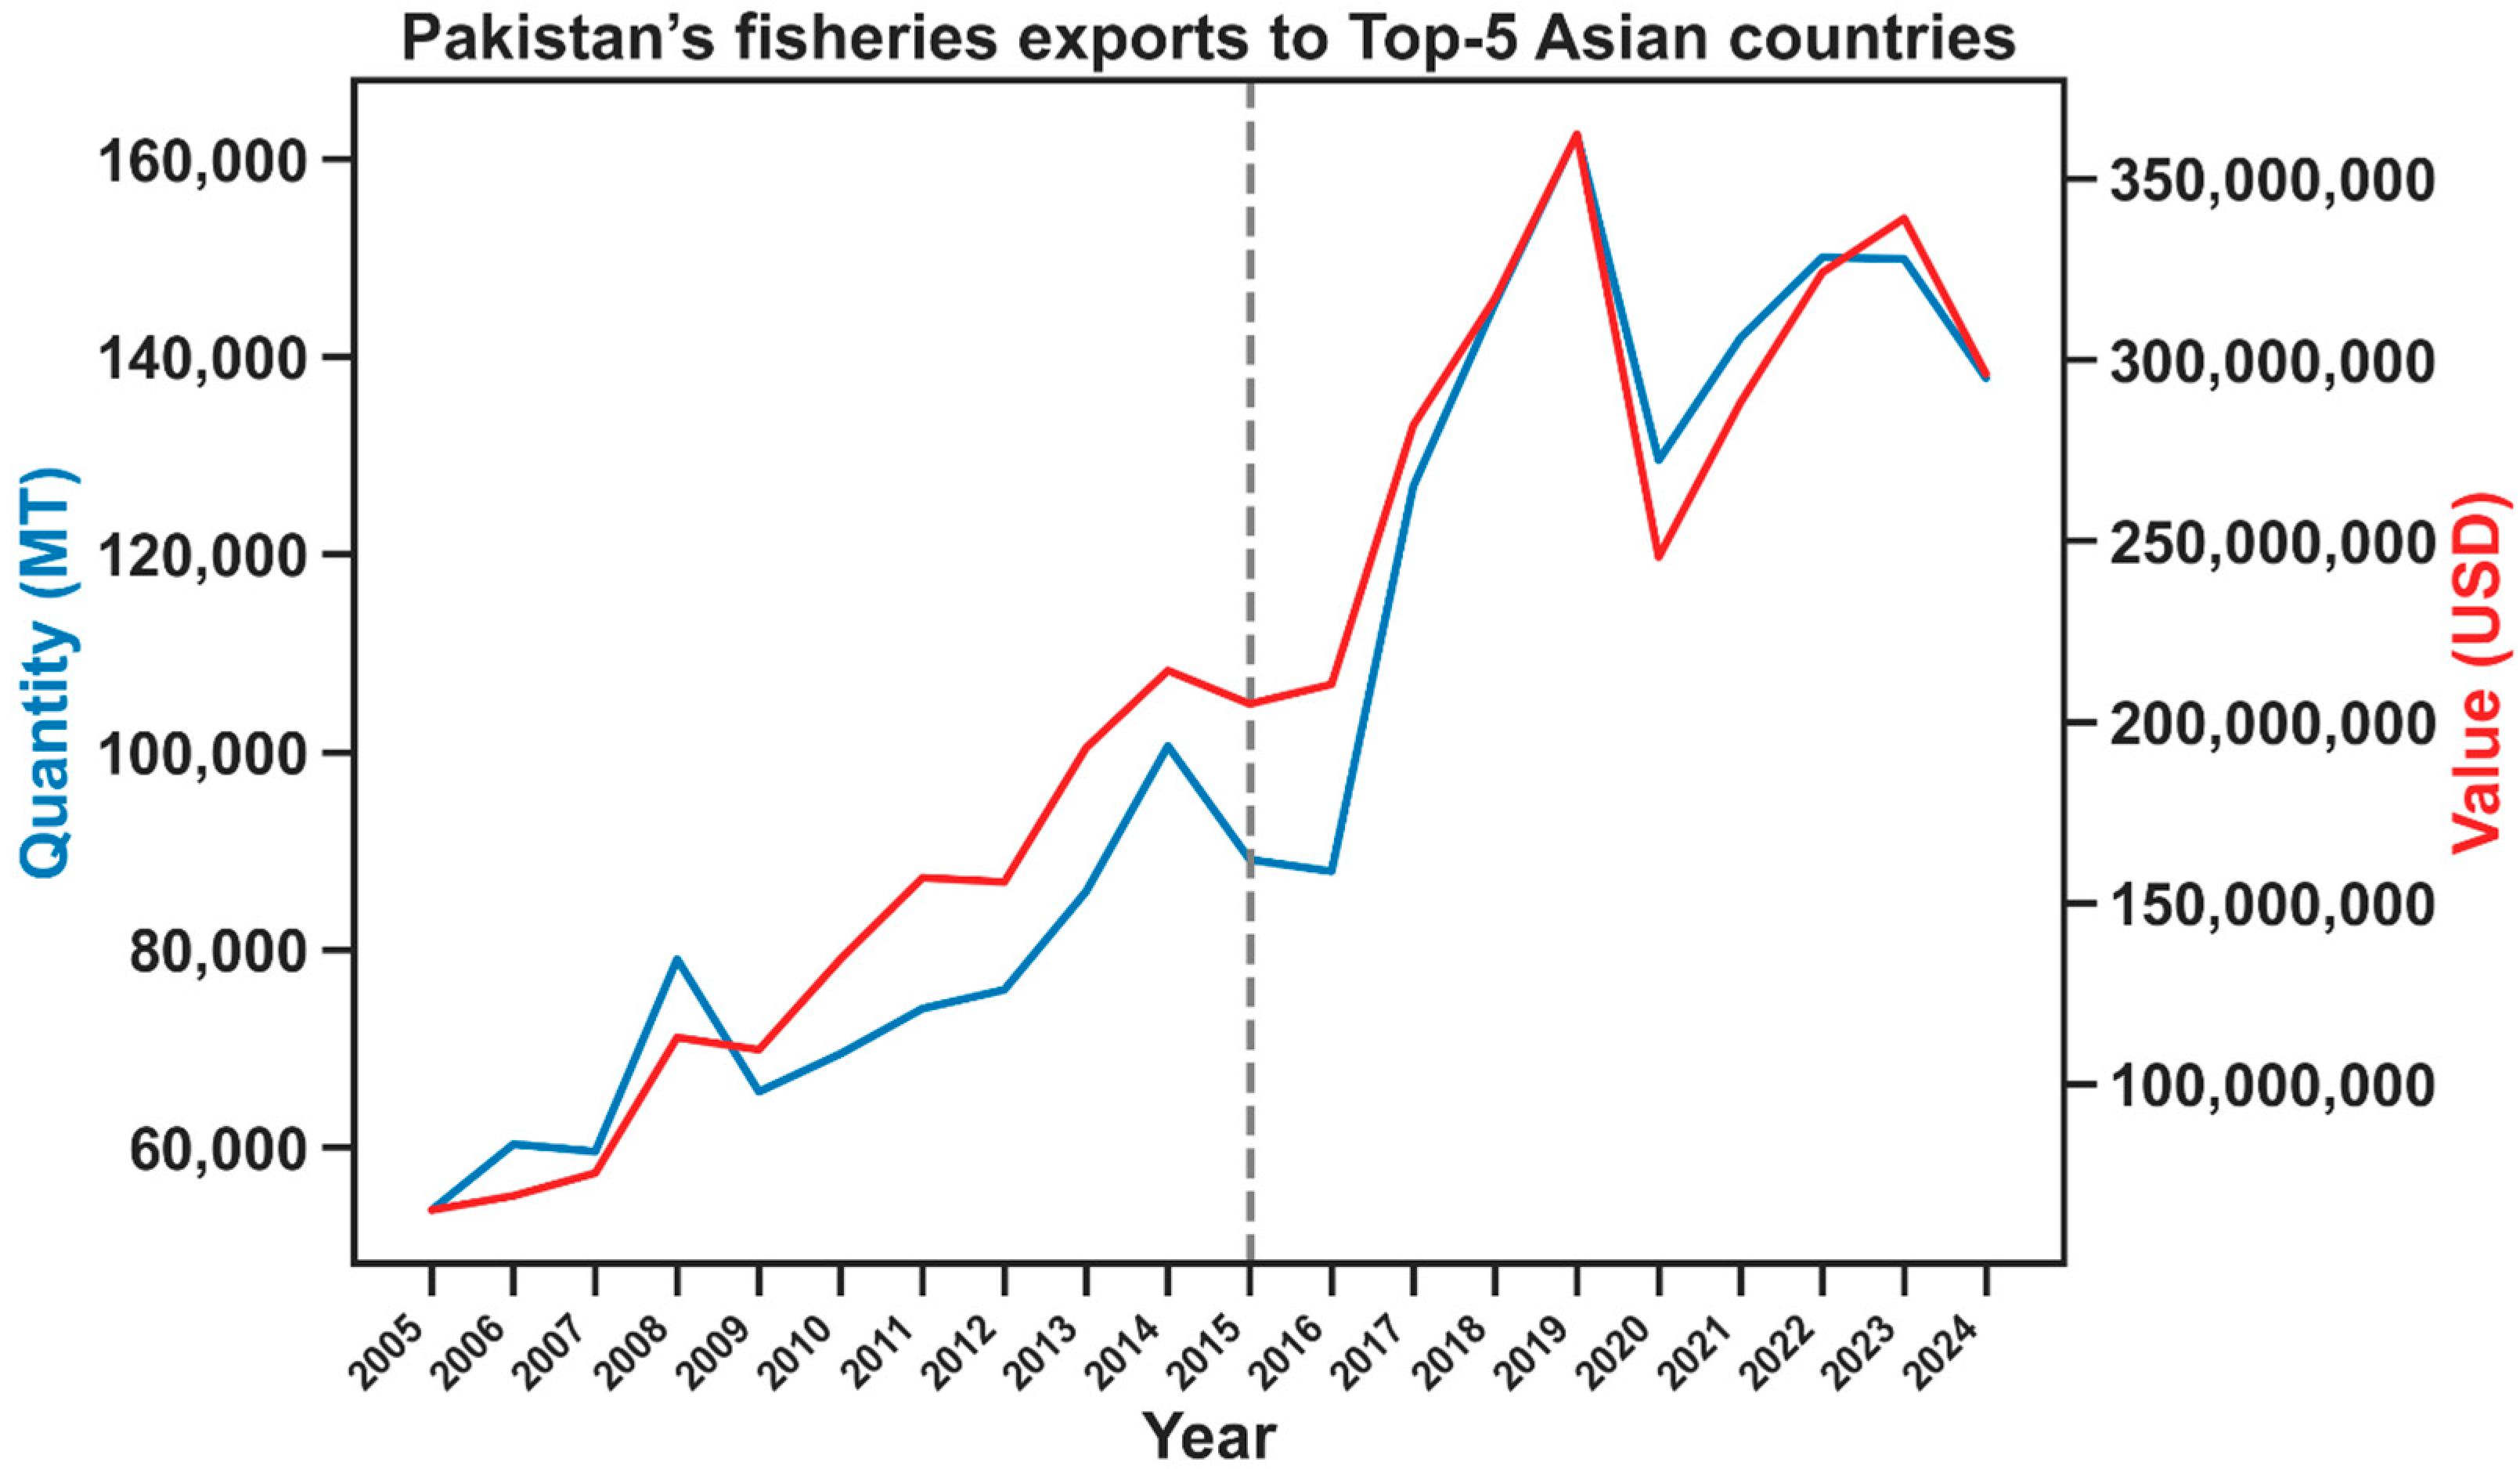
Following the descriptive statistics, the overall export dynamics are illustrated in Figure 4, which presents Pakistan’s fisheries exports to the top five Asian countries between 2005 and 2024, expressed in both quantity and value. The dashed vertical line marks the year 2015, corresponding to the operational phase of the China–Pakistan Economic Corridor (CPEC).
Pakistan exports approximately 23% of its annual fish and fisheries production—including fish, crustaceans, molluscs, and other aquatic invertebrates (in live, fresh, frozen, dried, smoked, and other processed forms fit for human consumption)—amounting to 1.25 million metric tons valued at 728.7 million USD per year at the global level. Of this, nearly 95% (129,554.2 MT; 228.61 million USD annually during 2005–2024) was destined for Asian countries. The top five Asian markets (China, Thailand, Vietnam, Japan, and Saudi Arabia) together accounted for 59.1% of Pakistan’s total fish and fisheries exports. A closer examination of sub-periods reveals distinct growth patterns. During the first period (2005–2009), exports averaged 107,562 MT (138.36 million USD) annually, with an estimated growth rate of 3894 MT (18.19 million USD) per year. In the second period (2010–2014), exports rose to an average of 120,721.6 MT (210.98 million USD) per year, reflecting a stronger growth rate of 7677.6 MT (17.46 million USD) annually. The trend further accelerated in the third period (2015–2019), when annual exports averaged 160,379 MT (336.5 million USD), accompanied by a growth rate of 11,919 MT (34.68 million USD) per year.
In contrast, during the final phase (2020–2024), export quantities declined slightly to 156,800 MT per year, although export values continued to increase, averaging 350.4 million USD annually. The compound annual growth rate (CAGR) for this phase was 0.45% for quantity, indicating a mild contraction, but 0.81% for export value, signifying steady monetary gains. Over the entire 20-year study period, the CAGR was 1.90% for export volume and 4.84% for export value, underscoring the sector’s resilience and its capacity to generate higher economic returns despite cyclical fluctuations in export volume.

3.1.2. Country-Specific Trends

The country-level dynamics of Pakistan’s fisheries exports are presented in Figure 5, showing annual quantities and values for China, Thailand, Vietnam, Saudi Arabia, and Japan from 2005 to 2024. The results reveal heterogeneous trajectories: China and Thailand exhibit steep upward trends after 2015, Vietnam expands strongly before contracting, Saudi Arabia declines with partial recovery, and Japan maintains modest but stable growth.
China has remained the dominant market throughout the study period. From 2005 to 2009, exports averaged 30,532.8 MT valued at 39.1 million USD, representing 28.4% of Pakistan’s Asian exports. Although the CAGR in quantity was slightly negative (−1.66%), the CAGR in value was positive (9.00%), suggesting higher unit prices or value-added trade. From 2010 to 2014, exports to China averaged 27,440.8 MT and 53.3 million USD, or 22.7% of Asian exports, with a decline in both quantity (−8.31%) and value (−4.43%). The post-CPEC phase (2015–2019) marked a sharp turnaround: exports rose to 34,790.6 MT and 78.9 million USD annually (21.7% share), with strong growth in both quantity (+30.9%) and value (+29.0%). During 2020–2024, exports to China surged further, averaging 72,500 MT and 177.7 million USD, with continued positive growth (CAGR: +5.5% for quantity; +8.8% for value). This trajectory confirms China’s rising dominance in Pakistan’s fisheries trade.
Thailand has consistently ranked as the second-largest destination. From 2005 to 2009, exports averaged 24,446.6 MT worth 27.2 million USD, or 22.8% of Asian exports, with annual growth of +2727 MT and +5.61 million USD. Exports dipped in 2010–2014 to 19,761.4 MT, but values increased to 39.97 million USD (17.7% share). Growth slowed sharply in this period. A major expansion occurred in 2015–2019, with exports averaging 46,498.4 MT and 103.4 million USD, accounting for 24.4% of Asian exports. Annual growth in this phase reached +8409 MT and +20.7 million USD, indicating robust resurgence. From 2020 to 2024, exports moderated slightly to 44,300 MT and 87.8 million USD but remained historically high, confirming Thailand’s sustained role as a primary destination.
Vietnam emerged as a key importer, with rapid expansion followed by contraction. From 2005 to 2009, exports were modest, averaging 1765.4 MT and 3.19 million USD (1.6% share), with growth of +755 MT and +1.42 million USD per year. During 2010–2014, exports surged to 28,510 MT and 62.9 million USD (18.7% share), with strong growth of +7405 MT and +16.1 million USD annually. The upward trajectory continued in 2015–2019 (39,037.2 MT; 84.7 million USD; 21.6% share), but the growth rate turned negative (−4087 MT and −9.09 million USD annually), signalling early signs of contraction. In 2020–2024, exports fell sharply to 18,640 MT and 9.86 million USD, reflecting competitive pressures and possible trade realignment.
Saudi Arabia has been a smaller but consistent market. From 2005 to 2009, exports averaged 4732.6 MT and 9.27 million USD (4.4% share), with positive growth (+541 MT and +2.2 million USD annually). From 2010 to 2014, exports rose to 5993.2 MT and 16.6 million USD (4.5% share), although growth rates turned negative. A sharp contraction followed in 2015–2019 (2941.4 MT; 8.13 million USD; 1.4% share), with declines of −51 MT and −0.73 million USD annually. In 2020–2024, exports recovered to 4200 MT and 9.44 million USD, suggesting modest stabilization.
Japan represents a niche but stable importer. From 2005 to 2009, exports averaged 2544.8 MT and 6.98 million USD (2.3% share), though growth was negative (−235 MT and −0.93 million USD annually). From 2010 to 2014, exports declined further to 1450.8 MT and 4.04 million USD, but values grew modestly, indicating resilience. A partial rebound occurred in 2015–2019 (2311.6 MT; 9.38 million USD; 1.4% share) with positive growth (+407 MT and +1.99 million USD annually). The most recent phase (2020–2024) shows stable exports of 2806 MT and 13.7 million USD, reflecting gradual strengthening of trade ties.

3.2. Interrupted Time Series (ITS) Analysis

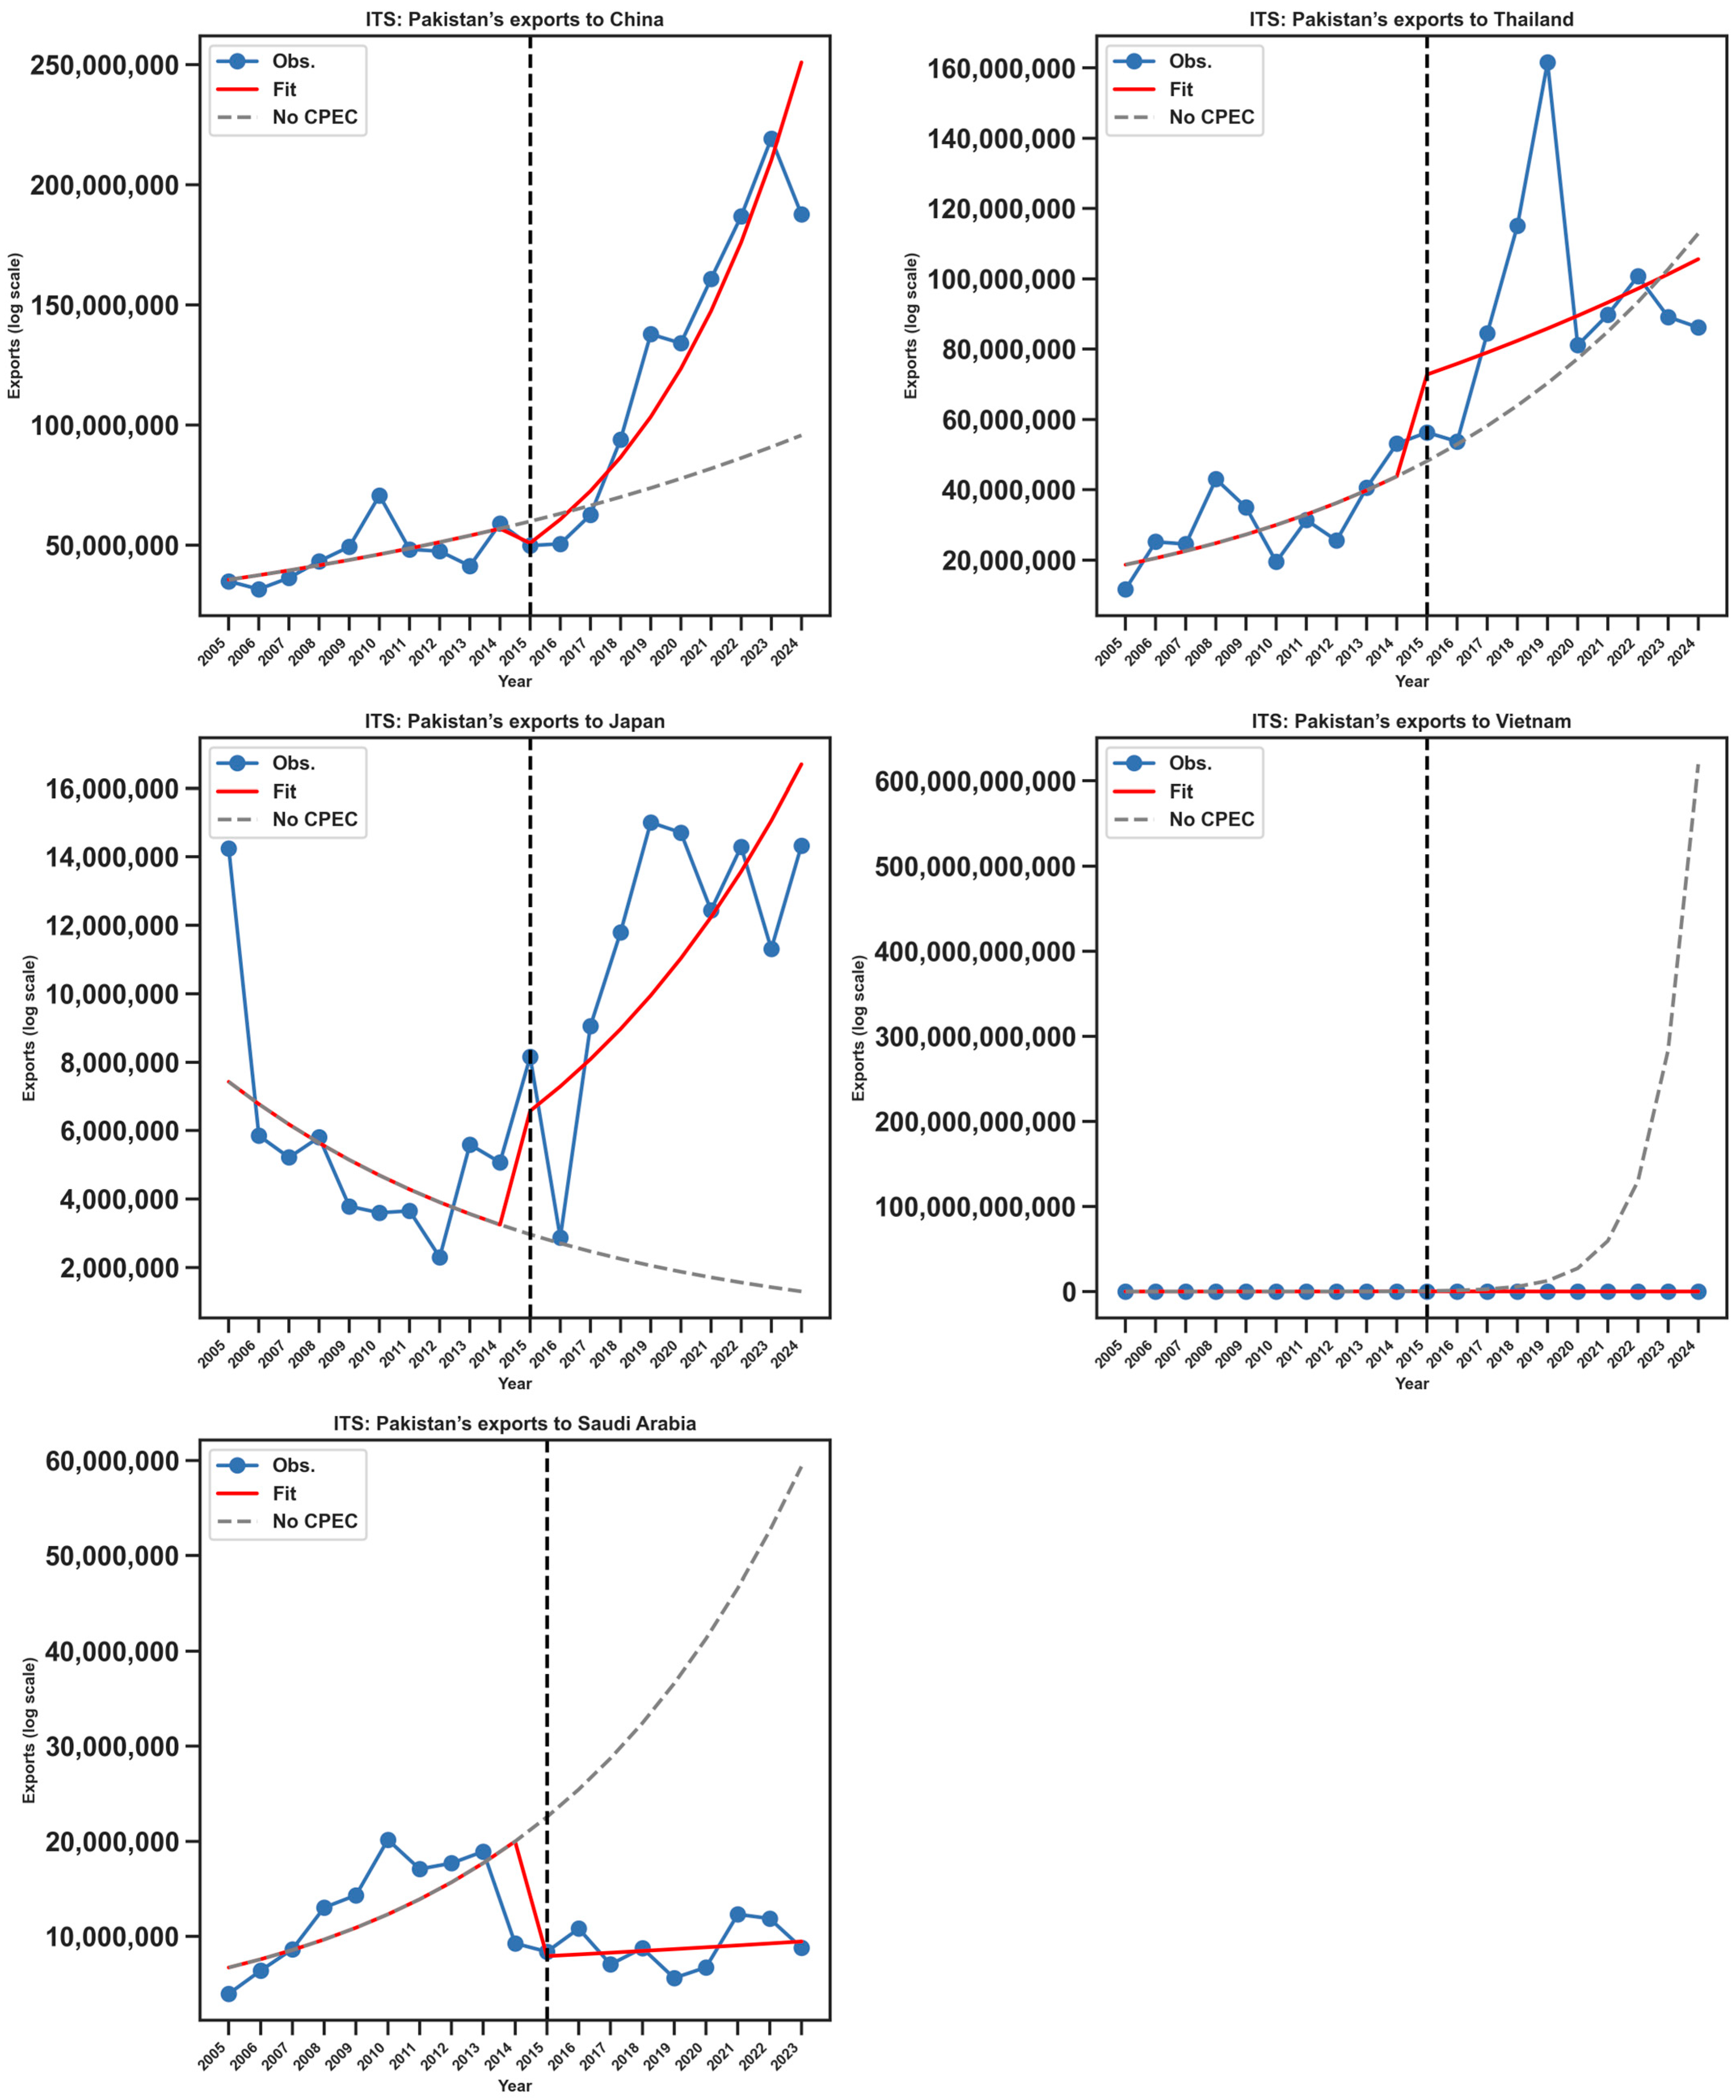
The interrupted time series analysis assessed whether the onset of the CPEC operational phase in 2015 significantly shifted Pakistan’s fisheries export trajectories (Figure 6). The results reveal heterogeneous impacts across destinations. For China, the ITS coefficient for the post-2015 period was −1.42 (p < 0.001), indicating a statistically significant change in the trajectory. Despite the negative sign (reflecting the logarithmic model specification), the observed values clearly diverged upward from the counterfactual, demonstrating a strong positive export response following CPEC. Thailand also displayed an upward shift after 2015, with a post-2015 coefficient of 0.95 (p = 0.071), which was marginally significant at the 10% level, suggesting a moderate but less robust effect compared to China. In contrast, Japan showed a negative post-2015 coefficient (−1.16; p = 0.088), indicating a modest decline relative to the counterfactual, although this effect was only weakly significant. Together, these findings highlight that CPEC’s impact was most strongly felt in China, moderately evident in Thailand, and largely absent in Japan, while other markets such as Vietnam and Saudi Arabia showed no consistent structural break.

3.3. Difference-in-Difference Analysis

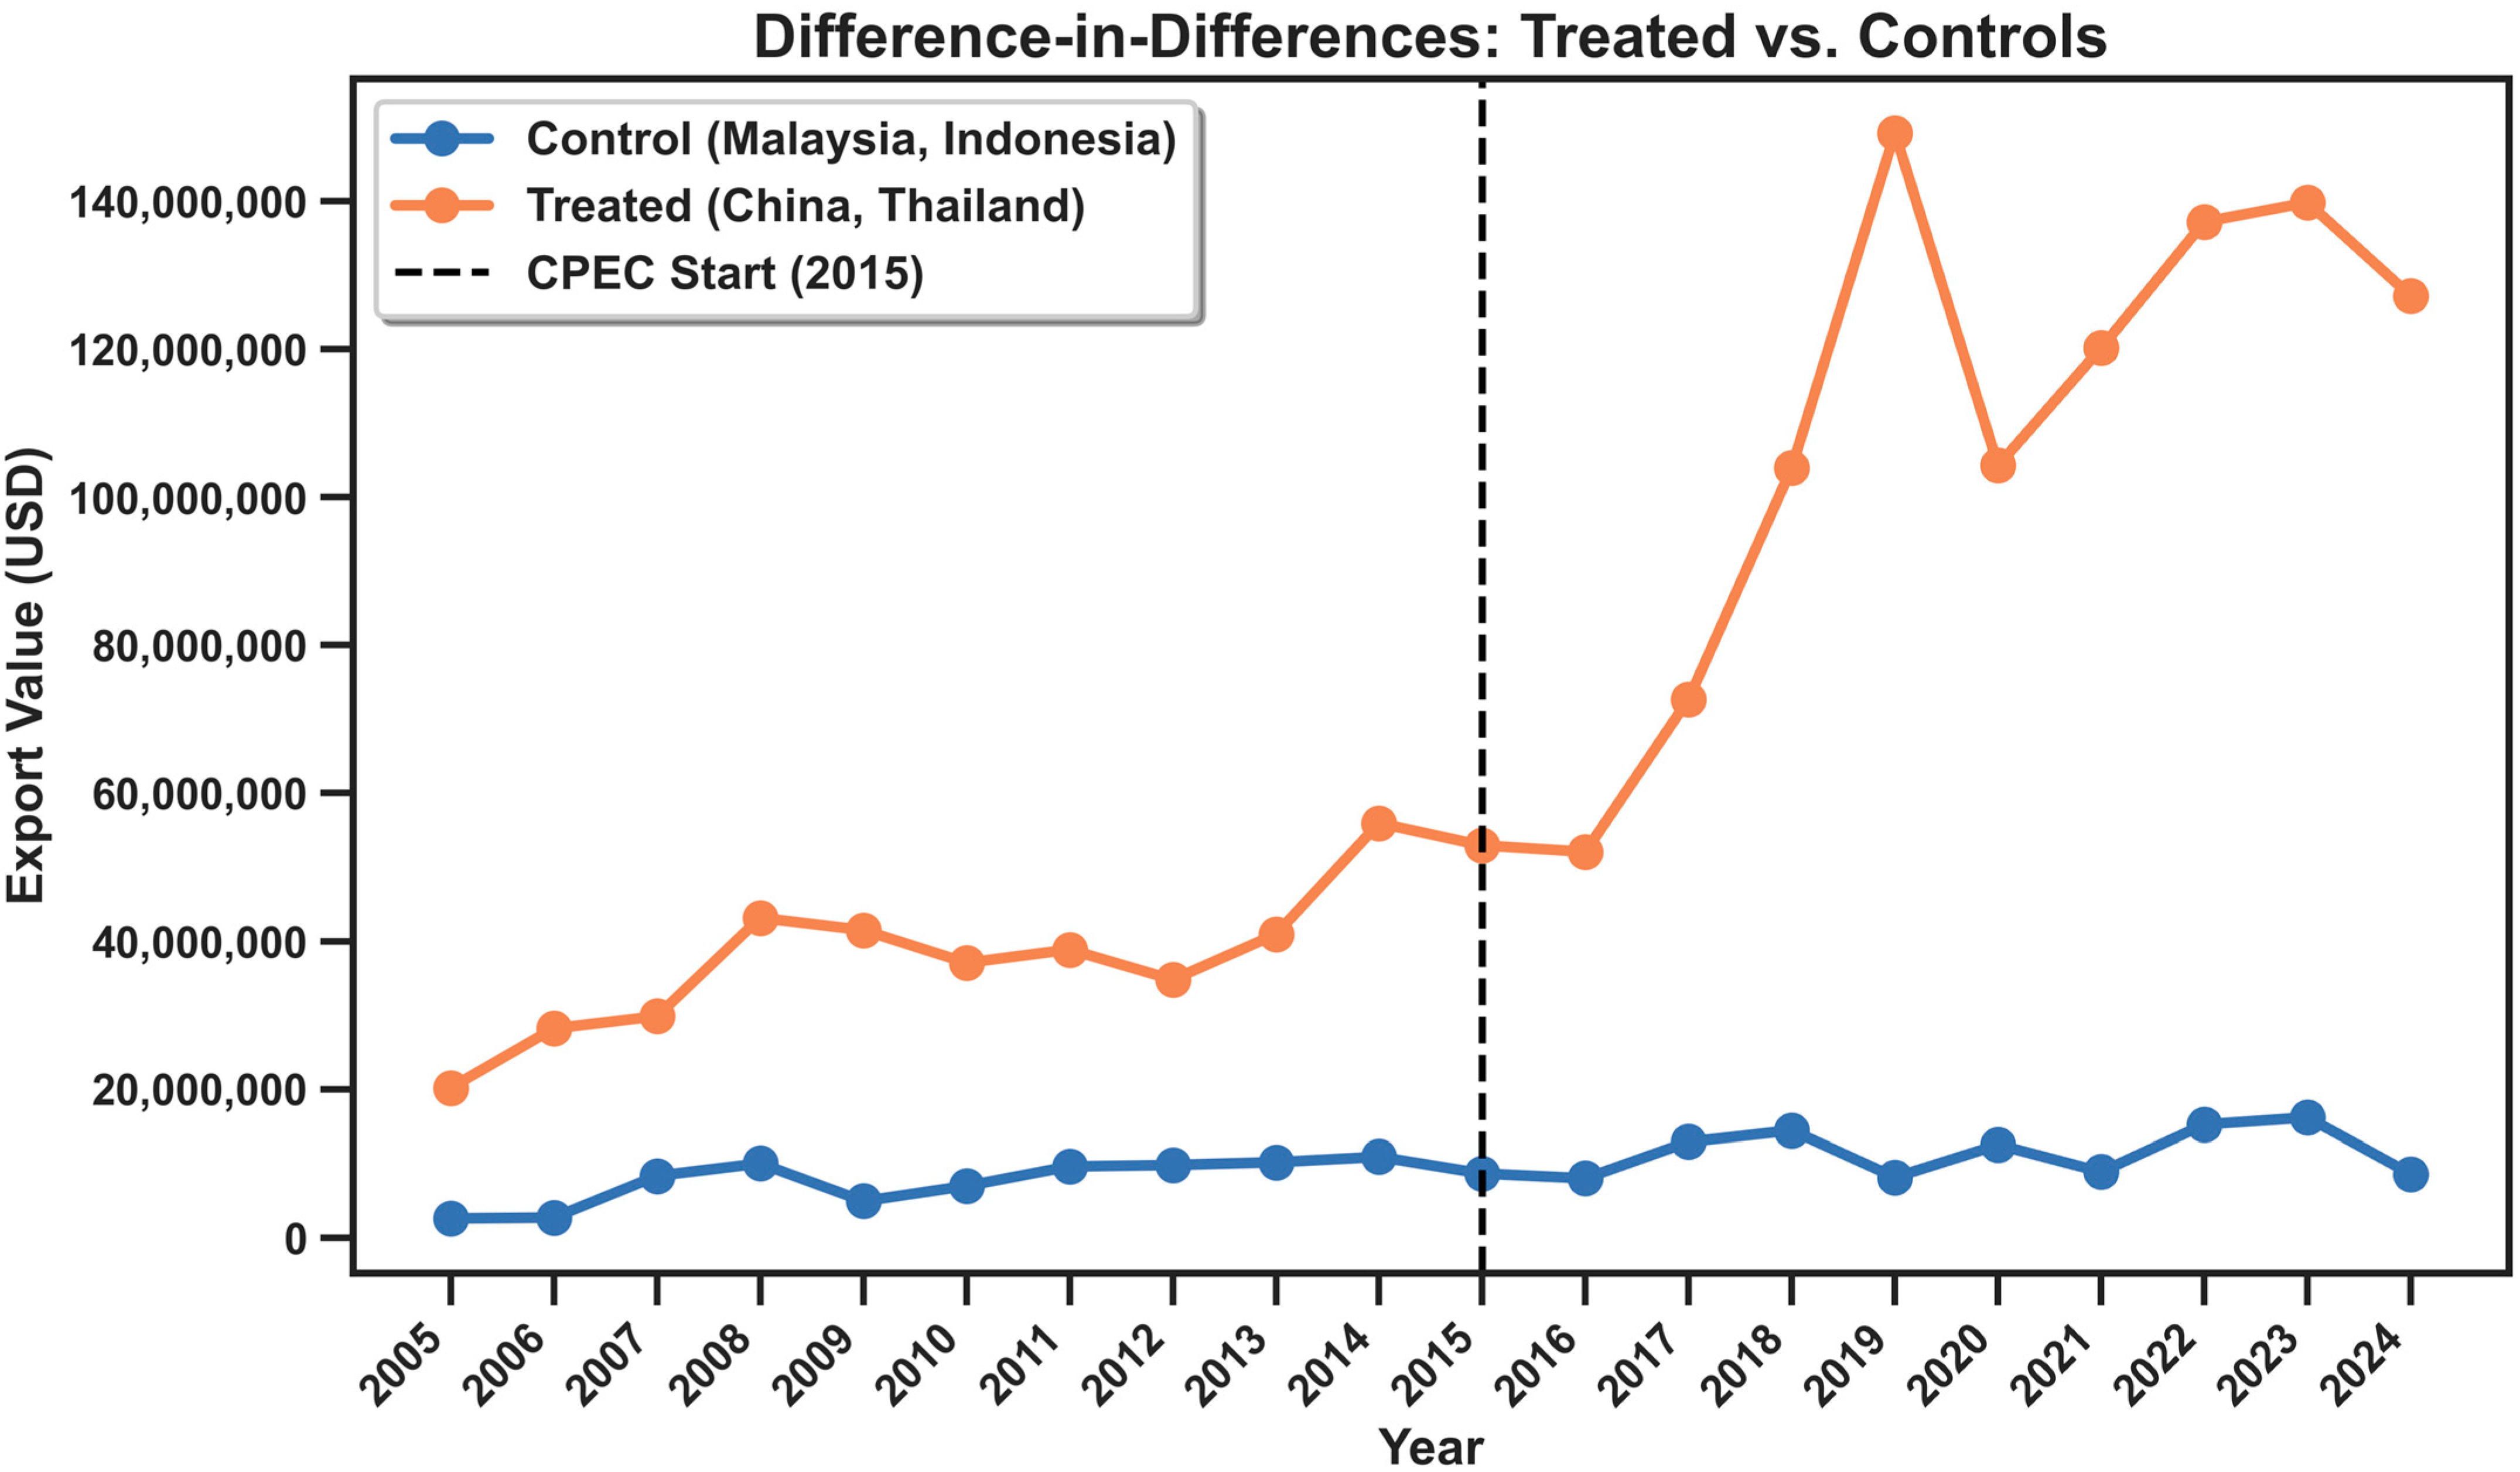
To further test whether the post-2015 surge in exports to China and Thailand could be attributed to CPEC rather than broader regional dynamics, a difference-in-differences (DiD) model was estimated using Malaysia and Indonesia as control markets not directly linked to CPEC (Figure 7).
The regression results (Appendix A) demonstrate a strong model fit (R2 = 0.747), with all key parameters statistically meaningful. The treatment effect for China and Thailand relative to Malaysia and Indonesia was 1.66 (p < 0.001), confirming that the treated group consistently exported at higher levels than the controls across the entire period. The post-2015 dummy was positive and marginally significant (0.47; p = 0.050), reflecting a general regional increase in exports after 2015. Crucially, the treatment × post-2015 interaction was also positive and significant at the 5% level (0.55; p = 0.050), indicating that exports to the treated group (China and Thailand) increased disproportionately after CPEC compared with the control group. These results confirm that the observed post-2015 expansion was not merely a continuation of existing trends, but rather a CPEC-driven structural gain concentrated in China and Thailand.
Taken together, the descriptive statistics, country-level trends, and causal inference analyses provide a consistent picture of Pakistan’s fisheries export dynamics over the past two decades. The results highlight both the resilience and heterogeneity of export trajectories: while overall exports to Asia expanded steadily, the benefits were concentrated in a few key destinations, particularly China and Thailand, with more modest or even negative responses in Vietnam, Saudi Arabia, and Japan. The ITS results suggest that the operationalization of CPEC in 2015 marked a structural break in export patterns, especially for China, while the DiD analysis confirms that these gains were not simply part of wider regional growth but were uniquely associated with CPEC-related trade integration. These findings set the stage for the discussion, where the implications of these shifts for regional trade strategies, fisheries sector development, and policy planning in Pakistan are critically examined.

4. Discussion

Econometric findings indicate conclusive evidence that the operationalization of the China-Pakistan Economic Corridor (CPEC) in 2015 was linked to statistically significant structural change in the fisheries export of Pakistan but with different market effects. Interrupted Time Series (ITS) analysis showed a strong and dramatic change in China (coefficient = −1.42, p < 0.001), but a moderate and slightly significant value in Thailand (0.95, p = 0.071). In contrast, Japan exhibited a poorly positive effect (−1.16, p = 0.088), whereas Vietnam and Saudi Arabia recorded contraction or volatility, which implies that CPEC-related benefits were not distributed equally. These non-homogenous paths clarify the need to consider market-specific features: China and Thailand directly benefited from the shorter delivery time and the better port logistics, whereas other destinations with sanitary and phytosanitary (SPS) requirements or sensitive demand were not so lucky. The Difference-in-Differences (DiD) analysis also had the benefit of showing that China and Thailand did not grow post-2015 in the same way as the regional trade would have. The interaction effect between the treatment and post-2015 was 0.55 (p = 0.050), which implies that the increase in exports to these countries was disproportionately high relative to control markets (Malaysia and Indonesia). Notably, the pace of increase in export value exceeded that of volume, indicating that CPEC enabled not only larger consignments but also increases in unit prices and supply chain modernization. The observation aligns with evidence at the global level that infrastructure corridors enhance trade with the aid of logistics effectiveness and value addition at one stage [30,31].
Nevertheless, infrastructure is not the only possible explanation of the patterns. It has been found that the fisheries sectors gain most through corridor-based integration when infrastructure is coupled to quality certification and institutional harmonization. Corridors have enhanced the export performance of regional fish in the Economic Community of Central African States (ECCAS), where the export of fish is boosted by linking cold-chain logistics investment with harmonized trade policies [32,33,34]. On the same note, the Indo-Pacific Economic Corridor (IPEC) enabled 38.1% growth in the exports of fish to India by Bangladesh because infrastructure has been aligned with SPS compliance and cooperative trade agreements [35]. In Southeast Asia, the Greater Mekong Sub-Region corridors have enhanced the aquaculture trade because they connect highway networks to processing clusters and export hubs [36]. These examples point to the idea that gains of connectivity can only bring about sustainable fisheries trade when they are combined with certification, value addition, and institutional reform investment. The lack of Hazard Analysis and Critical Control Points (HACCP) certification, the poor traceability systems, and the old processing infrastructure are still limiting factors to accessing the higher markets like the European Union and Japan [37,38]. Our findings are consistent with this fact: even with the CPEC-related gains, the exports to Japan continued to be statistically insignificant, which confirms that the infrastructure by itself cannot beat compliance hurdles. In the same vein, the fluctuating nature of import trends in Saudi Arabia indicates the existence of biosecurity-related constraints, which implies that an increase in the quality of logistics should be accompanied by stringent SPS.
Export growth and domestic food security can be complementary rather than conflicting goals if revenues are reinvested in the domestic system. Specifically, incremental earnings from fisheries trade could finance (i) aquaculture productivity improvements through (i) better feed and seed systems, (ii) domestic cold storage and distribution networks to reduce inland post-harvest losses and stabilize consumer prices, and (iii) nutrition access programs such as school feeding with small pelagic fish, which are both affordable and rich in micronutrients. Ring-fencing part of the additional export revenues for such uses would cushion domestic availability while simultaneously sustaining export competitiveness.
In this context, economic corridors are best understood as integrated infrastructure networks within a geographical area, designed to encourage trade and industrial progress [39]. They link multiple financial and industrial agents in a given zone and are typically anchored in transportation networks. International corridors often emerge through interconnected highways, railways, and terminals, connecting regions or entire countries [40,41]. By connecting production centres with consumption hubs, corridors accelerate supply-demand matching and mobilize valuable resources. However, as the literature emphasizes, they are rarely standalone investments; instead, they coincide with interventions such as border management, immigration protocols, travel arrangements, and regulatory harmonization [32,35,36,38].
The concept of “financial corridors” is often exemplified by highway-linked networks such as the Greater Mekong Sub-Region (GMS) East–West Economic Corridor and the Southern Economic Corridor, both of which illustrate how connectivity fosters regional trade and industrial clusters. The China–Pakistan Economic Corridor is similarly anchored in transport infrastructure but also includes energy/power stations and special economic zones. Recent scholarship highlights the need for direct links between linear infrastructure (highways, pipelines, fibre optics) and broader economic and spatial development strategies [42]. In practice, economic corridors not only enhance physical infrastructure but also stimulate regional integration, industrial clustering, and export diversification. They can spill over into other sectors such as tourism, hospitality, services, and local trade, thereby generating employment in production industries, food service, foreign trade, and logistics. Moreover, they improve the living standards of local communities through new services in transport, finance, health, and education.
Against this comparative backdrop, CPEC was formally introduced in May 2013 to upgrade Pakistan’s infrastructure and expand economic activity through advanced transportation, power plants, and special economic zones. Financing has been provided by the Asian Infrastructure Investment Bank (AIIB), the Silk Road Fund Exim Bank (SFEB), the Bank of China (BOC), and the Industrial and Commercial Bank of China (ICBC), with investments channelled into energy, SEZs, and transport connectivity. Yet, Pakistan’s fisheries sector remained largely overlooked in early CPEC programming and did not receive targeted support until 2020.
The present research demonstrates that China has consistently remained the leading importer of Pakistani fish and fisheries products, with an average annual growth of about 3010 metric tons over 2005–2024. The period 2020–2024 coincides with operational advances in CPEC, including major upgrades to Karachi and Gwadar ports, improved road and rail connectivity, and expanded overland trade with China. These improvements reduced logistical bottlenecks, enhanced transit efficiency, and strengthened access to East and Southeast Asian markets. They also stabilized export volumes and improved value margins, thereby amplifying Pakistan’s competitiveness even amid global disruptions.
Meanwhile, exports to Thailand expanded by an average of 4574 metric tons per year, while Vietnam grew by 1025 metric tons per year despite volatility. Saudi Arabia showed a mild contraction (−77 metric tons per year), while Japan registered modest but positive growth (72 metric tons annually), primarily in select high-value product segments. Thus, while CPEC has been hailed as a game-changer for Pakistan’s economy, the fisheries sector has only partially benefited. If fisheries are to fully leverage CPEC, they require targeted investments in aquaculture, processing, and value-chain development [43].
Despite opportunities, major constraints still hamper Pakistan’s fisheries export competitiveness. These include: (i) non-standardized fish holding tanks on most fishing vessels; (ii) absence of ice flasks and proper chilling systems, leading to spoilage; (iii) unsanitary and unstandardized unloading practices; (iv) low levels of food safety training among labourers; (v) poor sanitary conditions at landing centres; (vi) non-compliance with post-harvest quality standards due to outdated infrastructure; (vii) institutional rigidities and market imperfections; (viii) declining commodity prices; (ix) outdated processing technologies and weak R&D; (x) shortages of certified processing plants; (xi) overcrowding and pollution at Karachi fish harbour; (xii) underutilization of other harbours and landing centres; and (xiii) gaps in trade promotion, advocacy, and bilateral agreements [44,45,46,47,48,49].
Unless these structural bottlenecks are addressed, the full export potential of Pakistan’s fisheries sector under CPEC will remain unrealized. Addressing them requires a coordinated strategy that combines infrastructure upgrades, institutional reforms, and international certification standards, alongside targeted investments in aquaculture and value-addition.

5. Conclusions

This study concludes that between 2005 and 2024, Pakistan exported approximately 1.25 million metric tons of fish and fisheries products annually, with an average global trade value of 728.7 million USD per year. Of this volume, nearly 95%—about 129,554.2 metric tons, valued at 228.61 million USD annually—was directed toward Asian markets. Within the region, China, Thailand, Vietnam, Japan, and Saudi Arabia collectively absorbed 59.1% of Pakistan’s fisheries exports, underscoring their central role in the trade network. Among these, China consistently emerged as the dominant importer, averaging 34,790.6 metric tons per year (equivalent to 78.89 million USD), accounting for nearly one-quarter (24.69%) of total Asian-bound exports.
The temporal dynamics, however, reveal a differentiated trajectory. During the earlier study phases (2005–2014), export growth remained relatively modest despite strong bilateral ties. Yet, the post-2015 period—coinciding with the operationalization of the China–Pakistan Economic Corridor (CPEC)—marked a structural shift. Enhanced port facilities, cold-chain integration, and improved overland connectivity significantly reduced logistical bottlenecks, stabilized supply chains, and expanded Pakistan’s access to East and Southeast Asian markets. This shift not only facilitated higher export volumes but also improved trade margins, signalling a gradual move from bulk supply to value-enhanced seafood exports. Likewise, ITS results show significant structural breaks for China (–1.42, p < 0.001) and Thailand (0.95, p = 0.071), while DiD confirms a treatment × post-2015 effect of 0.55 (p = 0.050).
Looking forward, the fisheries sector represents an underutilized but high-potential pillar of Pakistan’s export economy. Strategic collaboration with China and other Asian partners under the CPEC umbrella—particularly in aquaculture expansion, value-added processing, and certification systems—could unlock mutual economic benefits. For Pakistan, this would generate employment, strengthen food security, and improve competitiveness in premium markets such as the European Union, the United States, Japan, and the Gulf states, where demand for certified high-quality seafood is expanding. For China and other partners, reliable access to diverse, sustainably sourced seafood would secure long-term supply chains. Achieving these outcomes will require policy alignment, investment in international quality standards, and stronger institutional capacity. A shared commitment to developing the fisheries value chain will ensure that CPEC delivers not just connectivity gains but also sustainable, inclusive, and mutually beneficial growth in the fisheries sector.

Author Contributions

M.Y. supervised, and A.M.D. collected data and drafted the manuscript. All authors have read and agreed to the published version of the manuscript.

Funding

This research received no external funding.

Institutional Review Board Statement

Not applicable.

Informed Consent Statement

Not applicable.

Data Availability Statement

The data presented in this study are available on request from the corresponding author, as this is the research work of doctor dissertation, so it is not applicable to show the data publically, but it will be available on request.

Conflicts of Interest

The authors declare no conflicts of interest.

Appendix A

Appendix A.1. OLS Regression Results

Dep. Variable:ln_val  R-squared:0.747
Model:OLS   Adj. R-squared:0.737
Method:Least Squares  F-statistic:84.04
Date:Sun, 17 August 2025   Prob (F-statistic):4.50 × 10⁻²⁴
Time:19:18:01  Log-Likelihood:−73.693
No. Observations:80  AIC:155.4
Df Residuals:76  BIC:164.9
  Df Model:3
  Covariance Type:HC1
coefstd errzP > |z|[0.025][0.975]
const15.73610.20875.5640.00015.32816.14
treat1.65830.2287.2710.0001.2112.105
post20150.47420.2421.9620.0500.0010.948
treat_post0.54680.2791.9600.0500.0001.093
Omnibus:32.146  Durbin–Watson:0.952
Prob(Omnibus):0.000  Jarque–Bera (JB):65.841
Skew:−1.457  Prob(JB):5.04 × 10⁻¹⁵
Kurtosis:6.356  Cond. No.6.85
Note: Standard Errors are heteroscedasticity robust (HC1).

Appendix A.2. Supplementary Equations and Model Specifications

Appendix A.2.1. Descriptive Statistics

µ x = i = 1 x 1 n N ,
where
  • µx = Estimation,
  • n = Total Number,
  • I = Frequency of observation and
  • N = Total
  • Percentage calculation:
  • Percentages ( p ) were calculated as:
p = x n × 100 ,
where
  • x = Given Quantity,
  • n = Total amount, and
  • p = percentage of the quantity compared to the total.
  • Growth rate:
  • Growth Rate (GR) was computed through:
G R = c y p y c y ,
where
  • GR = Growth Rate
  • cy = Current year,
  • py = Previous year. These metrics provided a descriptive basis for understanding the scale and pace of export changes.

Appendix A.2.2. Statistical Analysis

  • Sample mean:
The mean was estimated as:
µ ¯ = f x n ,
where
  • µ ¯ = mean,
  • f = Frequency of each Class,
  • x = mid-interval value of each class
  • N = Total frequency
  • f x = sum of the products of mid–interval Values and their corresponding frequency
  • Standard error:
S E x ¯ = σ n ,
where
  • S E x ¯ = Standard Error of the Sample,
  • σ = Sample Standard Deviation,
  • n = Sample of Samples
  • Confidence Interval (95%)
C I = x ¯ ± z s n ,
where
  • CI = Confidence interval,
  • x ¯ = sample mean,
  • s = sample standard deviation,
  • n = Sample Size, and
  • z = 1.96 for a 95% level of significance.

Appendix A.2.3. Interrupted Time Series (ITS) Analysis

The model specification was:
γ i t = β 0 +   β 1 t i m e t +   β 2   p o s t 2015 t +   β 3 t i m e   × p o s t 2015 +   ϵ i t
where
γ i t is the natural log of exports (quantity or value) for country i in year t. The term t i m e t denotes the continuous trend across years, p o s t 2015 t is a binary variable equal to 1 for years after 2015 (and 0 otherwise), and the interaction term captures the change in slope following the intervention. The coefficient β 2 reflects the immediate level change in exports post-CPEC, while β 3 indicates whether the growth rate of exports shifted significantly after 2015.

Appendix A.2.4. Difference in Difference (DiD) Model

The DiD regression model was specified as
I n γ i t = α + δ t r e a t i + γ p o s t 2015 t + θ   t r e a t i × p o s t 2015 t + ϵ i t
Here, I n γ i t is the natural log of export value; t r e a t i is a binary indicator for treatment countries; p o s t 2015 t is a time dummy for years after 2015; and the interaction term ( t r e a t i × p o s t 2015 t ) captures the DiD estimate of CPEC’s impact. The coefficient θ is of central interest, representing the relative export growth in treatment versus control countries after 2015. Robust standard errors (HC1) were used to account for heteroscedasticity.

References

  1. Trade Development Authority of Pakistan. Fisheries Potential of Pakistan. 2022. Available online: https://tdap.gov.pk/wp-content/uploads/2022/03/Fisheries-Potential-of-Pakistan-Salma-Nusrat.pdf (accessed on 1 September 2025).
  2. Shah, S.B.H.; Mu, Y.; Abbas, G.; Pavase, T.R.; Mohsin, M.; Malik, A.; Ali, M.; Noman, M.; Soomro, M.A. An economic analysis of the fisheries sector of Pakistan (1950–2017): Challenges, opportunities and development strategies. Int. J. Fish. Aquat. Stud. 2018, 6, 515–524. [Google Scholar]
  3. Mohsin, M.; Yongtong, M.; Hussain, K.; Mahmood, A.; Zhaoqun, S.; Nazir, K.; Wei, W. Contribution of Fish Production and Trade to the Economy of Pakistan. Int. J. Mar. Sci. 2015, 5, 1–7. [Google Scholar] [CrossRef]
  4. Shah, S.B.H.; Mu, Y.; Mohsin, M.; Pavase, T.R.; Jattak, Z.; Hydar, S.S.; Soomro, M.A. An economic analysis of the fisheries sector in Pakistan (1950–2013). Indian J. Geo-Mar. Sci. 2018, 47, 903–909. [Google Scholar]
  5. VLIZ. Maritime Boundaries Geodatabase. Retrieved 22 February 2019, from Flanders Marine Institute. 2019. Available online: http://www.marineregions.org/downloads.php (accessed on 22 February 2019).
  6. Siddiqi, A.H. Fishery resources and development policy in Pakistan. GeoJournal 1992, 26, 395–411. [Google Scholar] [CrossRef]
  7. FAOSTAT. Inland Waters in Pakistan. Retrieved 22 February 2019, from FAO. 2016. Available online: http://www.fao.org/faostat/en/#data/RL (accessed on 22 February 2019).
  8. Shah, S.B.H.; Mu, Y.; Pavase, T.R.; Abbas, G.; Soomro, M.A.; Kalhoro, M.T.; Muhammad, M.; Muhammad, N.; Mumtaz, A.; Abdul, M. Current status of shrimp fishery in Pakistan: Economic role, challenges, opportunities and strategies for aquaculture development. Indian J. Mar. Sci. 2019, 48, 1743. [Google Scholar]
  9. FAO. National Aquaculture Sector Overview Pakistan. 2020. Available online: http://www.fao.org/fishery/countrysector/naso_pakistan/en (accessed on 26 December 2020).
  10. MFD. Handbookof Fisheries Statistics of Pakistan; Marine Fisheries Department, Government of Pakistan: Karachi, Pakistan, 2018; Volume 21.
  11. FAO. Fisheries and Aquaculture; Hayat, M., Ed.; FAO: Rome, Italy, 2025; Available online: https://www.fao.org/fishery/en/countrysector/naso_pakistan (accessed on 15 July 2025).
  12. Internation Trade Centre (ITC). Trade Map: Trade Statistics for International Business Development. 2025. Available online: https://www.trademap.org/Product_SelCountry_TS.aspx (accessed on 9 August 2025).
  13. Mohsin, M.; Yin, H.; Mehak, A. Sustainable solutions: Exploring risks and strategies in Pakistan’s seafood trade for marine conservation. Front. Mar. Sci. 2024, 11, 1420755. [Google Scholar] [CrossRef]
  14. Ali, M.; Yongtong, M.; Oad, S.; Shah, S.; Kalhoro, M.; Kalhoro, M.; Lahbar, G. A comparative analysis on expansion of Pakistan Sfisheries trade: World & China. Indian J. Geo-Mar. Sci. 2020, 49, 1643–1650. [Google Scholar]
  15. Malik, A.R. The China–Pakistan Economic Corridor (CPEC): A Game Changer for Pakistan’s Economy China’s Global Rebalancing and the New Silk Road; Springer: Berlin/Heidelberg, Germany, 2018; pp. 69–83. [Google Scholar]
  16. Editorial. EU ‘Ban’ on Fish Import, The Express Tribune. 2019. Available online: https://tribune.com.pk/story/1967816/eu-ban-fish-import (accessed on 10 July 2025).
  17. Adnan, M.; Xiao, B.; Bibi, S.; Xiao, P.; Zhao, P.; Wang, H.; Ali, M.U.; An, X. Known and unknown environmental impacts related to climate changes in Pakistan: An under-recognized risk to local communities. Sustainability 2024, 16, 6108. [Google Scholar] [CrossRef]
  18. Marine Fisheries Department. Annual Export Progress Report FY 2024–25. Ministry of Maritime Affairs, Government of Pakistan. 2025. Available online: https://moma.gov.pk/Detail/Mzg0M2I4NzctMjE1ZS00ZGM0LTkyNmItMDViODFhZjE4Njhk (accessed on 10 July 2025).
  19. Food and Agriculture Organization. Globefish Highlights: Seafood Trade Trends in Asia. FAO Fisheries Division. 2024. Available online: https://www.fao.org/in-action/globefish/publications/en/ (accessed on 10 July 2025).
  20. International Trade Centre. Trade Map: Trade Statistics for International Business Development. 2025. Available online: https://www.trademap.org (accessed on 30 September 2025).
  21. Ali Khan, E.; Rizwan, M.; Wang, Y.; Munir, F.; Hua, J. Challenges and Future Prospects of Pakistan’s Animal Industry: Economic Potential, Emerging Trends, and Strategic Directions. Vet. Sci. 2025, 12, 733. [Google Scholar] [CrossRef]
  22. FAO. The State of World Fisheries and Aquaculture 2024—Blue Transformation in Action; FAO: Rome, Italy, 2024. [Google Scholar]
  23. FAO. The State of World Fisheries and Aquaculture 2020. Sustainability in Action; FAO: Rome, Italy, 2020. [Google Scholar]
  24. Pakistan Bureau of Statistics. 2024. Sectoral Shares in GDP (at Current Basic Prices): Table 7b. Government of Pakistan. Available online: https://www.pbs.gov.pk/sites/default/files/tables/national_accounts/2023-24/Table_7b.pdf (accessed on 11 July 2025).
  25. Banomyong, R. Supply chain dynamics in Asia. SSRN 2010. Available online: https://publications.iadb.org/en/supply-chain-dynamics-asia-0 (accessed on 11 July 2025).
  26. Eegunjobi, R.; Ngepah, N. The determinants of global value chain participation in developing seafood-exporting countries. Fishes 2022, 7, 186. [Google Scholar] [CrossRef]
  27. Rahman, F. Pakistan’s Evolving Relations with China, Russia and Central Asia. In Russia and Its Neighbors in Crisis; Slavic Eurasian Research Center; Hokkaido University: Sapporo, Japan, 2007; pp. 211–229. Available online: http://src-h.slav.hokudai.ac.jp/coe21/publish/no16_1_ses/11_rahman.pdf (accessed on 11 July 2025).
  28. China-Pakistan Economic Corridor Secretariat. New Gwadar International Airport. Ministry of Planning, Development & Special Initiatives, Government of Pakistan. Available online: https://cpec.gov.pk/project-details/33 (accessed on 14 October 2024).
  29. Yii, K.-J.; Bee, K.-Y.; Cheam, W.-Y.; Chong, Y.-L.; Lee, C.-M. Is transportation infrastructure important to the One Belt One Road (OBOR) Initiative? Empirical evidence from the selected Asian countries. Sustainability 2018, 10, 4131. [Google Scholar] [CrossRef]
  30. Xia, Y.; Yin, H.; Mohsin, M.; Mehak, A.; Yan, C. Exploring FTAs, seafood exports, and SDGs: A gravity model analysis of Pakistan’s seafood trade with China and regional partners. Front. Mar. Sci. 2025, 12, 1553780. [Google Scholar] [CrossRef]
  31. World Bank. Connecting to Compete: Trade Logistics Performance Index. 2020. Available online: https://lpi.worldbank.org (accessed on 11 July 2025).
  32. United Nations Conference on Trade and Development. Harmonizing Trade Policies in Africa: Lessons from ECCAS and COMESA. 2021, UNCTAD. Available online: http://unctad.org/system/files/official-document/webditc2017d1_en.pdf (accessed on 11 July 2025).
  33. Food and Agriculture Organization. Fishery and Aquaculture Country Profiles – Central Africa Region. 2020, Retrieved from FAO Website. Available online: http://www.fao.org/fishery/en/facp/search (accessed on 11 July 2025).
  34. Garba, D.; Wancelous, A. The challenges of regional integration and effective implementation of African Continental Free Trade Area (AfCFTA) policy in Africa. Afr. J. Politics Adm. Stud. 2023, 16, 712–734. [Google Scholar] [CrossRef]
  35. Chemonics International. Indo-Pacific Economic Corridor (IPEC) Phase I: Coordinated Regional Trade Analysis. 2015, United States Agency for International Development (USAID). Retrieved from Banyan Global’s IPEC Report. Available online: https://banyanglobal.com/wp-content/uploads/2017/06/Indo-Pacific-Economic-Economic-Corridor.pdf (accessed on 11 July 2025).
  36. Asian Development Bank. Greater Mekong Subregion: Twenty-Five Years of Partnership. 2018. Available online: https://www.adb.org/publications/greater-mekong-subregion-25-years-partnership (accessed on 11 July 2025).
  37. Tenório Gouveia de Melo, M.; Barros, J.M.S.; Ribeiro, A.R.B.; Lima, T.L.A.; Sobral, M.F.F. The role of certifications and eco-labels in fisheries: A systematic literature review of their benefits and challenges. Environ. Sci. Eur. 2024, 36, 200. [Google Scholar] [CrossRef]
  38. Banomyong, R. Benchmarking Economic Corridors logistics performance: A GMS border crossing observation. World Cust. J. 2010, 4, 29–38. [Google Scholar] [CrossRef]
  39. Srivastava, P. Regional corridors development: A framework. J. Int. Commer. Econ. Policy 2013, 4, 1350012. [Google Scholar] [CrossRef]
  40. NEPAD. Central African Corridor Cross-Border Trade in Fish; African Union Development Agency (AUDA-NEPAD): Johannesburg, South Africa, 2016. [Google Scholar]
  41. WorldFish. Opening Avenues for Cross-Border Fish Trade in Africa. FishTrade for a Better Future Project. 2016. Available online: https://worldfishcenter.org/pages/opening-avenues-for-cross-border-fish-trade-in-africa/ (accessed on 15 July 2025).
  42. USAID. Indo-Pacific Economic Corridor (Ipec) Coordinated Regional Trade Analysis; U.S. Agency for International Development: Washington, DC, USA, 2015.
  43. Burki, S.J. The State of the Economy China Pakistan Economic Corridor Review and Analysis. 2017, p. 196. Available online: https://www.academia.edu/41208681/The_State_of_the_Economy_China_Pakistan_Economic_Corridor_Review_and_Analysis (accessed on 15 July 2025).
  44. Ali, M.R. Small-scale fisheries in Pakistan. In Small-Scale Fisheries in South Asia; National Agriculture Research Centre: Islamabad, Pakistan, 2018; p. 81. [Google Scholar]
  45. Ali, S. Identifying and Mitigating the Factors Causing Post-Harvest Losses in Supply Chain of Inland Fish Industry: A Study of Badin Fish Industrial Cluster. Int. J. Sci. Res. Eng. Dev. 2021, 4. Available online: https://ijsred.com/volume4/issue2/29-identifying-and-mitigating-the%20-factors-causing-post-harvest-losses-in-supply-chain-of-in-land-fish-industry-a-study-of-badin-fish-industrial-cluster.html (accessed on 15 July 2025).
  46. Abbas, G.; Khan, M.W.; Ahmed, M. Coastal and Marine Fisheries Management in. Coast. Mar. Fish. Manag. SAARC Ctries. 2013, 245. Available online: https://www.researchgate.net/publication/274251322_Coastal_and_Marine_Fisheries_Management_in_SAARC_Countries (accessed on 15 July 2025).
  47. Khan, S.R.; Ali, F.; Tanveer, A. A Supply Chain Analysis from Pakistan; International Institute for Sustainable Development: Winnipeg, MB, Canada, 2005. [Google Scholar]
  48. Kausar, R. Best management practices in aquaculture in pakistan. In Best Management Practices in Aquaculture; Aquaculture and Fisheries Program; National Agriculture Research Centre: Islamabad, Pakistan, 2017; p. 69. [Google Scholar]
  49. Javed, M.; Abbas, K. Inland fisheries and aquaculture in Pakistan. In Developing Sustainable Agriculture in Pakistan; CRC Press: Boca Raton, FL, USA, 2018; pp. 543–559. [Google Scholar]
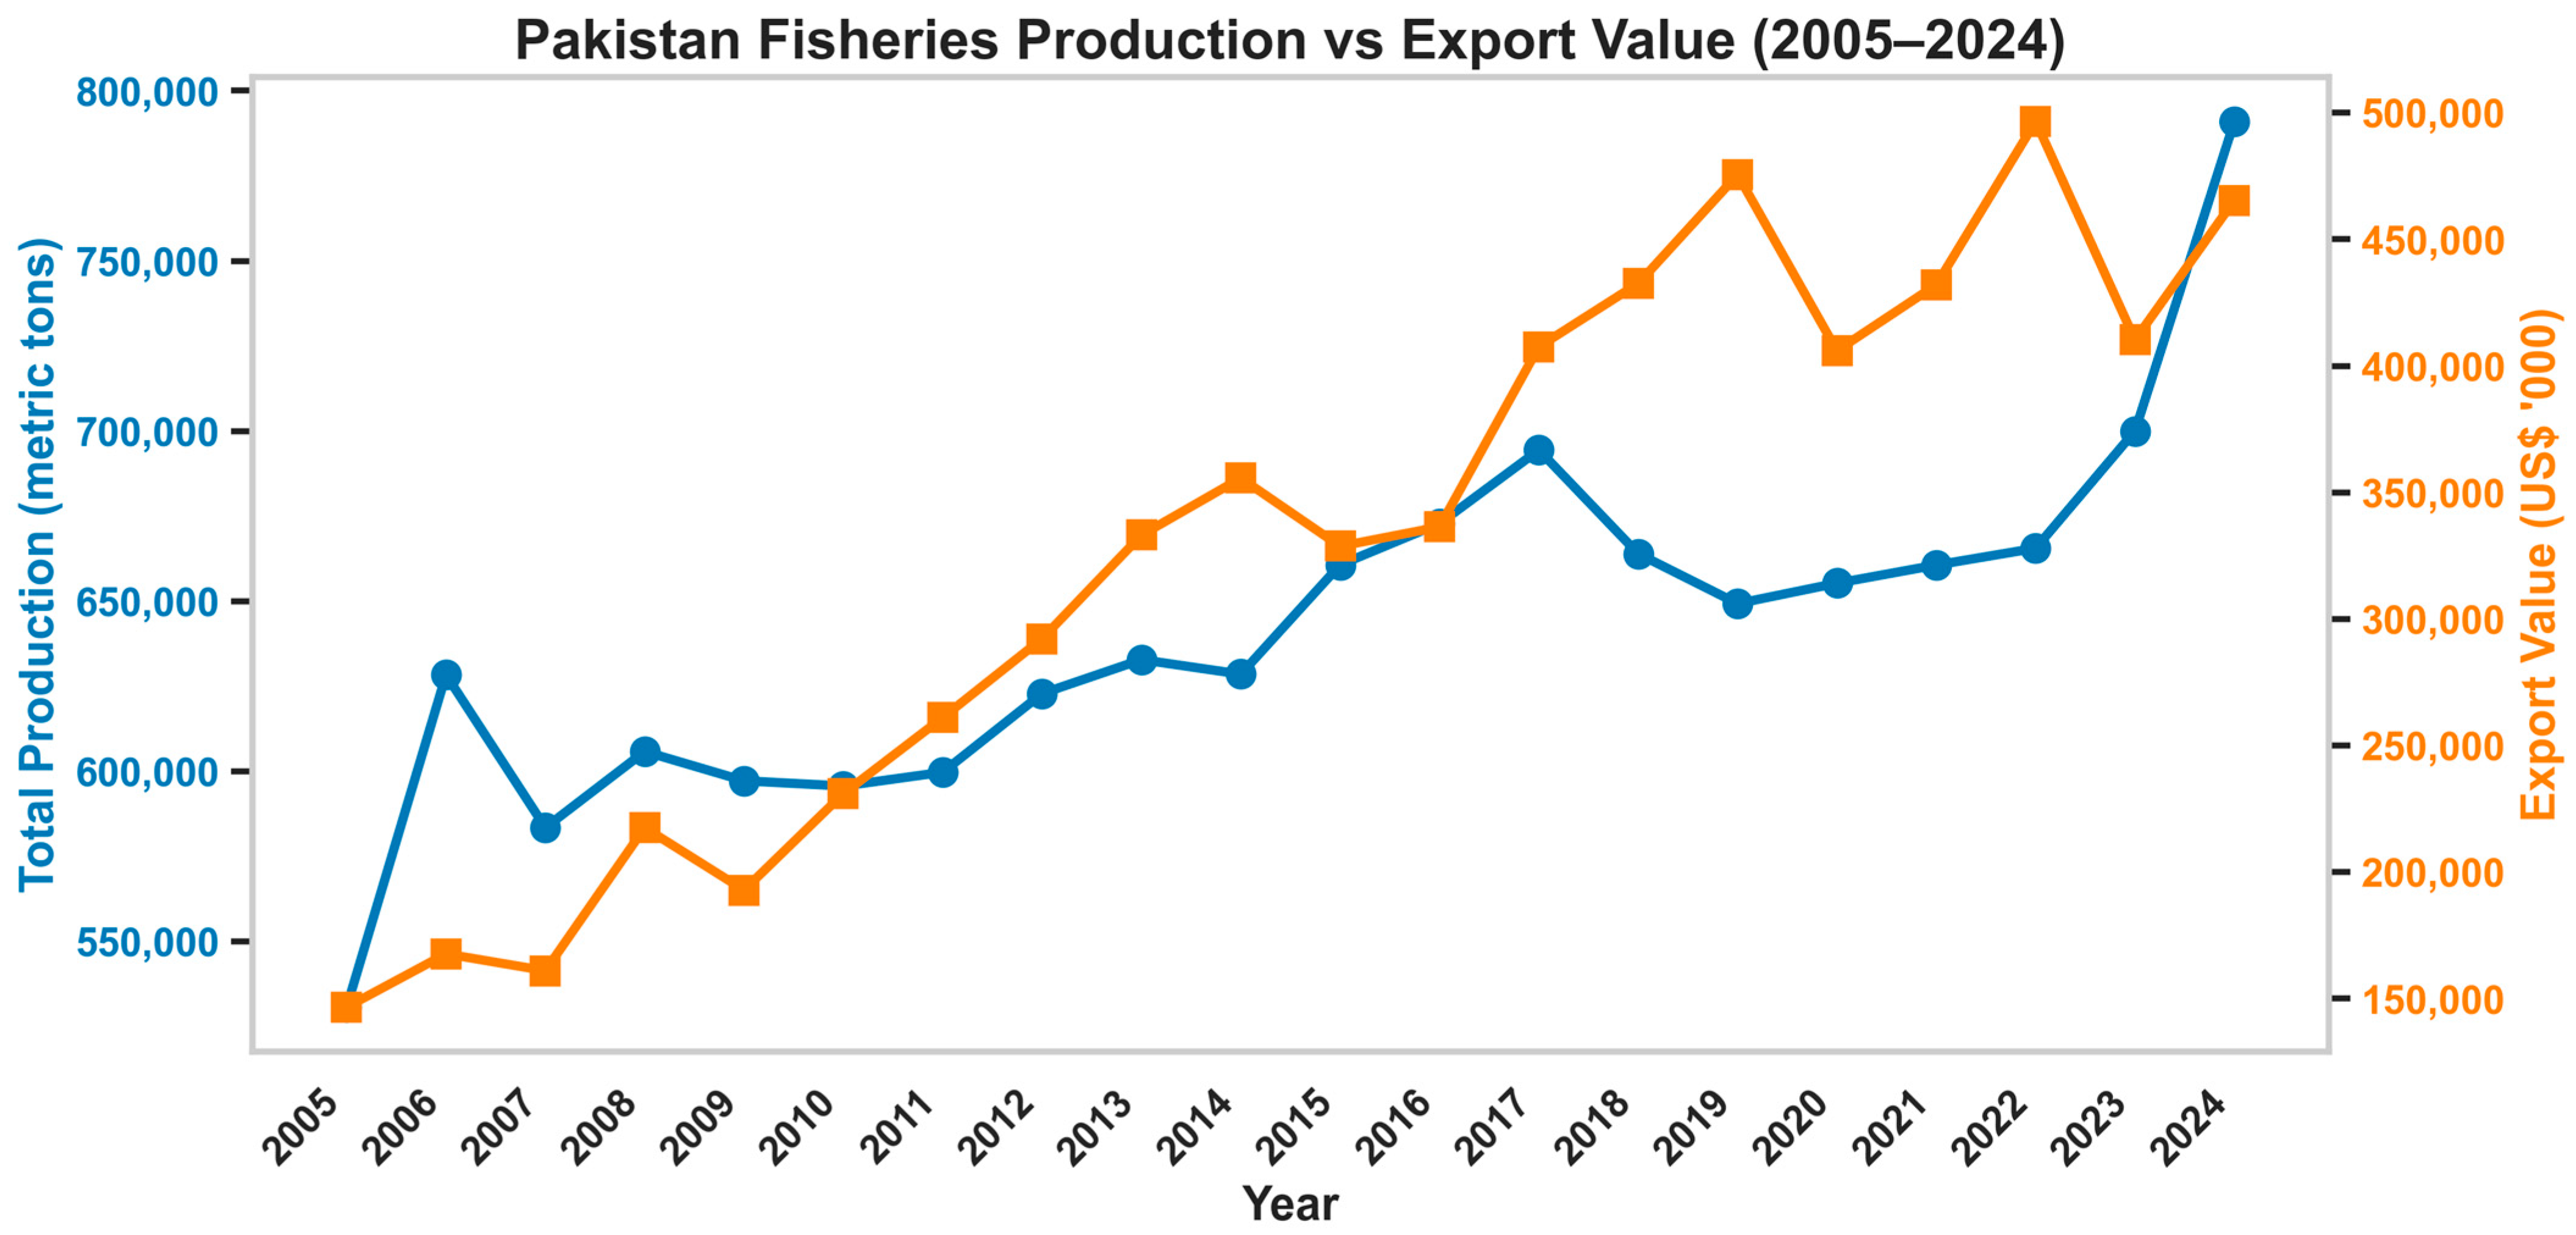
Figure 1. Fisheries production and export from Pakistan (2005–2024).
Sustainability 17 09121 g001
Figure 2. Contribution of Fisheries Sector to GDP of Pakistan at a constant price.
Sustainability 17 09121 g002
Figure 3. Model for the material and method for this research.
Sustainability 17 09121 g003
Figure 4. Pakistan’s fishery product exports to the top five Asian countries, 2005–2024 (Quantity/Value). The dashed line marks 2015 (onset of CPEC operational phase).
Sustainability 17 09121 g004
Figure 5. Country-specific time series of Pakistan’s fisheries exports, 2005–2024 (Quantity and Value).
Sustainability 17 09121 g005
Figure 6. Interrupted time series plot of Pakistan’s fisheries exports to China, Thailand, Japan, Vietnam, and Saudi Arabia (2005–2024). The dashed line marks 2015 (CPEC operational phase), with observed values compared to the counterfactual trend.
Sustainability 17 09121 g006
Figure 7. Difference-in-differences estimation of Pakistan’s fisheries export values (log scale) to treated markets (China and Thailand) relative to controls (Malaysia and Indonesia) for the period 2005–2024. The dashed line marks 2015 (CPEC operational phase).
Sustainability 17 09121 g007
Table 1. Statistical Analysis of Fish Export to the Top Five Asian Countries.
Countriesµ (y−1) S E x ¯ Confidence Interval
China87,239.65 *13,478.6359,028.55–115,450.75
Thailand61,364.60 *8630.3943,300.99–79,428.21
Vietnam40,277.45 *8875.8321,700.11–58,854.79
Saudi Arabia11,045.21 *1087.738759.98–13,330.44
Japan8454.00 *1027.526303.37–10,604.63
Total Exports208,380.91 *33,100.10139,093.00–277,668.82
* Estimated mean values are based on 20 observations per country. Thailand ranked second, importing an average of 61,364.60 MT annually (SE = 8630.39; CI = 43,300.99–79,428.21 MT). Vietnam followed with a mean of 40,277.45 MT per year (SE = 8875.83; CI = 21,700.11–58,854.79 MT). Among the Gulf countries, Saudi Arabia imported an average of 11,045.21 MT annually (SE = 1087.73; CI = 8759.98–13,330.44 MT). Japan received comparatively lower quantities, averaging 8454.00 MT per year (SE = 1027.52; CI = 6303.37–10,604.63 MT). Overall, the total mean export volume to the top five Asian countries was 208,380.91 MT per year, with an SE of 33,100.10 and a CI between 139,093.00 and 277,668.82 MT. These descriptive results highlight China’s dominance as a trading partner, followed by Thailand and Vietnam, while Japan and Saudi Arabia remained relatively smaller but stable import markets.
Disclaimer/Publisher’s Note: The statements, opinions and data contained in all publications are solely those of the individual author(s) and contributor(s) and not of MDPI and/or the editor(s). MDPI and/or the editor(s) disclaim responsibility for any injury to people or property resulting from any ideas, methods, instructions or products referred to in the content.