Article

Impact of Roof Configurations on Indoor Condensation in High-Humidity Environments

1
School of Architecture and Planning, Foshan University, Foshan 528225, China
2
School of Design, Foshan University, Foshan 528225, China
3
Guangdong Tianhui Architecture Technology Co., Ltd., Foshan 528225, China
*
Author to whom correspondence should be addressed.
Sustainability 2025, 17(20), 9112; https://doi.org/10.3390/su17209112 (registering DOI)
Submission received: 16 August 2025 / Revised: 30 September 2025 / Accepted: 11 October 2025 / Published: 14 October 2025
(This article belongs to the Special Issue Building Sustainability within a Smart Built Environment)

Abstract

In the subtropical regions of southern China, springtime is often characterized by persistently high humidity, leading to frequent condensation on building envelopes and interior surfaces. Top-floor rooms are particularly vulnerable due to their direct exposure to outdoor conditions through walls and the roof, making condensation prevention a critical concern. This study is grounded in the residential habits and spatial preferences of southern Chinese residents and evaluates three roof configurations—standard, thickened, and green roofs—using EnergyPlus (v22.1.0) simulation software to analyze their effects on indoor relative humidity levels in top-floor spaces. The results demonstrate that green roof systems significantly reduce indoor relative humidity, especially in high-rise residential buildings. Taking a 30-story residential building as an example, with a conventional roof, the indoor relative humidity remains at 100% for extended periods during high-risk condensation intervals, resulting in surface condensation. In contrast, when a green roof with a soil depth of 70 cm and daylilies at a height of 100 cm is used, the peak indoor maximum relative humidity is reduced by 10–40%, and the duration of condensation decreases to zero. Among the factors involved in green roofs, including plant height, soil depth, and leaf area index (LAI), soil depth shows a significant negative correlation with the maximum indoor relative humidity (correlation coefficient r = −0.987, p < 0.01), while the LAI exhibits a positive correlation with the maximum indoor relative humidity (r = 0.180, p < 0.05). Selecting plant species with a low LAI and increasing soil depth are effective passive strategies for humidity control and condensation prevention. These findings establish a basis for optimizing building environmental models and propose passive design strategies to enhance overall performance. In addition, the study highlights how roof greening contributes to global sustainability goals, particularly SDG 3 (Good Health and Well-being), SDG 11 (Sustainable Cities and Communities), and SDG 13 (Climate Action), by improving indoor comfort, enhancing resilience, and reducing climate-related risks.

1. Introduction

1.1. Adverse Impacts of Moisture and Condensation on Indoor Environments

The increasing emphasis on sustainable building practices has highlighted the need for innovative building envelope designs that enhance indoor environmental quality while minimizing energy consumption. One critical aspect of indoor environmental quality is the regulation of indoor humidity levels and the prevention of condensation, which are essential for maintaining occupant comfort and health, as well as preserving the integrity of building materials.
Whether in Europe or China, indoor humidity levels are important indicators affecting air quality and health predictions [1]. In a high-humidity environment, condensation on the inner surfaces of walls and ceilings can impact thermal performance, as the thermal conductivity coefficient of materials increases with moisture content, hindering building insulation. Additionally, condensation on the inner surfaces of enclosures can easily lead to mold growth, posing a health threat to occupants [2,3,4]. Finally, if mold penetrates the structure, it can damage the building and reduce its lifespan [5].

1.2. Causes of Condensation

Issues such as moisture and condensation occur not only in cold regions but also in hot, humid, or tropical areas [6]. The causes of condensation vary: in cold regions, warm, moist air generated by human activities and heating exchanges heat with colder enclosure structures, causing the air to cool. As a result, its capacity to hold moisture decreases, leading to condensation on the surfaces of the enclosures [7,8]. Conversely, in hot and humid climates, external air with high moisture content can condense on cooler indoor surfaces [9]. In southern China, such as Guangdong and Guangxi provinces, humid weather frequently occurs from February to April in the spring [10,11,12,13,14,15]. This phenomenon is characterized by very humid external air entering indoors and condensing on the cooler surfaces of buildings, leading to the formation of large amounts of water droplets on walls, floors, and ceilings. This results in slippery floors, damp clothes that do not dry, moldy walls, moist bedding, and fogged windows, causing significant inconvenience to daily life.

1.3. Condensation Prevention Measures

To reduce the occurrence of condensation, two conditions could be addressed: high-humidity air and cold interior surfaces of enclosure structures. One approach is to reduce indoor air humidity. Pre-treating the high-humidity air entering indoors to lower its moisture content [16,17] or using dehumidification equipment to decrease indoor air humidity can help achieve a comfortable humidity level and reduce the probability of condensation [18]. By integrating sensors with dehumidification or air conditioning systems, indoor humidity can be maintained within a comfortable range [19]. Traditional vapor compression air conditioning systems cool the air below the dew point, causing moisture to condense on cooling coils, and then the dehumidified air must be reheated to the desired temperature. This process essentially shifts the condensation from the enclosure structures to the cooling coils and requires substantial energy for cooling and reheating. In contrast, using desiccant dehumidification systems can reduce energy consumption by approximately 30% [20]. Desiccants can be solid (silica gel, molecular sieves) or liquid (lithium chloride, calcium chloride). Their working principle involves absorbing moisture from the air, thereby reducing air humidity. The desiccants are regenerated using high-temperature air to desorb the water vapor from solid desiccants or by concentrating diluted liquid desiccants, allowing for the cyclic use of desiccants [21,22,23].
The second approach is to raise the interior surface temperature of the enclosure structures by increasing thermal resistance or using heating methods [18]. Paul Klõšeiko et al. [24] conducted a renovation test using four different insulation materials in a historic building preservation project in cold climates. They found that calcium silicate and aerated concrete materials could raise the interior surface temperature while demonstrating good humidity control under high-humidity loads. Yena Chae et al. [25] selected a range of passive (e.g., insulation and airtightness improvements) and active (e.g., air conditioning system updates) measures in a modern heritage school in Korea to improve energy performance while avoiding condensation risks. Russell Richman et al. [26] applied the Reduced Gradient Algorithm (RGA) to museum buildings, adjusting indoor temperatures to minimize the vapor pressure difference between the inside and outside of the building envelope, thereby reducing condensation. Jassen et al. [27] simulated building condensation in cold climates and found that increasing the thermal resistance of the roof system and using breathable layers can significantly reduce condensation risk. June Hae Lee and Myoung Souk Yeo [28] developed a simulation model based on field measurement data to evaluate the effectiveness of applying insulation panels and ventilation measures. They used real-time sensor control strategies to dynamically adjust doors and ventilation systems, reducing condensation time. Deok-Oh Woo and Lars Junghans [29] propose a novel model predictive control (MPC)-based surface condensation prevention framework that can accurately predict the occurrence of surface condensation for thermo-active building systems (TABS). When the coupled dynamic model indicates a potential risk of developing surface condensation, the MPC framework will raise the surface temperature for the TABS to avoid surface condensation.
From the above studies, we find that both active equipment, such as air conditioning, and optimized passive design can reduce the occurrence of condensation. In the renovation and use of historic buildings, precise tracking and control of temperature and humidity are required [24,25,30], whereas there are no such mandatory requirements for residential buildings. In office and commercial buildings, operators are willing to pay higher electricity costs to use active equipment to maintain comfortable humidity levels, considering the potential benefits of improving the indoor environment, such as cost savings from improved health or productivity [31], or increased revenue from attracting foot traffic. However, for ordinary residences, residents are generally unwilling to incur high electricity costs for using dehumidifiers or air conditioners and do not require precise humidity control. Therefore, reducing reliance on active equipment and adopting passive design strategies to improve humid environments to some extent is a more suitable approach for aligning with residents’ habits and energy-saving goals.

1.4. Limitations of Passive Approaches in Condensation Prevention Research

In southern China, particularly in regions such as Guangdong, Guangxi, and Hainan, residents generally do not use heating during spring and winter, and thus tend to rely on natural ventilation. This allows warm and humid spring air to easily enter indoor spaces, significantly increasing the likelihood of condensation. Meanwhile, residents demonstrate a low willingness to regulate indoor humidity through air conditioning and generally exhibit a stronger preference for passive design strategies. A study by Azra Korjenic [32] shows that there is a substantial difference in indoor relative humidity between naturally ventilated and mechanically ventilated environments. Existing research on condensation prevention primarily focuses on factors such as fresh air volume, moisture-absorbing materials, and heating systems, which differ significantly from the actual living habits of residents in southern China. For instance, research by Menghao Qin et al. [33] indicates that even with the use of advanced moisture-regulating materials such as Metal–Organic Frameworks, effective humidity control in humid climates—such as Mediterranean, temperate, or subtropical regions—requires the suspension of night-time ventilation or the implementation of thermal regeneration systems. This demonstrates that the effectiveness of moisture-absorbing materials is limited under natural ventilation conditions. Shijun You [6] proposed a condensation prevention strategy that involves maintaining continuous operation of the air conditioning system with a constant supply airflow to sustain positive indoor pressure, enabling return air to circulate and remove excess moisture from infiltrated air. Therefore, current condensation prevention studies tend to overlook conditions involving natural ventilation and higher air exchange rates, which diverges considerably from the living practices of residents in southern China.
Indoor condensation is primarily caused by warm and humid outdoor air; therefore, the greater the surface area of contact between the building and the external environment, the risk of condensation is higher. As the building’s “fifth facade”, the roof—along with the space beneath it—is significantly affected by humid air and thus requires targeted condensation prevention strategies. Green roofs have become an increasingly adopted trend in sustainable building design. Issa Jaffal [34] simulated the impact of varying leaf area indices on indoor thermal conditions and energy consumption. C.Y. Jim [35,36] conducted monitoring studies on green roofs in a subtropical climate, comparing how different plant species such as sedum and peanuts influence indoor thermal conditions and energy consumption across seasons. These studies demonstrate a growing awareness of how vegetation and soil affect indoor temperature and energy performance, yet relatively few have assessed their impact on indoor humidity levels.
In response to these limitations, this study integrates the actual living habits of residents in southern China and selects typical residential building types in the Guangdong region. Focusing on the roof—a vulnerable interface exposed to the external environment—three roof configurations are examined: conventional roofs, thickened roofs, and green roofs. Indoor humidity dynamics under each condition are simulated using Energy-Plus (v22.1.0) software. The objectives of this study are as follows: (1) to compare the effects of different roof structures on indoor relative humidity; (2) to assess how various vegetation parameters influence indoor humidity; and (3) to propose passive design strategies, based on simulation results, for reducing indoor condensation risks in high-humidity environments.
The remainder of this paper is structured as follows: First, a base building model and occupant behavior parameters are established based on actual usage conditions in southern China. Next, roof construction parameters corresponding to different roof types are defined, and indoor humidity simulations are conducted using Energy-Plus. The impact mechanisms of roof construction parameters on indoor relative humidity are then analyzed and interpreted. Finally, design guidelines for condensation prevention are proposed to support the development of comfortable and moisture-resilient residential environments.

2. Methods and Data

2.1. Condensation Verification Procedure

The interior surface temperature of the building envelope is calculated as:
θ n = t n R n R o t n t w
In Equation (1), θn [°C] is the interior surface temperature of the envelope; tn [°C] is the indoor air dry-bulb temperature; Rn [m2·K/W] is the internal surface thermal resistance of the envelope; Ro [m2·K/W] is the total thermal resistance of the envelope; and tw [°C] is the indoor air dry-bulb temperature.
The indoor dew point temperature, denoted as Td, can be calculated using the Magnus–Tetens approximation. The Magnus–Teten formula is expressed as:
a = E 0 × 10 a × T d b + T d
It can be rearranged as:
T d = b × log e E 0 a log e E 0
In Equations (2) and (3): e [hPa] is the saturated vapor pressure at temperature Td; E0 is the saturated vapor pressure at 0 °C, taken as 6.1078 hPa; and a and b are empirical coefficients, with values of 7.69 and 243.92, respectively.
The saturation vapor pressure over a flat water surface, Ew, is calculated using the following equation:
log E w = 10.79574 ( 1 T 1 / T ) 5.02800 log T / T 1 + 1.50475 × 10 4 [ 1 10 8.2969 T / T 1 1 + 0.42873 × 10 3 [ 10 4.76955 ( 1 T / T 1 ) 1 ] + 0.78614
where Ew [hPa] is the saturation vapor pressure over a flat water surface; T1 [K] is the triple point temperature of water, equal to 273.16 K; and T [K] is the absolute temperature, given by T = 273.15 + t, and t [°C] is the temperature in degrees Celsius.
The saturation vapor pressure over a flat ice surface, Ei, is calculated using the following equation:
log E i =     9.09685 T 1 T 1     3.56654 log ( T 1 / T )   +   0.87682 [ 1 T 1 / ( T   1 ) + 0.78614 ]
The water vapor pressure can be calculated from the relative humidity using the following equation:
e = U E w / 100
In Equation (6), U [%] is the relative humidity, and Ew [hPa] is the saturation vapor pressure over a flat water surface at dry-bulb temperature t.
The indoor dew point temperature (Td) can be calculated using Equations (3)–(6). When the interior surface temperature (θn) is less than or equal to Td, condensation will occur on the inner surface of the envelope. Therefore, condensation is the result of the combined effect of indoor air humidity and temperature.

2.2. Simulation Scenario Parameters

Guangdong Province, located in a low-latitude region of China, experiences a subtropical monsoon climate. During the spring season (February to April), the area frequently encounters return moisture weather conditions, which often lead to indoor condensation. This study conducts modeling and simulation based on typical residential configurations, occupant behavior patterns, and floor plan layouts commonly found in Guangdong. The simulation setup encompassed multiple aspects, including the base building model, occupant activity schedules, envelope parameters, roof construction parameters, plant characteristics, and meteorological data, as detailed below.

2.2.1. Base Building Model

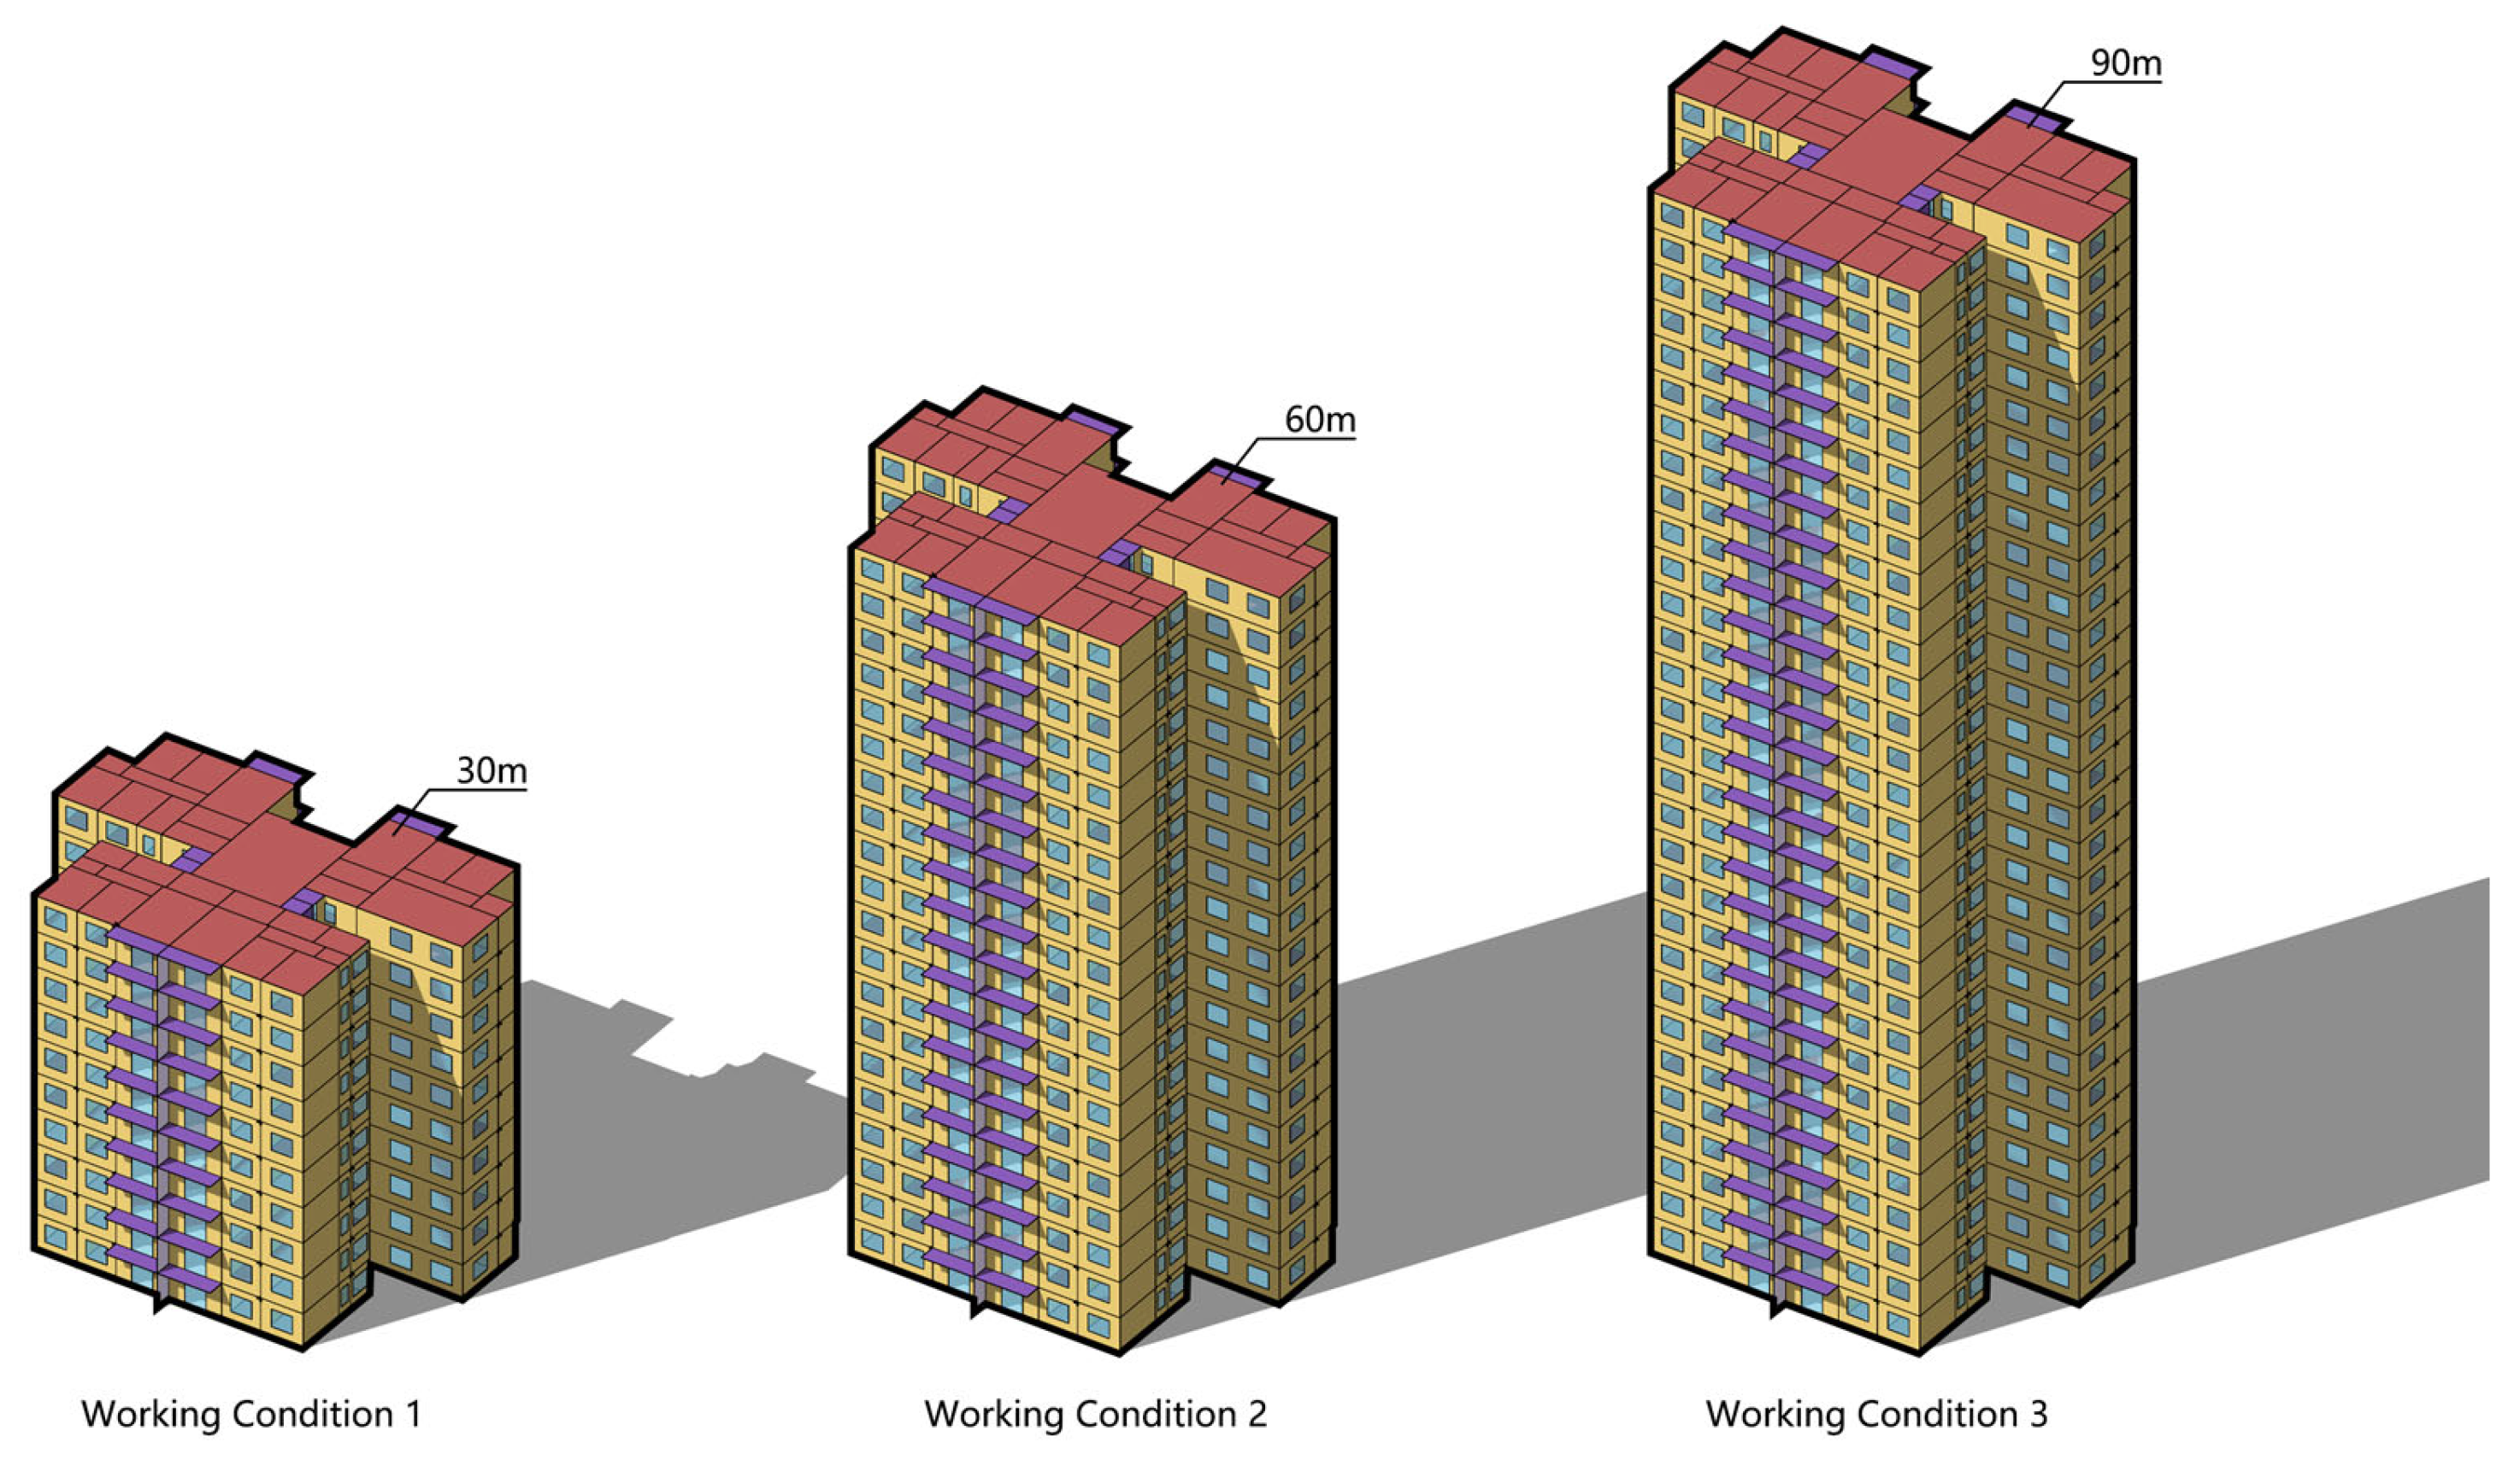
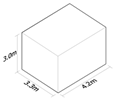
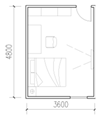
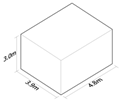
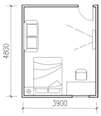
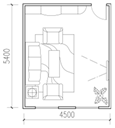
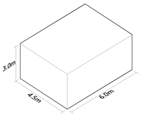
Based on an analysis of floor plan cases from 36 residential communities in Guangzhou and Foshan [37], this study categorizes the dimensions and layouts of living rooms, bedrooms, and bathrooms, and identifies eight representative room sizes that broadly cover common residential functions such as kitchens, bedrooms, studies, and living rooms (Table 1). In light of housing development trends in major cities of Guangdong Province (e.g., Guangzhou, Shenzhen, and Foshan), most newly constructed residential buildings are high-rise, among which tower-type buildings constitute a significant proportion. This study employs the eight representative room types to construct a standard floor plan for a two-elevator, four-unit per floor tower-type residential building as the simulation model (Figure 1). The building heights are set to 30 m, 60 m, and 90 m, respectively (Figure 2), to investigate the impact of various measures on indoor humidity levels in top-floor units. Among the layouts, Unit Types 1 and 2 have a floor area of 100.4 m2 (suitable for a family of four), while Unit Types 3 and 4 measure 137.1 m2 (suitable for a family of six). The main rooms, including the living room and bedrooms, are oriented along the north-south axis. The floor-to-ceiling height is 3 m, with two window sizes: 0.9 m × 1.5 m and 1.8 m × 1.5 m. The window-to-wall ratio is 0.17 on the south side and 0.14 on the north side.
The determination of building height in this study was based on two main considerations. First, according to common classifications in the Chinese housing market, residential buildings with 7 to 11 stories are typically referred to as “mid-rise buildings.” Assuming the previously common floor-to-floor height of approximately 2.8 m, the total height would be around 30.8 m. Second, it is noteworthy that the Residential Project Specifications (GB 55038-2025) [38], which came into effect on 1 May 2025, specifies that the floor height of newly constructed residential buildings shall not be less than 3 m.
To balance both the current market status and new regulatory requirements, while simplifying the model, this study set the baseline building height (Condition 1) at 30 m. Based on this reference, comparative conditions were further defined at 60 m (double) and 90 m (triple) (see Figure 2), enabling a systematic exploration of the influence of building height on indoor humidity conditions.

2.2.2. Occupant Activity and Envelope Parameters

Based on the lifestyle habits of Guangdong residents, indoor occupant activities were defined accordingly (Table 2). The power loads for appliances and lighting, as well as the number of occupants, were configured for each functional room according to typical daily usage patterns (Table 3). Simulation results of natural ventilation in residential buildings by Zhiyong Wu [39] indicate that, under sufficient pressure differentials, the air change rate can exceed 10 air changes per hour (ACH). Therefore, a ventilation rate of 10 ACH is adopted in this study. Referring to national standards such as the Thermal Design Code for Civil Building (GB 50176-2016) [40] and typical construction practices in southern China, this study set the thermal parameters for various envelope components—including interior and exterior walls, floors, and windows and doors (Table 4).

2.2.3. Roof Model

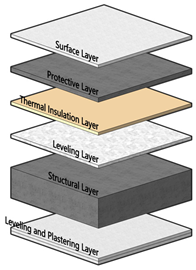
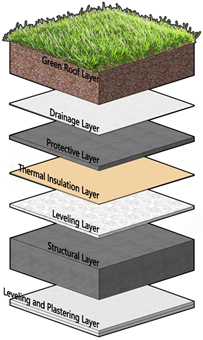
This study designs three types of roof structures—standard roof, thickened roof, and green roof (Table 5 and Table 6)—to compare their impacts on the indoor environment. The standard roof consists of four layers: reinforced concrete slab, insulation layer, protective layer, and surface layer. The thickness of the reinforced concrete slab is 100 mm. The green roof design in this study incorporates trees, shrubs, and ground cover. Due to the increased structural load, the roof must support soil depth for root systems, vegetation loads, and pedestrian loads. According to Load Code for the Design of Building Structures in China (GB 50009-2012) [41], the standard live loads for inaccessible roofs, accessible roofs, and rooftop gardens are 0.5 kN/m2, 2.0 kN/m2, and 3.0 kN/m2, respectively. Therefore, this study adopts a 200 mm-thick cast-in-place C40 reinforced concrete roof structure with a total load-bearing capacity of up to 15 kN/m2, which fully meets the structural requirements of rooftop gardens. The green roof structure is based on the design from the Chinese Standard Design Atlas Planting Roof Building Construction (14J206), which is commonly used for green roofs in Guangdong Province. The thickened roof shares the same structural layers as the standard roof but increases the thickness of the reinforced concrete to 200 mm to enhance load-bearing capacity.

2.2.4. Plant Parameters

This study proposes to include trees, shrubs, and ground covers in the green roof design. Given the hot climate of Guangdong and the typical conditions of rooftop gardens—such as prolonged sunlight exposure, arid and nutrient-poor soils, extreme temperatures, and strong winds—it is necessary to carefully select appropriate plant species. Zheng Kaiyu et al. [42] conducted a survey of rooftop garden vegetation in Guangzhou and recommended 36 plant species suitable for rooftop greening. Wang Liyuan [43] evaluated the overwintering and oversummering performance, cooling effects, and substrate influence on the growth of four ground cover species in Guangzhou. Based on the results, Sedum sarmentosum and Sedum lineare were recommended for rooftop greening. Drawing on previous research and considering dominant plant species commonly found in Guangdong, two tree species, two shrub species, and three ground cover species were selected for the experimental study.
Due to software limitations that cap the maximum plant height at 1 m and the maximum leaf area index (LAI) at 5, the heights of trees and shrubs were set to 1 m, while the heights of ground cover plants were assigned based on their actual dimensions. Leaf emissivity and reflectivity values were adopted from the study by Feng Chi [44]. The LAI of Ficus microcarpa was obtained from Ke Feng’s study [45]; the LAIs of Magnolia grandiflora, Hibiscus mutabilis, and Rosa chinensis were derived from Zhao Shengqiong’s research [46]; and the LAIs of Hemerocallis and Zoysia matrella were referenced from Zhuang Dawei’s findings [47]. Due to software constraints, the LAI was capped at 5. The LAI for Sedum lineare was taken from Feng Chi’s research [44]. The minimum stomatal resistance for the selected plant species generally ranges from 100 to 200 s/m with little variation; therefore, a uniform average value of 150 s/m was adopted [46]. Detailed parameters for each plant species are listed in Table 7.
To further clarify the influence of factors such as plant height and soil thickness on the indoor environment, two additional sets of single-factor experiments were designed. The selected plant species for the experiments is Hemerocallis (daylily), a perennial herbaceous plant that can exceed 1 m in height and reach a leaf area index of up to 30 [46], providing a wide range for parameter variation. In the experiments, the LAI of Hemerocallis was fixed at 5. Plant height was incrementally varied from 20 cm to 100 cm in 10 cm intervals, while soil thickness was adjusted from 15 cm to 70 cm in 5 cm increments.

2.2.5. Meteorological Parameters

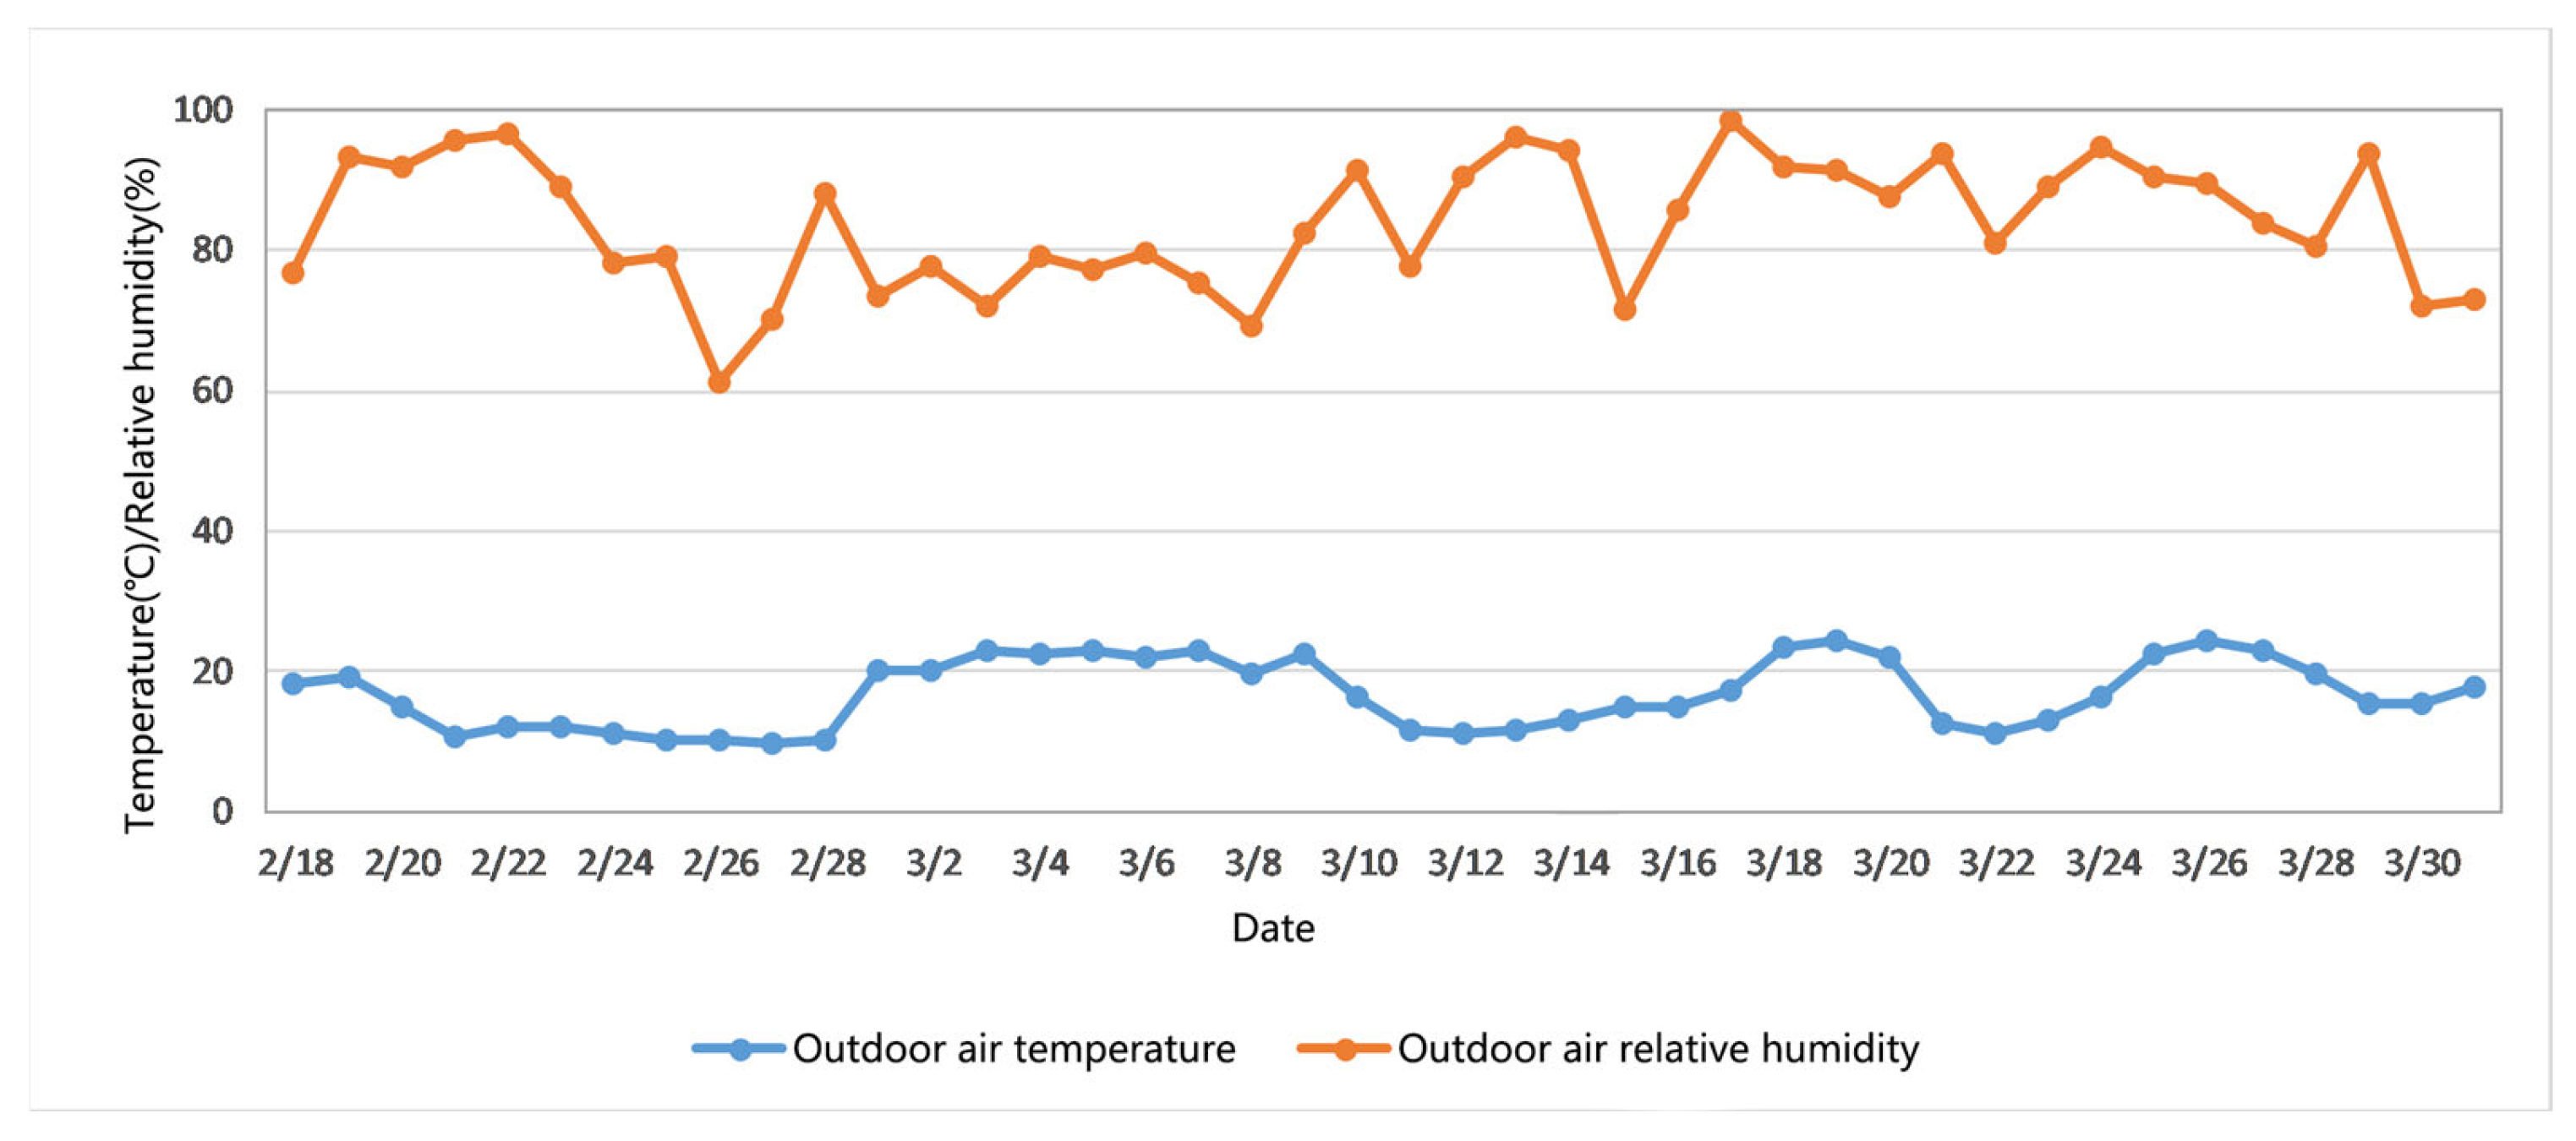
This study uses the Chinese Standard Weather Data (CSWD), an hourly typical meteorological year dataset jointly developed by the National Meteorological Information Center of the China Meteorological Administration and Tsinghua University, with data for Guangzhou serving as the basis for simulation. According to the research of Meimei Guo et al. [10,12], two conditions are required for indoor condensation to occur: first, a prolonged period of low temperatures, with a daily average temperature of ≤12 °C persisting for at least three consecutive days; second, a sudden shift in weather conditions, where the temperature and humidity rise sharply following the cold period. Based on the above meteorological characteristics, the period from 18 February to 31 March was selected as the simulation timeframe (Figure 3).

2.3. Software

This study employed EnergyPlus as the core tool for building energy consumption and indoor thermo-hygrometric environment simulation. Developed jointly by the U.S. Department of Energy and Lawrence Berkeley National Laboratory (LBNL), EnergyPlus is widely recognized internationally as one of the most advanced, full dynamic building energy simulation programs, and is frequently used for green roof simulations [48,49].
In terms of simulation accuracy, EnergyPlus provides several physical models to describe heat and moisture transfer through building envelopes, including the Conduction Transfer Function (CTF), Effective Moisture Penetration Depth (EMPD), and Heat and Moisture Transfer (HAMT) models. These three approaches differ in their computational principles, applicable conditions, and levels of accuracy (Table 8). Among these, the Heat and Moisture Transfer (HAMT) model is the only one based on a fully transient thermo-hygrometric transfer mechanism [50]. By solving the coupled partial differential equations for heat and mass transfer, it realistically reproduces moisture migration, storage, and its impact on heat conduction in porous media. Compared with traditional heat-balance-based models, such as the Conduction Transfer Function (CTF) model, or empirical moisture models like the Effective Moisture Penetration Depth (EMPD) model, HAMT demonstrates significant advantages under high-humidity climatic conditions. It can more accurately capture the dynamic coupling effects between building envelopes and indoor air humidity, which is critical for addressing the springtime high-humidity and condensation-prone conditions of southern China targeted in this study.
Several previous studies have validated the accuracy of HAMT through empirical data and model comparison. Qin et al. [54] found that in hot and humid climates, hygroscopic materials modeled by HAMT effectively regulate indoor relative humidity without significantly affecting cooling loads. Their study, using measured data from Nanjing (June–August 2013) to validate three models, showed that the temperature deviation between measurements and HAMT simulations remained within 3%, outperforming the other two models (CTF and EMPD, both with deviations around 4.5%). For humidity prediction, HAMT also showed the best consistency with measurements. Similarly, recent work by Flechas et al. [55] compared measured and simulated results for cross-laminated timber (CLT) wall assemblies, demonstrating that EnergyPlus’s four envelope heat transfer algorithms (HAMT, CTF, EMPD, and CondFD) accurately predict wall heat flux, with HAMT performing best for moisture content prediction—particularly in one-dimensional validation scenarios.
In summary, given HAMT’s advantages in accuracy under hot-humid climates, its physically based representation of hygroscopic processes, and its recent experimental validation, this study adopted the HAMT model in EnergyPlus as the simulation core. This ensures that results on the effects of different roof parameters (thickness, greening, soil properties) on indoor temperature and humidity are reliable and accurate, providing effective decision support for condensation-prevention design in high-humidity regions.
All correlation analyses, regression fitting, and related statistical tests were conducted using Python 3.8 with the SciPy library.

3. Results

3.1. The Influence of Roof Form on Indoor Air Relative Humidity

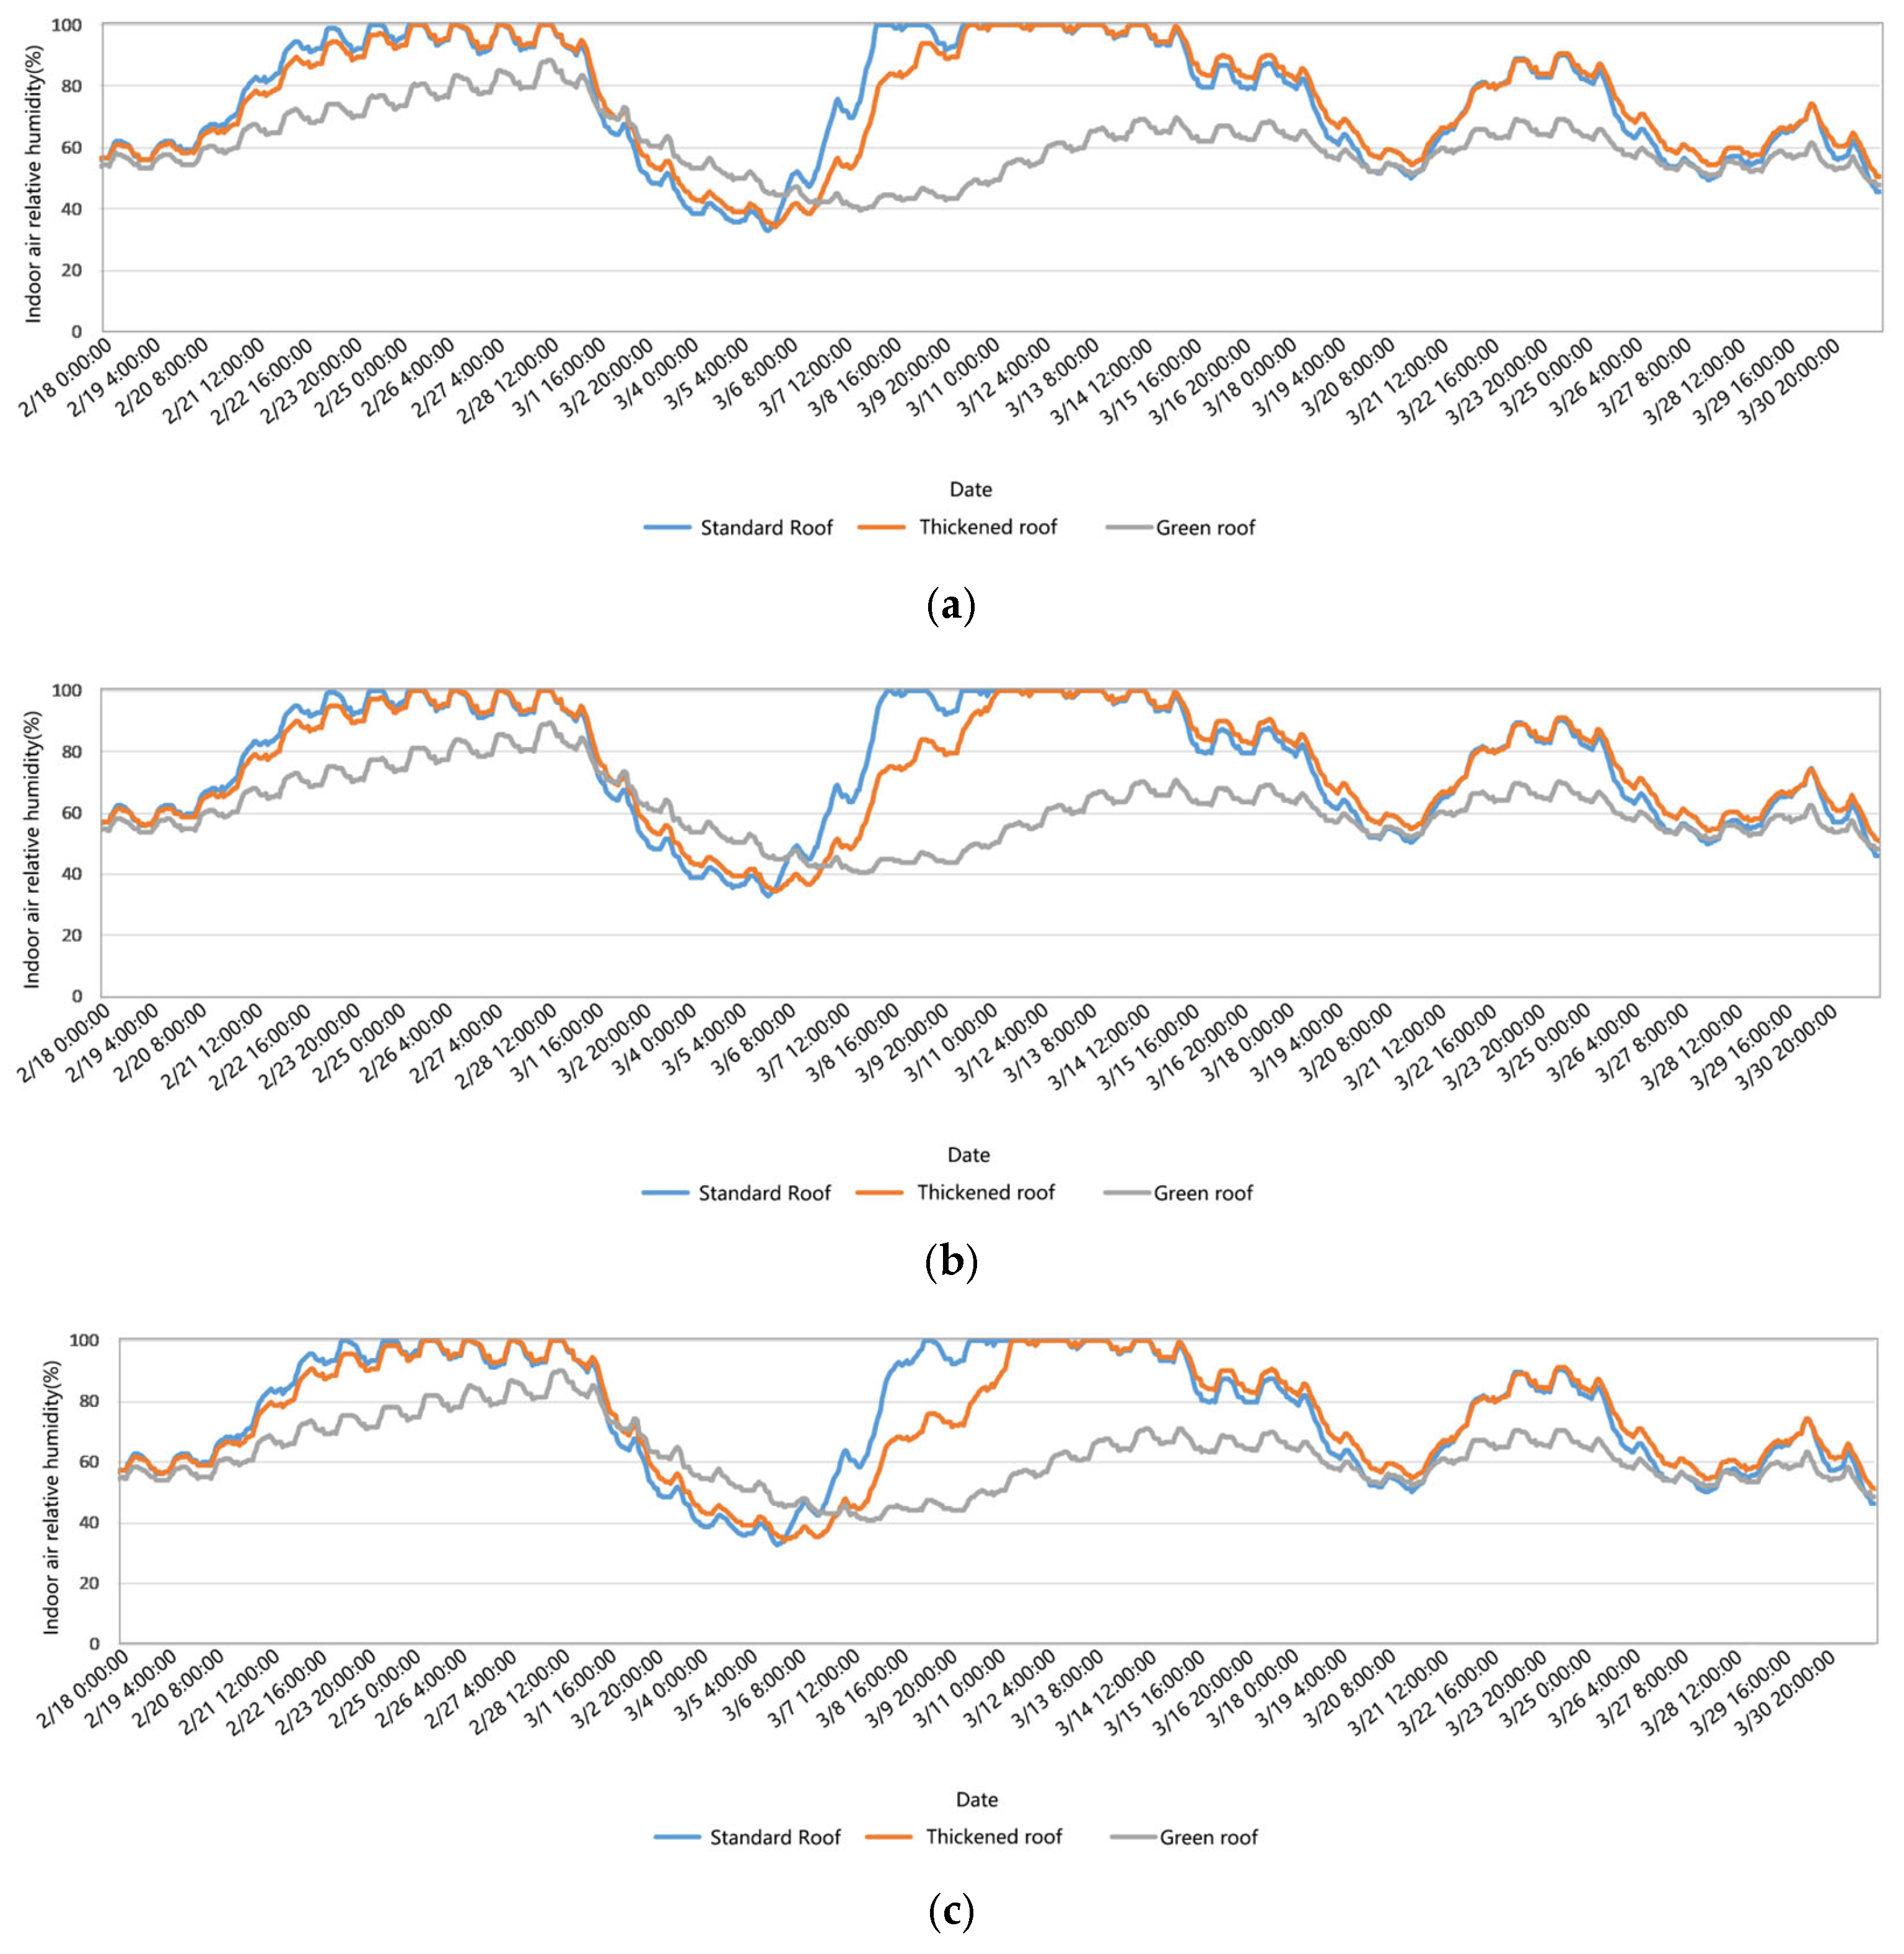
When the building heights are set to 30 m, 60 m, and 90 m, the indoor relative humidity levels of the top-floor rooms (10th, 20th, and 30th floors, respectively) are observed (Figure 4). The results indicate two high-risk periods for condensation during the simulation: the first from 22 February to 1 March, and the second from 6 March to 15 March.
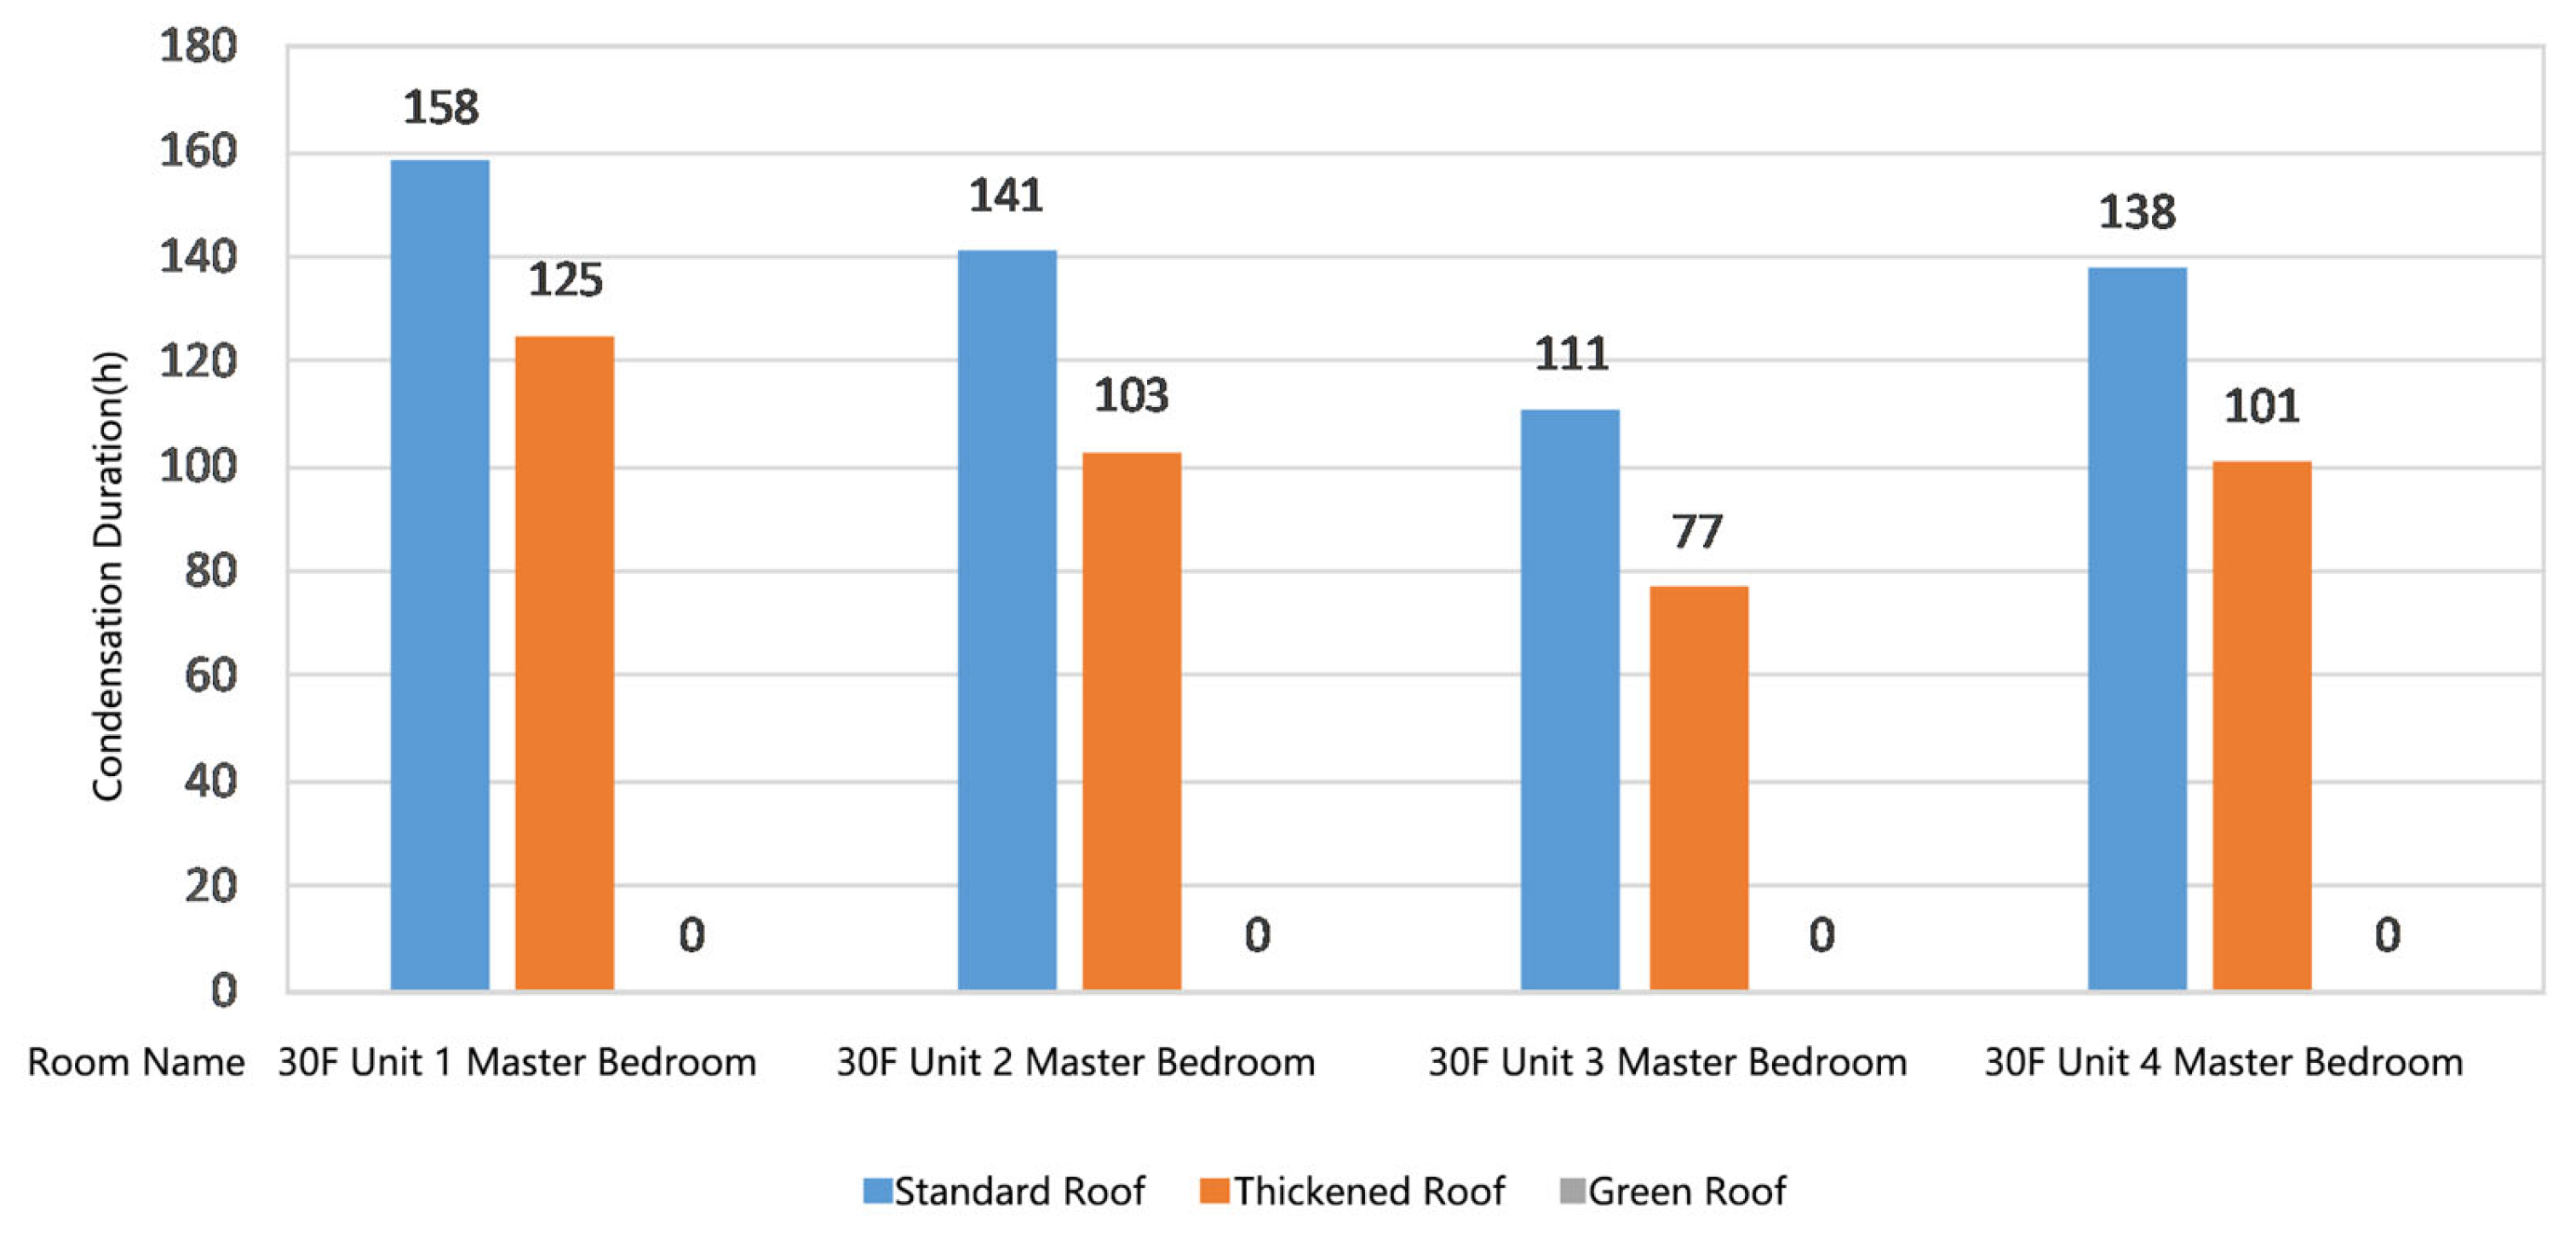
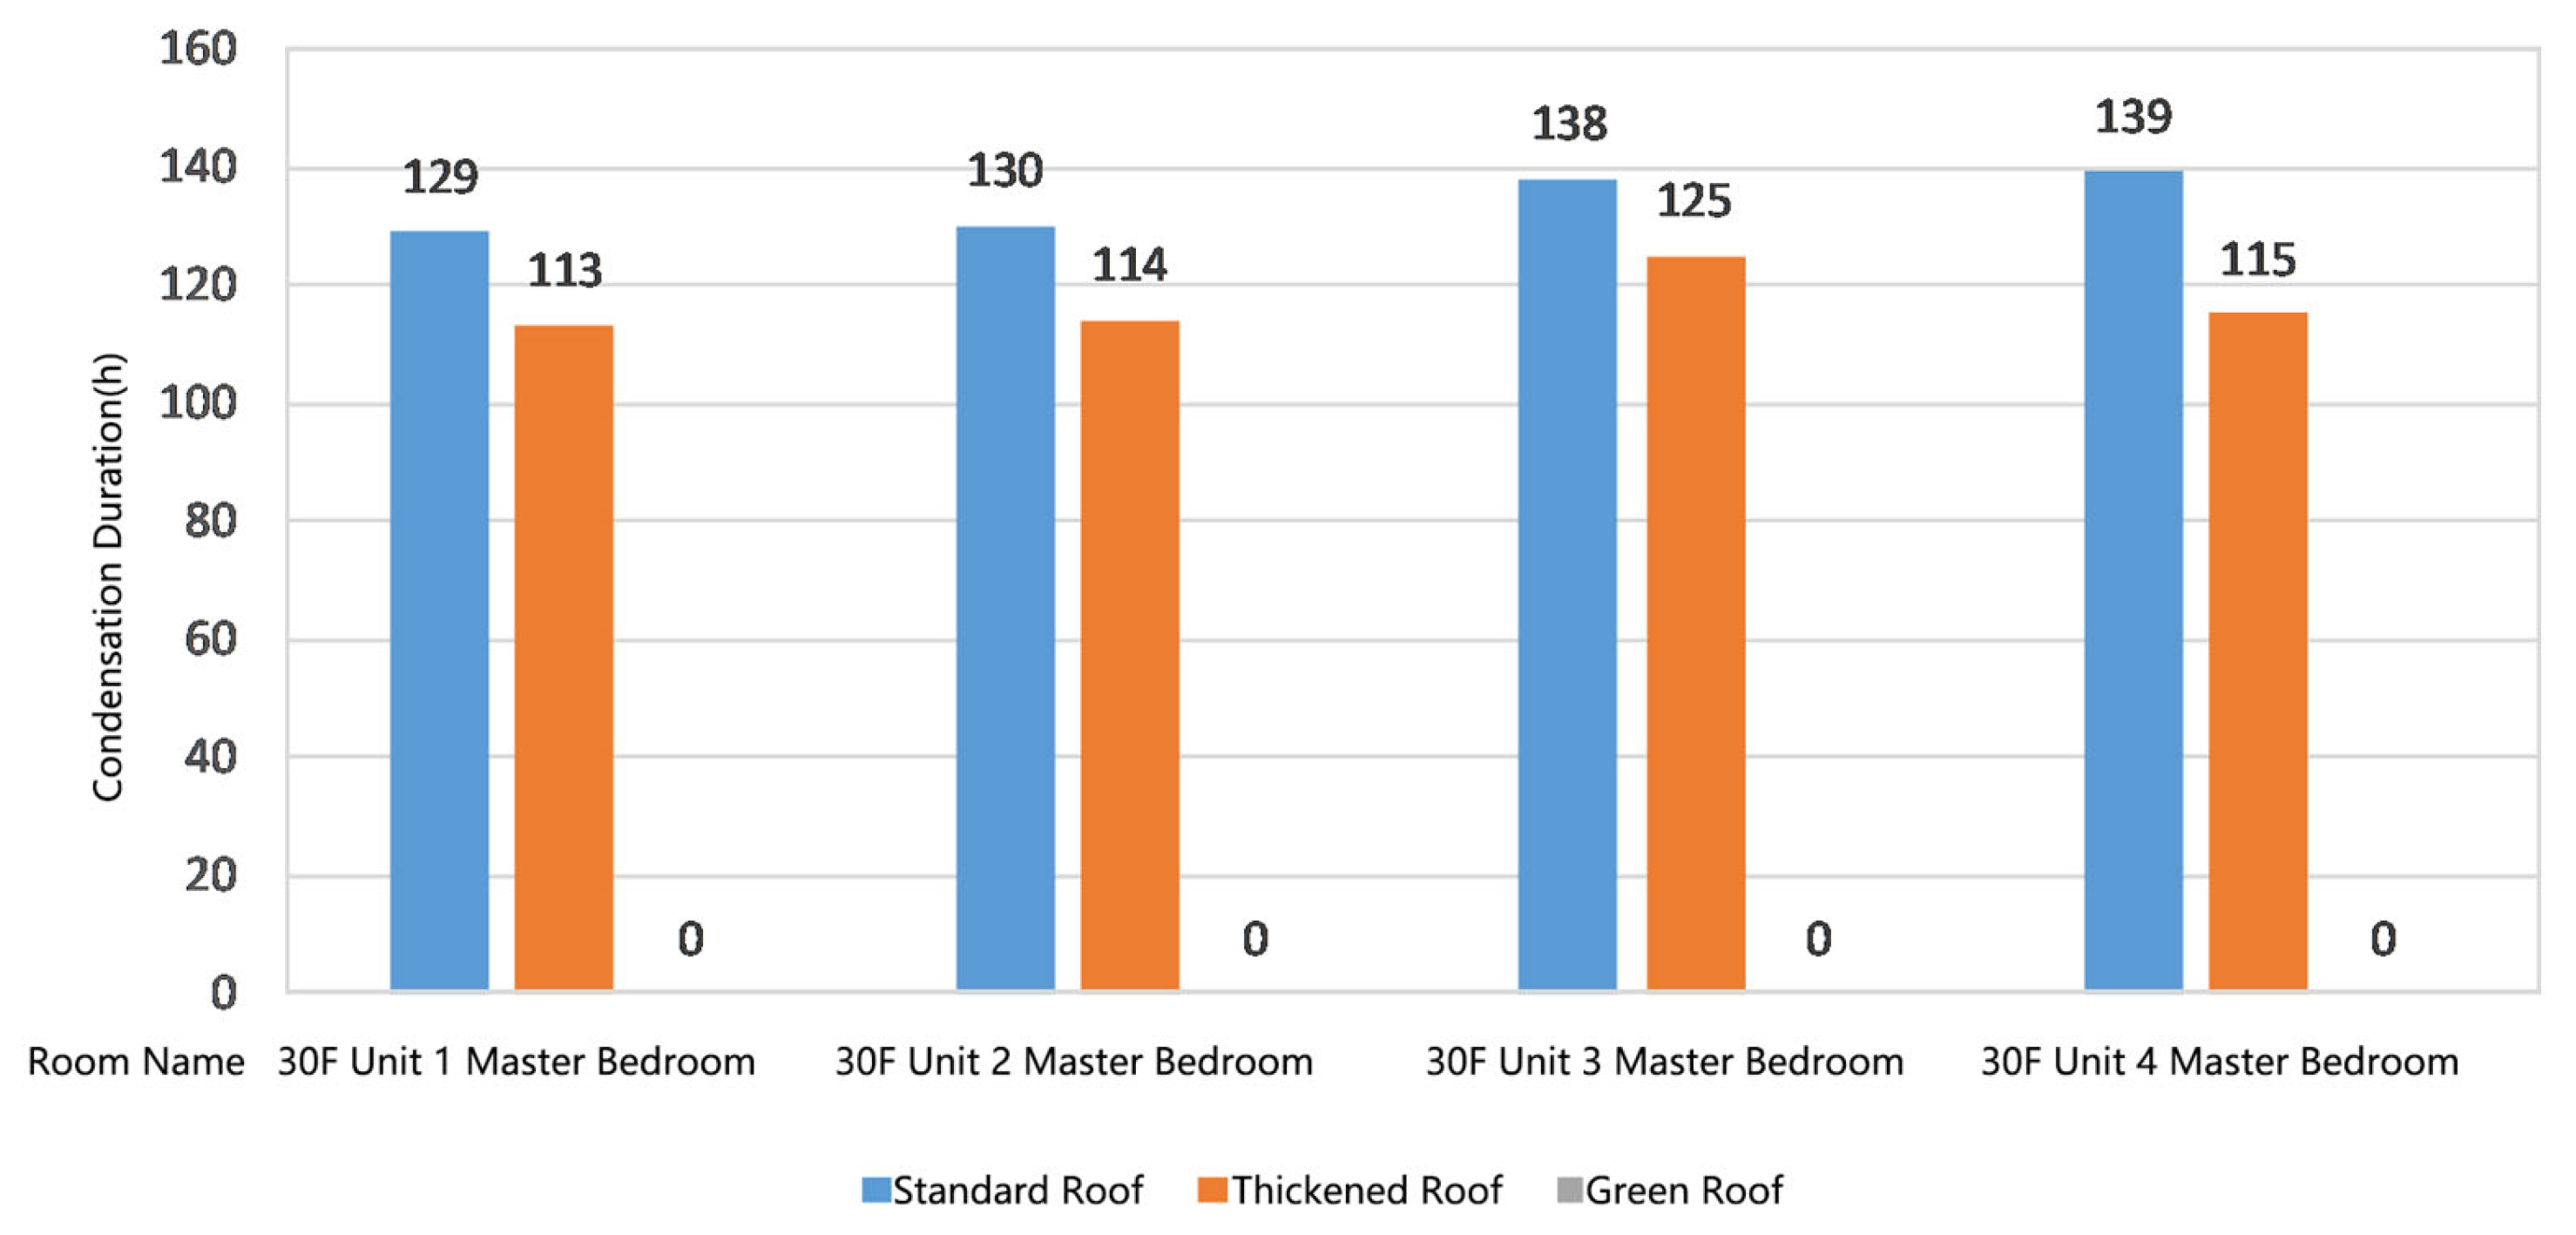
Taking the master bedroom of Unit Type 2 as an example, when using a conventional roof, the relative humidity of the top-floor room remains at 100% for extended periods, indicating saturated indoor air. When a thickened roof structure is used, the duration for which the indoor air reaches 100% relative humidity is significantly reduced. When a green roof is adopted (with 70 cm of soil depth and 100 cm tall Hemerocallis), the indoor relative humidity on the top floor is significantly reduced—peaking at around 90% during the first high-risk period and remaining between 60% and 70% during the second. Condensation calculations were performed for rooms across different unit types (Figure 5 and Figure 6). In both high-risk periods, the condensation duration follows the pattern: conventional roof > thickened roof > green roof (with the latter showing zero condensation duration). These findings indicate that green roofs can effectively mitigate condensation risk in top-floor rooms during the high-humidity season.
Moreover, as building height increases, the duration of 100% relative humidity in top-floor rooms (10F, 20F, and 30F) with conventional roof structures increases accordingly, leading to progressively longer condensation periods. In contrast, top-floor rooms with green roofs exhibit minimal variation in indoor relative humidity, showing limited sensitivity to changes in building height. Rooms with thickened roof structures show intermediate variability, falling between the conventional and green roof cases. These results suggest that green roofs provide substantial benefits in reducing condensation risk in high-rise buildings.

3.2. Influence of Plant Height on Indoor Relative Humidity

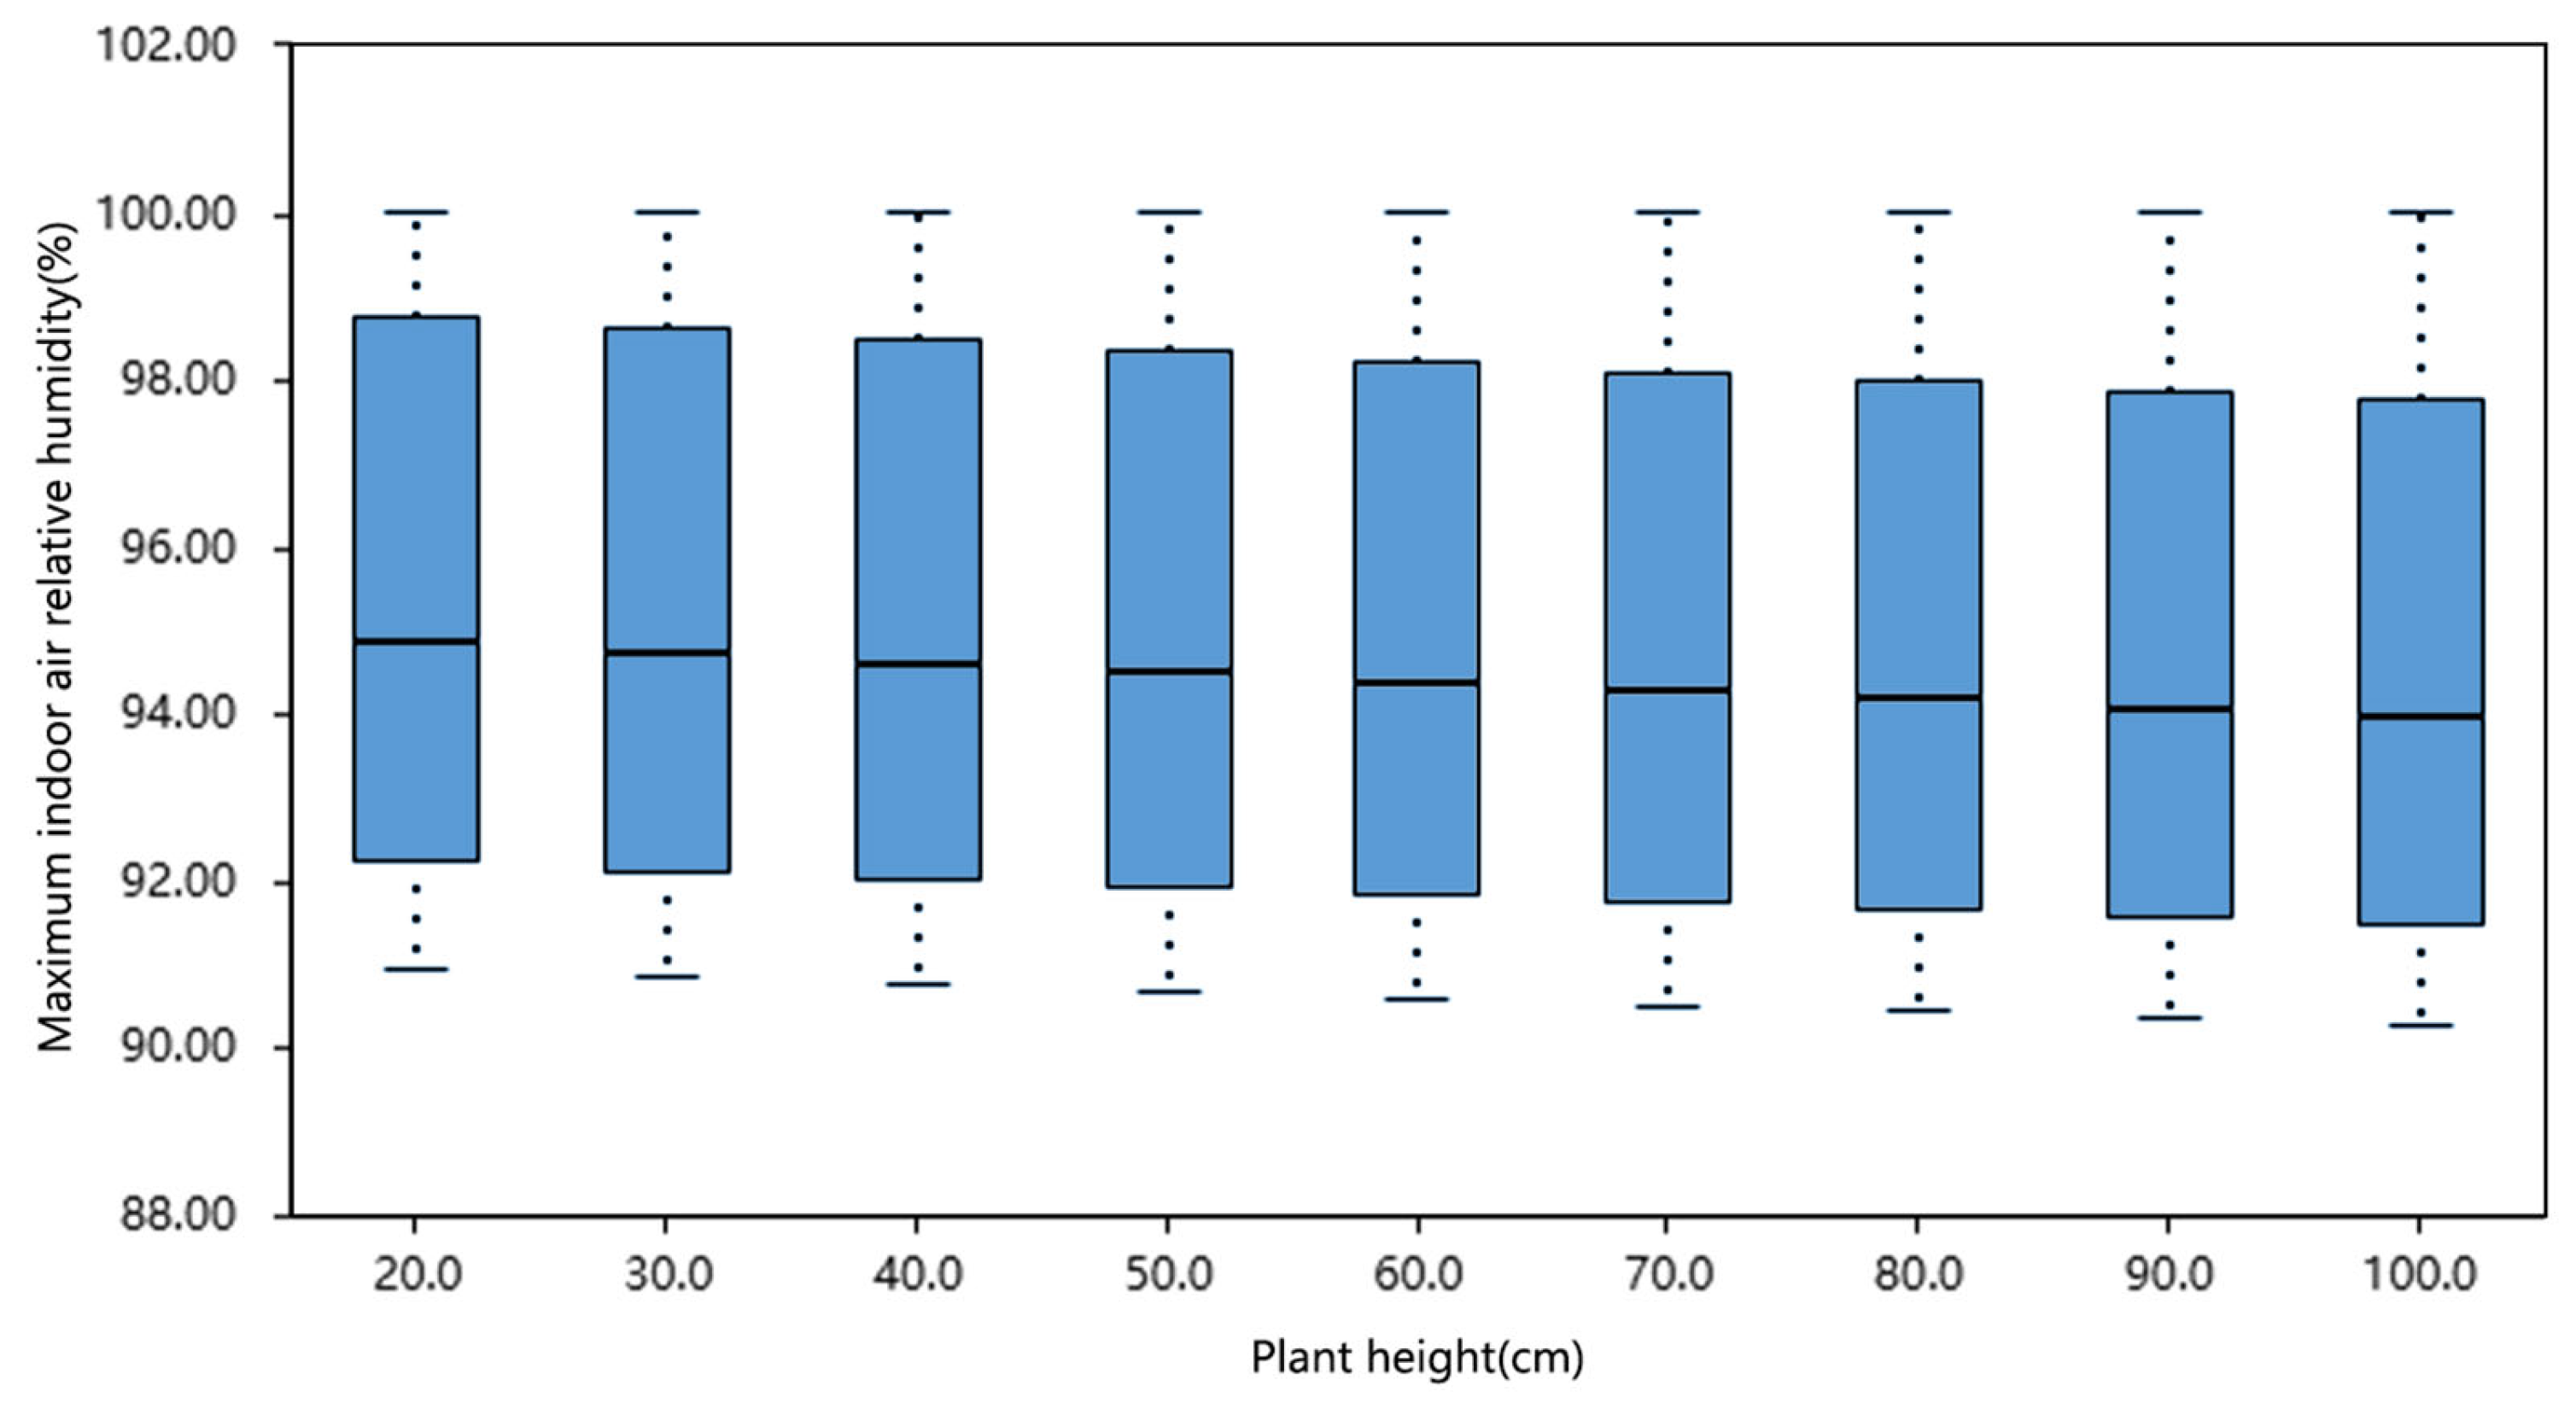
The species, growth status, and life cycle of plants can also influence the performance of green roofs. In this study, Hemerocallis is selected as a representative species to simulate the effect of varying plant heights on indoor relative humidity. Due to software limitations, only plant heights below 1 m can be simulated. According to the simulation results (Table 9), indoor maximum relative humidity shows a decreasing trend as plant height increases, with a relatively stable rate of decline (Figure 7). Overall, when the plant height is within 1 m, changes in plant height have a limited impact on indoor relative humidity. A correlation analysis was conducted to examine the relationship between maximum indoor relative humidity and plant height (Table 10). The correlation coefficient between indoor maximum relative humidity and plant height is −0.071, which is close to zero, and the p-value is 0.467, greater than 0.05. These results indicate that there is no significant correlation between indoor maximum relative humidity and plant height (within the 1-m range).

3.3. Influence of Soil Thickness on Indoor Relative Humidity

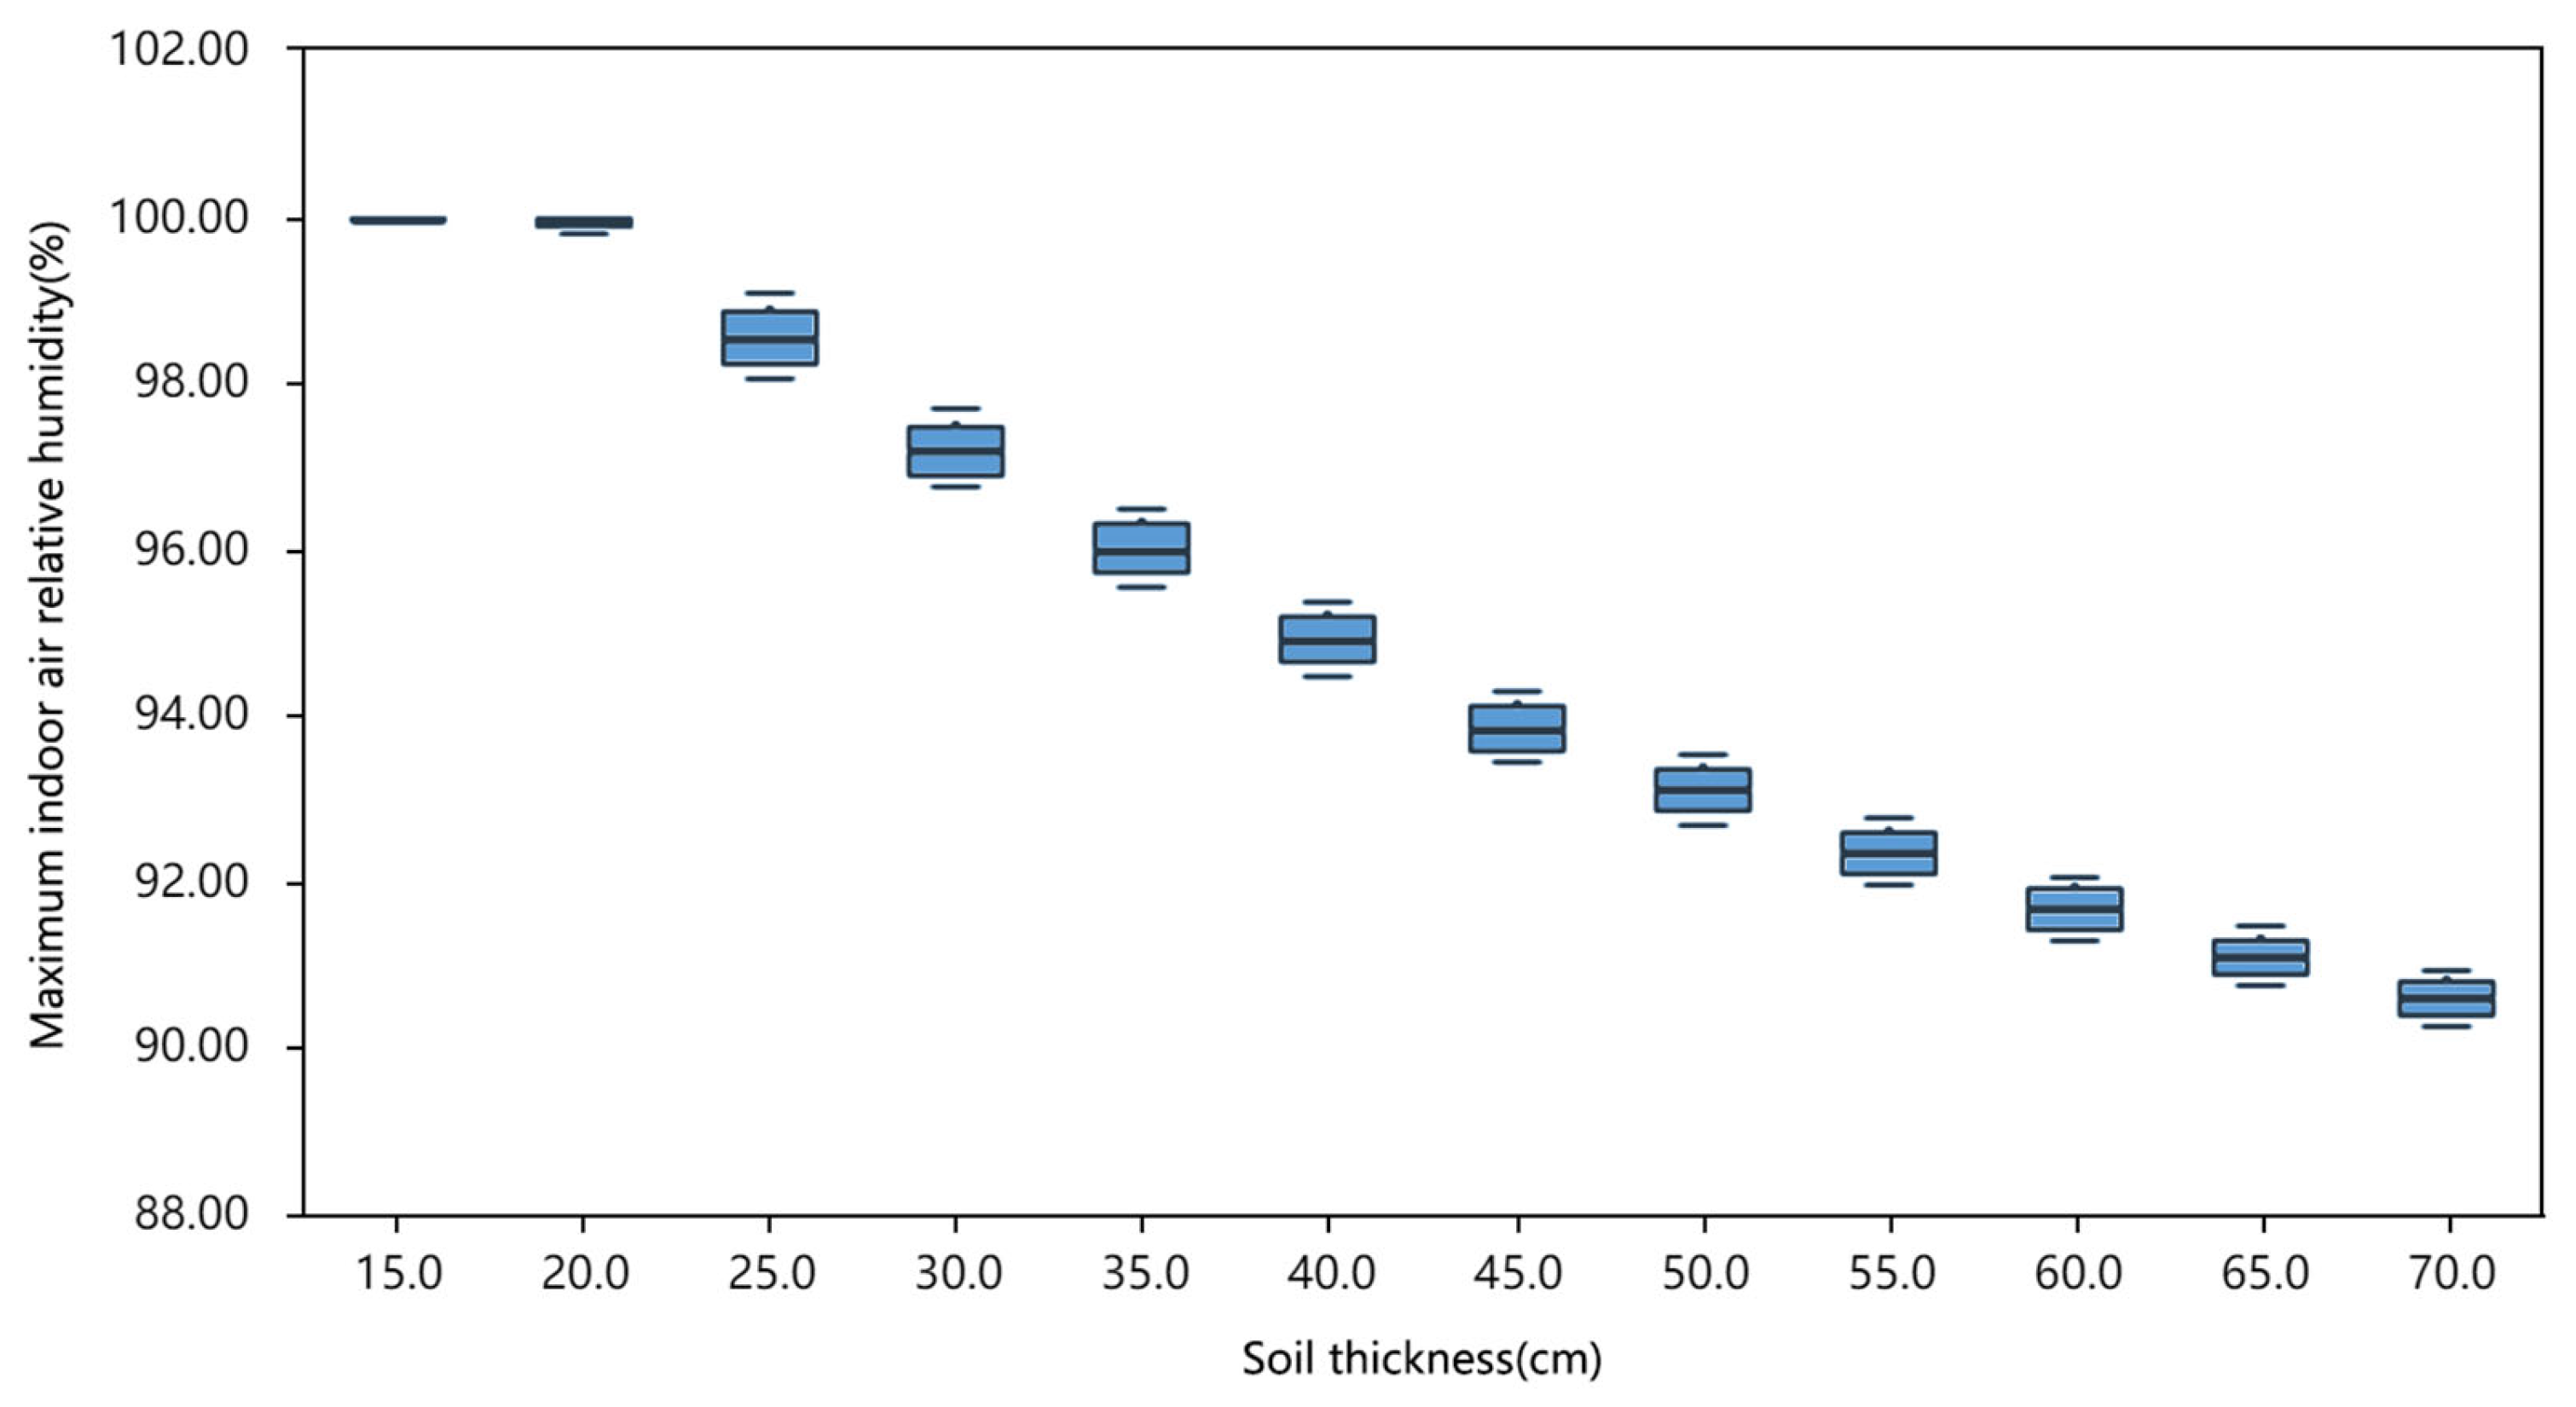
The thermal conductivity of soil also affects the performance of green roofs. This study simulates the impact of different soil thicknesses on indoor relative humidity. According to the simulation results (Table 11 and Figure 8), as soil thickness increases, the maximum indoor relative humidity exhibits a decreasing trend, with the rate of decline gradually slowing down. The impact of soil thickness on indoor relative humidity is relatively pronounced, especially when the initial soil layer is thin. Appropriately increasing the soil thickness helps to reduce the risk of indoor condensation. A correlation analysis was conducted to examine the relationship between maximum indoor relative humidity and soil thickness (Table 12). The analysis results show that the correlation coefficient between maximum indoor relative humidity and soil thickness is −0.987, with statistical significance at the 0.01 level. This indicates a significant negative correlation between maximum indoor relative humidity and soil thickness.
This result is likely closely related to the hygroscopic behavior, heat capacity, and other thermophysical properties of soil. Soil particles can adsorb water vapor from the air via their surface: at low humidity, water molecules are strongly adsorbed as a monomolecular layer on particle surfaces; as air humidity increases, multimolecular layers gradually form, followed by capillary condensation within micropores [56,57]. Such adsorbed water is usually tightly bound and thus not readily available to plants, but it plays an important role in regulating air humidity [58]. The hygroscopic capacity per unit mass of soil primarily depends on its texture, mineral composition, and organic matter content [57,59], rather than on thickness directly. However, as the soil layer becomes thicker, the total moisture storage capacity increases correspondingly. This is especially true in surface layers, where direct contact with air enhances hygroscopic effects [60].
In addition to modulating air humidity, soil also possesses relatively high volumetric heat capacity and thermal inertia [61]. A thicker soil layer can absorb and store part of the heat entering the building, delaying its transfer into the indoor environment and thus moderating the temperature gradient between indoor air and the building envelope. As soil moisture content increases due to its hygroscopic behavior, the volumetric heat capacity of the soil rises significantly, since the specific heat capacity of water is much greater than that of mineral particles. This coupled effect reduces vapor condensation on cold surfaces and helps mitigate indoor condensation risks [55].
Therefore, a thicker soil layer can, to some extent, absorb and retain both moisture and heat from the air, lowering peak indoor air humidity and slowing down heat and moisture exchange, thereby reducing the risk of condensation. Compared with the relatively weak influence of plant height (under 1 m) on indoor relative humidity (as discussed in Section 3.2), the regulatory effect of soil thickness is highly significant, exhibiting a strong negative correlation. Thus, in optimizing green roof design, soil thickness should be prioritized as the primary control variable. By appropriately increasing the soil depth, its thermal inertia and hygroscopic properties can be fully utilized to buffer the infiltration of humid outdoor air, significantly reduce indoor humidity peaks, and fundamentally suppress condensation risks. This strategy not only produces clear, measurable effects but is also practical for engineering implementation and standardization.

3.4. Influence of Plant Species on Indoor Relative Humidity

Simulations were conducted for rooftop greening scenarios using seven different plant species to observe their effects on indoor relative humidity (Table 13 and Figure 9). The simulation results show that, under the condition where leaf emissivity, reflectivity, soil thickness, and other parameters remain constant, an increase in the LAI leads to higher indoor relative humidity. During the high-humidity spring season, when solar radiation is relatively weak, the advantage of increased LAI in providing shading and cooling—as it does in summer—is not realized. Instead, due to enhanced transpiration and respiration, environmental humidity increases, thereby affecting the indoor environment negatively.
As analyzed in Section 3.3, soil thickness has a significant impact on indoor relative humidity. However, different types of vegetation require different soil depths for growth and reproduction. To meet survival and reproductive needs, groundcover plants typically require 15–30 cm of soil, flowers and small shrubs 30–45 cm, small trees 60–90 cm, and large trees 90–150 cm. Using the minimum required soil thickness for each vegetation category as the input parameter for simulation, the results show that:
For rooftops planted with groundcover vegetation, the maximum indoor relative humidity reaches 100%, resulting in condensation.
For rooftops planted with shrubs, while the maximum relative humidity does not reach 100%, condensation still occurs according to verification calculations, though for a shorter duration than with groundcover plants.
For rooftops planted with tree species, there is no risk of indoor condensation observed in any simulation scenario.

3.5. Element Analysis

A correlation analysis was conducted between indoor maximum relative humidity and several vegetation-related variables, including plant species, leaf emissivity, leaf area index (LAI), leaf reflectivity, plant height, and soil thickness (Table 14). The results indicate a very strong negative correlation between soil thickness and indoor maximum relative humidity (correlation coefficient = −0.988, p < 0.01), suggesting that increasing soil thickness significantly reduces indoor humidity and thus helps mitigate the risk of condensation.
In addition, the correlation coefficient between leaf area index and indoor maximum relative humidity is 0.180, which is statistically significant at the 0.05 level. This reveals a significant positive correlation between the two variables. Therefore, selecting plant species with a lower LAI is beneficial in controlling indoor humidity levels and reducing the risk of condensation.
This phenomenon may be attributed to the fact that plant species with a relatively low leaf area index (LAI) release only limited amounts of water vapor into the air through transpiration, whereas species with a high LAI possess a larger total transpiring leaf surface, which can substantially increase atmospheric moisture content [62,63]. Previous studies have demonstrated that LAI is a key parameter governing transpiration rates and air humidity at the canopy scale [64,65,66]. Getter et al. reported that in green roof systems, plant transpiration directly releases water vapor and increases near-surface air humidity [67]. Moreover, other studies have indicated that under indoor or greenhouse conditions, a higher LAI tends to raise air humidity, thereby intensifying the risk of condensation on cold surfaces [68]. Consequently, selecting plant species with a relatively low LAI may serve as an effective strategy for reducing indoor relative humidity and mitigating condensation risks.
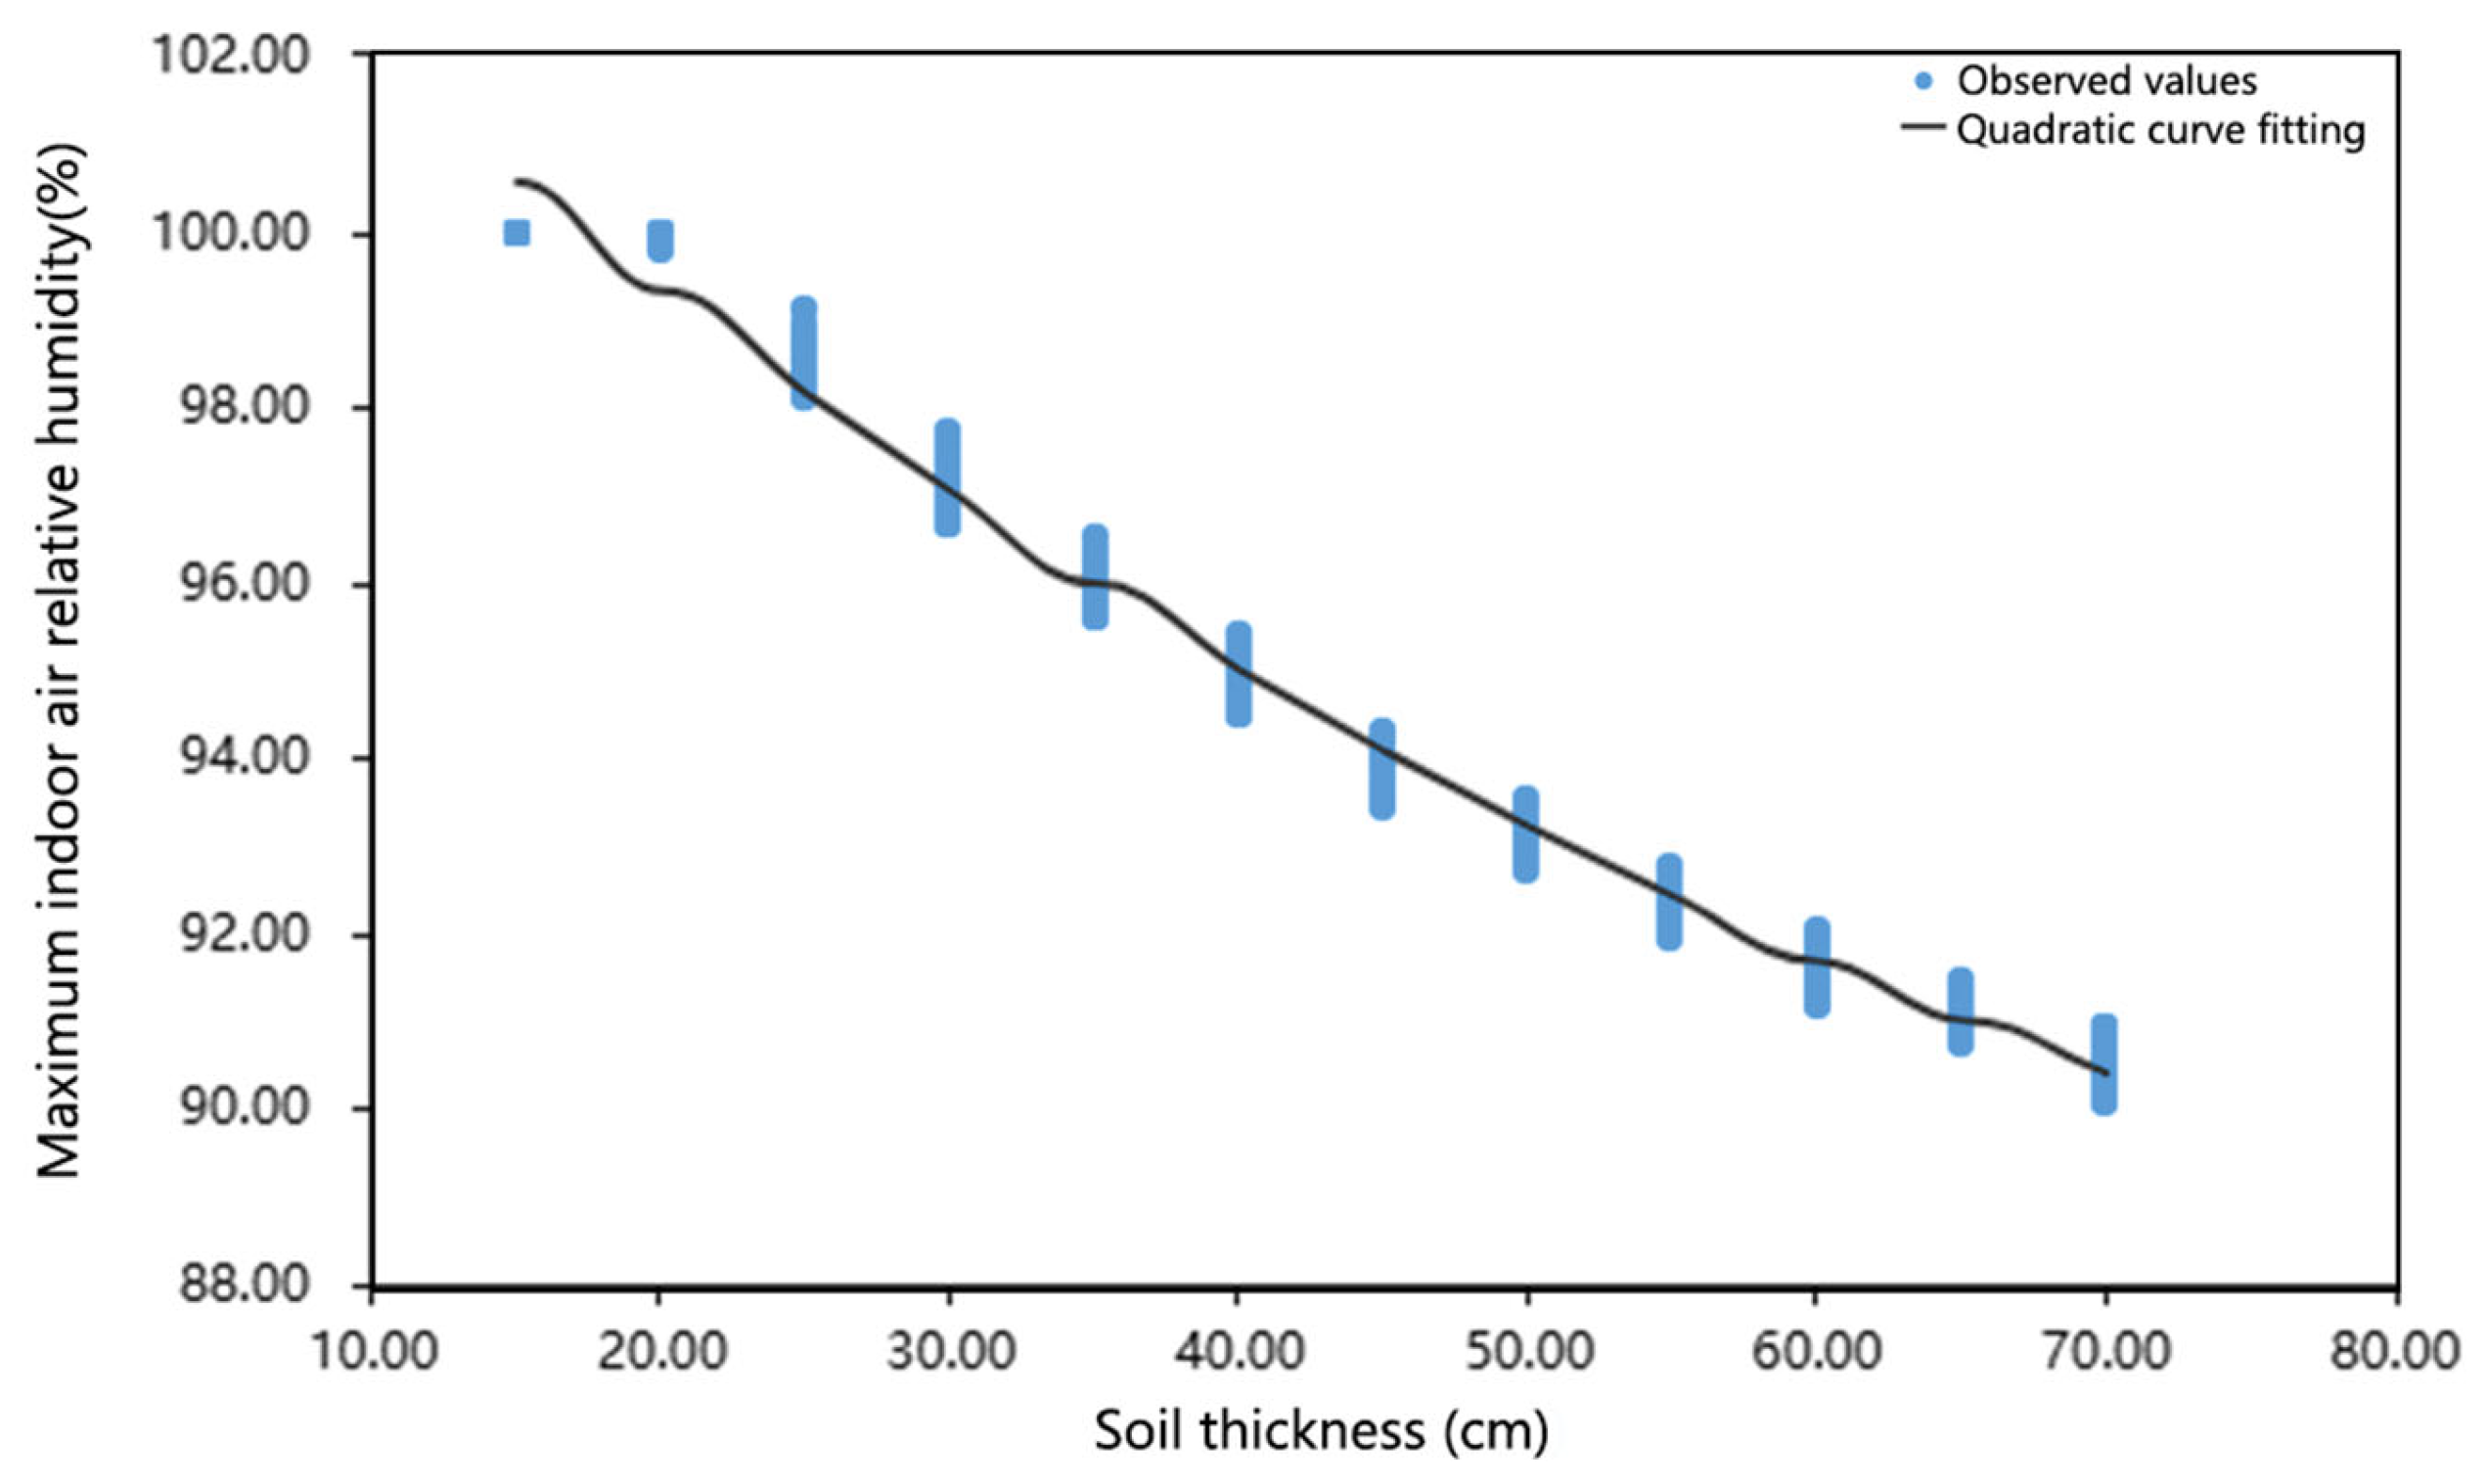
Based on the results of the correlation analysis, soil thickness was found to have a significant influence on indoor relative humidity. Based on the simulation data for a building height of 90 m, a further curve regression analysis was conducted for both variables (Figure 10). Several regression models—including quadratic, cubic, logarithmic, exponential, and linear functions—were fitted to the data. The cubic polynomial model (Y = 102.468 − 0.093X − 0.004X2 + 0.000X3) exhibited the best statistical performance (Table 15), with a coefficient of determination (R2) of 0.989, indicating that it explains 98.9% of the variance in the dependent variable. This R2 value was higher than that of other models, such as the logarithmic model (R2 = 0.967), exponential model (R2 = 0.978), and linear model (R2 = 0.975). Moreover, the sum of squared residuals (SSres) for the cubic model was 15.550, the lowest among all candidate models, further supporting its superior goodness of fit.
However, it is noteworthy that the coefficient of the cubic term (X3) is exceedingly small, indicating a minimal marginal contribution. Therefore, from the perspective of balancing model simplicity and explanatory power, the quadratic polynomial model is preferred as the predictive model. It offers a simpler structure while maintaining a high level of accuracy in representing the relationship between soil thickness and indoor relative humidity.
According to the regression results (Table 16), the coefficient of determination (R2) and the adjusted R2 are 0.986, indicating a high level of explanatory power and goodness of fit. This suggests that the model is capable of accurately explaining and predicting the variations in maximum indoor relative humidity. The standard error of the residuals is 0.395, which implies a relatively small average deviation between the predicted and actual values, further supporting the reliability and robustness of the model.
According to the analysis of the variance table (Table 17), the F-value is 4401.214 with a corresponding p-value < 0.01, indicating that the regression model is highly significant. The regression sum of squares (SSreg = 1376.002) is substantially greater than the residual sum of squares (SSres = 18.915), further validating the model’s strong explanatory power.
The fitted regression equation derived from the curve fitting is as follows:
RH = 104.6565950777 − 0.2919928166 D + 0.0012626395 D2,
where RH represents the maximum indoor relative humidity (%) and D denotes the soil thickness (cm).

4. Conclusions and Discussion

4.1. Significance of the Study

In the subtropical regions of southern China, warm and humid air masses during the spring season frequently cause indoor condensation, which significantly affects occupants’ comfort. Existing condensation prevention studies are mostly conducted under conditions with mechanical heating, ventilation, or air-conditioning systems, with limited ventilation rates, which do not align with the natural ventilation habits prevalent in southern China. This study models indoor humidity variations during spring based on the living habits and housing preferences of southern Chinese residents, aiming to identify condensation prevention strategies that do not rely on energy consumption or mechanical equipment.
Previous research by our team revealed that top-floor rooms are more prone to condensation due to their larger surface area in contact with the external environment, making them more susceptible to high-humidity outdoor airflow [69]. In current residential design, green roofs are favored by both designers and occupants for their benefits in psychological comfort and thermal regulation. Numerous studies have examined the effects of vegetation and soil on indoor temperature regulation and building energy consumption; however, relatively little attention has been paid to their influence on indoor humidity dynamics under natural ventilation, particularly regarding condensation prevention. Accordingly, this study focuses on investigating the regulatory effects of green roofs on indoor air humidity and condensation risk in top-floor units under the high-humidity climate of southern China, with the aim of providing new perspectives and empirical evidence for low-energy, moisture-control design strategies in hot and humid regions.
Simulation results indicate that the risk of condensation in top-floor rooms increases progressively with building height. A comparison of three roof types—conventional, thickened, and green—shows that conventional roofs are associated with higher indoor relative humidity, while thickened roofs reduce humidity to some extent. Green roofs, however, provide significantly greater improvement. During the simulated high-humidity period in spring (18 February–31 March), the indoor air relative humidity of top-floor rooms with conventional roofs remained at 100% saturation for extended periods, with a maximum condensation duration of 287 h. In contrast, when a green roof with a soil thickness of 70 cm was applied, the peak indoor relative humidity decreased to 90.7%, completely eliminating condensation. For high-rise buildings, implementing green roofs represents an effective and optimized strategy for mitigating condensation risk.
Correlation analysis reveals a strong negative relationship between soil thickness and the maximum indoor relative humidity. Increasing the soil depth of green roofs can significantly improve indoor humidity conditions and reduce the risk of condensation. A curve regression analysis was conducted to reveal the nonlinear relationship between soil thickness and the maximum indoor relative humidity on the 30th floor, resulting in the development of a predictive model (7). Based on model validation metrics such as the coefficient of determination (R2), residual sum of squares, and standard error, the model demonstrates high explanatory power and predictive accuracy, indicating a good fit. Simulation results indicate that once the maximum indoor relative humidity drops to approximately 95%, the probability of condensation is significantly reduced. According to the predictive model (7), when the soil thickness is 40 cm, the maximum indoor relative humidity is approximately 95.0%, approaching the critical threshold for a notable reduction in condensation risk; when the thickness is further increased to 50 cm, the maximum indoor relative humidity decreases to about 93.21%, clearly below the condensation threshold. This finding suggests that, for residential buildings with a height of 90 m (30 floors), the range of 40–50 cm in soil thickness represents a “tipping point,” beyond which indoor humidity and condensation risk undergo a qualitative change, making it a critical parameter for green roof design.
For buildings of different heights, predictive models of maximum indoor relative humidity can be established using simulation data, which can then guide the design of optimal soil depth to effectively prevent indoor condensation. According to the current simulation results, when the maximum indoor relative humidity is reduced to approximately 95%, the likelihood of condensation is significantly lowered. At this point, the dew point temperature can be calculated using Formulas (3)–(6) and compared to the wall surface temperature to further assess the risk of condensation.
Among the key parameters of green roofs—plant height, soil thickness, and leaf area index (LAI)—soil thickness exhibited a strong negative correlation with the maximum indoor relative humidity (correlation coefficient r = −0.987, p < 0.01), whereas the LAI showed a positive correlation (r = 0.180, p < 0.05). The underlying mechanism is that increasing soil thickness significantly enhances its moisture retention and thermal storage capacity. Through surface adsorption and capillary condensation, thicker soil layers can immobilize more water vapor, while their high volumetric heat capacity delays heat transfer, thereby reducing the temperature gradient between indoor air and interior surfaces. These coupled effects suppress humidity peaks and mitigate condensation risk. In contrast, a higher LAI increases plant transpiration, releasing more water vapor into the air, which directly elevates humidity and increases the likelihood of condensation.
To demonstrate the reliability of the simulation outcomes in this study, relevant empirical findings from previous research were examined for comparison. Voyde et al., based on field monitoring in New Zealand’s subtropical climate [70], demonstrated that soil depth and water-holding capacity significantly affect the moisture retention and evaporation processes of green roofs, noting that plants can contribute 20–48% of total evapotranspiration through transpiration. Teemusk et al. confirmed in Nordic field studies that thicker soil layers can substantially reduce indoor–outdoor temperature fluctuations [71]. Peng et al., using urban field measurements, reported that vegetated areas exhibit higher relative humidity compared to their built surroundings, with green roofs lowering the indoor temperature of top-floor rooms and improving occupants’ thermal comfort [72]. In China, Mingxi Peng et al. found that the air humidity above plant-covered roofs was consistently higher than that above bare roofs, with Sedum lineare exhibiting the greatest effect, increasing humidity by up to 33.1% over the roof surface [73]. Lazzarin et al. observed in experimental studies that soil with higher moisture content exhibits increased volumetric heat capacity, which significantly attenuates the transmission of outdoor temperature fluctuations to the interior, thereby reducing indoor environmental variation [74]. Collectively, these field-based findings resonate with the outcomes of this study, and the consistent trends confirm from an experimental perspective that soil depth and vegetation play a decisive role in regulating indoor temperature and humidity, thereby mitigating condensation risks.
Based on the above findings, the proposed humidity optimization strategies are as follows: 1. The optimal strategy is to implement a green roof, followed by increasing the structural thickness of the roof. 2. Appropriately increase soil thickness to leverage its moisture absorption and thermal capacity, thereby mitigating the impact of warm, humid air currents. 3. In the selection of rooftop vegetation, prioritize plant species with a low leaf area index.

4.2. Limitations of the Study

This study has several limitations:
  • Due to software constraints, the maximum plant height allowed in the simulation was limited to 1 m. In reality, many tree species exceed this height, making it difficult to accurately assess the impact of taller vegetation on indoor environmental conditions. Although the leaf area index (LAI) exhibits similar limitations, the upper boundary for LAI in the simulation was set at 5. In practice, LAI typically ranges from 0.5 to 5.0 [48,70]. Moreover, the current findings indicate that a smaller LAI is beneficial for controlling indoor humidity. Therefore, the upper bound of LAI used in this study has only a limited impact on the overall results and conclusions.
  • This study primarily relies on numerical simulations conducted using the HAMT model in EnergyPlus. To enhance the credibility of the results, we referred to multiple field studies conducted in different climatic contexts, which consistently corroborate the trends observed in our simulations [70,71,72,73,74]. This comparative approach demonstrates the reliability of the findings while also revealing the significant role of soil thickness and vegetation in regulating indoor temperature and humidity.
However, the HAMT model itself has certain limitations. First, the model depends strongly on material data, which are often difficult to obtain in real engineering practice. Second, it requires considerable computational resources, as long-term simulations need fine time steps to remain stable. Finally, because it assumes uniform material properties, the model is less capable of reflecting the variations found in actual construction materials.
Therefore, although the HAMT model is able to reasonably capture the regulatory effects of soil thickness and vegetation on indoor temperature and humidity in this study, the absence of localized field measurements may lead to deviations in absolute values or fine-scale dynamics. Future research should therefore integrate on-site measurements under regional climatic conditions to further calibrate the model parameters and improve the accuracy and generalizability of the outcomes.

4.3. Discussion

With the growing emphasis on residential comfort and health, the creation of sustainable and healthy housing has become a key goal for architects and designers. This study, based on the actual living habits of residents in southern China, simulated indoor humidity variations during springtime high-humidity weather conditions. In addition to commonly used active dehumidification methods, the research offers a passive design strategy to mitigate the risk of indoor condensation.
The results indicate that green roofs can significantly reduce indoor relative humidity in high-rise buildings. According to previous studies [75,76,77], green roofs have been shown to mitigate the urban heat island effect and improve urban microclimates to varying degrees. Furthermore, green roofs can moderate indoor temperature fluctuations and reduce energy demand [78], with particularly notable benefits in hot climates [79]. Combined with the simulation results of this study, green roofs demonstrate promising effectiveness in improving both indoor temperature and humidity conditions, thus providing a viable design strategy for residential buildings in subtropical regions.
Among the variables tested, soil thickness exhibited a significant impact on indoor humidity levels. We hypothesize that this effect may be attributed to multiple interacting mechanisms, including coupled heat and moisture transfer through the envelope, soil heat and moisture storage, and plant transpiration. However, the exact mechanisms remain to be validated through further empirical studies, and this constitutes an important direction for future research.
For instance, research by Chao Zeng [80] suggests that in subtropical regions such as Guangzhou, a soil thickness of 0.3 m achieves optimal energy-saving performance. Similarly, this study identified an optimal range of soil thickness for reducing indoor humidity. Therefore, future work could focus on multi-objective optimization studies that account for variables such as building height, soil thickness, environmental performance, structural load capacity, and economic cost, aiming to identify design strategies that maximize overall benefits.
Beyond the humidity-control function, roof configurations—particularly green roofs—should also be evaluated from a perspective of comprehensive benefits. In addition to mitigating condensation, green roofs can enhance stormwater retention, reduce peak runoff, and improve urban drainage performance, thus aligning with water-sensitive urban design objectives. When economic cost is considered, thickened roofs represent a moderate investment with partial environmental benefits, while green roofs require higher upfront and maintenance costs but provide multiple co-benefits across health, energy savings, and climate resilience. To support practical applications, we further synthesized the findings of this study with results from previous research on green roof systems (Saadatian et al., 2013; William et al., 2016; Shafique et al., 2020) [81,82,83], and integrated them into a comparative framework (Table 18). This framework consolidates aspects of condensation reduction, runoff control, economic cost, and relevance to the UN Sustainable Development Goals (SDGs), thereby providing designers with a clearer basis for selecting appropriate roof systems according to different performance priorities.

Author Contributions

Conceptualization, S.W. and K.X.; methodology, S.W.; software, S.W.; validation, S.W. and K.X.; formal analysis, S.W.; investigation, S.W. and W.M.; resources, S.W. and W.M.; data curation, K.X.; writing—original draft preparation, S.W. and K.X.; writing—review and editing, S.W. and K.X.; visualization, B.S.; responsible for the overall technical guidance and final review of the entire manuscript, W.M. and B.W. All authors have read and agreed to the published version of the manuscript.

Funding

This research was funded by the Foundation and Applied Basic Research Fund project of Guangdong Province, grant number 2019A1515110998.

Institutional Review Board Statement

Not applicable.

Informed Consent Statement

Not applicable.

Data Availability Statement

Data are contained within the article.

Acknowledgments

During the preparation of this manuscript, the authors used ChatGPT (https://chatgpt.com/) in order to improve language and readability. The authors have reviewed and edited the output and take full responsibility for the content of this publication.

Conflicts of Interest

Author Bing Wang was employed by the company Guangdong Tianhui Architecture Technology Co., Ltd. The remaining authors declare that the research was conducted in the absence of any commercial or financial relationships that could be construed as a potential conflict of interest.

References

  1. Wolkoff, P. Indoor Air Humidity, Air Quality, and Health—An Overview. Int. J. Hyg. Environ. Health 2018, 221, 376–390. [Google Scholar] [CrossRef] [PubMed]
  2. Desai, S.; Manapragada, N.V.S.K.; Shukla, A.K.; Pignatta, G. Mould-Growth Study in Building Materials Exposed to Warm and Humid Climate Using Heat and Mass Transfer (HAMT) EnergyPlus Simulation Method. Sustainability 2022, 14, 8292. [Google Scholar] [CrossRef]
  3. Arlian, L.G.; Neal, J.S.; Morgan, M.S.; Vyszenski-Moher, D.L.; Rapp, C.M.; Alexander, A.K. Reducing Relative Humidity Is a Practical Way to Control Dust Mites and Their Allergens in Homes in Temperate Climates. J. Allergy Clin. Immunol. 2001, 107, 99–104. [Google Scholar] [CrossRef]
  4. Bornehag, C.G.; Sundell, J.; Bonini, S.; Custovic, A.; Malmberg, P.; Skerfving, S.; Sigsgaard, T.; Verhoeff, A. Dampness in Buildings as a Risk Factor for Health Effects, EUROEXPO: A Multidisciplinary Review of the Literature (1998–2000) on Dampness and Mite Exposure in Buildings and Health effects. Indoor Air 2004, 14, 243–257. [Google Scholar] [CrossRef]
  5. Adan, O.C.; Samson, R.A. (Eds.) Fundamentals of Mold Growth in Indoor Environments and Strategies for Healthy Living; Wageningen Acadaemic Publishers: Wageningen, The Netherlands, 2011; pp. 245–266. [Google Scholar]
  6. You, S.; Li, W.; Ye, T.; Hu, F.; Zheng, W. Study on Moisture Condensation on the Interior Surface of Buildings in High Humidity Climate. Build. Environ. 2017, 125, 39–48. [Google Scholar] [CrossRef]
  7. Sulaiman, S.J.; Badran, A. Moisture and Condensation in Residential Buildings in a Relatively Dry Region. Int. J. Vent. 2010, 8, 313–324. [Google Scholar] [CrossRef]
  8. Craven, C.; Garber-Slaght, R. Exterior Insulation Envelope Retrofits in Cold Climates: Implications for Moisture Control. HVAC&R Res. 2014, 20, 384–394. [Google Scholar] [CrossRef]
  9. Lucas, F.; Adelard, L.; Garde, F.; Boyer, H. Study of Moisture in Buildings for Hot Humid Climates. Energy Build. 2002, 34, 345–355. [Google Scholar] [CrossRef]
  10. Guo, M.; Mai, G.; Gao, J.; Kong, S.; Huang, C. Characteristics of the Weather during “Huinantian” in Zhaoqing City in Spring. Guangdong Meteorol. 2013, 35, 27–31. [Google Scholar] [CrossRef]
  11. Li, Q.; Wu, Y.; Cao, C.; Chen, S.; Xu, W.; Gao, H. Discussion on Weather Forecasting for “Huinantian” in Shenzhen. J. Trop. Meteorol. 2014, 30, 971–976. [Google Scholar] [CrossRef]
  12. Zhang, D.; Wang, Y.; Feng, Y.; Fang, Y. Analysis and Forecast of the “Huinantian” Phenomenon in Guangdong. Meteorol. Sci. Technol. 2014, 42, 302–308. [Google Scholar] [CrossRef]
  13. Luo, X.; Gu, M.; Zhong, L.; Lin, Z. Analysis of the Causes of Typical “Huinantian” Phenomena in Guangxi in Recent Years. In Proceedings of the 2017 China-ASEAN Disaster Prevention and Mitigation and Sustainable Development Forum-Meteorology Session, Nanning, China, 13 September 2017; pp. 77–92. [Google Scholar]
  14. Chen, F.; Li, M.; Wu, W. Analysis of the Circulation Background of “Huinantian” Phenomenon in Late Winter and Early Spring of 2010—A Case Study of Huizhou City. Trop. Geogr. 2011, 31, 570–574+603. [Google Scholar] [CrossRef]
  15. Gu, M. Analysis of the Meteorological Factors During the “Huinantian” Weather in Nanning from February to April. Meteorol. Res. Appl. 2015, 36, 21–25+30. [Google Scholar] [CrossRef]
  16. Ding, Z.; Yu, X.; Ma, Z.; Wu, W.; Zhang, L.; Yu, D.Y.W.; Cheng, D.H.K. On-Site Measurement and Simulation Investigation on Condensation Dehumidification and Desiccant Dehumidification in Hong Kong. Energy Build. 2022, 254, 111560. [Google Scholar] [CrossRef]
  17. Li, J.; Calautit, J.; Jimenez-Bescos, C.; Song, W.; Riffat, S.; Chen, Q. Climate-Adaptive Windcatcher Natural Ventilation Integrated with Passive and Low-Energy Technologies: A Review of Current and Future Developments. Build. Environ. 2025, 284, 113436. [Google Scholar] [CrossRef]
  18. Galvin, R. Solving Mould and Condensation Problems: A Dehumidifier Trial in a Suburban House in Britain. Energy Build. 2010, 42, 2118–2123. [Google Scholar] [CrossRef]
  19. Aziz, A.A.; Sumiyoshi, D.; Akashi, Y. Low Cost Humidity Controlled Air-Conditioning System for Building Energy Savings in Tropical Climate. J. Build. Eng. 2017, 11, 9–16. [Google Scholar] [CrossRef]
  20. Chen, X.; Riffat, S.; Bai, H.; Zheng, X.; Reay, D. Recent Progress in Liquid Desiccant Dehumidification and Air-Conditioning: A Review. Energy Built Environ. 2020, 1, 106–130. [Google Scholar] [CrossRef]
  21. Chen, L.; Chen, S.H.; Liu, L.; Zhang, B. Experimental Investigation of Precooling Desiccant-Wheel Air-Conditioning System in a High-Temperature and High-Humidity Environment. Int. J. Refrig. 2018, 95, 83–92. [Google Scholar] [CrossRef]
  22. Tian, S.; Su, X.; Li, H.; Huang, Y. Using a Coupled Heat Pump Desiccant Wheel System to Improve Indoor Humidity Environment of nZEB in Shanghai: Analysis and Optimization. Build. Environ. 2021, 206, 108391. [Google Scholar] [CrossRef]
  23. Katejanekarn, T.; Kumar, S. Performance of a Solar-Regenerated Liquid Desiccant Ventilation Pre-Conditioning System. Energy Build. 2008, 40, 1252–1267. [Google Scholar] [CrossRef]
  24. Klõšeiko, P.; Arumägi, E.; Kalamees, T. Hygrothermal Performance of Internally Insulated Brick Wall in Cold Climate: A Case Study in a Historical School Building. J. Build. Phys. 2015, 38, 444–464. [Google Scholar] [CrossRef]
  25. Chae, Y.; Kim, S.H. Selection of Retrofit Measures for Reasonable Energy and Hygrothermal Performances of Modern Heritage Building under Dry Cold and Hot Humid Climate: A Case of Modern Heritage School in Korea. Case Stud. Therm. Eng. 2022, 36, 102243. [Google Scholar] [CrossRef]
  26. Richman, R.; Pressnail, K.D.; O’Malley, L.; Liebenow, N. The Reduced Gradient Approach (RGA): An Alternate Method to Optimizing Humidity Conditions in House Museums in Cold Climates. Int. J. Archit. Herit. 2010, 5, 48–59. [Google Scholar] [CrossRef]
  27. Janssens, A.; Hens, H. Interstitial Condensation Due to Air Leakage: A Sensitivity Analysis. J. Therm. Envel. Build. Sci. 2003, 27, 15–29. [Google Scholar] [CrossRef]
  28. Lee, J.H.; Yeo, M.S. Condensation Control to Cope with Occupancy Activity and Effectively Mitigate Condensation in Unheated Spaces by Real-Time Sensor Control Strategy. Sustainability 2020, 12, 4033. [Google Scholar] [CrossRef]
  29. Woo, D.-O.; Junghans, L. Framework for Model Predictive Control (MPC)-Based Surface Condensation Prevention for Thermo-Active Building Systems (TABS). Energy Build. 2020, 215, 109898. [Google Scholar] [CrossRef]
  30. Dorokhov, V.; Pintelin, N. Control of Temperature and Humidity Conditions of Church Buildings-Architectural Monuments as a Method of Preservation. IOP Conf. Ser. Mater. Sci. Eng. 2018, 463, 032076. [Google Scholar] [CrossRef]
  31. Seppänen, O.; Fisk, W.J. Some Quantitative Relations between Indoor Environmental Quality and Work Performance or Health. HVAC&R Res. 2006, 12, 957–973. [Google Scholar] [CrossRef]
  32. Korjenic, A.; Teblick, H.; Bednar, T. Increasing the Indoor Humidity Levels in Buildings with Ventilation Systems: Simulation Aided Design in Case of Passive Houses. Build. Simul. 2010, 3, 295–310. [Google Scholar] [CrossRef]
  33. Qin, M.; Hou, P.; Wu, Z.; Wang, J. Precise Humidity Control Materials for Autonomous Regulation of Indoor Moisture. Build. Environ. 2020, 169, 106581. [Google Scholar] [CrossRef]
  34. Jaffal, I.; Ouldboukhitine, S.-E.; Belarbi, R. A Comprehensive Study of the Impact of Green Roofs on Building Energy Performance. Renew. Energy 2012, 43, 157–164. [Google Scholar] [CrossRef]
  35. Jim, C.Y. Assessing Climate-Adaptation Effect of Extensive Tropical Green Roofs in Cities. Landsc. Urban Plan. 2015, 138, 54–70. [Google Scholar] [CrossRef]
  36. Jim, C.Y. Passive Warming of Indoor Space Induced by Tropical Green Roof in Winter. Energy 2014, 68, 272–282. [Google Scholar] [CrossRef]
  37. Wu, S. Study on the Thermal Environment of Residential Areas in Foshan City. New Archit. 2019, 183, 94–96. [Google Scholar] [CrossRef]
  38. GB 55038-2025; Residential Project Specifications. Ministry of Housing and Urban-Rural Development of the People’s Republic of China: Beijing, China, 2025.
  39. Wu, Z. Evaluation Method for Residential Ventilation Effectiveness. Master’s Thesis, Xi’an University of Architecture and Technology, Xi’an, China, 2009. [Google Scholar]
  40. GB 50176-2016; Thermal Design Code for Civil Building. China Architecture & Building Press: Beijing, China, 2016.
  41. GB 50009-2012; Load Code for the Design of Building Structures. China Architecture & Building Press: Beijing, China, 2012.
  42. Zheng, K.; Fang, Y.; Wei, R.; Liu, N. Survey and Analysis of Garden Roof Plants in Guangzhou Area. Mod. Hortic. 2021, 44, 170–171. [Google Scholar] [CrossRef]
  43. Wang, L. Suitability Evaluation of Four Types of Roof Greening Plants and Substrate Formulas in Guangzhou Area. Master’s Thesis, Gansu Agricultural University, Lanzhou, China, 2011. [Google Scholar]
  44. Feng, C. Energy Balance Study of Bermuda Grass Vegetative Roofs. Master’s Thesis, South China University of Technology, Guangzhou, China, 2011. [Google Scholar]
  45. Ke, F.; Weng, S.; Su, Z. Study on the Leaf Area Index Measurement Method of Urban Greenery Tree Species—A Case Study of Ficus Microcarpa. Fujian For. Sci. Technol. 2011, 38, 88–91+95. [Google Scholar] [CrossRef]
  46. Zhao, S.; He, Y. Energy Saving Study of Roof Plants in Wuhan. Build. Energy Effic. 2018, 46, 40–43+60. [Google Scholar] [CrossRef]
  47. Zhuang, D.; Kong, B.; Wang, X.; Sun, X. Study on the Leaf Area Index of Lawns and Ground Cover Plants. Shandong For. Sci. Technol. 2014, 44, 72–73. [Google Scholar] [CrossRef]
  48. Sailor, D.J. A Green Roof Model for Building Energy Simulation Programs. Energy Build. 2008, 40, 1466–1478. [Google Scholar] [CrossRef]
  49. Vera, S.; Pinto, C.; Tabares-Velasco, P.C.; Bustamante, W. A Critical Review of Heat and Mass Transfer in Vegetative Roof Models Used in Building Energy and Urban Environment Simulation Tools. Appl. Energy 2018, 232, 752–764. [Google Scholar] [CrossRef]
  50. Kämpf, J.H.; Robinson, D. A Simplified Thermal Model to Support Analysis of Urban Resource Flows. Energy Build. 2007, 39, 445–453. [Google Scholar] [CrossRef]
  51. Neymark, J.; Judkoff, R.; Knabe, G.; Le, H.-T.; Dürig, M.; Glass, A.; Zweifel, G. Applying the Building Energy Simulation Test (BESTEST) Diagnostic Method to Verification of Space Conditioning Equipment Models Used in Whole-Building Energy Simulation Programs. Energy Build. 2002, 34, 917–931. [Google Scholar] [CrossRef]
  52. Henninger, R.H.; Witte, M.J.; Crawley, D.B. Experience Testing EnergyPlus with the IEA HVAC BESTest E100-E200 Series. In Proceedings of the Eighth International IBPSA Conference, Eindhoven, The Netherlands, 11–14 August 2003. [Google Scholar]
  53. Crawley, D.B.; Hand, J.W.; Kummert, M.; Griffith, B.T. Contrasting the Capabilities of Building Energy Performance Simulation Programs. Build. Environ. 2008, 43, 661–673. [Google Scholar] [CrossRef]
  54. Qin, M.; Yang, J. Evaluation of Different Thermal Models in EnergyPlus for Calculating Moisture Effects on Building Energy Consumption in Different Climate Conditions. Build. Simul. 2016, 9, 15–25. [Google Scholar] [CrossRef]
  55. Flechas, G.M.; Salonvaara, M.; Tabares-Velasco, P.C. Validation and Moisture Content Sensitivity Analysis of Cross-Laminated Timber Wall Assemblies in EnergyPlus. J. Build. Eng. 2025, 108, 112852. [Google Scholar] [CrossRef]
  56. Tuller, M.; Or, D.; Dudley, L.M. Adsorption and Capillary Condensation in Porous Media: Liquid Retention and Interfacial Configurations in Angular Pores. Water Resour. Res. 1999, 35, 1949–1964. [Google Scholar] [CrossRef]
  57. Chen, C.; Arthur, E.; Zhou, H.; Wang, X.; Shang, J.; Hu, K.; Ren, T. A New Model for Soil Water Vapor Sorption Isotherms Considering Adsorption and Condensation. Soil Sci. Soc. Am. J. 2021, 85, 195–206. [Google Scholar] [CrossRef]
  58. Tokunaga, T.K. Hydraulic Properties of Adsorbed Water Films in Unsaturated Porous Media. Water Resour. Res. 2009, 45, 2009WR007734. [Google Scholar] [CrossRef]
  59. Amer, A.M. Soil Moisture Adsorption Capacity and Specific Surface Area in Relation to Water Vapor Pressure in Arid and Tropical Soils. Eurasian J. Soil Sci. (EJSS) 2019, 8, 289–297. [Google Scholar] [CrossRef]
  60. Zhang, Q.; Wang, H.; Wang, Z.; Xie, H.; Chen, T.; Guan, S. Experimental Study of Water Vapor Adsorption on Bare Soil and Gravel Surfaces in an Arid Region of Ningxia, China. Water 2024, 16, 984. [Google Scholar] [CrossRef]
  61. Ochsner, T.E.; Horton, R.; Ren, T. A New Perspective on Soil Thermal Properties. Soil Sci. Soc. Am. J. 2001, 65, 1641–1647. [Google Scholar] [CrossRef]
  62. Monteith, J.; Unsworth, M. Principles of Environmental Physics: Plants, Animals, and the Atmosphere, 4th ed.; Academic Press: Oxford, UK, 2013; pp. 179–198. [Google Scholar]
  63. Chen, H.; Wei, Y.; Huang, J.J. Widespread Increase in Plant Transpiration Driven by Global Greening. Glob. Planet. Change 2024, 235, 104395. [Google Scholar] [CrossRef]
  64. Baldocchi, D.; Meyers, T. On Using Eco-Physiological, Micrometeorological and Biogeochemical Theory to Evaluate Carbon Dioxide, Water Vapor and Trace Gas Fluxes over Vegetation: A Perspective. Agric. For. Meteorol. 1998, 90, 1–25. [Google Scholar] [CrossRef]
  65. Xu, Z.; Man, X.; Cai, T.; Shang, Y. How Potential Evapotranspiration Regulates the Response of Canopy Transpiration to Soil Moisture and Leaf Area Index of the Boreal Larch Forest in China. Forests 2022, 13, 571. [Google Scholar] [CrossRef]
  66. Jin, Z.; You, Q.; Zuo, Z.; Li, M.; Sun, G.; Pepin, N.; Wang, L. Weakening Amplification of Grassland Greening to Transpiration Fraction of Evapotranspiration over the Tibetan Plateau during 2001-2020. Agric. For. Meteorol. 2023, 341, 109661. [Google Scholar] [CrossRef]
  67. Getter, K.L.; Rowe, D.B. The Role of Extensive Green Roofs in Sustainable Development. HortScience 2006, 41, 1276–1285. [Google Scholar] [CrossRef]
  68. Körner, O.; Challa, H. Process-Based Humidity Control Regime for Greenhouse Crops. Comput. Electron. Agric. 2003, 39, 173–192. [Google Scholar] [CrossRef]
  69. Wu, S.; Mo, W. Study on the Mechanism of Indoor Condensation Influenced by Residential Room Parameters. Build. Energy Effic. 2023, 51, 87–95. [Google Scholar] [CrossRef]
  70. Voyde, E.; Fassman, E.; Simcock, R. Hydrology of an Extensive Living Roof under Sub-Tropical Climate Conditions in Auckland, New Zealand. J. Hydrol. 2010, 394, 384–395. [Google Scholar] [CrossRef]
  71. Teemusk, A.; Mander, Ü. Greenroof Potential to Reduce Temperature Fluctuations of a Roof Membrane: A Case Study from Estonia. Build. Environ. 2009, 44, 643–650. [Google Scholar] [CrossRef]
  72. Peng, L.; Jim, C. Green-Roof Effects on Neighborhood Microclimate and Human Thermal Sensation. Energies 2013, 6, 598–618. [Google Scholar] [CrossRef]
  73. Peng, M.; Yang, Z. Cooling and Humidity Enhancement Effects of Green Roofs on Outdoor Microclimate. J. Civ. Environ. Eng. 2019, 41, 165–173. [Google Scholar] [CrossRef]
  74. Lazzarin, R.M.; Castellotti, F.; Busato, F. Experimental Measurements and Numerical Modelling of a Green Roof. Energy Build. 2005, 37, 1260–1267. [Google Scholar] [CrossRef]
  75. Moody, S.S.; Sailor, D.J. Development and Application of a Building Energy Performance Metric for Green Roof Systems. Energy Build. 2013, 60, 262–269. [Google Scholar] [CrossRef]
  76. Costanzo, V.; Evola, G.; Marletta, L. Energy Savings in Buildings or UHI Mitigation? Comparison between Green Roofs and Cool Roofs. Energy Build. 2016, 114, 247–255. [Google Scholar] [CrossRef]
  77. Taleghani, M.; Tenpierik, M.; van den Dobbelsteen, A.; Sailor, D.J. Heat Mitigation Strategies in Winter and Summer: Field Measurements in Temperate Climates. Build. Environ. 2014, 81, 309–319. [Google Scholar] [CrossRef]
  78. Theodosiou, T.G. Summer Period Analysis of the Performance of a Planted Roof as a Passive Cooling Technique. Energy Build. 2003, 35, 909–917. [Google Scholar] [CrossRef]
  79. Lin, B.-S.; Yu, C.-C.; Su, A.-T.; Lin, Y.-J. Impact of Climatic Conditions on the Thermal Effectiveness of an Extensive Green Roof. Build. Environ. 2013, 67, 26–33. [Google Scholar] [CrossRef]
  80. Zeng, C.; Bai, X.; Sun, L.; Zhang, Y.; Yuan, Y. Optimal Parameters of Green Roofs in Representative Cities of Four Climate Zones in China: A Simulation Study. Energy Build. 2017, 150, 118–131. [Google Scholar] [CrossRef]
  81. William, R.; Goodwell, A.; Richardson, M.; Le, P.V.V.; Kumar, P.; Stillwell, A.S. An environmental cost-benefit analysis of alternative green roofing strategies. Ecol. Eng. 2016, 95, 1–9. [Google Scholar] [CrossRef]
  82. Shafique, M.; Xue, X.; Luo, X. An overview of carbon sequestration of green roofs in urban areas. Urban For. Urban Green. 2020, 47, 126515. [Google Scholar] [CrossRef]
  83. Saadatian, O.; Sopian, K.; Salleh, E.; Lim, C.H.; Riffat, S.; Saadatian, E.; Toudeshki, A.; Sulaiman, M.Y. A review of energy aspects of green roofs. Renew. Sustain. Energy Rev. 2013, 23, 155–168. [Google Scholar] [CrossRef]
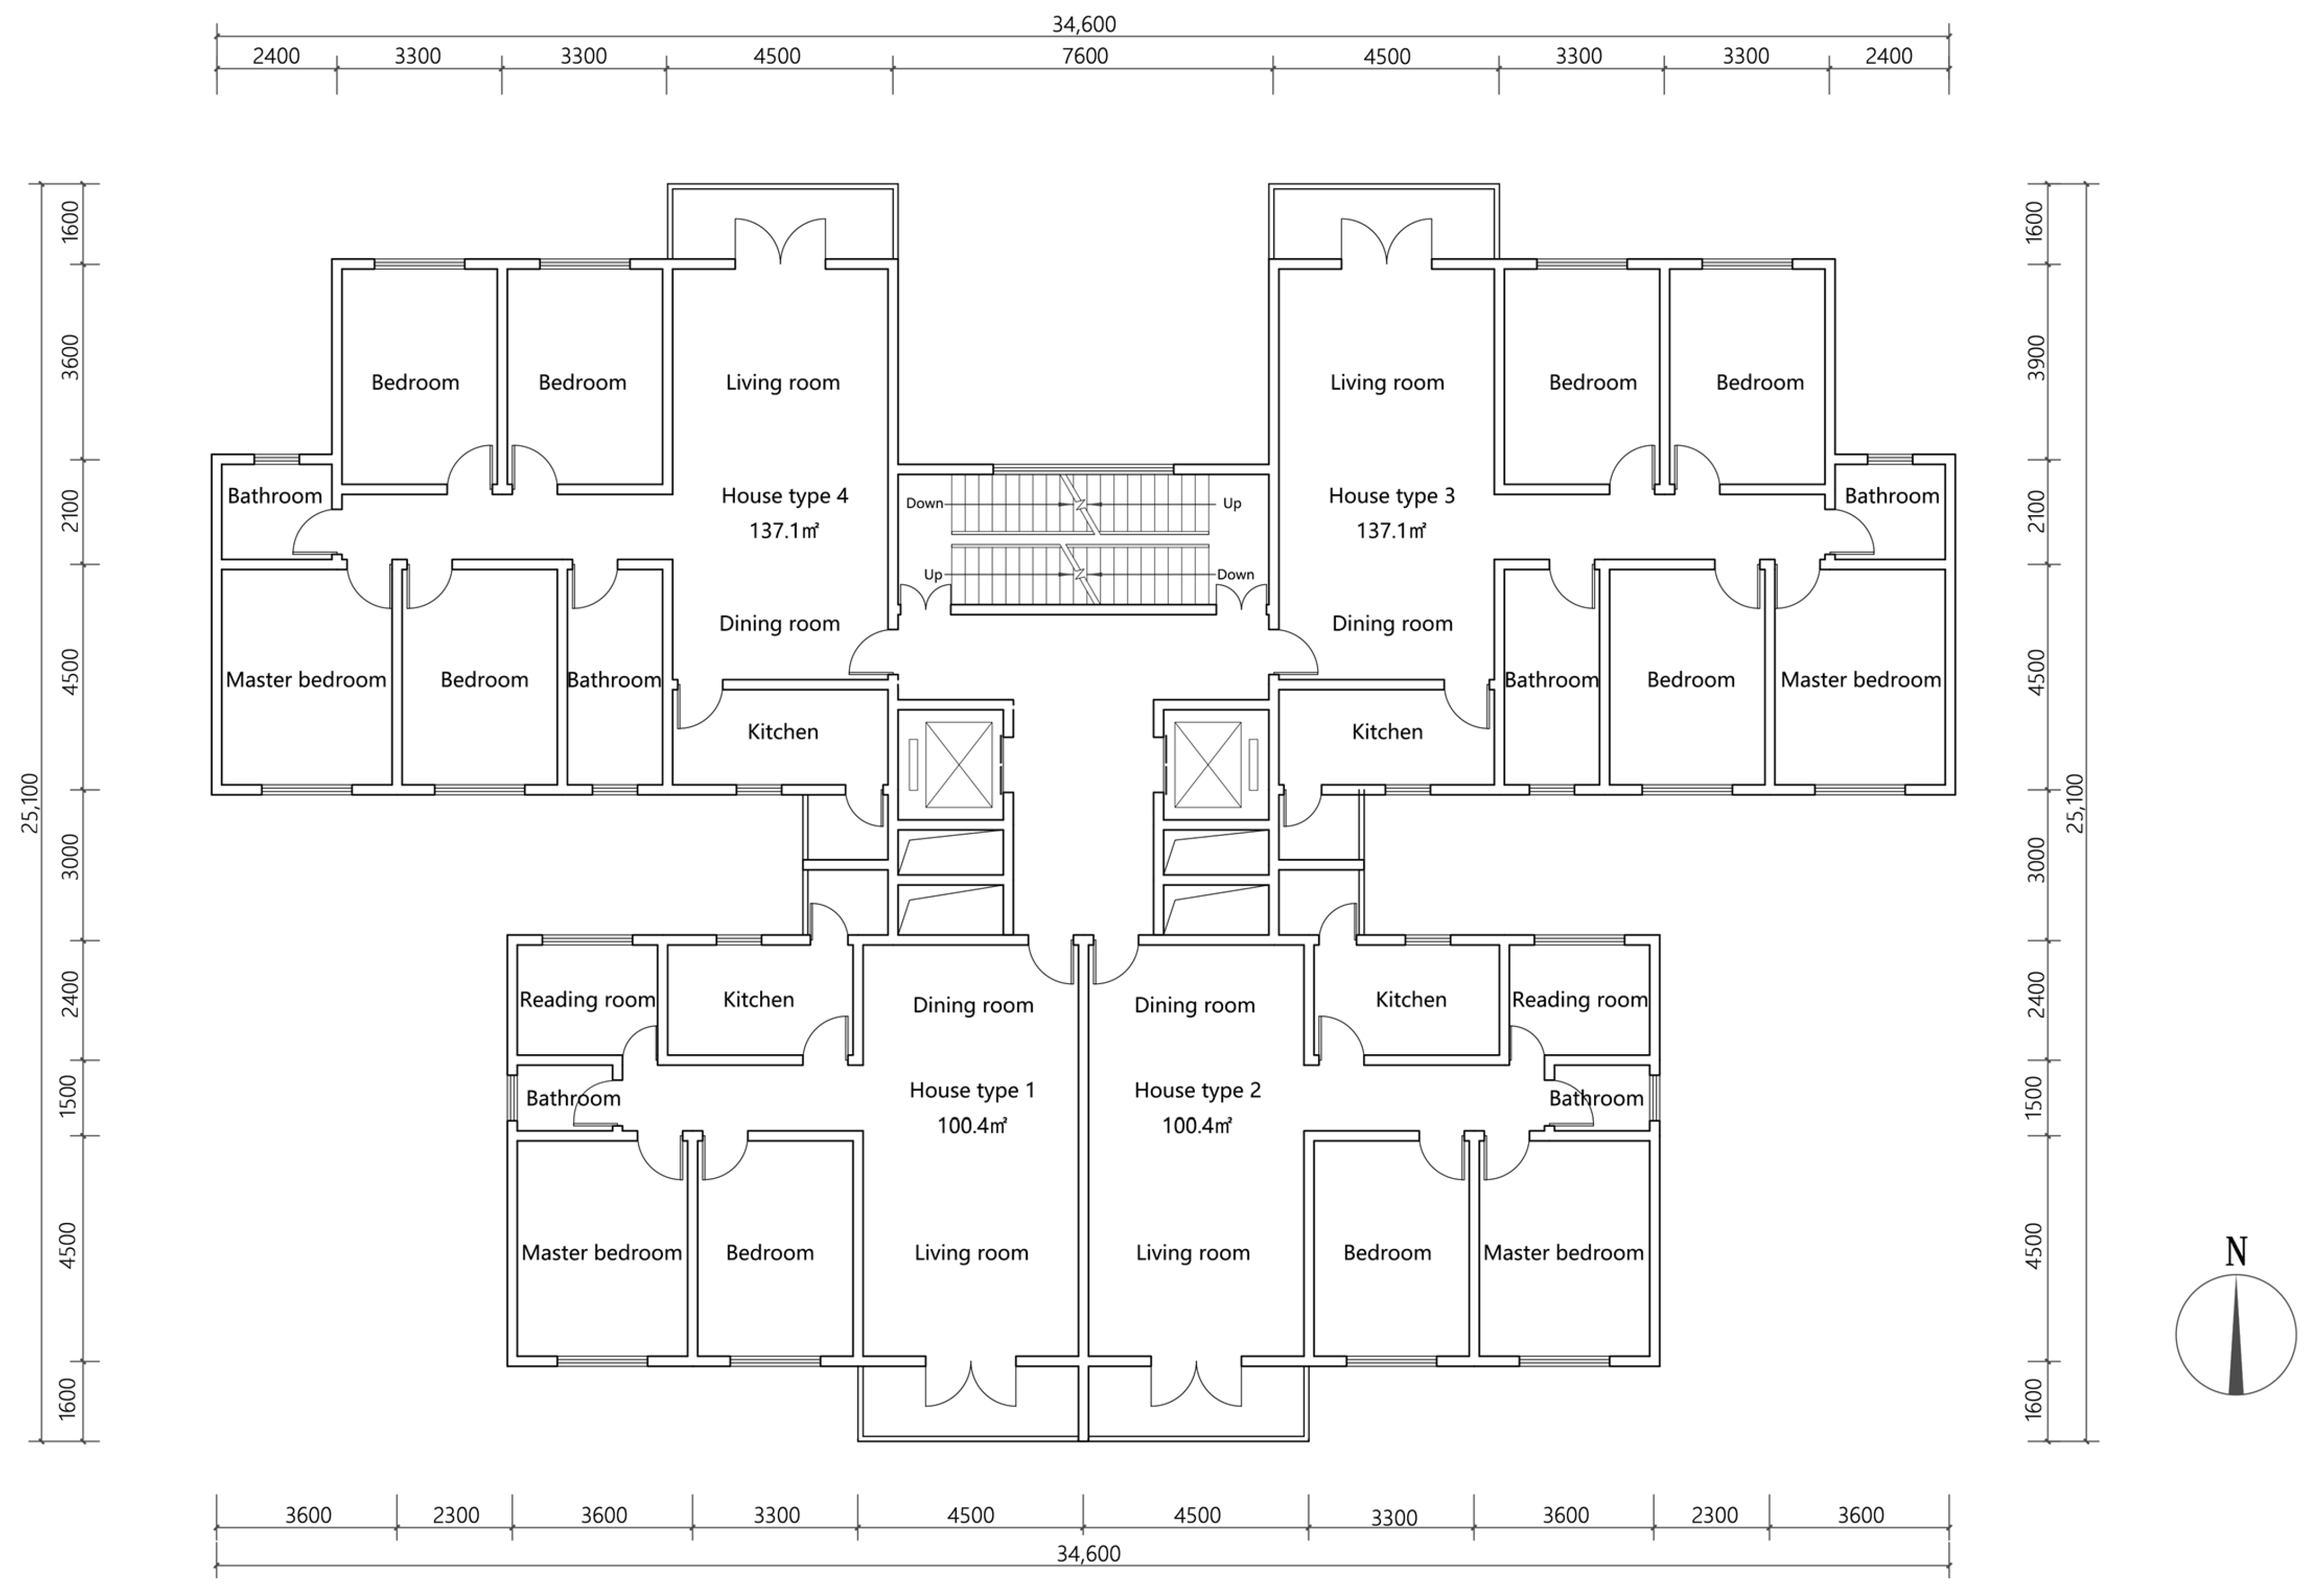
Figure 1. Residential building layout.
Sustainability 17 09112 g001
Figure 2. Building of the Three Building Conditions.
Sustainability 17 09112 g002
Figure 3. Daily outdoor meteorological parameters from 18 February to 31 March.
Sustainability 17 09112 g003
Figure 4. Change curve of indoor air relative humidity in the top floor rooms. (a) Variation curve of indoor air relative humidity in the master bedrooms of 10-story apartment (Unit Type 2); (b) variation curve of indoor air relative humidity in the master bedrooms of 20-story apartment (Unit Type 2); (c) variation curve of indoor air relative humidity in the master bedrooms of 30-story apartment (Unit Type 2).
Sustainability 17 09112 g004
Figure 5. Comparison of dew condensation time of different types of top-floor rooms in high-risk period 1.
Sustainability 17 09112 g005
Figure 6. Comparison of dew condensation time of different types of top-floor rooms in high-risk period 2.
Sustainability 17 09112 g006
Figure 7. Boxplot showing the effect of varying plant heights on indoor maximum relative humidity.
Sustainability 17 09112 g007
Figure 8. Boxplot showing the effect of varying soil depths on indoor maximum relative humidity.
Sustainability 17 09112 g008
Figure 9. Effect of planting soil thickness on indoor air relative humidity.
Sustainability 17 09112 g009
Figure 10. Curve regression analysis between soil thickness and indoor air humidity.
Sustainability 17 09112 g010
Table 1. Room sizes and functions.
NumberDimensionsFunctionLayout
Room 1Sustainability 17 09112 i001Single Bedroom, KitchenSustainability 17 09112 i002
Room 2Sustainability 17 09112 i003Bedroom, Study RoomSustainability 17 09112 i004
Room 3Sustainability 17 09112 i005Master Bedroom, BedroomSustainability 17 09112 i006
Room 4Sustainability 17 09112 i007Master BedroomSustainability 17 09112 i008
Room 5Sustainability 17 09112 i009Master Bedroom, Living RoomSustainability 17 09112 i010
Room 6Sustainability 17 09112 i011Living RoomSustainability 17 09112 i012
Room 7Sustainability 17 09112 i013Living RoomSustainability 17 09112 i014
Room 8Sustainability 17 09112 i015Living Room, Living and Dining AreaSustainability 17 09112 i016
Table 2. Schedule of personnel activities.
TimeActivity
6:30–8:00Cooking/Breakfast
8:00–11:00Indoor Activities
11:00–13:00Cooking/Lunch
13:00–14:30Afternoon Rest
14:30–17:30Indoor Activities
17:30–19:30Cooking/Dinner
19:30–21:00Indoor Activities
21:00–22:00Bathing
22:00–6:30Sleeping
Table 3. Parameter settings of rooms.
Room FunctionAppliance Power (W)Lighting Power (W)Occupant Count (Persons)Air Change Rate (ACH)
Living Room16045210
Bedroom16045210
Kitchen85030110
Bathroom2010110
Table 4. Parameters of the envelope structure.
ComponentMaterial Name (Out-to-In/Top-to-Bottom)Thickness (mm)Density (kg/m3)Specific Heat [J/(kg·K)]Thermal Conductivity [W/(m·K)]
Exterior WallPaint2018588370.6918
Cement mortar2018588370.6918
Aerated concrete block20070010500.18
Mortar2018588370.6918
Interior WallPaint2018588370.6918
ALC panel (Autoclaved aerated concrete)10050011300.13
Paint2018588370.6918
Ground FloorCeramic tile1023008401.3
Cement mortar3518588370.6918
Concrete10022438371.7296
Compacted soil-
Floor SlabCeramic tile1023008401.3
Cement mortar3518588370.6918
Reinforced concrete10022438371.7296
Cement mortar2018588370.6918
Mortar2018588370.6918
Doors/WindowsAluminum single-glazing625008400.76
Table 5. Structural levels of the three roofs.
Layer PositionMaterial Name (Outer to Inner)Thickness (mm)Density (kg/m3)Specific Heat [J/(kg·K)]Thermal Conductivity [W/(m·K)]
Conventional Roof AssemblyCement mortar2518588370.6918
Fine aggregate concrete4022438371.7296
XPS board (Extruded Polystyrene insulation)3080010900.16
Cement mortar2018588370.6918
Masonry mortar2018588370.6918
Thicken the roofCement mortar2518588370.6918
Fine aggregate concrete4022438371.7296
XPS board (Extruded polystyrene insulation)3080010900.16
Cement mortar2018588370.6918
Reinforced concrete20022438371.7296
Cement mortar2018588370.6918
Masonry mortar2018588370.6918
Green the roofGrowing substrateInorganic growing medium700110012000.35
Filter layerNon-woven geotextile2
water retention layerDrainage composite board1
Protection layerFine aggregate concrete4022438371.7296
Separation layerPolyethylene membrane0.4
Root barrierPolymer-modified asphalt waterproofing membrane490016000.23
Leveling layerCement mortar2018588370.6918
Slope formation layerLightweight aggregate concrete (LAC)3012808400.53
Reinforced concrete roof deckReinforced concrete20022438371.7296
The heat and moisture transfer settings of the materials are set according to the default material properties in Energy-Plus.
Table 6. Roof structure illustration.
Category(a) Standard Roof(b) Thickened Roof(c) Green Roof
General Structural Schematic Diagram

Sustainability 17 09112 i017


Sustainability 17 09112 i018
Sustainability 17 09112 i019
Table 7. Parameters of 7 species of plants.
CategoryScientific NameFamilyBiological CharacteristicsLeaf Emissivity (%)Plant Height(m)Leaf Area Index (LAI)Leaf Reflectance (%)Minimum Stomatal Resistance (s/m)
ArborFicus microcarpaMoraceaeLight-loving, moderately salt-tolerant0.9212.20.08150
Magnolia grandifloraMagnoliaceaePrefers warm, humid climates0.9213.150.08150
ShrubHibiscus mutabilisMalvaceaeLight-demanding, thrives in acidic, fertile soil0.9211.850.08150
Rosa chinensisRosaceaePrefers warm, sunny, well-ventilated environments0.9212.410.08150
Ground CoverHemerocallis fulvaLiliaceaeNeutral, light-preferred, shade-tolerant. Hardy, cold/drought-resistant0.92150.08150
Zoysia matrellaPoaceaeLight-preferred with shade tolerance, highly adaptable0.920.250.08150
Sedum lineareCrassulaceaeSoil-indifferent, drought/cold/heat-resistant0.830.12.90.17150
Table 8. Comparison of three heat and moisture transfer models in EnergyPlus.
ModelComputational PrinciplePerformance in ASHRAE 140/BESTEST TestsAdvantagesLimitationsReferences
CTF (Conduction Transfer Function)Frequency-domain conduction functions; heat transfer only.Heating load results highly consistent with reference solutions; reliable for heat transfer.Fast; minimal parameters; widely used in EnergyPlus.Ignores moisture migration; cannot simulate condensation.[51,52,53]
EMPD (Effective Moisture Penetration Depth)Semi-empirical moisture model with effective depth.Reasonable for heat loads; less accurate for long-term moisture storage/release.Captures some humidity effects with low computational demand.Strongly parameter-dependent; deviations in dynamic humidity.[49,54]
HAMT (Heat and Moisture Transfer)Finite-difference, coupled heat–moisture diffusion.Best agreement with measurements; superior to CTF and EMPD.Accurate heat–moisture coupling; suitable for condensation/humidity risk analysis.Requires extensive parameters; high computational cost; timestep-sensitive.[50,53,54,55]
Note: ASHRAE Standard 140 (BESTEST) is an internationally recognized benchmark for building energy simulation, designed to compare the accuracy of different software or models under standardized scenarios.
Table 9. Effects of plant height on indoor air relative humidity (exemplified by master bedrooms in a 30-story apartment, Unit Type 2).
Plant Height (cm)2030405060708090100
Maximum indoor air relative humidity (%)97.715597.571597.44297.320497.203997.090796.980296.873596.7719
Table 10. Correlation Analysis Between Maximum Indoor Relative Humidity and Plant Height.
Maximum Indoor Air Relative Humidity (%)Correlation Coefficientp-ValueSample Size
Plant height (cm)−0.0710.467108
Table 11. Effect of soil thickness on indoor air relative humidity.
Soil Thickness/cmMaximum Indoor Air Relative Humidity/% (Exemplified by Master Bedrooms in 30-Story Apartment, Unit Type 2)
15100
20100
2598.6612
3097.3204
3596.121
4095.0267
4593.9598
5093.2015
5592.4392
6091.7599
6591.184
7090.6736
Table 12. Correlation Analysis Between Maximum Indoor Relative Humidity and Soil Thickness.
Maximum Indoor Air Relative Humidity (%)Correlation Coefficientp-ValueSample Size
Plant height (cm)−0.987 **0.000108
Note: ** p < 0.01.
Table 13. Effects of 7 plants on indoor air relative humidity.
CategoryScientific NameSoil Depth (cm)Max Indoor RH (%) 1Category (h)Min Soil Depth (cm)Max Indoor RH (%) 1Category (h)
ArborFicus microcarpa7090.1006091.150
Magnolia grandiflora7090.1706091.220
ShrubHibiscus mutabilis7090.0803096.6711
Rosa chinensis7090.1203096.6711
Ground CoverHemerocallis fulva7090.26015100.0047
Zoysia matrella7090.94015100.0055
Sedum lineare7090.81015100.0053
1 Taking the master bedroom of the 30th-floor Unit Type 2 as the sample, the maximum indoor relative air humidity was measured.
Table 14. Correlation Analysis of Multiple Factors.
AverageStandard Deviation (SD)Maximum Indoor Air Relative Humidity (%)Plant SpeciesLeaf Emissivity (%)Leaf Area Index (LAI)Leaf Reflectance (%)Plant Height (cm)Soil Thickness (cm)
Maximum indoor air relative humidity (%)94.7783.3681
Plant species6.6611.1680.1641
Leaf emissivity (%)0.9190.011−0.0240.623 **1
Leaf area index (LAI)4.7990.6960.180 *0.877 **0.351 **1
Leaf reflectance (%)0.0810.0110.024−0.623 **−1.000 **−0.351 **1
Plant height (cm)62.41928.324−0.136−0.0830.238 **−0.231 **−0.238 **1
Soil thickness (cm)43.38718.174−0.988 **−0.1700.006−0.176−0.0060.0651
* p < 0.05; ** p < 0.01.
Table 15. Comparison of Fitting Parameters among Multiple Models.
Model TypeR2Residual Sum of Squares (RSS)Number of Parameters
Logarithmic Model0.96746.3622
Exponential Model0.97830.2502
Cubic Polynomial Model0.98915.5504
Exponential Decay Model0.97830.2502
Quadratic Polynomial Model0.98618.9153
Linear Regression0.97534.2301
Table 16. Model Summary.
R2Adjusted R2Standard Error (SE)AICBICEffective Sample Size
0.9860.9860.395124.735133.196124
Table 17. Analysis of Variance Table.
Sum of Squares (SS)Degrees of Freedom (df)Mean Square (MS)Fp
Regression1376.0022688.0014401.2140.000 **
Residual18.9151210.156
Total1394.917123
** p < 0.01.
Table 18. Comparative framework of roof configurations in relation to condensation reduction, runoff control, cost, and contributions to the UN Sustainable Development Goals (SDGs).
Roof TypeCondensation Reduction Benefit (h)Cost (¥/m2)Runoff ReductionCarbon Reduction BenefitsEnergy SavingsSDGs Goals
Standard RoofNone350–450NoneNoneLowSDGs 3 Health
SDG 6 Water
SDG 7 Energy
SDG 11 Sustainable Cities★★
SDG 13 Climate Action
Thickened Roof47–61500–600Low (limited effect)Limited (mainly through insulation)Moderate (≈5–15%)SDGs 3 Health★★
SDG 6 Water★★
SDG 7 Energy★★
SDG 11 Sustainable Cities★★~★★★
SDG 13 Climate Action★★
Green Roof249–287800–1200 (depending on soil/vegetation depth)High (up to 70–100% reduction)2–5 kg C/m2·yr2–35% (compared to standard roof)SDGs 3 Health★★★
SDG 6 Water★★★
SDG 7 Energy★★~★★★
SDG 11 Sustainable Cities★★★
SDG 13 Climate Action★★★
Note: ★ = Weak relevance; ★★ = Medium relevance; ★★★ = Strong relevance. Cost ranges are approximate and depend on local construction practices and material prices. Data synthesized from: William et al. (2016) [81]; Shafique et al. (2020) [82]; Saadatian et al. (2013) [83].
Disclaimer/Publisher’s Note: The statements, opinions and data contained in all publications are solely those of the individual author(s) and contributor(s) and not of MDPI and/or the editor(s). MDPI and/or the editor(s) disclaim responsibility for any injury to people or property resulting from any ideas, methods, instructions or products referred to in the content.