Article

Incentive-Based Peak Demand Regulation with Intelligent Parking Management for Enhanced Sustainability

1
Graduate School of Science and Technology, Gunma University, Kiryu 376-8515, Japan
2
Department of Systems and Control Engineering, Institute of Science Tokyo, Tokyo 152-8552, Japan
*
Authors to whom correspondence should be addressed.
Sustainability 2025, 17(20), 9093; https://doi.org/10.3390/su17209093 (registering DOI)
Submission received: 1 September 2025 / Revised: 7 October 2025 / Accepted: 11 October 2025 / Published: 14 October 2025
(This article belongs to the Section Sustainable Management)

Abstract

Urban parking facilities often experience severe peak-period congestion, resulting in delays, fuel consumption, and emissions. This paper develops an incentive-based intelligent parking management system to address the challenges of peak demand by encouraging drivers with flexible schedules to shift their parking from peak to off-peak times. The proposed incentive model regulates peak demand, which has been calibrated using historical data on parking demand and occupancy. The model incorporates empirically derived behavioral parameters (from field surveys) to capture drivers’ sensitivity to incentives. The system’s performance is evaluated via discrete-time simulation using real-world parking data from a Japanese supermarket, considering both weekday and weekend demand patterns. The incentive mechanism redistributed approximately 6% of the total parking demand from peak to off-peak periods, markedly reducing peak congestion. This demand shift resulted in substantial sustainability benefits: CO2 emissions decreased by approximately 21% on weekdays (19.5% on weekends), and fuel consumption decreased by about 25% on weekdays (28% on weekends) compared to a baseline scenario without incentives. The prioritizing of electric cars (EVs) and hybrid electric vehicles (HEVs) significantly enhanced emission reductions by promoting cleaner vehicles in the allocation process. This behavioral demand-management strategy offers a practical and scalable solution to enhance urban mobility and sustainability, demonstrating how modest incentives can yield substantial benefits in terms of traffic flow and emissions mitigation.

1. Introduction

Urban traffic congestion has become a critical challenge in modern cities, undermining mobility, economic productivity, and environmental sustainability [1,2]. One significant yet often overlooked contributor to this problem is parking inefficiency. Specifically, during peak hours, many drivers circulate in search of parking spots [3], which exacerbates traffic congestion and leads to unnecessary fuel consumption and emissions by vehicles, further deteriorating urban air quality and public health [4,5]. Developing more effective strategies to manage parking demand during peak hours has therefore become a priority in addressing these urban mobility challenges [6,7].
Conventional parking management practices, such as fixed-rate pricing and first-come, first-served policies, are inadequate for accommodating dynamic fluctuations in demand [8]. Because these methods do not encourage drivers to adjust their arrival times or parking durations, peak-hour congestion persists even when substantial off-peak capacity remains underutilized [9]. Recent advances in intelligent transportation systems (ITS) and smart parking technologies (e.g., IoT-based real-time space availability platforms) have improved the efficiency of locating available parking spaces [10,11,12,13,14,15,16,17,18,19]. However, technology-driven solutions such as machine learning (ML) [20,21] and radio frequency identification (RFID) [22,23] have proven insufficient to mitigate congestion during high-demand periods on their own entirely.
As a complementary strategy, incentive-based demand–response approaches, which have been successfully applied in other domains, offer promising potential for parking management [24,25,26]. For example, in the energy sector, consumers often shift usage to off-peak times in response to financial incentives such as time-of-use pricing or rebates. Similarly, transportation demand management programs have introduced rewards to influence travel behavior and trip timing [27,28]. A notable case is the Metropia pilot study, which used point-based rewards for off-peak commuting and achieved approximately a 20% reduction in travel times during peak periods [29]. Although such reward-driven schemes remain relatively new in the parking context, early evidence suggests that they can substantially influence driver decision making.
Based on these insights, researchers have begun implementing incentive-based strategies for parking. In our previous studies [30,31], an incentive-driven parking allocation was introduced at a shopping center in Gunma, Japan, where drivers with flexible schedules received rewards for parking during off-peak hours. This pilot successfully encouraged a portion of drivers to shift their parking away from peak times, yielding a noticeable reduction in peak occupancy and overall congestion. However, that experiment was limited to regular weekdays and did not examine demand patterns on weekends or during special events. Beyond this, few other initiatives have been reported in the literature; one notable example is Stanford’s CAPRI project, which tested a dynamic pricing scheme to discourage peak-hour arrivals [32]. Nevertheless, pricing-based approaches are not applicable in many free-access parking environments (such as shopping malls) where direct monetary charges are absent. These gaps highlight the need for a more comprehensive incentive-based parking management system, particularly in situations where traditional pricing methods are impractical.
To address the research gaps outlined above, this paper proposes an incentive-based parking management system designed to actively redistribute peak-period demand by offering targeted incentives. The primary focus of this paper is to regulate peak demand through incentives, which are calibrated using historical parking demand and occupancy data, to guide users in adjusting their future visiting schedules, particularly motivating flexible drivers to shift from peak to off-peak periods. Unlike prior studies [30,31] that focused solely on weekday commutes, this framework accounts for both weekday and weekend parking demand patterns, thereby capturing realistic temporal variations. The proposed system incorporates a sustainability-oriented, multi-objective optimization framework that dynamically balances user convenience and emission reduction goals, enabling a rigorous study and evaluation of the incentive mechanism. The key feature of this framework is its prioritization strategy for eco-friendly vehicles (EVs and HEVs), thereby aligning parking allocation decisions with broader sustainability goals. To evaluate performance, the system is tested using real-world historical data from a busy supermarket parking facility in Japan, with key behavioral parameters, such as the proportion of flexible users and their responsiveness to incentives derived from field surveys. The proposed incentive scheme may redistribute a portion of total parking demand from peak to alleviate traffic congestion, thereby alleviating peak demand congestion. This demand shift also generates significant environmental benefits: compared to a preliminary optimization scenario without incentives, the proposed system achieves notable reductions in both emissions and fuel consumption during weekdays and weekends. These improvements are realized by reducing unnecessary cruising within the lot and by prioritizing low-emission vehicles in the allocation process, thereby further lowering overall emissions. In summary, the findings demonstrate that an incentive-driven parking management approach can effectively mitigate peak-hour congestion and enhance parking efficiency, while also advancing sustainability objectives through substantial reductions in emissions and fuel savings.
The paper is organized as follows. Section 2 details the incentive-based parking management system, including the methodological framework and mathematical formulations. Section 3 presents the simulation design and results, with a focus on the system’s performance under both weekday and weekend demand conditions. Section 4 concludes with a summary of key findings, their practical implications, and prospective directions for future research.

2. Incentive-Based Parking Management System

To address peak-period congestion challenges and sustainability goals, we formalize the parking demand management problem and introduce a proactive incentive-based system. Unlike a real-time reactive approach, this system leverages historical parking demand and occupancy data (spanning daily cycles and multiple months) to anticipate congestion. At its core is a congestion-tuning model calibrated on past demand patterns, which guides users in rescheduling future parking visits, specifically motivating drivers with flexible schedules to shift from peak to off-peak times.
Figure 1 illustrates the overall concept of the proposed Incentive-Based Peak Demand Regulation with Intelligent Parking Management. In the user domain, the arrival patterns of cars in the parking lot naturally vary based on convenience and individual needs. When a car arrives, the parking management system receives information about the vehicle type, user details, and preferences. This information, along with historical trends and current occupancy levels, is used to determine the optimal parking allocation while considering various objectives and constraints. Once the allocation is made, the car is parked, and the user departs after a specific period. Up to this point, the process follows a standard allocation system without incorporating any demand regulation. As a result, during periods of high or excessive parking demand, the management system struggles to provide a comfortable and sustainable solution. To address this issue, an incentive scheduling model is introduced. This model periodically identifies suitable incentives and applies them to encourage off-peak users to shift their arrivals away from peak demand times. It is assumed that users will respond to these incentives, informed by feedback from the system, and that some flexible users will adjust their arrival patterns accordingly. This approach aims to alleviate peak parking demands, thereby enhancing the overall performance of the parking management system. The detailed mathematical formulation of the congestion-tuning incentive model and the optimization algorithm is presented in the following sections.

2.1. Formulation of Incentive Model

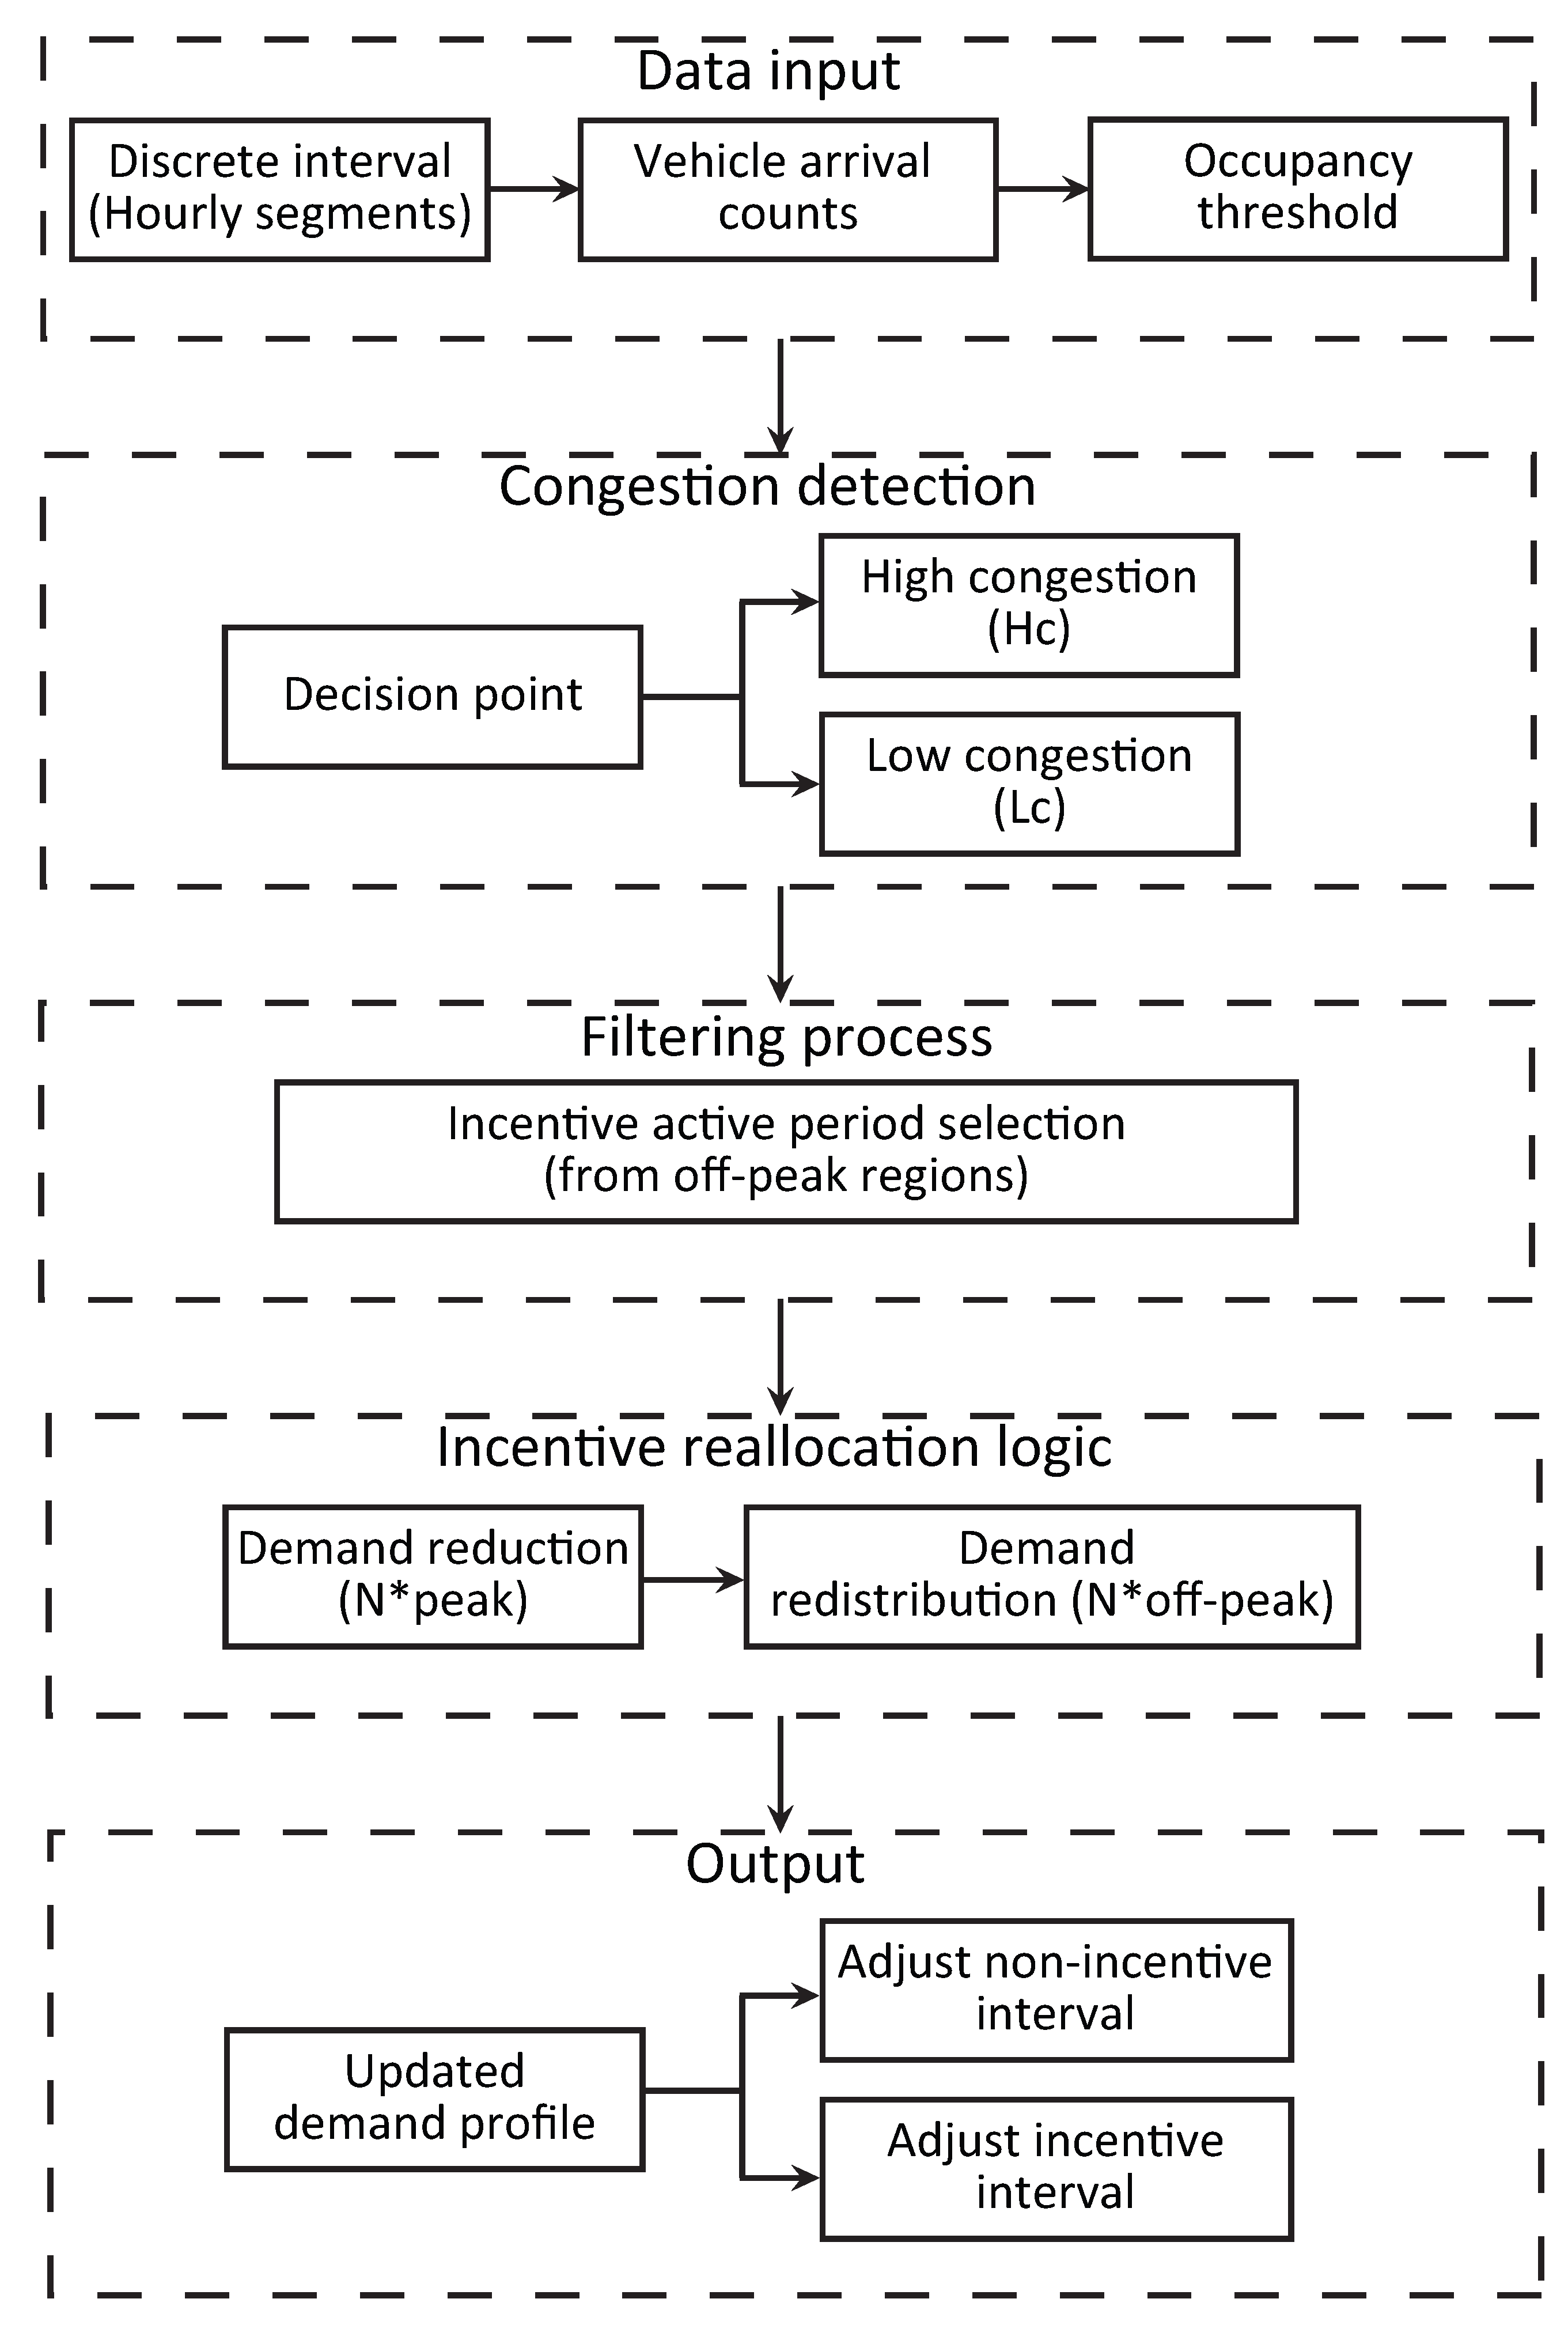
In the proposed incentive-based parking management system, a dynamic incentive model is introduced to influence user behavior and facilitate more efficient parking utilization while addressing sustainability objectives. This increasing model operates by identifying regions of peak congestion and strategically redistributing demand to underutilized off-peak intervals. The operational framework of the proposed model is illustrated in Figure 2 as a block diagram, outlining a five-step process that comprises data input, congestion detection, incentive region filtering, reallocation logic, and demand profile adjustment. Each stage contributes to the system’s overall goal of mitigating peak-hour overload and promoting a more balanced, environmentally conscious parking distribution.

2.1.1. Data Input

The process starts by gathering input data at distinct time intervals, usually divided by the projected time (hour/min), with the two main inputs utilized during operation.
(i)
Vehicle Arrival Counts: The number of vehicles entering the parking system during each interval. The arrival vehicle count is as follows,
V in ( τ ) = n , for T s ( τ ) < t in ( n ) T f ( τ )
Here, Equation (1) defines the incoming vehicles V in ( τ ) within a discrete time step τ . Specifically, it includes all users n whose arrival times t in ( n ) fall within the interval bounded by the start time T s ( τ ) and the finish time T f ( τ ) . In other words, the system divides vehicles into time segments based on when they enter the parking facility, allowing time-dependent demand modeling.
(ii)
Occupancy Threshold: A predefined upper limit of acceptable parking utilization, beyond which the system considers the lot to be congested (e.g., percentage (%) of total capacity).

2.1.2. Congestion Detection

This stage performs high-demand interval identification by evaluating parking occupancy within each discrete time interval. A decision point compares real-time arrival data against a predefined occupancy threshold to determine whether the interval qualifies as a peak congestion region. The decision point consists of two distinct parts that identify the congestion status; these are
(i)
High congestion: If the measured occupancy O p ( t ) exceeds the threshold O th , the interval is flagged as a high congestion region H c .
H c = τ , max O p ( t ) > O th , for T s ( τ ) < t in ( n ) T f ( τ ) , τ { 1 , 2 , 3 , , M }
(ii)
Low congestion: L c represents the off-peak regions where parking occupancy remains below the congestion threshold. These intervals are candidates for applying incentives to shift demand.
L c = τ , for τ H c , τ { 1 , 2 , 3 , , M }

2.1.3. Filtering Process

In this stage, the system executes a filtering operation to identify suitable intervals for demand reallocation. From the set of non-congested regions ( τ H c ) , a subset is selected as incentive periods, which serve as target regions for shifting peak-hour demand. The selection is based on multiple criteria, including consecutive duration, current occupancy levels, and the capacity of each interval to absorb redirected demand without inducing secondary congestion. This ensures that incentives are only applied to off-peak intervals with sufficient buffer capacity, thereby maintaining system stability and maximizing the effectiveness of redistribution.

2.1.4. Incentive Reallocation Logic

Before detailing the incentive reallocation logic, it is essential to introduce two key parameters α and β derived from empirical survey analysis. These parameters characterize the proportion of flexible users ( β ) within the overall user population and the behavioral responsiveness of these users to incentives ( α ) , which are fundamental to modeling demand shift dynamics as explained below.
(i)
Ratio of flexible users ( β ): This parameter represents the overall proportion of flexible users within the total population over all days. It quantifies how many users in the system, on average, have the potential to adjust their parking time or behavior. A higher value of β indicates a greater share of users who could be responsive to incentive-based interventions.
(ii)
Fraction of incentive-responsive flexible users ( α ): This parameter measures the percentage increase in flexible user participation on incentive days compared to the overall average. It captures the behavioral shift caused by the incentive, indicating how many additional flexible users responded positively (i.e., shifted their behavior) due to the presence of an incentive. A higher value of α reflects the greater effectiveness of the incentive mechanism in influencing user decisions.
Then, we can determine the overall demand shift fraction δ (delta) as
δ = α β
In practice, the parameters α and β can be derived from field observations or user surveys. For example, in a case study, their values were obtained from a parking survey, providing empirical evidence of how these parameters capture actual user behavior. The parameter δ represents the fraction of daily parking demand that can be reallocated from peak to off-peak periods via the proposed incentive mechanism. Its magnitude depends on both the proportion of users with schedule flexibility and the effectiveness of the incentive offered. Specifically, a larger flexible user or more compelling incentives will yield a higher δ , while limited user flexibility or insufficient incentive strength will result in a lower value. This parameter is critical, as it quantitatively links the incentive policy to the anticipated shift in temporal demand distribution, thereby influencing the overall effectiveness of the demand management strategy.
With the parameter δ defined, the model adjusts the expected number of vehicle arrivals across peak and off-peak regions, a process referred to as demand reduction and redistribution. Let N peak ( 0 ) and N off-peak ( 0 ) denote the baseline number of arrivals during peak and off-peak intervals, respectively, in the absence of any incentive intervention. Under the influence of the incentive mechanism, the adjusted number of arrivals denoted by N peak and N off-peak are computed to reflect the reallocation of a fraction δ of the flexible user population from peak to off-peak regions. The modified arrival distributions serve as inputs for subsequent optimization and allocation stages.
(i)
Demand reduction N peak :
N peak = N peak ( 0 ) × ( 1 δ )
(ii)
Demand redistribution N off-peak :
N off-peak = N off-peak ( 0 ) + δ N peak ( 0 )
This reallocation ensures that the portion of peak-hour users (specifically, the δ fraction of the original peak demand) is encouraged to come during off-peak hours instead.

2.1.5. Output

The system generates an updated demand profile that reduces arrival counts during non-incentive intervals and reallocates that demand to the selected incentive intervals. As a result, the occupancy distribution becomes more balanced throughout the day. This updated demand profile integrates seamlessly with downstream modules, including the optimization and the real-time parking allocation system, for efficient implementation.

2.2. Optimization System

To better justify the incentive effect and outcomes, we apply the parking data in a simulation system where an optimization model is developed with the concern of an eco-friendly parking system. Two types of optimization are considered: primary optimization and a proposed optimization scheme with an incentive mechanism.

2.2.1. Primary Optimization

In this section, we will examine the optimization system, describing the working process guided by the objective function and the practical methods used to assign appropriate parking spaces to users based on their convenience. This method evaluates the driving distance from the parking entrance to the allocated area and the walking distance from the parking spot to the shopping entrance.
Formally, let P = { 1 , 2 , , N } be the set of all parking points (spots) in the lot, each identified by an index. We denote the occupancy status of spot p at time t by X p ( t ) , where X p ( t ) = 1 indicates that the place is occupied (unavailable) and X p ( t ) = 0 indicates that it is free. For any parking point p, the minimum driving distance required to enter the lot, reach spot p, and exit the lot is defined as
D p = D entry p + D p exit
where D entry p is the distance from the parking lot entry gate to spot p, and D p exit is the distance from spot p to the exit gate. After parking the car at p, the driver (and passengers) must walk to the nearest entrance of the destination (e.g., shopping complex building), covering a distance W p . We define the total walking distance associated with parking at p (considering a round trip to and from the car) as
L p = 2 W p
We assume that the users will walk from the parked car into the establishment and back to the vehicle again when leaving. Here, D p represents the driving convenience (and related fuel use/emissions) for using spot p, while L p represents the walking inconvenience (and related loss of comfort) for that spot. We consider cars arriving sequentially at the parking lot. Let n denote the index of incoming vehicles ( n = 1 , 2 , 3 , ), and let t n be the arrival time of car n. Upon arrival, car n provides its relevant data to the system, including its vehicle type and the number of occupants (passengers) U n , as well as any special requirements for those occupants (for instance, if a passenger requires a wheelchair-accessible parking spot, the system will handle that request separately). For simplicity in classification, we group vehicle types by their powertrain into three categories: electric vehicles (EVs), hybrid electric vehicles (HEVs), and gasoline vehicles (GVs). These categories are chosen because they directly relate to emission characteristics where EVs and HEVs emit little or no CO2 during low-speed driving, whereas GVs do. When a car n arrives at time t n , the allocation system must select an available parking spot p P with X p ( t n ) = 0 and assign it to that car. The selection of the spot is contingent upon its availability and aims to optimize a specific cost objective, as described below.
Before detailing the proposed optimized allocation scheme, we outline several typical parking allocation approaches to serve as baselines and to clarify the underlying concepts. Usually, individual drivers aim for a parking spot that minimizes their walking distance (maximizing personal convenience), while environmental considerations would favor limiting the driving distance (to reduce emissions). Considering these potentially conflicting preferences, three basic allocation strategies can be defined as follows:
(i)
Greedy (Walk-Minimizing) Method: Each arriving car is assigned to the available parking spot that minimizes THE walking distance to the destination entrance (i.e., the spot closest to the entrance). This method prioritizes user comfort by minimizing walking, effectively employing a greedy strategy for convenience.
(ii)
Random (Uncontrolled) Method: Each arriving car is assigned to a randomly chosen available spot. This approach does not optimize any particular objective but can serve as a neutral baseline; in practice, it may help avoid the competitive behavior of everyone aiming for the same preferred spots.
(iii)
Balanced Objective Method: Each arriving car is assigned to a spot by considering a combination of driving distance and walking distance, giving both factors equal (or at least significant) weight. In this approach, neither driving nor walking distance is ignored; the goal is to strike a compromise between minimizing travel distance within the lot (for lower emissions) and minimizing walking distance (for higher user comfort).
Methods (i) and (iii) above can be formulated as optimization-based selections using a cost function, whereas method (ii) represents a non-optimized baseline. To generalize these approaches, let us define a composite cost metric for assigning car n to spot p at time t n . We introduce
C p = ω D ˜ p + ( 1 ω ) L ˜ p ,
where ω [ 0 , 1 ] is a tunable trade-off weight between driving and walking components; here, D ˜ p and L ˜ p are the normalized driving and walking distances for spot p, respectively. Specifically, we scale D ˜ p = D p / D max and L ˜ p = L p / L max , where D max = max q P D q is the longest driving distance among all spots and L max = max q P L q is the longest walking distance among all spots. Here, D max and L max represent the maximum driving and walking distances within the parking lot. By scaling distances by D max and L max , the cost weights automatically adapt to different lot sizes. After this normalization, both D ˜ p and L ˜ p range from 0 to 1, making them comparable in magnitude. The parameter ω then determines the relative emphasis: for example, ω = 0.5 yields an equal weighting of driving and walking distances in the cost function. Using this cost formulation, the above schemes can be expressed as special cases:
(a)
In the greedy method (i), we set ω = 0 (ignoring driving distance entirely). The cost C p then reduces to just L ˜ p , and the allocation decision for car n is to choose the spot with the minimum walking distance:
p n = arg min p P free ( t n ) L p
Here, P free denotes the set of available parking spaces for allocation. The shortcomings of this method are that it can lead to many drivers converging on the few closest spots, potentially causing conflicts and localized congestion near the entrance during peak periods.
(b)
The random method (ii) does not use the cost function C p ; instead, p n is selected uniformly at random from the available spots. This method serves as a control case that avoids the biased use of particular spots. Notably, a random allocation can, in some situations, outperform a naive greedy approach by distributing vehicles more evenly, thereby preventing excessive crowding in any one area of the lot.
(c)
For the balanced method (iii), we choose an intermediate ω (for instance, ω = 0.5 for equal weighting) to account for both driving and walking distances. In this case, the assignment for car n is based on minimizing the combined cost:
p n = arg min p P free ( t n ) C p
This method avoids the extreme biases of the purely greedy approach; however, it still does not differentiate between different types of vehicles or the number of passengers.
The aforementioned baseline methods have apparent limitations, especially as the parking lot becomes crowded. Importantly, in the cost formulation of Equation (9) and the decisions in Equations (10) and (11), all vehicles and users are treated uniformly. The model does not account for the fact that an EV produces essentially zero emissions while driving inside the lot (unlike a GV, which burns fuel and emits CO2 during driving within the parking facility), nor does it account for the situation where a car has multiple passengers (each additional passenger means additional person–distance walked, affecting overall user comfort). As occupancy approaches capacity (peak congestion conditions), providing an optimal experience for every user with these simple methods becomes increasingly complex due to limited spot availability. These shortcomings motivate the development of an improved allocation scheme that incorporates sustainability (emissions) and user comfort more comprehensively. The following subsection presents the proposed optimization system with an emphasis on an eco-friendly approach and the advantages of the incentive system that addresses these issues.

2.2.2. Proposed Optimization Scheme with Incentive Benefit

We have developed an incentive-based parking optimization framework designed to enhance sustainability by explicitly incorporating vehicle emission characteristics into the system’s cost function, along with incentive rewards for eligible users, while maintaining a high level of user comfort. Empirical insights from existing optimal parking systems, as well as our prior research [33], demonstrate that parking spot allocation efficiency substantially deteriorates when occupancy rates range between 60% and 100%, primarily due to constraints imposed by limited space availability. In our previous research [30], we focused exclusively on conventional optimization methodologies. Conversely, in this proposed approach, we introduce an environmentally sustainable optimization framework designed to broaden the scope of comparative analysis and rigorously assess its performance relative to the existing methods. This advancement aims not only to enhance optimization efficacy but also to align the system with long-term sustainability objectives, effectively contributing to congestion mitigation and environmental preservation, and by incorporating a term to reflect the walking inconvenience of multiple passengers. To address these concerns, we modify the cost function in Equation (9) to an adaptive weighted cost F p ( n ) for each incoming car n as
F p ( n ) = ω n D ˜ p + 1 ω n L ˜ p + κ U n 1 L ˜ p
where U n is the number of passengers in car n (including the driver), κ is a constant factor that represents the additional cost penalty per extra passenger beyond the driver. The key new element here is ω n , an adaptive trade-off weight that depends on the vehicle’s emission category. We define ω n based on the vehicle type as
ω n = ω EV , if vehicle n is an EV or HEV , ω GV , if vehicle n is a gasoline vehicle ( GV ) ,
with the value chosen such that ω EV < ω GV . In other words, for low-emission vehicles, such as electric vehicles (EVs)/hybrid electric vehicles (HEVs), the weight on the driving distance term is reduced relative to that for high-emission conventional cars. According to the cost function in Equation (12), these eco-friendly vehicles can effectively drive further within the lot (if needed to find a spot) without incurring a heavy penalty, as their driving contributes negligible direct emissions. Conversely, gasoline vehicles are assigned a larger weight ω n , meaning that the driving distance term carries more importance in F p ( n ) , which discourages sending a GV to a far-off spot that would require a long drive and produces more emissions. The second term of (12), with factor ( 1 ω n ) , corresponds to the weighted walking distance; this is automatically higher in influence for EVs (since ω n is lower, 1 ω n is higher) and lower for GVs, reflecting a design choice to gently incentivize gasoline car users to accept a slightly longer walk if it means reducing driving distance. The third term κ ( U n 1 ) L ˜ p adds an extra penalty proportional to the number of passengers beyond the driver, thereby accounting for the fact that if, say, U n = 4 people are in the car, the total discomfort of walking is higher than if U n = 1 . This term ensures that cars carrying more people are more likely to be assigned to closer spots than cars with a single occupant, all else being equal, which aligns with improving overall user comfort for groups. The optimization problem for each arriving vehicle is then to find the parking spot p that minimizes the cost function F p ( n ) subject to the spot being available. Mathematically, for each car n arriving at time t n we select
p n = arg p P free ( t n ) min F p ( n )
This optimization decision is made instantaneously for each arriving vehicle based on the current state of the parking lot (which spots are free and the attributes of the arriving car). The objective function (12) is constructed to be convex when viewed in its continuous relaxation; however, because the actual decision domain at time n consists solely of the discrete set of unoccupied spots P free ( t n ) , one can perform an exhaustive evaluation of F p ( n ) over all available p. In a parking facility of moderate scale (in the order of a few hundred spaces), computing F p ( n ) for each candidate spot p is computationally negligible; each assignment can be resolved in real-time. Consequently, the proposed incentive-based framework incorporates an emission-weighted cost term that biases decisions towards low-emission vehicles while simultaneously offering incentive rewards that encourage drivers to avoid peak-hour demand. The system explicitly promotes environmental sustainability without compromising real-time operability by dynamically redistributing arrivals to less-congested periods and emission-favorable slots.

2.3. Parking Allocation System

The proposed parking space allocation method assigns arriving vehicles to parking spots based on the information or user data of each incoming car. In this approach, when a vehicle arrives and requests a parking space, the system collects relevant information (such as the vehicle type or driver’s past preferences). It employs an optimization-based decision process to identify the most suitable available parking space. The assignment is made in real time and aims to satisfy predefined optimization objectives (for example, minimizing search time or balancing lot occupancy). This methodology is demonstrated in a real-world context using a busy shopping complex parking lot in Japan, which serves as a case study for evaluating the effectiveness of the proposed allocation system.

3. Simulation Results

3.1. Simulation Framework and Setup

A discrete-time simulation framework was developed to evaluate the proposed environmentally friendly, incentive-based parking allocation algorithm under realistic operational conditions. A comprehensive model of the case study facility was implemented using MATLAB R2024b, and the algorithm’s performance was thoroughly assessed across typical demand and congestion scenarios. The facility model represents a large shopping center parking lot in Japan and simulates daily operations over the interval from 07:00 to 23:00. Arrival events are generated probabilistically according to an empirically derived hourly demand distribution D t , which captures two primary peak intervals (a different pattern depends on weekdays or weekends) based on observed traffic counts. Each 1 h time step t is assigned an expected arrival rate λ t . To capture day-to-day variability, the simulation is executed over a multi-day horizon (e.g., five consecutive weekdays and two days as the weekend), thereby preserving typical temporal fluctuations in arrival volumes. Upon generating the arrival pattern, each incoming vehicle is categorized as either an electric vehicle (EV) or a conventional gasoline vehicle (GV) in a stochastic manner; approximately 40% of arrivals are assigned to the EV class based on recent Japanese sales statistics [34]. The resulting dynamic arrival pattern, characterized by distinct peak and off-peak intervals, provides a realistic scenario for assessing the intelligent, emission, incentive-based allocation algorithm.
In the proposed eco-friendly incentive-based parking allocation system, electric vehicles (EVs) are assigned a lower driving distance weight, ω E V . This effectively assigns a higher relative weight ( 1 ω E V ) to walking distance compared to gasoline vehicles (GVs). An inappropriate selection of these weights could adversely impact overall user comfort by overly prioritizing EV users and consistently allocating them preferential parking locations. To prevent this imbalance, the weights ω E V and ω G V are carefully calibrated to minimize the driving distance for GVs while maintaining an aggregate walking distance comparable to a balanced optimal allocation scenario, where both EVs and GVs receive the exact weighting. Specifically, based on the described methodology, the optimization parameters are set as follows: D max = 228.5 m , L max = 78 m , ω E V = 0.4 , and ω G V = 0.6 . The choice of ω E V and ω G V (0.4 and 0.6) was made to favor EVs, while maintaining a total walking distance comparable to the balanced scenario, thereby preventing any extreme bias.

3.2. Demand (Arrival) Pattern Characteristics in Simulation

To ensure that the allocation system accommodates typical demand variations, two distinct user demand patterns were incorporated in the simulation for weekdays and weekends, as illustrated in Figure 3. The analysis of parking usage data from the case study site revealed that weekdays exhibit two pronounced peak periods in demand (generally around midday and early evening). Weekends similarly exhibit two peak demand periods, but these peaks tend to be broader and sustained over longer portions of the day than those on weekdays. These insights were obtained through comprehensive field observations of parking occupancy at different times and surveys of users about their parking habits. Based on this behavioral analysis, a representative hourly demand profile was constructed for the facility, capturing the typical rise and fall of parking demand throughout the day, as well as the differences between weekday and weekend patterns. In the simulation analysis, the average daily vehicle volume was approximately 2000 cars for weekdays, whereas weekend scenarios exhibited higher demand with an average of about 2500 vehicles per day. In the next section, we present a comprehensive simulation study that benchmarks this eco-friendly, incentive-driven optimization scheme against conventional allocation methods, demonstrating its advantages in both congestion mitigation and emission reduction.

3.3. Calculation of Emission and Fuel Consumption

In the emission-minimizing incentive-based approach, vehicle emission classifications are integrated into the parking allocation system through Equations (12)–(14), with user comfort being based on vehicle occupancy. Eco-friendly vehicles, including EVs and HEVs, can be promoted with significant advantages owing to their minimal emissions during low-speed operation, thereby supporting the prioritization of their access within driving and allocation schemes. The effectiveness of the four parking allocation methods is independently assessed for weekday and weekend scenarios, with performance metrics averaged over five weekdays and two weekend days, respectively. Furthermore, we developed a detailed model that captures precise acceleration profiles within the parking facility, allowing for an accurate analysis of fuel consumption and emissions. To estimate vehicle fuel use and CO2 emissions from instantaneous speed and acceleration typical of parking maneuvers, we employ the widely recognized VT-Micro model [35], known for its simplicity and frequent use in transportation emission studies [36,37]. Considering the operational environment within enclosed parking facilities, a maximum driving speed of 15 km/h is adopted.

3.4. Real Parking Survey and Influence of Incentive Model

In our proposed model, one critical assumption is that a fraction of users (denoted by δ ) will adjust their parking schedules in response to incentives. We conducted a field study of an incentive program to validate this assumption and align our model with actual behavior. The experiment took place at the parking facility of a local supermarket in Gunma, Japan. Management implemented a simple reward system targeting days for senior citizens, who were offered a modest discount voucher to encourage them to visit on that day. This initiative aimed to encourage them to visit on that particular day. The field observations described here were conducted over a week, with one designated ‘incentive day’ compared against other days.

3.5. Results

Initially, we evaluate the results from the incentive model formulation detailed in the methodology (Section 2). Utilizing Equation (1), the analysis focuses on tracking vehicle arrivals by assigning unique identification (ID) numbers to each vehicle and systematically recording their respective arrival times within predetermined intervals. Each arriving vehicle was assigned an ID, and its entry time was recorded; however, parking durations were not tracked, and no specific time limit was imposed. However, observation intervals begin at T s = 7 AM and the observation intervals conclude at T f = 11 PM. Finally, the total number of discrete time intervals considered is M, spanning 17 h.
Subsequently, we define an optimal occupancy threshold to identify and analyze congestion intervals based on vehicle arrival patterns. This occupancy threshold is systematically determined to ensure that operational occupancy consistently remains within the optimal utilization range, specifically between 60% and 100%, as previously established in another study [33]. Consequently, an occupancy threshold O th = 80 % , representing the median value within this recommended operational interval, is selected for further analysis. Next, we proceed with the analysis using Equation (2), where the vehicle arrival rate is redefined in terms of occupancy rate, specifically by identifying intervals where occupancy surpasses the predetermined threshold, so max O p ( t ) > O th . This assessment is conducted within the defined arrival time range, spanning from the start time to the end time of the interval, as T s ( τ ) < t i n ( n ) T f ( τ ) and consistent with the previous setup, the time interval ( τ ) continues to span a total duration of M, as τ { 1 , 2 , 3 , , M } . Consequently, based on the aforementioned criteria, the identified peak congestion intervals ( H c ) are defined as H c = { 11 , 12 , 13 , 17 , 18 , 19 } for weekdays and H c = { 11 , 12 , 13 , 14 , 15 , 16 , 17 , 18 , 19 } for weekends, reflecting the periods during which occupancy consistently exceeds the established threshold. Additionally, low-congestion intervals ( L c ) are determined as the complement of the identified peak congestion intervals ( H c ) , defined according to Equations (2) and (3), specifically ( L c H c ) .
Next, we calculate the demand shift fraction, denoted by δ , using the methodology outlined in Equation (4). To establish a practical and realistic estimate, we reference data obtained from our survey, which indicates that the parking system administration implemented a 5% incentive aimed at motivating users to shift their parking behavior to off-peak intervals. According to the survey results, the proportion of flexible users, ( β ) , is identified as 0.20 , while the fraction of these flexible users responsive to incentives, ( α ) , is determined to be 0.30 . Consequently, the resulting demand shift fraction is calculated as δ = α β = 6 , corresponding to a 6% shift. However, the adjustment of vehicle arrival numbers is performed according to Equations (5) and (6). Specifically, the demand reduction during peak periods is denoted by N peak , and the corresponding demand redistribution to off-peak intervals is represented as N off-peak . These calculations are directly based on the results discussed earlier. The simulation was conducted across various benchmark methods, including the proposed emission-minimizing, incentive-based approach. Key user experience metrics, such as average driving distance and average walking distance, should be evaluated for each method to facilitate a comprehensive comparative analysis.
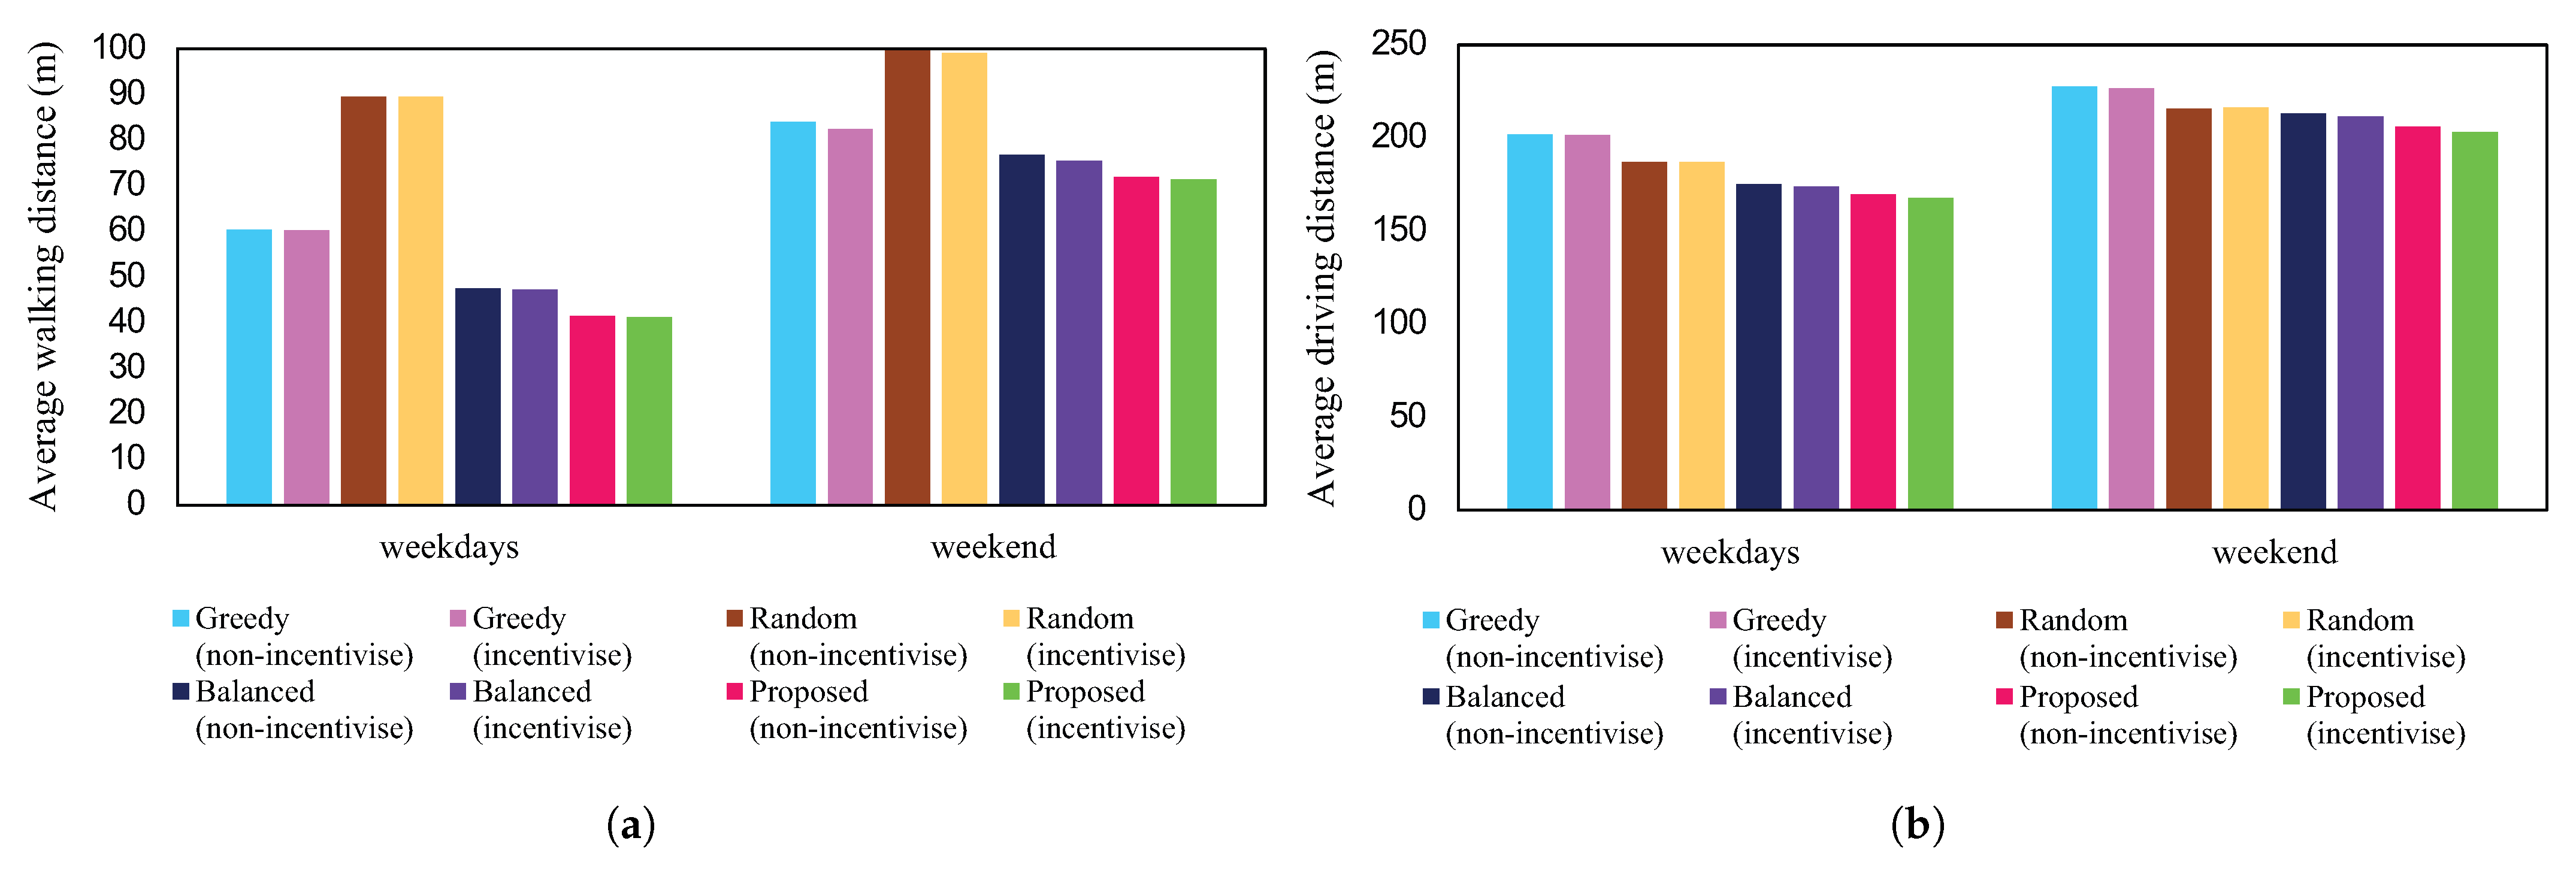
Figure 4 presents a comparative analysis of the mean walking and driving distances per vehicle for various allocation strategies, including the proposed method, across both weekday and weekend arrival patterns. The integration of an incentive mechanism within each strategy is shown to consistently reduce both driving and walking distances, thereby improving the operational efficiency and supporting environmental sustainability goals. A rigorous evaluation of key performance indicators highlights that the proposed method consistently outperforms conventional allocation strategies in terms of user mobility and overall system effectiveness. Specifically, transitioning from the traditional greedy allocation to the proposed approach results in a progressive decrease in both average driving and walking distances. It is noteworthy, however, that the random allocation strategy exhibits an increase in walking distance, which underscores its limitations regarding user convenience.
To further contextualize these outcomes, Table 1 details the driving and walking distances for each method during peak and off-peak periods. Under the non-incentivized scenario, the proposed method reduced average driving distances during peak periods to 171.69 m on weekdays and 207.83 m on weekends, compared to 204.94 m and 229.16 m, respectively, observed with the baseline greedy approach. When the incentive mechanism was incorporated, driving distances declined even further to 169.35 m (weekdays) and 205.91 m (weekends), the lowest across all strategies considered. Similarly, average walking distances during peak periods dropped from 61.55 m (greedy, non-incentivized) to 43.26 m (proposed, non-incentivized) on weekdays and from 85.69 m to 71.33 m on weekends, with additional improvements observed when incentives were applied. These findings indicate that all allocation strategies helped reduce travel distances during peak periods, primarily due to a behavioral shift toward off-peak usage. However, under incentivized conditions, both driving and walking distances showed increases during off-peak periods, reflecting the higher volumes of vehicles redirected from peak intervals.
Table 2 presents an analysis of improvements between the baseline greedy (walking-minimizing) method and the proposed emission-minimizing, incentive-based allocation. Under the non-incentivized scenario, the optimized allocation resulted in a 15.93% reduction in average weekday driving distance (from 201.81 m to 169.66 m) and a 9.46% reduction on weekends (from 227.69 m to 206.14 m). Incorporating the emission-free incentive scheme, which strategically favors eco-friendly vehicles (EVs/HEVs) due to their negligible emissions, resulted in further decreases: weekday driving distances fell by 16.83% to approximately 167.86 m, and weekend driving distances by 10.80% to 203.11 m. Corresponding improvements in walking distances were also observed. The non-incentivized optimized allocation reduced weekday walking distances by 31.18% (from 60.36 m to 41.54 m) and weekend distances by 14.33% (from 84.04 m to 72.00 m), while the introduction of incentives further amplified these reductions by 31.76% on weekdays (to 41.19 m) and 15.03% on weekends (to 71.41 m). Overall, these results confirm that the incentive-induced redistribution of parking demand consistently enabled more drivers to park closer to their destinations, particularly during peak congestion periods. This outcome led to significant enhancements in both operational efficiency and environmental performance, thereby fulfilling the primary research objective of optimizing user experience and system sustainability across all allocation strategies.
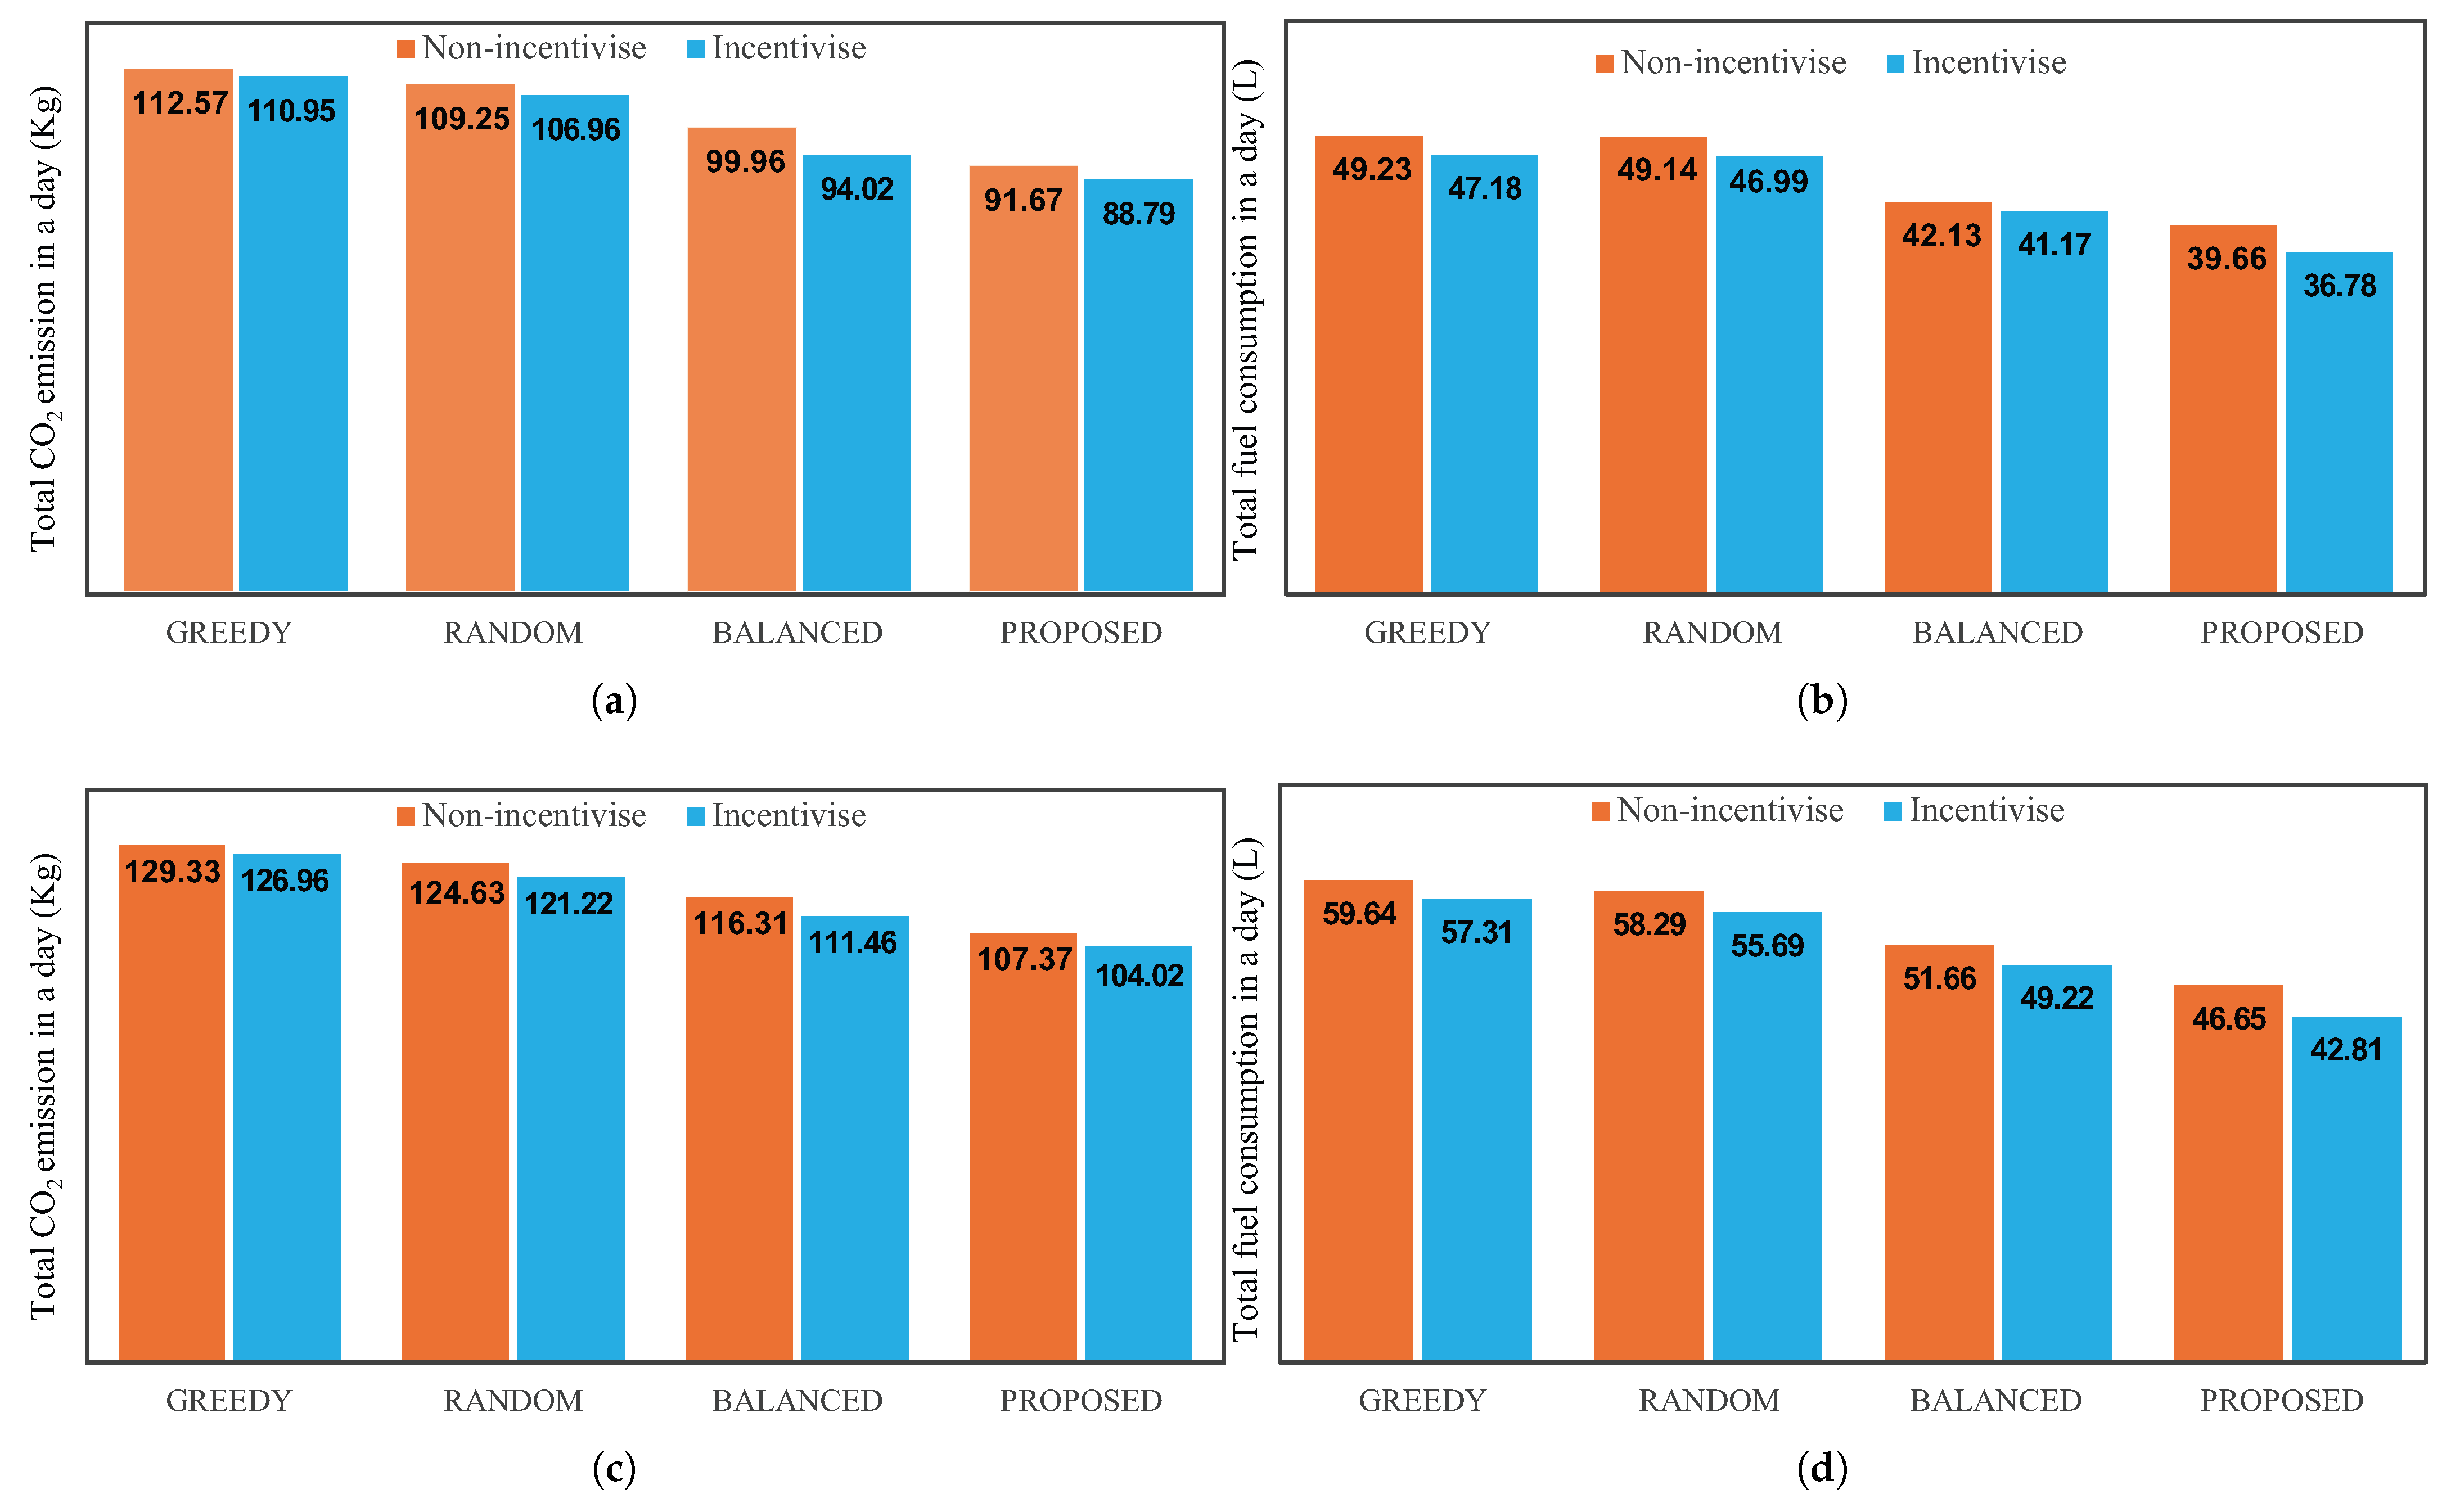
Figure 5 presents a comparative analysis of average CO2 emissions and fuel consumption for vehicles under different parking allocation strategies, including greedy, random, balanced, and the proposed incentive-based method, evaluated using the VT micro model [35]. The results demonstrate that the proposed incentive-driven model consistently achieves lower CO2 emissions and fuel consumption compared to non-incentivized and baseline methods. Specifically, during weekdays, the proposed incentivized method reduced CO2 emissions by approximately 21.13% (from 112.57 kg/day to 88.79 kg/day) relative to the greedy non-incentivized baseline. Similarly, fuel consumption was reduced by about 25.28% (from 49.23 L/day to 36.78 L/day). Weekend results exhibit similar trends: the proposed incentive model lowered CO2 emissions by approximately 19.55% (from 129.33 kg/day to 103.02 kg/day) and fuel consumption by approximately 28.24% (from 59.64 L/day to 42.81 L/day) compared to the greedy baseline model. Moreover, even when evaluated against other advanced allocation strategies, such as the balanced allocation without incentives, the proposed incentivized model demonstrated superior environmental performance. This outcome highlights the tangible benefits of incorporating demand elasticity incentives, which not only reduce vehicular emissions but also generate substantial fuel savings for drivers, thereby lowering associated fuel costs. These sustainability improvements underline the effectiveness of the incentive-based approach, not merely in optimizing parking system efficiency but also in advancing broader environmental goals through reduced unnecessary driving and smoother parking traffic flows.

4. Discussion

A key strength of the proposed model is its modular and scalable architecture, which allows it to accommodate any parking lot size or operational scenario. Modularity means the system is composed of interchangeable components that handle distinct functions (for instance, occupancy detection, reservation and allocation logic, and user incentive management). This design philosophy is common in advanced parking systems – for example, one smart parking framework consists of separate modules for monitoring available spaces, managing reservations, and ensuring secure access. By organizing our model in a modular format, each component can be independently optimized or expanded to meet local needs without necessitating a complete system overhaul. Additionally, the model is designed to be highly scalable. Whether deployed in a small parking lot or across a city-wide network of garages, the system can efficiently accommodate increasing users and vehicles. Prior research highlights the importance of scalability in parking solutions, emphasizing that a “scalable dynamic parking allocation framework” is crucial for maintaining service quality as demand increases [38]. Our model embodies this principle, allowing it to seamlessly scale up to manage thousands of parking spots or integrate new technologies (such as additional sensors or payment methods) as needed.
We note that our simulation assumes typical weekday and weekend demand profiles along with constant probabilities for vehicle types. In practice, however, factors such as weather conditions, holidays, or special events can significantly influence both arrival patterns and the composition of the vehicle mix. To better capture such variability, future extensions of this work could employ scenario-based demand models or incorporate stochastic factors (e.g., weather-dependent arrival rates).
While our initial comparisons mainly focused on traditional allocation methods through simulation modeling, it is important to emphasize that dynamic pricing and machine learning approaches represent complementary research directions. These techniques have demonstrated potential in improving demand prediction and enabling real-time allocation. In contrast, our proposed framework uniquely integrates incentive-driven demand management with eco-friendly vehicle prioritization, thereby advancing both operational efficiency and sustainability objectives.
The effectiveness of incentives depends on the target users. While we used shopping store discounts in our case study, other contexts may require different rewards. For example, off-peak commuters might receive parking credits, public transit vouchers, or reduced fees. In general, the incentive mechanism is flexible—it can accommodate any reward (monetary or non-monetary) appropriate to the setting. We acknowledge that the effectiveness of incentives may vary depending on their magnitude, user preferences, and external conditions (e.g., weather or holidays). Our use of fixed α and β values represents a necessary simplification based on available survey data. Future research should therefore consider more detailed behavioral models or adaptive incentive mechanisms to capture such complexities better. Finally, we note that our analysis focused on a single parking facility. Extending the model to multiple lots or a city-wide network is a crucial direction for future research, as interactions between parking sites can influence demand shifts and congestion patterns.

5. Conclusions

This study has developed an incentive-based intelligent parking management system aimed at reducing peak-period congestion through targeted incentives. Comprehensive simulation analyses, informed by real-world data, demonstrated that the proposed approach significantly improved operational efficiency and sustainability compared to traditional parking allocation strategies. Specifically, the incentive-based method consistently outperformed the baseline (greedy), random, and balanced allocation methods by achieving considerable reductions in average driving and walking distances, fuel consumption, and CO2 emissions. Notably, the incentivized allocation model reduced driving distances by approximately 16.83% on weekdays and 10.80% on weekends, and walking distances by 31.76% and 15.03%, respectively. Moreover, fuel usage decreased by about 25.28% (weekdays) and 28.24% (weekends), while CO2 emissions were lowered by around 21.13% (weekdays) and 19.55% (weekends).
The results underscore the substantial potential of incentive-driven parking management to alleviate congestion, optimize resource utilization, and make a significant contribution to urban sustainability goals. Future research directions will explore real-time implementation of the proposed system, dynamic incentive schemes responsive to varying congestion levels, and scalability assessments for broader deployment within extensive urban parking networks.

Author Contributions

Conceptualization, N.S., A.S.M.B. and M.A.S.K.; methodology, N.S., A.S.M.B. and M.A.S.K.; software, N.S.; validation, M.A.S.K. and K.Y.; formal analysis, N.S.; investigation, M.A.S.K.; resources, M.A.S.K.; data curation, N.S.; writing—original draft preparation, N.S.; writing—review and editing, A.S.M.B., M.A.S.K. and K.Y.; visualization, N.S.; supervision, A.S.M.B., M.A.S.K. and K.Y.; project administration, A.S.M.B. and M.A.S.K.; funding acquisition, M.A.S.K. All authors have read and agreed to the published version of the manuscript.

Funding

The authors acknowledge financial support from the Japan Society for the Promotion of Science (JSPS) Grants-in-Aid for Scientific Research (C) 23K03898.

Institutional Review Board Statement

Not applicable.

Informed Consent Statement

Not applicable.

Data Availability Statement

Data are contained within the article.

Conflicts of Interest

The authors declare no conflicts of interest. The funders had no role in the design of the study; in the collection, analyses, or interpretation of data; in the writing of the manuscript; or in the decision to publish the results.

References

  1. Xu, S.; Sun, C.; Liu, N. Road congestion and air pollution -analysis of spatial and temporal congestion effects. Sci. Total Environ. 2024, 945, 173896. [Google Scholar] [CrossRef] [PubMed]
  2. Li, W.; Feng, W.; Yuan, H. Multimode Traffic Travel Behavior Characteristics Analysis and Congestion Governance Research. J. Adv. Transp. 2020, 2020, 1–8. [Google Scholar] [CrossRef]
  3. Zang, J.; Jiao, P.; Liu, S.; Zhang, X.; Song, G.; Yu, L. Identifying traffic congestion patterns of urban road network based on Traffic Performance index. Sustainability 2023, 15, 948. [Google Scholar] [CrossRef]
  4. Meena, K.K.; Goswami, A.K. A review of air pollution exposure impacts on travel behaviour and way forward. Transp. Policy 2024, 154, 48–60. [Google Scholar] [CrossRef]
  5. Ajayi, S.A.; Adams, C.A.; Dumedah, G.; Adebanji, O.A.; Ababio-Donkor, A.; Ackaah, W.; Kehinde, A. Public perceptions of vehicular traffic emissions on Health Risk in Lagos metropolis nigeria: A critical survey. Heliyon 2023, 9, e15712. [Google Scholar] [CrossRef]
  6. Paiva, S.; Ahad, M.; Tripathi, G.; Feroz, N.; Casalino, G. Enabling Technologies for Urban Smart Mobility: Recent trends, opportunities and challenges. Sensors 2021, 21, 2143. [Google Scholar] [CrossRef]
  7. Kirschner, F.; Lanzendorf, M. Parking management for promoting sustainable transport in urban neighbourhoods. A review of existing policies and challenges from a German perspective. Transp. Rev. 2019, 40, 54–75. [Google Scholar] [CrossRef]
  8. Chen, R.; Gao, G.; Kang, L.-J.; Zhang, L.-Y. Efficiency and equity analysis on Parking Reservation. Transp. Res. Part E Logist. Transp. Rev. 2024, 187, 103606. [Google Scholar] [CrossRef]
  9. Liu, W.-J.; Li, Z.-C.; Yang, H. Gasoline and electric vehicle ownership rationing over time: Lottery vs. first-come-first-served schemes. Transp. Res. Part B Methodol. 2024, 186, 102995. [Google Scholar] [CrossRef]
  10. Verma, S.K.; Verma, R.; Singh, B.K.; Sinha, R.S. Management of Intelligent Transportation Systems and Advanced Technology. In Intelligent Transportation System and Advanced Technology; Energy, Environment, and Sustainability; Springer: Berlin/Heidelberg, Germany, 2024; pp. 159–175. [Google Scholar]
  11. Elassy, M.; Al-Hattab, M.; Takruri, M.; Badawi, S. Intelligent Transportation Systems for Sustainable Smart Cities. Transp. Eng. 2024, 16, 100252. [Google Scholar] [CrossRef]
  12. Shen, T.; Hua, K.; Liu, J. Optimized public parking location modelling for Green Intelligent Transportation System using genetic algorithms. IEEE Access 2019, 7, 176870–176883. [Google Scholar] [CrossRef]
  13. Musa, A.A.; Malami, S.I.; Alanazi, F.; Ounaies, W.; Alshammari, M.; Haruna, S.I. Sustainable Traffic Management for smart cities using internet-of-things-oriented intelligent transportation systems (ITS): Challenges and recommendations. Sustainability 2023, 15, 9859. [Google Scholar] [CrossRef]
  14. Luque-Vega, L.F.; Michel-Torres, D.A.; Lopez-Neri, E.; Carlos-Mancilla, M.A.; González-Jiménez, L.E. IOT smart parking system based on the visual-aided smart vehicle presence sensor: Spin-V. Sensors 2020, 20, 1476. [Google Scholar] [CrossRef]
  15. Jabbar, W.A.; Wei, C.W.; Azmi, N.A.; Haironnazli, N.A. An IOT raspberry pi-based parking management system for Smart Campus. Internet Things 2021, 14, 100387. [Google Scholar] [CrossRef]
  16. Al-Turjman, F.; Malekloo, A. Smart parking in IOT-enabled cities: A survey. Sustain. Cities Soc. 2019, 49, 101608. [Google Scholar] [CrossRef]
  17. Xu, D.; Shi, Y.; Ji, Z. Model-free adaptive discrete-time integral sliding-mode-constrained-control for autonomous 4WMV Parking Systems. IEEE Trans. Ind. Electron. 2018, 65, 834–843. [Google Scholar] [CrossRef]
  18. Zhang, Y.; Wang, C.-Y.; Wei, H.-Y. Parking reservation auction for parked vehicle assistance in Vehicular Fog Computing. IEEE Trans. Veh. Technol. 2019, 68, 3126–3139. [Google Scholar] [CrossRef]
  19. Lin, T.; Rivano, H.; Le Mouel, F. A survey of Smart Parking Solutions. IEEE Trans. Intell. Transp. Syst. 2017, 18, 3229–3253. [Google Scholar] [CrossRef]
  20. Lu, K.; Zheng, B.; Shi, J.; Xu, Y. Automated optimal parking slot prediction using Deep Learning and digital twin technology aided parking space management for Material Science Application. Alex. Eng. J. 2025, 122, 229–242. [Google Scholar] [CrossRef]
  21. Su, Z.; Liu, X.; Li, H.; Zhang, T.; Liu, X.; Jiang, Y. A vehicle trajectory-based parking location recognition and inference method: Considering both travel action and intention. Sustain. Cities Soc. 2025, 119, 106088. [Google Scholar] [CrossRef]
  22. Tsiropoulou, E.E.; Baras, J.S.; Papavassiliou, S.; Sinha, S. RFID-based Smart Parking Management System. Cyber-Phys. Syst. 2017, 3, 22–41. [Google Scholar] [CrossRef]
  23. Abdulkader, O.; Bamhdi, A.M.; Thayananthan, V.; Jambi, K.; Alrasheedi, M. A novel and secure smart parking management system (SPMS) based on integration of WSN, RFID, and IOT. In Proceedings of the 15th Learning and Technology Conference (L&T), Jeddah, Saudi Arabia, 25–26 February 2018; pp. 102–106. [Google Scholar]
  24. Chen, H.; Wu, H.; Li, H.; Chen, F.; Shui, S.; Li, Z. Bi-level optimal scheduling of Integrated Energy Systems considering incentive-based demand response and Green Certificate-Carbon Trading Mechanisms. Energy Rep. 2025, 13, 330–344. [Google Scholar] [CrossRef]
  25. Gao, W.; Liang, X.; Zhao, F.; Wang, Z. Research on demand response mechanism based on Price Incentive Driven Directrix Load. In Proceedings of the 4th New Energy and Energy Storage System Control Summit Forum (NEESSC), Hohhot, China, 9–31 August 2024; pp. 231–235. [Google Scholar]
  26. Bakibillah, A.S.M.; Paw, Y.F.; Kamal, M.A.S.; Susilawati, S.; Tan, C.P. An incentive based dynamic ride-sharing system for Smart Cities. Smart Cities 2021, 4, 532–547. [Google Scholar] [CrossRef]
  27. Tang, Q.; Hu, X. Triggering behavior changes with information and incentives: An active traffic and demand management-oriented review. In The Evolving Impacts of ICT on Activities and Travel Behavior; Advances in Transport Policy and Planning; Elsevier: Amsterdam, The Netherlands, 2019; pp. 209–250. [Google Scholar]
  28. Tian, Y.; Li, Y.; Sun, J.; Ye, J. Characterizing favored users of incentive-based Traffic Demand Management Program. Transp. Policy 2021, 105, 94–102. [Google Scholar] [CrossRef]
  29. Metropia Mobility as a Service. Available online: https://www.metropia.com/ (accessed on 26 August 2025).
  30. Sakib, N.; Bakibillah, A.S.M.; Kamal, M.A.S.; Yamada, K. An incentive-based parking management system for reducing congestion during peak demands. In Proceedings of the SICE International Symposium on Control Systems (SICE ISCS), Osaka, Japan, 3–5 March 2025; pp. 113–118. [Google Scholar]
  31. Sakib, N.; Bakibillah, A.S.M.; Kamal, M.A.S.; Yamada, K. Intelligent parking management for sustainable society: A data-driven demand elasticity incentive model. Sustain. Cities Soc. 2025, 106864. [Google Scholar] [CrossRef]
  32. Asitha, K.S.; Khoo, H.L. Incentivised travel and mobile application as multiple policy intervention for Mode Shift. KSCE J. Civ. Eng. 2020, 24, 3074–3091. [Google Scholar] [CrossRef]
  33. Sakib, N.; Bakibillah, A.S.M.; Susilawati, S.; Kamal, M.A.S.; Yamada, K. Eco-friendly smart car parking management system with enhanced sustainability. Sustainability 2024, 16, 4145. [Google Scholar] [CrossRef]
  34. Japan Electric Vehicles. International Trade Administration. Available online: https://www.trade.gov/market-intelligence/japan-electric-vehicles (accessed on 25 August 2025).
  35. Rakha, H.; Ahn, K.; Trani, A. Development of VT-micro model for estimating Hot Stabilized Light Duty Vehicle and truck emissions. Transp. Res. Part D Transp. Environ. 2004, 9, 49–74. [Google Scholar] [CrossRef]
  36. Bakibillah, A.S.M.; Kamal, M.A.S.; Tan, C.P.; Hayakawa, T.; Imura, J. Optimal eco-driving scheme for reducing energy consumption and carbon emissions on curved roads. Heliyon 2024, 10, e23586. [Google Scholar] [CrossRef]
  37. Lu, C.; Liu, C. Ecological control strategy for cooperative autonomous vehicle in mixed traffic considering linear stability. J. Intell. Connect. Veh. 2021, 4, 115–124. [Google Scholar] [CrossRef]
  38. Makarova, I.; Mavrin, V.; Sadreev, D.; Buyvol, P.; Boyko, A.; Belyaev, E. Rational organization of urban parking using microsimulation. Infrastructures 2022, 7, 140. [Google Scholar] [CrossRef]
Figure 1. Overall working process of the proposed incentive-based parking management system.
Sustainability 17 09093 g001
Figure 2. Block diagram of the proposed incentive model.
Sustainability 17 09093 g002
Figure 3. Average car arrival pattern (user demand) at (a) weekdays and (b) weekend (Saturday and Sunday).
Sustainability 17 09093 g003
Figure 4. A comparative analysis was conducted to examine (a) the average walking distances and (b) the average driving distances for vehicles based on four allocation strategies: greedy, random, balanced, and the proposed method. This evaluation considered both incentivized and non-incentivized scenarios, as well as weekday and weekend arrival patterns.
Sustainability 17 09093 g004
Figure 5. A comparative analysis is presented for (a) average CO2 emissions and (b) average fuel consumption of vehicles under the greedy, random, and optimal allocation methods for weekdays arrival patterns. Additionally, panels (c,d) illustrate the corresponding average CO2 emissions and fuel consumption for each method under weekend arrival patterns.
Sustainability 17 09093 g005
Table 1. Analysis of driving and walking distances based on different periods (peak and off-peak) in an average day (weekdays and weekend).
MethodPeriodWalkingDistance (m)DrivingDistance (m)
Weekdays Weekend Weekdays Weekend
GreedyPeak61.5585.69204.94229.16
(non-incentivize)Off-peak59.1682.39198.69226.21
GreedyPeak58.8980.67201.02224.86
(incentivize)Off-peak61.4884.31202.11228.22
RandomPeak91.20101.33189.62216.00
(non-incentivize)Off-peak87.6698.06184.65215.60
RandomPeak88.2397.36187.25214.81
(incentivize)Off-peak90.90100.79186.63217.65
BalancedPeak50.1577.61188.94214.23
(non-incentivize)Off-peak45.0475.92161.68212.45
BalancedPeak47.5774.08183.17210.00
(incentivize)Off-peak46.8376.95164.55213.26
ProposedPeak43.2671.33171.69207.83
(non-incentivize)Off-peak39.8172.68167.63204.44
ProposedPeak40.8368.26166.38200.31
(incentivize)Off-peak41.5574.55169.35205.91
Table 2. The comparison analysis of driving and walking distances in (m) from greedy to proposed method in an average day (weekdays and weekend).
MethodWalkingDistance (m)DrivingDistance (m)
Weekdays Weekend Weekdays Weekend
Greedy60.3684.04201.81227.69
(non-incentivize)(Base)(Base)(Base)(Base)
Proposed41.5472.00169.66206.14
(non-incentivize)(−31.18%)(−14.33%)(−15.93%)(−9.46%)
Proposed41.1971.41167.86203.11
(incentivize)(−31.76%)(−15.03%)(−16.83%)(−10.80%)
Disclaimer/Publisher’s Note: The statements, opinions and data contained in all publications are solely those of the individual author(s) and contributor(s) and not of MDPI and/or the editor(s). MDPI and/or the editor(s) disclaim responsibility for any injury to people or property resulting from any ideas, methods, instructions or products referred to in the content.