Article

Will Conventional Public Transport Users Adopt Autonomous Public Transport? A Model Integrating UTAUT Model and Satisfaction–Loyalty Model

1
Department of Civil Engineering, Faculty of Civil Engineering, Istanbul Technical University, 34469 Istanbul, Turkey
2
Institute for Transport Studies, Faculty of Environment, University of Leeds, Leeds LS2 9JT, UK
3
Department of Civil Engineering, Faculty of Engineering, Marmara University, 34854 Istanbul, Turkey
*
Author to whom correspondence should be addressed.
Sustainability 2025, 17(20), 9087; https://doi.org/10.3390/su17209087 (registering DOI)
Submission received: 5 September 2025 / Revised: 9 October 2025 / Accepted: 9 October 2025 / Published: 14 October 2025

Abstract

As an emerging technology for sustainable, safe, energy-efficient, and smooth traffic flow, autonomous public transport (APT) has been widely studied in recent years. However, the influence of conventional public transport (CPT) on behavioural intentions toward APT is largely overlooked. While APT is in its nascent phase, users’ choices may be shaped by their perceptions and attitudes toward CPT. Therefore, identifying these perceptions and examining their effect on behavioural intention is crucial. In this study, the Unified Theory of Acceptance and Use of Technology (UTAUT) is integrated with the satisfaction-loyalty model to analyze the key factors influencing behavioural intentions toward APT. To obtain more precise findings, this study examined public transport by type, including rubber-tired systems, urban rail, and bus rapid transit, rather than as a single mode, unlike many previous studies. A survey (n = 1271) was employed to validate the theoretical model among CPT users in Istanbul. The results indicate that loyalty to CPT significantly influences behavioural intention toward APT. Moreover, users of different CPT types have distinct priorities influencing their intention to use APT. While users of rubber-tired systems prioritize effort expectancy, social influence and facilitating conditions, users of urban rail systems consider social influence, trust and loyalty to CPT to be decisive factors. Furthermore, users of bus rapid transit systems consider performance expectancy, effort expectancy, trust, and loyalty to CPT as key factors influencing their behavioural intention. The findings are expected to enrich theoretical research on behavioural intention toward APT and guide future integration and transition between CPT and APT.

1. Introduction

In recent decades, autonomous vehicles have significantly transformed the transportation by offering unique solutions to the negative externalities of transportation [1,2]. Autonomous vehicles, equipped with advanced software that reacts more quickly than humans and eliminates the factor of human error, hold the potential to enhance road safety [3,4,5]. Moreover, autonomous vehicles offer more environmentally friendly solutions by using more sustainable energy sources (electricity, etc.) and technologies that reduce fuel consumption (restricting stop-and-go movements, etc.) [6,7] compared to the current transportation system [8]. In addition, autonomous vehicles have the potential to enhance transportation flow and reduce traffic congestion by ensuring safer and more efficient driving, along with optimized routing [9].
As outlined above, autonomous vehicles offer promising solutions for achieving sustainable, safe, and smoother transportation. However, overuse of autonomous private vehicles rather than shared autonomous modes may turn these advantages into disadvantages [10]. Autonomous private vehicles may increase traffic density by extending mobility to groups such as the elderly, children, and individuals with disabilities, while also operating in continuous loops instead of being parked. As a result, private autonomous vehicles may cause more congested traffic and higher fuel consumption [11]. Herein, due to its nature, autonomous public transport (APT) emerges as a promising solution that incorporates the advantages of both autonomous vehicles and public transport.
Moreover, beyond the positive features that APT promises, it also has the potential to affect public transport usage patterns. Recent studies have demonstrated that public transport ridership has been decreasing in many urban contexts due to a combination of socioeconomic and infrastructural factors. For instance, Yu et al. [12] examined bus ridership across 175 Chinese cities between 2010 and 2019, revealing a marked decline after 2015. This downturn was largely driven by the growth in private car ownership, rising travel costs, and widening income inequality. They further emphasized that a dramatic decline in passenger numbers could lead to disruptions that might deeply undermine public transport services, such as reduced revenues for public transport operators, disruption of bus route networks, and deterioration of service quality. However, autonomous vehicles have the potential to enhance public transport ridership by improving accessibility and convenience through strengthened first- and last-mile connections, while simultaneously increasing punctuality, frequency, and service flexibility.
At this point, the future behaviour of CPT users holds significant importance, as CPT users are the most likely to adopt APT, which can be considered a future form of CPT. Therefore, it is essential to rigorously examine the reasons why CPT users might adopt APT, as well as the potential positive or negative impacts of autonomous systems on overall public transport usage and the underlying factors driving these effects. Thus, the perceptions and attitudes of CPT users toward APT play a crucial role in its adoption and widespread use. During the nascent phase, individuals deciding whether to adopt a new technology will compare its advantages and disadvantages with their current option from a utilitarian perspective. For instance, individuals assess the advantages of electric vehicles (e.g., lower fuel consumption) against their disadvantages (e.g., longer charging time) when deciding whether to use them [13,14]. Similarly, within the scope of the study, the satisfaction of CPT users with the service and their loyalty to CPT, along with the advantages promised by APT, will directly influence their acceptance of it. The main purpose of this paper is to provide insights into acceptance of APT by CPT users. Our objective was to identify the factors influencing APT usage, which promises sustainable, safe, and efficient transport, with a particular focus on determining the impact of CPT satisfaction and loyalty on APT adoption.
In this study, the UTAUT model and the satisfaction-loyalty model are combined to create a comprehensive framework that explores the key factors influencing the behavioural intentions toward APT. This study contributes to the existing body of knowledge in threefold: first, this study is the first to examine the impact of CPT satisfaction and loyalty on APT use, which may play a significant role in APT adoption. Second, this study examines CPT not as a single, unified concept, but as distinct types. While most studies in the literature have analyzed CPT as a general concept, different CPT types (e.g., rubber-tired systems, urban rail systems, bus rapid transit) offer varying features such as price, punctuality, and safety. Consequently, users who prefer these different CPT types may have differing behavioural intentions toward APT. To provide a more detailed perspective, this study is the first to examine the APT usage intention of different types of CPT users. Third, it provides valuable insights to urban planners, transportation engineers, policymakers, and academics, and can also be applied to other transportation modes to effectively enhance the acceptance of new technologies by bridging conventional and autonomous systems.
The remainder of this paper is organized as follows. Section 2 discusses studies conducted in this field in the literature and highlights research gaps. Section 3 explains the theoretical background and hypotheses. Section 4 provides an overview of the method, survey design and sample description. Section 5 presents and analyses the results of the predictions and tests the hypotheses. Eventually, Section 6 presents the main findings and implications and offers suggestions for future research.

2. Literature Review and Research Gaps

Many theories have been developed in the literature to investigate human behaviour, the Theory of Reasoned Action [15,16] and the Theory of Planned Behaviour are widely used [17]. Among these theories, which can be considered as extensions of one another, the Theory of Reasoned Action (TRA) identifies attitudes toward behaviour and subjective norms as significant factors, whereas the Theory of Planned Behaviour (TPB) builds upon TRA by incorporating perceived behavioural control as an additional factor. Then, the Technology Acceptance Model (TAM) was developed by Davis [18] that included perceived usefulness and perceived ease of use factors. The Technology Acceptance Model (TAM) was initially used to examine the acceptance of computer use in the workplace and has since been applied to various emerging technologies [19]. Various theories of human behaviour contributed to the development of the Unified Theory of Acceptance and Use of Technology (UTAUT), which integrates four main factors: performance expectancy, effort expectancy, social influence, and facilitating conditions [20]. The UTAUT model employs structural equation modelling (SEM) to examine the relationships between observed and latent variables, allowing for the analysis of measurement and structural models in the adoption of new technologies. The UTAUT model was initially applied to examine employees’ intentions to adopt new technologies in the workplace, demonstrating an explanatory power of 70% in variance [20]. Derived from the development of various theories of human behaviour, UTAUT is one of the most comprehensive models explaining the intention to adopt new technology and has gained widespread acceptance in the literature.

2.1. UTAUT in the Autonomous Technologies

UTAUT and its extended versions have been extensively applied in the transportation field, particularly in studies on autonomous technologies. The UTAUT model has been applied to various types of autonomous vehicles, including autonomous private vehicles [21,22,23], autonomous delivery vehicles [24,25], autonomous urban air mobility [26,27], and APT [28,29,30,31,32].
Y. Chen et al. [33] investigated people’s perceived safety in autonomous vehicles in their study and found that perceived safety is at least as important as social influence and facilitating conditions. In their study, Hafeez et al. [34] examined behavioural intention toward autonomous vehicles using the UTAUT model, incorporating cultural and geographical factors into the framework. It was found that young people are more interested in autonomous vehicles and performance expectancy is a crucial determinant of behavioural intention. Widyanti et al. [35] investigated the acceptance of autonomous vehicles across three different regions and found that safety perceptions, transport mode frequency, effort expectancy, and social influence were key determinants of adoption. Kapser and Abdelrahman [36] investigated the acceptance of autonomous delivery vehicles and found that price sensitivity was the most significant determinant of behavioural intention. Moreover, performance expectancy, perceived risk, social influence and hedonic motivation played important roles, whereas effort expectancy did not have a significant effect. In their study on the acceptance of autonomous delivery vehicles, Engesser et al. [25] found that performance expectancy, facilitating conditions, experience, trust, and perceived risk had significant effects on behavioural intention. In a study on the acceptance of autonomous urban air mobility among university students, Yavuz [26] found that social influence, hedonic motivation, and personal innovativeness were the primary factors influencing behavioural intention.
Overall, prior studies demonstrate that while the UTAUT framework has been widely applied across different autonomous modes, certain latent constructs consistently emerge as key determinants of behavioural intention. In particular, performance expectancy, social influence, and perceived safety have been consistently identified as strong predictors of behavioural intention. The importance of performance expectancy highlights that individuals’ behavioural intentions are strongly shaped by perceived usefulness and expected improvements in mobility. In addition, the significance of social influence indicates that acceptance of autonomous technologies is not only an individual choice but also a socially embedded process shaped by collective norms and peer approval. Similarly, concerns about technological reliability and risk remain central barriers to behavioural intention, underscoring the importance of building trust in emerging transport systems. Moreover, facilitating conditions and hedonic motivations also make a contribution, though their significance appears to be more study-specific.

2.2. UTAUT in the Autonomous Public Transport

Several studies have examined behavioural intention toward APT using the UTAUT model. In their study on the acceptance of autonomous shuttles, Bellet and Banet [29] developed a new version of the UTAUT model, achieving a predictive value 20–30% higher than the original model. Bernhard et al. [37] investigated the psychological factors influencing autonomous minibus use, finding that performance expectancy, spaciousness, real-life autonomous experience, and environmental friendliness were significant, while effort expectancy had no significant impact. In another study, the acceptance of autonomous buses was investigated by integrating Task Technology Fit (TTF) and UTAUT, revealing that trust is the strongest factor determining the intention to use autonomous buses [30]. Chng and Cheah [32] investigated the acceptance of APT in Singapore. Participants reported that APT would be beneficial in improving public transport reliability and accessibility, but were concerned about technical issues and legal liability. Goldbach et al. [38] investigated the acceptance of autonomous buses and found that trust and real-life experience significantly influenced usage, while the presence of staff could alter outcomes. Korkmaz et al. [39] studied the use of APT in Istanbul, expanding the UTAUT model to include trust, safety, and perceived risk factors. Their model explained 72% of the variance, with performance expectancy, social influence, habit, and trust and safety factors having significant positive effects on behavioural intention. Madigan et al. [40] found that hedonic motivation was the strongest determinant of intention to use, while performance expectancy, social influence, and facilitating conditions were also important. Nordhoff et al. [28] examined the acceptance of autonomous shuttles by integrating the Unified Theory of Acceptance and Use of Technology (UTAUT) with the Diffusion of Innovation Theory (DIT). It was found that after incorporating DIT constructs, performance expectancy no longer had a significant effect, and external control rooms were preferred for supervision of autonomous shuttles. In another study, the acceptance of autonomous shuttles was explored in a real-life setting. The results indicated a positive correlation between behavioural intention and performance expectancy, facilitating conditions, hedonic motivation, and trust. In their study on the acceptance of autonomous buses, Sweet et al. [41] found that performance expectancy was the strongest determinant, while real-life autonomous experience and public transport habits also played significant roles. In their study on the intention to use APT in Beijing, Yuen et al. [31] revealed that all five factors of the UTAUT model had positive and significant effects.
Taken together, previous studies applying the UTAUT framework to APT highlight several latent constructs as key determinants of behavioural intention. Performance expectancy consistently emerges as a strong predictor, indicating that perceived usefulness and expected service improvements are important to users’ willingness to adopt APT. Trust has also proven to be a key factor, often outweighing other constructs and underscoring the importance of technological reliability and safety in behavioural intention. In addition, social influence, habit, and hedonic motivation appear as significant constructs, suggesting that both social norms and affective experiences contribute to behavioural intention. Nevertheless, the effect of some latent constructs such as effort expectancy and facilitating conditions shows greater variation across studies, reflecting the influence of contextual, cultural, and experiential conditions on model outcomes.

2.3. Influence of Existing Technologies on the Intention to Use Emerging Technologies

The influence of existing technologies on the adoption and dissemination of emerging technologies cannot be overlooked. Despite its importance, this effect has been investigated by very few studies in the literature. Niu et al. [42] hypothesized that user satisfaction and loyalty toward conventional parking modes would have a positive influence on the adoption of shared parking modes; however, these hypotheses are not supported. Curtale et al. [43] examined the intention to use electric car-sharing services and investigated the impact of satisfaction with current modes of transport on this intention. The analysis revealed that satisfaction with current means of transport, particularly for long-distance trips, negatively affects the intention to use electric car-sharing services.
Karimi et al. [44] investigated the effect of satisfaction with daily commute trips on the intention to use urban air taxis. The study concluded that a general sense of dissatisfaction with daily commuting increases the preference for urban air taxis. These two studies concluded that satisfaction with current transport modes negatively affects the intention to adopt new technologies, and vice versa.
As explained above, UTAUT is a convenient model for examining the psychological factors that influence individuals’ intention to adopt new technology. The UTAUT model and variations have been widely applied to explain behavioural intention toward APT. These studies primarily focused on usage intention in the context of autonomous technologies, constructs such as performance expectancy, social influence, and perceived trust have dominated the discourse. However, the influence of conventional public transport (CPT) in shaping users’ attitudes toward autonomous public transport (APT) has been largely overlooked. Since autonomous vehicles are still in the nascent phase, people’s behavioural intention may be influenced by conventional vehicles from a utilitarian perspective. For instance, an individual who is satisfied with the CPT may be loyal to CPT, thus unwilling to use autonomous transport. On the other hand, a person who is not satisfied with the CPT may be more likely to try and use APT. Therefore, the influence of CPT may play a crucial role in the adoption and widespread use of APT. Incorporating factors related to CPT into the UTAUT model may provide new insights and lead to a more comprehensive understanding, so specialized research incorporating these factors is necessary.
Moreover, studies conducted to date on APT have addressed it as a single, general mode. Furthermore, studies examining it by type have generally focused on rubber-tired public transport systems such as shuttles and buses. However, different types of public transport systems (urban rail systems, bus rapid transit) may offer different types of service characteristics such as cost, time, punctuality and safety. An individual who considers differences in service attributes across different public transport types when making daily travel decisions is likely to rely on a similar decision-making process in their future mode choices. Thus, users who prefer these different CPT types may have differing behavioural intentions toward APT. Therefore, it is crucial to investigate public transport by type, which has been largely overlooked in the literature, for a deeper understanding. Moreover, examining types that are less studied in the literature, such as bus rapid transit and urban rail systems, can provide more detailed and accurate insights into behavioural intention. In addition, as a research gap, it should be noted that although a study on this topic has been conducted in Istanbul, Turkey, the analysis remained limited in scope, as it treated public transport as a single, general mode and did not incorporate the key latent variables employed in our model [39]. Hence, further research is essential to provide a deeper understanding and to capture different perspectives within the context of Turkey as a developing country. This study addresses these gaps by examining the phenomenon and presenting significant findings.

3. Theoretical Background and Hypotheses

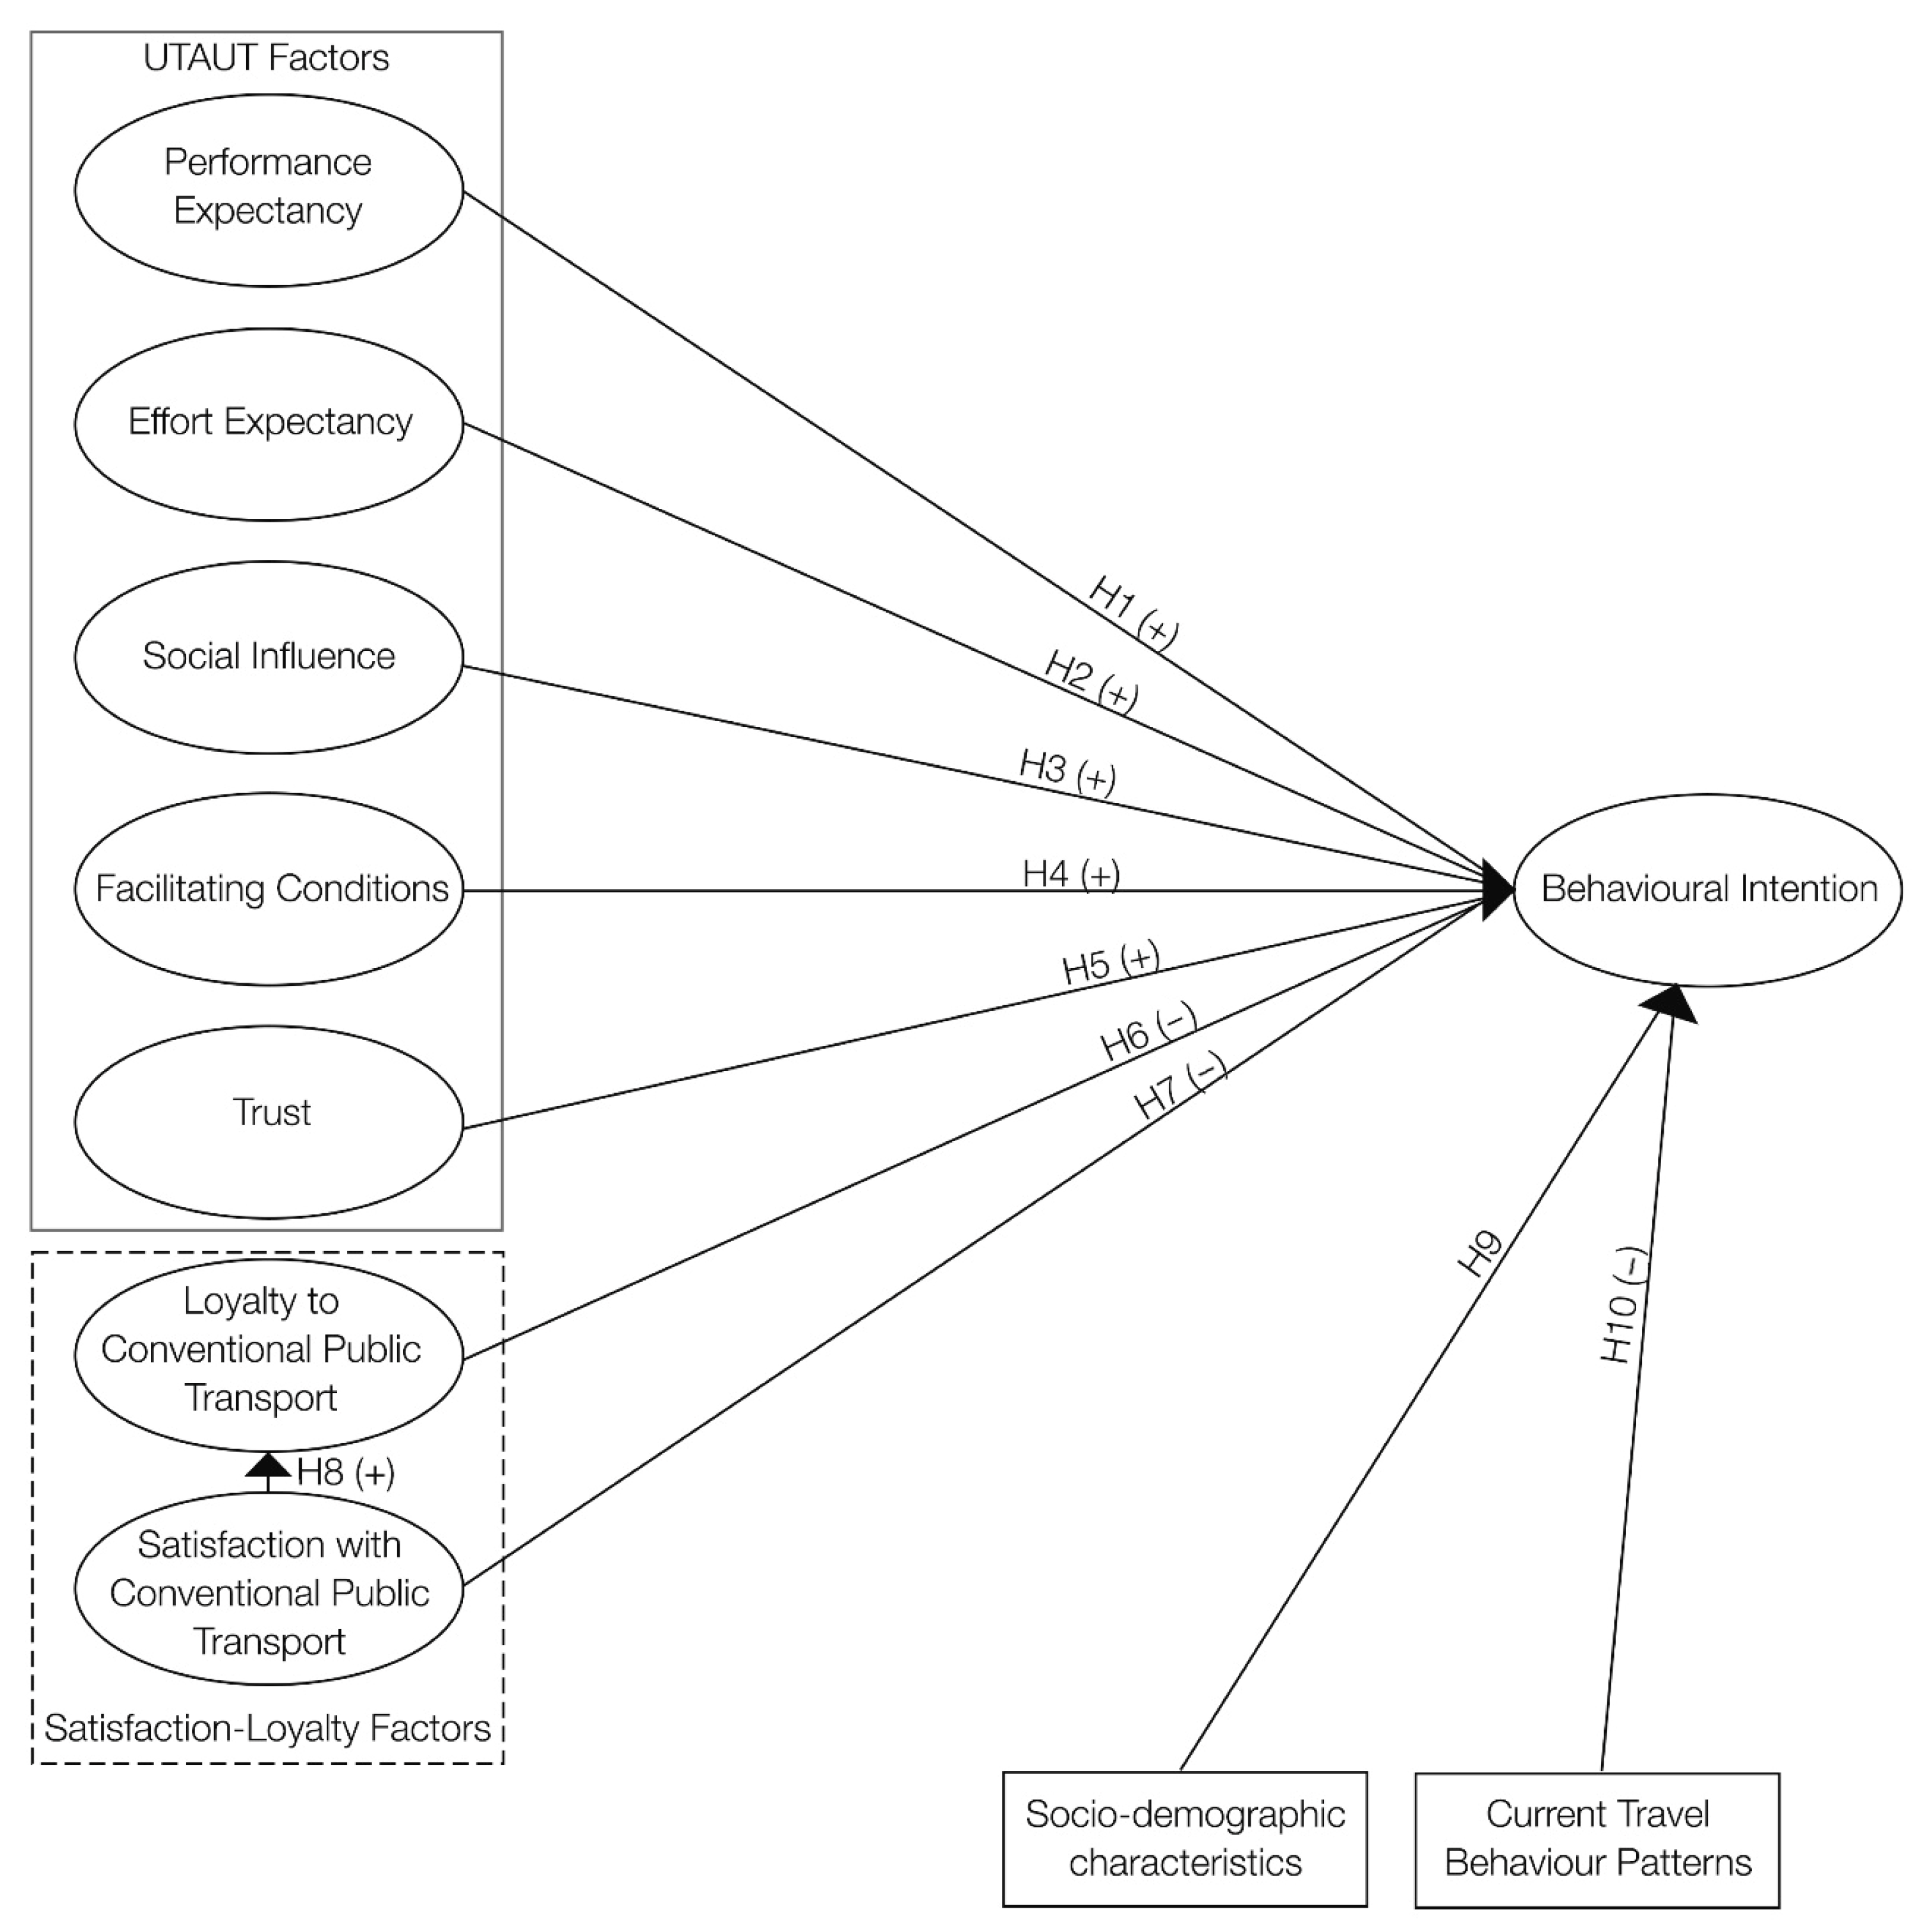
In this section, the theoretical framework of the study will first be introduced, and then the theoretical background and hypotheses will be explained. Within the scope of this study, an integrated model was developed by combining the UTAUT and satisfaction-loyalty models to investigate the behavioural intentions of CPT users toward APT. UTAUT provides strong explanatory power regarding individual-level drivers of behavioural intention, such as performance expectancy or social influence. However, it cannot capture the experiential dimension arising from users’ interactions with CPT. Conversely, satisfaction–loyalty models offer robust insights into how service quality and user experience related to CPT shape attitudes and current usage, and may also indirectly influence behavioural intention towards APT due to the potential impact of satisfaction with and loyalty to CPT. By combining these two perspectives, the present study seeks to capture both the cognitive evaluations related to the adoption of APT and the attitudinal dispositions shaped by prior use of CPT. This integrated framework thus addresses a critical research gap by linking past experiences with existing transport modes to future behavioural intentions, offering a more holistic understanding of acceptance dynamics in the transition toward autonomous mobility. In the subsequent sections, both models are discussed in detail, with particular attention to the relationships among the latent variables of interest. Factors influencing users’ behavioural intentions toward APT were analyzed based on the factors from both models. The proposed model explores the integrated effect of the technical acceptance of APT as an internal construct and the satisfaction and loyalty towards CPT as an external construct on the behavioural intention towards APT. Accordingly, the UTAUT model is defined as the internal construct, while the satisfaction-loyalty model is defined as the external construct influencing behavioural intentions toward APT. Figure 1 presents the structural framework of the study. Based on this structural framework, the hypotheses of the integrated model and the final conceptual structure were developed.

3.1. Theoretical Background

UTAUT was employed as a method to explore the internal factors influencing users’ behavioural intentions towards APT. The Unified Theory of Acceptance and Use of Technology (UTAUT) is a widely adopted technology acceptance model that seeks to explain the relationship between users’ intentions to adopt emerging technologies and their actual usage behaviour [20]. According to the model, actual technology use is primarily driven by behavioural intention. The UTAUT model includes latent variables such as performance expectancy, effort expectancy, social influence, and facilitating conditions, which are the basic constructs explaining users’ behavioural intentions [20,43,45]. Equation (1) presents the basic formulation of the integrated UTAUT model.
B I = β 0 + β 1 P E + β 2 E E + β 3 S I + β 4 F C + β 5 T R + β 6 L O Y + β 7 S A T + β 8 S D + β 9 C T P + ε
where BI represents the behavioural intention to use autonomous public transport; PE, EE, SI, and FC refer to performance expectancy, effort expectancy, social influence, and facilitating conditions, respectively; TR represents trust; LOY and SAT denote loyalty to and satisfaction with conventional public transport; SD stands for socio-demographic characteristics; CTP denotes current travel patterns; and ε represents the error term.
The UTAUT model has been widely applied across various fields to examine the intention to use new technologies. However, in some cases, the four variables of the UTAUT model may not sufficiently explain user adoption [21]. At this point, trust emerges as a complementary factor in technology adoption, as users need to have confidence in the technology and perceive minimal risk associated with its use [46,47]. Korkmaz Aslan et al. [48] emphasized that gaining users’ trust is more critical for technology adoption than merely advancing the technology itself. Moreover, Meyer-Waarden and Cloarec [49] identified trust as a key factor in increasing technology adoption. Moreover, in their study on the intention to use APT, Korkmaz et al. [39] found that trust has a significant positive effect on behavioural intention. As seen in the literature, trust has a positive and significant influence on the intention to adopt new technologies. Therefore, in addition to the variables of the UTAUT model, the trust variable was also incorporated into this study.
Satisfaction and loyalty constructs were added to the model as external factors affecting users’ behavioural intentions. Satisfaction, which refers to the pleasantness or disappointment between individuals’ expectations and their actual experience with a product or service, is a crucial factor in the utilization of transportation services. Loyalty is defined as an individual’s willingness to repeatedly use a product or service and is often positively associated with satisfaction. The satisfaction and loyalty factors have been studied extensively in the transport and public transport literature [50,51,52,53]. Since it is still in the trial and deployment phase, very few studies have investigated the effect of satisfaction and loyalty factors on autonomous vehicles [54,55]. Although numerous studies in the transportation field have investigated satisfaction and loyalty, a crucial aspect has been overlooked: the potential relationship between these factors in conventional transport and their influence on autonomous transport. When deciding whether to use autonomous vehicles, which are still in the deployment phase, people’s satisfaction with and loyalty to their current transport type will have a direct impact from a utilitarian perspective. An individual who is satisfied with the conventional transport type they currently use may feel loyalty and thus hesitate to use autonomous transport. Conversely, a person who is not satisfied with the conventional transport type may be more likely to try and use autonomous transport. Therefore, satisfaction and loyalty to CPT, which may play a crucial role in the adoption and widespread use of APT, are incorporated into the model.

3.2. Conceptual Model Structure

Based on these perspectives, the final conceptual model, which integrates UTAUT and the satisfaction–loyalty model was developed as shown in Figure 2. The conceptual model consists of eight latent variables and two observed variables: behavioural intentions, performance expectancy, effort expectancy, social influence, facilitating conditions, trust, loyalty, satisfaction, socio-demographic characteristics and current travel behaviour patterns. In this framework, performance expectancy, effort expectancy, social influence, and facilitating conditions are adapted from the original UTAUT framework and are hypothesized to have positive effects on behavioural intention (H1–H4). In addition, trust has been incorporated as a complementary latent construct, reflecting the critical role of reliability and confidence in public transport, and is hypothesized to positively influence behavioural intention (H5). Furthermore, satisfaction and loyalty are incorporated as additional latent constructs, reflecting the impact of CPT use on the intention to use APT, with satisfaction expected to positively influence loyalty (H8), and both factors are further hypothesized to negatively influence behavioural intention (H6–H7). Moreover, socio-demographic characteristics (H9) and current travel behaviour patterns (H10) are included to capture the role of external and contextual factors. The current travel behaviour patterns are represented by car ownership and hypothesized to negatively influence behavioural intention, while socio-demographic characteristics are represented by gender, age, education, and income, which are assumed to affect behavioural intention in different directions. The proposed model aims to investigate the influence of CPT on APT, as well as the behavioural intentions towards APT.

3.3. Hypotheses Development

Performance expectancy suggests that individuals who perceive greater benefits from autonomous vehicles are more likely to intend to use them than those who do not [28,56]. The present study expects that individuals who perceive APT as performance-enhancing are more likely to intend to use it. Based on the above findings, the following hypothesis is posited in this study:
Hypothesis 1 (H1).
Performance expectancy will have a positive effect on the behavioural intention to use APT.
Previous studies have obtained mixed results regarding the effect of effort expectancy on the behavioural intention towards autonomous vehicles. Some studies have found that effort expectancy is a significant factor affecting the use of autonomous vehicles [37,57], while others have not found a significant result [28,40]. This study anticipates that individuals will perceive APT as easy to use and will be more likely to intend to adopt it. Hence, the following hypothesis is proposed in this study:
Hypothesis 2 (H2).
Effort expectancy will have a positive effect on the behavioural intention to use APT.
Individuals generally consider the opinions of people they value (family, friends, etc.) in their decision-making processes. Similarly, studies in the literature have shown that social influence is a key determinant of autonomous vehicle adoption [58,59]. This study anticipates that individuals who have not yet experienced APT will be influenced by the opinions of those around them. Thus, the following hypothesis is posited in this study:
Hypothesis 3 (H3).
Social influence will have a positive effect on the behavioural intention to use APT.
Individuals who perceive the availability of necessary resources and support for using new technology are more likely to intend to use it. Indeed, studies in the literature have identified facilitating factors as an important factor affecting intention to use [40,59]. The present study expects that individuals who consider the availability of facilitating conditions are more likely to intend to use APT. Based on the above discussion, the following hypothesis is posited in this study:
Hypothesis 4 (H4).
Facilitating conditions will have a positive effect on the behavioural intention to use APT.
Trust is one of the most crucial determinants influencing the use of automated vehicles [60]. Indeed, existing research supports this, implying that individuals who have confidence in the safety of APT are more likely to intend to use it [61]. This study anticipates that individuals with higher levels of trust in APT will be more likely to intend to use it. Thus, the following hypothesis is proposed in this study:
Hypothesis 5 (H5).
Trust will have a positive effect on the behavioural intention to use APT.
In the context of public transport, studies in the literature have shown that individuals who are loyal to CPT are more likely to continue using it [62,63]. This study expects that individuals who are loyal to CPT will be less likely to intend to use APT. Hence, the following hypothesis is proposed in this study:
Hypothesis 6 (H6).
Loyalty to CPT will have a negative effect on the behavioural intention to use APT.
Individuals who are satisfied with CPT services are more likely to continue using them in the future [64,65,66]. This study anticipates that individuals who are satisfied with CPT will be less likely to intend to use APT. Thus, the following hypothesis is proposed in this study:
Hypothesis 7 (H7).
Satisfaction with CPT will have a negative effect on the behavioural intention to use APT.
Individuals’ satisfaction with a technology, product or service will positively affect their loyalty [66,67]. This study proposes that public transportation satisfaction will positively affect loyalty. Hence, the following hypothesis is proposed in this study:
Hypothesis 8 (H8).
Satisfaction with CPT will have a positive effect on the loyalty to CPT.
The literature shows that socio-demographic characteristics associated with a greater interest in APT include being male [3,68,69,70], belonging to younger generations [3,58,71], having higher income [68] and having higher education [3,72]. This study investigates the effects of gender, age, education level and income on behavioural intention towards APT. The following hypothesis is posited in this study:
Hypothesis 9 (H9).
People with different socio-demographic characteristics also have different behavioural intentions towards APT.
Hypothesis 9a.
Males have higher behavioural intention towards APT.
Hypothesis 9b.
Older people have lower behavioural intention towards APT.
Hypothesis 9c.
People with higher education have higher behavioural intention towards APT.
Hypothesis 9d.
People with higher incomes have higher behavioural intentions towards APT.
This study also investigates whether transport-related characteristic, which is car ownership, affects behavioural intention toward APT. The studies in the literature show that car ownership has a negative effect on behavioural intention towards APT [73,74]. These findings revealed that car ownership increases expectations about some attributes such as comfort and safety, thus decreasing the intention to use APT. Based on the above discussion, the following hypothesis is posited in this study:
Hypothesis 10 (H10).
Car ownership will have a negative effect on the behavioural intention to use APT.

4. Survey Design, Sample Statistics and Method

In this section, based on the literature, the observed variables (scale items) corresponding to the latent variables in the final conceptual model are explained. Then, the questionnaire structure, the socio-demographic characteristics of the sample, and the estimation method are explained.

4.1. Survey Design

Survey respondents indicated their opinions about related item using the widely adopted five-level Likert scale, where “1 = totally agree, 2 = agree, 3 = neutral, 4 = disagree, 5 = totally disagree.” [75]. Likert-type questions present more precise insights into the direction and strength of participants’ attitudes and perceptions on the topic [76]. The measurement items of the original UTAUT constructs were adapted from previous studies that applied the UTAUT model [20,29,40,43,77]. The trust construct was adapted from previous studies examining the acceptance of new technologies [28,39,78,79]. Loyalty and satisfaction to CPT constructs were adapted from previous studies applying satisfaction-loyalty theory [62,63,64,80,81]. The definitions of all the latent factors included in the study and their sources of adaptation are presented in Table 1. Furthermore, Table 2 presents the eight psychological constructs used in the study, together with their corresponding measurement items.
The survey was completed by collecting participants’ socio-demographic information, primary public transport mode, and transport-related characteristics through multiple-choice questions.

4.2. Sample Statistics

The data collection process was carried out in two steps. Initially, the survey was conducted on a pilot scale with a sample of 50 participants. Thus, clarity of the survey questions, the average response time, and the participants’ feedback on the survey were assessed. Subsequently, the internal consistency and reliability of the items were evaluated using Cronbach’s Alpha test and all questionnaire items were retained. The survey was administered in Istanbul, Turkey during 5–20 January 2025. Istanbul, with a population of approximately 15.7 million [82], is the most populous city in Turkey and one of the cities with the most traffic congestion in the world [83]. Moreover, Istanbul is a city where public transport (PT) is intensively used, with various PT systems such as buses, minibuses, metro, trams, bus rapid transit, commuter rail, funiculars, and ferries. Istanbul, with approximately 5 million public transport trips made daily, provides a suitable field for obtaining empirical evidence for the model [84].
The survey was approved by the university ethics board and respondents were recruited through the survey company. The target population is people who live in Istanbul and primarily use public transport in their daily life. CPT passengers who used only one or mostly one type of CPT were included in the study. Participants were asked to choose the main CPT type before the current travel behaviour pattern part of questionnaire. The selected CPT type was then highlighted in the questions and supported with visuals to obtain responses related specifically to this CPT type. Moreover, each participant received a written and visual description of APT, along with instructions to complete the survey. In addition, participants filled out a consent form explaining that participation was voluntary before starting the survey. 1293 respondents in total completed the survey, the responses of 22 participants were excluded due to lack of variation in answers and unengaged responses. Thus, the study was conducted using data obtained from 1271 participants. In the literature, various approaches have been employed to determine the appropriate sample size in structural equation modeling (SEM) studies. One widely cited guideline, proposed by Kline [85] recommends a minimum of 200 participants for SEM analyses, with more complex models requiring at least 300 participants. Hair et al. [86] suggest that the sample size should be at least ten times the number of indicators in the model, which requires at least 280 participants for our study. The target sample sizes calculated according to these two widely adopted methods, along with the achieved sample sizes for each public transport mode examined in this study, confirm that the required thresholds have been met. Table 3 presents the descriptive statistics for the final dataset. The final sample consisted of 1271 respondents, with a slightly higher proportion of females (52.79%) compared to males (47.21%). In terms of age distribution, the largest group was 36–45 years (24.56%), followed by 46–55 years (23.94%). Most respondents reported living in households of four or more members (37.25%), and the majority owned at least one car (77.45%). Regarding education, 59.81% had completed elementary school, while 28.89% held an undergraduate or two-year degree. Employment status varied, with the largest proportion working in the private sector (39.58%), followed by unemployed individuals (26.50%) and retirees (21.55%). Monthly income was most frequently below $549 (33.36%), while only 6.59% reported incomes exceeding $2747. Public transport usage patterns indicated that 40.99% primarily used rubber-tired systems, 35.17% urban rail systems, and 23.84% bus rapid transit.

4.3. Method

SEM analysis was employed to examine the behavioural intentions of CPT users toward APT. The analysis was carried out in two stages. First, confirmatory factor analysis (CFA) was conducted to analyse the reliability, convergent validity, and discriminant validity of the measurement model. Then, based on the conceptual framework, the hypotheses of the model were tested using path analysis in the structural model. This process was carried out separately for each type of CPT. Analyses were conducted through SPSS 30.0 and AMOS 30.0.

5. Results

In this section, data reliability and validity were first assessed, followed by the analysis of the measurement and structural models using SEM. Moreover, as a unique contribution to the literature, models of different public transport types were tested within their own groups. In conclusion, the study’s findings are discussed, and recommendations are provided for policymakers.

5.1. Measurement Model

Before the structural model analysis, confirmatory factor analysis (CFA) is conducted to evaluate the construct reliability and convergent validity of the psychological constructs. Construct reliability refers to the internal consistency of a scale’s measurement values as a result of repeated tests under the same conditions [87]. Construct reliability was tested through Cronbach’s alpha and Composite Reliability (CR), both of which should be greater than 0.7 [88,89]. High values of Cronbach’s alpha and Composite Reliability (CR) indicate high reliability of the measurement model. As shown in Table 4, the Cronbach’s alpha and Composite Reliability (CR) values for all constructs exceed the desired threshold of 0.70, thus the measurement model is reliable. Moreover, the average variance extracted (AVE) values for all latent variables were above the recommended minimum of 0.50, indicating adequate convergent validity. In addition, each factor loading is expected to be at least 0.50; otherwise, the corresponding variables should be excluded from the measurement model to enhance its structural validity [87]. The results in Table 4 show that the factor loadings for all latent variables were acceptable. The findings indicate that the reliability and validity of all variables met the desired standards for all types of CPT.
Finally, the results of the confirmatory factor analysis indicate that the model fit indices demonstrate an acceptable level of goodness-of-fit. In particular, the proposed models for conventional rubber tire systems and urban rail systems yielded fit statistics that fall within the range of acceptable thresholds, with values of CMIN/DF slightly above the good fit threshold but supported by satisfactory GFI, AGFI, and CFI scores. These results suggest that the constructs are adequately represented within the measurement framework, even though certain indices indicate a moderate rather than perfect fit. By contrast, the model developed for conventional bus rapid transit systems performed exceptionally well across all indices, with values surpassing the recommended criteria for a good fit. This outcome highlights the robustness of the proposed specification for this mode, reflecting its consistency and explanatory power relative to the other public transport types examined. The proposed model fit indices and their corresponding reference values [90] are presented in Table 5.

5.2. Structural Equation Model (SEM)

Six structural models were developed for this study. Separate structural models were developed for users of conventional rubber-tired systems (bus, minibus), conventional urban rail systems (metro, tram), and conventional bus rapid transit systems, based on the primary public transport mode each user stated. For each public transport type, the analysis was first conducted using the original constructs of the basic UTAUT model, followed by estimation with the proposed integrated UTAUT model.
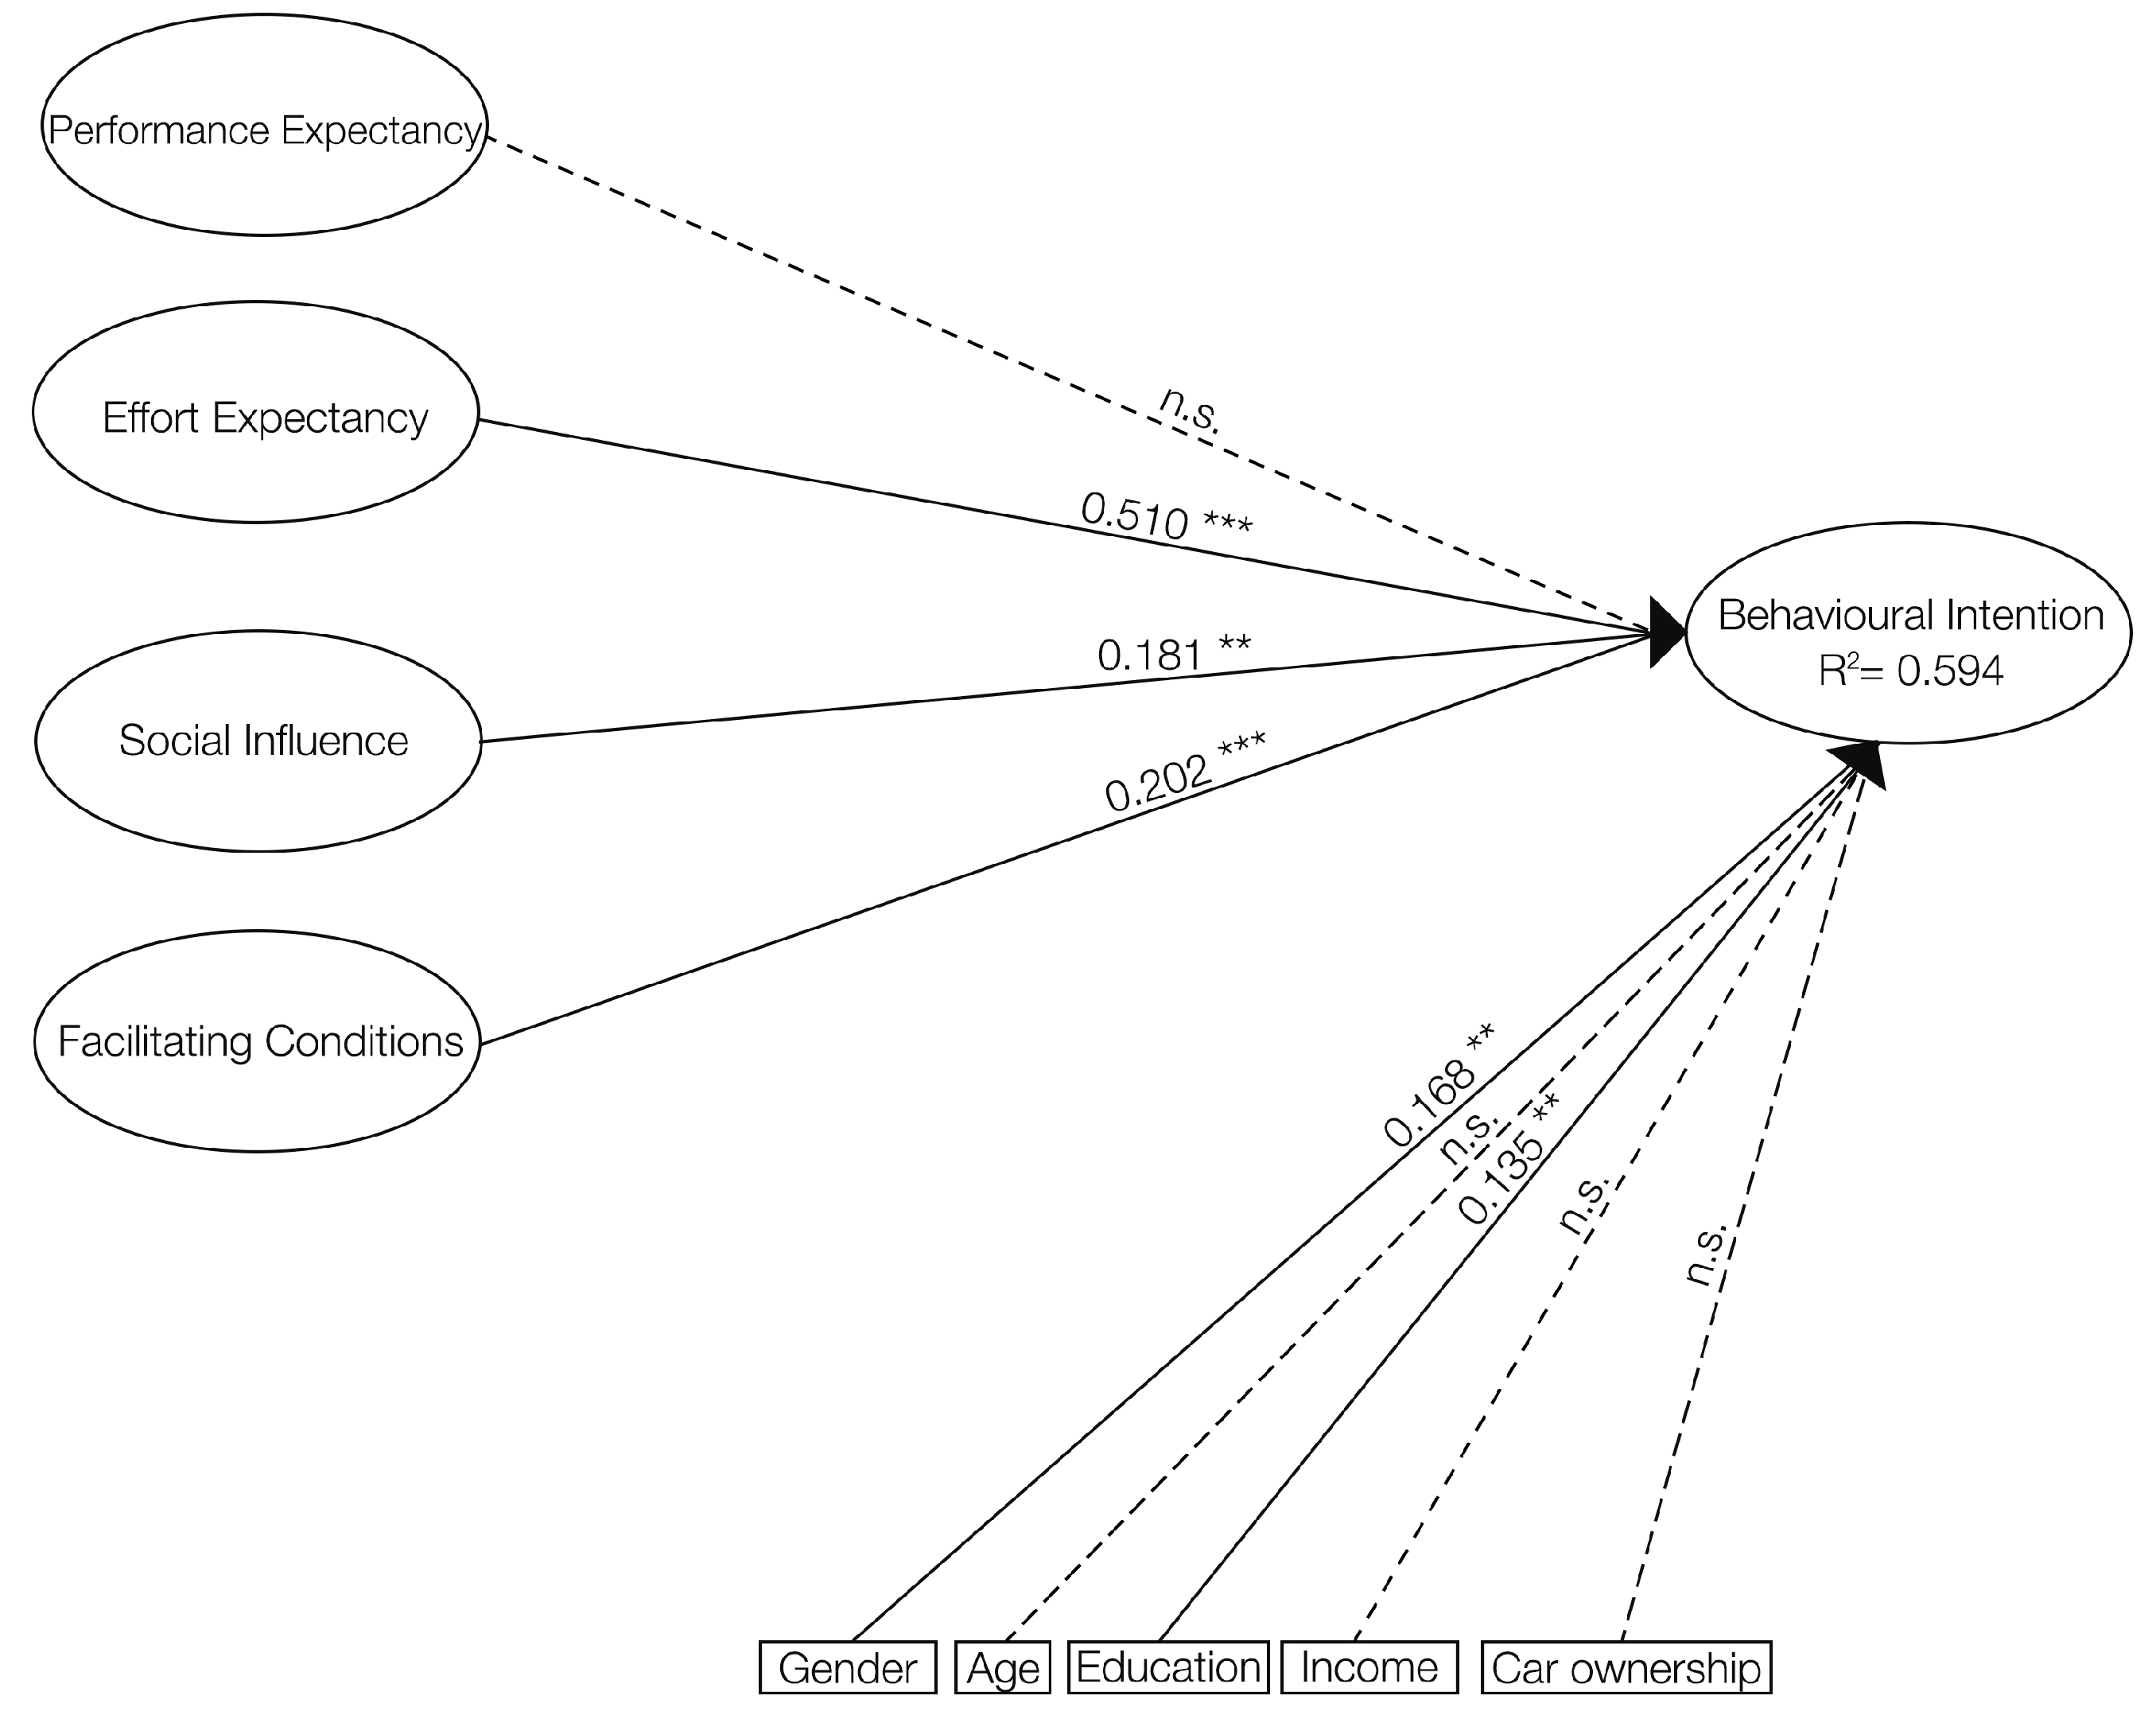
A total of 521 participants reported conventional rubber-tired public transport (bus, minibus) as their primary mode of CPT. The basic UTAUT model, incorporating the four original exogenous constructs, performance expectancy, effort expectancy, social influence, and facilitating conditions, along with behavioural intention as the endogenous variable, was estimated first. The basic UTAUT model results for conventional rubber tire systems indicate that all hypothesized paths were significant with the exception of performance expectancy. Overall, the model accounted for 59.4% of the variance in behavioural intention (see Appendix A).
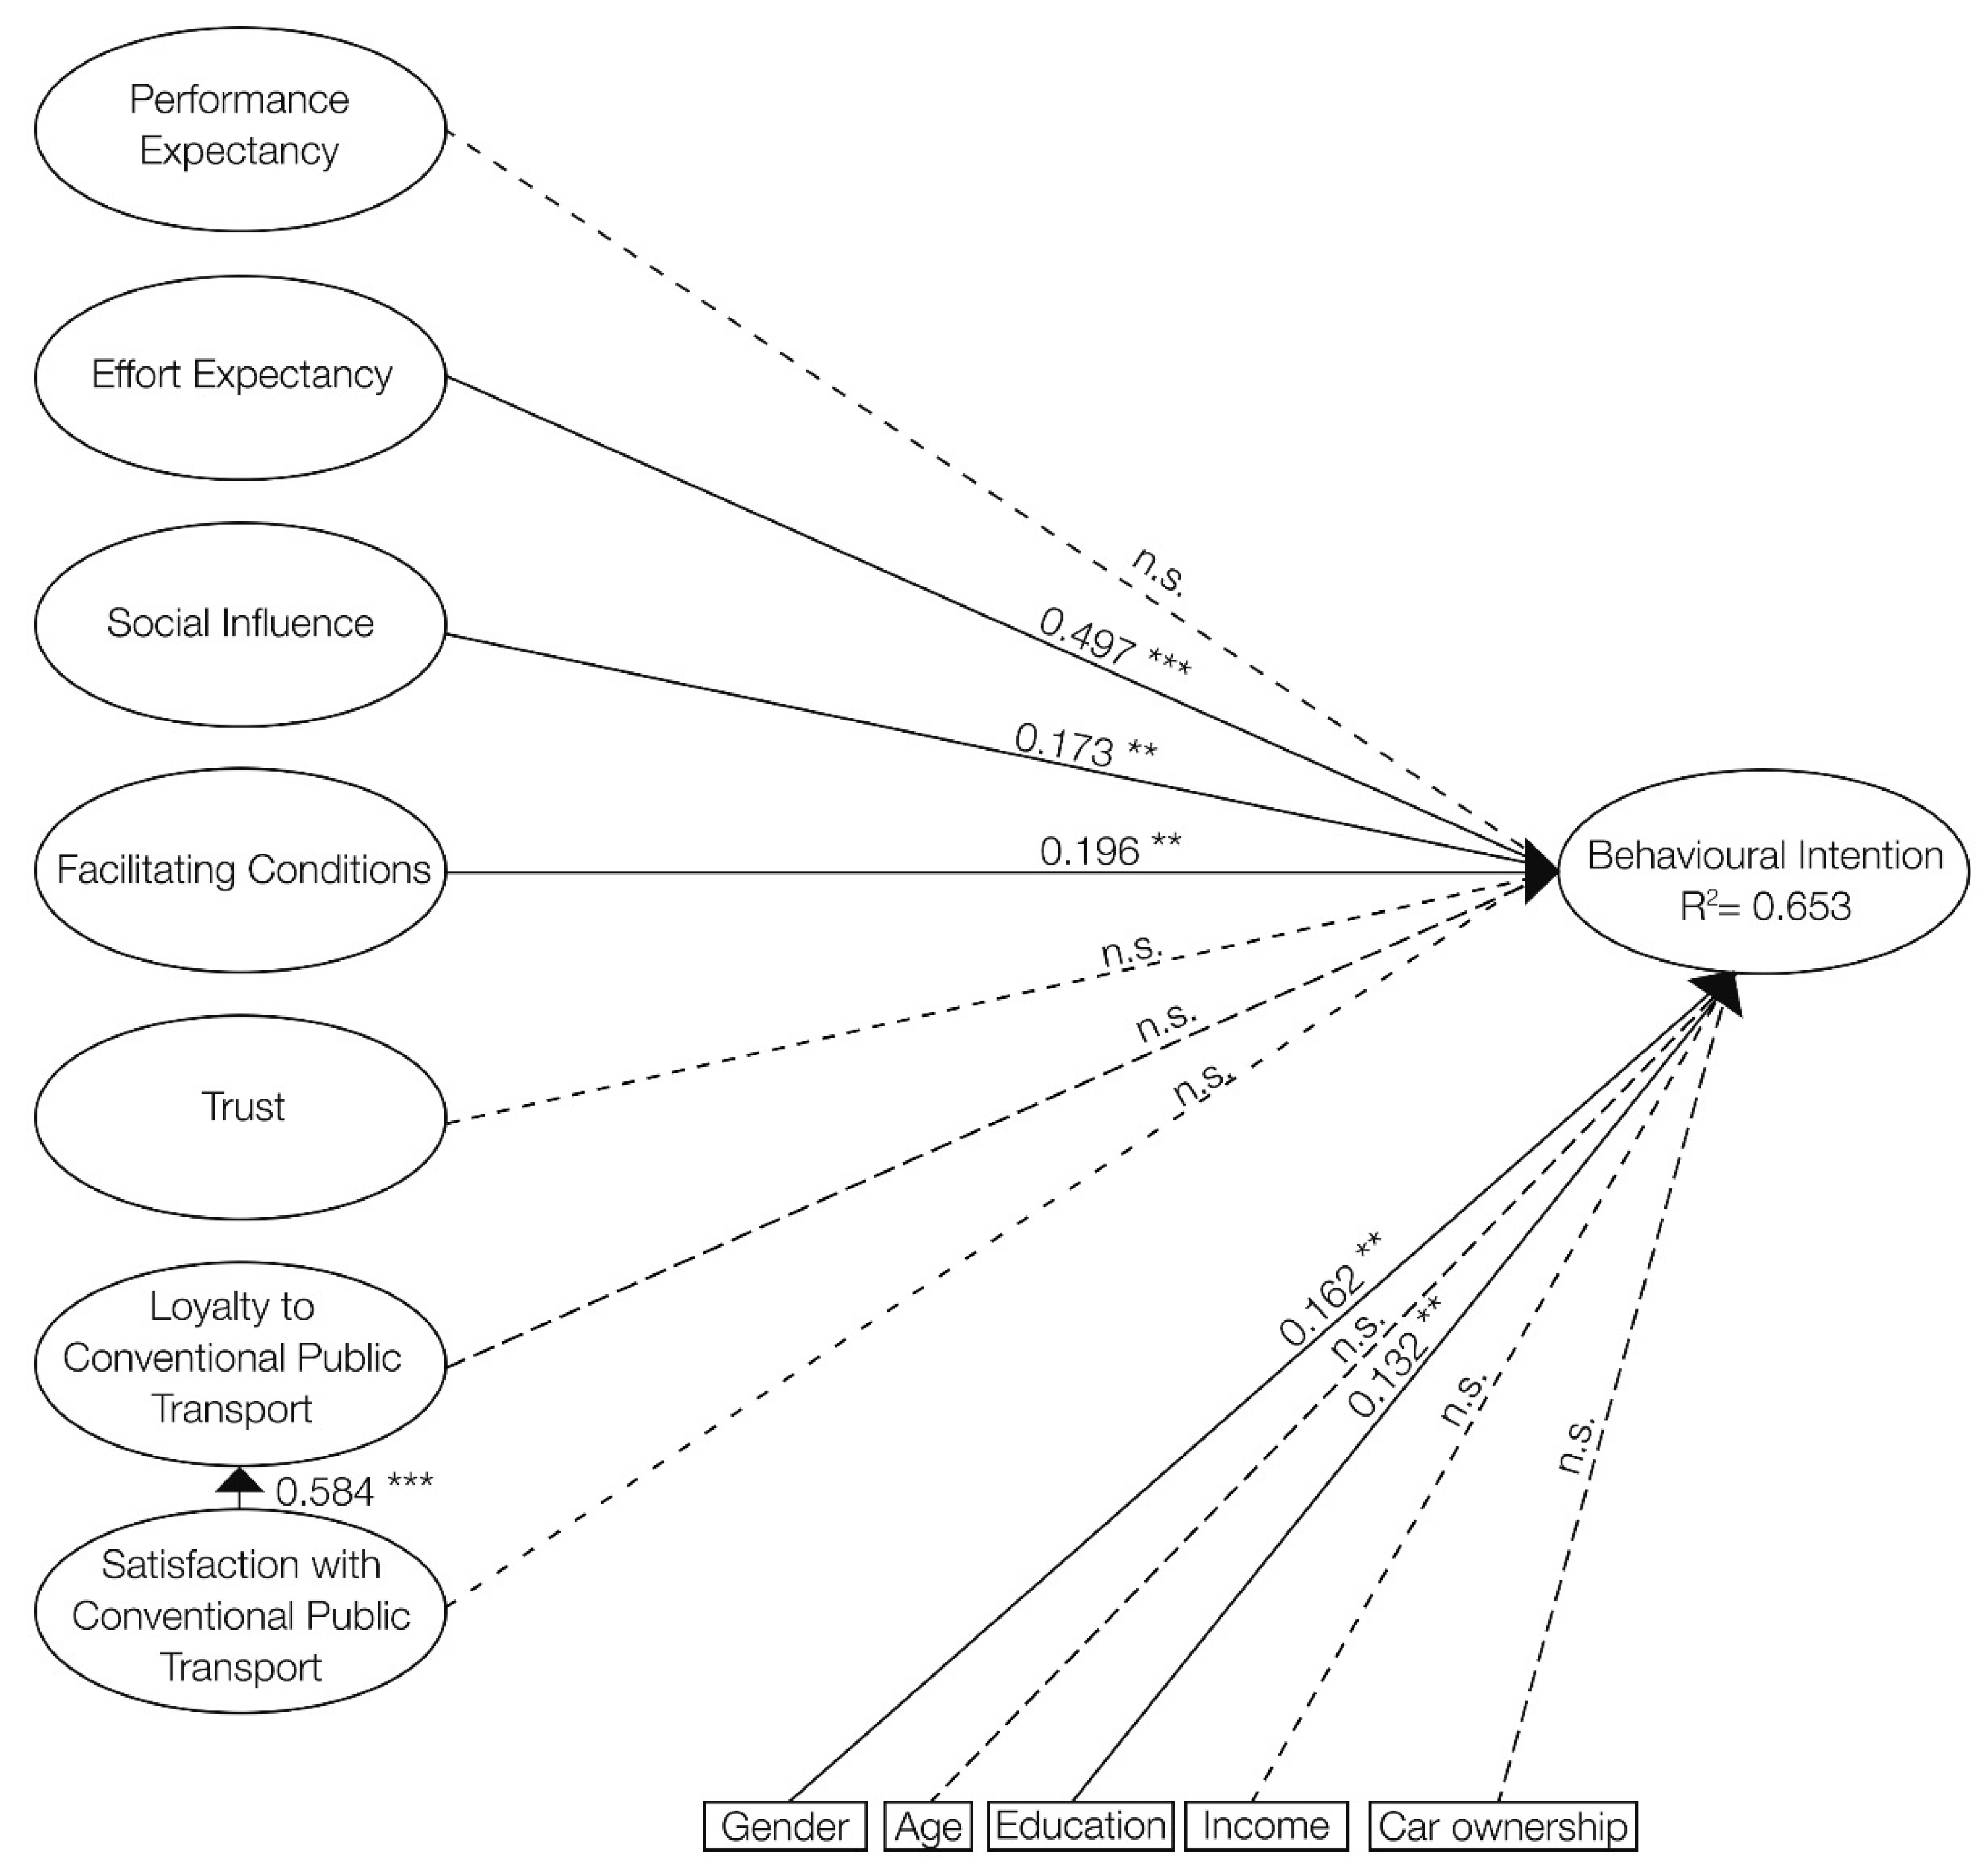
In addition, the relationships between the constructs in the proposed integrated UTAUT model are illustrated in Figure 3, and the path coefficients along with their corresponding p-values were calculated using path analysis. Effort expectancy is the strongest predictor of behavioural intention (path coefficient (β) = 0.497, p-value (p) < 0.001), followed by facilitating conditions (β = 0.196, p < 0.01) and social influence (β = 0.173, p < 0.01). Moreover, satisfaction with CPT is a significant predictor of loyalty to CPT (β = 0.584, p < 0.001). Behavioural intention was not found to be significantly related to either loyalty to CPT or satisfaction with CPT. In addition, some socio-demographic characteristics also have significant effects on behavioural intention. Consistent with the existing literature, males (β = 0.162, p < 0.01) and individuals with higher levels of education (β = 0.132, p < 0.01) have a significant and positive effect on behavioural intention. However, age, income and car ownership did not show a clear-cut effect. According to the SEM results, hypotheses H2, H3, H4, H8, H9a and H9c are supported, whereas H1, H5, H6, H7, H9b, H9d and H10 are not supported.
The integrated model explains 65.3% of the variance (R2 = 0.653), which shows that the model has high predictive power. The proposed integrated UTAUT model exhibits an approximate 9.9% increase in explanatory power relative to the basic UTAUT model, emphasizing the value of the extended framework, as shown in Table 6.
A total of 447 respondents stated that conventional urban rail systems are their main public transport type. The results for the basic UTAUT model for conventional urban rail systems indicate that all hypothesized paths were non-significant, with the exception of social influence. Overall, the model accounted for 49.1% of the variance in behavioural intention (see Appendix B).
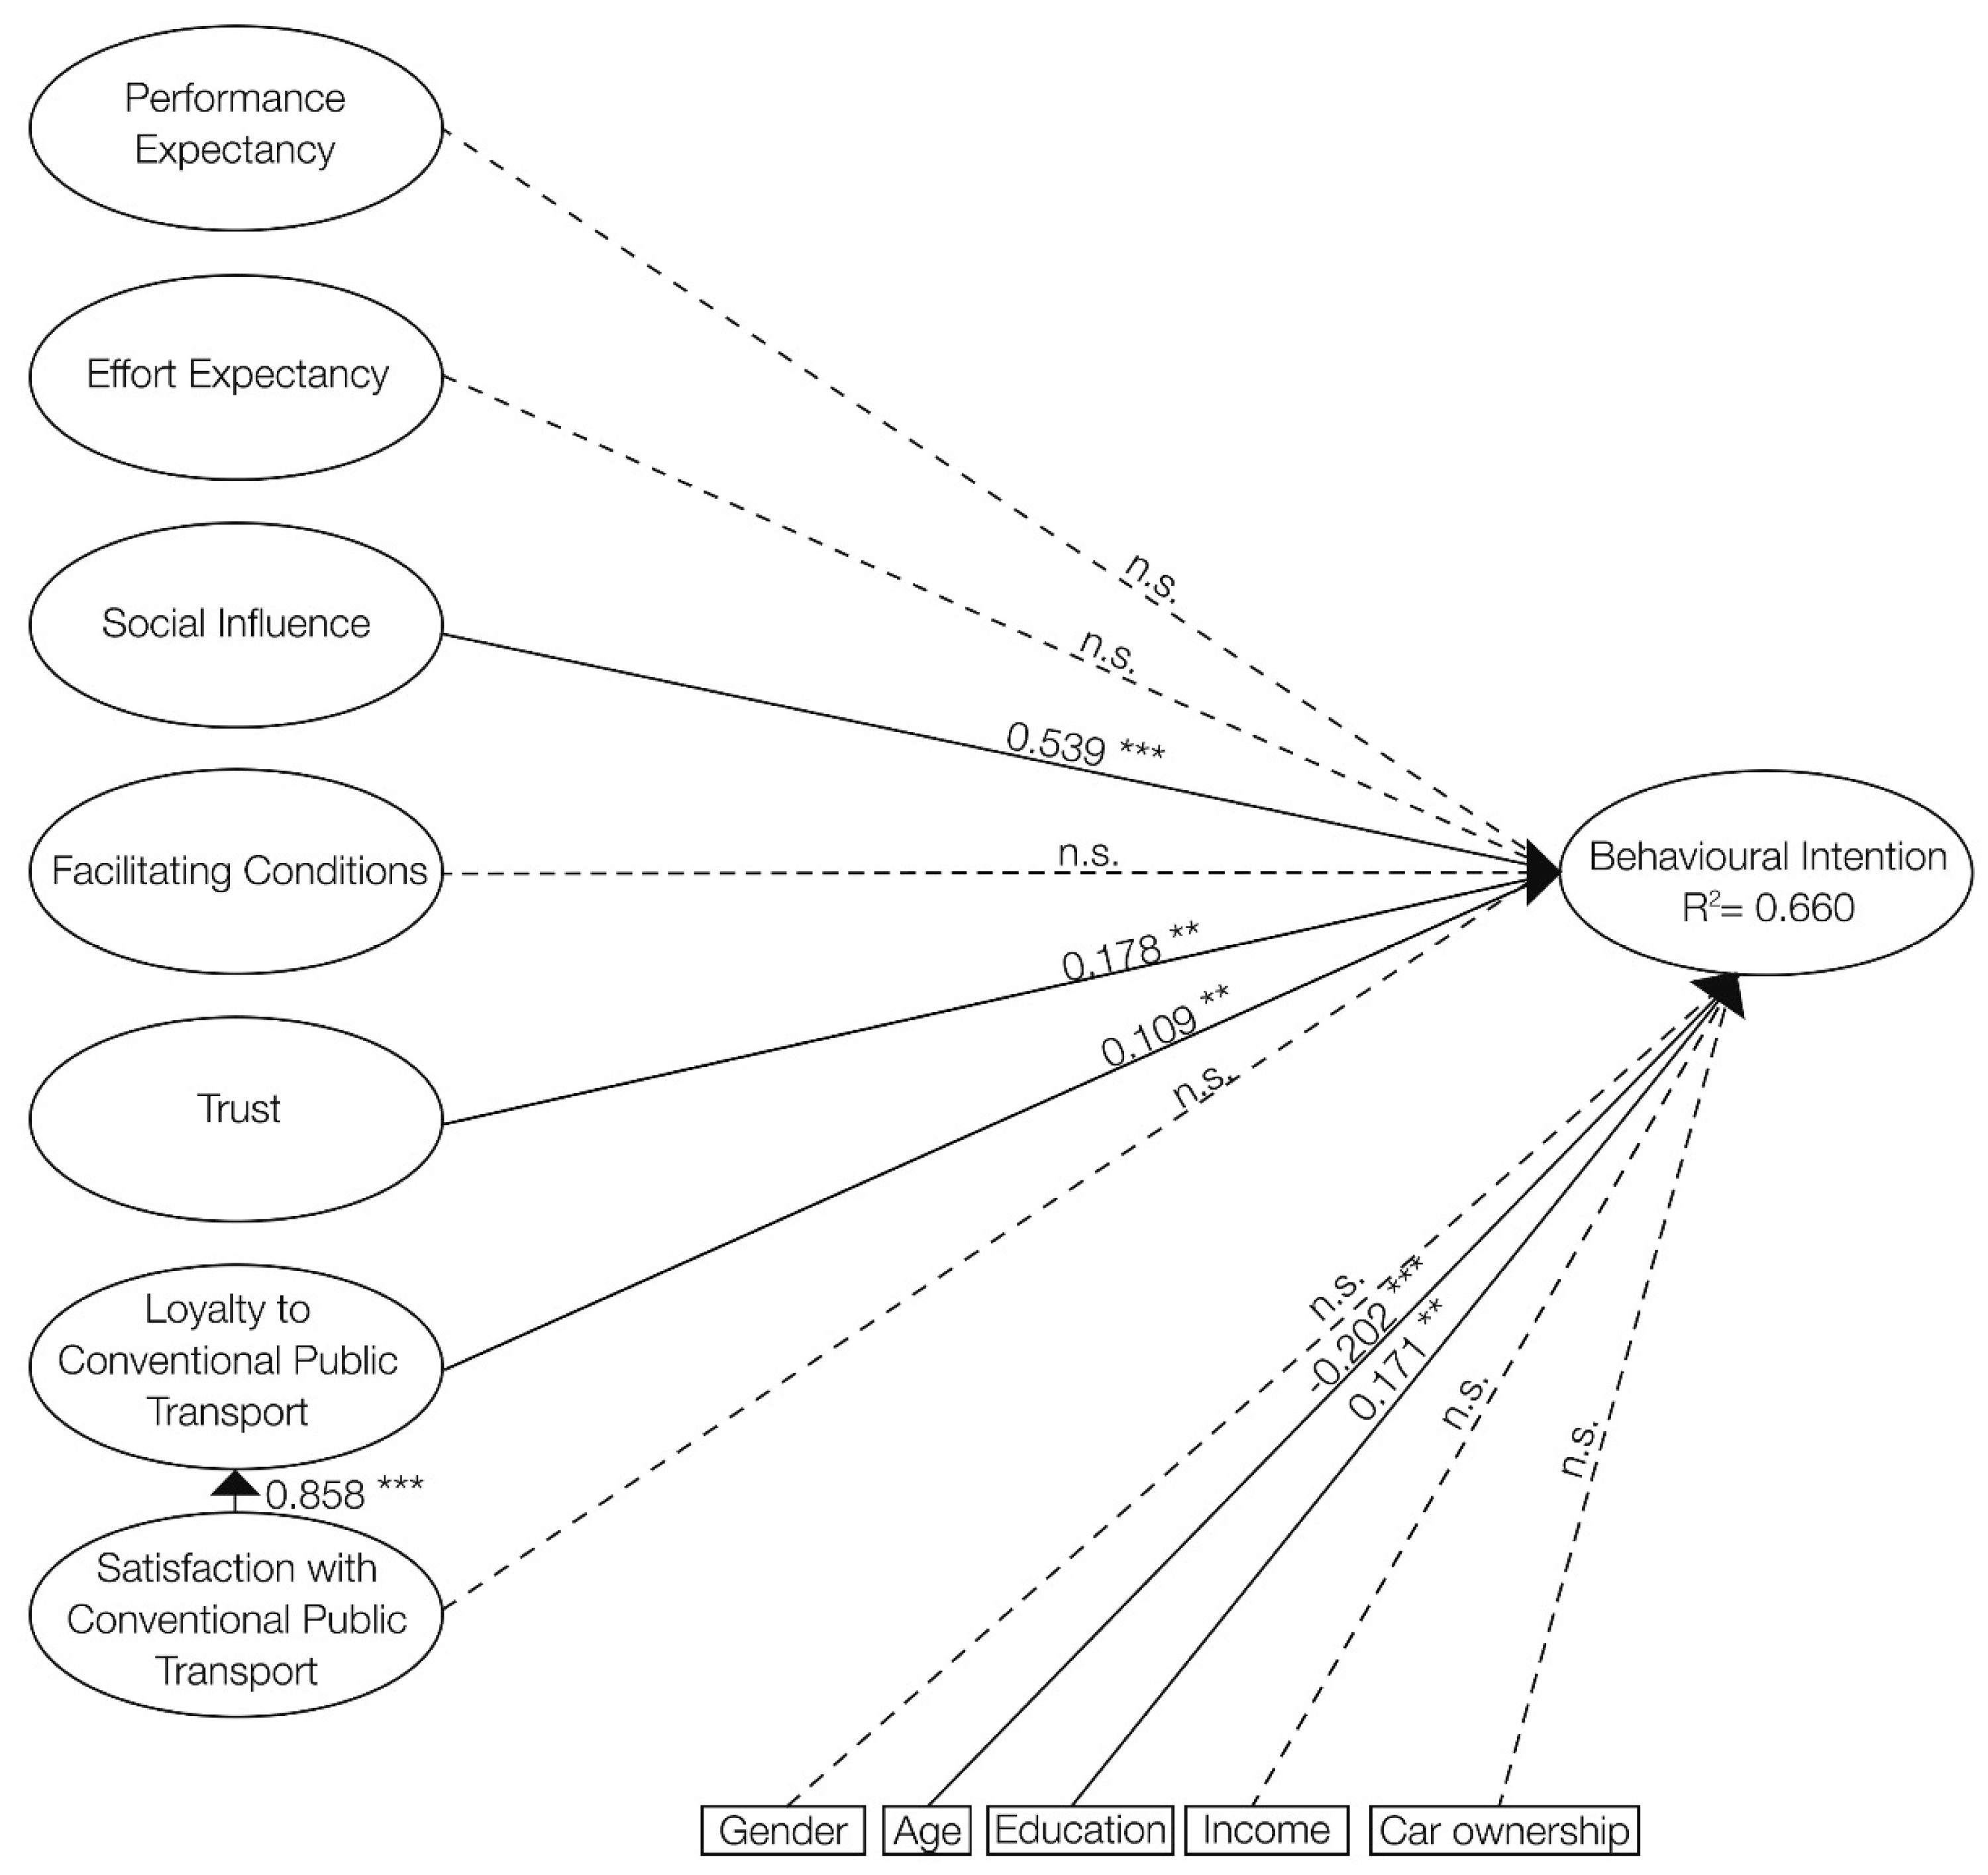
Furthermore, the proposed integrated UTAUT model shows the regression results using integrated constructs (Figure 4). Social influence (β = 0.539, p < 0.001), trust (β = 0.178, p < 0.01) and loyalty to CPT (β = 0.109, p < 0.01) are found to be significant predictors of behavioural intention. Moreover, as a unique contribution to the literature, this study reveals that loyalty to CPT significantly and positively affects the intention to use APT. However, no significant relationship is identified between satisfaction with CPT and the intention to use APT. In addition, a strong relationship is found between satisfaction with CPT and loyalty to CPT (β = 0.858, p < 0.001). Moreover, age (β = -0.202, p < 0.001) and education (β = 0.171, p < 0.01) are found to be significant predictors as well. Based on the results, hypotheses H3, H5, H6, H8, H9b and H9c are supported, whereas hypotheses H1, H2, H4, H7, H9a, H9d and H10 are not statistically supported.
The proposed model explains 66% of the variance (R2 = 0.660). Relative to the basic UTAUT model, the proposed integrated model demonstrated an approximate 34.4% increase in explanatory power, highlighting the substantive contribution of the proposed model, as shown in Table 6.
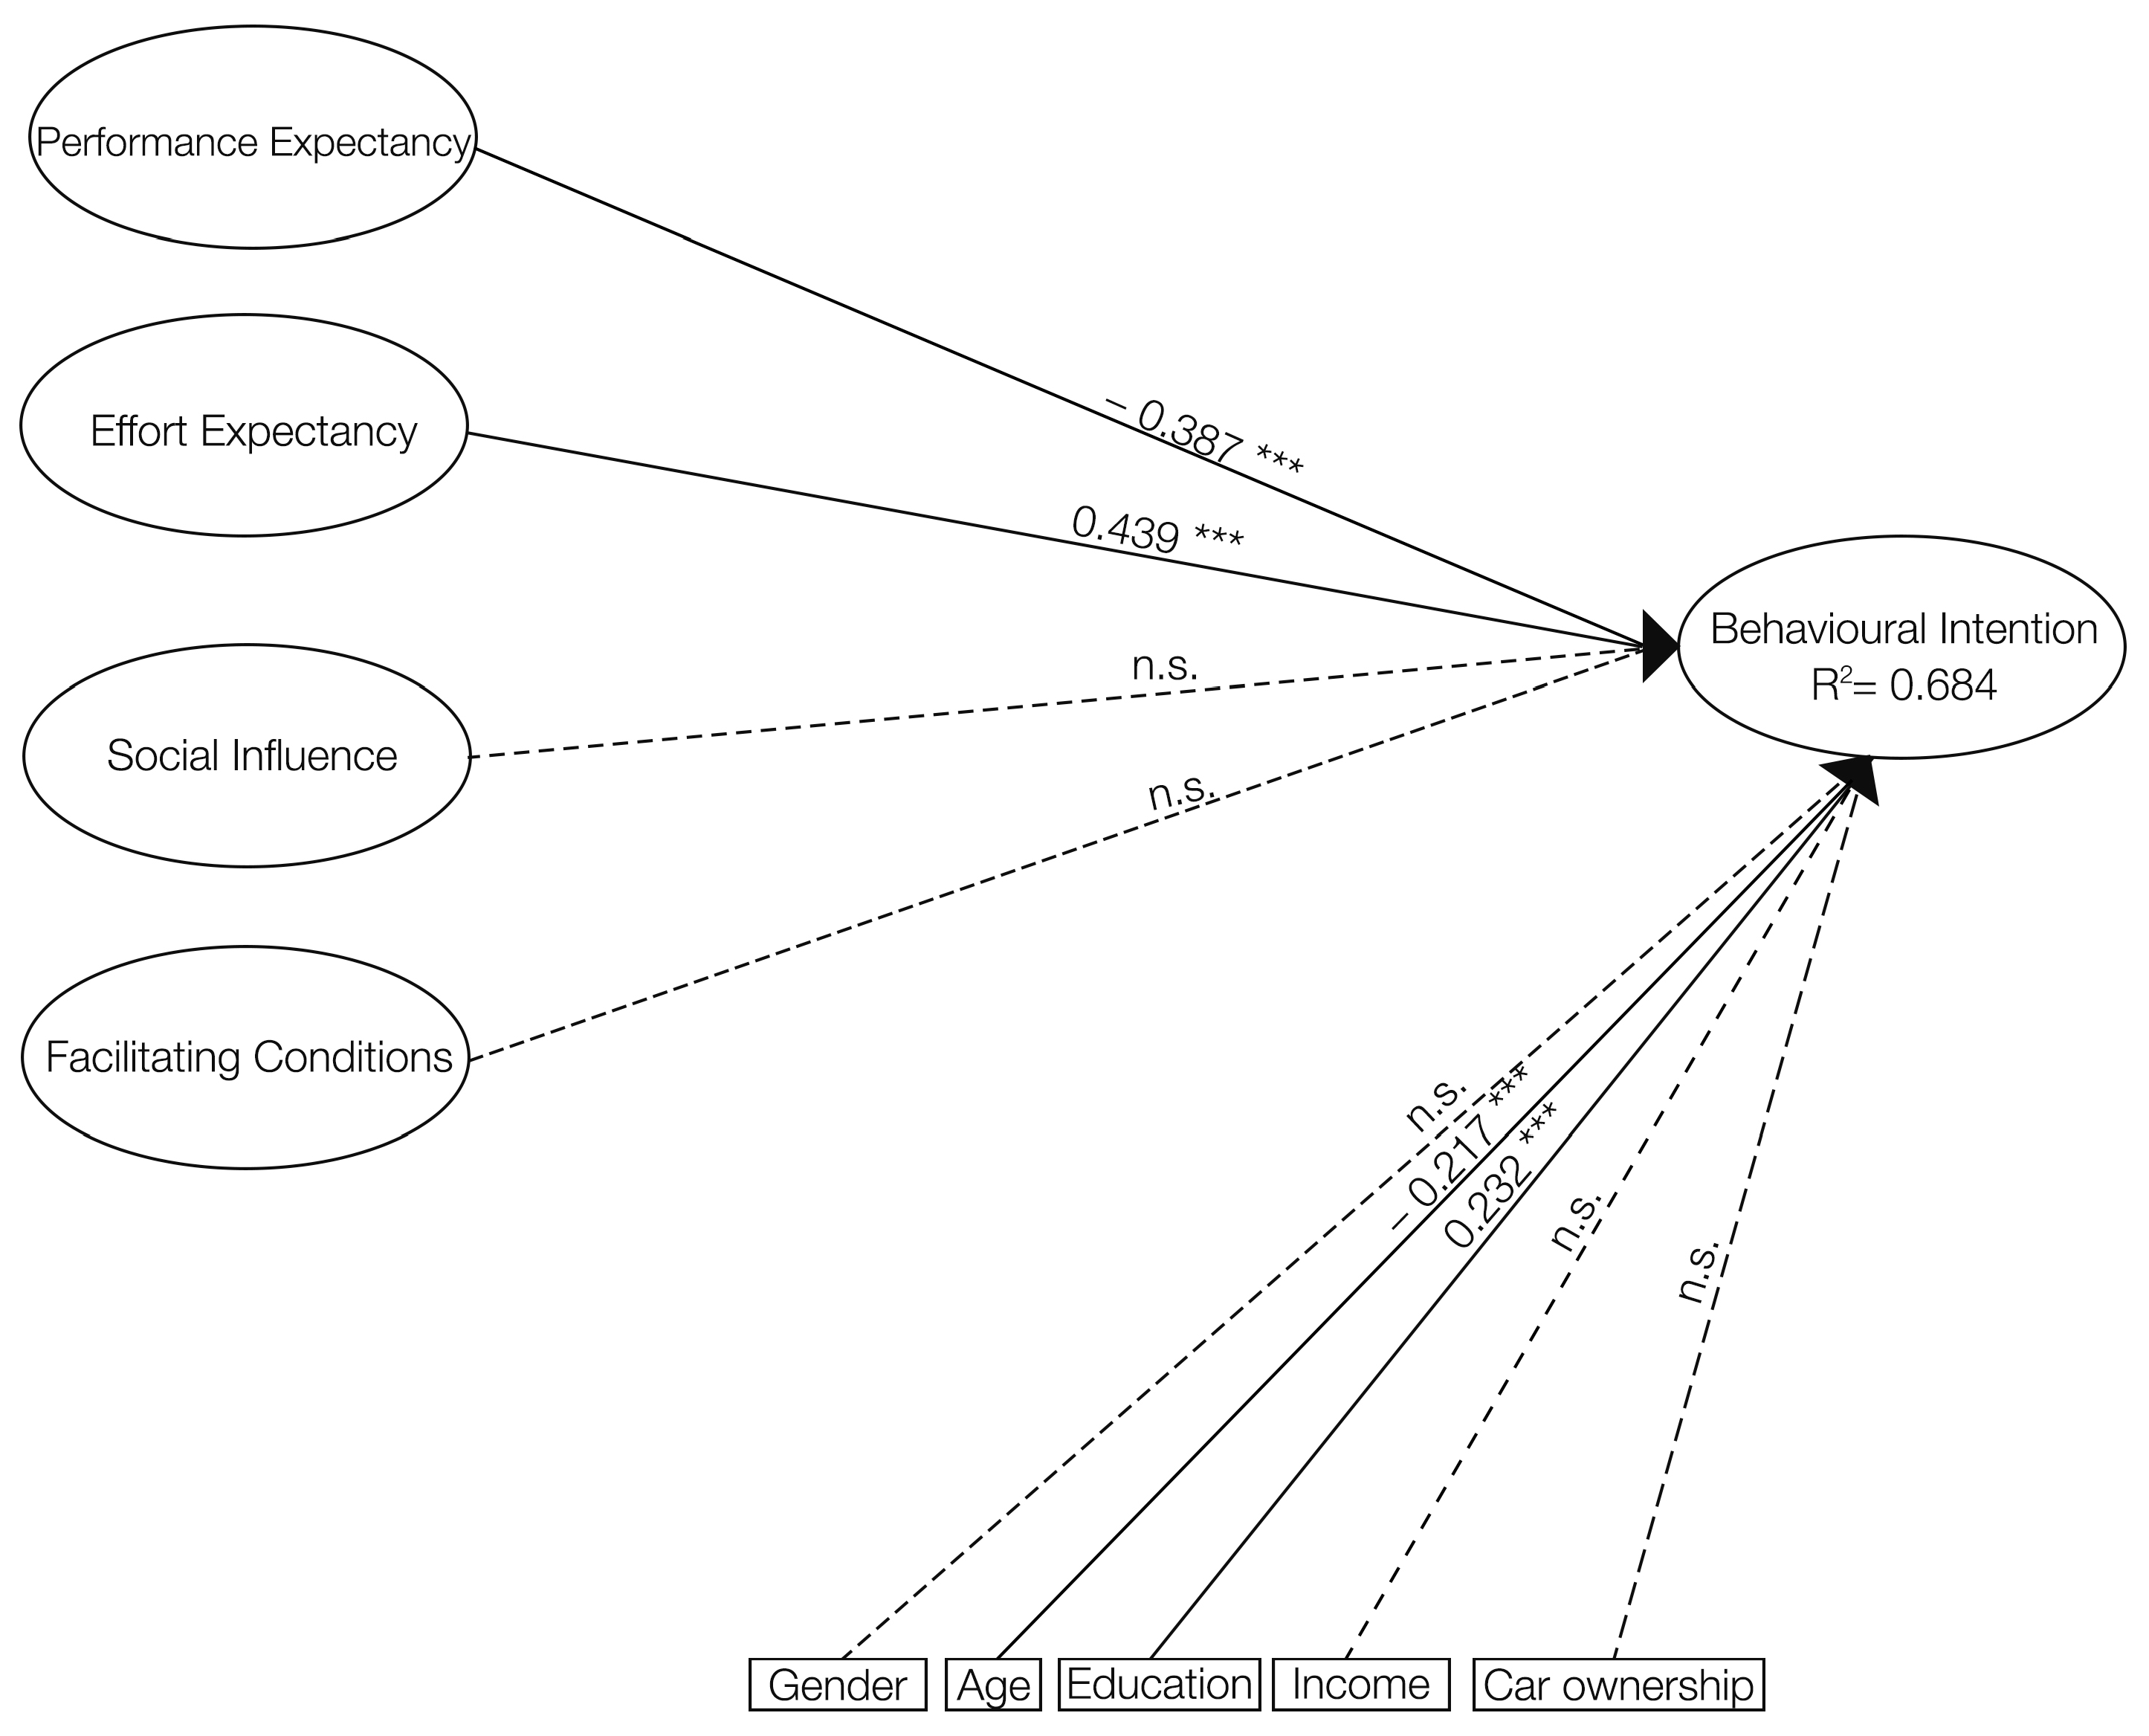
303 participants indicated that conventional bus rapid transit (BRT) is their primary public transport type in daily life. The results for the basic UTAUT model indicate that while performance expectancy and effort expectancy are significant, social influence and facilitating conditions are non-significant. Overall, the model accounted for 68.4% of the variance in behavioural intention (see Appendix C).
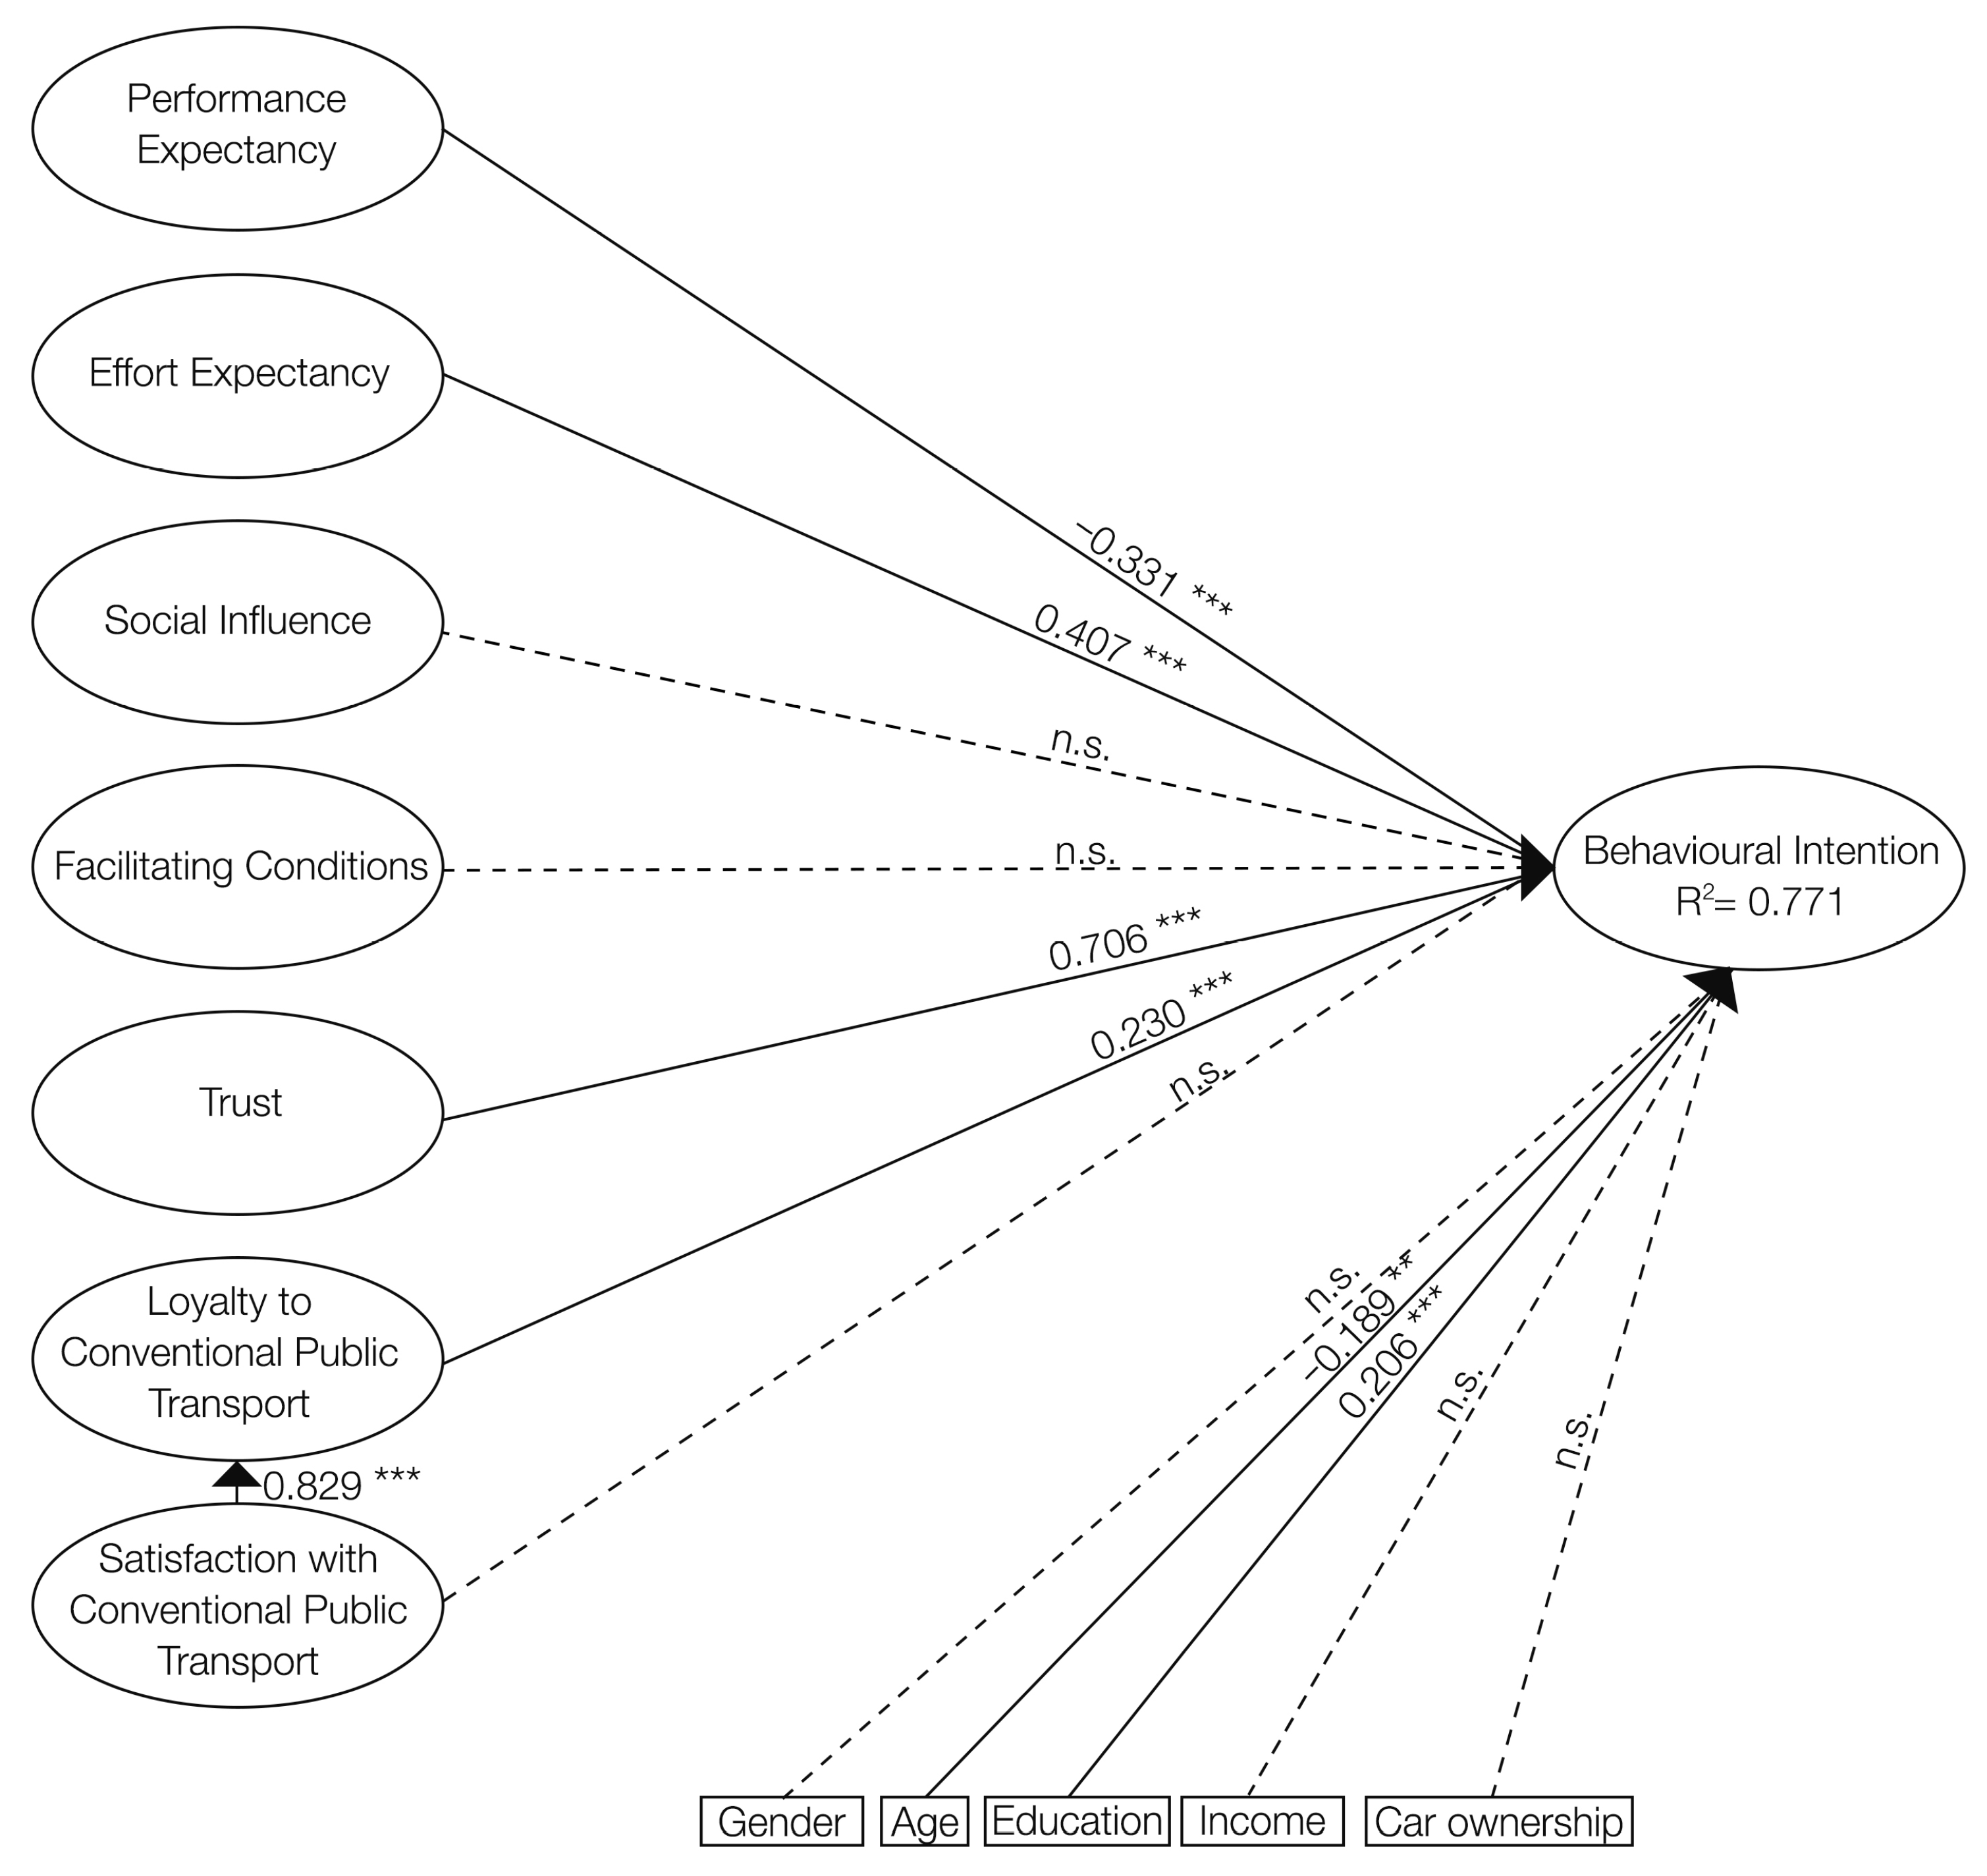
In addition, the proposed integrated model incorporates the greatest number of significant constructs, and the relationships between model constructs are shown in Figure 5. Trust (β = 0.706, p < 0.001) and effort expectancy (β = 0.407, p < 0.001) are the strongest predictors of behavioural intention. Moreover, performance expectancy (β = −0.331, p < 0.001), loyalty to CPT (β = 0.230, p < 0.001), age (β = −0.189, p < 0.01) and education (β = 0.206, p < 0.001) are found to be statistically significant. Consistent with the other two models, a positive and significant relationship is found between satisfaction with CPT and loyalty to CPT (β = 0.829, p < 0.001). Similar to the urban rail systems’ model, as a contribution to the literature, a significant and positive relationship is found between loyalty to CPT and behavioural intention. Furthermore, a significant relationship is found between performance expectancy and behavioural intention, but contrary to the hypothesis, the relationship is negative. According to the SEM results, hypotheses H1, H2, H5, H6, H8, H9b and H9c are supported, whereas H3, H4, H7, H9a, H9d and H10 are not supported.
The integrated model explains 77.1% of the variance (R2 = 0.771), indicating the highest predictive power among the three proposed integrated models. This superior explanatory capacity highlights the robustness of the integrated approach and suggests that the BRT context, probably due to its hybrid characteristics between bus and rail systems, provides particularly fertile ground for understanding the multifaceted determinants of APT acceptance. The proposed integrated model is 12.7% greater in terms of predictive power than the basic UTAUT model, underscoring the added value of incorporating satisfaction–loyalty and trust constructs into the framework, as shown in Table 6.
As discussed above, the constructs and their relationships for each of the three structural models based on the proposed integrated UTAUT framework have been examined in detail. To provide a concise overview, the results of these three structural models are presented in Table 7, which presents all standardized path coefficients, p-values, and support status for the proposed hypotheses in a summary format.

6. Discussion

Within the scope of the study, six different SEM models were developed for conventional rubber-tired public transport, conventional urban rail systems, and conventional bus rapid transit. For each public transport type, both the basic UTAUT model with its original constructs and the proposed integrated UTAUT model were developed, with their results subsequently compared. The comparative analysis between the basic UTAUT and the proposed integrated UTAUT model further highlights the robustness of the extended framework; the explanatory power of behavioural intention improved across all three transport modes when satisfaction–loyalty and trust constructs were incorporated. Specifically, the variance explained increased by 9.9% for conventional rubber-tired systems, 34.4% for urban rail systems, and 12.7% for bus rapid transit systems. These improvements demonstrate that the integrated model provides a more comprehensive understanding of behavioural intention, capturing critical experiential and attitudinal dimensions overlooked by the original UTAUT.
The latent variables incorporated in the model were analysed for all types of public transport. First, for conventional rubber-tired public transport, effort expectancy, facilitating conditions, and social influence emerged as latent constructs exerting a positive and significant effect. This highlights those practical considerations of ease of use and support infrastructure play a more decisive role in shaping behavioural intentions than other attitudinal factors. In addition, the significant role of social influence further indicates that peer groups and social circles contribute to legitimizing emerging transport technologies. Moreover, a positive and significant relationship was found between satisfaction with CPT and loyalty to CPT. This confirms the robustness of the satisfaction–loyalty relationship widely observed in the public transport literature. With respect to socio-demographic characteristics, the analysis indicated that males and individuals with higher levels of education exhibited a more favourable attitude toward using APT. These results imply that structural socio-demographic differences can accelerate or hinder the acceptance of emerging transport technologies, highlighting the importance of targeted communication and policy strategies.
Furthermore, for conventional urban rail systems, social influence, trust, and loyalty to CPT were identified as significant predictors of behavioural intention. This demonstrates that social approval and collective norms play a central role in shaping urban rail users’ willingness to adopt APT, while autonomous technology reliability, reflected in trust, also emerges as an important determinant. In addition, the positive impact of loyalty suggests that continued use of and commitment to CPT can be transferred to the intention to use APT, highlighting the importance of past behavioural patterns in future technology acceptance. The analysis did not reveal any significant association between satisfaction with CPT and the intention to use APT. This may indicate that although satisfaction is strongly linked to loyalty, it does not necessarily translate into greater openness to emerging transport technologies, implying that satisfaction functions primarily as a driver of continued CPT use rather than as a motivator for transition to APT. Furthermore, younger individuals as well as those with higher levels of education were found to be significant predictors of APT usage. The negative role of age suggests that younger individuals are more enthusiastic about autonomous technologies, aligning with prior evidence that generational cohorts differ in their openness to innovation. Furthermore, the positive effect of education reflects greater awareness and knowledge about novel technologies, which facilitates acceptance.
In addition, within the structural model of conventional bus rapid transit systems, trust and effort expectancy emerged as the strongest determinants. This emphasizes the importance of autonomous technology reliability and perceived ease of use in fostering acceptance of APT among BRT users, reflecting their dependence on both confidence in service delivery and the expectation of reduced cognitive or physical effort. Similar to the model of urban rail systems, a significant and positive relationship was identified between loyalty to CPT and behavioural intention. This unique finding indicates that loyalty not only strengthens current CPT use but also extends into openness to APT, underlining the transferability of habitual and affective bonds across transport modes. Although a significant relationship emerged between performance expectancy and behavioural intention, the relationship was negative, contrary to the hypothesis. The negative effect of performance expectancy, although contrary to the hypothesis, suggests that BRT users who place greater emphasis on performance may perceive APT as less capable of meeting their expectations compared to CPT. This counterintuitive finding highlights the role of scepticism toward technological maturity and points to the importance of managing expectations in the early phases of APT deployment.
The analysis results indicated that there is no significant relationship between satisfaction with CPT (H7) and behavioural intention to use APT for all models. Even though the hypothesized relationship is not supported, it is revealed that there is a significant and positive relationship between loyalty to CPT and the behavioural intention to use APT for both the conventional urban rail systems and conventional bus rapid transit models. That is, current loyal users of urban rail systems (β = 0.109) and bus rapid transit show (β = 0.230) a significant positive tendency toward using APT. The positive influence of loyalty on APT adoption can be explained in several ways. First, loyalty may reflect not only habitual and affective bonds but also a broader sense of trust in public transport authorities and service providers. Such trust may translate into greater openness toward adopting innovative systems such as APT. Second, loyal CPT users may perceive APT less as an emerging technology and more as a continuation or enhancement of the existing system, which reduces perceived risks and fosters acceptance. Furthermore, in contrast to satisfaction, which primarily represents evaluations of current service experiences, loyalty represents long-term commitment and habitual reliance. This enduring commitment may therefore function as a stronger predictor of openness to technological innovations. By contrast, the non-significant effect of satisfaction on the intention to use APT can also be explained through the cognitive–habitual distinction between satisfaction and loyalty. Satisfaction is typically a conscious evaluative judgment based on perceptions of service quality within CPT, and thus reflects deliberate and rational assessments. Such conscious evaluations may not easily extend to the adoption of an emerging technology that users have not yet directly experienced, which could explain the absence of a significant relationship between satisfaction and APT intention. Loyalty, on the other hand, may be shaped by habitual reliance and affective attachment, operating less through conscious judgment and more through long-standing patterns of behaviour. This can be attributed to the fact that people tend to remain loyal to their choice or choices they perceive as its continuation, regardless of their satisfaction with them, which is consistent with findings in existing literature [63,91,92,93]. Thus, loyalty may emerge as a more significant factor that affects users to switch from the current technologies to the new technologies.
As previously mentioned, another contribution of this study to the literature is examining public transport type by type, rather than treating it as a general and unified mode. For instance, Scherer [94] revealed that some public transport users found light rail systems more attractive than buses and prioritized them. Ben-Akiva & Morikawa [95] investigated the potential difference between the ridership attraction of urban rail systems and bus. The study revealed that there was no significant difference in user preference when quantifiable service characteristics such as travel time and cost were equal. However, when urban rail systems offered higher quality service, public transport users tended to prioritize them. In their study conducted in Stockholm, Lorenzo Varela et al. [96] investigated whether differences in preference existed among public transport modes for commuters. The study concluded that the value of time for trains is lower than that for buses and metro systems, and that the unobserved preference for metro is higher than for buses. As seen, although the majority of studies in the literature treat public transport as a general and unified mode, there may be differences in choice between its various types in terms of both perceptual and rational factors. Thus, within the scope of this study, the behavioural intention of current public transport users in Istanbul toward APT is investigated separately. The analysis results revealed that different types of CPT users have different concerns and priorities regarding their intention to use APT. Conventional rubber tire systems users have placed the highest priority on effort expectancy. Moreover, it is revealed that the opinions of family members and friends of conventional urban rail system users regarding APT are the factors that most strongly influence their intention to use it. In addition, conventional bus rapid transit systems users place the utmost importance on trust in APT. These findings show that investigating public transport modes separately may provide more accurate insights into behavioural intentions toward APT.

7. Conclusions

In this study, the UTAUT and satisfaction–loyalty models are employed to construct the theoretical framework, and the factors influencing behavioural intentions toward APT are examined in depth. The model results reveal the significance of the relationship between CPT and APT, and analyse the behavioural intentions toward the use of APT. The comparative analysis between the basic UTAUT and the proposed integrated UTAUT models confirmed the methodological strength of the extended framework. Across all three transport modes, the integrated model consistently outperformed the basic version in explanatory power, with improvements ranging from 9.9% to 34.4%. In this regard, the proposed integrated model is believed to be a viable approach for bridging the existing gap in exploring CPT users’ behavioural intentions toward APT, providing valuable insights for dissemination.
In addition, several significant findings were obtained within the scope of this study. First and foremost, a relationship exists between CPT and APT. Users’ loyalty to CPT significantly influences their intention to use APT. In two of the three proposed integrated models, it was revealed that loyalty to CPT significantly and positively influences the intention to use APT. Hence, loyalty is a key factor that affects the dissemination of APT. Secondly, it is revealed that examining public transport in detail, by type rather than as a general and unified mode, yields more accurate insights. Indeed, different public transport type users have distinct priorities that influence their intention to use APT. For users of conventional rubber-tired systems, effort expectancy, social influence and facilitating conditions are important factors. For users of conventional urban rail systems, social influence, trust and loyalty to CPT are decisive factors. Users of conventional bus rapid transit systems consider numerous factors important: performance expectancy, effort expectancy, trust, and loyalty to CPT significantly influence behavioural intention. Moreover, satisfaction with CPT positively and significantly influences loyalty to CPT across all three public transport types. Third, perhaps one of the most important contributions of this study is the revelation that public transport, which promises sustainable, safe, economical, and smooth transport, must be meticulously analysed in order to ensure its continued use when autonomous vehicles become widespread in the future. Such detailed examination can offer more accurate predictions about future scenarios.

Limitations and Future Directions

In addition to its contributions, this study has some limitations that need to be addressed. First, in a large metropolis with a well-developed public transportation network such as Istanbul, it is likely that participants use multiple types of public transport. Although the study included only participants who exclusively use one (or mostly one) type of public transport, and the questionnaire emphasized their selected mode through type-specific questions and visuals, there remains a risk that participants’ experiences with other public transport modes may have influenced their responses. In future studies, to eliminate this potential bias entirely, targeting participants who exclusively use a single type of public transport, although challenging in terms of time and cost, would provide more accurate and reliable results. Secondly, no significant relationship was identified regarding satisfaction within the model framework. Although the current sample size is sufficiently large, more meaningful results concerning satisfaction could be obtained with a larger budget and, consequently, a larger dataset, as demonstrated in other studies [43,44]. While the differences between CPT and APT were explained to participants in detail using written and visual materials, some may have perceived APT as merely a continuation of CPT. Future studies could develop new models incorporating latent variables such as inertia and habit to examine whether users who are loyal to CPT consciously intend to use APT or simply perceive it as a new extension of CPT. Finally, while the effect of satisfaction with conventional transport modes on the intention to use new technologies has been examined in only a few studies, this study is the first to investigate the effect of loyalty to conventional transport modes on behavioural intention. Future studies could develop models for different types of autonomous vehicles, thereby contributing to a more comprehensive understanding and further enriching the literature in this field.
Additionally, while this study primarily addresses the supply-side improvement, future research should aim to complement supply-side innovations, such as APT, with demand-side perspectives that capture passenger behaviour and usage dynamics. While APT promises significant operational efficiencies and service improvements, sustaining long-term ridership also depends on understanding how passengers’ travel patterns evolve over time. In this regard, a novel framework, the TripChain2RecDeepSurv model [97], which predicts lifecycle behaviour status transitions and identifies optimal intervention points against passenger churn, highlights promising directions for integrating behavioural analytics into transit planning. Incorporating such demand-side approaches alongside supply-side technological advancements may provide a more holistic framework, enabling policymakers and operators to design strategies that both reduce operating costs and secure a resilient, growing ridership base.

Author Contributions

Conceptualization, M.E.; Data curation, H.Y.; Formal analysis, H.Y. and G.B.; Investigation, H.Y.; Methodology, H.Y.; Project administration, M.E. and G.B.; Software, H.Y.; Supervision, M.E.; Visualization, H.Y.; Writing—original draft, H.Y., M.E. and G.B.; Writing—review & editing, M.E. and G.B. All authors have read and agreed to the published version of the manuscript.

Funding

This work is jointly supported by the Istanbul Technical University Scientific Research Projects Coordination Unit (project ID. 45132, project code. MDK-2023-45132) and Scientific and Technological Research Council of Turkey (2214-A, project no. 1059B142400109).

Institutional Review Board Statement

The study was conducted in accordance with the Declaration of Helsinki and approved by the Ethics Committee of Istanbul Technical University (approval code: 576, approval date: 4 November 2024).

Informed Consent Statement

Informed consent for participation was obtained from all subjects involved in the study.

Data Availability Statement

The original contributions presented in this study are included in the article. Further inquiries can be directed to the corresponding author.

Acknowledgments

The authors wish to thank the Technological Research Council of Turkey (TUBITAK) and the Istanbul Technical University Scientific Research Projects Coordination Unit (ITU BAP) for their support.

Conflicts of Interest

The authors declare no conflicts of interest. The funders had no role in the design of the study; in the collection, analyses, or interpretation of data; in the writing of the manuscript; or in the decision to publish the results.

Appendix A

Figure A1. Conventional rubber tire systems’ structural model based on the basic UTAUT model (** p < 0.01, *** p < 0.001, n.s. = not significant).
Sustainability 17 09087 g0a1

Appendix B

Figure A2. Conventional urban rail systems’ structural model based on the basic UTAUT model (** p < 0.01, *** p < 0.001, n.s. = not significant).
Sustainability 17 09087 g0a2

Appendix C

Figure A3. Conventional bus rapid transit systems’ structural model based on the basic UTAUT model (*** p < 0.001, n.s. = not significant).
Sustainability 17 09087 g0a3

References

  1. Fagnant, D.J.; Kockelman, K. Preparing a Nation for Autonomous Vehicles: Opportunities, Barriers and Policy Recommendations. Transp. Res. Part A Policy Pract. 2015, 77, 167–181. [Google Scholar] [CrossRef]
  2. Bakioglu, G.; Salehin, M.F.; Wang, K.; Atahan, A.O.; Habib, K.N. Examination of the Role of Safety Concerns from Autonomous Vehicle Ownership Choice: Results of a Stated Choice Experiment in Istanbul, Turkey. Transp. Lett. 2022, 14, 1172–1183. [Google Scholar] [CrossRef]
  3. Acheampong, R.A.; Cugurullo, F. Capturing the Behavioural Determinants behind the Adoption of Autonomous Vehicles: Conceptual Frameworks and Measurement Models to Predict Public Transport, Sharing and Ownership Trends of Self-Driving Cars. Transp. Res. Part F Traffic Psychol. Behav. 2019, 62, 349–375. [Google Scholar] [CrossRef]
  4. Wang, S.; Jiang, Z.; Noland, R.B.; Mondschein, A.S. Attitudes towards Privately-Owned and Shared Autonomous Vehicles. Transp. Res. Part F Traffic Psychol. Behav. 2020, 72, 297–306. [Google Scholar] [CrossRef]
  5. Bakioglu, G.; Atahan, A.O. AHP Integrated TOPSIS and VIKOR Methods with Pythagorean Fuzzy Sets to Prioritize Risks in Self-Driving Vehicles. Appl. Soft Comput. 2021, 99, 106948. [Google Scholar] [CrossRef]
  6. Fagnant, D.J.; Kockelman, K.M. The Travel and Environmental Implications of Shared Autonomous Vehicles, Using Agent-Based Model Scenarios. Transp. Res. Part C Emerg. Technol. 2014, 40, 1–13. [Google Scholar] [CrossRef]
  7. Wadud, Z.; MacKenzie, D.; Leiby, P. Help or Hindrance? The Travel, Energy and Carbon Impacts of Highly Automated Vehicles. Transp. Res. Part A Policy Pract. 2016, 86, 1–18. [Google Scholar] [CrossRef]
  8. Wilson, C.; Limburg, A.; Caldecott, B. Implications of the International Energy Agency Net Zero Emissions by 2050 Scenario for Net Zero Committed Financial Institutions; Oxford Sustainable Finance Group: Oxford, UK, 2022. [Google Scholar]
  9. Lu, Q.; Tettamanti, T.; Hörcher, D.; Varga, I. The Impact of Autonomous Vehicles on Urban Traffic Network Capacity: An Experimental Analysis by Microscopic Traffic Simulation. Transp. Lett. 2020, 12, 540–549. [Google Scholar] [CrossRef]
  10. Harb, M.; Xiao, Y.; Circella, G.; Mokhtarian, P.L.; Walker, J.L. Projecting Travelers into a World of Self-Driving Vehicles: Estimating Travel Behavior Implications via a Naturalistic Experiment. Transportation 2018, 45, 1671–1685. [Google Scholar] [CrossRef]
  11. Harb, M.; Stathopoulos, A.; Shiftan, Y.; Walker, J.L. What Do We (Not) Know about Our Future with Automated Vehicles? Transp. Res. Part C Emerg. Technol. 2021, 123, 102948. [Google Scholar] [CrossRef]
  12. Yu, C.; Dong, W.; Liu, Y.; Yang, C.; Yuan, Q. Rethinking Bus Ridership Dynamics: Examining Nonlinear Effects of Determinants on Bus Ridership Changes Using City-Level Panel Data from 2010 to 2019. Transp. Policy 2024, 151, 85–100. [Google Scholar] [CrossRef]
  13. Mandys, F. Electric Vehicles and Consumer Choices. Renew. Sustain. Energy Rev. 2021, 142, 110874. [Google Scholar] [CrossRef]
  14. Kautish, P.; Lavuri, R.; Roubaud, D.; Grebinevych, O. Electric Vehicles’ Choice Behaviour: An Emerging Market Scenario. J. Environ. Manag. 2024, 354, 120250. [Google Scholar] [CrossRef] [PubMed]
  15. Fishbein, M.; Ajzen, I. Belief, Attitude, Intention, and Behavior: An Introduction to Theory and Research. Philos. Rhetor. 1975, 10, 130–132. [Google Scholar]
  16. Ajzen, I.; Fishbein, M. Understanding Attitudes and Predicting Social Behavior; Prentice-Hall: Hoboken, NJ, USA, 1980. [Google Scholar]
  17. Ajzen, I. The Theory of Planned Behavior. Organ. Behav. Hum. Decis. Process. 1991, 50, 179–211. [Google Scholar] [CrossRef]
  18. Davis, F.D. Perceived Usefulness, Perceived Ease of Use, and User Acceptance of Information Technology. MIS Q. 1989, 13, 319–340. [Google Scholar] [CrossRef]
  19. Davis, F.D.; Bagozzi, R.P.; Warshaw, P.R. User Acceptance of Computer Technology: A Comparison of Two Theoretical Models. Manag. Sci. 1989, 35, 982–1003. [Google Scholar] [CrossRef]
  20. Venkatesh, V.; Morris, M.G.; Davis, G.B.; Davis, F.D. User Acceptance of Information Technology: Toward a Unified View. MIS Q. 2003, 27, 425–478. [Google Scholar] [CrossRef]
  21. Kenesei, Z.; Kökény, L.; Ásványi, K.; Jászberényi, M. The Central Role of Trust and Perceived Risk in the Acceptance of Autonomous Vehicles in an Integrated UTAUT Model. Eur. Transp. Res. Rev. 2025, 17, 8. [Google Scholar] [CrossRef]
  22. Ni, J.; Chen, J.; Xie, W.; Shao, Y. The Impacts of the Traffic Situation, Road Conditions, and Driving Environment on Driver Stress: A Systematic Review. Transp. Res. Part F Traffic Psychol. Behav. 2024, 103, 141–162. [Google Scholar] [CrossRef]
  23. Waung, M.; McAuslan, P.; Lakshmanan, S. Trust and Intention to Use Autonomous Vehicles: Manufacturer Focus and Passenger Control. Transp. Res. Part F Traffic Psychol. Behav. 2021, 80, 328–340. [Google Scholar] [CrossRef]
  24. Kapser, S.; Abdelrahman, M.; Bernecker, T. Autonomous Delivery Vehicles to Fight the Spread of COVID-19—How Do Men and Women Differ in Their Acceptance? Transp. Res. Part A Policy Pract. 2021, 148, 183–198. [Google Scholar] [CrossRef] [PubMed]
  25. Engesser, V.; Rombaut, E.; Vanhaverbeke, L.; Lebeau, P. Autonomous Delivery Robots for Urban Last-Mile Logistics Operations: A Modified UTAUT Framework. Transp. Res. Procedia 2023, 72, 1816–1823. [Google Scholar] [CrossRef]
  26. Yavuz, Y.C. Exploring University Students’ Acceptability of Autonomous Vehicles and Urban Air Mobility. J. Air Transp. Manag. 2024, 115, 102546. [Google Scholar] [CrossRef]
  27. Lee, C.; Bae, B.; Lee, Y.L.; Pak, T.-Y. Societal Acceptance of Urban Air Mobility Based on the Technology Adoption Framework. Technol. Forecast. Soc. Change 2023, 196, 122807. [Google Scholar] [CrossRef]
  28. Nordhoff, S.; Malmsten, V.; van Arem, B.; Liu, P.; Happee, R. A Structural Equation Modeling Approach for the Acceptance of Driverless Automated Shuttles Based on Constructs from the Unified Theory of Acceptance and Use of Technology and the Diffusion of Innovation Theory. Transp. Res. Part F Traffic Psychol. Behav. 2021, 78, 58–73. [Google Scholar] [CrossRef]
  29. Bellet, T.; Banet, A. UTAUT4-AV: An Extension of the UTAUT Model to Study Intention to Use Automated Shuttles and the Societal Acceptance of Different Types of Automated Vehicles. Transp. Res. Part F Traffic Psychol. Behav. 2023, 99, 239–261. [Google Scholar] [CrossRef]
  30. Cai, L.; Yuen, K.F.; Wang, X. Explore Public Acceptance of Autonomous Buses: An Integrated Model of UTAUT, TTF and Trust. Travel Behav. Soc. 2023, 31, 120–130. [Google Scholar] [CrossRef]
  31. Yuen, K.F.; Choo, L.Q.; Li, X.; Wong, Y.D.; Ma, F.; Wang, X. A Theoretical Investigation of User Acceptance of Autonomous Public Transport. Transportation 2023, 50, 545–569. [Google Scholar] [CrossRef]
  32. Chng, S.; Cheah, L. Understanding Autonomous Road Public Transport Acceptance: A Study of Singapore. Sustainability 2020, 12, 4974. [Google Scholar] [CrossRef]
  33. Chen, Y.; Khan, S.K.; Shiwakoti, N.; Stasinopoulos, P.; Aghabayk, K. Integrating Perceived Safety and Socio-Demographic Factors in UTAUT Model to Explore Australians’ Intention to Use Fully Automated Vehicles. Res. Transp. Bus. Manag. 2024, 56, 101147. [Google Scholar] [CrossRef]
  34. Hafeez, F.; Mas’ud, A.A.; Al-Shammari, S.; Sheikh, U.U.; Alanazi, M.A.; Hamid, M.; Azhar, A. Autonomous Vehicles Perception, Acceptance, and Future Prospects in the GCC: An Analysis Using the UTAUT-Based Model. World Electr. Veh. J. 2024, 15, 186. [Google Scholar] [CrossRef]
  35. Widyanti, A.; Erlangga, R.; Sutarto, A.P.; Trapsilawati, F.; Ansori, N.; Woodman, R.; Pawitra, T.A.; Rifai, A.P. Driving Forward Together: The Common Intention of Indonesians in Different Residential Areas to Use Autonomous Vehicles. Transp. Res. Interdiscip. Perspect. 2024, 24, 101049. [Google Scholar] [CrossRef]
  36. Kapser, S.; Abdelrahman, M. Acceptance of Autonomous Delivery Vehicles for Last-Mile Delivery in Germany—Extending UTAUT2 with Risk Perceptions. Transp. Res. Part C Emerg. Technol. 2020, 111, 210–225. [Google Scholar] [CrossRef]
  37. Bernhard, C.; Oberfeld, D.; Hoffmann, C.; Weismüller, D.; Hecht, H. User Acceptance of Automated Public Transport: Valence of an Autonomous Minibus Experience. Transp. Res. Part F Traffic Psychol. Behav. 2020, 70, 109–123. [Google Scholar] [CrossRef]
  38. Goldbach, C.; Sickmann, J.; Pitz, T.; Zimasa, T. Towards Autonomous Public Transportation: Attitudes and Intentions of the Local Population. Transp. Res. Interdiscip. Perspect. 2022, 13, 100504. [Google Scholar] [CrossRef]
  39. Korkmaz, H.; Fidanoglu, A.; Ozcelik, S.; Okumus, A. User Acceptance of Autonomous Public Transport Systems (APTS): Extended UTAUT2 Model. J. Public Transp. 2021, 23, 100013. [Google Scholar] [CrossRef]
  40. Madigan, R.; Louw, T.; Wilbrink, M.; Schieben, A.; Merat, N. What Influences the Decision to Use Automated Public Transport? Using UTAUT to Understand Public Acceptance of Automated Road Transport Systems. Transp. Res. Part F Traffic Psychol. Behav. 2017, 50, 55–64. [Google Scholar] [CrossRef]
  41. Sweet, M.N.; Scott, D.M.; Hamiditehrani, S. Who Will Adopt Private Automated Vehicles and Automated Shuttle Buses? Testing the Roles of Past Experience and Performance Expectancy. Transp. Plan. Technol. 2023, 46, 45–70. [Google Scholar] [CrossRef]
  42. Niu, Z.; Hu, X.; Qi, S.; Yang, H.; Wang, S.; An, S. Determinants to Parking Mode Alternatives: A Model Integrating Technology Acceptance Model and Satisfaction–Loyalty Model. Transp. Res. Part A Policy Pract. 2021, 152, 216–234. [Google Scholar] [CrossRef]
  43. Curtale, R.; Liao, F.; van der Waerden, P. User Acceptance of Electric Car-Sharing Services: The Case of the Netherlands. Transp. Res. Part A Policy Pract. 2021, 149, 266–282. [Google Scholar] [CrossRef]
  44. Karimi, S.; Karami, H.; Samadzad, M. The Role of Travel Satisfaction and Attitudes toward Travel Modes in the Prospect of Adoption of Urban Air Taxis: Evidence from a Stated Preference Survey in Tehran. Transp. Res. Part A Policy Pract. 2024, 179, 103885. [Google Scholar] [CrossRef]
  45. Nordhoff, S.; de Winter, J.; Madigan, R.; Merat, N.; van Arem, B.; Happee, R. User Acceptance of Automated Shuttles in Berlin-Schöneberg: A Questionnaire Study. Transp. Res. Part F Traffic Psychol. Behav. 2018, 58, 843–854. [Google Scholar] [CrossRef]
  46. Chen, J.; Li, R.; Gan, M.; Fu, Z.; Yuan, F. Public Acceptance of Driverless Buses in China: An Empirical Analysis Based on an Extended UTAUT Model. Discret. Dyn. Nat. Soc. 2020, 2020, 4318182. [Google Scholar] [CrossRef]
  47. Pande, D.; Taeihagh, A. A Governance Perspective on User Acceptance of Autonomous Systems in Singapore. Technol. Soc. 2024, 77, 102580. [Google Scholar] [CrossRef]
  48. Korkmaz Aslan, G.; Kartal, A.; Turan, T.; Taşdemir Yiğitoğlu, G.; Kocakabak, C. Association of Electronic Health Literacy with Health-promoting Behaviours in Adolescents. Int. J. Nurs. Pract. 2021, 27, e12921. [Google Scholar] [CrossRef]
  49. Meyer-Waarden, L.; Cloarec, J. “Baby, You Can Drive My Car”: Psychological Antecedents That Drive Consumers’ Adoption of AI-Powered Autonomous Vehicles. Technovation 2022, 109, 102348. [Google Scholar] [CrossRef]
  50. De Oña, J.; De Oña, R.; Eboli, L.; Mazzulla, G. Perceived Service Quality in Bus Transit Service: A Structural Equation Approach. Transp. Policy 2013, 29, 219–226. [Google Scholar] [CrossRef]
  51. Chen, C.-F. Investigating Structural Relationships between Service Quality, Perceived Value, Satisfaction, and Behavioral Intentions for Air Passengers: Evidence from Taiwan. Transp. Res. Part A Policy Pract. 2008, 42, 709–717. [Google Scholar] [CrossRef]
  52. De Vos, J.; Mokhtarian, P.L.; Schwanen, T.; Van Acker, V.; Witlox, F. Travel Mode Choice and Travel Satisfaction: Bridging the Gap between Decision Utility and Experienced Utility. Transportation 2016, 43, 771–796. [Google Scholar] [CrossRef]
  53. Ye, R.; Titheridge, H. Satisfaction with the Commute: The Role of Travel Mode Choice, Built Environment and Attitudes. Transp. Res. Part D Transp. Environ. 2017, 52, 535–547. [Google Scholar] [CrossRef]
  54. Chen, C.F. Factors Affecting the Decision to Use Autonomous Shuttle Services: Evidence from a Scooter-Dominant Urban Context. Transp. Res. Part F Traffic Psychol. Behav. 2019, 67, 195–204. [Google Scholar] [CrossRef]
  55. Chee, P.N.E.; Susilo, Y.O.; Wong, Y.D.; Pernestål, A. Which Factors Affect Willingness-to-Pay for Automated Vehicle Services? Evidence from Public Road Deployment in Stockholm, Sweden. Eur. Transp. Res. Rev. 2020, 12, 20. [Google Scholar] [CrossRef]
  56. Cao, Z.; Ceder, A.; Zhang, S. Real-Time Schedule Adjustments for Autonomous Public Transport Vehicles. Transp. Res. Part C Emerg. Technol. 2019, 109, 60–78. [Google Scholar] [CrossRef]
  57. Feys, M.; Rombaut, E.; Vanhaverbeke, L. Experience and Acceptance of Autonomous Shuttles in the Brussels Capital Region. Sustainability 2020, 12, 8403. [Google Scholar] [CrossRef]
  58. Nordhoff, S.; van Arem, B.; Merat, N.; Madigan, R.; Ruhrort, L.; Knie, A.; Happee, R. User Acceptance of Driverless Shuttles Running in an Open and Mixed Traffic Environment. In Proceedings of the 12th ITS European Congress, Strasbourg, France, 19–22 June 2017; pp. 19–22. [Google Scholar]
  59. Nordhoff, S.; Madigan, R.; van Arem, B.; Merat, N.; Happee, R. Interrelationships among Predictors of Automated Vehicle Acceptance: A Structural Equation Modelling Approach. Theor. Issues Ergon. Sci. 2021, 22, 383–408. [Google Scholar] [CrossRef]
  60. Paddeu, D.; Parkhurst, G.; Shergold, I. Passenger Comfort and Trust on First-Time Use of a Shared Autonomous Shuttle Vehicle. Transp. Res. Part C Emerg. Technol. 2020, 115, 102604. [Google Scholar] [CrossRef]
  61. Hong, J.-W.; Cruz, I.; Williams, D. AI, You Can Drive My Car: How We Evaluate Human Drivers vs. Self-Driving Cars. Comput. Human Behav. 2021, 125, 106944. [Google Scholar] [CrossRef]
  62. Zhang, C.; Liu, Y.; Lu, W.; Xiao, G. Evaluating Passenger Satisfaction Index Based on PLS-SEM Model: Evidence from Chinese Public Transport Service. Transp. Res. Part A Policy Pract. 2019, 120, 149–164. [Google Scholar] [CrossRef]
  63. Fu, X.; Zhang, J.; Chan, F.T.S. Determinants of Loyalty to Public Transit: A Model Integrating Satisfaction-Loyalty Theory and Expectation-Confirmation Theory. Transp. Res. Part A Policy Pract. 2018, 113, 476–490. [Google Scholar] [CrossRef]
  64. de Oña, J.; de Oña, R.; Eboli, L.; Forciniti, C.; Mazzulla, G. Transit Passengers’ Behavioural Intentions: The Influence of Service Quality and Customer Satisfaction. Transp. A Transp. Sci. 2016, 12, 385–412. [Google Scholar] [CrossRef]
  65. Ingvardson, J.B.; Nielsen, O.A. The Relationship between Norms, Satisfaction and Public Transport Use: A Comparison across Six European Cities Using Structural Equation Modelling. Transp. Res. Part A Policy Pract. 2019, 126, 37–57. [Google Scholar] [CrossRef]
  66. Nguyen-Phuoc, D.Q.; Phuong Tran, A.T.; Van Nguyen, T.; Le, P.T.; Su, D.N. Investigating the Complexity of Perceived Service Quality and Perceived Safety and Security in Building Loyalty among Bus Passengers in Vietnam—A PLS-SEM Approach. Transp. Policy 2021, 101, 162–173. [Google Scholar] [CrossRef]
  67. Allen, J.; Muñoz, J.C.; Ortúzar, J.d.D. Understanding Public Transport Satisfaction: Using Maslow’s Hierarchy of (Transit) Needs. Transp. Policy 2019, 81, 75–94. [Google Scholar] [CrossRef]
  68. Dong, X.; DiScenna, M.; Guerra, E. Transit User Perceptions of Driverless Buses. Transportation 2019, 46, 35–50. [Google Scholar] [CrossRef]
  69. Winter, S.R.; Rice, S.; Mehta, R.; Walters, N.W.; Pierce, M.B.; Anania, E.C.; Milner, M.N.; Rao, N. Do Americans Differ in Their Willingness to Ride in a Driverless Bus? J. Unmanned Veh. Syst. 2018, 6, 267–278. [Google Scholar] [CrossRef]
  70. Nordhoff, S.; de Winter, J.; Payre, W.; van Arem, B.; Happee, R. What Impressions Do Users Have after a Ride in an Automated Shuttle? An Interview Study. Transp. Res. Part F Traffic Psychol. Behav. 2019, 63, 252–269. [Google Scholar] [CrossRef]
  71. Hinderer, H.; Stegmuller, J.; Schmidt, J.; Sommer, J.; Lucke, J. Acceptance of Autonomous Vehicles in Suburban Public Transport. In Proceedings of the 2018 IEEE International Conference on Engineering, Technology and Innovation (ICE/ITMC), Stuttgart, Germany, 17–20 June 2018; pp. 1–8. [Google Scholar]
  72. Alessandrini, A.; Site, P.D.; Gatta, V.; Marcucci, E. Investigating Users’ Attitudes towards Conventional and Automated Buses in Twelve European Cities. Int. J. Transp. Econ. 2016, 43, 413–436. [Google Scholar] [CrossRef]
  73. Cordera, R.; González-González, E.; Nogués, S.; Arellana, J.; Moura, J.L. Modal Choice for the Driverless City: Scenario Simulation Based on a Stated Preference Survey. J. Adv. Transp. 2022, 2022, 1108272. [Google Scholar] [CrossRef]
  74. Patel, R.K.; Etminani-Ghasrodashti, R.; Kermanshachi, S.; Michael Rosenberger, J.; Foss, A. How Riders Use Shared Autonomous Vehicles. In Proceedings of the Automated People Movers and Automated Transit Systems 2022, Seattle, WA, USA, 31 May–3 June 2022; American Society of Civil Engineers: Reston, VA, USA, 2022; pp. 81–93. [Google Scholar]
  75. Cheng, Y.-H.; Chen, S.-Y. Perceived Accessibility, Mobility, and Connectivity of Public Transportation Systems. Transp. Res. Part A Policy Pract. 2015, 77, 386–403. [Google Scholar] [CrossRef]
  76. Bollen, K.A. Structural Equations with Latent Variables; John Wiley & Sons: Hoboken, NJ, USA, 1989. [Google Scholar]
  77. Nordhoff, S.; Stapel, J.; van Arem, B.; Happee, R. Passenger Opinions of the Perceived Safety and Interaction with Automated Shuttles: A Test Ride Study with ‘Hidden’ Safety Steward. Transp. Res. Part A Policy Pract. 2020, 138, 508–524. [Google Scholar] [CrossRef]
  78. Pavlou, P.A. Consumer Acceptance of Electronic Commerce: Integrating Trust and Risk with the Technology Acceptance Model. Int. J. Electron. Commer. 2003, 7, 101–134. [Google Scholar] [CrossRef]
  79. Choi, J.K.; Ji, Y.G. Investigating the Importance of Trust on Adopting an Autonomous Vehicle. Int. J. Hum. Comput. Interact. 2015, 31, 692–702. [Google Scholar] [CrossRef]
  80. Nguyen-Phuoc, D.Q.; Su, D.N.; Tran, P.T.K.; Le, D.-T.T.; Johnson, L.W. Factors Influencing Customer’s Loyalty towards Ride-Hailing Taxi Services—A Case Study of Vietnam. Transp. Res. Part A Policy Pract. 2020, 134, 96–112. [Google Scholar] [CrossRef]
  81. Shen, W.; Xiao, W.; Wang, X. Passenger Satisfaction Evaluation Model for Urban Rail Transit: A Structural Equation Modeling Based on Partial Least Squares. Transp. Policy 2016, 46, 20–31. [Google Scholar] [CrossRef]
  82. Turkish Statistical Institute Address Based Population Registration System Results. Available online: https://data.tuik.gov.tr/Bulten/Index?p=Adrese-Dayali-Nufus-Kayit-Sistemi-Sonuclari-2024-53783 (accessed on 2 April 2025).
  83. INRIX Global Traffic Scorecard 2024. Available online: https://inrix.com/press-releases/2024-global-traffic-scorecard-us/ (accessed on 8 October 2025).
  84. Istanbul Electricity, Tram and Tunnel Establishments. IETT Annual Report 2023; Istanbul Electricity, Tram and Tunnel Establishments: Istanbul, Turkey, 2024. [Google Scholar]
  85. Kline, R.B. Principles and Practice of Structural Equation Modeling, 5th ed.; The Guilford Press: New York, NY, USA, 2015. [Google Scholar]
  86. Hair, J.F.; Hult, G.T.M.; Ringle, C.M.; Sarstedt, M.; Thiele, K.O. Mirror, Mirror on the Wall: A Comparative Evaluation of Composite-Based Structural Equation Modeling Methods. J. Acad. Mark. Sci. 2017, 45, 616–632. [Google Scholar] [CrossRef]
  87. Hair, J.; Anderson, R.E.; Tatham, R.L.; Black, W.C. Multivariate Data Analysis, 5th ed.; Prentice-Hall International Inc.: Hoboken, NJ, USA, 1998. [Google Scholar]
  88. Hair, J.F.; Hult, G.T.M.; Ringle, C.M.; Sarstedt, M.; Danks, N.P.; Ray, S. Evaluation of Reflective Measurement Models. In Partial Least Squares Structural Equation Modeling (PLS-SEM) Using R; Springer: Cham, Switzerland, 2021; pp. 75–90. [Google Scholar]
  89. Cheung, G.W.; Cooper-Thomas, H.D.; Lau, R.S.; Wang, L.C. Reporting Reliability, Convergent and Discriminant Validity with Structural Equation Modeling: A Review and Best-Practice Recommendations. Asia Pac. J. Manag. 2024, 41, 745–783. [Google Scholar] [CrossRef]
  90. Hooper, D.; Coughlan, J.; Mullen, M.R. Structural Equation Modelling: Guidelines for Determining Model Fit. Electron. J. Bus. Res. Methods 2008, 6, 53–60. [Google Scholar]
  91. Sun, S.; Zhou, L.; Wang, P.; Zhang, H. Unraveling the Inconsistency in Captive Riders’ Behaviors and Attitudes within Public Transportation Service Usage: An Integrated Modeling Approach. Res. Transp. Econ. 2024, 105, 101431. [Google Scholar] [CrossRef]
  92. Fang, D.; Xue, Y.; Cao, J.; Sun, S. Exploring Satisfaction of Choice and Captive Bus Riders: An Impact Asymmetry Analysis. Transp. Res. Part D Transp. Environ. 2021, 93, 102798. [Google Scholar] [CrossRef]
  93. Chen, C.-F.; Chao, W.-H. Habitual or Reasoned? Using the Theory of Planned Behavior, Technology Acceptance Model, and Habit to Examine Switching Intentions toward Public Transit. Transp. Res. Part F Traffic Psychol. Behav. 2011, 14, 128–137. [Google Scholar] [CrossRef]
  94. Scherer, M. Is Light Rail More Attractive to Users than Bus Transit?: Arguments Based on Cognition and Rational Choice. Transp. Res. Rec. J. Transp. Res. Board 2010, 2144, 11–19. [Google Scholar] [CrossRef]
  95. Ben-Akiva, M.; Morikawa, T. Comparing Ridership Attraction of Rail and Bus. Transp. Policy 2002, 9, 107–116. [Google Scholar] [CrossRef]
  96. Lorenzo Varela, J.M.; Börjesson, M.; Daly, A. Public Transport: One Mode or Several? Transp. Res. Part A Policy Pract. 2018, 113, 137–156. [Google Scholar] [CrossRef]
  97. Yu, C.; Lin, H.; Dong, W.; Fang, S.; Yuan, Q.; Yang, C. TripChain2RecDeepSurv: A Novel Framework to Predict Transit Users’ Lifecycle Behavior Status Transitions for User Management. Transp. Res. Part C Emerg. Technol. 2024, 167, 104818. [Google Scholar] [CrossRef]
Figure 1. Structure framework of the study.
Sustainability 17 09087 g001
Figure 2. The research model.
Sustainability 17 09087 g002
Figure 3. Conventional rubber tire systems’ structural model based on the proposed integrated UTAUT model (** p < 0.01, *** p < 0.001, n.s. = not significant).
Sustainability 17 09087 g003
Figure 4. Conventional urban rail systems’ structural model based on the proposed integrated UTAUT model (** p < 0.01, *** p < 0.001, n.s. = not significant).
Sustainability 17 09087 g004
Figure 5. Conventional bus rapid transit systems’ structural model based on the proposed integrated UTAUT model (** p < 0.01, *** p < 0.001, n.s. = not significant).
Sustainability 17 09087 g005
Table 1. Description of the constructs and sources.
Construct Description Source
Performance expectancy The degree to which an individual’s use of the new technology will provide gains in job performance. Adapted from Bellet & Banet [29]; Curtale et al. [43];
Madigan et al. [40]; Nordhoff et al. [77]; Venkatesh et al. [20]
Effort expectancy The level of ease an individual perceives in using a new technology.
Social influence The degree to which individuals perceive those significant others in their social circle (such as family and friends) believe they should adopt and use new technology.
Facilitating conditions The degree to which an individual believes that supporting factors, such as knowledge and technical infrastructure, are available to facilitate the use of the new technology.
Trust The degree of participants’ confidence in the APT’s in-car and driving safety.New construct based on Choi & Ji [79]; Korkmaz et al. [39]; Nordhoff et al. [28]; Pavlou [78]
Loyalty Overall satisfaction with CPT, willingness to recommend it to others, and continue using CPT in the future.New constructs based on de Oña et al. [64]; Fu et al. [63]; Nguyen-Phuoc et al. [80]; Shen et al. [81]; Zhang et al. [62]
Satisfaction CPT user’s overall experience with a CPT service compared to his or her pre-defined expectations.
Behavioural intention The degree to which respondents intend to use the APT. Adapted from Bellet & Banet [29]; Curtale et al. [43]; Madigan et al. [40]; Nordhoff et al. [77]; Venkatesh et al. [20]
Table 2. Measurement items.
ConstructsItems
Performance expectancy
PE1I would find the APT a useful mode of transport
PE2I expect using the APT would shorten travel times
PE3I expect a safe and comfortable travel with APT
PE4I expect that using APT would increase my productivity
Effort expectancy
EE1I expect it’ll be easy to understand how to use the APT
EE2I expect a clear and understandable interaction with the APT
EE3I expect a simple procedure for using the APT
Social influence
SI1People who are important to me would think that I should use the APT
SI2I would probably use the APT if people who are important to me think that I should use the APT
SI3I would be more likely to use APT if my friends and family also used it.
Facilitating conditions
FC1I have the knowledge necessary to use the APT
FC2I have the resources necessary to use the APT
FC3I would be able to get help from others when I have difficulties using an APT
Trust
TR1I think the APT is safe
TR2I think the APT is safer than CPT
TR3I think the APT can reduce traffic accidents
Loyalty
LOY1I intend to keep travelling by this CPT when I want to travel
LOY2I consider this CPT to be my first choice when I travel
LOY3I recommend this CPT to others.
LOY4I say positive things about this CPT
Satisfaction
SAT1I am satisfied with this CPT
SAT2I believe I make a right decision to choose this CPT
SAT3The CPT service meets my expectations
SAT4I feel happy with my decision to travel by this CPT
Behavioural intention
BI1I plan to try the APT in the future
BI2I plan to use the APT frequently in the future
BI3Assuming that I had access to APT, I predict that I would use it
BI4I intend to use APT in the future
Table 3. Socio-demographic and transport-related characteristics.
VariableLevelsNPercentage (%)
Main public transport typePublic transport with rubber tires52140.99
Urban rail systems44735.17
Bus rapid transit30323.84
GenderFemale67152.79
Male60047.21
Age18–251138.92
26–3522517.67
36–4531224.56
46–5530423.94
56–6520916.43
>651088.48
Household size118714.71
227421.57
333626.47
4 and more47437.25
Car ownership028722.55
172356.86
2 and more26220.59
EducationElementary school76059.81
High school393.09
Undergraduate & two-year degree36728.89
Master816.36
PhD241.86
Working statusStudent564.42
Public employee1017.95
Private sector employee50339.58
Retired27421.55
Unemployed33726.5
Monthly income<$54942433.36
$549–$82430724.17
$824–$137428822.67
$1374–$274716813.22
>$2747846.59
Table 4. Results of confirmatory factor analysis.
Conventional Rubber
Tire Systems
Conventional Urban
Rail Systems
Conventional Bus Rapid
Transit Systems
Latent VariableNotationλCRAVEλCRAVEλCRAVE
Performance expectancyPE10.7660.9310.8970.6860.8310.9330.8840.6570.7210.9570.8940.680
PE20.8680.8290.866
PE30.8720.8340.912
PE40.8010.7450.786
Effort expectancyEE10.9370.9470.9320.8210.7250.9570.8810.7140.7810.9690.8310.622
EE20.8870.8960.833
EE30.8930.9020.749
Social influenceSI10.8410.9360.8850.7190.8590.9420.8690.6890.9380.9340.8450.648
SI20.8580.7560.704
SI30.8450.8710.755
Facilitating conditionsFC10.6920.8220.7580.5120.6610.8260.7570.5100.7480.7840.8120.594
FC20.7850.7820.893
FC30.6630.6940.652
TrustTR10.8530.9420.8910.7310.8740.9510.8730.6970.8240.9630.9120.776
TR20.8650.7520.890
TR30.8470.8730.925
LoyaltyLOY10.7590.8850.8730.6330.8250.9210.8680.6220.8390.9010.8930.675
LOY20.7810.7990.816
LOY30.7980.8180.830
LOY40.8410.7060.802
SatisfactionSAT10.7110.9060.8460.5790.8340.9110.9270.7620.8690.9260.9020.701
SAT20.6980.7870.676
SAT30.8050.8710.814
SAT40.8220.9870.963
Behavioural intentionBI10.8470.9330.9010.6940.8870.9590.9150.7300.8670.9570.9390.795
BI20.8310.9030.967
BI30.8190.7250.888
BI40.8340.8900.840
Note: λ = Factor loading; ⍺ = Cronbach’s alpha; CR = Composite reliability; AVE = average variance extracted.
Table 5. Model Fit Measures.
Fit Index CMIN/DF =x2/dfGFIAGFICFINFITLIRMSEASRMR
Good Fitx2/df < 3>0.95>0.95>0.95>0.95>0.95<0.05<0.05
Acceptable Fit3 < x2/df < 5>0.90>0.90>0.90>0.90>0.90<0.08<0.08
Conventional rubber tire systems
The Proposed Model Fit Indices3.520.9410.9490.9410.9470.9410.070.07
Conventional urban rail systems
The Proposed Model Fit Indices3.1690.9480.9490.9550.9360.9470.070.07
Conventional bus rapid transit systems
The Proposed Model Fit Indices1.690.9690.9610.9750.9650.9660.040.032
x2/df = ratio of chi-square to degrees of freedom, GFI = goodness-of-fit index, AGFI = adjusted goodness-of-fit index, CFI = comparative fit index, NFI = normed fit index, TLI = Tucker–Lewis index, RMSEA = root mean square error of approximation, SRMR = standardized root mean square residual.
Table 6. Comparison of R2 values for behavioural intention between the basic and proposed integrated UTAUT models.
R2 for Behavioural
Intention
Basic UTAUTThe Proposed
Integrated UTAUT Model
Improvement over Basic Model
Conventional rubber tire systems’
structural model
0.5940.6539.9%
Conventional urban rail systems’
structural model
0.4910.66034.4%
Conventional bus rapid transit systems’
structural model
0.6840.77112.7%
Table 7. Results of the proposed integrated UTAUT structural models: hypotheses, standardized path coefficients (b), p-values (p) (** p < 0.01, *** p < 0.001).
Hypotheses Standardized Path
Coefficients
p-Values Supported?
Conventional rubber tire systems’ structural model
H1: PE → BI0.0380.611No
H2: EE → BI0.497***Yes
H3: SI → BI0.173**Yes
H4: FC → BI0.196**Yes
H5: TR → BI−0.0280.679No
H6: LOY → BI−0.0190.828No
H7: SAT → BI0.0130.861No
H8: SAT → LOY0.584***Yes
H9a: Male → BI0.162**Yes
H9b: Age → BI−0.0320.644No
H9c: Education → BI0.132**Yes
H9d: Income → BI0.0640.379No
H10: Car ownership → BI−0.0220.775No
Conventional urban rail systems’ structural model
H1: PE → BI−0.0080.898No
H2: EE → BI0.0270.702No
H3: SI → BI0.539***Yes
H4: FC → BI0.0530.494No
H5: TR → BI0.178**Yes
H6: LOY → BI0.109**No
H7: SAT → BI−0.0600.424No
H8: SAT → LOY0.858***Yes
H9a: Male → BI0.0880.291No
H9b: Age → BI−0.202***Yes
H9c: Education → BI0.171**Yes
H9d: Income → BI0.0340.631No
H10: Car ownership → BI−0.0730.342No
Conventional bus rapid transit systems’ structural model
H1: PE → BI−0.331***No
H2: EE → BI0.407***Yes
H3: SI → BI−0.0620.401No
H4: FC → BI0.0570.442No
H5: TR → BI0.706***Yes
H6: LOY → BI0.230***No
H7: SAT → BI−0.0650.370No
H8: SAT → LOY0.829***Yes
H9a: Male → BI0.0540.480No
H9b: Age → BI−0.189**Yes
H9c: Education → BI0.206***Yes
H9d: Income → BI0.0120.872No
H10: Car ownership → BI−0.0070.901No
Disclaimer/Publisher’s Note: The statements, opinions and data contained in all publications are solely those of the individual author(s) and contributor(s) and not of MDPI and/or the editor(s). MDPI and/or the editor(s) disclaim responsibility for any injury to people or property resulting from any ideas, methods, instructions or products referred to in the content.