Article

Steam-Assisted Semi-Carbonization Pretreatment of Corn Stalks: Effects on Physicochemical Properties for Enhanced Biomass Utilization

1
School of Engineering, Shenyang Agricultural University, Shenyang 110866, China
2
Liaoning Provincial Key Laboratory of Energy Storage and Utilization, Yingkou Institute of Technology, Yingkou 115014, China
*
Author to whom correspondence should be addressed.
Sustainability 2025, 17(20), 9091; https://doi.org/10.3390/su17209091 (registering DOI)
Submission received: 28 August 2025 / Revised: 5 October 2025 / Accepted: 10 October 2025 / Published: 14 October 2025

Abstract

The inefficient disposal of corn stover (CS) and the accumulation of magnesite tailings (MMTs) pose dual environmental threats. Although biomass gasification can utilize CS, its inherent drawbacks result in syngas with low heating value and high tar content. Torrefaction pretreatment can effectively improve biomass properties, and the use of steam as a reaction medium can further optimize the product’s pore structure. This study proposes a steam-assisted torrefaction pretreatment to address the inefficient utilization of CS and the disposal challenges of MMTs. The experimental results demonstrated that torrefaction at 300 °C with 30% water content for 60 min significantly improved the raw material’s properties. The optimized CSBC exhibited a well-developed pore structure and achieved a phenol removal rate of 63.4%. The addition of MMTs further enhanced the pretreatment effect, increasing the removal rate to 75.5% and confirming the superiority of the CSBC–magnesite composite system. The steam atmosphere improved phenol adsorption by regulating pore structures and surface functional groups, offering a feasible approach for utilizing solid waste resources and developing a new in situ tar control strategy.

1. Introduction

Corn stalk (CS) is an abundantly available agricultural byproduct with considerable potential for renewable energy production [1]. However, approximately 11.8 billion tons of straw are still disposed of annually through traditional incineration, leading to severe resource wastage and environmental pollution [2]. Therefore, developing efficient and clean biomass energy utilization technologies is essential for alleviating the energy crisis [3]. Researchers have previously converted CS into high-calorific-value biofuels—for instance, by using an exa ruthenium-based catalyst under sodium hydroxide catalysis the solid products undergo hydrotracting furfural from CS. Then, the residues can be hydrolyzed to produce levulinic acid [4]. Using genation, deoxygenation, and upgrading can yield final products such as aviation fuel [5]. Similarly, research on developing advanced multifunctional collagen-based nanocomposites using biomass derivatives has attracted widespread attention. These materials exhibit significant application potential in the fields of bioinformation encryption and display [6], sustainable packaging [7], and environmental remediation [8]. Additionally, biomass gasification technology can transform CS into combustible gases rich in H2, CO2, and CH4. However, biomass feedstock inherently exhibits characteristics such as a loose structure, high ash content, high O/C ratio, low energy density, and poor raw material quality. These characteristics result in issues such as a low calorific value of gasification products and excessive tar content. In particular, high tar concentrations can cause pipeline blockages, equipment corrosion, and contamination, thereby compromising system stability [9]. Thus, appropriate pretreatment methods are necessary to enhance biomass energy density and improve the quality of combustible gases.
Biomass torrefaction pretreatment is a mild pyrolysis process conducted at relatively low temperatures compared to conventional pyrolysis, typically between 200 °C and 300 °C. This thermal treatment primarily modifies biomass properties by removing moisture and light volatile components (e.g., hemicellulose degradation products). Unlike complete pyrolysis, torrefaction preserves the biomass’s fundamental carbon skeleton while considerably improving feedstock characteristics. It serves as an effective strategy for simultaneously enhancing syngas production and minimizing tar formation [10]. Singh et al. [11] conducted torrefaction experiments at various temperatures using eucalyptus as feedstock. Their results showed optimal performance of the product yield at 280 °C with a 60 min residence time, achieving 37.1% and 12.9% improvements in higher heating value (HHV) and energy density, respectively. Tsalidis et al. [12] systematically investigated the effects of torrefaction pretreatment on tar generation during spruce gasification. Their findings revealed that spruce pretreated at 260 °C exhibited a remarkable reduction of 30% of the tar content in the gasification products compared to untreated material. This finding clearly validates the effectiveness of torrefaction pretreatment in improving biomass gasification quality. Sarker et al. [13] examined the influence of torrefaction on pigeon pea stalks. Their findings revealed concurrent decreases in O/C and H/C ratios with increasing pretreatment temperature. Under optimal conditions of 275 °C and a 45 min residence time, the torrefied biomass showed a 28.6% increase in calorific value and a notable improvement in energy density compared to the raw material.
Steam is a crucial atmospheric medium for torrefaction treatment and forms the basis of steam-based technologies used to convert biomass wastes into high-value combustible gases [14]. It has been widely employed to upgrade low-quality biomass feedstocks, thereby enhancing subsequent gasification processes to achieve low tar yields and high syngas production. When steam is used as a gasification agent, the hydrogen concentration in the resulting syngas appreciably increases, leading to higher-quality syngas products compared with air gasification [15]. The reducing environment created by steam enhances metal–biomass interactions, thereby improving the performance of biochar (BC) catalysts by reducing particle size to the nanoscale and optimizing pore structure, while also yielding high-value bio-oil products through biomass pyrolysis steam-reforming processes [16]. Zhou et al. [17] found that using steam as the atmospheric medium for torrefaction at 280 °C enabled more efficient removal of oxygenated volatiles from corn cob and rice husk compared with air gasification. In the subsequent gasification reactions, tar yield remained below 1%, and the H2 production rate of syngas increased from 4.33 (raw material) to 12.97 mmol/g (280 °C treated). Ömer et al. [18] developed a physical activation method using steam as the atmospheric medium for carbonization treatment to produce activated carbon from acorn shells. The resulting activated carbon exhibited a maximum Brunauer–Emmett–Teller surface area (1779 m2/g), a micropore volume of 0.927 cm3/g, and a density functional theory calculation-derived pore diameter of 1.688 nm. Collectively, these findings demonstrate that biomass structure modification is influenced not only by torrefaction temperature and treatment duration, but also by the selection of the reactive atmosphere medium, which plays a pivotal optimization role in optimizing biomass conversion and product quality [19].
As a globally notable nonrenewable mineral resource, magnesite has extensive proximate application value. However, continuous mining operations have generated substantial amounts of magnesite tailings (MMTs), which contain high levels of impurities such as calcium and silicon, making their effective utilization challenging. These tailings are typically disposed of as waste piles, posing potential contamination risks to air quality and causing the leaching of heavy metals into groundwater systems [20,21]. Therefore, the development of environmentally friendly and sustainable approaches for MMT treatment has remained a research priority. To mitigate the environmental impact of MMTs, researchers have explored various utilization strategies [22]. One notable approach involves employing magnesite as a bed material in gasification reactions, which considerably enhances hydrogen production. Experimental results have demonstrated a 100% increase in hydrogen volume fraction compared with the condition without adding magnesite, along with effective tar suppression, achieving reductions of approximately 2 g/m3 [23,24]. Alternative strategies include converting MMTs into refractory materials [25], magnesium potassium phosphate cements [26], and porous MgO-based ceramics [27]. However, these strategies generally face limitations in processing capacity or involve complex procedures, rendering them unsuitable for large-scale proximate implementation. Therefore, these strategies do not offer an effective solution for the substantial accumulation of MMTs.
In summary, the development of a synergistic technology combining magnesite and biomass effectively addresses waste disposal challenges while enhancing resource utilization efficiency and economic benefits. Zhou et al. [28] successfully synthesized magnesite-modified BC via copyrolysis and demonstrated its efficacy in phosphate adsorption (176.16 mg/g) and plant growth promotion, with germination rates and plant height increasing by 5.0–5.8 times and 9.4–10.0 times, respectively. Furthermore, Liang et al. [29] developed a porous MgO-nanofiber-functionalized biochar (PMgNF-BC) using waste biomass and magnesite, which exhibited enhanced phosphate adsorption and regeneration performance. This advanced material achieved an exceptional phosphate adsorption capacity of 725.43 mg/g at 318.15 K.
However, current research on the synergistic effects of temperature, processing time, and reactive atmosphere agents on biomass properties, gas yield, and tar suppression during torrefaction pretreatment remains limited. Moreover, the underlying mechanisms governing the magnesite–biomass interaction during torrefaction remain poorly understood. Therefore, this study systematically optimizes the process parameters of torrefaction pretreatment and investigates the optimal reaction conditions for CS torrefaction. The torrefaction pretreatment is employed to create a partially carbonized structure that retains certain organic components, such as a carbon-rich aromatic structural framework, thereby preventing excessive ash formation or over-fragilization of the CS. Innovatively, magnesite is introduced as an additive, and phenol is used as a model compound for tar products generated during gasification [30]. This approach aims to elucidate the adsorption mechanisms of BC toward organic pollutants, offering new strategies for in situ tar control while establishing a theoretical foundation for high-value biomass utilization and environmental pollution remediation. The findings of this study have notable implications for promoting sustainable development by addressing the interlinked challenges of energy production, environmental protection, and economic growth.

2. Materials and Methods

2.1. Chemicals and Reagents

Corn stalk (CS; particle size: 12 mesh) was collected from farmlands surrounding Dalian City. Magnesite, which was calcined at 800 °C to 60 mesh assaying 90% MgO and minor impurities such as SiO2 and CaO, was provided by Yingkou Magnesite Chemical Group Co., Ltd. (Yingkou, China).
Phenol (analytical grade) was purchased from Shanghai Aladdin Biochemical Technology Co., Ltd. (Shanghai, China). Ammonium hydroxide and ammonium chloride were obtained from Tianjin Comio Chemical Reagent Co., Ltd. (Tianjin, China). Potassium ferricyanide and 4-aminoantipyrine (analytical grade) were supplied by Shanghai Macklin Biochemical Technology Co., Ltd. (Shanghai, China). All solutions were prepared using distilled water.

2.2. Semi-Carbonization Pretreatment Process

Pretreatment Process

(1)
Steam-assisted torrefaction pretreatment of corn stover
The torrefaction pretreatment of the corn stover was performed in a muffle furnace. Quartz crucibles were wrapped with aluminum foil, and 5 g of corn stover powder was placed in each crucible. Distilled water was added according to predetermined moisture content levels (0%, 20%, 30%, and 40%). The crucibles were then placed in the muffle furnace, which was programmed to heat at 10 °C/min to target torrefaction temperatures (220 °C, 240 °C, 260 °C, 280 °C, and 300 °C) and maintained for 30 or 60 min. After reaction completion, the heating was stopped and the furnace was cooled to 22 °C with air circulation. The semicarbonized solid products—hereafter generally referred to as CSBC—were collected and weighed to calculate their mass yields. For characterization, the pretreated samples were labeled as CSBC-0%-220-60, CSBC-0%-240-60, CSBC-0%-260-60, CSBC-0%-280-60, and CSBC-0%-300-60, where CSBC-0%-220-60 represents the solid product obtained from corn stover with 0% moisture content treated at 220 °C for 60 min, with other samples named accordingly. All experiments were conducted in triplicate. The mass and energy yields of the solid products were calculated using Equations (1) and (2), respectively.
M a s s   y i e l d   ( % ) = [ M a s s   o f   t o r r e f i e d   s o l i d   p r o d u c t   ( g ) / M a s s   o f   r a w   m a t e r i a l   ( g ) ] × 100 %
Energy   Enhancement   Factor :         λ HHV =   HHV T / HHV 0 .
where λHHV denotes the energy enhancement factor, HHVT denotes the higher heating value of biochar (MJ/kg), and HHV0 denotes the higher heating value of raw biomass (MJ/kg).
(2)
Direct co-torrefaction pretreatment of corn stover with magnesite
Based on the optimal conditions (30% moisture content, 300 °C, and 60 min) identified in the pretreatment experiment (1), a subsequent experiment (2) was conducted. Corn stover powder was uniformly mixed with magnesite at a mass ratio of 5:6 and then placed in quartz crucibles for torrefaction in the muffle furnace. This experimental procedure was performed in triplicate. The resulting black solid products were designated as magnesite–BC (Mg-BC) composites.
(3)
Acid-assisted loading and torrefaction pretreatment of corn stover with Magnesite
Initially, magnesite powder (60 mesh) was calcined at 800 °C for 3 h in a tubular furnace, yielding a product containing >90% MgO. Subsequently, 27 mL of a hydrochloric acid (HCl) solution (37%) and 67 mL of deionized water were added to a three-neck flask maintained at 50 °C in a thermostatic water bath. Excess calcined magnesite powder (5 g, containing 4.5 g of MgO) was gradually introduced into the HCl solution, followed by the addition of 6 g of corn stover (MgO:biomass ratio = 0.75:1). The mixture was stirred at 50 °C for 2 h, aged at room temperature for 2 h, and then filtered to obtain a tan solid mixture. This intermediate product was semi-carbonized at 300 °C with 30% moisture content for 60 min in a muffle furnace. The final solid product prepared by impregnation was designated as magnesite-loaded corn BC (MgO-BC).

2.3. Analytical and Characterization Methods

2.3.1. Yield of Torrefied Corn Stover Biochar (CSBC)

The yield of semicarbonized CSBC is calculated as follows:
η ( % ) = m 1 m 0 × 100 %
where m0 denotes the initial mass (g) of CS and m1 denotes the mass (g) of CSBC after torrefaction.

2.3.2. Phenol Adsorption Experiments

(1)
Phenol measurement method
The concentration of phenol was quantified using a standard colorimetric method. Briefly, the supernatant obtained after adsorption and centrifugation was reacted with 4-aminoantipyrine and potassium ferricyanide in an alkaline medium to form an orange-red complex. The absorbance of this complex was measured at a wavelength of 510 nm using a UV-Vis (Model 723PCS, Shanghai Xinmao Instrument Co., Ltd., Shanghai, China). spectrophotometer. The concentration was calculated from a calibration curve prepared with standard phenol solutions.
(2)
Phenol removal efficiency
The phenol removal efficiency is calculated as follows:
RE   ( % )   =   C 0 C e C 0 × 100 % ,
where C0 denotes the initial phenol concentration (mg/L) and Ce denotes the equilibrium phenol concentration (mg/L).
(3)
Equilibrium adsorption capacity
The equilibrium adsorption capacity (qe) is calculated as follows:
q e = C 0 C e m V ,
where C0 denotes the initial phenol concentration (mg/L), Ce denotes the equilibrium phenol concentration (mg/L), qe denotes the adsorption capacity, m denotes the mass of CSBC (g), and V represents the phenol solution volume (L).

2.3.3. SEM and Energy Spectrum Analysis

The morphological characteristics of the biochar samples were investigated using scanning electron microscopy (SEM, Model [Regulus810, Hitachi, Japan]). Prior to observation, the powdered samples were mounted on an aluminum stub using conductive carbon tape and were subsequently sputter-coated with a thin layer of platinum (coating time: 90 s) to enhance surface conductivity. SEM images were captured at an accelerating voltage of 15 kV and a working distance of 10 mm. Energy-dispersive X-ray spectroscopy (EDS) was used for ultimate composition analysis, with a focus on the distribution of carbon (C) and oxygen (O).

2.3.4. Determination of Calorific Value

The calorific value of the biochar samples was determined using an oxygen bomb calorimeter (Model 5E-AC/PL, Changsha Kaiyuan Instruments Co., Ltd., Changsha, China). This study was conducted in accordance with national standards such as GB/T 21923-2008 “General Rules for Inspection of Solid Biomass Fuels,” ([31]), GB/T 28731-2012 “proximate Analysis Methods for Solid Biomass Fuels,” ([32]), and GB/T 30727-2014 “Determination Methods for Calorific Value of Solid Biomass Fuels.” ([33]).

2.3.5. FTIR Analysis

The surface functional groups of the biochar samples were characterized using a WQF-510A Fourier transform infrared (FTIR) spectrometer. The analysis was performed employing the potassium bromide (KBr) pellet technique. Approximately 1.5 mg of the dried sample was thoroughly mixed with 150 mg of spectroscopic-grade KBr and pressed into a transparent pellet under a pressure of 10 MPa for 2 min. FTIR spectra were recorded in the wavelength range of 4000 to 400 cm−1 with a resolution of 4 cm−1. Each spectrum was recorded using an average of 32 scans to enhance the signal-to-noise ratio, and a background spectrum of a pure KBr pellet was subtracted prior to each measurement.

2.3.6. BET Surface Area Analysis

The specific surface area, pore volume, and pore size distribution of the biochar samples were determined using nitrogen adsorption-desorption isotherms measured at 77 K with an ASAP 2460 3.01 surface area analyzer (Micromeritics, Norcross, GA, USA). Prior to analysis, approximately 0.1 g of each sample was degassed under vacuum at 150 °C for 6 h to remove moisture and adsorbed contaminants. The Brunauer–Emmett–Teller (BET) method was applied to calculate the specific surface area from the adsorption data in the relative pressure (P/P0) range of 0.05–0.30. The total pore volume was estimated from the amount of nitrogen adsorbed at a relative pressure of 0.99, while the pore size distribution was derived from the adsorption branch of the isotherm using the Barrett–Joyner–Halenda (BJH) model. All measurements were performed in triplicate to ensure reproducibility, with a standard deviation of less than 3% for surface area values.

2.3.7. X-Ray Diffraction

The Dutch Panalytical Aeris benchtop X-ray diffraction (XRD) system was used, equipped with a Co Kα radiation source (wavelength λ = 1.78901 A, excitation voltage = 45 kV, operating current = 40 mA), and a wide-angle diffraction geometry configuration was selected to evaluate information such as crystal phase types, grain sizes, and structural defects in materials. The scanning parameters were set as follows: a detection range of 2 θ = 5–85°, a scanning rate of 10 °/min, and a total test duration of 12 min.

2.3.8. Raman Analysis

The graphitic structure and disorder degree of the carbon materials were investigated using Raman spectroscopy. Spectra were acquired with a Renishaw inVia Reflex spectrometer (Renishaw, Gloucestershire, UK) equipped with a 532 nm laser as the excitation source. The laser power at the sample surface was carefully adjusted to 2 mW to avoid thermal decomposition of the material. The scattered light was collected through a 50× objective lens and dispersed by a 1800 grooves/mm grating onto a CCD detector. The spectra were recorded in the range of 800 to 2000 cm−1 with an accumulation time of 20 s per scan, and each final spectrum was the result of 3 repeated accumulations to improve the signal-to-noise ratio. Prior to measurement, the spectrometer was calibrated using the characteristic Raman peak of a silicon wafer at 520 cm−1.

2.4. Flowchart

Based on the research methodology and procedures described above, a comprehensive flowchart summarizing the experimental workflow of this study is presented in Figure 1.

3. Results and Discussion

3.1. Steam-Assisted Torrefaction of Corn Stalk

3.1.1. Influence of Torrefaction Conditions on Phenol Adsorption Performance of CSBC

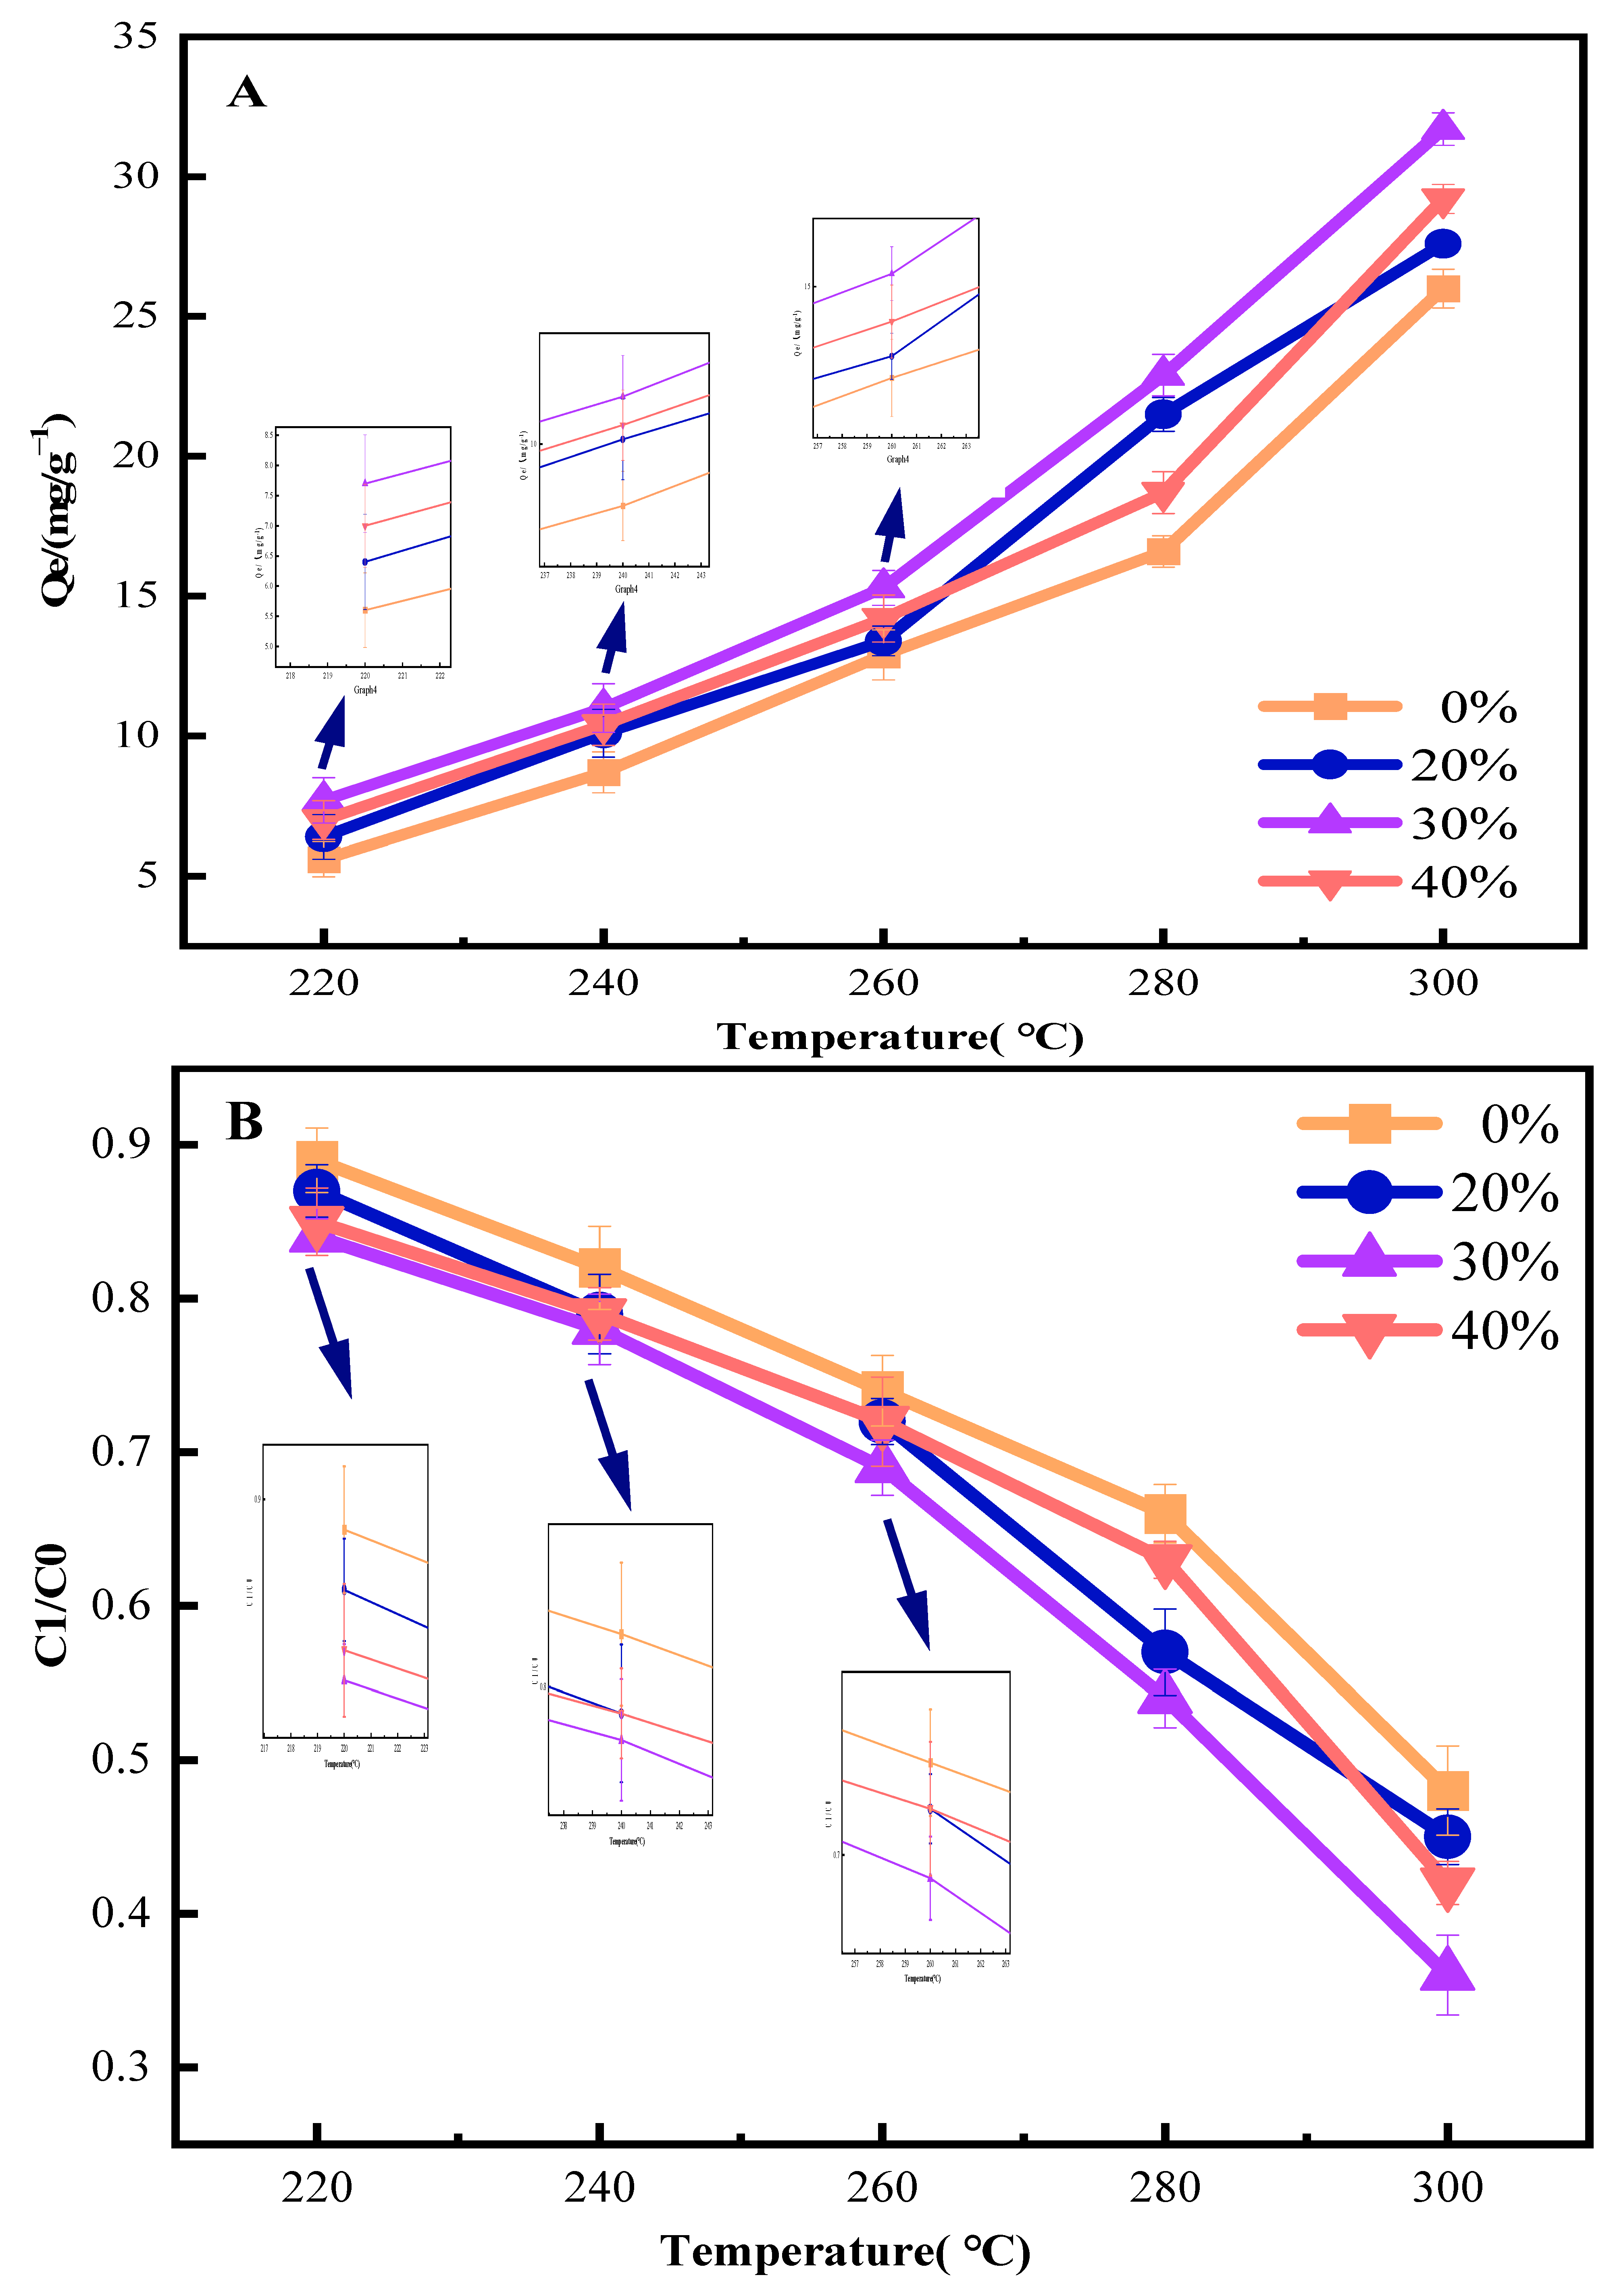
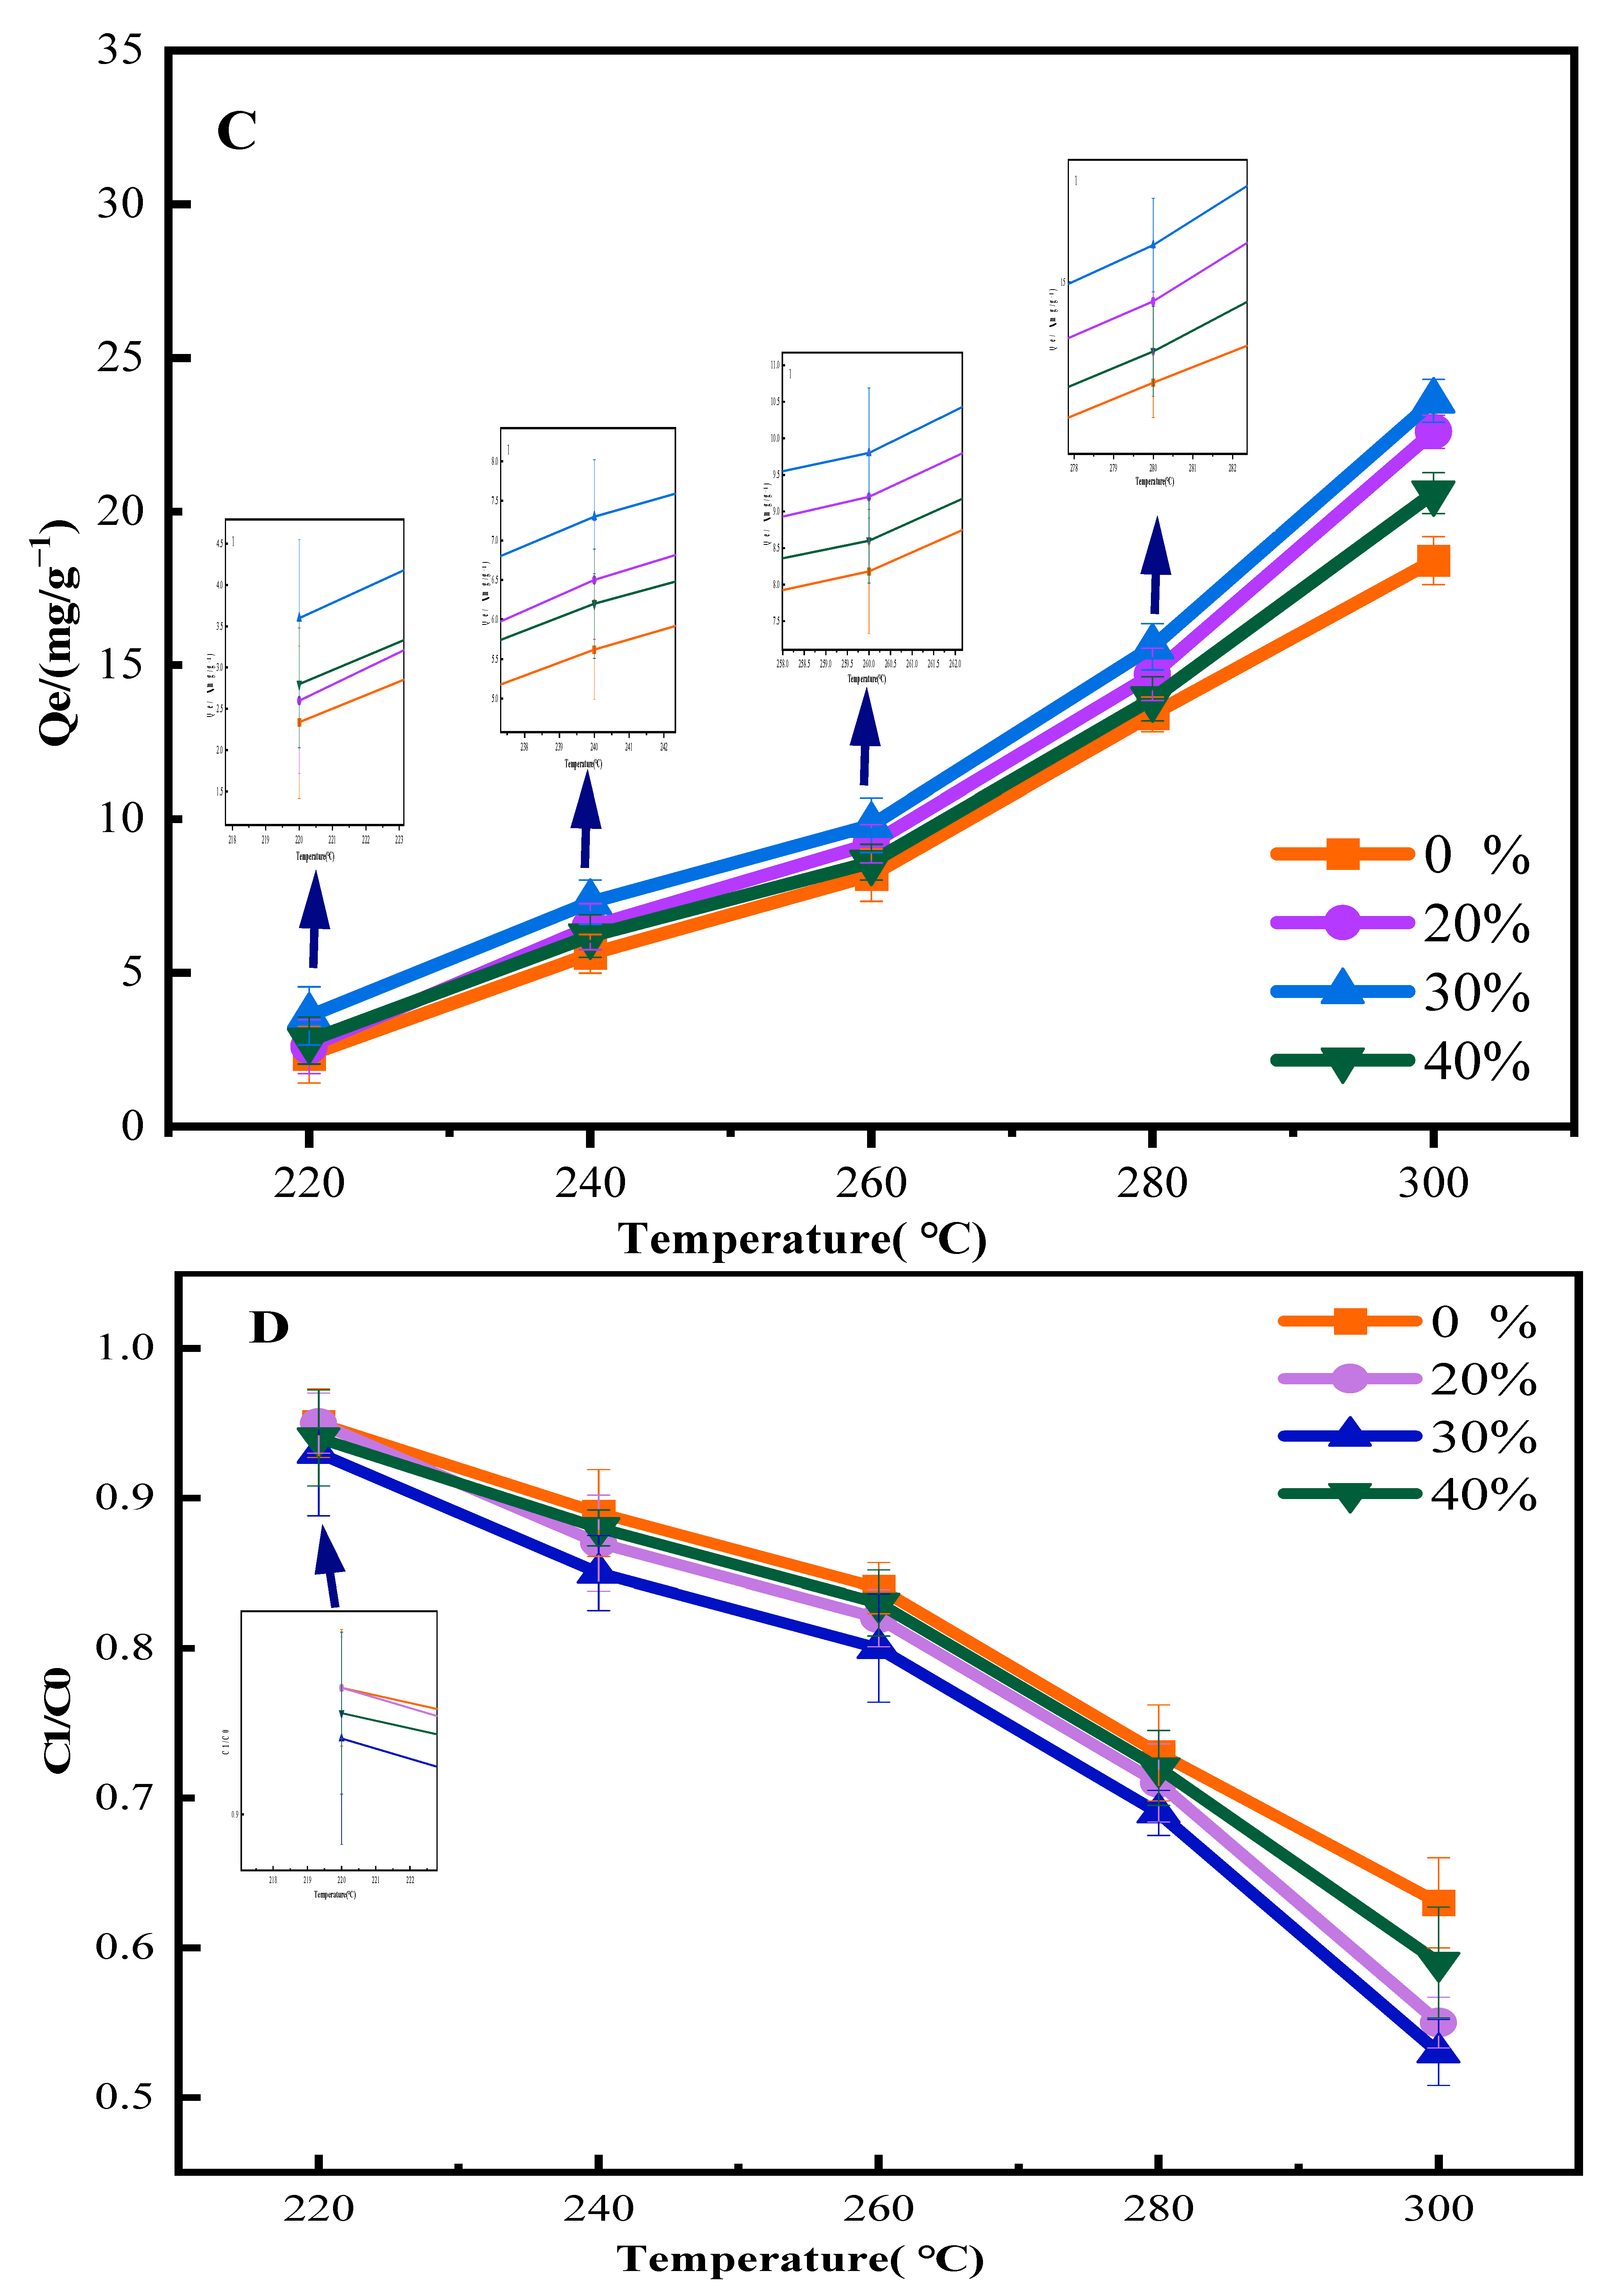
The adsorption of organic pollutants onto BC primarily occurs through intermolecular interactions, such as π–π interactions, hydrogen bonding, hydrophobic interactions, and electrostatic interactions. Studies indicate that hydrogen bonding plays a crucial role in sulfamethoxazole adsorption by Fe-modified BC, as evidenced by an appreciable reduction in oxygen-containing functional groups after adsorption [34]. Herein, Equations (4) and (5) were used to analyze phenol adsorption performance by CSBC. Figure 2A,B presents the phenol adsorption performance of CSBC under different temperatures and moisture contents with a 60 min torrefaction duration. The results show that adsorption performance improved with increasing temperature, reaching an optimum at 300 °C with 30% moisture content. Figure 2C,D displays the corresponding results for 30 min torrefaction. Although adsorption performance also improved with increasing temperature under these conditions—again peaking at 300 °C with 30% moisture content—the overall adsorption efficiency was considerably lower than that of the 60 min treatment. This discrepancy is primarily attributed to the synergistic enhancement of CSBC’s physicochemical properties through prolonged torrefaction duration and elevated temperature. Specifically, the extended duration and increased temperature enhanced the alkalinity of BC’s surface functional groups, improved its hydrophobicity, and optimized pore structure, which collectively provided more phenol adsorption sites and a greater number of micropores [35]. Simultaneously, partial volatile impurities and oxygen-containing functional groups (e.g., carboxyl and hydroxyl) were removed during pyrolysis, reducing their hindrance to phenol adsorption in micropores [36]. Residual hydrophilic oxygen-containing groups on the BC surface could otherwise interact with water molecules, competing with hydrophobic phenol molecules for adsorption sites and thereby diminishing phenol adsorption affinity [37,38]. In conclusion, CSBC produced through 60 min torrefaction exhibited substantially better phenol adsorption performance than that produced in 30 min. Therefore, subsequent performance analyses were conducted using CSBC prepared via 60 min torrefaction pretreatment.

3.1.2. Proximate and Ultimate Analyses of CSBC Under Different Torrefaction Treatment Conditions

(1)
Ultimate analysis of CSBC
The results of EDS ultimate analysis combined with the calculation using the difference method (mass fraction of oxygen: O (%) = 100% − [C(%) + H(%) + N(%) + S(%) + Ash(%)) in Table 1. indicate that torrefaction pretreatment at different temperatures significantly influences the ultimate composition of corn stover-based biochar (CSBC) produced from corn stover (CS) with a moisture content of 30%. As the treatment temperature increased, the O and H contents decreased while the C content showed a gradual increase. Meanwhile, the molar ratios of H/C and O/C in the torrefied solid products gradually decreased, mainly due to the increasingly intense decarboxylation and dehydration reactions occurring in corn stover with the increase of torrefaction temperature, which removed a large portion of oxygen and moisture from the corn stover [39]. Furthermore, during the torrefaction process at 200–300 °C, a portion of the nitrogen and sulfur ultimates in the biomass is volatilized and released with the volatiles, leading to a decrease in their absolute content in the solid product. Specifically, nitrogen is primarily released in the form of NH3 and HCN, while sulfur is volatilized as sulfur-containing gases such as H2S [40].
(2)
Proximate analyses of CSBC
The proximate analysis of the raw corn stover and the prepared biochars was performed according to the standardized ASTM procedures to determine the contents of moisture, volatile matter, fixed carbon, and ash.
Moisture Content: The moisture content was determined by measuring the weight loss after drying the sample at 105 °C for 24 h in an oven until a constant weight was achieved, following the principle of ASTM D3173. Volatile Matter: The volatile matter content was measured by heating the dried sample in a covered crucible at 900 °C for 7 min in a muffle furnace, as per ASTM D3175. Ash Content: The ash content was obtained by combusting the sample in an open crucible at 750 °C for 6 h in the muffle furnace until constant weight, according to ASTM D3174. Fixed Carbon: The fixed carbon content was calculated by difference using the following equation:
Fixed Carbon (%) = 100% − Moisture (%) − Volatile Matter (%) − Ash (%)
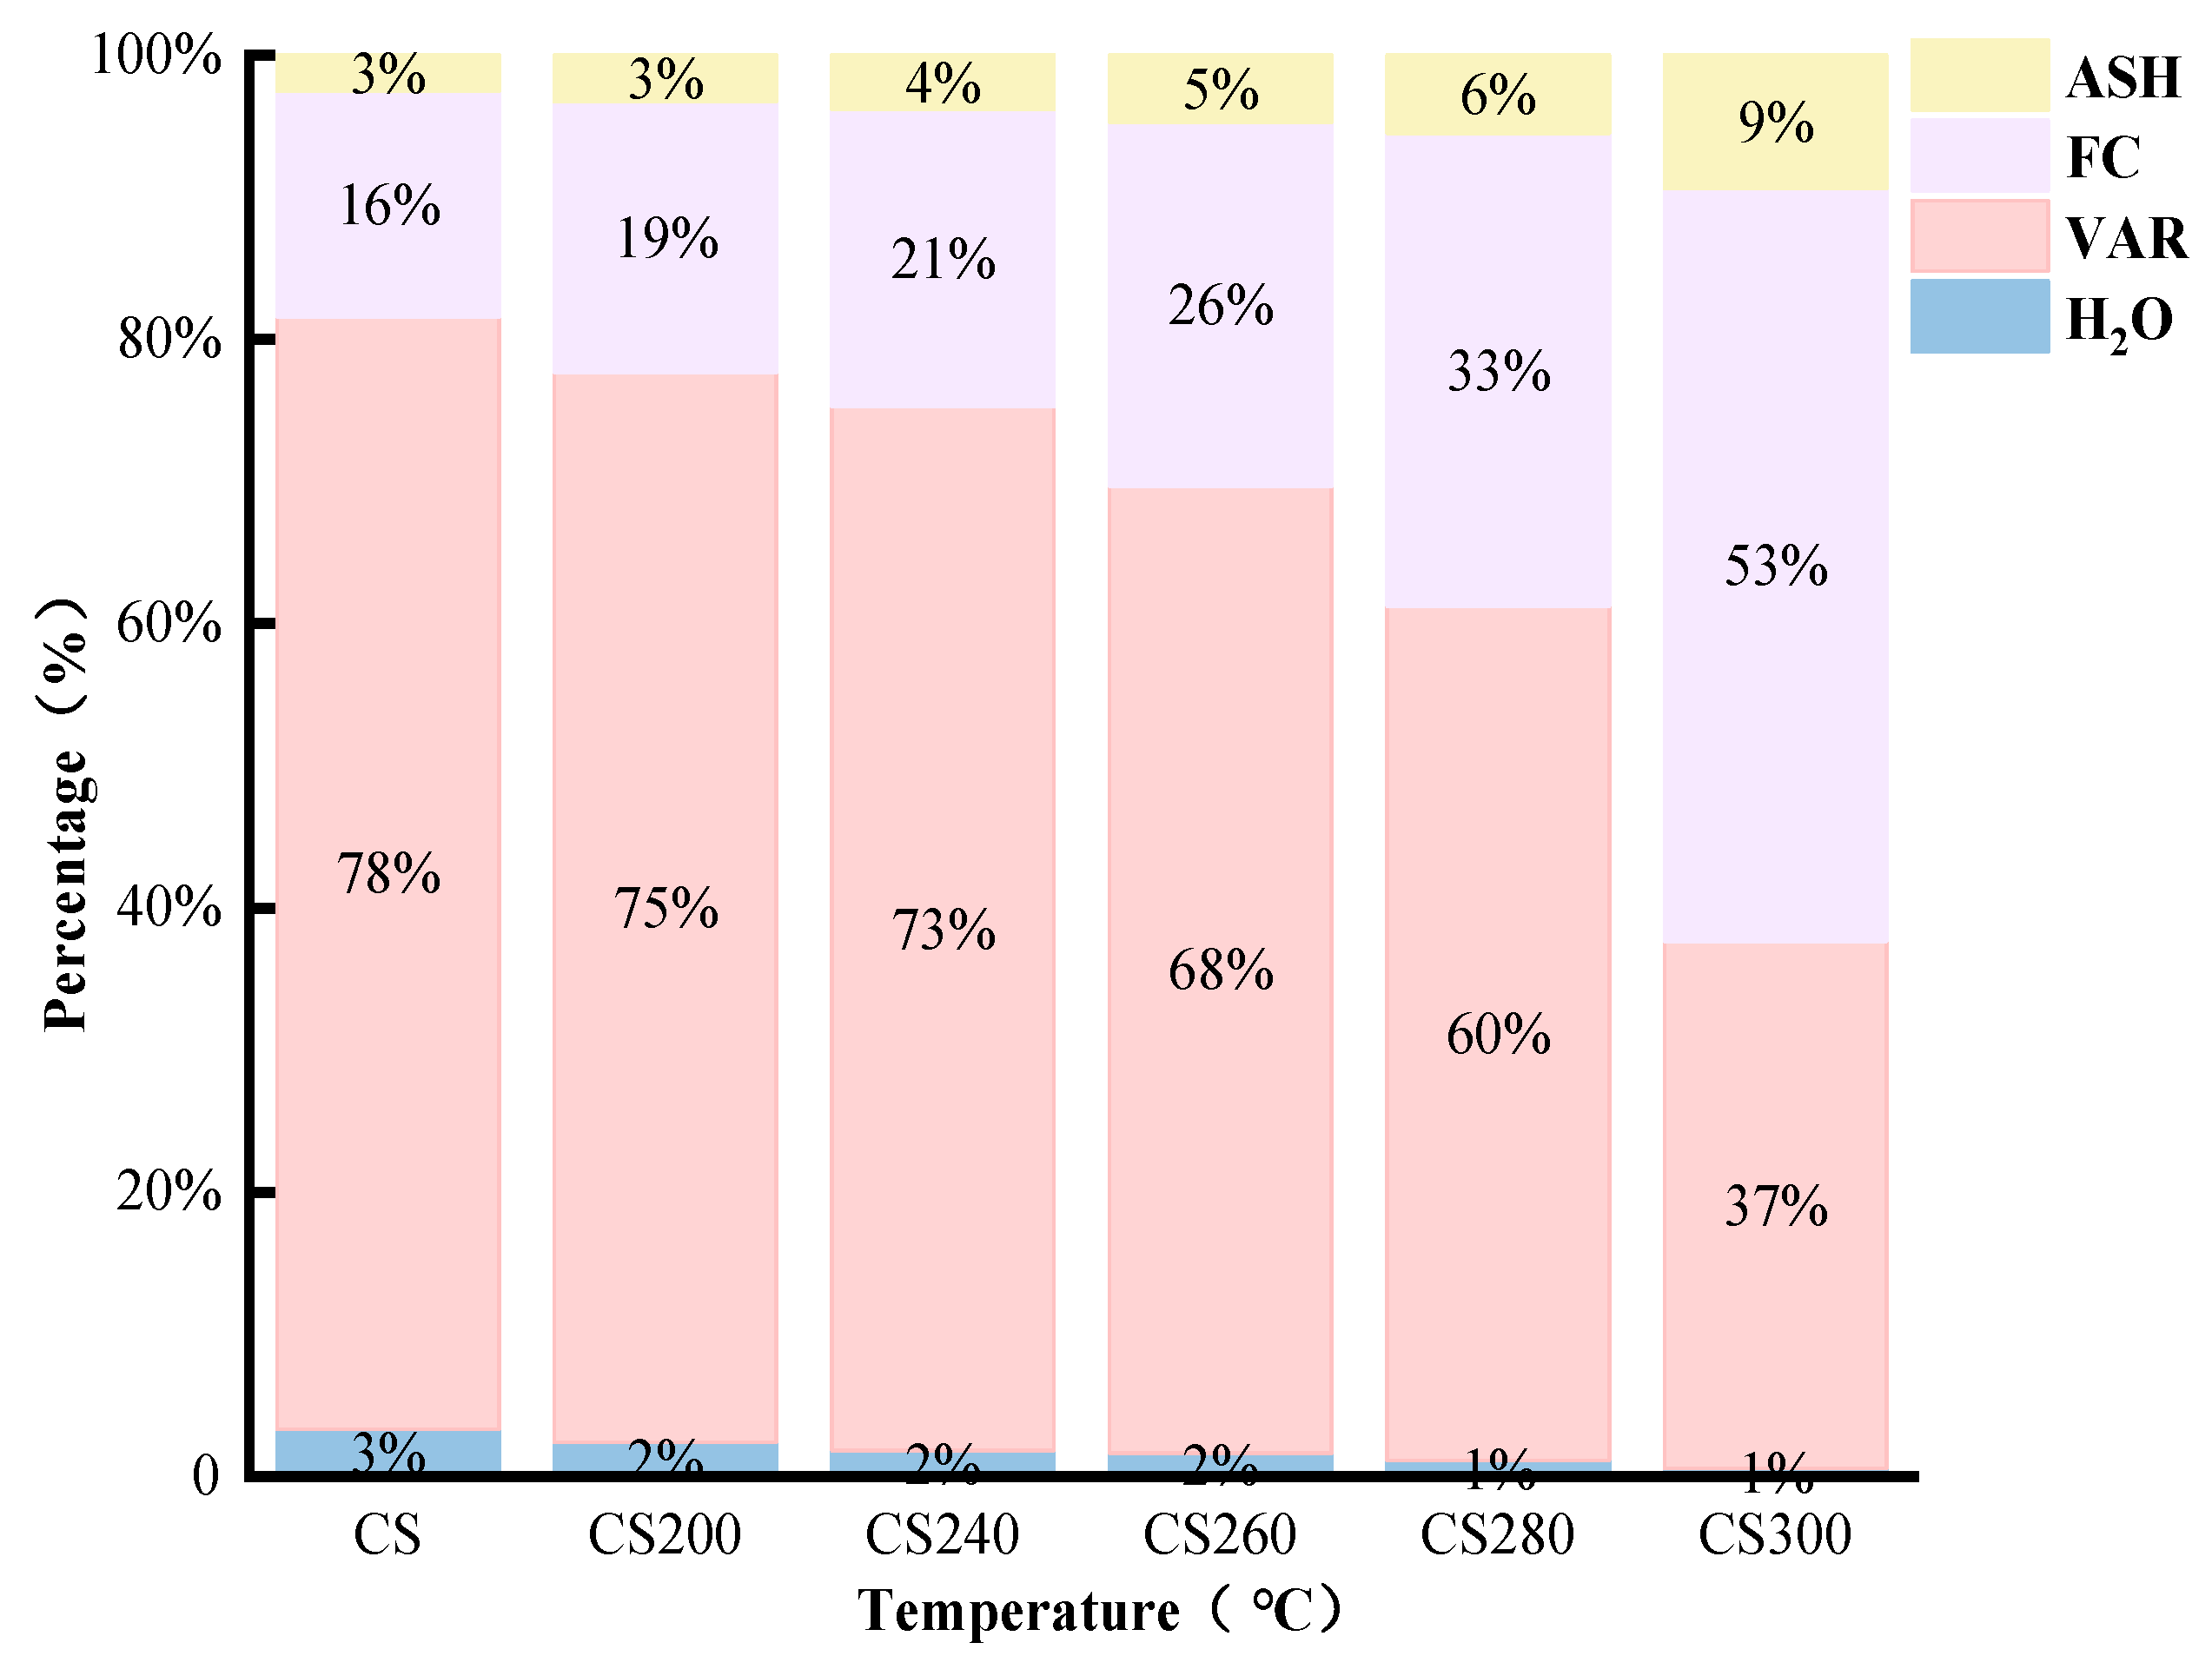
As shown in Figure 3, with the increase in torrefaction pretreatment temperature, the data exhibit an obvious pattern: the contents of volatile matter and moisture decrease from 78.25% and 3.35% to 37.1% and 0.58%, respectively. This mass loss process is accompanied by the enrichment of ash (increasing from 2.54% to 9.38%) and a significant increase in fixed carbon content (rising from 15.86% to 52.94%). The aforementioned changes are typical characteristics of the progressive thermal decomposition of hemicellulose, cellulose, and lignin. After the selective volatilization of organic components, inorganic ash remains and is enriched in the solid product; meanwhile, the degradation of lignin promotes carbonization, which in turn leads to the formation of a stable carbonaceous matrix. This process is ultimately reflected in the increase in fixed carbon yield.

3.1.3. Influence of Torrefaction Treatment Conditions on the Energy Enhancement Coefficient of CSBC

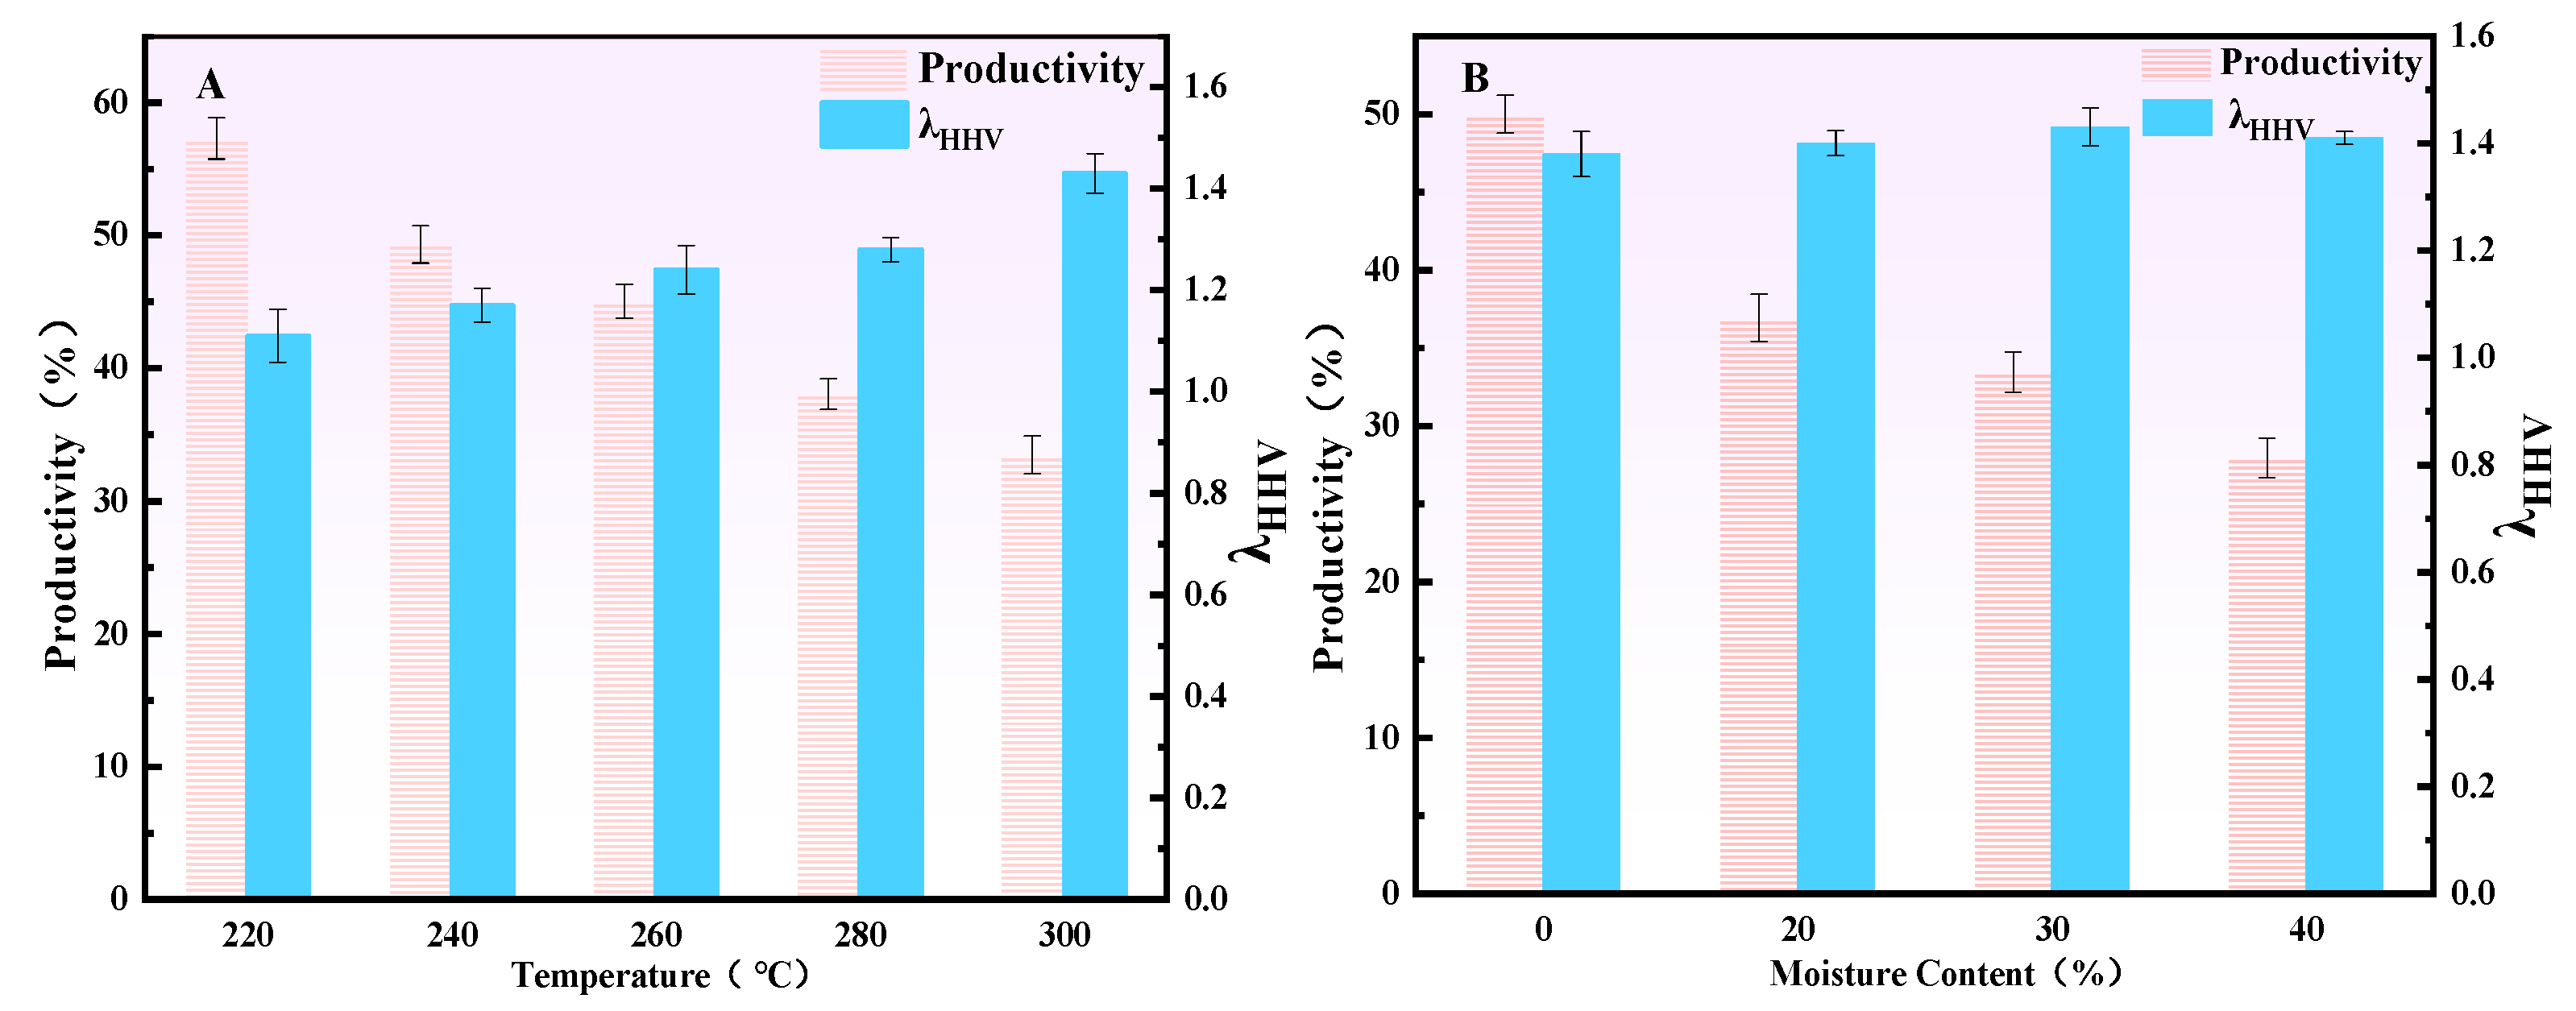
The energy enhancement factor (λHHV) is defined as the ratio of the higher heating value (HHVT, MJ/kg) of hydrochar to that of the raw material (HHV0, MJ/kg) and is a key indicator for evaluating improvements in energy density [41]. A higher λHHV value indicates greater enhancement of heating value and a stronger hydrothermal carbonization effect [42]. As shown in Figure 4, the hydrothermal carbonization process considerably increased the λHHV value of CSBC. In Figure 4A, under a fixed moisture content (30%), as the carbonization temperature increased, the CSBC yield gradually decreased, while λHHV steadily rose, reflecting an improvement in the thermal value of the product [43]. Between 280 °C and 300 °C, λHHV exhibited a substantial enhancement. This trend aligns with the ultimate analysis results (i.e., increased C content), demonstrating that higher temperatures promoted a greater degree of carbonization, thereby enhancing the energy density [44,45]. Figure 4B shows that at a fixed temperature (300 °C), the CSBC yield decreased as the initial moisture content increased. λHHV reached its peak at 30% moisture content. This optimum is attributed to the moderate amount of steam (30%) acting as a mild oxidant at high temperature, selectively cleaving O-containing functional groups (e.g., carboxyl and carbonyl) and promoting the release of CO2 and H2O, thereby improving the heating value of the product [46,47]. However, when the moisture content was too high (e.g., 40%), the excessive steam could not be discharged efficiently and absorbed a large amount of vaporization latent heat, leading to reduced thermal efficiency and a lower heating value. In addition, the hydrochar yield at 40% moisture was markedly lower than under dry conditions, primarily due to the additional energy required for water evaporation, which reduced the effective carbonization efficiency. Besides the effects of moisture, the increased ash content in the char at higher carbonization temperatures also contributed to the overall decline in solid yield.

3.1.4. FTIR Analysis of CSBC Under Different Hydrothermal Carbonization Conditions

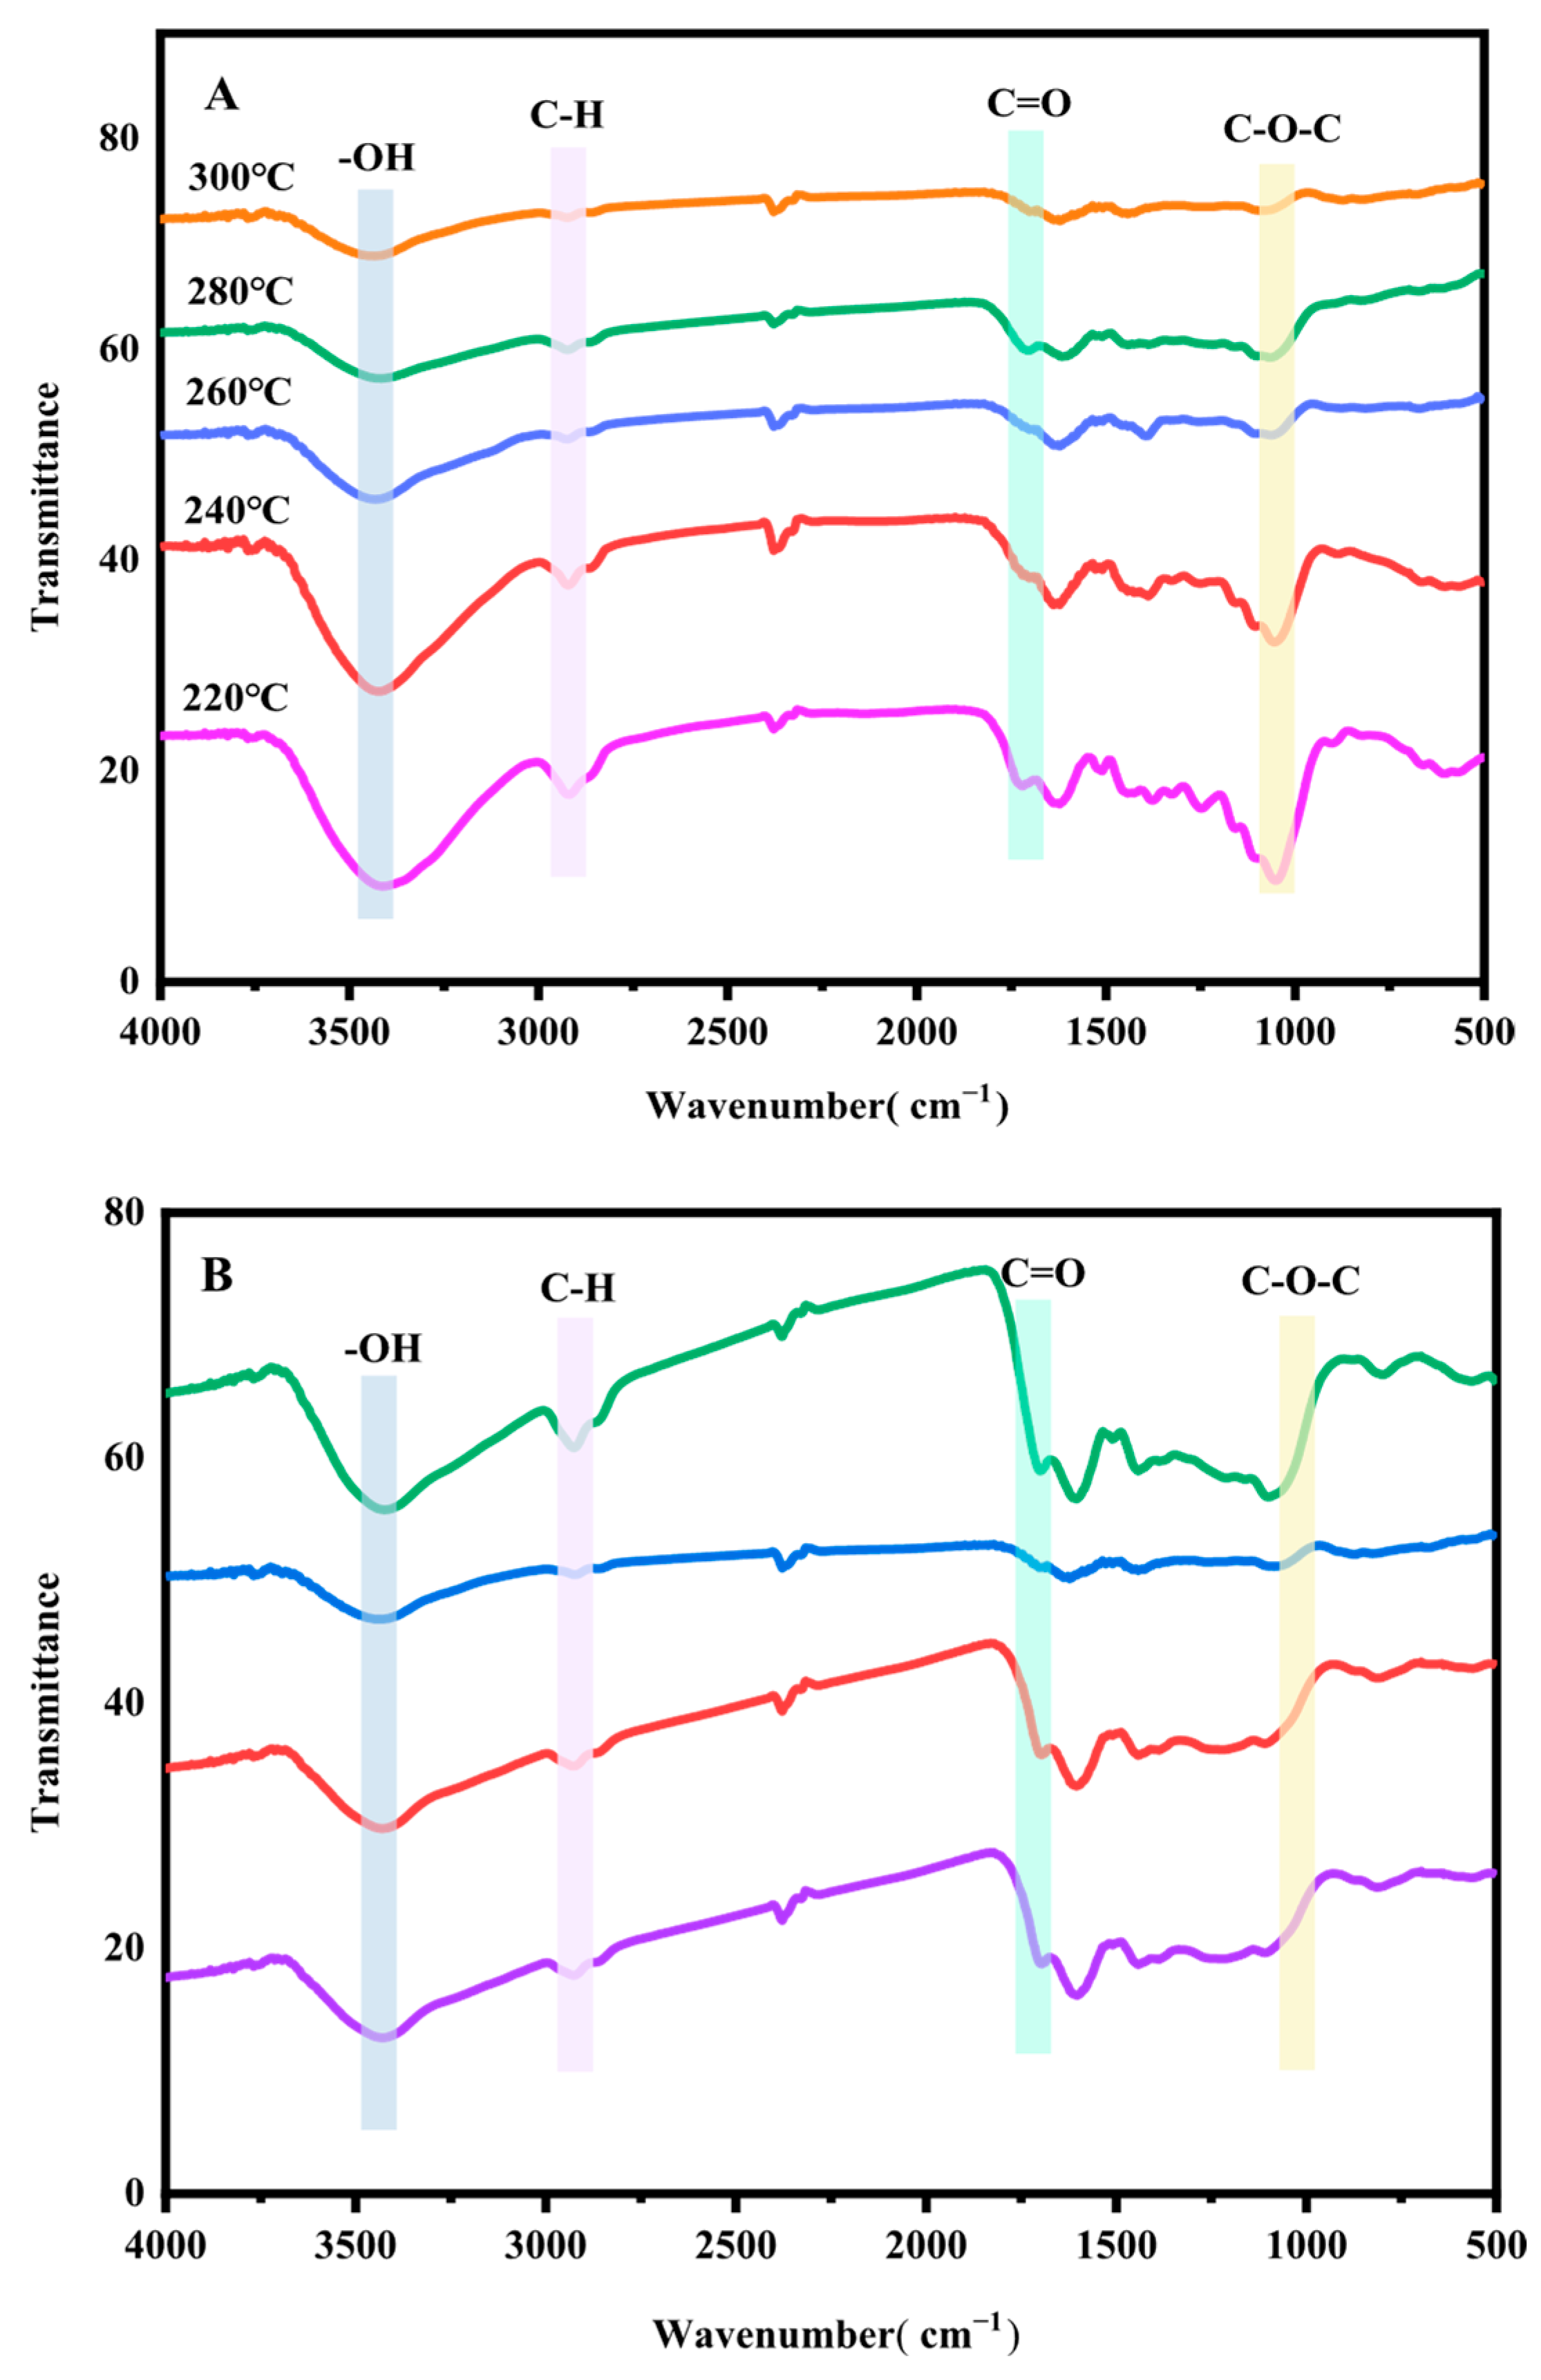
This study systematically analyzed the evolution of functional groups in CSBC under various hydrothermal carbonization conditions using FTIR spectroscopy. Under a steam atmosphere with fixed carbonization time (60 min), moisture content (30%), and particle size (12 mesh), the effects of hydrothermal carbonization temperature (220 °C, 240 °C, 260 °C, 280 °C, and 300 °C) on CSBC functional groups were investigated (Figure 5A). At the optimized temperature (300 °C), with identical carbonization time and particle size, the influence of varying moisture contents (0%, 20%, 30%, and 40%) on CSBC structure was further examined (Figure 5B).
As shown in Figure 5A, CSBC displays a range of functional groups, with notable variations in absorption peak positions and intensities across different temperatures. The broad absorption peak near 3400 cm−1 corresponds to the stretching vibration of hydroxyl (–OH) groups. As temperature increases, the intensity of this peak gradually weakens, indicating the removal of bound water and the breakdown of hydrogen-bonded –OH groups during dehydration. The symmetric C–H stretching vibration peak at ~2850 cm−1 persists across all temperatures but diminishes at elevated temperatures, confirming the progressive decomposition of aliphatic hydrocarbons. The intensity of the C=O stretching vibration at 1700 cm−1 exhibited a positive correlation with water content, as evidenced by its decrease with increasing temperature, which coincided with the reduction in both the water content and the intensity of the –OH stretching bands [48]. The C–O–C stretching vibration in the range of 1170–1160 cm−1, associated with ether bond cleavage and degradation of polar components, is prominent at lower temperatures but markedly decreases at higher temperatures. This suggests decomposition of ether compounds and a reduction in polar constituents such as cellulose in CSBC [49]. These spectral changes confirm that increasing hydrothermal carbonization temperature leads to the decomposition of –OH groups, aliphatic hydrocarbons, carbonyl groups, and ether bonds in CSBC, facilitating the formation of highly stable aromatic structures. In addition, samples with different moisture contents show systematic variations in characteristic peak intensities, highlighting the considerable influence of moisture in the hydrothermal carbonization process and in shaping the functional group composition. As illustrated in Figure 5B, high-moisture (40%) samples exhibit enhanced absorption peaks at 3400 cm−1 (–OH) and 1700 cm−1 (C=O stretching), indicating that water stabilizes hydroxyl and carbonyl groups (e.g., carboxylic acids, esters, and ketones) [50]. However, under the condition of 300 °C with 30% moisture content, the observed changes in the intensities of C=O functional groups indicate a more thorough decomposition process compared to other conditions. This enhanced decomposition can be attributed to a synergistic effect between water and functional groups, which consequently leads to the optimal phenol adsorption performance observed under this specific condition. FTIR spectral analysis thus enables a detailed understanding of the chemical characteristics of corn stover and its molecular changes during hydrothermal carbonization, providing essential insights for optimizing experimental conditions and advancing biomass conversion for agricultural applications.

3.1.5. SEM Analysis Based on Torrefaction Treatment

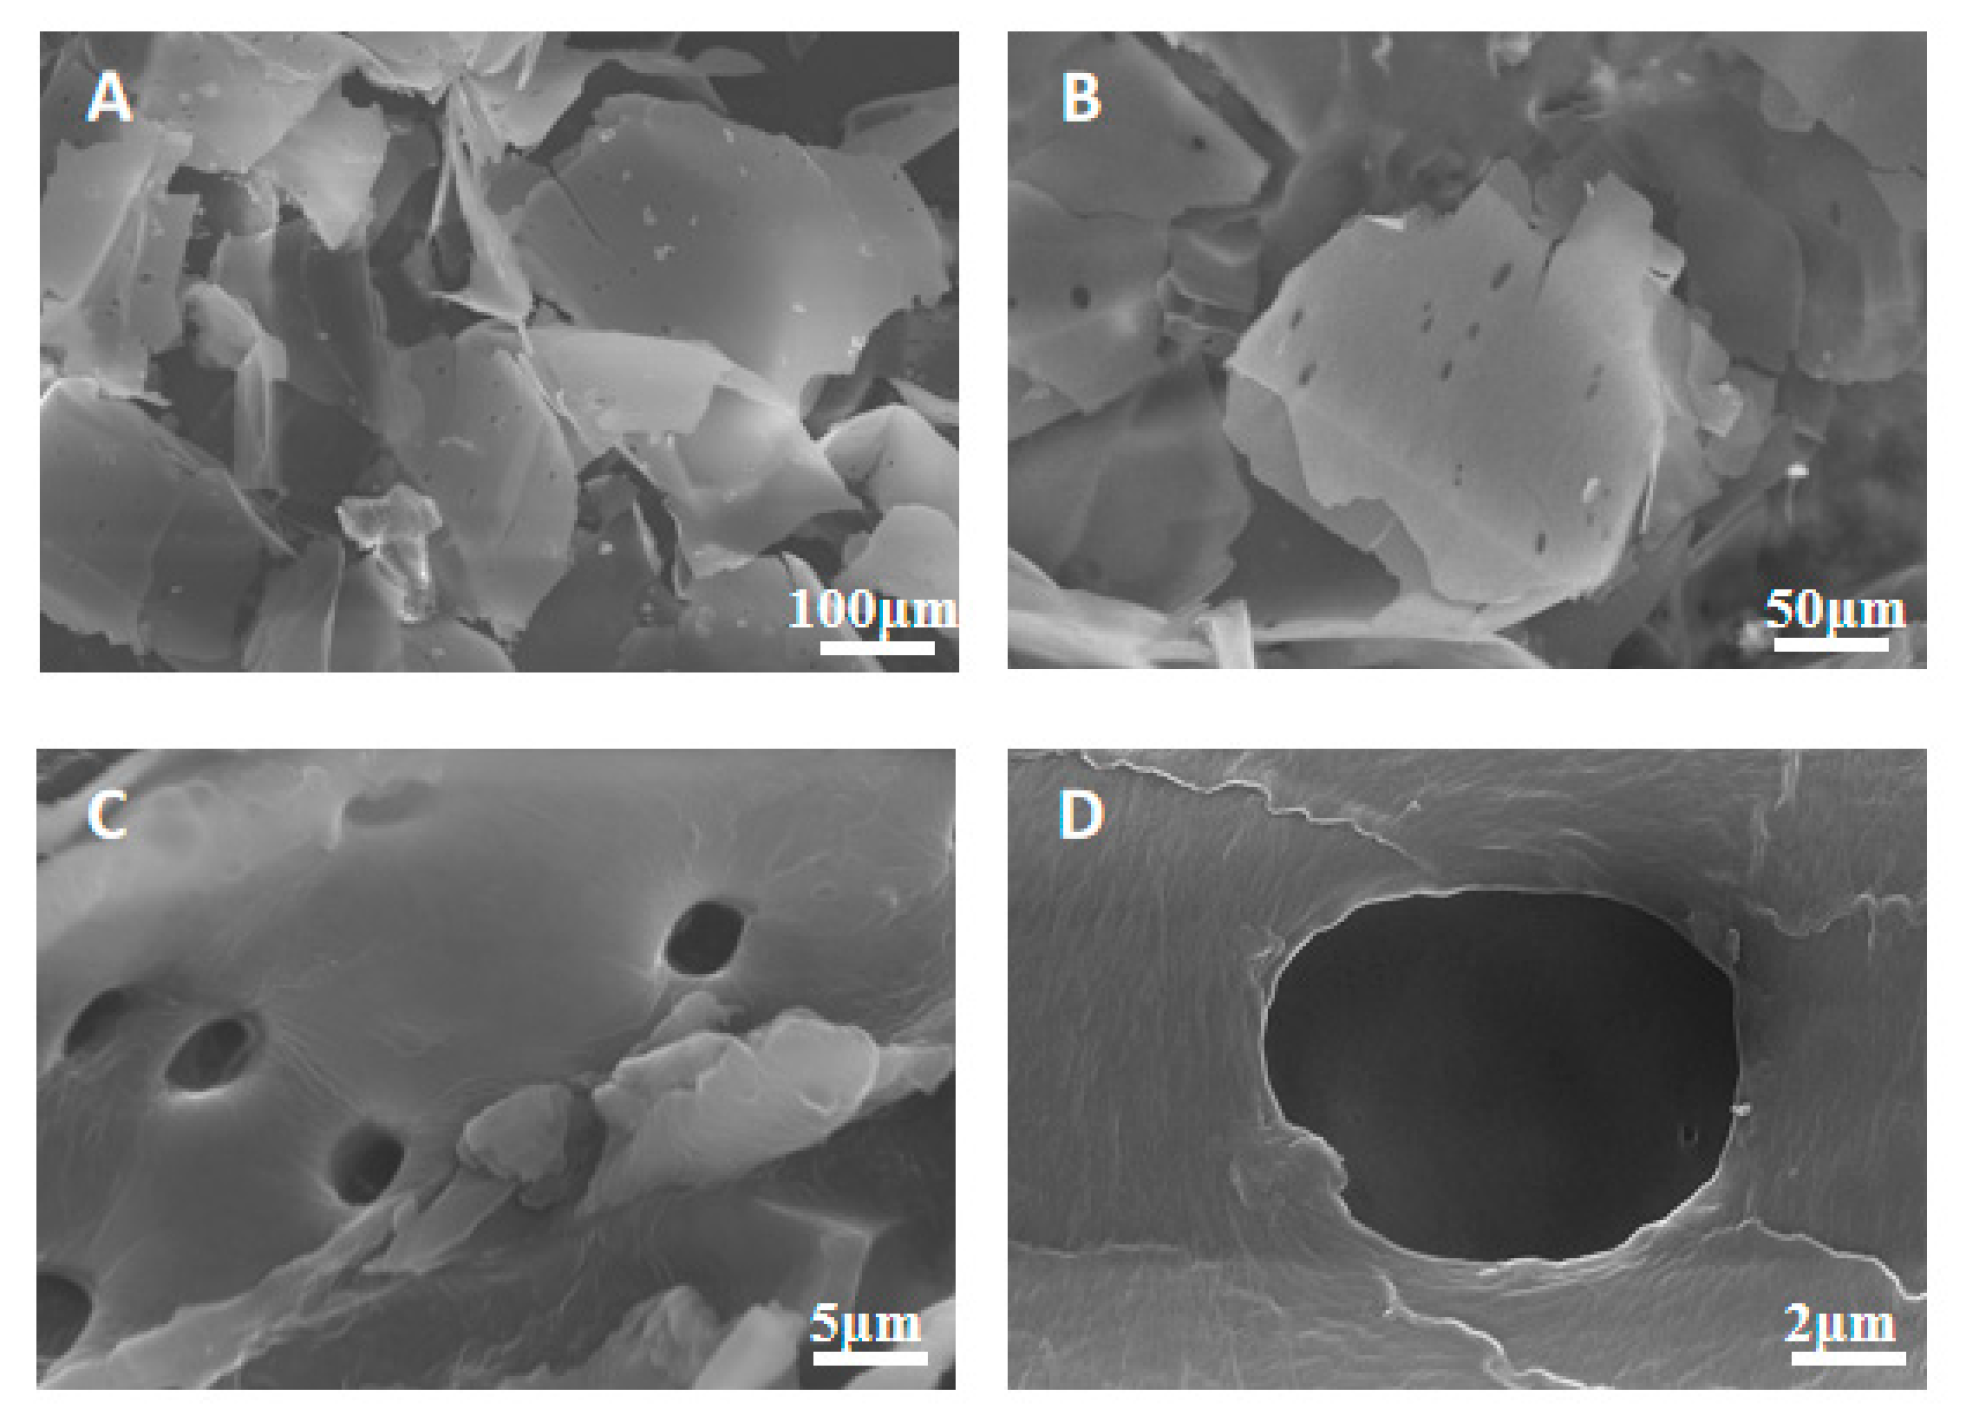
Figure 6 shows the morphological characteristics of CSBC prepared at 300 °C with 30% moisture content. Compared with other biomass feedstocks (e.g., wood chips and rice husks), CS inherently possesses fewer natural pore structures [51], which directly leads to the limited porosity of its derived BC—primarily displaying fragmented, flake-like structures (Figure 6A–D). The CSBC surface exhibits relatively rough, textured porous structures, suggesting the formation of micropores through cellulose and hemicellulose degradation during hydrothermal carbonization. As the carbonization temperature increases (220 °C–300 °C), the pore size distribution of CSBC changes substantially. Overall, pore enlargement occurs due to the release of volatiles and shrinkage of the carbon matrix [52]. However, under the specific condition of 300 °C with 30% moisture, the sample demonstrates a unique dominance of micropores and maximum pore volume. This is likely because 300 °C approaches the peak temperature range for cellulose pyrolysis (280 °C–350 °C), triggering directional fiber decomposition that forms dense micropores. At high temperatures, the collapse and merging of micropore walls result in structures dominated by mesopores (Figure 6C). At 30% moisture, hydrothermal synergy markedly modifies the physical structure of CSBC by enhancing structural disruption, markedly reducing density, and creating loosely packed configurations. Consequently, the sample prepared at 300 °C with 30% moisture exhibited optimal phenol adsorption (63.4%), primarily due to the presence of micropores providing abundant adsorption sites and the low-density porous structure facilitating pollutant uptake.

3.2. Steam-Assisted Torrefaction Pretreatment of Corn Stalks and Magnesite

3.2.1. Effect of Different Pretreatment Methods on Phenol Adsorption Performance

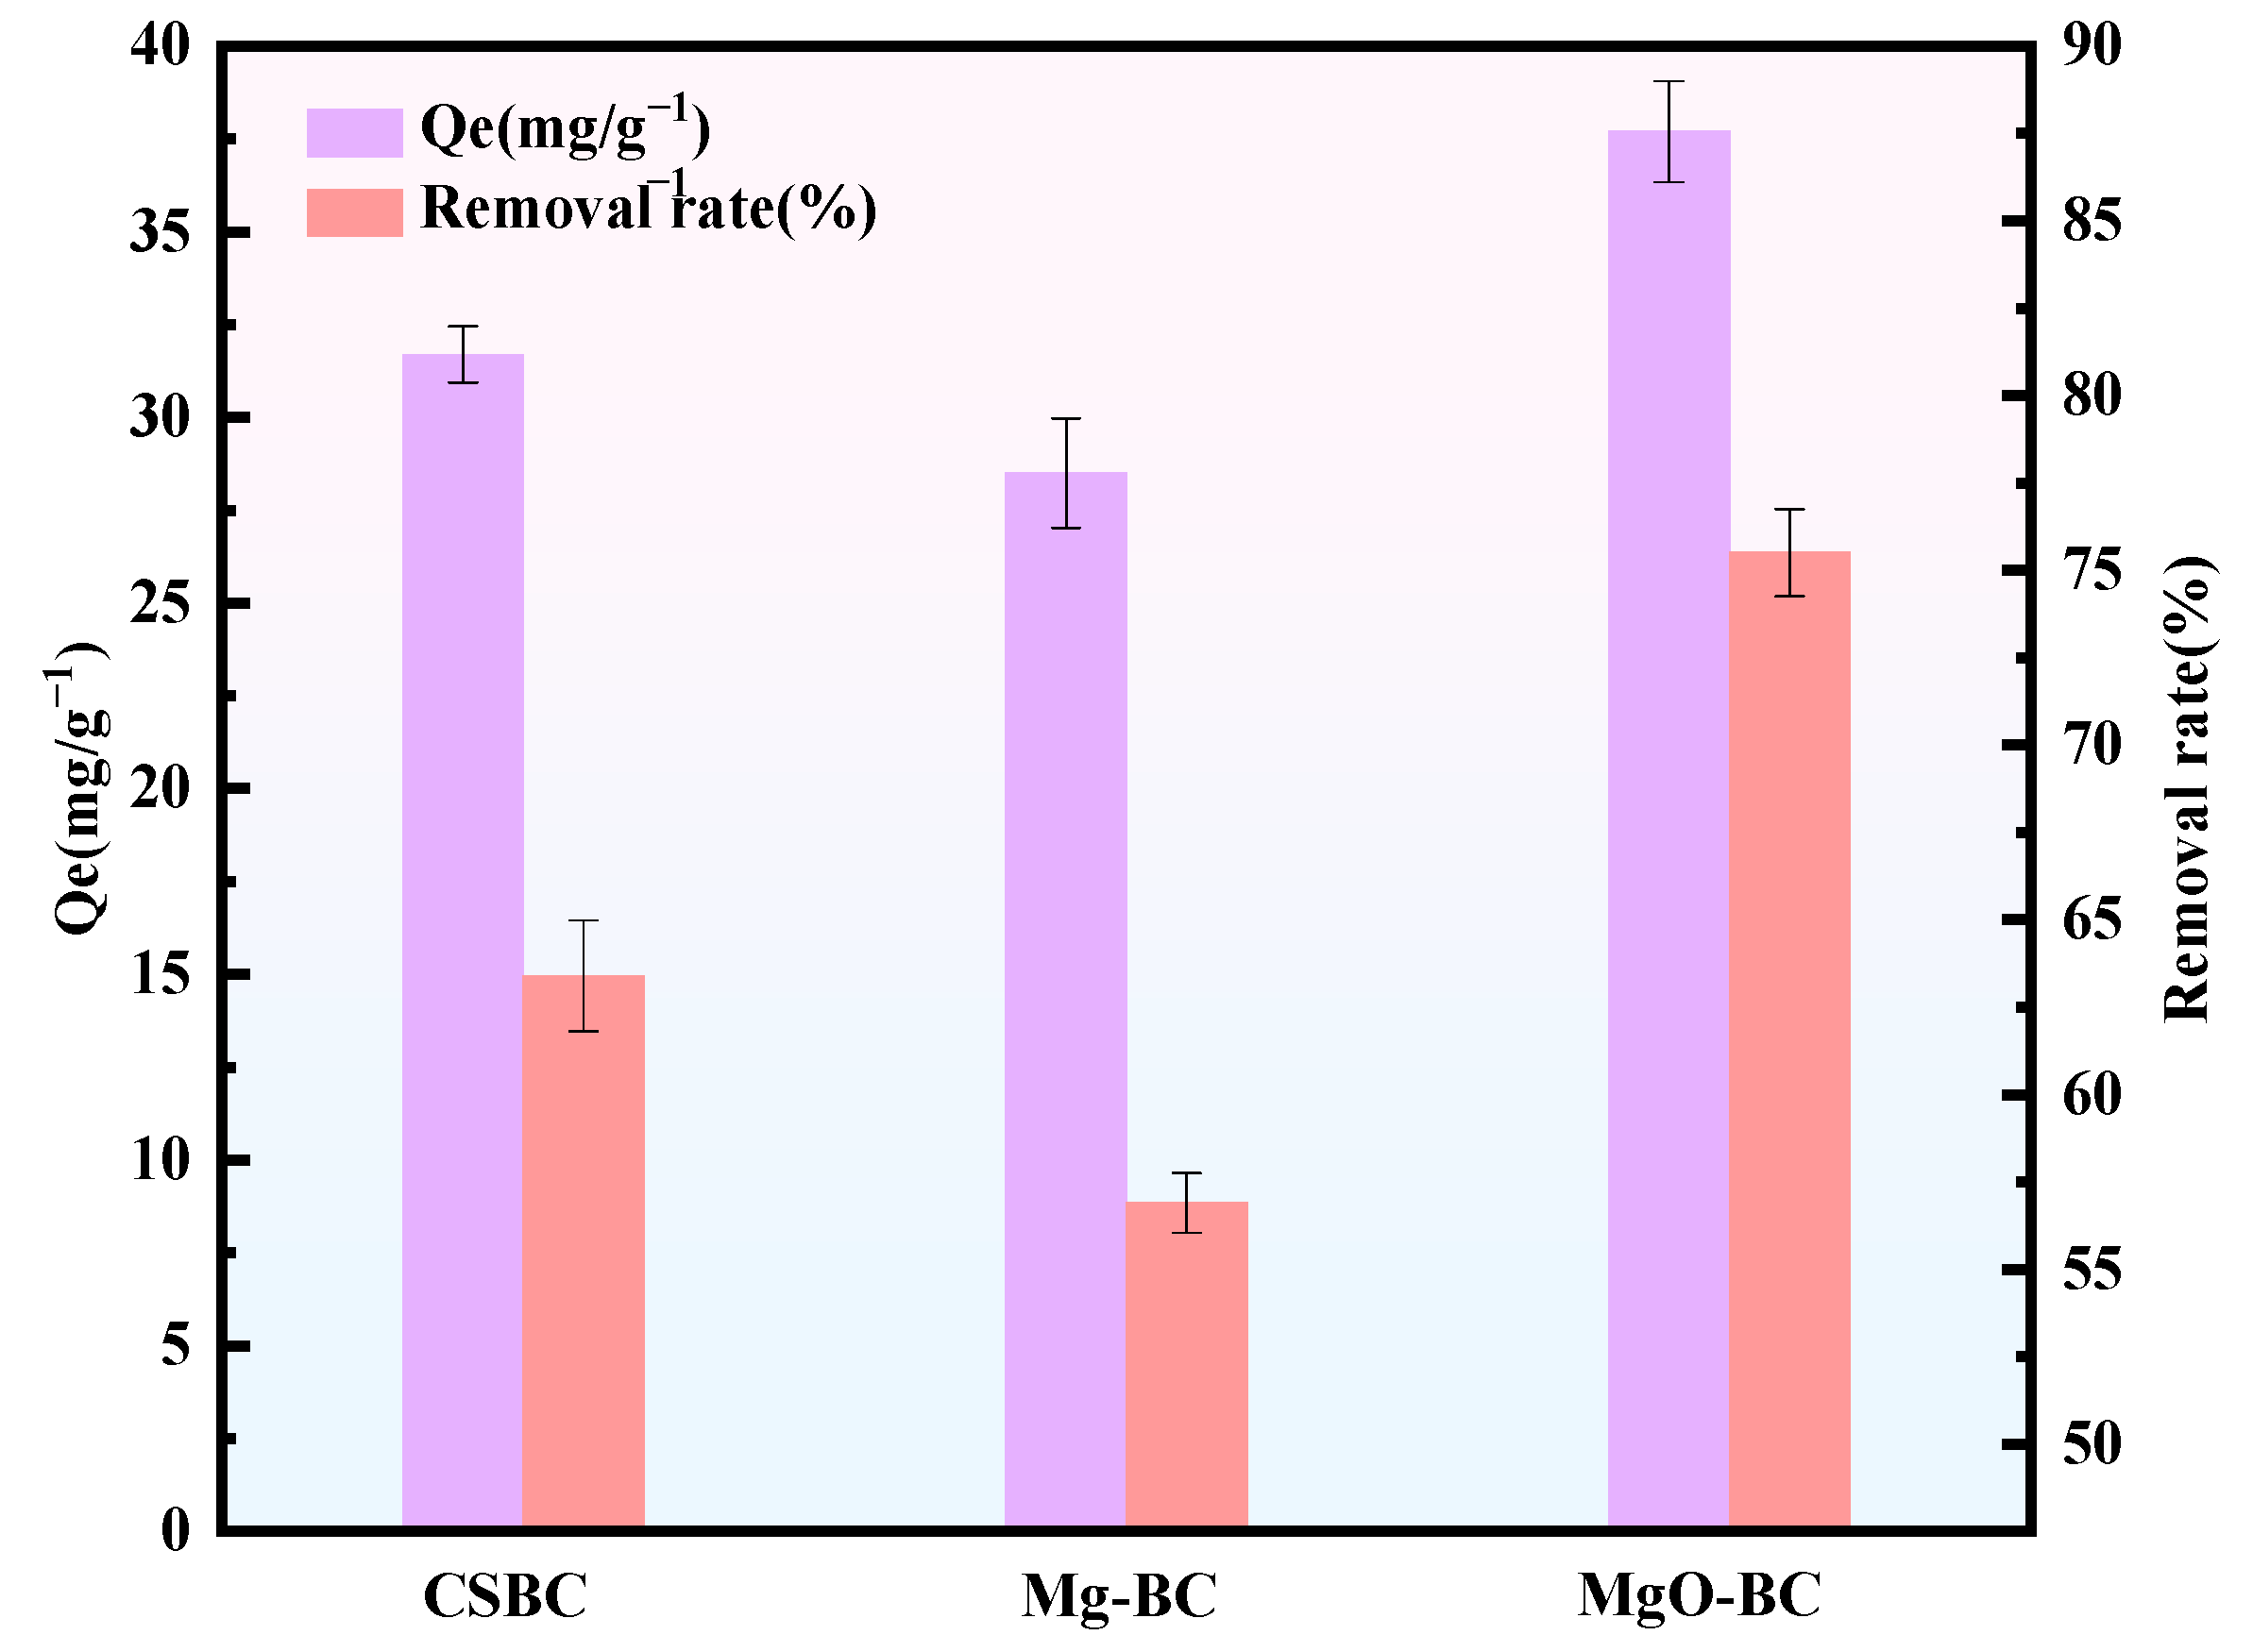
Comparative analysis of the optimal pretreatment experimental groups is shown in Figure 7. From left to right, the samples represent (1) undoped single-component CSBC treated under steam-assisted conditions of 300 °C, 30% moisture content, and 60 min reaction time; (2) CSBC directly mixed with magnesite; (3) magnesite-treated CSBC. The corresponding adsorption capacities and removal rates were 31.7 mg/g (63.4%), 28.5 mg/g (56.9%), and 37.7 mg/g (75.5%), respectively. The directly mixed magnesite group exhibited considerably poorer adsorption performance than the single-component CSBC. This demonstrates that magnesium oxide (MgO) cannot sufficiently react and effectively combine with CSBC under these torrefaction conditions, thereby inhibiting its inherent adsorption capability. The results suggest that 300 °C is insufficient to disrupt the stable crystal lattice of MgO or to overcome the required activation energy for the reaction [53]. Consequently, MgO cannot fully react; its physicochemical properties remain underdeveloped and 300 °C does not reach its thermodynamic decomposition threshold, resulting in an excessively slow kinetic process [54]. The acid-treated experimental group validated this conclusion. After loading, the adsorption performance of BC surpassed that of the single-component group, confirming the successful loading of magnesite onto CSBC. The enhanced adsorption performance primarily results from (1) synergistically optimized physical structures (improved pore architecture) and (2) notably enhanced surface chemical properties (particularly the strong electrostatic attraction between Mg2+ from magnesite and C6H5O derived from phenol dissociation) [52]. CSBC acts as a carrier to disperse magnesite particles while simultaneously contributing its functional groups (e.g., hydrogen bonds) to the adsorption process. Their combination creates a synergistic effect that integrates multiple adsorption mechanisms, including hydrogen bonding, π–π interactions, and ion exchange/electrostatic attraction. This comprehensive mechanism system considerably enhances phenol adsorption capacity and efficiency compared with the individual components.

3.2.2. BET Surface Area Analysis

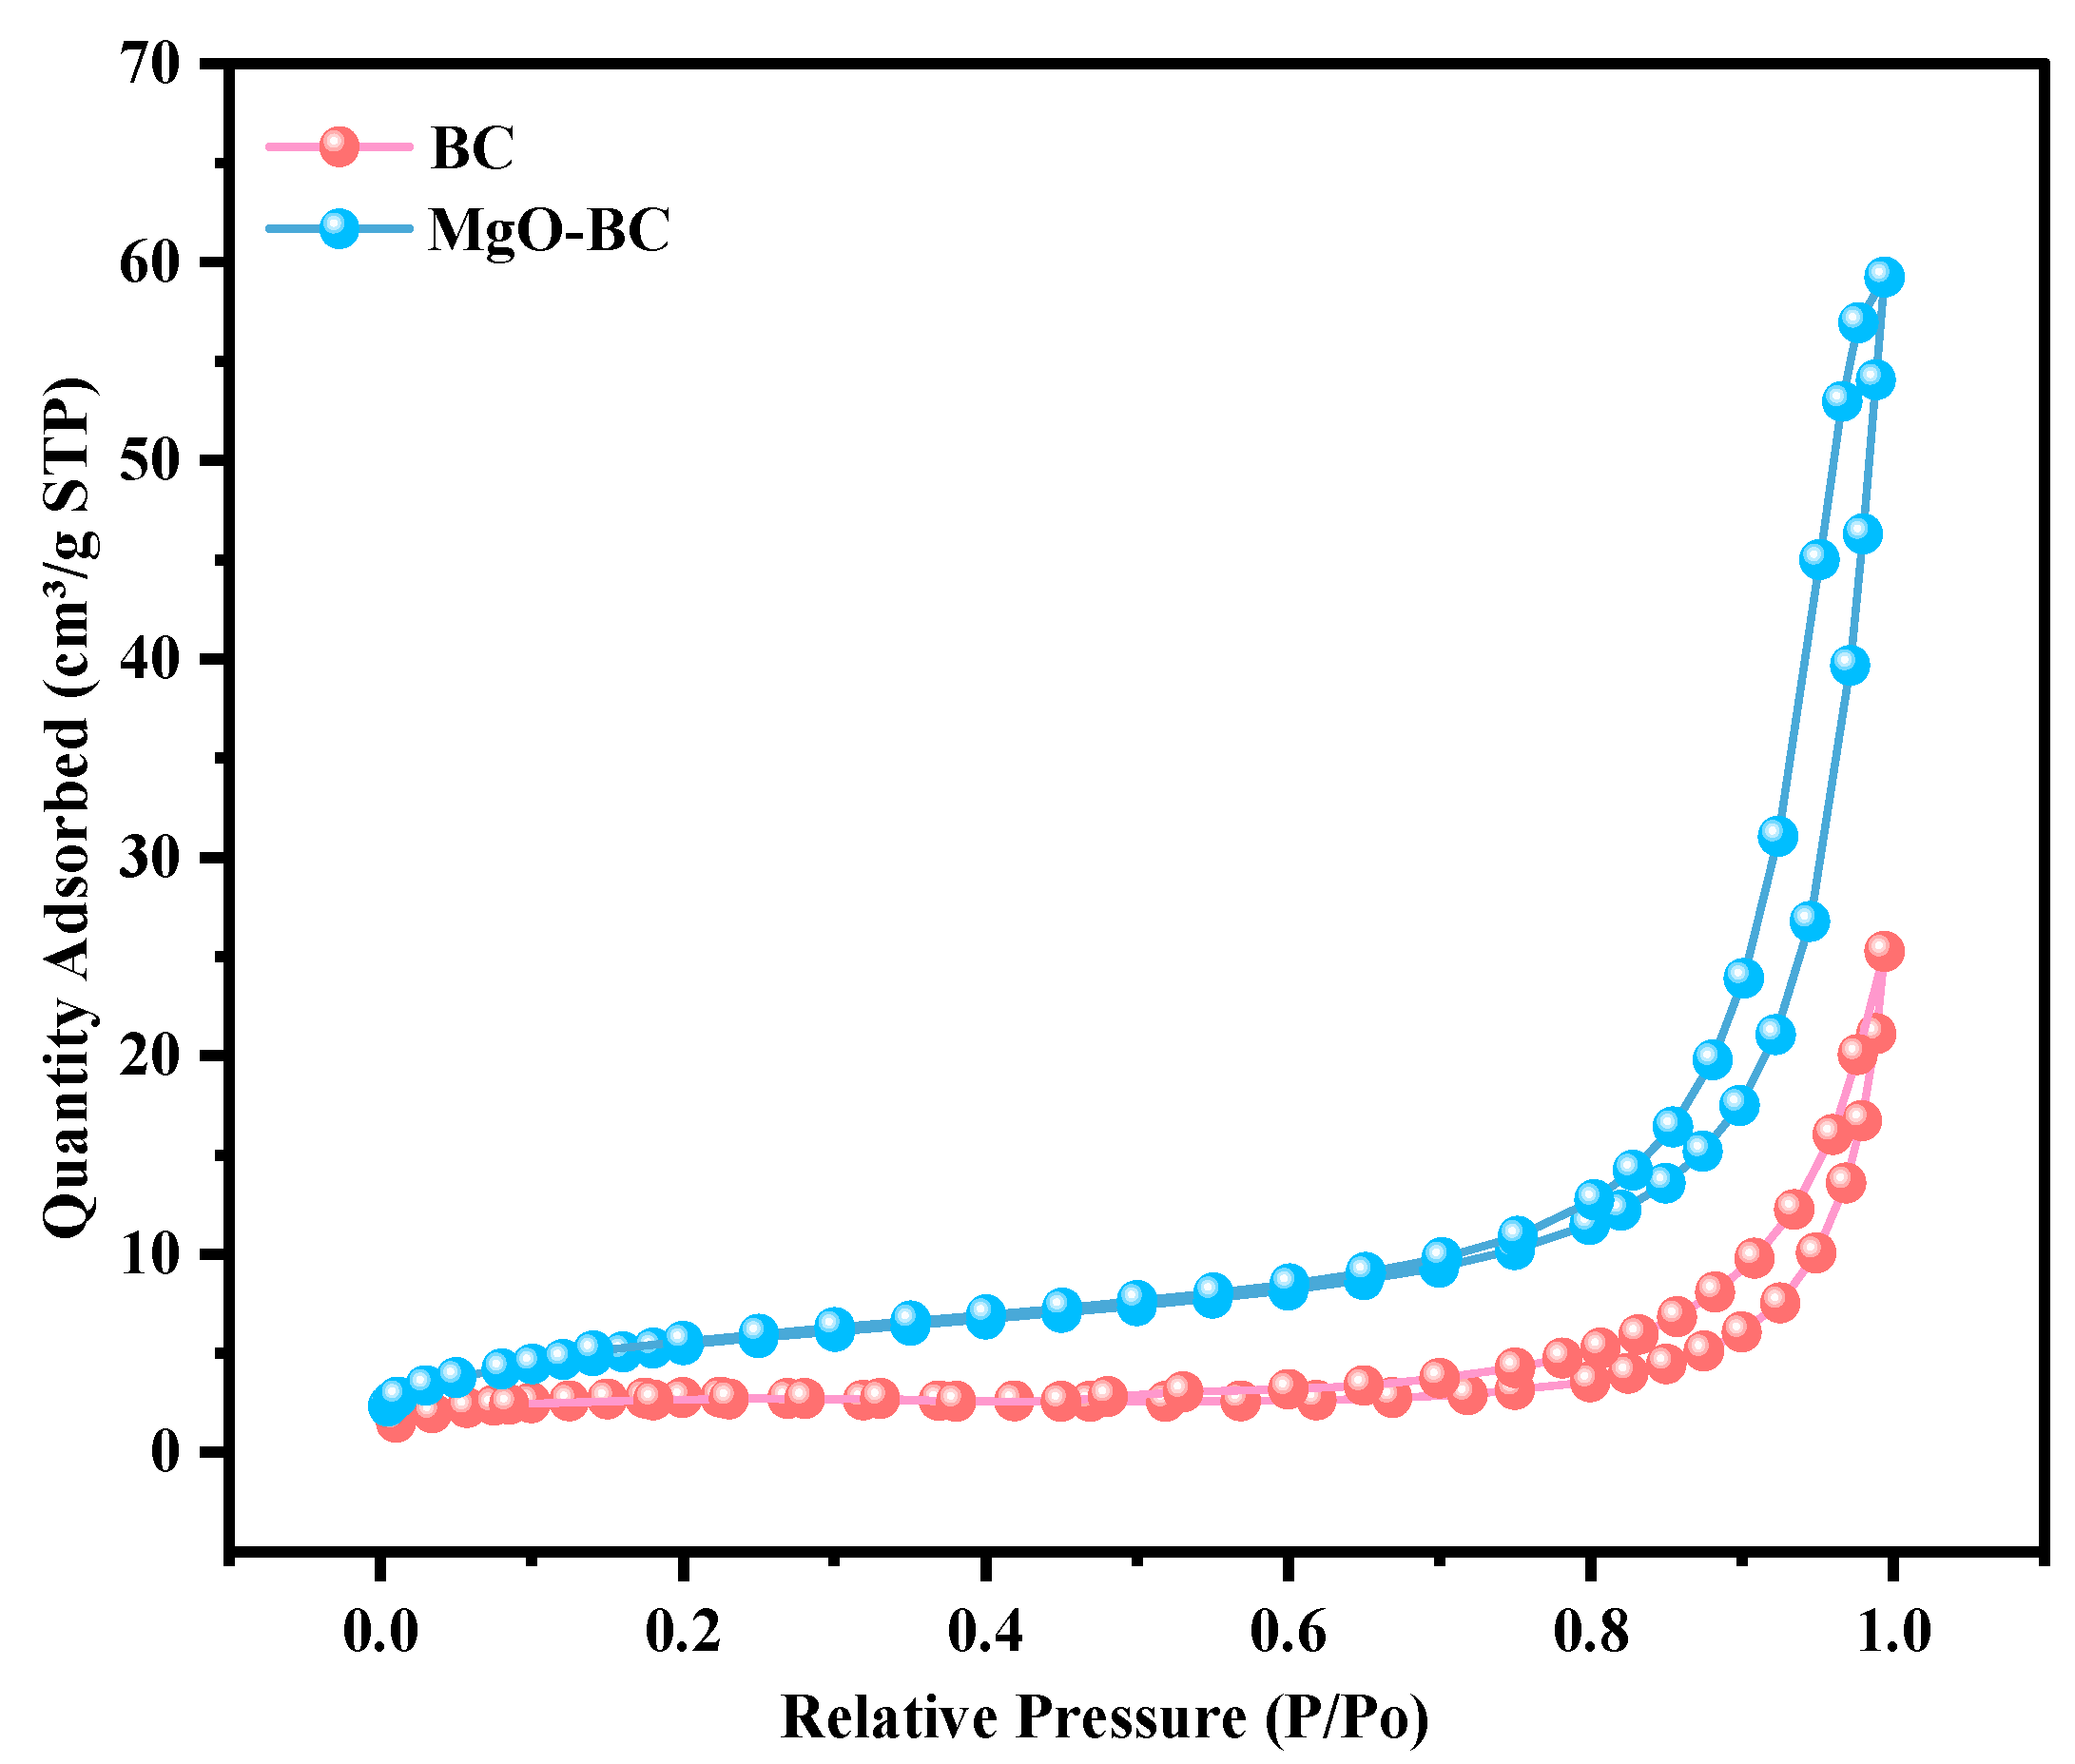
The biochar (BC) sample exhibited a Type I isotherm (Figure 8), which is characterized by a rapid attainment of adsorption saturation at low relative pressure (P/P0 < 0.1), followed by a plateau phase of adsorption capacity. Even at high relative pressure (P/P0 > 0.9), the adsorption capacity only increased slightly to 2.53 cm3/g under standard temperature and pressure (STP) [55]. The absence of a hysteresis loop in this isotherm indicates that the pore structure development of the BC sample is limited. Its single-point specific surface area (at P/P0 = 0.15) was merely 0.998 m2/g, the total pore volume (at P/P0 = 0.994) was as low as 0.0039 cm3/g, and the average pore width was 14.999 nm. Such low specific surface area and pore volume resulted in insufficient active sites on the sample surface, thereby leading to a low phenol adsorption capacity. In contrast, the magnesium oxide-biochar composite (MgO-BC) displayed a Type IV(a) isotherm (Figure 8), which consists of three distinct characteristic regions: (1) an increase in adsorption capacity at low relative pressure (P/P0) [56]; (2) the appearance of an H4-type hysteresis loop in the medium-pressure range (P/P0 = 0.4–0.9); (3) a renewed increase in adsorption capacity at high relative pressure (P/P0 > 0.9) due to the macropore filling effect, ultimately reaching 5.92 mmol/g. After modification, the Brunauer–Emmett–Teller (BET) specific surface area of MgO-BC (at P/P0 = 0.25) increased to 42.26 m2/g, the total pore volume rose to 0.205 cm3/g, and the average pore width decreased significantly to 1.848 nm. This combined characteristic of “high specific surface area, large pore volume, and small average pore width” indicates that the material has formed a hierarchical pore structure dominated by micropores/small mesopores (<5 nm) and accompanied by transport macropores. Among them, micropores/small mesopores provide abundant active sites for adsorption [57]. Meanwhile, the H4-type hysteresis loop and the adsorption behavior in the high-pressure region confirm the presence of slit-like pores and transport macropores in the material. These two types of pore structures are crucial for increasing the total pore volume and promoting the diffusion of phenol molecules.
In summary, the modification with magnesium oxide (MgO) overcomes the pore structure limitations of biochar. The modification process not only constructs a micropore–mesopore hierarchical structure but also regulates the surface chemical properties of the material, ultimately significantly improving its phenol adsorption performance.

3.2.3. FTIR Spectra of Samples for Different Pretreatment Methods

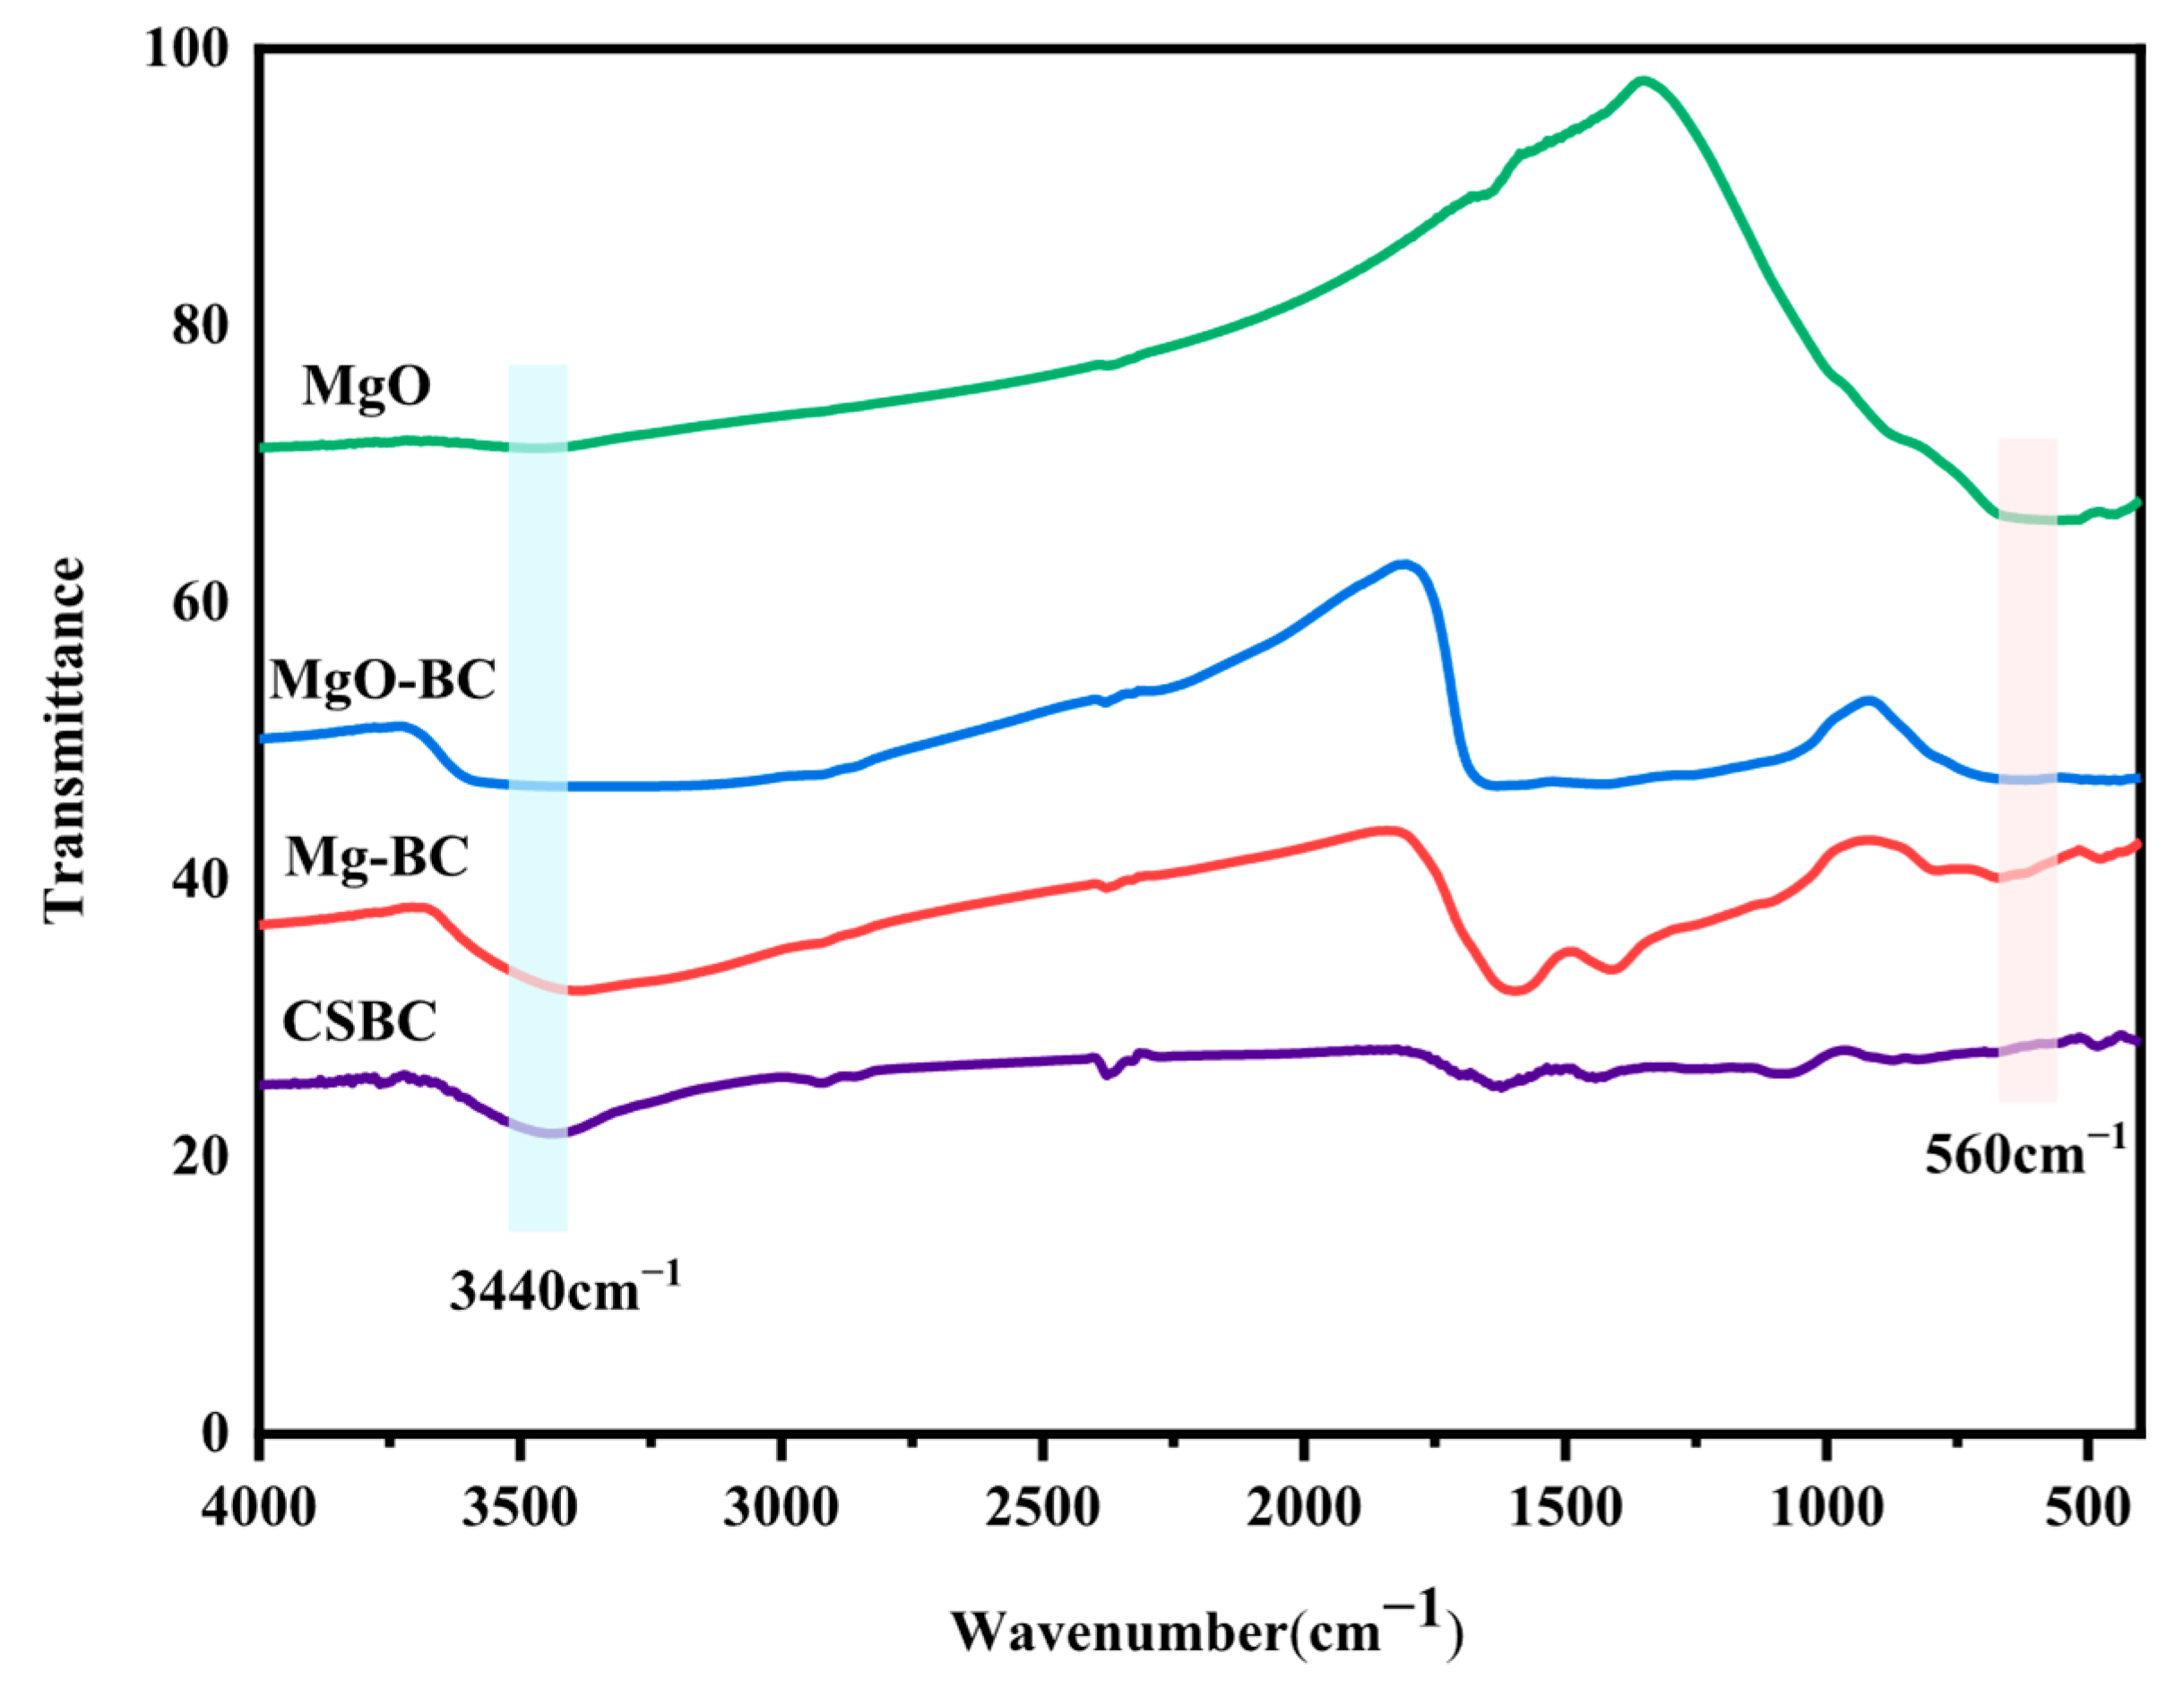
Figure 9 presents the FTIR spectra of four materials: CSBC, Mg-BC, MgO-BC, and pure MgO. A weak absorption is observed around 560 cm−1 for MgO and MgO-BC, potentially corresponding to Mg-O vibrations [58]. This confirms the successful incorporation of MgO into the BC in the MgO-BC sample. In contrast, Mg-BC shows no such characteristic peak, indicating that direct doping of CSBC with magnesium failed to achieve homogeneous mixing or effective Mg–O bond formation. Additionally, none of the samples show broad absorption bands in the 3400–3500 cm−1 region, indicating complete dehydration under the torrefaction treatment at 300 °C. This confirms that the initial 30% moisture content did not lead to rehydration during the process, thereby validating the thermal pretreatment conditions used for torrefaction.

3.2.4. SEM-EDX Analysis for Different Pretreatment Methods

Figure 10A shows the typical fragmented flake structures of CSBC, originating from the porous plant cell wall framework retained after carbon skeleton fracture during corn stover pyrolysis. The material exhibits small pore sizes with a uniform distribution and no observable microfractures [50,51]. These morphological features indicate that torrefaction preserves the integrity of the carbon matrix with good pore connectivity, facilitating the exposure of abundant adsorption sites and providing an ideal substrate for subsequent modification. Figure 10B shows that Mg-BC comprises irregular flake aggregates with unevenly dispersed MgO particles on the CSBC surface. Distinct interfacial boundaries confirm the absence of chemical bonding or pore penetration between CSBC and MgO, indicating mere physical mixing. This interfacial separation causes MgO detachment, preventing effective utilization of the pore structure of CSBC and ultimately inhibiting pollutant adsorption performance. Figure 10C demonstrates blurred interfaces between MgO and the CSBC matrix in the MgO-BC composite, suggesting possible chemical bonding or effective pore filling due to precursor (MgCO3) torrefaction for stable loading. No notable MgO agglomerates were observed, confirming uniform dispersion during modification. The introduced Mg2+ promoted new pore formation in CSBC. This structural optimization exposes additional active sites, thereby considerably enhancing the phenol adsorption capacity and removal efficiency of the composite. Figure 11 shows the EDX ultimate mapping results of MgO-BC. The Mg element was homogeneously dispersed throughout the material. The average Mg content was 48.2 wt%, resulting in a Mg/C atomic ratio of approximately 0.67.

3.2.5. XRD Analysis for Different Pretreatment Methods

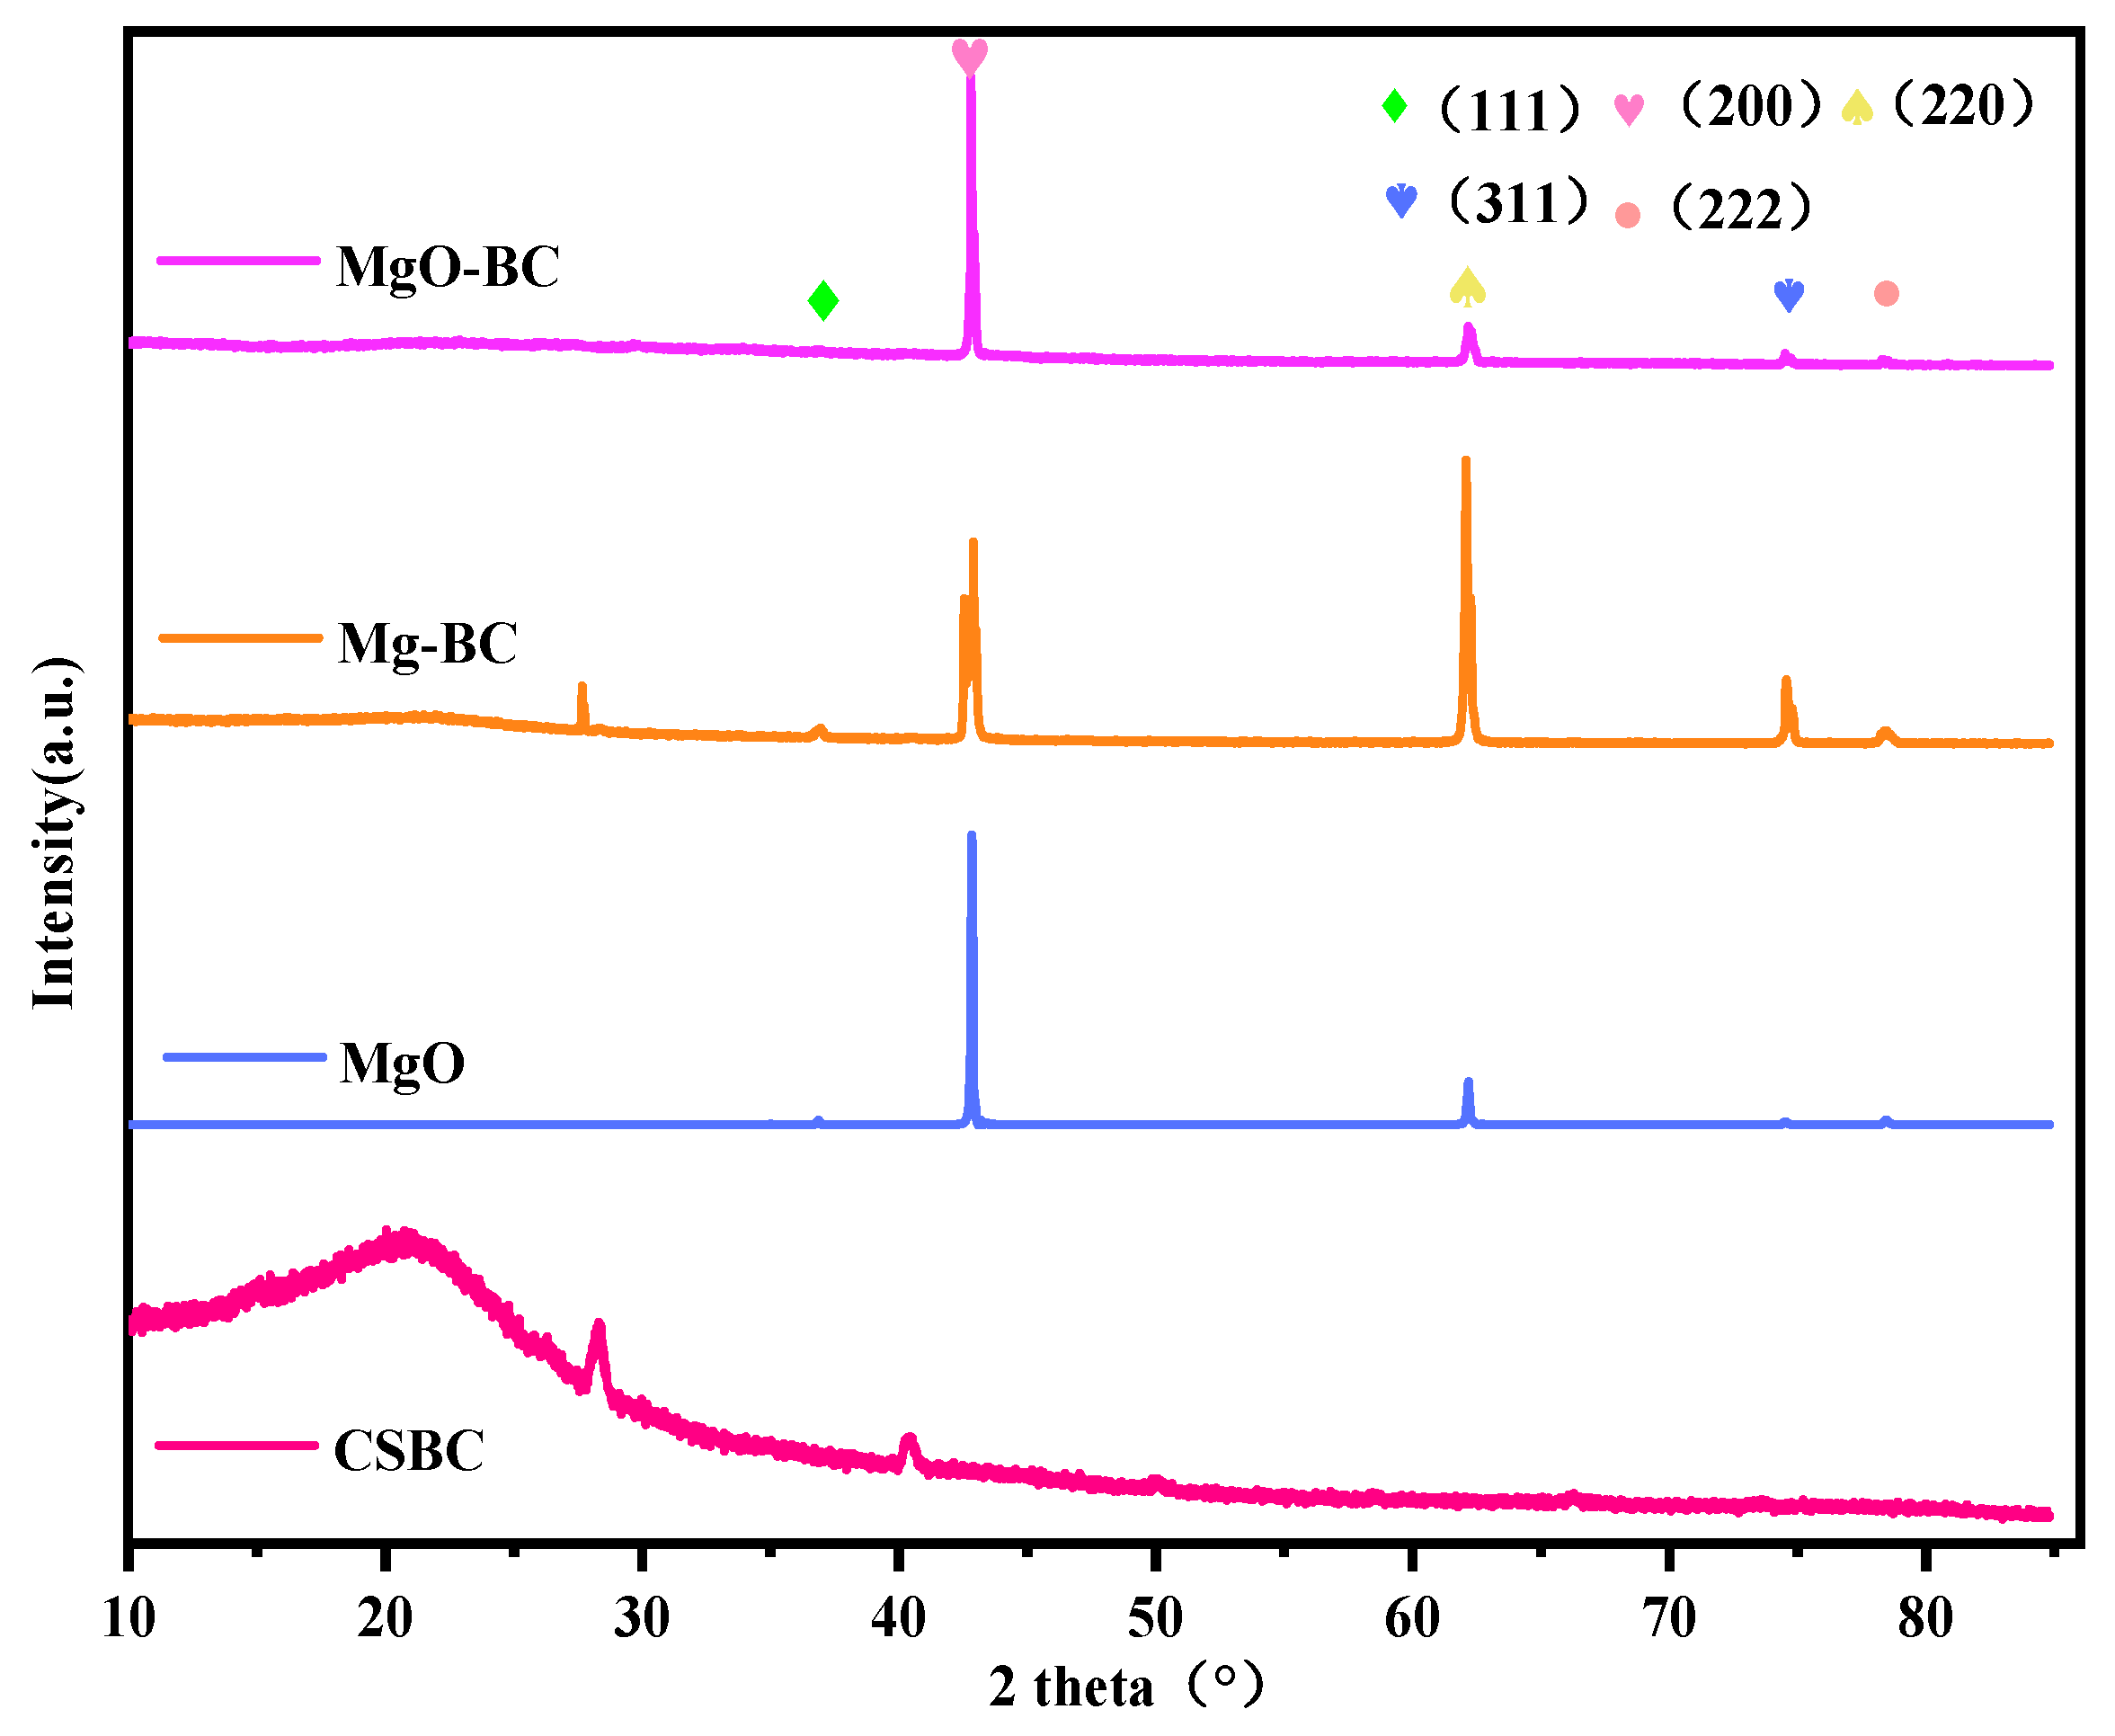
XRD was used to analyze the chemical compositions and phase structures of CSBC, MgO obtained from calcined magnesite (800 °C), Mg-BC, and MgO-BC. The XRD patterns (Figure 12) revealed two broad diffraction peaks for CSBC in 2θ positions of 22° and 43°, corresponding to the (002) graphitic carbon plane and (100) amorphous carbon layer of BC, respectively [29]. However, these broad peaks showed appreciably reduced intensity in Mg-BC and MgO-BC, indicating that the sample structures were altered by MgO incorporation. For the MgO sample, characteristic diffraction peaks were observed at 2θ positions of 36.7°, 42.8°, 62.2°, 74.4°, and 78.4° indexed to the (111), (200), (220), (311) and (222) crystal planes of cubic-phase MgO, respectively (PDF#-45-0946) [59]. The most intense peak corresponds to the (200) plane, which is consistent with the rock-salt structure of MgO where the (200) plane has the highest structure factor. The weaker intensities of the (311) and (222) peaks are inherent to the crystal structure itself, as these higher-index planes have lower atomic densities and structure factors compared to the (200) plane [60]. The XRD pattern of MgO-BC showed excellent agreement with the standard MgO reference (PDF#-45-0946), confirming the successful loading of MgO onto the BC surface with an improved uniform crystallite size. Notably, both CSBC and Mg-BC exhibited a diffraction peak near 28°. This peak indicates low crystallinity, which is consistent with the disordered structure characteristic of biomass pyrolysis residues [61]. This phenomenon can be attributed to the incomplete carbonization of lignocellulose under torrefaction pretreatment conditions, which retains partial polymeric framework structures.

3.2.6. Raman Analysis for Different Pretreatment Methods

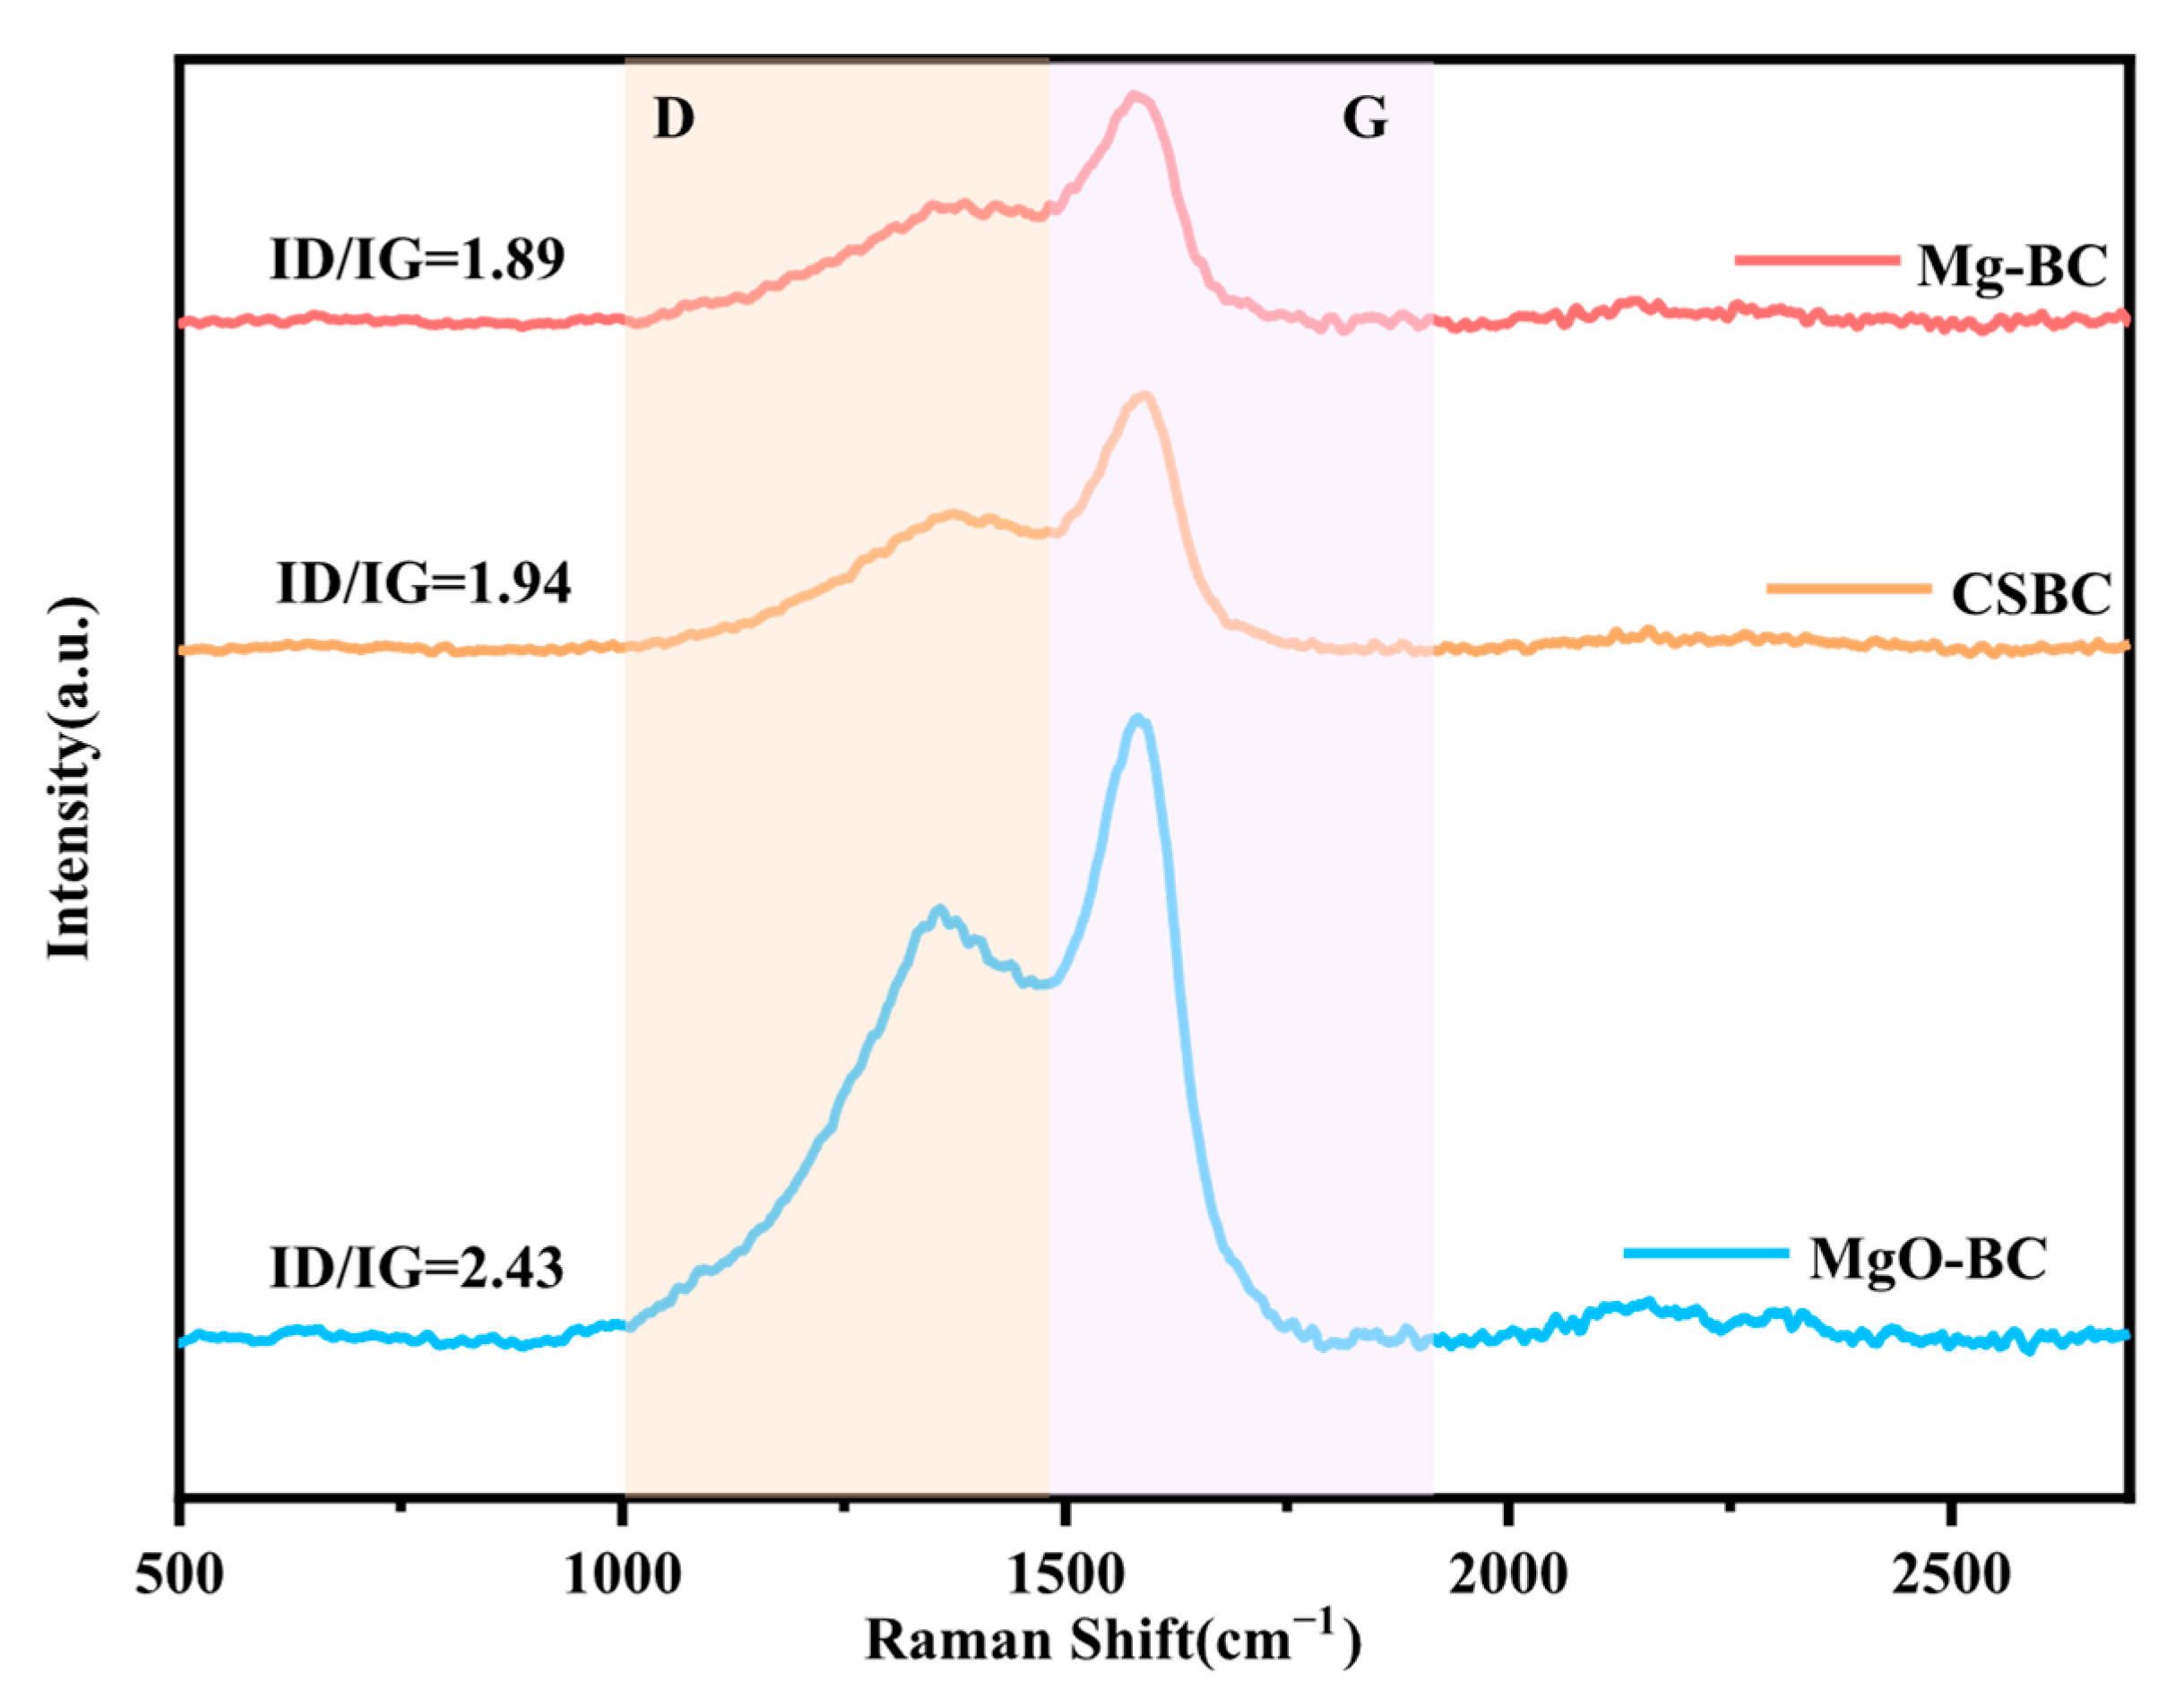
Figure 13 presents the Raman spectral characteristics of CSBC, Mg-BC, and MgO-BC. All three samples exhibited characteristic peaks near 1335 and 1580 cm−1, corresponding to the D-band and G-band of carbon materials, respectively. The D-band at 1335 cm−1 is attributed to defects in the microcrystalline carbon structures, and its intensity is positively correlated with the development of hexagonal aromatic rings and increased structural ordering of carbon components. The G-band at 1580 cm−1 corresponds to the in-plane stretching vibration of sp2 hybridized carbon atoms (E2g mode), reflecting the graphitization degree of the material [62]. The intensity ratio of the D-band to the G-band (ID/IG) quantifies the defect level of the material. A higher ID/IG value indicates a higher defect density in the carbon skeleton and lower structural ordering. The weak interfacial interactions between Mg-BC particles and the BC induce minimal perturbation to the carbon lattice structure, thereby resulting in nearly identical Raman spectral features. However, MgO-BC exhibited considerably higher ID/IG values than CSBC and Mg-BC, suggesting that the MgO loading process introduced abundant structural defects and sp3 hybridized carbon, resulting in more surface defects and edge active sites that substantially increased the structural disorder of the carbon carrier [63]. This defect-enriched characteristic promotes the coordination of oxygen-containing functional groups, thereby optimizing the pollutant adsorption performance of the material via various mechanisms such as π–π interactions, hydrogen bonding, and electrostatic attraction [64,65].

4. Conclusions

This study addresses the challenges of low resource utilization efficiency of waste corn stover and the disposal of magnesite tailings (MMTs) by proposing a steam-assisted torrefaction pretreatment method. Results demonstrate that corn stover biochar (CSBC) prepared under optimal conditions (300 °C, 30% moisture content, 60 min) exhibits significantly improved energy density and well-developed pore structure, achieving a phenol adsorption capacity of 31.7 mg/g with 63.4% removal rate. The incorporation of magnesite tailings further enhances the pore structure and surface chemistry of CSBC, promoting the formation of MgO active sites. The composite system (CSBC + MMTs) reaches a phenol removal rate of 75.5%. As a reaction medium, steam not only facilitates pore development but also regulates the distribution of oxygen-containing functional groups (-OH and C=O), thereby enhancing phenol adsorption through hydrogen bonding and π–π interactions via a synergistic adsorption mechanism. The proposed steam-assisted torrefaction pretreatment improves both the gasification suitability of corn stover and enables efficient resource utilization of MMTs. This approach provides a practical technical pathway for clean biomass energy conversion and solid waste co-processing. Based on the excellent adsorption performance demonstrated in this study, our future research work will focus on verifying the tar reduction efficiency at the pilot scale. Specifically, we will conduct systematic gasification experiments on pretreated corn stover biochar (CSBC) in a fluidized bed gasification system and quantitatively analyze the variation patterns of tar components and concentrations. In conclusion, this study presents a novel strategy for in situ tar control in biomass gasification and solid waste resource recovery, demonstrating significant environmental and energy production benefits. Subsequent research will extend the investigation of corn stover and magnesite tailings under varied processing conditions.

Author Contributions

S.G. conceived the research direction, designed the overall framework, and ensured research scientificity. Q.L. led experimental implementation, including corn stalk torrefaction pretreatment, composite biochar preparation, and phenol adsorption experiments. W.K. was responsible for material characterization (FTIR, XRD, Raman spectroscopy) and data analysis. Z.S. guided key technical issues and revised the manuscript and handled journal submission communication. X.L. created visual contents including experimental flowcharts and SEM images. Y.W. conducted parallel experiments to ensure data reproducibility. H.Z. provided insights for discussions on steam adsorption mechanism and magnesite synergistic effect. P.G. polished the manuscript logic and ensured compliance with Sustainability’s language requirements. All authors have read and agreed to the published version of the manuscript.

Funding

This research was financed by the Project of National Key R&D Program of China (2022YFE0196700), Scientific Research Fund Project of Liaoning Provincial Department of Education (Grant No. LJ212414435007), Liaoning Provincial Key Laboratory of Energy Storage and Utilization, Yingkou Institute of Technology, (CNNK202401), Joint Fund of Natural Science Foundation of Liaoning province (2023-MSLH-309 and 2023-MSLH-317). Liaoning Provincial Department of Education Project of China (No. LJ242510157003).

Institutional Review Board Statement

Not applicable.

Informed Consent Statement

Not applicable.

Data Availability Statement

The data used to support the findings of this study are included within the article.

Conflicts of Interest

The authors declare no conflicts of interest.

References

  1. Mei, Y.; Gao, P.; Li, J.; He, X.-S.; Cui, L.-P.; Zhang, T.; Wang, Y.-J.; Xue, P. Enhanced Cadmium Sequestration from Animal Waste Using a Combined Modified Corn Straw Biochar: Unraveling the Mechanisms and Performance in Hazardous Metal Removal. Environ. Technol. Innov. 2025, 39, 104256. [Google Scholar] [CrossRef]
  2. Li, T.; Dai, Q.; Bi, X.; Wu, J.; Zhang, Y.; Feng, Y. Size Distribution and Chemical Characteristics of Particles from Crop Residue Open Burning in North China. J. Environ. Sci. 2021, 109, 66–76. [Google Scholar] [CrossRef]
  3. Xu, C.; Wang, Z.; Fan, Q.; Yang, Y.; Zhang, Q. Fabricating Phosphorus-Doped Corn Straw Biochar for Efficient Adsorptive Removal of Imazethapyr from Aqueous Solutions. Surf. Interfaces 2025, 63, 106347. [Google Scholar] [CrossRef]
  4. Lugo-Arias, J.; González-Álvarez, J.; Maturana, A.; Villa-Parejo, J.; Barraza-Heras, C. Removal of Nitrate and Phosphate from Aqueous Solutions Using Bioadsorbents Derived from Agro-Industrial Wastes of Rice Husk and Corn Stalk. Biomass Convers. Biorefinery 2025, 15, 19453–19475. [Google Scholar] [CrossRef]
  5. Prado, E.R.L.; Rial, R.C. Advances in Conversion Technologies for Biofuels from Wheat and Corn Straws. Biocatal. Agric. Biotechnol. 2025, 63, 103481. [Google Scholar] [CrossRef]
  6. Shi, J.; Sheng, L.; Chen, M.; Wu, X.; Li, X.; Tan, Y.Q. pH-Responsive Collagen Nanocomposite Films Reinforced by Curcumin-Loaded Laponite Nanoplatelets for Dynamic Visualization of Shrimp Freshness. Food Hydrocoll. 2024, 157, 110447. [Google Scholar] [CrossRef]
  7. Shi, J.; Zhang, Y.; Yang, N.; Guan, X.; Sheng, L.; Liu, L.; Zhong, W. Covalently Surface-Grafting A-zirconium Phosphate Nanoplatelets Enables Collagen Fiber Matrix with Ultraviolet Barrier, Antibacterial, and Flame-Retardant Properties. Int. J. Biol. Macromol. 2024, 254, 127999. [Google Scholar] [CrossRef]
  8. Shi, J.; Wu, X.; Sheng, L.; Chen, M.; Shi, L.; Zhang, Y.; Yang, J.; Mao, S.; Liu, Q.; Zhou, Z. Enabling Multifunctional Bio-Based Waterborne Polyurethane through Polyphenol-Mediated Assembly of Zirconium Phosphate Nanoplatelets for Patternable Coating. Compos. Sci. Technol. 2025, 266, 111178. [Google Scholar] [CrossRef]
  9. Bach, Q.-V.; Nguyen, D.D.; Lee, C.-J. Effect of Torrefaction on Steam Gasification of Biomass in Dual Fluidized Bed Reactor—A Process Simulation Study. Bioenergy Res. 2019, 12, 1042–1051. [Google Scholar] [CrossRef]
  10. Zheng, A.; Fan, Y.; Wei, G.; Zhao, K.; Huang, Z.; Zhao, Z.; Li, H. Chemical Looping Gasification of Torrefied Biomass Using NiFe2O4 as an Oxygen Carrier for Syngas Production and Tar Removal. Energy Fuels 2020, 34, 6008–6019. [Google Scholar] [CrossRef]
  11. Singh, R.K.; Sarkar, A.; Chakraborty, J.P. Effect of Torrefaction on the Physicochemical Properties of Pigeon Pea Stalk (Cajanus cajan) and Estimation of Kinetic Parameters. Renew. Energy 2019, 138, 805–819. [Google Scholar] [CrossRef]
  12. Tsalidis, G.A.; Di Marcello, M.; Spinelli, G.; De Jong, W.; Kiel, J.H.A. The Effect of Torrefaction on the Process Performance of Oxygen-Steam Blown CFB Gasification of Hardwood and Softwood. Biomass Bioenergy 2017, 106, 155–165. [Google Scholar] [CrossRef]
  13. Singh, R.K.; Sarkar, A.; Chakraborty, J.P. Effect of Torrefaction on the Physicochemical Properties of Eucalyptus Derived Biofuels: Estimation of Kinetic Parameters and Optimizing Torrefaction Using Response Surface Methodology (RSM). Energy 2020, 198, 117369. [Google Scholar] [CrossRef]
  14. Cvetinović, D.; Erić, A.; Cvetković, S.; Komatina, M.; Manić, N.; Janković, B. Performance Assessment and Techno-Economic Analysis of the Thermal Plasma Gasification of Biomass Using Air and Steam as Gasification Medium. Appl. Therm. Eng. 2025, 276, 126940. [Google Scholar] [CrossRef]
  15. Song, S.-H.; Kim, J.-K.; Kim, J.-W.; Park, C.-W.; Kim, J.-S. Low-Temperature Steam Gasification of Wood Using a Two-Stage Gasification Process to Avoid Bed Agglomeration in a Fluidized Bed Gasifier and Tar Problems. Energy 2025, 328, 136496. [Google Scholar] [CrossRef]
  16. Guo, J.; Foo, J.L.C.; Ge, L.; Chan, W.P.; Veksha, A.; Liu, G.; Hu, Z.; Guo, S.; Lisak, G. Steam-Assisted One-Step Fabrication of Ni-Ce Biochar Catalysts for Enhanced Biomass Pyrolysis-Steam Reforming. Chem. Eng. J. 2025, 509, 161302. [Google Scholar] [CrossRef]
  17. Zhou, Q.; Shen, Y.; Zhou, Q.; Zhang, C.; Gu, X. Torrefaction Integrated with Steam Gasification of Agricultural Biomass Wastes for Enhancing Tar Reduction and Hydrogen-Rich Syngas Production. Int. J. Hydrog. Energy 2024, 94, 474–484. [Google Scholar] [CrossRef]
  18. Şahin, Ö.; Saka, C. Preparation and Characterization of Activated Carbon from Acorn Shell by Physical Activation with H2O–CO2 in Two-Step Pretreatment. Bioresour. Technol. 2013, 136, 163–168. [Google Scholar] [CrossRef]
  19. Senthilkumar, V.; Prabhu, C. Development, Simulation and ANN Validation of Thermodynamic and Kinetic Models for Optimised Biomass Gasification for CO2 Reduction and Enhanced Syngas Yield. Int. J. Hydrog. Energy 2025, 163, 150681. [Google Scholar] [CrossRef]
  20. Vinodhkumar, S.; Balaji, S.; Kulanthaivel, P.; Deshmukh, R. Utilisation of Magnesite Mine Tailings as Sustainable Structural Fill Material: A Novel Approach to Mitigate Environmental Impact. Int. J. Environ. Sci. Technol. 2025, 22, 13661–13672. [Google Scholar] [CrossRef]
  21. Lin, H.; Tian, L.; Liu, X.; Wang, G.; Xie, C.; Li, G.; Tian, C. Tailoring Intergranular Binding Phase by Pr6O11 in Mg2SiO4–MgO Refractories Prepared from Magnesite Flotation Tailings. Ceram. Int. 2025, 51, 14110–14117. [Google Scholar] [CrossRef]
  22. Zhang, L.; Xu, W.; Jiang, J.; Li, R.; Gu, J.; Liang, W. Metagenomic Insights on Promoting the Removal of Resistome in Aerobic Composting Pig Manure by Lightly Burned Modified Magnesite. Sci. Total Environ. 2024, 957, 177101. [Google Scholar] [CrossRef]
  23. He, T.; Jin, B.; Pei, H.; Luo, Z.; Cai, Y. A Two-Stage Gasification System Achieving Clean Gas Production with Zero-Tar: 200 kWth Autothermal Pilot-Scale Experiment. Energy Convers. Manag. 2025, 345, 120335. [Google Scholar] [CrossRef]
  24. Oni, B.A.; Sanni, S.E.; Tomomewo, O.S.; Ibegbu, A.J. Gasification of Egusi Melon (Citrullus lanatus) Shell over a Novel Ni/Dolomite/MgO/γ–Al2O3 Catalyst for the Production of H2-Rich Gas. Process Saf. Environ. Prot. 2024, 183, 446–458. [Google Scholar] [CrossRef]
  25. Zan, W.; Ma, B.; Ma, Y.; Zhou, Z.; Cao, R.; Liu, G.; You, J. Synthesis and Properties of Porous MgAl2O4–Mg2SiO4 Refractory Aggregates from Magnesite Tailings and Bauxite Chamotte. Ceram. Int. 2025, 51, 14632–14643. [Google Scholar] [CrossRef]
  26. Zhang, X.; Zhang, Z.-Y.; Liu, Y.; Yang, L.; Zheng, Y.; Kang, S.; Zhou, J. Preparation of Magnesium Potassium Phosphate Cement from Magnesite Tailings under Lower Calcination Temperature. Constr. Build. Mater. 2024, 451, 138869. [Google Scholar] [CrossRef]
  27. Ma, B.; Zan, W.; Liu, K.; Mu, X.; Deng, C.; Huang, A. Preparation and Properties of Porous MgO-Based Ceramics from Magnesite Tailings and Fused Magnesia. Ceram. Int. 2023, 49, 19072–19082. [Google Scholar] [CrossRef]
  28. Zhou, Y.; Liu, Z.; Shan, J.; Wu, C.; Lichtfouse, E.; Liu, H. Efficient Recovery of Phosphate from Urine Using Magnesite Modified Corn Straw Biochar and Its Potential Application as Fertilizer. J. Environ. Chem. Eng. 2024, 12, 111925. [Google Scholar] [CrossRef]
  29. Liang, H.; Jiang, Y.; Wang, S.; Xue, Z.; Wang, C.; Wang, W.; Zuo, X.; Dai, Y.; Ruan, X. Facile and Scalable Synthesis of Long-Life Porous MgO-Nanofiber Functionalized Biochar Adsorbent from Magnesite for Phosphate Recycling. Sep. Purif. Technol. 2025, 354, 129234. [Google Scholar] [CrossRef]
  30. Artetxe, M.; Nahil, M.A.; Olazar, M.; Williams, P.T. Steam Reforming of Phenol as Biomass Tar Model Compound over Ni/Al2O3 Catalyst. Fuel 2016, 184, 629–636. [Google Scholar] [CrossRef]
  31. GB/T 21923-2008; General Rules for Inspection of Solid Biomass Fuels. Standard Press of China: Beijing, China, 2008.
  32. GB/T 28731-2012; Proximate Analysis of Solid Biofuels. Standard Press of China: Beijing, China, 2012.
  33. GB/T 30727-2014; Determination of Calorific Value of Solid Biofuels. Standard Press of China: Beijing, China, 2014.
  34. Chen, J.; Duan, Q.; Liu, J.; Zhang, S.; Zhang, J.; Lin, S. Adsorption of Fe-Modified Peanut Shell Biochar for Pb(II) in Mixed Pb(II), Cu(II), Ni(II) Solutions. Sci. Rep. 2025, 15, 13558. [Google Scholar] [CrossRef]
  35. Li, H.; Gui, Y.; Li, J.; Zhang, J.; Lü, J. Development of Lignin-Derived Hierarchically Porous Carbon by One-Step Pyrolysis in an Air/N2 Flow for Efficient Adsorption of Organic Pollutants. J. Anal. Appl. Pyrolysis 2024, 177, 106344. [Google Scholar] [CrossRef]
  36. Bentley, M.J.; Kearns, J.P.; Murphy, B.M.; Summers, R.S. Pre-Pyrolysis Metal and Base Addition Catalyzes Pore Development and Improves Organic Micropollutant Adsorption to Pine Biochar. Chemosphere 2022, 286, 131949. [Google Scholar] [CrossRef]
  37. Duan, H.; Liu, Q.; Mao, S.; He, Y.; Han, X.; Yu, J.; Xu, S. Effect of Tea Stalk Biochar Derived from Pyrolysis at Different Temperatures on Adsorption Capacity of Asphalt Fume. Constr. Build. Mater. 2025, 481, 141523. [Google Scholar] [CrossRef]
  38. Chungcharoen, T.; Limmun, W.; Srisang, S.; Phetpan, K.; Ruttanadech, N.; Youryon, P.; Kongtragoul, P.; Srisang, N. Enhanced Biodiesel Purification Using Coffee Husk Bioadsorbents: The Role of Pyrolysis Temperature, KOH Activation, and Adsorption Efficiency. Renew. Energy 2025, 244, 122700. [Google Scholar] [CrossRef]
  39. Cao, X.; Zhang, K.; Yan, J.; Wang, Z.; Lei, Z.; Ren, S.; Kang, S.; Li, Z.; Shui, H. Sulfur Migration during Co-Pyrolysis of High Sulfur Coking Coal with Fat Coal and Lean Coal. Fuel 2024, 365, 131338. [Google Scholar] [CrossRef]
  40. Schmid, D.; Karlström, O.; Yrjas, P. Release of NH3, HCN and NO during Devolatilization and Combustion of Washed and Torrefied Biomass. Fuel 2020, 280, 118583. [Google Scholar] [CrossRef]
  41. Tumuluru, J.S.; Ghiasi, B.; Soelberg, N.R.; Sokhansanj, S. Biomass Torrefaction Process, Product Properties, Reactor Types, and Moving Bed Reactor Design Concepts. Front. Energy Res. 2021, 9, 728140. [Google Scholar] [CrossRef]
  42. Yin, Y.; Wang, G.; Li, Q.; Zhao, Z.; Guo, Z.; Zhang, F.; Luan, Y.-N.; Liu, C. Optimizing Biochar Structure via Two-Step Pyrolysis for Uniform Magnesium Oxide Post-Doping with Enhanced Phosphate Removal Performance. Colloids Surf. Physicochem. Eng. Asp. 2025, 724, 137438. [Google Scholar] [CrossRef]
  43. Duongbia, N.; Kamopas, W.; Ruangrit, K.; Deethayat, T.; Asanakham, A.; Kiatsiriroat, T. Biochar from Co-Pyrolysis of Spent Coffee Ground with Leptolyngbya Sp. KC 45 Biomass and Residue for Energy and Agricultural Utilization. Energy Nexus 2025, 18, 100454. [Google Scholar] [CrossRef]
  44. Li, G.; Cheng, W.; Zhang, X.; Zhang, H.; Wang, W.; Shao, J.; Yang, H.; Chen, H.; Zhang, S. A Comprehensive Study on Fuel Property, Pyrolysis Kinetic and Product Characteristic of Torrefied Biomass for High-Value Utilization. Ind. Crops Prod. 2025, 230, 121052. [Google Scholar] [CrossRef]
  45. Wang, X.; Ma, D.; Jin, Q.; Deng, S.; Stančin, H.; Tan, H.; Mikulčić, H. Synergistic Effects of Biomass and Polyurethane Co-Pyrolysis on the Yield, Reactivity, and Heating Value of Biochar at High Temperatures. Fuel Process. Technol. 2019, 194, 106127. [Google Scholar] [CrossRef]
  46. Ren, H.; Li, B.; Zhou, X.; Chen, S.; Li, Y.; Hu, C.; Tian, J.; Zhang, G.; Pan, Y.; Zou, C. Wafer-Size VO2 Film Prepared by Water-Vapor Oxidant. Appl. Surf. Sci. 2020, 525, 146642. [Google Scholar] [CrossRef]
  47. Meng, X.; Xu, X.; Hu, S.; Chu, R.; Li, X.; Li, W.; Yu, S.; Sun, Y. Changes in the Pore Structure and Oxygen-Containing Functional Groups of Lignite under Steam Explosion and Their Influence on Water Molecule Resorption. Colloids Surf. Physicochem. Eng. Asp. 2025, 725, 137675. [Google Scholar] [CrossRef]
  48. Hassan, M.; Strezov, V. Wheat Straw Pyrolysis Fundamentals during Production of Biochar. J. Therm. Anal. Calorim. 2025. [Google Scholar] [CrossRef]
  49. Beljin, J.; Isakovski, M.K.; Agbaba, J.; Vujić, M.; Maletić, S.; Tubić, A. Adsorptive Behavior of Corn-Cob- and Straw-Derived Biochar for Polycyclic Aromatic Hydrocarbon Removal from Aqueous Systems. Processes 2025, 13, 1521. [Google Scholar] [CrossRef]
  50. Ahmed, M.W.; Singh, V.; Kamruzzaman, M. Near-Infrared Spectroscopy as a Green Analytical Tool for Sustainable Biomass Characterization for Biofuels and Bioproducts: An Overview. Bioresour. Technol. 2025, 433, 132722. [Google Scholar] [CrossRef] [PubMed]
  51. Zafar, A.; Wasim, M.; Ali, T.; Qureshi, R.N. Application of XRD, SEM-EDX and FTIR Techniques for Mineral Characterization of Geological Ores. Radiochim. Acta 2025, 113, 399–409. [Google Scholar] [CrossRef]
  52. Chen, T.; Xie, P.; Yu, Y.; Duan, X.; Sun, Y.; Guan, X. Metal Ions-Mediated Concerted Electron-Proton Transfer Enables Catalytic Oxidation of Phenolic Contaminants by Permanganate. Water Res. 2025, 268, 122622. [Google Scholar] [CrossRef]
  53. Darla, U.R.; Lataye, D.H.; Kumar, A.; Pandit, B.; Ubaidullah, M. Adsorption of Phenol Using Adsorbent Derived from Saccharum officinarum Biomass: Optimization, Isotherms, Kinetics, and Thermodynamic Study. Sci. Rep. 2023, 13, 18356. [Google Scholar] [CrossRef] [PubMed]
  54. Eboibi, B.E.; Ogbue, M.C.; Udochukwu, E.C.; Umukoro, J.E.; Okan, L.O.; Agarry, S.E. Maize Cob (Zea mays) as Natural Biomass Sorbent for Crude Oil Biosorptive Removal from Contaminated Seawater: Taguchi Process Optimization and Biosorptive Removal Mechanism. Environ. Monit. Assess. 2023, 195, 1145. [Google Scholar] [CrossRef] [PubMed]
  55. Schlumberger, C.; Scherdel, C.; Kriesten, M.; Leicht, P.; Keilbach, A.; Ehmann, H.; Kotnik, P.; Reichenauer, G.; Thommes, M. Reliable Surface Area Determination of Powders and Meso/Macroporous Materials: Small-Angle X-Ray Scattering and Gas Physisorption. Microporous Mesoporous Mater. 2022, 329, 111554. [Google Scholar] [CrossRef]
  56. Goodarzi, F.; Kock, M.; Mielby, J.; Kegnæs, S. CO2 Methanation Using Metals Nanoparticles Supported on High Surface Area MgO. J. CO2 Util. 2023, 69, 102396. [Google Scholar] [CrossRef]
  57. Sreekanth, R.; Pattar, J.; Anupama, A.V.; Mallikarjunaswamy, A.M.M. Synthesis of High Surface Area and Plate-like Magnesium Oxide Nanoparticles by pH-Controlled Precipitation Method. Appl. Phys. A 2021, 127, 797. [Google Scholar] [CrossRef]
  58. Ehiro, T. Characterization of Ibuprofen-Loaded MgO by One-Step Mid- and Far-FT-IR Spectroscopy. Chem. Pharm. Bull. 2021, 69, 693–697. [Google Scholar] [CrossRef]
  59. Rajagopalachar, S.; Pattar, J.; Mulla, S. Synthesis and Characterization of Plate-like High Surface Area MgO Nanoparticles for Their Antibacterial Activity against Bacillus cereus (MTCC 430) and Pseudomonas aeruginosa (MTCC 424) Bacterias. Inorg. Chem. Commun. 2022, 144, 109907. [Google Scholar] [CrossRef]
  60. Anbazhagi, S.; Murugesan, A.; Muthukrishnan, P.; Paramanantham, M.; Rajasekar, S.; Pazhanisamy, T.; Arivazhagan, S.; Karuppiah, C. Synthesis and Characterization of ZnO/MgO Nanocomposites: Targeted Drug Delivery Strategies for Cancer Treatment. Inorg. Chem. Commun. 2025, 180, 115014. [Google Scholar] [CrossRef]
  61. Jing, F.; Guan, J.; Tang, W.; Chen, J. Mechanistic Insight into Adsorptive Removal of Ionic NOR and Nonionic DEP Organic Contaminates by Clay-Biochar Composites. Environ. Pollut. 2022, 310, 119881. [Google Scholar] [CrossRef]
  62. Chen, S.; Xia, Y.; Zhang, B.; Chen, H.; Chen, G.; Tang, S. Disassembly of Lignocellulose into Cellulose, Hemicellulose, and Lignin for Preparation of Porous Carbon Materials with Enhanced Performances. J. Hazard. Mater. 2021, 408, 124956. [Google Scholar] [CrossRef]
  63. Khalil, A.M.; Msaadi, R.; Sassi, W.; Ghanmi, I.; Pires, R.; Michely, L.; Snoussi, Y.; Chevillot-Biraud, A.; Lau-Truong, S.; Chehimi, M.M. Facile Diazonium Modification of Pomegranate Peel Biochar: A Stupendous Derived Relationship between Thermal and Raman Analyses. Carbon Lett. 2022, 32, 1519–1529. [Google Scholar] [CrossRef]
  64. Xu, Y.; Wang, C.; An, X.; Wang, Y.; Gao, M.; Wang, R.; Ke, P.; Cheng, X. Defects and Oxygen Functional Groups on Sludge Biochar Synergistic Activation of PMS for Degradation of Sulfamethoxazole and Practical Application. J. Environ. Chem. Eng. 2024, 12, 114958. [Google Scholar] [CrossRef]
  65. Yang, H.; Ding, Z.; Liu, Y.; Zhang, S.; Zou, Y.; Bai, G.; Zhang, Y.; Xia, S. Biomass-Derived Carbon Aerogel for Peroxymonosulfate Activation to Remove Tetracycline: Carbonization Temperature, Oxygen-Containing Functional Group Content, and Defect Degree. Ind. Crops Prod. 2022, 177, 114437. [Google Scholar] [CrossRef]
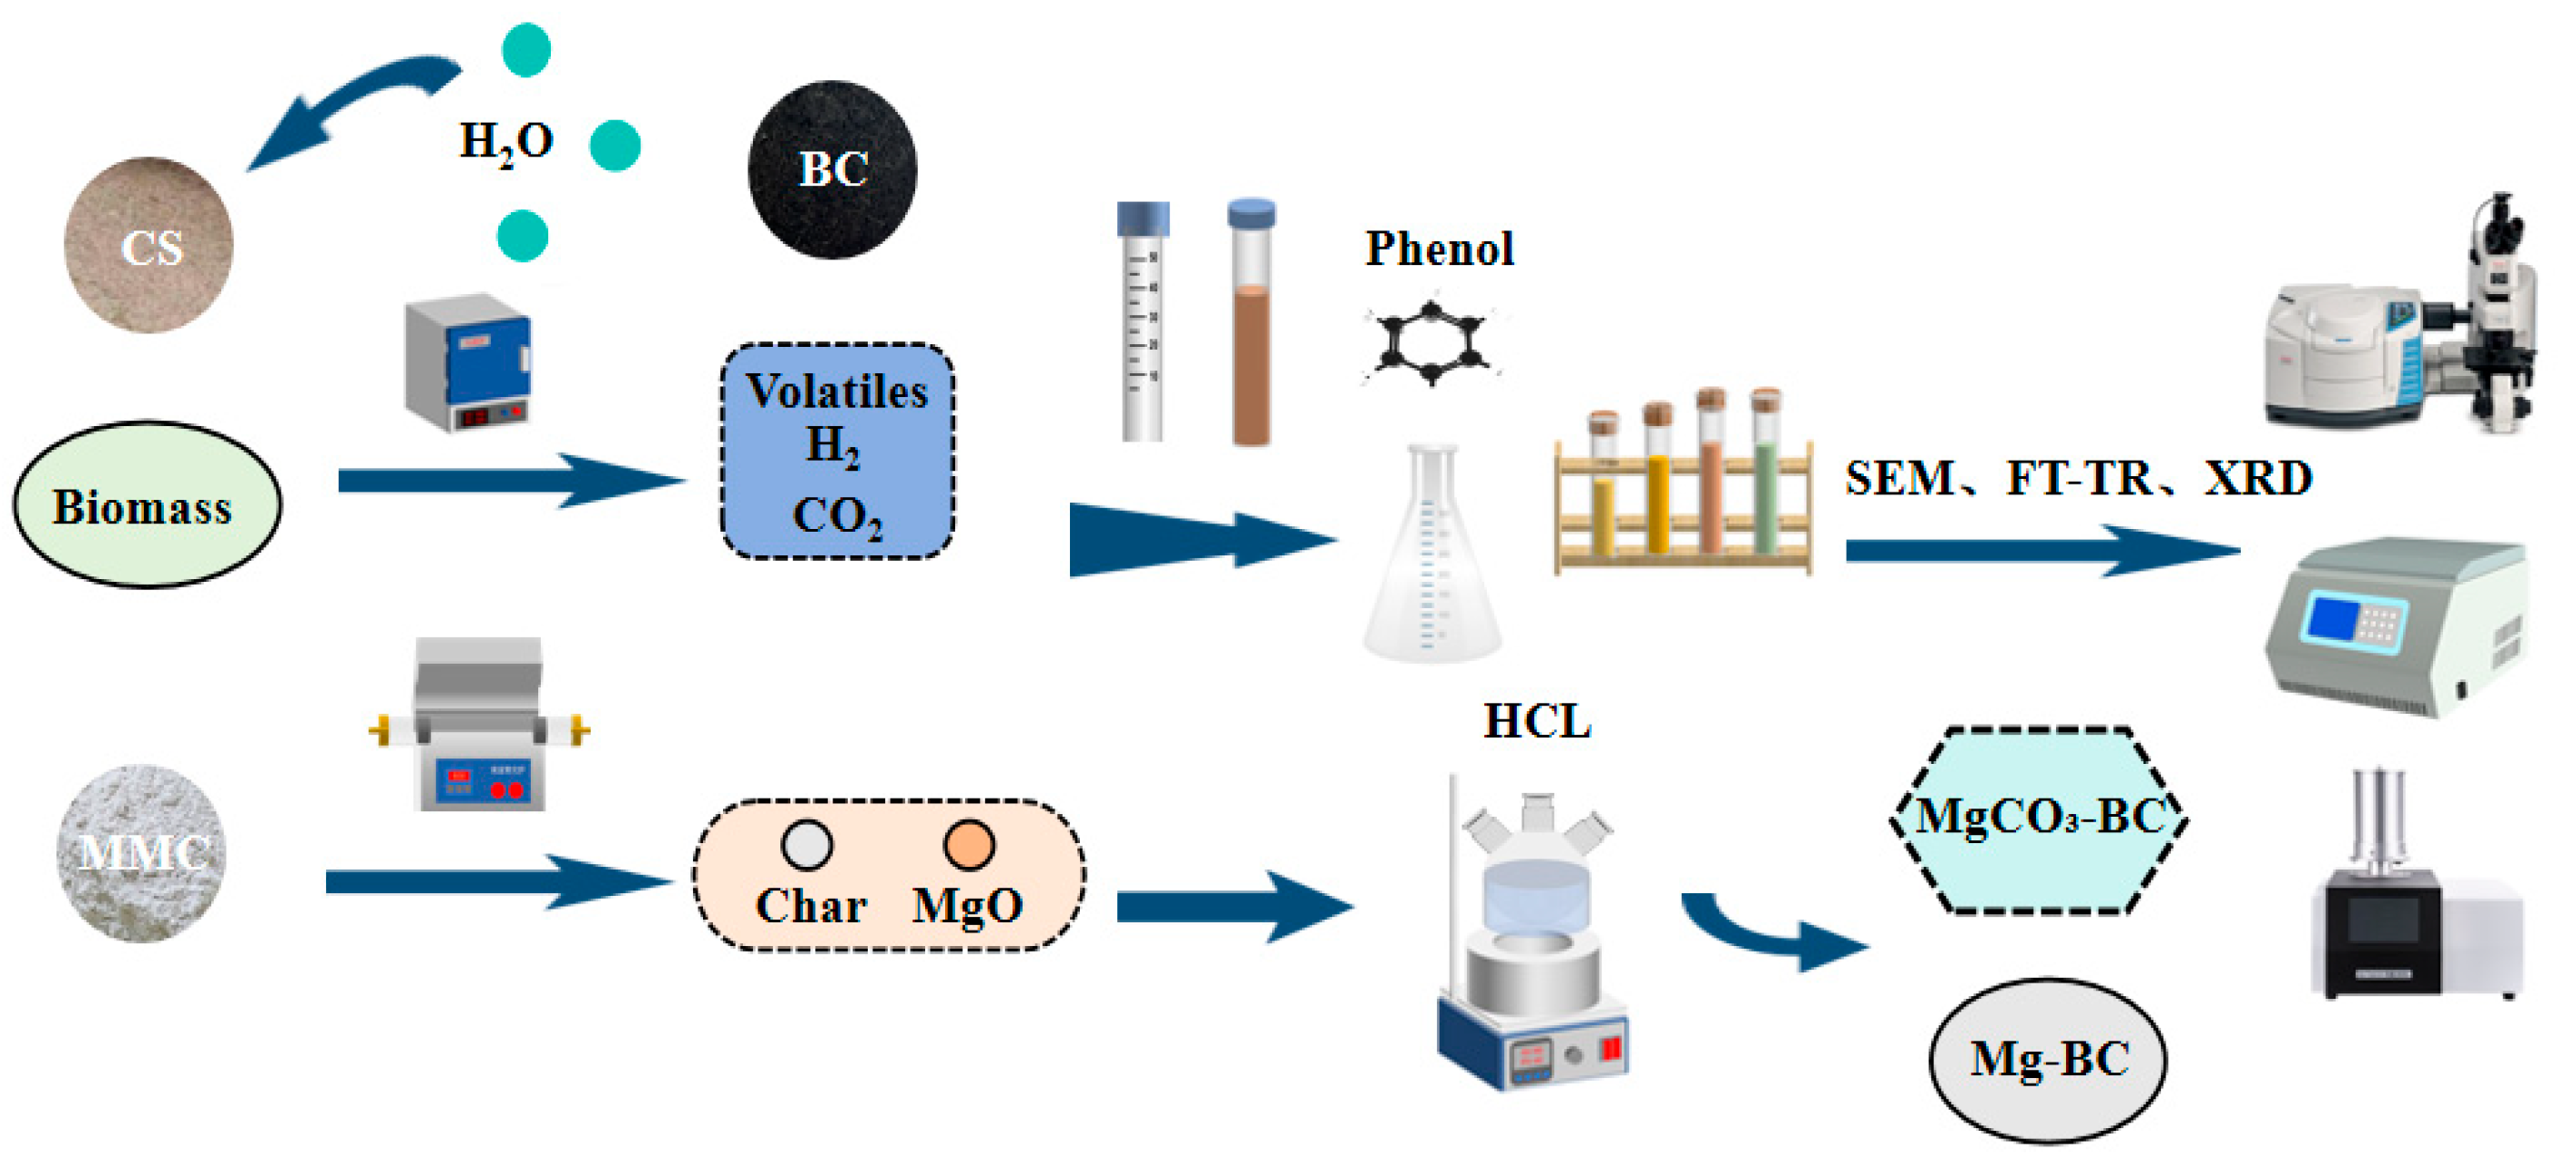
Figure 1. Experimental flowchart.
Sustainability 17 09091 g001
Figure 2. Influence of torrefaction pretreatment on phenol adsorption and removal rate: (A) Phenol adsorption capacity under different temperature and moisture content conditions (torrefaction duration: 60 min); (B) Phenol removal rate under different temperature and moisture content conditions (torrefaction duration: 60 min); (C) Phenol adsorption capacity under different temperature and moisture content conditions (torrefaction duration: 30 min); (D) Phenol removal rate under different temperature and moisture content conditions (torrefaction duration: 30 min).
Sustainability 17 09091 g002aSustainability 17 09091 g002b
Figure 3. Proximate analysis of CSBC.
Sustainability 17 09091 g003
Figure 4. Influence of torrefaction pretreatment on energy enhancement coefficient of CSBC: (A) Semi-carbonization temperature; (B) Moisture content.
Sustainability 17 09091 g004
Figure 5. Effects of hydrothermal carbonization parameters on distribution of functional groups in CSBC: (A) hydrothermal carbonization temperature; (B) moisture content.
Sustainability 17 09091 g005
Figure 6. SEM images of corn stalk biochar (CSBC) prepared at 300°C with 30% moisture content, shown at different magnifications: (A) 100 μm; (B) 50 μm; (C) 5 μm; (D) 2 μm.
Sustainability 17 09091 g006
Figure 7. Comparative diagram of the effects of different pretreatment methods.
Sustainability 17 09091 g007
Figure 8. BET Surface Area Analysis of CSBC.
Sustainability 17 09091 g008
Figure 9. Effects of torrefaction conditions on functional group distribution in CSBC.
Sustainability 17 09091 g009
Figure 10. SEM images for different pretreatment methods: (A) CSBC; (B) Mg-BC; (C) MgO-BC.
Sustainability 17 09091 g010
Figure 11. EDX ultimate mapping results of MgO-BC.
Sustainability 17 09091 g011
Figure 12. XRD patterns of different pretreatment methods.
Sustainability 17 09091 g012
Figure 13. Raman analysis for different pretreatment methods.
Sustainability 17 09091 g013
Table 1. Characteristics of biomass raw materials and baked biomass.
SampleCSCS220CS240CS260CS280CS300
ultimate analysis (wt%)
C52.5153.4256.5059.7261.9268.63
H6.085.925.835.725.144.68
O36.6136.2732.5528.5826.116.91
N1.601.200.960.830.720.68
S0.200.190.160.150.120.10
O/C0.700.680.580.480.420.25
H/C0.120.110.100.090.080.06
Disclaimer/Publisher’s Note: The statements, opinions and data contained in all publications are solely those of the individual author(s) and contributor(s) and not of MDPI and/or the editor(s). MDPI and/or the editor(s) disclaim responsibility for any injury to people or property resulting from any ideas, methods, instructions or products referred to in the content.