Abstract
The Belt and Road Initiative (BRI) represents one of the world’s most ambitious transnational infrastructure and investment programs, but its implementation faces considerable external risks. Specifically, these risks include geopolitical instability, regulatory disparities, socio-cultural conflicts, and economic volatility, which threaten project continuity, economic viability, and sustainability of the BRI framework. Consequently, effective risk recognition and prediction has become crucial for mitigating disruptions and supporting evidence-based policy formulation. What should be noticed is that existing risk management frameworks lack specialized, dynamically adaptive indicator systems capable of forecasting external risks specific to international engineering projects under the BRI. They tend to rely on static and traditional methods, which are ill-equipped to handle the dynamic and nonlinear nature of these transnational challenges. To address this gap, we have developed a machine learning-based early warning system. Drawing on a comprehensive dataset of 31 risk indicators across 155 BRI countries from 2013 to 2022, we constructed a stacked ensemble model optimized via Grid Search. The resulting ensemble model demonstrated exceptional predictive performance, achieving an R2 value of 0.966 and outperforming all baseline methods significantly. By introducing a data-driven early-warning framework, our study contributes to more resilient infrastructure planning and improved risk governance mechanisms in the context of transnational cooperation initiatives.
1. Introduction
1.1. Background and Motivation
In an era of sluggish global economic recovery, enhanced regional cooperation has become both a major driver of economic growth and a defining trend. Launched by China in 2013, the Belt and Road Initiative (BRI) stands as a monumental undertaking designed to bolster this trend by prioritizing infrastructure connectivity and trade facilitation. Nonetheless, the implementation of BRI projects is fraught with considerable challenges. Specifically, many participating countries hold strategic importance, either due to critical resource endowments or their location along important trade corridors. This position exposes projects to complex external risks, including political instability, economic fluctuations, and intricate social dynamics [1]. In addition, the absence of a systematic method to anticipate and quantify these threats creates significant uncertainty. Against this backdrop, the development of a scientifically rigorous framework for risk assessment and prediction is not merely beneficial but imperative to safeguard the long-term sustainability and success of BRI major projects.
1.2. Literature Review
1.2.1. Risk Assessment and Prediction in BRI Major Projects
Despite a growing body of research on the external risks associated with BRI major projects, the existing literature exhibits critical limitations in addressing the unique complexities of these cross-border undertakings. Early investigations were primarily focused on risk identification and static assessment, typically adopting an investment-oriented approach. This is exemplified by the use of risk checklists to identify dominant project risks in BRI economies [2], and the development of comprehensive indicator systems to assess and rank investment risks across nations using methods like entropy-weighted models and Technique for Order Preference by Similarity to Ideal Solution (TOPSIS) [3,4,5,6]. While valuable for initial feasibility assessments, this investor-focused approach overlooks other crucial risks that emerge across the entire project lifecycle. Furthermore, this narrow focus often fails to capture salient, non-financial risks, such as long-term environmental sustainability and cross-cultural management challenges, which are particularly acute in the BRI’s complex transnational contexts. More recent research has advanced beyond static evaluation to capture the temporal and relational nature of these risks by constructing a dynamic risk monitoring system [7] and quantifying risk correlations, as well as building association networks [8]. These approaches remain fundamentally descriptive rather than predictive in nature. They excel at interpreting existing risk structures and correlations, but offer limited capacity for forecasting future threats—a crucial element for proactive strategic planning. Therefore, a mature and widely accepted external risk prediction framework tailored explicitly to the interconnected realities of international engineering projects in BRI countries remains a significant research gap.
1.2.2. Methodological Limitations of Traditional Risk Prediction Approaches
Research on BRI major projects remains relatively limited in the context of risk prediction, as opposed to risk identification. A survey of existing studies in project evaluation and forecasting within related domains shows that current methodologies remain heavily dependent on conventional quantitative and qualitative techniques. Approaches such as the Analytic Hierarchy Process (AHP), expert scoring, and fuzzy comprehensive evaluation are widely used for risk assessment and the development of early-warning systems. For example, Chen et al. utilized the ANP to determine early-warning indicator weights, subsequently constructing a gray-fuzzy evaluation matrix to calculate risk thresholds through fuzzy comprehensive evaluation [9]. Gacu et al. applied the AHP method to assess the vulnerability of buildings in Odiongan, Romblon [10]. Zhang et al. applied TOPSIS to high-speed rail safety assessment to enhance engineering assessment accuracy [11]. Liu implemented AHP for objective and precise project risk classification [12]. While valuable for structured problems with clear causal links, these traditional methods exhibit fundamental limitations when faced with the BRI’s dynamic risk environment [13,14]. Their weaknesses include a significant dependence on expert judgment, which introduces subjectivity and limits adaptability to rapidly evolving geopolitical and economic conditions. Moreover, they frequently assume linear relationships among risk factors, thereby failing to capture the complex nonlinear interactions and cascading effects that can occur where minor concurrent events may precipitate a major crisis. Collectively, these limitations undermine their predictive accuracy and restrict their practical utility in real-world early-warning systems.
1.2.3. Advantage of Machine Learning for Risk Prediction
To overcome the constraints of traditional methods, this study utilizes machine learning (ML), which offers distinct advantages for modeling complex, data-rich environments, such as the BRI [15]. The application of ML is justified by several key strengths, including High-dimensional data processing: Traditional methods often struggle to effectively incorporate a large number of variables, requiring manual feature selection to avoid issues such as multicollinearity. In contrast, ML algorithms, through automated feature engineering and selection processes, can effectively integrate heterogeneous multidimensional data (economic, political, social), overcoming the limitations of traditional methods’ reliance on indicator quantity [16]. Nonlinear relationship modeling: Chen and Guestrin pioneered the Extreme Gradient Boosting (XGBoost) algorithm, demonstrating exceptional speed, robustness, and accuracy [17]. Enhanced predictive performance: Numerous comparative studies have shown ML models outperforming traditional statistical methods in risk prediction tasks across various domains, from financial credit scoring to project management [18,19]. The ordered constraint Apriori-RF methodology was introduced by Ding et al. for predicting metro accident hazard levels during operations [20]. XGBoost demonstrated the highest predictive accuracy for C-S parameters among four tested ML algorithms (Decision Tree, Random Forest, Gradient Boosting, XGBoost) in Ahmed et al.’s 2025 study, achieving minimal error rates using published data [21]. Dynamic Adaptability in a Changing Environment: The external risks associated with the BRI are highly dynamic. Geopolitical alliances shift, and economic policies change, rendering static models obsolete. Methodologies like online learning and rolling forecasting enable real-time risk assessment updates [22]. This enables a real-time risk assessment capability that is difficult to achieve with traditional models, which often require complete recalibration and retraining.
Integrating machine learning into BRI national risk early-warning systems transcends traditional methodological constraints, delivering scientifically precise foundations for major project investment decisions.
1.2.4. Research Gap
This review clarifies the positioning of our study within the existing scholarship. While previous research has made substantial contributions to identifying and statistically assessing risks in the BRI context, and some studies have begun exploring dynamic monitoring, the literature remains largely focused on evaluation rather than prediction. A notable gap identified in the literature is the lack of an integrated, data-driven, and predictive risk assessment framework that can leverage contemporary machine learning methods to address the complex and multifaceted external risks associated with BRI major projects. Previous studies have either cataloged risks qualitatively or applied traditional quantitative methods with limited predictive capability. Building upon all these insights, this study seeks to develop and validate a specialized ensemble ML model for enhanced risk prediction in the BRI context, so as to fill that gap.
1.3. Research Objectives
The primary objectives of this research are as follows:
- (1)
- To construct a comprehensive and specialized indicator system for quantifying external risks in the unique context of BRI major projects.
- (2)
- To establish an objective weighting framework using the entropy-weighted TOPSIS method to assign weights to risk indicators and calculate composite risk scores, which provides a quantifiable and data-driven foundation for risk assessment.
- (3)
- To develop and validate a stacking ensemble learning model that integrates multiple base ML algorithms (e.g., Ridge Regression, XGBoost, GBRT, RF) to deliver stronger predictive performance than individual models or traditional approaches or techniques.
- (4)
- To provide a data-driven decision-support tool that can enhance risk early-warning capabilities and inform strategic policy-making for ensuring the sustainable implementation of BRI major projects.
Positioned within the existing literature, this study does not merely replicate existing risk analysis methods. More importantly, it attempts to advance them. While previous research has extensively documented the types of risks facing the BRI, few studies have developed a dedicated and empirically grounded predictive framework for these risks. Our work bridges this gap by transitioning from descriptive risk identification to prescriptive risk prediction. It introduces a novel application of ensemble machine learning to transnational infrastructure risk governance, while offering innovative methodological support for early warning and risk mitigation in BRI partner countries.
2. Materials and Methods
2.1. Constructing the External Risk Indicator System for BRI Major Projects
An effective external risk indicator system for BRI major projects must comprehensively capture risk exposure levels across participating nations to inform targeted mitigation strategies. Based on an extensive literature review and synthesis, this study identifies risk factors across four dimensions, with particular attention to risks arising from the BRI’s emphasis on cross-continental connectivity, varying development levels among partner countries, and commitments to sustainable development.
At the political risk level, BRI implementation involves numerous transnational mega-projects. These initiatives are deeply intertwined with host nations’ policies, legal frameworks, and socio-political environments, rendering them politically sensitive. Political transitions, regulatory adjustments, social instability, and geopolitical realignments may adversely impact project execution.
At the economic risk level, most Belt and Road countries constitute developing economies characterized by fragile economic foundations, mono-industrial structures, underdeveloped financial markets, and volatile economic policies. Such disparities pose challenges to achieving balanced and mutually beneficial economic cooperation, directly affecting the feasibility and sustainability of BRI projects.
At the socio-cultural risk level, the initiative spans diverse geographical regions where heterogeneous socio-cultural environments create soft barriers due to divergent cultural, religious, and customary practices, hindering project integration and local acceptance. These differences highlight the need for culturally adaptive management strategies to support the BRI’s overarching goal of fostering people-to-people connectivity and inclusive development.
At the legal and environmental risk level, projects face legal challenges, including jurisdictional disparities and evolving compliance requirements, particularly in light of the BRI’s stated commitment to sustainable and environmentally friendly projects. Environmental threats, including natural disasters, ecological constraints, and resource scarcity, further exacerbate these risks, potentially jeopardizing the project’s long-term viability and its alignment with international environmental standards.
These mutually reinforcing risks create multifaceted obstacles throughout project lifecycles. The risk prediction indicator system needs to fully reflect the severity of external risks for BRI major projects while also providing training data for future risk early-warning models. Consequently, selected indicators require both representativeness and measurability to reflect external risks comprehensively. Selected based on the principles of comprehensiveness, timeliness, measurability, and sensitivity, the indicators aim to capture risks in a manner that aligns with the strategic priorities and operational realities of the BRI. Table 1 presents the finalized external risk indicator system for major BRI major projects.

Table 1.
BRI Major Project External Risk Indicator System.
2.2. Data Sources and Preprocessing
This study integrated cross-sectional panel data (2013–2022) from authoritative sources, including the World Bank and the Worldwide Governance Indicators (WGI), covering 155 BRI partner countries. To preserve structural integrity in these complex datasets, missing values were addressed through k-nearest neighbors (KNN) imputation [23]. This technique estimates missing entries by identifying patterns in the K most similar complete cases, thereby significantly enhancing analytical reliability [24].
2.3. Calculation of External Risk Scores for BRI Major Projects
The Entropy Weight-TOPSIS method combines two established techniques: the Entropy Weight Method and TOPSIS [25]. This hybrid approach first uses entropy weighting to calculate objective indicator weights, then applies TOPSIS to rank alternative solutions. By combining these methods, it addresses limitations of using entropy weighting alone (which struggles with result ranking) while reducing the subjectivity concerns of standalone TOPSIS applications. As validated by Chauhan et al. (2017), this integration significantly improves both the objectivity of data processing and comparability across different cases [26]. The procedure for calculating the risk scores of BRI major projects through the entropy-weighted TOPSIS framework is illustrated in Figure 1.
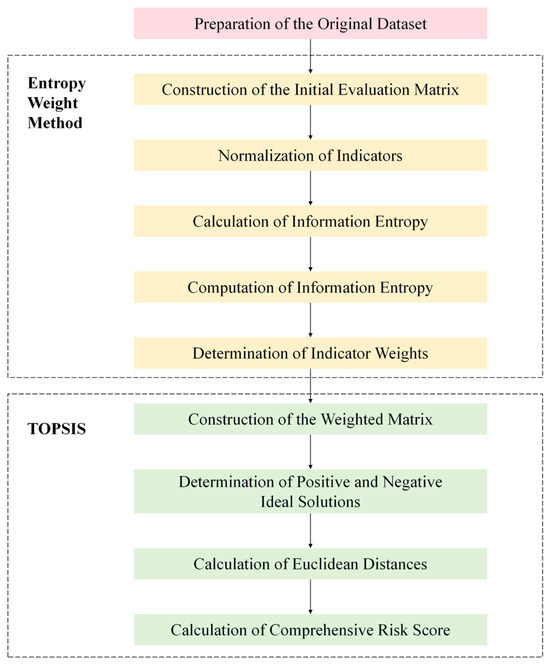
Figure 1.
Procedure for calculating risk scores using the entropy-weighted TOPSIS method.
2.4. Screening Key Risk Indicators
Employing a data-driven feature selection strategy, this study first constructs an indicator correlation matrix by calculating the Pearson correlation coefficients between each risk indicator and the comprehensive risk score. The field of international engineering risk assessment currently lacks a consensus on a screening threshold for risk indicators. Therefore, while guided by the common statistical practice of using |r| > 0.3 to denote a significant relationship, we adopted a more conservative cutoff of 0.35 [27,28]. This approach was designed to exclude variables with only marginal statistical significance, thereby enhancing model parsimony and robustness against overfitting. A threshold-based screening strategy is applied, retaining indicators with absolute correlation coefficients exceeding 0.35 (p < 0.01). The correlation coefficients between individual risk indicators and the comprehensive score are presented in Figure 2.
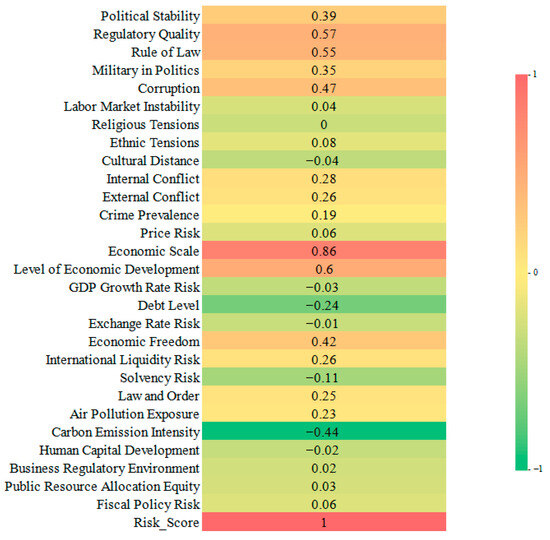
Figure 2.
Correlation coefficients between risk factors and the comprehensive risk score.
As illustrated in Figure 2, nine risk indicators exhibit absolute correlation coefficients with the risk score greater than 0.35. These key indicators are: “Political Stability”, “Regulatory Quality”, “Rule of Law”, “Military in Politics”, “Corruption”, “Economic Scale”, “Level of Economic Development”, “Economic Freedom”, and “Carbon Emission Intensity”. Consequently, these nine risk factors exert the most significant influence on the overall risk assessment.
2.5. PCA for Dimensionality Reduction
To further mitigate potential multicollinearity effects, Principal Component Analysis (PCA) is performed on the screened indicators. The resulting principal components from the dimensionality reduction process are subsequently used as input features for the downstream machine learning prediction models (Table 2).

Table 2.
Principal Component Loading Matrix.
3. Model Selection and Construction
The processed dataset was partitioned chronologically, with the first 80% of the temporal data allocated as the training set and the remaining 20% as the test set. Using the principal components derived from PCA dimensionality reduction as input variables and the comprehensive risk score as the output variable, six machine learning prediction models were constructed.
3.1. Stacked Ensemble Classifier
The ensemble classifier optimizes the model performance by fusing the prediction results of multiple base learners. Its prediction performance is significantly better than that of a single classifier and has been successfully employed across diverse classification tasks [29]. The ensemble model can be divided into three categories: Bagging, Boosting, and Stacking. The Bagging algorithm utilizes bootstrap sampling to generate multiple sets of data subsets, which are independently trained using base learners, and achieves prediction integration through voting or averaging [30]. The Boosting algorithm gradually approaches the optimal classification boundary by iteratively adjusting the sample weights and the model’s weighted combination [31]. Unlike the first two, Stacking employs a hierarchical architecture. The first layer trains heterogeneous base classifiers through k-fold cross-validation to reduce the risk of overfitting [32]. In contrast, the second layer uses the base classifiers’ outputs as meta-features to train a meta-classifier [33]. By leveraging feature extraction from base classifiers and decision optimization via the meta-classifier, Stacking demonstrates strong robustness in complex prediction scenarios [34,35].
3.2. Introduction of Each Classifier
The selection of appropriate base classifiers and a meta-classifier is critical for the performance of a stacked ensemble model. To ensure the prediction performance and generalization ability of the stacked model, this study selected five classification models, including Ridge regression (Ridge), XGBoost, Random Forest (RF), Support Vector Regression (SVR), and Gradient Boosting Regression Trees (GBRT).
Allahbakhshian-Farsani et al. conducted a comparison of various Machine Learning models against Nonlinear Regression. The findings revealed that the SVR model, based on the Radial Basis Function kernel, was identified as optimal for estimating design floods across various return periods [36]. Ridge Regression is included as a high-performance regularized linear baseline, crucial for determining whether the problem necessitates more complex nonlinear models. Çiftçioğlu et al. demonstrated through their study of TBM surrounding rock that RF and SVM outperform Extra Trees (ET), Gaussian Naive Bayes (GNB), and KNN in classification prediction [37]. RF constructs multiple decision trees through double randomness and integrates them with a voting mechanism, which effectively suppresses overfitting and enhances generalization ability. SVM transforms low-dimensional, linearly inseparable data into a separable problem in a high-dimensional space, based on structural risk minimization and kernel function mapping. According to Javaid et al., XGBoost outperforms Light Gradient Boosting and GBDT in classification tasks [38]. XGBoost mitigates overfitting in high-dimensional features by incorporating a regularization term and a tree structure complexity penalty mechanism. Chen et al. validated the ridge-based stacking model through SO2 concentration predictions, demonstrating that it outperforms other models on key evaluation metrics and achieves optimal results [39]. GBRT has strong applicability in the multi-feature combination of data, processing missing data, and solving model overfitting, and has been widely used in solving many practical engineering problems.
This suite of models enables a comprehensive evaluation, ranging from simple, regularized linear models to sophisticated, high-performing ensembles, thereby assessing the predictive potential for BRI external risk.
- Ridge Regression Model
Ridge is fundamentally a refinement of the ordinary least squares (OLS) estimation method. This algorithm sacrifices the unbiasedness inherent in OLS estimation to achieve enhanced robustness against overfitting. By introducing a regularization penalty, it yields regression coefficients that are often more reliable and better aligned with practical expectations than those obtained via standard least squares [40]. The principle of ridge regression can be described by an optimization objective function that minimizes the sum of the weighted residual sum of squares and an L2-norm penalty term on the coefficient vector [41].
- 2.
- XGBoost Model
XGBoost extends the Gradient Boosting Decision Tree (GBDT) framework by incorporating regularization terms into its loss function to control model complexity and prevent overfitting. The algorithm also utilizes second-order Taylor approximations for faster convergence, enhanced optimization precision, and improved performance. Empirical studies consistently demonstrate XGBoost’s advantages in predictive accuracy, resistance to overfitting, scalability, and efficient processing of high-dimensional data [42].
- 3.
- Random Forest Algorithm
Initially developed by Leo Breiman’s team, RF employs ensemble learning to deliver exceptional predictive accuracy with minimal error rates while naturally resisting overfitting [43]. By combining predictions from multiple weakly correlated decision trees through bootstrap aggregation (bagging), RF produces robust outputs for both classification and regression tasks. Now established as a foundational method through decades of scientific validation, RF maintains critical importance across research domains due to its consistent reliability in machine learning workflows.
- 4.
- Support Vector Regression Model
Support Vector Regression (SVR), developed from Vapnik’s statistical learning theory, provides a practical framework for nonlinear regression [44]. By nonlinearly mapping input vectors into high-dimensional feature spaces, SVR solves constrained optimization problems to identify optimal estimation functions—even with limited training data. This approach maximizes generalization capacity, delivering robust prediction accuracy, particularly valuable for small-sample applications.
- 5.
- Gradient Boosting Regression Trees
GBRT sequentially constructs simple regression trees, where each subsequent tree predicts the residual errors (i.e., the differences between predicted and actual values) of the preceding ensemble [45].
- 6.
- Stacking Ensemble Model
Stacking employs layered ensemble learning where the base model’s outputs become input features for a meta-model. This meta-learner intelligently synthesizes base predictions to capture intricate data relationships, enhancing overall predictive capability [46].
This study combines Ridge Regression, SVR, RF, XGBoost, and GBRT as base learners, with XGBoost serving as the meta-learner (Figure 3). This architecture efficiently consolidates meta-features to make precise final predictions [47]. The Stacking implementation comprises:
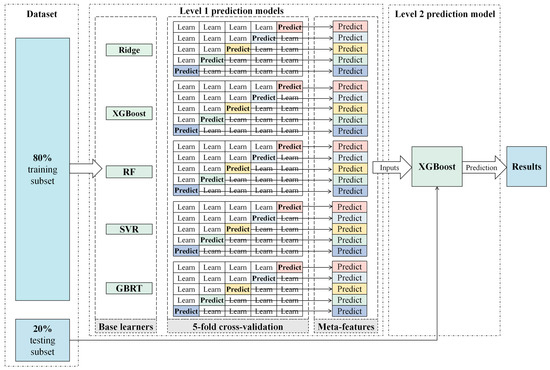
Figure 3.
Stacking Model Architecture.
Step 1: Data Partitioning and Hyperparameter Tuning. We divided the dataset into 80% training and 20% testing subsets. Using 5-fold cross-validation (where the training is split into five equal parts), we fine-tuned the hyperparameters of all base learners via grid search to optimize their individual performance.
Step 2: Cross-Validation Procedure. In each cross-validation fold, base learners were trained on four subsets (aggregating 80% of the training data) and validated on the remaining independent subset (20%). This procedure cycled through all five data partitions, ensuring every subset served exactly once as the validation set. After completing K = 5 full iterations, all base learners underwent a comprehensive evaluation across the entire training dataset.
Step 3: Meta-Feature Engineering. To generate meta-features, out-of-fold predictions from all K cross-validation rounds of each base learner were concatenated into the training meta-feature matrix. For the test set, all base learners underwent retraining on the complete training dataset before prediction, with their outputs aggregated to form the test meta-feature matrix.
Step 4: Stacked Model Integration. The XGBoost meta-learner was trained on the training meta-feature matrix as input features, with the original training labels serving as target variables. This integration produced the final stacked ensemble model, which leverages the optimized meta-learner to strategically combine the diverse predictive strengths of all base learners through learned weighting mechanisms.
4. Model Prediction Results and Evaluation
4.1. Hyperparameter Tuning
Given the presence of manually adjustable hyperparameters in the models, we employed grid search to optimize hyperparameter configurations for each model. This method systematically explores a predefined hyperparameter space through exhaustive combinatorial evaluation. Each hyperparameter combination is iteratively assessed by training the model and evaluating its performance, ultimately identifying the optimal configuration that maximizes model performance. This approach guarantees identification of the optimal solution within the defined search space through systematic enumeration.
The optimized hyperparameter combinations for all models are presented in Table 3.

Table 3.
Optimized Hyperparameter Configurations.
4.2. Prediction Results
The comparative performance of all optimized models against actual values is presented in Figure 4, Figure 5, Figure 6, Figure 7, Figure 8 and Figure 9.
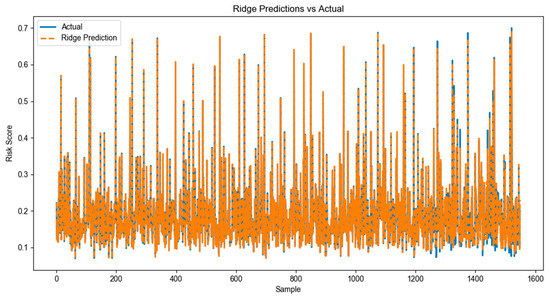
Figure 4.
Comparative analysis of Ridge model prediction with real results.
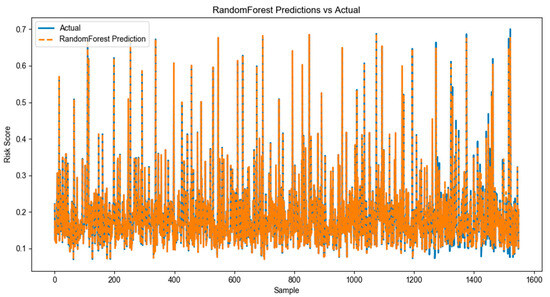
Figure 5.
Comparative analysis of RF model prediction with real results.
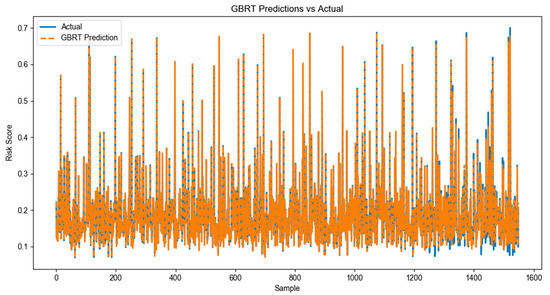
Figure 6.
Comparative analysis of GBRT model prediction with real results.
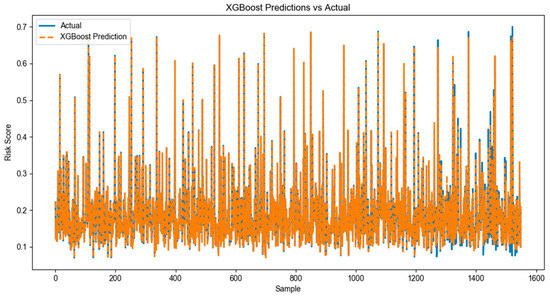
Figure 7.
Comparative analysis of XGBoost model prediction with real results.
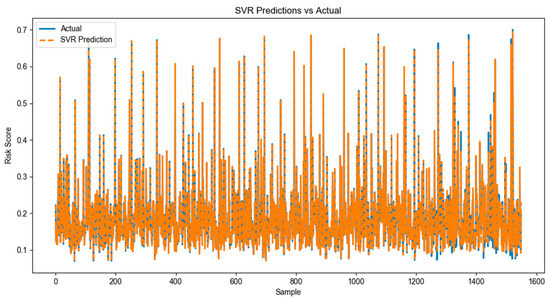
Figure 8.
Comparative analysis of SVR model prediction with real results.
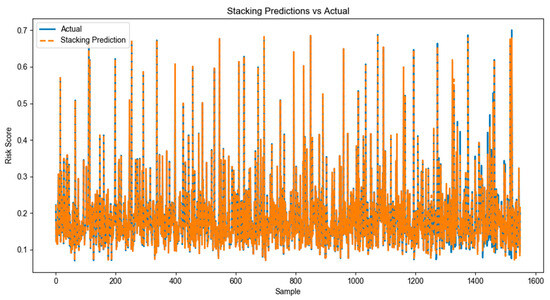
Figure 9.
Comparative analysis of the Stacking model prediction with real results.
4.3. Model Evaluation
Evaluating machine learning model performance is essential for assessing predictive effectiveness and identifying optimal algorithms for deployment. This study employs a comprehensive suite of established classification metrics—MSE, RMSE, R2—to evaluate model performance holistically. The quantitative evaluation metrics for all models are summarized in Table 4.

Table 4.
Comparative Model Performance Metrics.
The Stacking model yields the smallest MSE and RMSE (0.00034 and 0.01857, respectively), indicating the lowest prediction error among all models and thus the highest predictive accuracy. Furthermore, the Stacking model achieves the highest R2 value (0.96597), which is close to 1. This underscores its strongest explanatory power for national external risk data and the optimal fitting performance.
Given its robust performance across all metrics and strong alignment with practical requirements, the Stacking model emerges as the optimal solution in this study, providing a reliable foundation for subsequent risk assessment applications.
4.4. Robustness Checks
To validate the reliability and stability of our findings, particularly the superior performance of the Stacking ensemble model, we conducted a series of robustness checks.
4.4.1. Sensitivity Analysis to Data Partitioning
To further assess the robustness of our findings, we conducted a sensitivity analysis on the data partitioning ratio. The primary objective was to ensure that the superior predictive performance of the stacked ensemble model is not an artifact of the specific 80/20 train-test split used in our primary analysis. By systematically increasing or reducing the proportion of training data, we can evaluate the model’s stability. Comparing results across 70/30, 75/25, and 85/15 training–test splits reveals that the stacked ensemble model consistently and significantly outperforms the best base model across all partitioning schemes. This result indicates that the superiority of the stacking framework is robust and not contingent on a specific data partitioning choice. The model retains its predictive edge even when trained on a reduced dataset, which further solidifies the reliability and generalizability of our conclusions.
4.4.2. Model Configuration Robustness
To further ensure the reliability of our best-performing base model, we conducted a sensitivity analysis on its key hyperparameters. The objective was to verify that the model’s performance is not a fragile artifact of the hyperparameter tuning process but rather is stable within a reasonable range of its optimal parameter values. Specifically, we examined the model’s sensitivity to variations in the Alpha.
As illustrated in Figure 10, there are no sharp drops or erratic fluctuations in performance, which indicates that our hyperparameter optimization has identified a reliable and stable model configuration. This robustness further strengthens the validity of using Ridge as a strong baseline in our study.
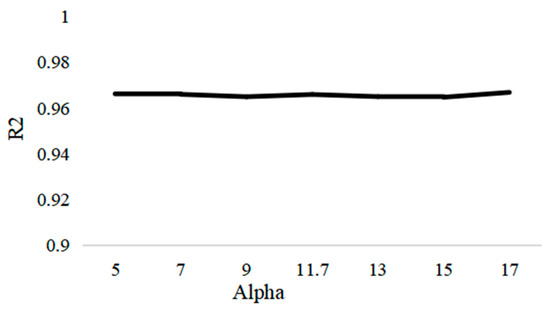
Figure 10.
Sensitivity Analysis of Ridge Model Hyperparameters.
4.4.3. Sensitivity Analysis
To further verify the rationality of the selected thresholds and the robustness of the screening results, a sensitivity analysis was conducted in this study. We compare the screening results of key metrics and their impact on the final model performance under three different correlation thresholds: loose (0.3), benchmark (0.35), and strict (0.4). The analysis results are presented in Table 5.

Table 5.
Sensitivity analysis results at different screening thresholds.
As shown in Table 5, the set of nine key indicators remains consistent when the screening threshold is increased from 0.30 to 0.35, indicating that the selected core indicators are not sensitive to minor variations in the threshold value. This consistency stems from the clear separation in correlation strength between included and excluded variables: the ninth selected indicator has an absolute correlation coefficient of 0.35. At the same time, the next candidate exhibits a value of only 0.28. Thus, any threshold within the [0.28, 0.35] range produces identical results. Expanding the threshold to 0.30 introduces no additional indicators, confirming that the 0.35 criterion did not omit any relevant variables. Conversely, raising the threshold to 0.40 excludes two politically relevant indicators, Political Stability and Military in Politics, leading to a decline in model performance and underscoring their importance. In summary, the sensitivity analysis demonstrates that the selected nine indicators form a robust core set, and the core findings of this study exhibit strong robustness to minor variations in the screening criteria.
4.4.4. Model Validation and Robustness Check
The final model achieved a coefficient of determination (R2) of 0.9659, reflecting its capacity to capture the majority of variance in the target variable. Although the application of such models to BRI prediction is nascent, high R2 values are not uncommon in other domains where stacked ensembles have been successfully implemented. For example, Routhu et al. reported an R2 of 0.9687 in the prediction of air quality index (AQI) values and levels with a comparable framework, and Tanveer achieved 0.9762 in uniaxial compressive strength prediction [48,49]. These precedents support the plausibility of the high explanatory power observed in our study.
To rigorously evaluate the model’s generalization performance and to ensure the high predictive power was not a product of overfitting, a 10-fold cross-validation was implemented. The validation results were exceptionally strong and consistent. The model achieved an average R2 of 0.97543 with a standard deviation of only 0.00204 across the 10 folds (detailed results in Table 6). This outcome serves as powerful evidence for the model’s robustness.

Table 6.
Results of 10-Fold Cross-Validation.
The slight increase in performance compared to the R2 from a single train-test split (0.966) is attributable to the more robust performance estimate. The cross-validation result represents an average performance across 10 different data partitions, which smooths out the randomness of a single train-test split. This provides a more stable and reliable estimate of the model’s true predictive power on unseen data.
Collectively, these robustness checks provide strong evidence that our central finding—the superior predictive accuracy of the Stacking ensemble model for BRI external risk assessment—is reliable and stable.
5. Discussion
5.1. Theoretical Implications of the Predictive Model
In predicting external risks for BRI major projects, this study integrates five base models—RF, XGBoost, Ridge, SVR, and GBRT—chosen for their complementary strengths and theoretical diversity. These models were combined through a stacking ensemble approach to construct a multi-model fusion framework. Experimental comparisons indicate that the stacked model outperforms all individual base models, achieving a minimum MSE of 0.00034, RMSE of 0.01857, and R2 of 0.96597. It provides a robust and data-driven tool for theorizing and navigating the unique risk landscape inherent to the BRI’s strategic goals. Our findings demonstrate that the BRI’s defining features can be modeled as predictable, quantifiable phenomena rather than intractable uncertainties. In addition, by forecasting political disruptions, the model secures the long-term viability of interconnected infrastructure. By systematically deconstructing multifaceted risks into quantifiable components, this research advances the theoretical discourse on BRI risk management. It delivers a tailored analytical framework that translates the Initiative’s strategic objectives into a context-sensitive and empirically grounded decision-support system, which moves beyond generic risk assessment toward predictive governance.
5.2. Comparison with Existing Literature
Our findings both align with and extend the existing body of literature in risk management and machine learning. First and foremost, the superiority of ensemble methods over single models is well established across diverse risk prediction tasks. For instance, studies in financial fraud prediction and forest fire risk prediction have shown that stacking and other ensemble techniques significantly improve prediction accuracy and robustness, to a great extent [50,51]. Our research confirms these conclusions in the novel and complex domain of BRI external risk, which validates the applicability and power of ensemble learning for macro-level geopolitical risk analysis.
Furthermore, our machine learning framework offers distinct advantages over traditional methods frequently applied to BRI risk assessment. Conventional approaches, such as the AHP and fuzzy comprehensive evaluation, often rely on expert judgments, which can bring about subjectivity In some cases, they might be ill-suited to handle the scale and speed of dynamic data [52,53]. In contrast, our data-driven model autonomously learns from vast historical data, providing a more objective, dynamic, and granular risk assessment tool. This is particularly crucial for navigating the rapidly evolving risk landscapes characteristic of many BRI partner countries.
5.3. Limitations and Future Research
This study provides essential groundwork for future research, enabling extensions through strategic improvements in data infrastructure and modeling frameworks. These limitations are primarily centered on data granularity, model interpretability, and dynamic adaptation, which represent key opportunities for subsequent research.
First, the model’s predictive resolution is constrained by its reliance on country-level data. While sufficient for a broad strategic overview, this approach may overlook project-specific vulnerabilities. In this context, it is advisable to incorporate finer-grained data sources, such as micro-level project parameters and sentiment analysis from news reports using Natural Language Processing, and geospatial intelligence from satellite imagery. Together, these inputs could generate a more holistic and timely risk profile
Second, the trade-off between the Stacking model’s high predictive and its limited transparency must be addressed to facilitate practical application. The “black-box” nature of complex ensembles can be a barrier for stakeholders who must justify their decisions. Future research should therefore delve deeper into the integration of explainable AI techniques, such as SHAP or LIME, which helps enhance the transparency and accountability of AI systems. Doing so would not only identify the primary drivers behind risk predictions but also make the model’s reasoning accessible and actionable for end-users.
Last but not least, the current framework operates as a static model, which does not fully account for the fluid risk environment of the BRI. To maintain relevance and accuracy, future iterations should incorporate adaptive capabilities. The implementation of online learning algorithms would enable the model to stay abreast with the latest information, allowing for a shift from periodic assessment to continuous, real-time risk monitoring and providing a much-needed early warning function for stakeholders.
6. Conclusions
6.1. Summary of Findings
In general, this research develops machine learning models for external risk assessment in BRI partner countries, establishing a scientifically robust evaluation methodology. Through a systematic comparison of Ridge Regression, XGBoost, RF, SVR, GBRT, and Stacking ensembles, the stacking model emerged as the optimal performer. These results confirm that ensemble learning excels at identifying complex patterns in multidimensional data analysis. By combining predictions from multiple base models, the stacking approach uncovers diverse features and hidden relationships in BRI risk data in an effective manner, which greatly refines the model’s ability to generalize to new contexts.
6.2. Practical Implications and Policy Recommendations
The findings of this research are of practical value for a range of stakeholders involved in BRI.
At the strategic level, governments and multilateral organizations can utilize this model as a macro-level risk scanning and early warning system. By identifying high-risk nations and highlighting the key drivers of instability, the framework provides a solid and proper empirical basis for informed decision-making. It is important to note that this foresight enables the formulation of more nuanced and country-specific investment strategies and the proactive design of targeted risk mitigation policies, moving beyond generalized risk assessments toward data-informed strategic planning. For project managers and investors on the ground, the model serves a dual purpose across the project lifecycle. During the pre-investment phase, it offers a quantitative tool for assessing the external risks of a potential host country as part of due diligence and feasibility studies. Once a project is underway, it becomes a dynamic monitoring instrument and delivers insights on a continual basis. These insights can guide operational adjustments and robust contingency planning. In the end, the overall project resilience will witness enhancement to a certain extent. In the financial sphere, the model provides a critical advantage for banks, insurers, and other capital providers. By integrating its outputs, these institutions can enrich their conventional credit risk models with a quantitative and forward-looking perspective. Ultimately, this enhancement leads directly to more precise risk pricing and optimized capital allocation for BRI-related financing endeavors.
6.3. Contributions to Sustainable Development
The predictive framework proposed in this study comes with important implications for enhancing the sustainability of BRI major projects, encompassing environmental, social, and economic dimensions. By improving the accuracy of external risk forecasting, the model facilitates the early identification of threats that could compromise the long-term viability of projects and regional sustainable development. For instance, predicting geopolitical instability or social unrest is conducive to proactive community engagement and adaptive planning. This effort helps reduce the risk of conflicts and project delays. From an environmental perspective, anticipating regulatory changes or ecological controversies can help avoid costly disruptions and support compliance with host countries’ sustainability standards. Economically, enhancing risk resilience helps minimize unexpected losses while supporting long-term returns, which contributes to financial sustainability.
Author Contributions
Conceptualization, S.L. and C.W.; methodology, S.L.; software, S.L.; validation, S.L.; formal analysis, S.L.; investigation, S.L.; resources, S.L.; data curation, S.L.; writing—original draft preparation, S.L.; writing—review and editing, S.L.; visualization, S.L.; supervision, C.W.; project administration, C.W.; funding acquisition, C.W. All authors have read and agreed to the published version of the manuscript.
Funding
This research was funded by National Social Science Fund of China, grant number 22&ZD135.
Institutional Review Board Statement
Not applicable.
Informed Consent Statement
Not applicable.
Data Availability Statement
The data that support the findings of this study are available in Zenodo at 10.5281/zenodo.17149104 (accessed on 20 September 2025). These data were derived from the following resources available in the public domain: https://www.worldbank.org/en/publication/worldwide-governance-indicators (accessed on 15 September 2025). https://data.worldbank.org.cn/ (accessed on 15 September 2025). https://databank.worldbank.org/source/global-economic-prospects (accessed on 15 September 2025). https://www.numbeo.com/cost-of-living/ (accessed on 15 September 2025). https://geerthofstede.com/ (accessed on 15 September 2025).
Acknowledgments
The authors sincerely thank the reviewers for their helpful comments and suggestions about our manuscript.
Conflicts of Interest
The authors declare no conflicts of interest.
References
- Hu, Y.N.; Ding, Y.B.; Wang, T.S. Risk identification and countermeasures for PPP projects in Belt and Road countries. Int. Econ. Coop. 2019, 132–140. [Google Scholar]
- Wu, Y.; Wang, J.; Ji, S.; Song, Z. Renewable energy investment risk assessment for nations along China’s Belt & Road Initiative: An ANP-cloud model method. Energy 2020, 190, 116381. [Google Scholar] [CrossRef]
- Duan, F.; Ji, Q.; Liu, B.-Y.; Fan, Y. Energy Investment Risk Assessment for Nations Along China’s Belt & Road Initiative. J. Clean. Prod. 2018, 170, 535–547. [Google Scholar] [CrossRef]
- Dang, L.; Zhao, J. Cultural risk and management strategy for Chinese enterprises’ overseas investment. China Econ. Rev. 2020, 61, 101433. [Google Scholar] [CrossRef]
- Hussain, J.; Zhou, K.; Guo, S.; Khan, A. Investment risk and natural resource potential in ‘Belt & Road Initiative’ countries: A multi-criteria decision-making approach. Sci. Total Environ. 2020, 723, 137981. [Google Scholar]
- Liu, B. Risk analysis and prevention of overseas infrastructure projects under the Belt and Road Initiative. Financ. Account. Transp. 2018, 13–15. [Google Scholar]
- Wang, J.X.; Zhang, H.C.; Xu, S.Y. Research on dynamic risk monitoring index system for overseas projects under the Belt and Road Initiative based on big data. E-Government 2021, 11–19. [Google Scholar] [CrossRef]
- Yao, D.; Zhan, W. Analysis of external risk correlation networks in international engineering contracting projects under the Belt and Road Initiative. Stat. Decis. 2023, 39, 178–182. [Google Scholar] [CrossRef]
- Chen, L.; Ren, J. Multi-attribute sustainability evaluation of alternative aviation fuels based on fuzzy ANP and fuzzy grey relational analysis. J. Air Transp. Manag. 2018, 68, 176–186. [Google Scholar] [CrossRef]
- Gacu, J.; Kantoush, S.; Candelario, R.; Falculan, J.; Moaje, K.V.; Famaran, M.J.; Nepomuceno, M.; Ebon, J.A.; Parungao, R.; Ignacio, R.; et al. Integrated multi-hazard risk assessment under compound disasters using analytical hierarchy process (AHP). Heliyon 2025, 11, e43173. [Google Scholar] [CrossRef]
- Zhang, Z.; Wang, K.; Mao, J.; Yu, Z.; Khan, M.; Wu, J. A TOPSIS-XGBoost evaluation method for train-track-bridge system travelling safety based on probability density evolution theory and machine learning. Structures 2025, 74, 108614. [Google Scholar] [CrossRef]
- Yang, C.; Zheng, X.; Dai, C.; Li, D.; Liu, L.; Fang, L.; Tian, H.; Shao, T.; Zhang, J. Risk Assessment of Coal Supply Chain Based on Analytic Hierarchy Process and Fuzzy Comprehensive Evaluation. Heliyon 2025, 11, e42629. [Google Scholar] [CrossRef]
- Han, D.; Kolli, K.K.; Gransar, H.; Lee, J.H.; Choi, S.-Y.; Chun, E.J.; Han, H.-W.; Park, S.H.; Sung, J.; Jung, H.O.; et al. Machine learning based risk prediction model for asymptomatic individuals who underwent coronary artery calcium score: Comparison with traditional risk prediction approaches. J. Cardiovasc. Comput. Tomogr. 2020, 14, 168–176. [Google Scholar] [CrossRef]
- Altuncan, I.Ü.; Vanhoucke, M. Duration forecasting in resource constrained projects: A hybrid risk model combining complexity indicators with sensitivity measures. Eur. J. Oper. Res. 2025, 325, 329–343. [Google Scholar] [CrossRef]
- Mullainathan, S.; Spiess, J. Machine Learning: An Applied Econometric Approach. J. Econ. Perspect. 2017, 31, 87–106. [Google Scholar] [CrossRef]
- Zhang, Z.; Chen, Y. Tail Risk Early Warning System for Capital Markets Based on Machine Learning Algorithms. Comput. Econ. 2022, 60, 901–923. [Google Scholar] [CrossRef]
- Chen, T.; Guestrin, C. XGBoost: A Scalable Tree Boosting System. In Proceedings of the 22nd ACM SIGKDD International Conference on Knowledge Discovery and Data Mining, San Francisco, CA, USA, 13–17 August 2016. [Google Scholar] [CrossRef]
- Hanafy, N.O. An extensive examination of uses of machine learning and artificial intelligence in the construction industry’s project life cycle. Energy Build. 2025, 345, 116094. [Google Scholar] [CrossRef]
- Wahono, T.; Purniawan, A.; Mukhlash, I.; Putri, E.R. Risk-based asset integrity management in the oil and gas industry from traditional to machine learning approaches: A systematic review. Results Eng. 2025, 28, 107287. [Google Scholar] [CrossRef]
- Ding, X.; Wan, H.; Shi, G.; Hong, C.; Liu, Z. Predicting hazard degree levels of metro operation accidents based on ordered constraint Apriori-RF method. Int. J. Transp. Sci. Technol. 2025, 18, 245–260. [Google Scholar] [CrossRef]
- Al-Naghi, A.A.A.; Ahmad, A.; Amin, M.N.; Algassem, O.; Alnawmasi, N. Sustainable Optimisation of GGBS-Based Concrete: De-Risking Mix Design through Predictive Machine Learning Models. Case Stud. Constr. Mater. 2025, 23, e04900. [Google Scholar] [CrossRef]
- Liu, X.; Xu, Z.; He, T.; Xiang, H.; Zhao, J.; Jiao, Y.; Jin, T.; Li, L.; Feng, W.; Yu, Z.; et al. Application of Spatiotemporal Data Prediction Method in Intelligent Monitoring System for Early Warning of Equipment Failure in Power Distribution Room. Procedia Comput. Sci. 2025, 262, 227–235. [Google Scholar] [CrossRef]
- Tutz, G.; Ramzan, S. Improved methods for the imputation of missing data by nearest neighbor methods. Comput. Stat. Data Anal. 2015, 90, 84–99. [Google Scholar] [CrossRef]
- Huang, G.; Yin, F.; He, H.; Zeng, P. Intelligent prediction of lost circulation based on improved k-nearest neighbor and self-attention mechanism-convolutional neural network. Geoenergy Sci. Eng. 2025, 247, 213712. [Google Scholar] [CrossRef]
- Taylan, O.; Bafail, A.O.; Abdulaal, R.M.; Kabli, M.R. Construction projects selection and risk assessment by fuzzy AHP and fuzzy TOPSIS methodologies. Appl. Soft Comput. 2014, 17, 105–116. [Google Scholar] [CrossRef]
- Chauhan, R.; Singh, T.; Tiwari, A.; Patnaik, A.; Thakur, N. Hybrid entropy—TOPSIS approach for energy performance prioritization in a rectangular channel employing impinging air jets. Energy 2017, 134, 360–368. [Google Scholar] [CrossRef]
- Buda, A.; Jarynowski, A. Life Time of Correlations and Its Applications; Andrzej Buda Wydawnictwo NiezaleĹĽne: Wrocław, Poland, 2010. [Google Scholar]
- Jia, J.; He, X.; Jin, Y. Statistics, 7th ed.; China Renmin University Press: Beijing, China, 2018. [Google Scholar]
- Dong, X.; Yu, Z.; Cao, W.; Shi, Y.; Ma, Q. A survey on ensemble learning. Front. Comput. Sci. 2020, 14, 241–258. [Google Scholar] [CrossRef]
- Breiman, L. Bagging predictors. Mach. Learn. 1996, 24, 123–140. [Google Scholar] [CrossRef]
- Freund, Y.; Schapire, R.E. Experiments with a new boosting algorithm. In Proceedings of the 13th International Conference on Machine Learning (ICML’96), Bari, Italy, 3–6 July 1996; pp. 148–156. [Google Scholar]
- Rodriguez, J.D.; Perez, A.; Lozano, J.A. Sensitivity analysis of k-fold cross validation in prediction error estimation. IEEE Trans. Pattern Anal. Mach. Intell. 2009, 32, 569–575. [Google Scholar] [CrossRef] [PubMed]
- Cui, S.; Yin, Y.; Wang, D.; Li, Z.; Wang, Y. A stacking-based ensemble learning method for earthquake casualty prediction. Appl. Soft Comput. 2021, 101, 107038. [Google Scholar] [CrossRef]
- Han, S.; Li, Z.; Zhou, Z.; Tan, Z.; Wei, F. Research on real-time prediction method of surrounding rock classification of TBM tunnel based on stacked ensemble classifier. Tunn. Undergr. Space Technol. 2025, 166, 107025. [Google Scholar] [CrossRef]
- Wu, L.; Li, J.; Zhang, J.; Wang, Z.; Tong, J.; Ding, F.; Li, M.; Feng, Y.; Li, H. Prediction model for the compressive strength of rock based on stacking ensemble learning and shapley additive explanations. Bull. Eng. Geol. Environ. 2024, 83, 439. [Google Scholar] [CrossRef]
- Allahbakhshian-Farsani, P.; Vafakhah, M.; Khosravi-Farsani, H.; Hertig, E. Regional flood frequency analysis through some machine learning models in semi-arid regions. Water Resour. Manag. 2020, 34, 2887–2909. [Google Scholar] [CrossRef]
- Çiftçioğlu, A.Ö. RAGN-L: A stacked ensemble learning technique for classification of Fire-Resistant columns. Expert Syst. Appl. 2024, 240, 122491. [Google Scholar]
- Pamir; Javaid, N.; Akbar, M.; Aldegheishem, A.; Alrajeh, N.; Mohammed, E.A. Employing a machine learning boosting classifiers based stacking ensemble model for detecting non technical losses in smart grids. IEEE Access 2022, 10, 121886–121899. [Google Scholar] [CrossRef]
- Chen, Y.; Wang, Q.; Xie, G.; Tian, Z.; Zhang, B.; Yue, J. Sparse Principal Component Analysis and SHAP-based Explainable Framework for SO2 Concentration Prediction: A Multi-Method Stacked Ensemble Model. J. Environ. Chem. Eng. 2025, 13, 118330. [Google Scholar] [CrossRef]
- Marquardt, D.W.; Snee, R.D. Ridge Regression in Practice. Am. Stat. 1975, 29, 3–20. [Google Scholar] [CrossRef]
- Douak, F.; Melgani, F.; Benoudjit, N. Kernel ridge regression with active learning for wind speed prediction. Appl. Energy 2013, 103, 328–340. [Google Scholar] [CrossRef]
- Han, P.; Liu, Z.; Sun, Z.; Yan, C. A novel prediction model for ship fuel consumption considering shipping data privacy: An XGBoost-IGWO-LSTM-based personalized federated learning approach. Ocean Eng. 2024, 302, 117668. [Google Scholar] [CrossRef]
- Leo, B. Random forests. Mach. Learn. 2001, 45, 5–23. [Google Scholar] [PubMed]
- Vapnik, V.N. The Nature of Statistical Learning Theory; Springer: New York, NY, USA, 1995. [Google Scholar] [CrossRef]
- Friedman, J.H. Greedy Function Approximation: A Gradient Boosting Machine. Ann. Stat. 2001, 29, 1189–1232. [Google Scholar] [CrossRef]
- Ren, X.; Tian, X.; Wang, K.; Yang, S.; Chen, W.; Wang, J. Enhanced load forecasting for distributed multi-energy system: A stacking ensemble learning method with deep reinforcement learning and model fusion. Energy 2025, 319, 135031. [Google Scholar] [CrossRef]
- Wang, T.; Zhang, K.; Liu, Z.; Ma, T.; Luo, R.; Chen, H.; Wang, X.; Ge, W.; Sun, H. Prediction and explanation of debris flow velocity based on multi-strategy fusion Stacking ensemble learning model. J. Hydrol. 2024, 638, 131347. [Google Scholar] [CrossRef]
- Rao, R.S.; Kalabarige, L.R.; Alankar, B.; Sahu, A.K. Multimodal imputation-based stacked ensemble for prediction and classification of air quality index in Indian cities. Comput. Electr. Eng. 2024, 114, 109098. [Google Scholar] [CrossRef]
- Munshi, T.A.; Popi, K.; Jahan, L.N.; Howladar, M.F.; Hashan, M. Stacking modeling with genetic algorithm-based hyperparameter tuning for uniaxial compressive strength prediction. Appl. Comput. Geosci. 2025, 27, 100276. [Google Scholar] [CrossRef]
- Zhu, S.; Wu, H.; Ngai, E.W.T.; Ren, J.; He, D.; Ma, T.; Li, Y. A Financial Fraud Prediction Framework Based on Stacking Ensemble Learning. Systems 2024, 12, 588. [Google Scholar] [CrossRef]
- Li, Y.; Li, G.; Wang, K.; Wang, Z.; Chen, Y. Forest fire risk prediction based on stacking ensemble learning for Yunnan Province of China. Fire 2023, 7, 13. [Google Scholar] [CrossRef]
- Hua, Z.; Jing, X.; Martínez, L. Consensus reaching for social network group decision making with ELICIT information: A perspective from the complex network. Inf. Sci. 2023, 627, 71–96. [Google Scholar] [CrossRef]
- Cui, H.; Dong, S.; Hu, J.; Chen, M.; Hou, B.; Zhang, J.; Zhang, B.; Xian, J.; Chen, F. A hybrid MCDM model with Monte Carlo simulation to improve decision-making stability and reliability. Inf. Sci. 2023, 647, 119439. [Google Scholar] [CrossRef]
Disclaimer/Publisher’s Note: The statements, opinions and data contained in all publications are solely those of the individual author(s) and contributor(s) and not of MDPI and/or the editor(s). MDPI and/or the editor(s) disclaim responsibility for any injury to people or property resulting from any ideas, methods, instructions or products referred to in the content. |
© 2025 by the authors. Licensee MDPI, Basel, Switzerland. This article is an open access article distributed under the terms and conditions of the Creative Commons Attribution (CC BY) license (https://creativecommons.org/licenses/by/4.0/).