Article

Analysis of Carbon Emissions and Carbon Reduction Benefits of Green Hydrogen and Its Derivatives Based on the Full Life Cycle

1
CGN Wind Power Company Limited, Beijing 100071, China
2
School of Economics and Management, China University of Geosciences Beijing, Beijing 100083, China
3
Key Laboratory of Carrying Capacity Assessment for Resource and Environment, Ministry of Natural Resoures, Beijing 100083, China
*
Authors to whom correspondence should be addressed.
Sustainability 2025, 17(20), 9077; https://doi.org/10.3390/su17209077 (registering DOI)
Submission received: 4 September 2025 / Revised: 26 September 2025 / Accepted: 8 October 2025 / Published: 13 October 2025

Abstract

Under the constraints of the “dual carbon” goals, accurately depicting the full life cycle carbon footprint of green hydrogen and its derivatives and quantifying the potential for emission reduction is a prerequisite for hydrogen energy policy and investment decisions. This paper constructs a unified life cycle model, covering the entire process from “wind and solar power generation–electrolysis of water to producing hydrogen-synthesis of methanol/ammonia-terminal transportation”, and includes the manufacturing stage of key front-end equipment and the negative carbon effect of CO2 capture within a single system boundary, and also presents an empirical analysis. The results show that the full life cycle carbon emissions of wind power hydrogen production and photovoltaic hydrogen production are 1.43 kgCO2/kgH2 and 3.17 kgCO2/kgH2, respectively, both lower than the 4.9 kg threshold for renewable hydrogen in China. Green hydrogen synthesis of methanol achieves a net negative emission of −0.83 kgCO2/kgCH3OH, and the emission of green hydrogen synthesis of ammonia is 0.57 kgCO2/kgNH3. At the same time, it is predicted that green hydrogen, green ammonia, and green methanol can contribute approximately 1766, 66.62, and 30 million tons of CO2 emission reduction, respectively, by 2060, providing a quantitative basis for the large-scale layout and policy formulation of the hydrogen energy industry.

1. Introduction

With the acceleration of the industrialization process, the extensive reliance of human activities on fossil fuels has given rise to a multitude of severe environmental and resource challenges [1,2]. The over-exploitation and excessive consumption of fossil fuels not only result in the progressive exhaustion of finite resources but also precipitate a series of ecological crises, including global warming, which seriously imperils human survival and development [3,4,5]. In this context, combating climate change and fostering sustainable development have emerged as a global consensus. Nations around the world are actively formulating and implementing sustainable development blueprints to seek effective approaches that enable the coordinated advancement of economic development and environmental conservation [6,7].
Hydrogen energy, as a highly promising secondary energy carrier, plays a crucial role in the energy transition due to its unique physical and chemical properties. It effectively connects renewable energy sources with end-use sectors, providing key support for the efficient conversion and utilization of energy [8]. In recent years, with the continuous development of renewable energy technologies, “green hydrogen” produced through electrolysis of water using renewable electricity such as wind and solar power has gradually emerged. As shown in Figure 1, green hydrogen achieves nearly zero carbon emissions throughout its entire life cycle. This significant advantage makes it a key path for deep decarbonization in high-carbon emission industries such as power, chemical, transportation, and construction, providing strong support for achieving global emission reduction targets and opening up new directions for the optimization and sustainable development of future energy structures.
As shown in Figure 1, green hydrogen can be widely applied in high-carbon-emission sectors such as power, industry, construction, and transportation through direct use or via the production of ammonia, methanol, etc., thereby significantly reducing carbon emissions. However, the “green” attribute of green hydrogen and its derivatives (such as ammonia and methanol) is not inherently guaranteed. Throughout the entire life cycle of equipment such as wind turbines, photovoltaic modules, electrolyzers, and synthesis units, there are still substantial hidden carbon emissions. Moreover, factors such as the carbon intensity of renewable electricity, process configuration, and transportation distance all have a significant impact on the final carbon footprint of green hydrogen and its derivatives. Therefore, when all these factors are taken into account, it is worth exploring in-depth whether green hydrogen still retains its “green” attribute. Based on this, this paper proposes the need for a quantitative analysis of the full life cycle carbon emissions of green hydrogen and its derivatives to answer the following key questions:
(1) How much carbon reduction benefit can the green hydrogen route achieve compared to the traditional fossil energy route?
(2) What differences exist in the carbon reduction contribution of green hydrogen produced from different renewable power sources (such as wind power and photovoltaic power)?
(3) Can the carbon emissions in the production, transportation, and other chain links of green hydrogen and its derivatives still maintain their green advantages? What is their specific carbon reduction potential?
To address these key questions, this paper first constructs a unified accounting model covering wind power/photovoltaic power hydrogen production and its derivatives. Based on the latest data from the northwest region of China, which is rich in wind and solar resources, the full life cycle carbon emissions of green hydrogen and its derivatives are calculated, and their carbon reduction benefits are quantified.

2. Literature Review

2.1. Definition of “Green” for Green Hydrogen and Its Derivatives

At present, there is no unified standard for defining the “green” attribute of green hydrogen and its derivatives both domestically and internationally. Different countries and regions have formulated differentiated definition methods based on their own energy structures, technological development levels, and policy goals.

2.1.1. Definition of Green Hydrogen

IRENA, in its “Green Hydrogen Policy-Making Guide 2020”, states that green hydrogen refers to hydrogen produced using renewable energy. The guide believes that water electrolysis technology based on renewable electricity is currently the most mature green hydrogen production technology. Meanwhile, other renewable energy hydrogen production schemes, such as biomass gasification and pyrolysis, thermochemical water splitting, photocatalysis, and biomass supercritical water gasification, also have certain development potentials [9,10]. The European Union has defined the criteria for “renewable hydrogen” through two authorization acts under the Renewable Energy Directive. The first act clearly defines three scenarios that can be counted as “renewable hydrogen”: hydrogen produced by directly connecting renewable energy production facilities with hydrogen production equipment; hydrogen produced using grid power in regions where the proportion of renewable energy exceeds 90%; and hydrogen produced using grid power in regions with low carbon dioxide emission limits after signing a renewable energy power purchase agreement [11,12]. The second act sets a fuel threshold for renewable hydrogen, stipulating that hydrogen with a carbon dioxide equivalent of less than 3.4 kgCO2/kgH2 can be regarded as renewable. Japan has also set a carbon emission intensity threshold of less than 3.4 kgCO2/kgH2 for “low-carbon hydrogen”. The U.S. Department of Energy released the “Clean Hydrogen Production Standard Guide”, which states that the methods for producing “clean hydrogen” include using fossil fuels with carbon capture, utilization, and storage (CCUS) technology, hydrogen carrier fuels (including ethanol and methanol), renewable energy, nuclear energy, etc. The threshold for “clean hydrogen” is that the carbon dioxide-equivalent-produced 1 kg H2 at the production site should not exceed 2 kg, and the carbon dioxide equivalent throughout the life cycle should not exceed 4 kg/kgH2.
In China, the Hydrogen Energy Alliance released the “Standards and Evaluation for Low-Carbon Hydrogen, Clean Hydrogen, and Renewable Hydrogen”, classifying hydrogen based on the carbon emissions per unit of hydrogen. Among them, the threshold for low-carbon hydrogen is 14.51 kgCO2/kgH2, and the threshold for clean hydrogen and renewable hydrogen is 4.9 kgCO2/kgH2. Additionally, renewable hydrogen also requires that the hydrogen production energy must be from renewable energy sources [13].

2.1.2. Definition of Green Methanol

Compared with green hydrogen, the definition of green methanol is more complex. Currently, there is no clear and unified concept internationally. The green attribute of methanol mainly depends on the sources of its synthesis of raw materials, namely hydrogen and carbon dioxide [7]. According to the suggestion of IRENA, methanol can only be recognized as green methanol when both the sources of hydrogen and carbon dioxide are renewable. Specifically, only methanol produced from biomass and direct air capture (DAC) of carbon dioxide meets the definition of green methanol [14]. The EU, in its supplementary regulation to the Renewable Energy Directive (RED II), proposed that in the short term, it would no longer insist that biomass-based methanol and electro-methanol are the only two ways to produce green methanol. Instead, methanol produced from non-renewable CO2 captured in industrial and thermal power scenarios and included in the EU Emissions Trading System would also be recognized as green methanol, but it requires that its full life cycle carbon emissions do not exceed 28.2 gCO2/MJ [15,16].

2.1.3. Definition of Green Ammonia

Regarding the definition of green ammonia, International Renewable Energy Agency (IRENA) and the Ammonia Energy Association (AEA) jointly released the “Innovation Outlook: Renewable Ammonia”, which defines “renewable ammonia” as ammonia produced from hydrogen generated by renewable electricity and nitrogen purified from the air. All raw materials and energy used in the production of renewable ammonia must be renewable, but there is no specific regulation on the carbon dioxide equivalent per unit of green ammonia produced. The International Renewable Hydrogen Coalition updated the green ammonia standard, stipulating that the greenhouse gas emission intensity of green ammonia produced from green hydrogen should not exceed 0.3 kgCO2/kgNH3. Japan’s “Hydrogen Energy Basic Strategy” sets full life cycle carbon emission intensity targets for the production of hydrogen and ammonia, defining “low-carbon ammonia” as ammonia with a production chain (including the hydrogen production process) carbon emission intensity of less than 0.84 kgCO2/kgNH3. Currently, there is no unified definition by official institutions or authoritative organizations in China.

2.2. Carbon Emission Accounting Methods and Scope for Green Hydrogen and Its Derivatives

There are various carbon emission accounting methods, each with its own applicable scenarios and advantages and disadvantages. Common methods include direct measurement, emission factor method, and mass balance method. The direct measurement method involves installing online monitoring equipment to directly measure the gas concentration and flow rate of the emission source and then calculate the carbon emissions. This method has high data accuracy but is costly and is suitable for large, fixed emission sources, such as the chimneys of thermal power plants [17]. The emission factor method calculates emissions based on the formula “activity data × emission factor”, where activity data refers to the amount of activity that generates emissions, such as fuel consumption or product output, and the emission factor is the carbon emissions per unit of activity. This method is simple to operate and has a low cost, making it the most widely used accounting method, and is widely used in enterprise carbon emission reports and national greenhouse gas inventory compilation [18]. The mass balance method, based on the principle of material conservation, calculates the carbon emissions by determining the difference between the input of raw materials and the output of products and by-products in the production process. It is suitable for industrial processes with clear production processes and material flows, such as chemical production [17].
However, for the carbon emission accounting of green hydrogen and its derivatives (such as ammonia, methanol, etc.), considering the complexity of their full life cycle and multi-stage carbon emissions, the life cycle assessment (LCA) method is the most suitable. LCA is a scientific method used to assess the environmental impact of a product or service from cradle to grave, and its calculation scope typically includes key stages such as raw material acquisition, production, transportation, use, and disposal of the product. The advantage of the LCA method is that it can comprehensively reflect the carbon emission impact of a product or service and is often used in green product certification and supply chain carbon management scenarios [19]. In practical applications, the scope of the LCA method can be adjusted according to research purposes and resource constraints. For instance, some studies may focus on the environmental impact of the production stage, while others may pay more attention to the use stage or the waste disposal stage. For green hydrogen and its derivatives, the production process involves multiple steps, including the acquisition of renewable energy, electrolysis of water to produce hydrogen, and the synthesis of ammonia or methanol. The carbon emission characteristics of these steps vary significantly, and the “green” attribute of green hydrogen and its derivatives needs to be evaluated from a full life cycle perspective.

2.3. Current Status of Carbon Emission Calculation for Green Hydrogen and Its Derivatives

Driven by the “carbon neutrality” goal, a large number of domestic and foreign studies have adopted LCA to calculate the carbon footprint of hydrogen and its derivatives such as ammonia and methanol. However, due to the differences in research objects, technical routes, and system boundaries, the existing conclusions are often difficult to compare directly. Through a systematic review of representative studies, the research context can be summarized into the following three aspects.
Firstly, the research object is expanding from “single hydrogen” to “hydrogen-derivative coupling”. Qin Wenli et al. [20] constructed a full life cycle model of the electricity–heat–gas–hydrogen network, but the accounting boundary only reached the “factory gate” of hydrogen; Zheng Lixing et al. [21] compared coal gasification, natural gas reforming, and renewable electrolysis water hydrogen production and found that the renewable route had the lowest carbon emissions, but still stopped at the “hydrogen production” stage. Kleijne et al. [22] for the first time included hydrogen compression, liquefaction, and road transportation in the system boundary based on electrolysis water hydrogen production; Bai Zhang et al. [23] compared hydrogen production from wind and solar power generation with that from coal, providing a quantitative basis for green hydrogen to replace traditional coal-based hydrogen, but still did not involve downstream products such as methanol and ammonia. Overall, studies that place “hydrogen + derivatives” in a unified framework for chain accounting are still lacking.
Secondly, the technical route is evolving from “static parameters” to “dynamic operation”. Most studies set the efficiency of key equipment such as electrolyzers and fuel cells as fixed constants to reduce model complexity [20]; Qian Junjie et al. [24] introduced dynamic efficiency curves to address this deficiency, proving that load fluctuations can cause a 3% to 7% deviation in annual carbon emissions. However, existing dynamic models are still limited to the hydrogen stage, and there is a lack of discussion on the dynamic emissions of derivatives such as methanol and ammonia.
Finally, the system boundary shows “missing at both ends”: one is the absence of the embodied carbon of front-end equipment. Huang Xiaoyu et al. [25] considered the upstream emissions of wind turbines and photovoltaic components but did not include the manufacturing stage of key devices such as electrolyzers, resulting in an underestimation of 10% to 20% of carbon emissions; the other is the absence of back-end storage and transportation and carbon sources. Chu et al. [26] did not include the hydrogen storage and transportation and international trade links when predicting the hydrogen energy reduction potential of Chinese cities in 2060; the energy consumption and negative carbon effects of units such as CO2 capture and air separation required for green methanol and green ammonia are often simplified.
In summary, there are still significant gaps in the current research in the three aspects of “hydrogen-derivative integration, full life cycle, dynamic-negative carbon”: ① There is a lack of unified accounting for the complete chain of wind and solar power generation-electrolysis water hydrogen production-synthesis of methanol/ammonia. ② The embodied carbon emissions of key equipment (wind turbines, photovoltaic components, electrolyzers, etc.) are generally ignored. ③ There is no quantitative comparison of the negative carbon contribution brought by CO2 capture and the emission differences in the storage and transportation stage of derivatives.
Based on this, this paper intends to construct a unified accounting model covering the full life cycle of “wind and solar power generation-electrolysis hydrogen production-methanol/ammonia synthesis-product transportation”, and for the first time include the manufacturing of equipment and the negative carbon effect of CO2 capture in the system boundary, to make up for the deficiencies of existing research and provide a more comprehensive basis for the determination of the green attribute and the assessment of the emission reduction potential of green hydrogen and its derivatives.

3. Models and Data

3.1. Scenario Design for Carbon Emission Accounting of Green Hydrogen and Its Derivatives

3.1.1. Scenario Design for Carbon Emission Accounting of Green Hydrogen

  • Hydrogen Production from Wind Power:
With high annual utilization hours (2500–3500 h on land and over 4000 h at sea) and continuous output capacity at night, wind power can provide relatively stable power input for electrolyzers [27]. This characteristic is highly consistent with the requirement of continuous operation of an alkaline electrolyzer (ALK), which can significantly reduce the start–stop loss of equipment and prolong the system life. Especially in the Three North areas or offshore areas where wind resources are abundant, large-scale wind farms can be directly connected to centralized electrolytic plants (such as 50–100 MW) to dilute the cost through large-scale hydrogen production. Hydrogen production during the low electricity price period of wind power at night can also realize the inter-time conversion of “electricity-hydrogen”, effectively improving the wind power consumption rate and economy [28].
  • Hydrogen Production from Photovoltaic Power:
The daytime characteristics of photovoltaic power generation (overlapping with daytime peak electricity consumption) and its modular architecture make it naturally suited for distributed hydrogen production scenarios [29]. In regions with excellent solar resources (annual irradiation > 1600 kWh/m2), the levelized cost of electricity for photovoltaic power generation has already broken through the 0.2 yuan/kWh threshold. Hydrogen production using surplus midday electricity can significantly reduce hydrogen production costs. Its modular design supports flexible deployment in scenarios such as rooftops and barren slopes, enabling a closed-loop system of “on-site power generation-hydrogen production-hydrogen use” in industrial and commercial parks.

3.1.2. Scenario Design for Carbon Emission Accounting of Green Hydrogen Derivatives

  • CO2 Capture and Green Hydrogen Synthesis of Methanol:
Methanol synthesis requires hydrogen and carbon sources. This path achieves full-chain decarbonization through “green hydrogen + captured CO2”. Green hydrogen produced from wind and solar energy replaces traditional natural gas reforming for hydrogen production, completely eliminating carbon emissions in the hydrogen production process. The captured industrial CO2 emissions, from industries that have already paid the corresponding carbon quotas, are used as a carbon source, converting greenhouse gases into raw materials and forming a closed carbon cycle loop. This combination not only makes it possible for methanol production to achieve “negative carbon” potential but also meets the low-carbon transformation needs of the chemical industry. It not only absorbs renewable energy electricity but also provides a carbon utilization outlet for industrial processes whose emissions are difficult to reduce, achieving both environmental and economic synergy benefits.
  • Air Separation for Nitrogen Production and Green Hydrogen Synthesis of Ammonia:
The essence of the ammonia synthesis process is the combination of nitrogen and hydrogen. This design achieves zero carbon emissions through two major innovations. On the one hand, the air separation unit uses wind and solar power to extract high-purity nitrogen from the air (accounting for 78%), a mature technology with only electricity-related carbon emissions [30]. On the other hand, wind and solar power are used to electrolyze water to produce green hydrogen, replacing traditional fossil fuel-based hydrogen production (accounting for over 75% of the carbon emissions in ammonia synthesis), completely eliminating the carbon footprint of the process [31].

3.2. Determination of the System Boundaries for Carbon Emission Accounting of Green Hydrogen and Its Derivatives

3.2.1. Determination of the System Boundaries for Carbon Emission Accounting of Green Hydrogen

  • System Boundaries for Carbon Emission Accounting of Wind Power Hydrogen Production:
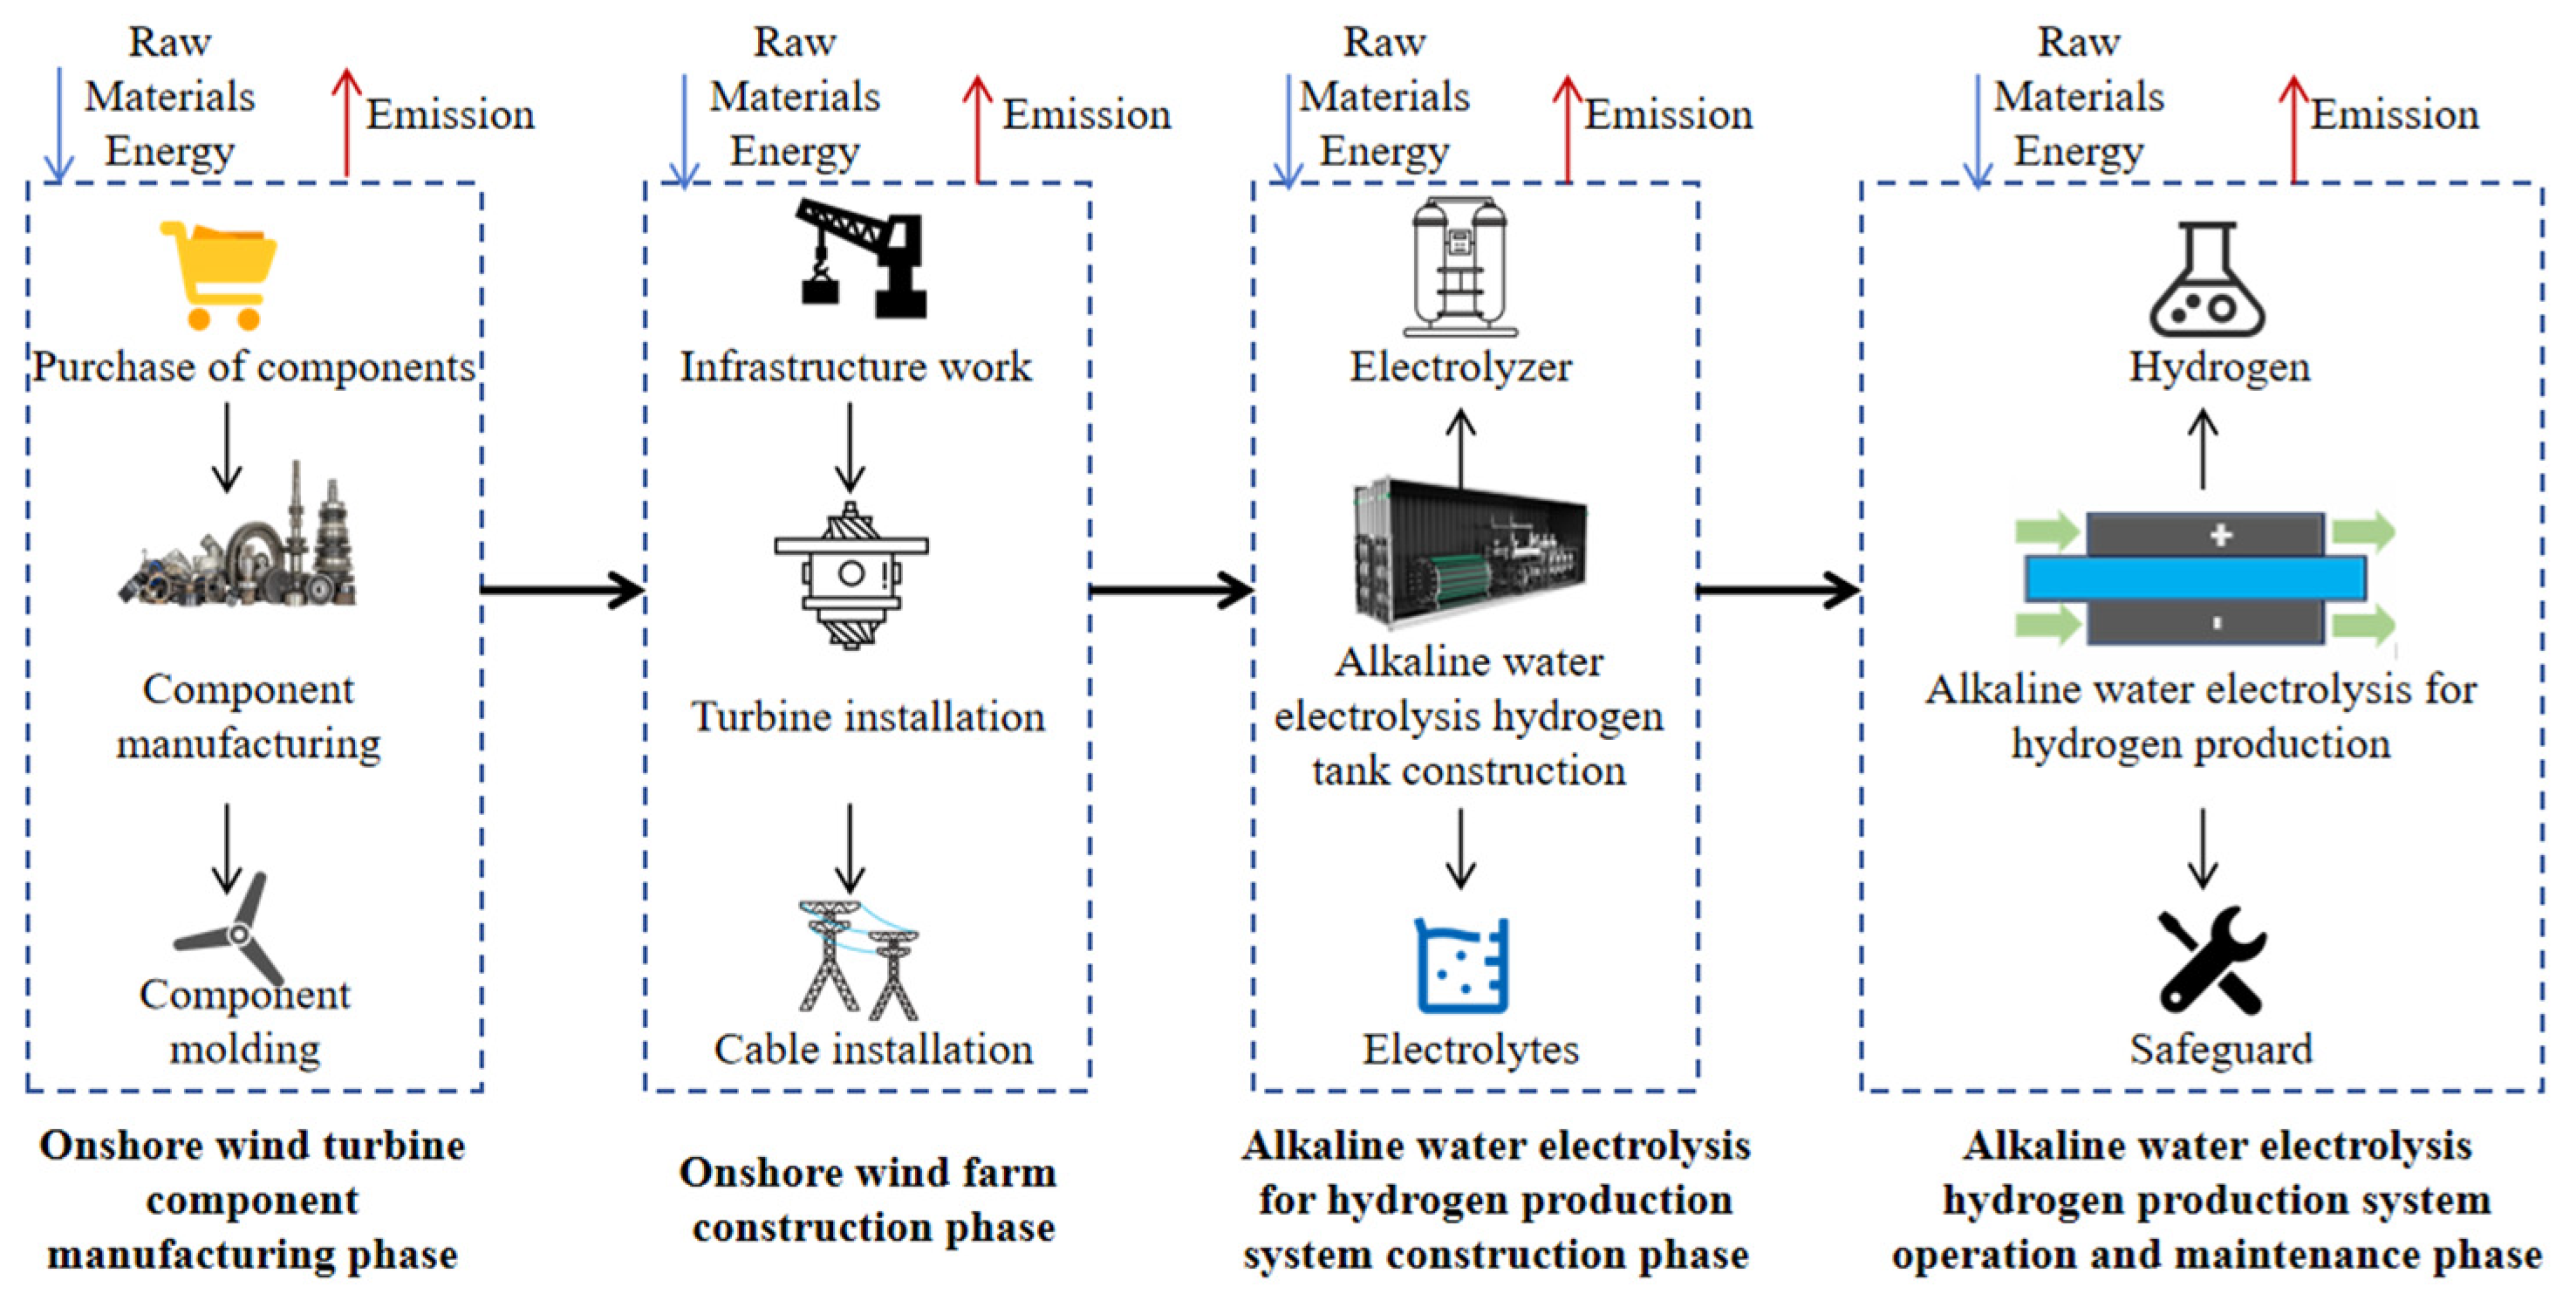
The boundary of wind power hydrogen production is “from cradle to gate”. Wind power hydrogen production is divided into onshore wind power hydrogen production and offshore wind power hydrogen production because the current offshore wind power hydrogen production technology is still relatively immature in China, so this study takes onshore wind power hydrogen production as an example to analyze the wind power hydrogen production of the whole life cycle emissions and selects the alkaline water electrolysis hydrogen production system, which is more widely used at present, as the core equipment for hydrogen production from electrolytic water. The whole life cycle of hydrogen production from onshore wind power is divided into four phases: the manufacturing phase of onshore wind turbine components, the construction phase of onshore wind farms, the construction phase of the alkaline water electrolysis hydrogen production system, and the operation and maintenance phase of the alkaline water electrolysis hydrogen production system, with each phase generating carbon emissions. Among them, the manufacturing phase of onshore wind turbine components and the construction phase of onshore wind farms require a large amount of raw material inputs, and carbon emissions will be generated during the raw material production process. In the construction phase of the alkaline water electrolysis hydrogen production system, raw materials and energy need to be invested in the electrolyzer, which mainly consists of electrodes and diaphragms, which are divided into an anode chamber and a cathode chamber separated by the diaphragm, and a 30–40% KOH solution is usually used as the electrolyte [32]; the production of these energies and materials will generate carbon emissions. In the operation and maintenance phase of the alkaline water electrolysis hydrogen production system, in consideration of materials focusing on the regular maintenance and the energy consumed in the hydrogen production process, excluding unexpected maintenance and overhauling, the links that use these energies produce CO2. The specific system boundaries are shown in Figure 2.
  • System Boundaries for Carbon Emission Accounting of Photovoltaic Hydrogen Production:
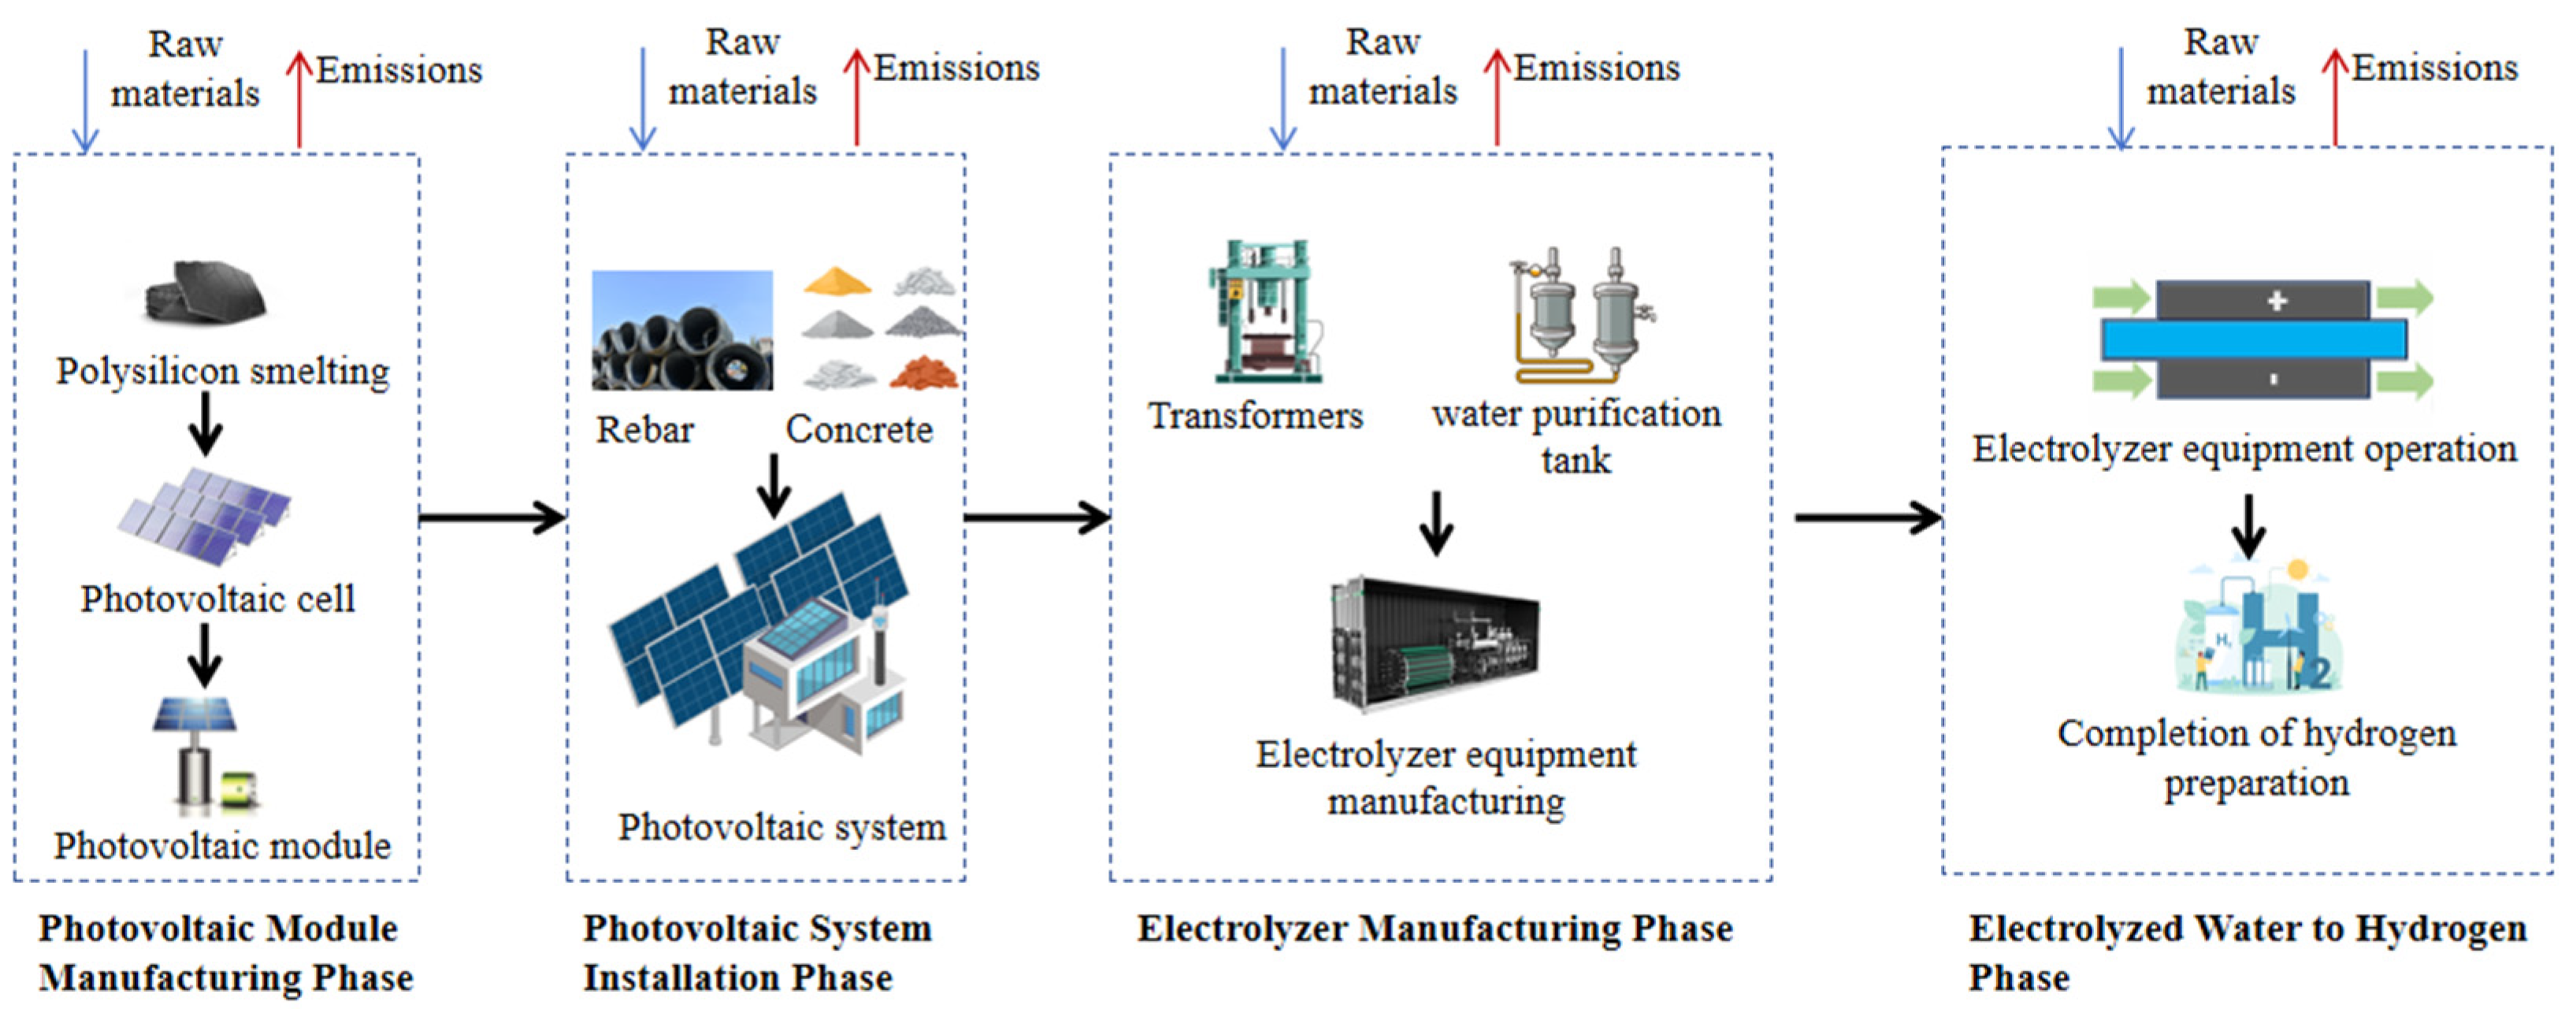
The boundary of PV (photovoltaic) power hydrogen production is “from cradle to gate”. Consider emissions from all relevant raw materials in each production stage in an off-grid scenario, as well as access to energy and utilities (including electricity, steam, and water), and emissions from the product manufacturing process. Also consider the manufacturing and construction processes for fixed assets (PV arrays, electrolyzers, hydrogen tanks, converters, compressors, etc.). Equipment construction includes a 50 MWp PV installation with open grounded modules. PV power generation consists of metallurgical-grade polysilicon–solar-grade silicon–Polycrystalline silicon wafer–Solar cell–PV modules with several links [33]. The specific system boundary is shown in Figure 3.

3.2.2. Determination of the System Boundary for Carbon Emission Accounting of Green Hydrogen Derivatives

  • Boundary of the carbon emission accounting system for synthetic methanol:
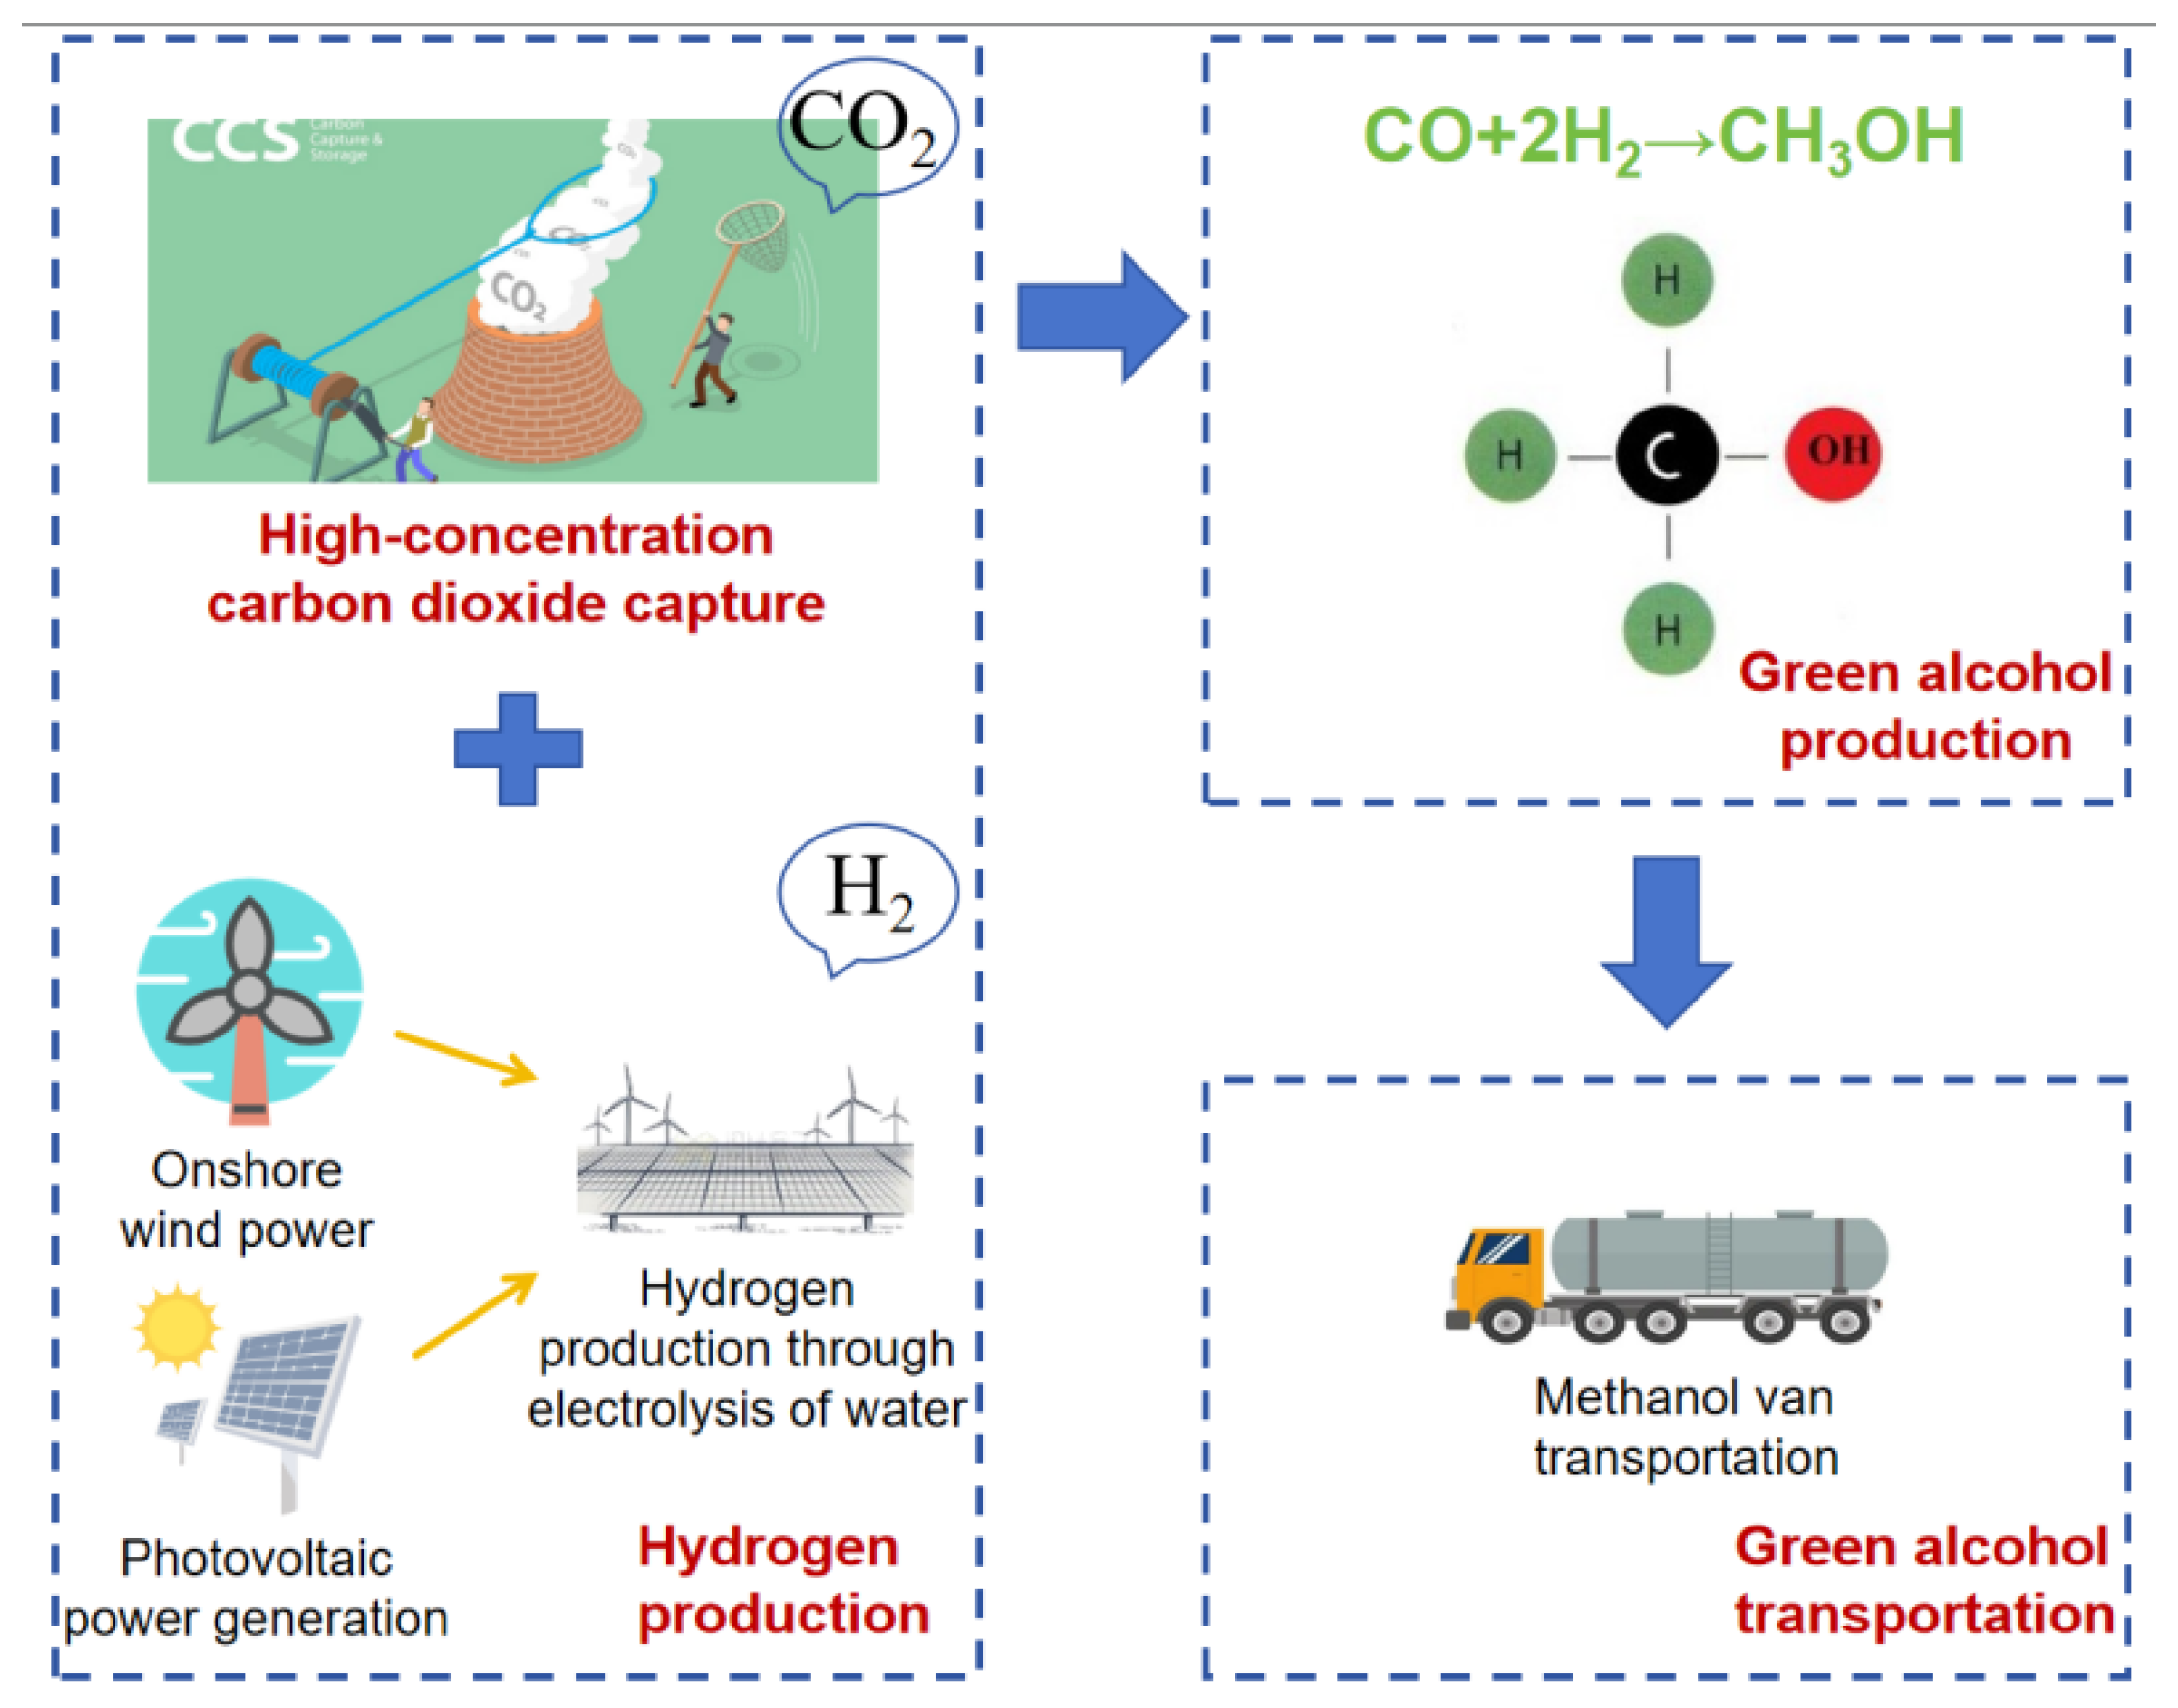
The selection of capturing CO2 and green hydrogen for the synthesis of methanol has a boundary defined as “from gate to consumer”, meaning from production to the consumer. Specifically, this boundary begins with the capture of high-concentration CO2. This process involves capturing CO2 from industrial emission sources or the atmosphere, which serves as one of the key raw materials for methanol synthesis. The captured CO2 is then transported to subsequent stages for chemical reactions. Meanwhile, hydrogen is produced through electrolysis of water based on wind and solar power, ensuring the production of green hydrogen. The carbon emissions mainly come from the processes within the operational boundaries of wind power hydrogen production and PV hydrogen production systems. Subsequently, the captured CO2 and the green hydrogen produced by electrolysis of water react in a synthesis reactor under specific conditions (such as catalysts, appropriate temperature, and pressure) to generate methanol [34]. During the transportation stage, methanol is transported by dedicated tank trucks, and its safety and transportation efficiency are guaranteed by optimizing the selection of transportation tools and route planning. This process is also an important consideration point for overall carbon reduction. Since the equipment for green methanol and traditional methanol is the same, with only a difference in the raw materials used, the life cycle carbon emissions of the equipment are not considered in the calculation. The boundary of the methanol synthesis system is shown in Figure 4.
  • Boundary of the Carbon Emission Accounting System for Ammonia Synthesis:
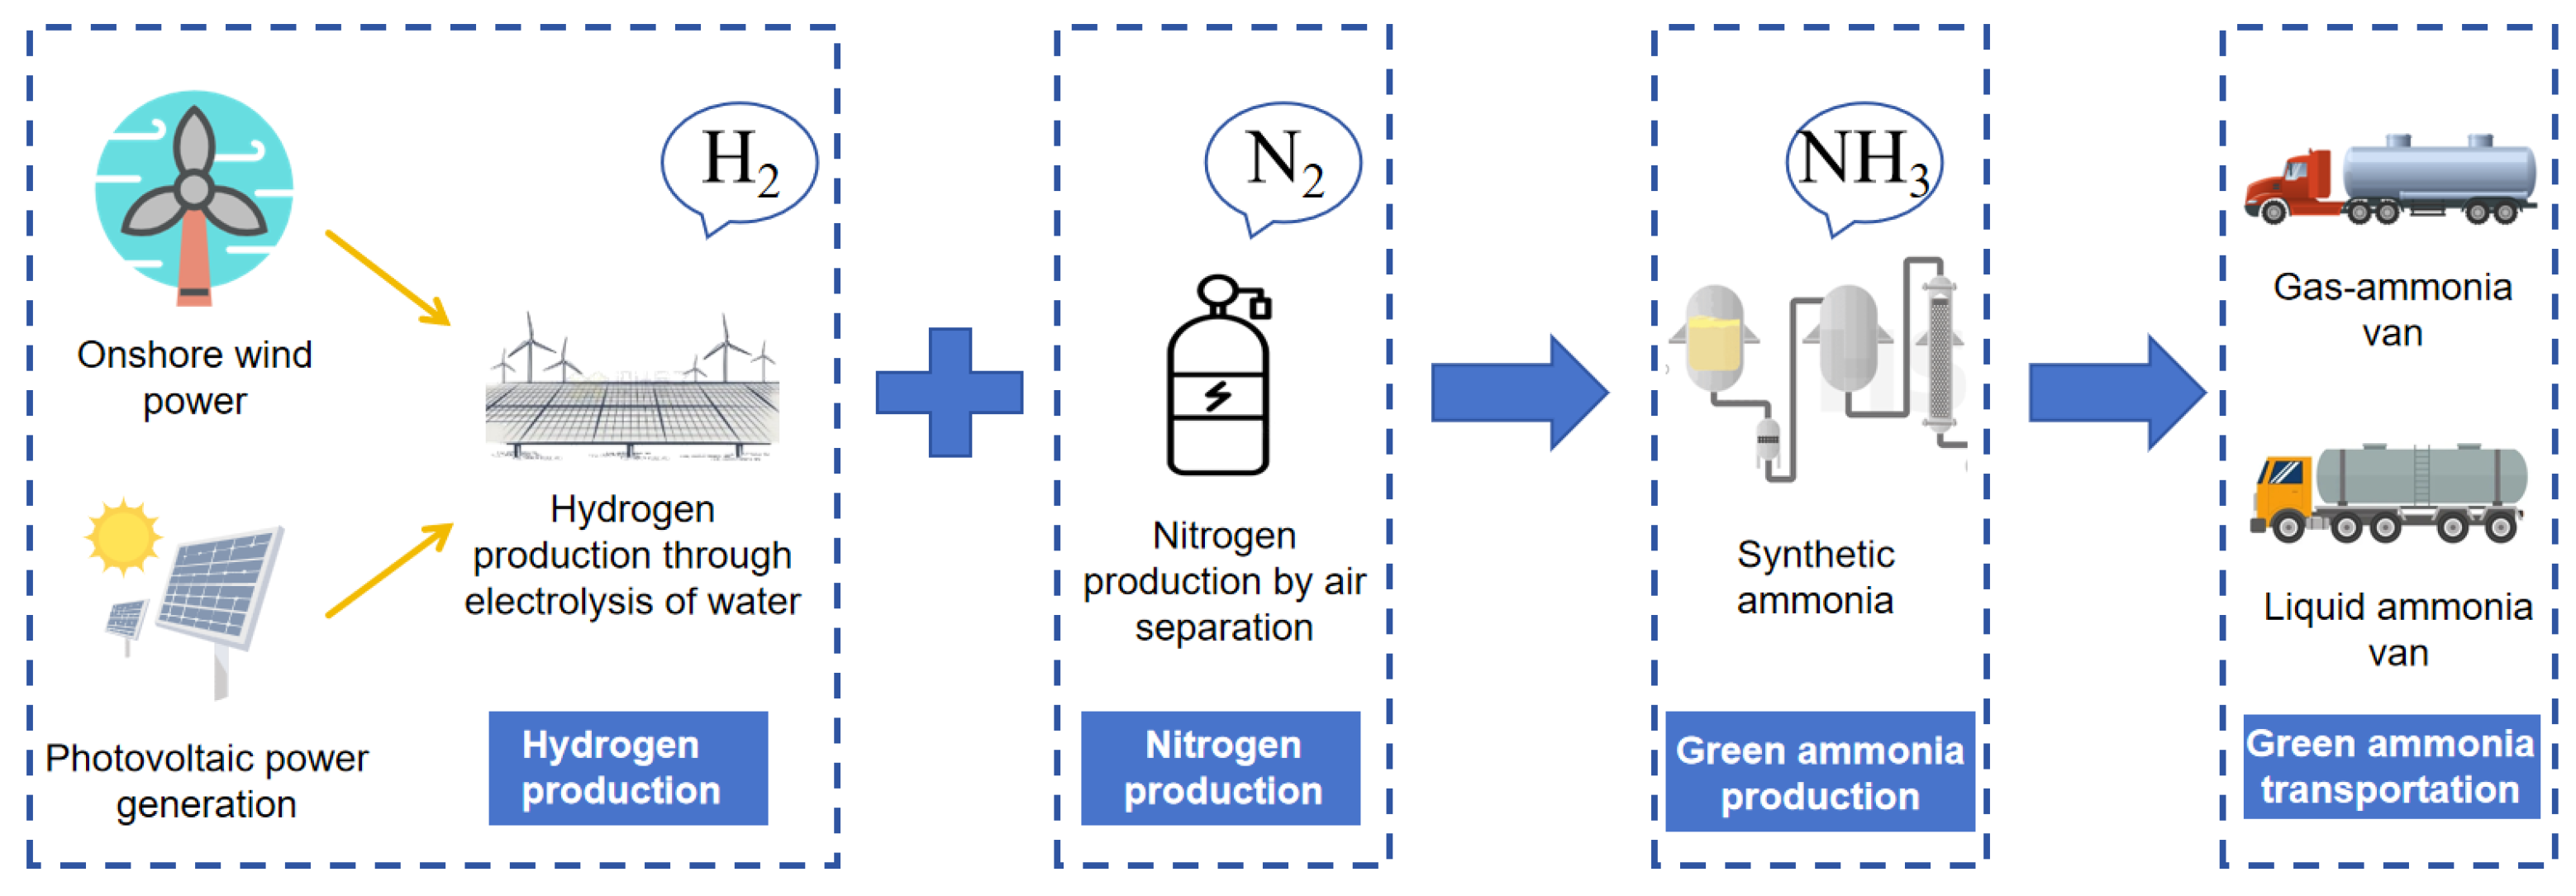
The selection of air separation for nitrogen production and green hydrogen for ammonia synthesis has a boundary of “from gate to consumer”. The carbon accounting of green ammonia begins with the preparation of raw gases. Hydrogen is produced through electrolysis of water based on wind and solar power, while nitrogen is extracted from the atmosphere using air separation technology to obtain high-purity nitrogen. The carbon emissions in this stage mainly come from the electricity consumption of air separation equipment. Subsequently, the produced green hydrogen and air separation nitrogen are mixed in a chemical ratio of 3:1, and ammonia synthesis is carried out through the Haber process at a reaction temperature of 500–600 °C under the action of a catalyst [35,36]. Finally, in the product storage and transportation stage, the synthesized ammonia is compressed and liquefied or cooled according to downstream demand and transported using dedicated liquid ammonia tankers or gaseous ammonia tankers to ensure the safe and efficient delivery of the product to end users. The carbon emissions in this stage mainly come from the diesel consumption of transportation vehicles and the electricity usage of related storage and transportation facilities. Since the equipment for green hydrogen ammonia synthesis and traditional ammonia synthesis is the same, with only a difference in raw material usage, the life cycle carbon emissions of the equipment are not considered in the calculation. The boundary of the ammonia synthesis system is shown in Figure 5.
Although this paper defines wind/solar-to-hydrogen as “cradle-to-gate” and its derivatives as “gate-to-consumer,” the two parts are rigidly linked through the same hydrogen dataset: the upstream carbon footprint calculated in the “cradle-to-gate” stage is fully carried over to the downstream ammonia/methanol routes without truncating any burdens. This modular design both aligns with current certification practice that treats hydrogen as a tradable commodity and allows readers to compare products on a uniform functional unit (per kg or per MJ) or to merge the modules into a full “cradle-to-grave” boundary in future work, all without re-aggregating the wind/PV and electrolysis stages.

3.3. Carbon Emission Accounting Parameters for Green Hydrogen and Its Derivatives

3.3.1. Carbon Emission Accounting Parameters for Green Hydrogen

  • Parameters for Hydrogen Production from Wind Power:
The wind farm data used in this study are wind turbine data from the Chifeng wind farm located in Inner Mongolia, China. The wind farm has an annual grid-connected power generation of 440 GWh and an annual grid-connected time of 2222 h [37]. Table 1 shows the list of wind power hydrogen production life cycle data required for the preparation of 1 kg of hydrogen. Among them, the data used in the Manufacturing Phase of Onshore Wind Turbine Components comes from Dongfeng Turbine Co., Ltd, Sichuan, China. The data of the Construction Phase of Onshore Wind Farms comes from Chifeng Wind Farm in Inner Mongolia, China [37]. The data of the construction phase of the alkaline water electrolysis hydrogen production system and the operation and maintenance phase of the alkaline water electrolysis hydrogen production system are derived from QDQ2-1 alkaline electrolyzer data [32].
  • Parameters for Hydrogen Production from Photovoltaic Power:
The hydrogen load in this study is stable hourly with a daily output of 100 tons, and the weather data used is from the solar-rich region of Qinghai, China (36° N, 100.5° E); the functional unit chosen is 1 kg of hydrogen, with the preparation environment being completely off-grid. The list of the various steps required to prepare 1 kg of hydrogen is shown in Table 2, which was obtained from real-life cases, references, and sources such as the China Products Carbon Footprint Factors Database, the Tiangong.earth, and the Simapro database [33]. More specifically, data for the photovoltaic module fabrication stage are sourced from Reference [38], data for the photovoltaic power plant construction stage are sourced from Reference [39], and data for the electrolyzer manufacturing stage and hydrogen production stage are sourced from Reference [39].

3.3.2. Carbon Emission Accounting Parameters for Green Hydrogen Derivatives

  • Parameters for Methanol Synthesis:
In the carbon dioxide capture stage, based on the material balance data of a million-ton high-concentration (91.62% v/v) CO2 capture project, the carbon emission factor per unit of captured carbon dioxide is calculated. The green hydrogen supply adopts the electrolysis water hydrogen production technology driven by PV and wind power. Considering that the domestic methanol transportation is dominated by road tankers, this study selects a 32-ton rated-load methanol tanker as a typical case to calculate the carbon emission factor per unit mass of transportation. The material and energy consumption list of each stage is detailed in Table 3. Taking 91.62% CO2 at 1.23 kg as an example to calculate the process, it is indicated in reference [40] that 703,000 tons of CO2 capture requires 864,000 tons of 91.62% CO2. Therefore, approximately 1.23 kg of 91.62% carbon dioxide is needed for each kilogram of CO2.
  • Parameters for Ammonia Synthesis:
Compared with the hydrogen production and ammonia synthesis route powered by the grid, the ammonia synthesis process that uses renewable energy electricity for water electrolysis to produce hydrogen significantly reduces the comprehensive energy consumption and carbon emissions in the raw material production, raw material transportation, and fuel production stages. The carbon emissions in the raw material production stage mainly come from the electricity consumption of air separation for nitrogen production and the hidden emissions in the green hydrogen preparation process; the carbon emissions in the ammonia synthesis reaction stage mainly result from the process of electricity consumption.
Ammonia product transportation is carried out in two modes: gaseous ammonia transportation and liquid ammonia transportation. In gaseous ammonia transportation, the ammonia gas is compressed to a set pressure by a compressor and then transported to the terminal by a tanker truck. The compression process mainly consumes electricity, while the transportation process mainly consumes diesel. The diesel consumption rate of a gaseous ammonia transport vehicle with a rated load of 9000 kg is 0.25 L/km. In liquid ammonia transportation, the ammonia is liquefied and then transported by a tanker. The fuel consumption of a liquid ammonia tanker with a rated load of 10,000 kg is 25 L per 100 km [41]. The data list of ammonia synthesis production and air separation nitrogen production were derived from the actual operation data of the enterprise. The list of material and energy input is shown in Table 4.

3.4. Construction of Carbon Emission Accounting Model for Green Hydrogen and Its Derivative Products

To circumvent the symbol redundancy and cross-ambiguity inherent in conventional multi-formulation approaches, this paper abstracts the carbon-emission accounting of wind/PV-to-hydrogen systems and their downstream methanol and ammonia derivatives into a unified framework. Only the single core expression, a “stage-wise summation,” is retained: E _ total ( p , q ) = j J p , q E _ j , and a binary index ( p , q ) is introduced to pin down, in one stroke, “where the electricity comes from and where the hydrogen goes.” This simplification shrinks the number of equations from more than twenty to exactly one. Whenever new energy pathways or derivative products are added in the future, only the set J _ p , q   needs to be expanded with the corresponding stages; the mathematical form itself remains unchanged. Consequently, model readability and portability are markedly improved, while multi-scenario comparisons, sensitivity analyses, and future policy extensions can be accommodated at zero additional algorithmic cost.

3.4.1. Symbols and Indexes

Energy path. WF is wind power generation, and PV  is photovoltaic power generation:
p WF , PV  
Product pathways. H 2 represents hydrogen, MeOH represents methanol, and N H 3 represents ammonia:
q H 2 , MeOH , N H 3  
Life cycle stages can be represented as follows:
j J _ p , q
Among them, J _ p , q   represents the set of stages for each scenario, as shown in Table 5.
The types of materials or energy within stage j can be expressed as follows:
k K _ j

3.4.2. Calculation Methods

Stage carbon emissions:
E _ j = k K _ j Q j , k × EF _ j , k
Total carbon emissions over the life cycle:
E _ total ( p , q ) = j J p , q E _ j
For q MeOH , N H 3 , the direct reuse of the hydrogen production stage results corresponding to the energy path is as follows:
E _ H 2 _ prod ( p ) = E _ total ( p , H 2 )
Carbon emissions calculation for the methanol scenario:
E _ total ( p , MeOH ) = E _ H 2 _ prod ( p ) + E _ C O 2 _ cap + E _ MeOH _ syn + E _ MeOH _ tr
Carbon emissions calculation for the ammonia scenario:
E _ total ( p , N H 3 ) = E _ H 2 _ prod ( p ) + E _ ASU + E _ N H 3 _ syn + E _ N H 3 _ tr

3.5. Construction of Carbon Emission Reduction Model for Green Hydrogen and Its Derivative Products

The carbon emission reduction benefit of green hydrogen is defined as the carbon emissions generated by the equivalent amounts of other types of hydrogen that are replaced by the consumption of green hydrogen. The calculation formula is as follows:
E 1 H 2 = Q H 2 × EF i i = 1 , 2
where E 1 H 2 represents the carbon emission reduction benefit of green hydrogen, Q H 2 represents the consumption of green hydrogen, EF 1 represents the full life cycle carbon emissions of PV hydrogen production, and EF 2 represents the full life cycle carbon emissions of wind power hydrogen production.
The carbon emission reduction benefit of green ammonia is defined as the carbon emissions generated by the equivalent amounts of other types of ammonia that are replaced by the consumption of green ammonia. The calculation formula is as follows:
E 2 H 2 = Q NH 3 × EF NH 3
where E 2 H 2 represents the carbon emission reduction benefit of green ammonia, Q NH 3 represents the consumption of green ammonia, and EF NH 3 represents the full life cycle carbon emissions of ammonia synthesis.
The carbon emission reduction benefit of green methanol is defined as the carbon emissions generated by the equivalent amounts of other types of methanol that are replaced by the consumption of green methanol. The calculation formula is as follows:
E 3 H 2 = Q CH 2 OH × EF CH 2 OH
where E 2 H 2 represents the carbon emission reduction benefit of green methanol, Q CH 2 OH represents the consumption of green methanol, and EF CH 2 OH represents the full life cycle carbon emissions of methanol synthesis.

4. Results and Discussion

4.1. Analysis of the Full Life Cycle Carbon Emissions of Green Hydrogen and Its Derivatives

4.1.1. Analysis of the Full Life Cycle Carbon Emissions of Green Hydrogen

  • Hydrogen Production from Wind Power:
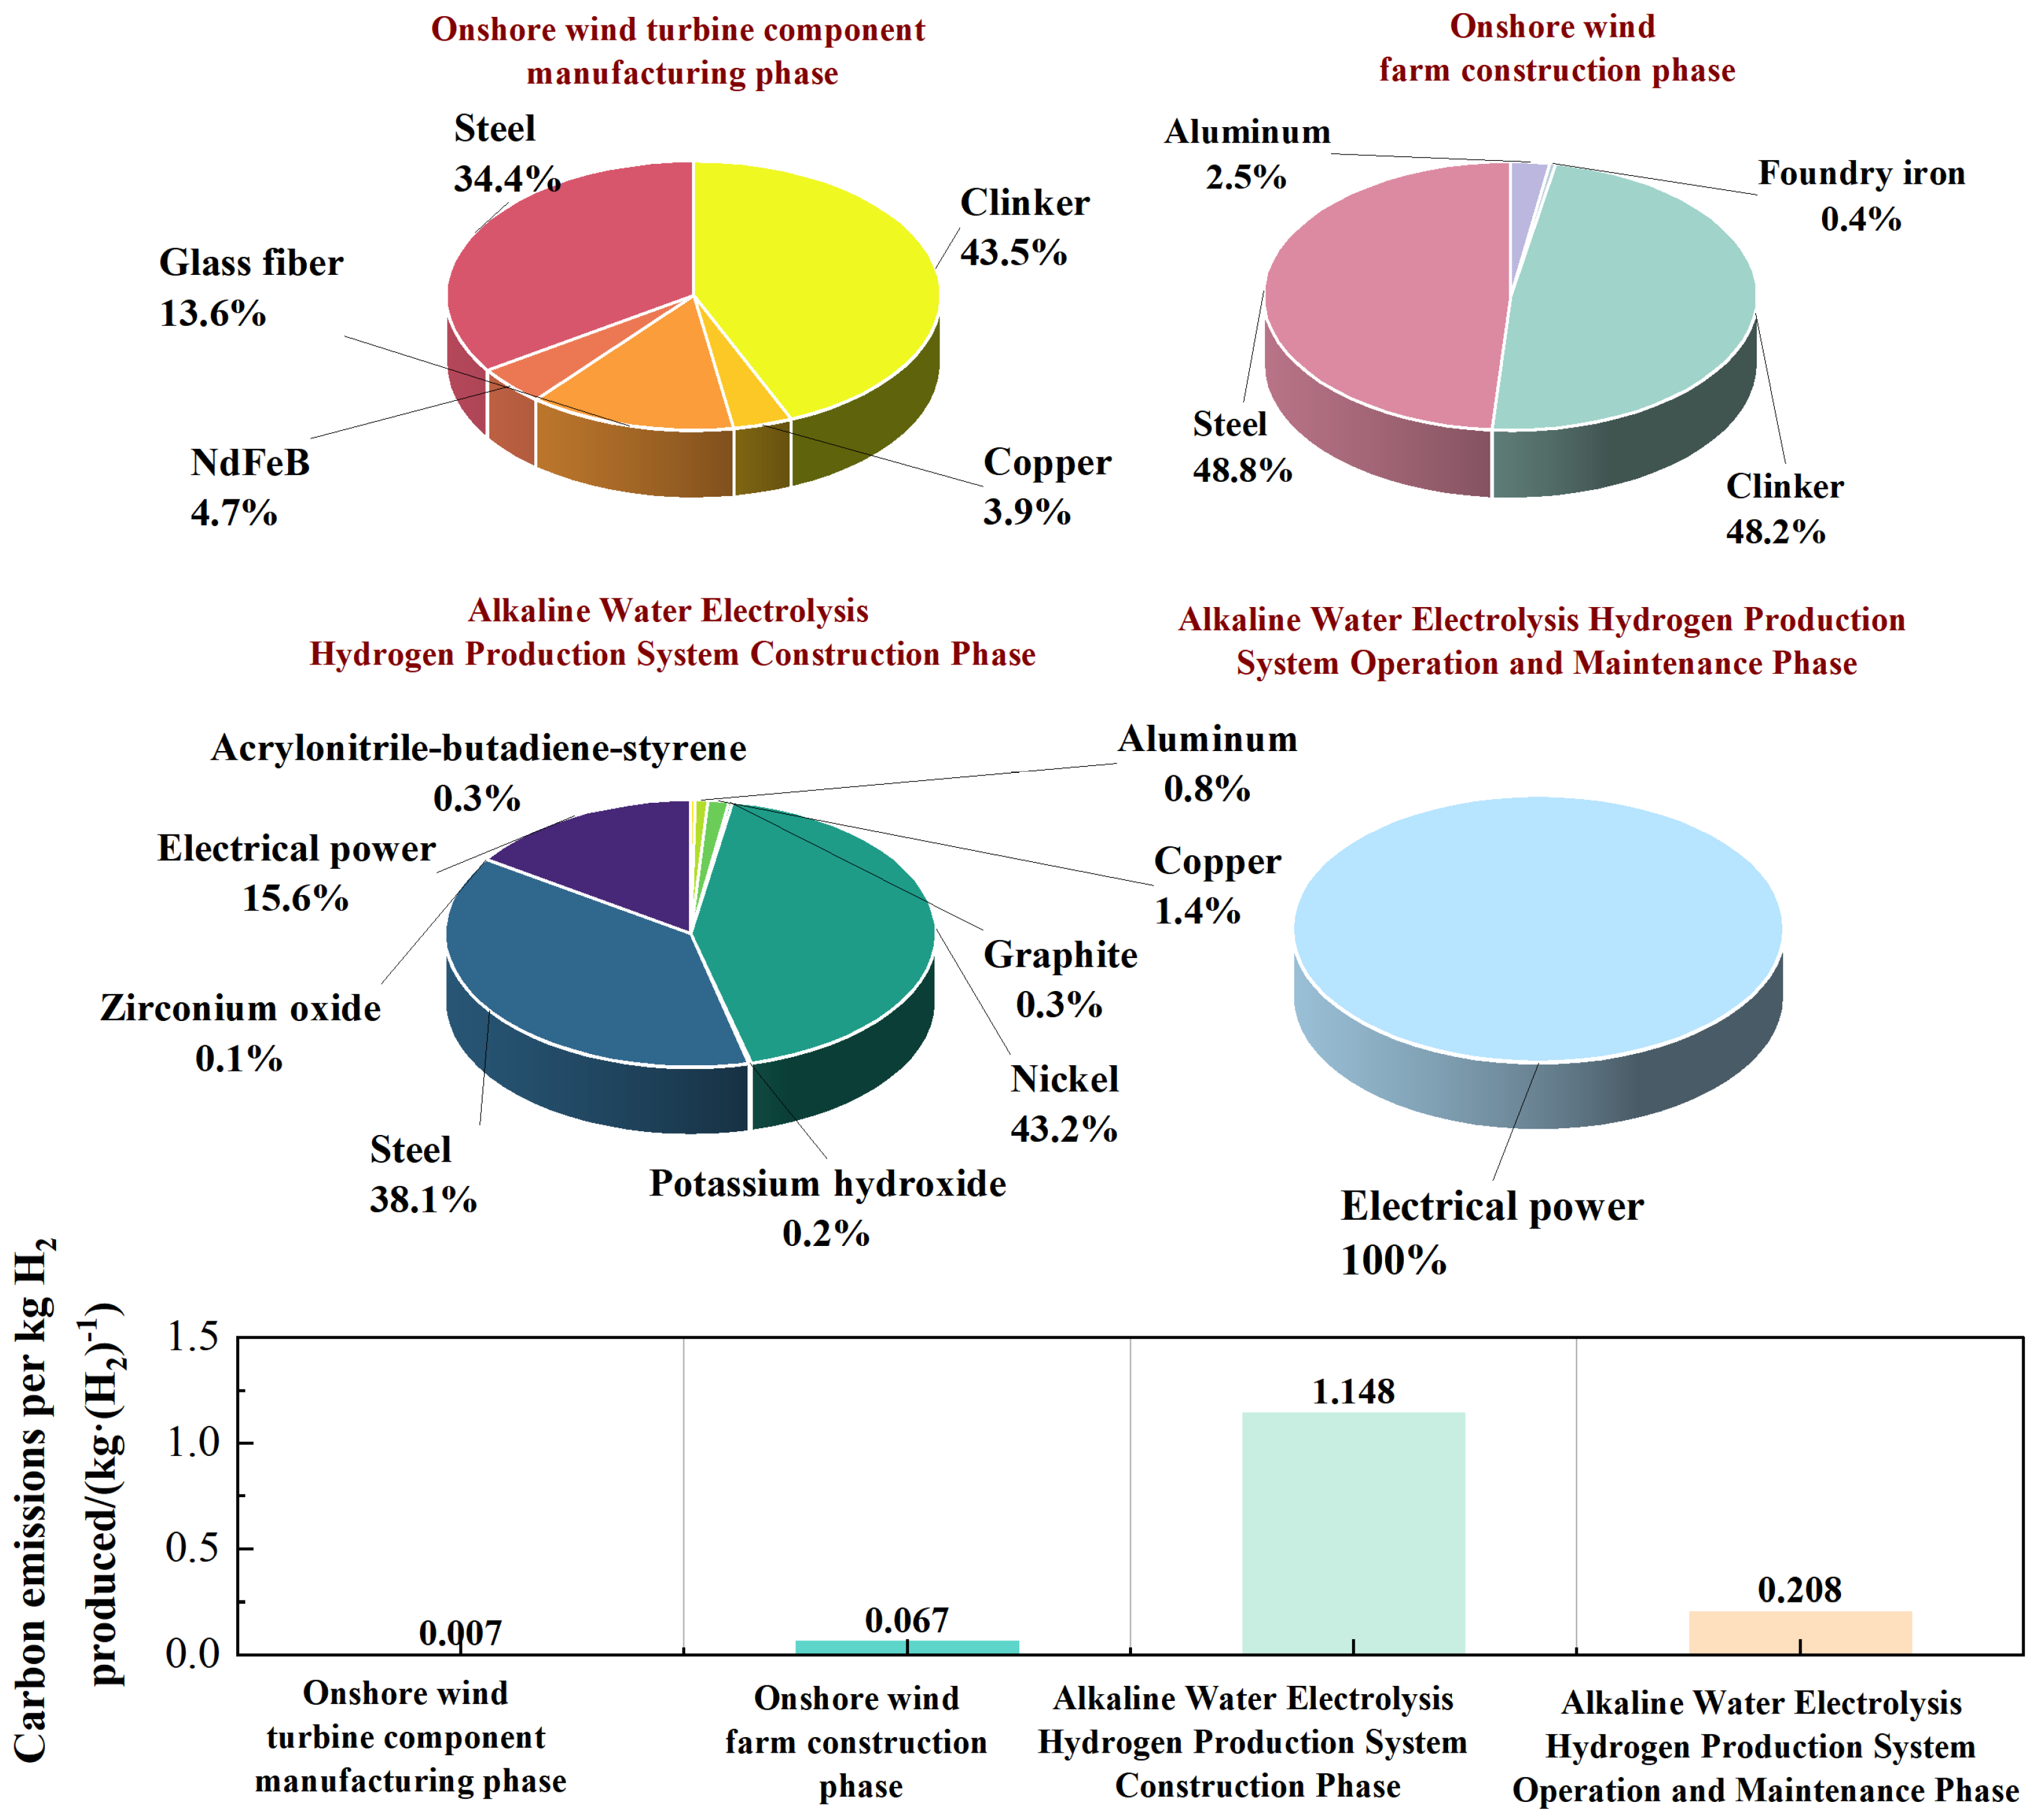
This study utilized Simapro Craft to conduct simulation and modeling of the four carbon emission models constructed above, and obtained the unit carbon emissions of wind power hydrogen production. As shown in Figure 6, for the production of 1 kg of hydrogen, the carbon emissions in the onshore wind turbine component manufacturing stage are 0.007 kgCO2/kgH2, with cement and steel having a relatively high proportion. The carbon emissions in the onshore wind farm construction stage are 0.067 kgCO2/kgH2, and the carbon emissions in the construction stage of the alkaline water electrolysis hydrogen production system are 1.148 kgCO2/kgH2. The carbon emissions in the operation and maintenance stage of the alkaline water electrolysis hydrogen production system are 0.208 kgCO2/kgH2.
Overall, the construction phase of the alkaline water electrolysis hydrogen production system construction phase has the highest carbon emissions, followed by the alkaline water electrolysis hydrogen production system operation and maintenance phase, and the onshore wind turbine component manufacturing phase has the least carbon emissions. In general, the total life cycle carbon emissions of wind power hydrogen production are 1.43 kgCO2/kgH2. The hydrogen production from wind power obtained in the reference is 0.923 kgCO2/kgH2, which is lower than the calculated value in this paper, mainly because the calculated results will be different due to different accounting methods, accounting boundaries, and equipment parameters. For example, the electrolytic cell used in the reference [38] is an alkaline electrolyzer with model FDQ, and the electrolyzer used in this paper is an alkaline electrolyzer with model QDQ2-1. QDQ2-1 electrolyzer technology is mature in technology, but it has high nickel content, and the carbon emission of nickel as a raw material in the whole life cycle is relatively high, so the calculation results are different.
  • Hydrogen Production from PV Power:
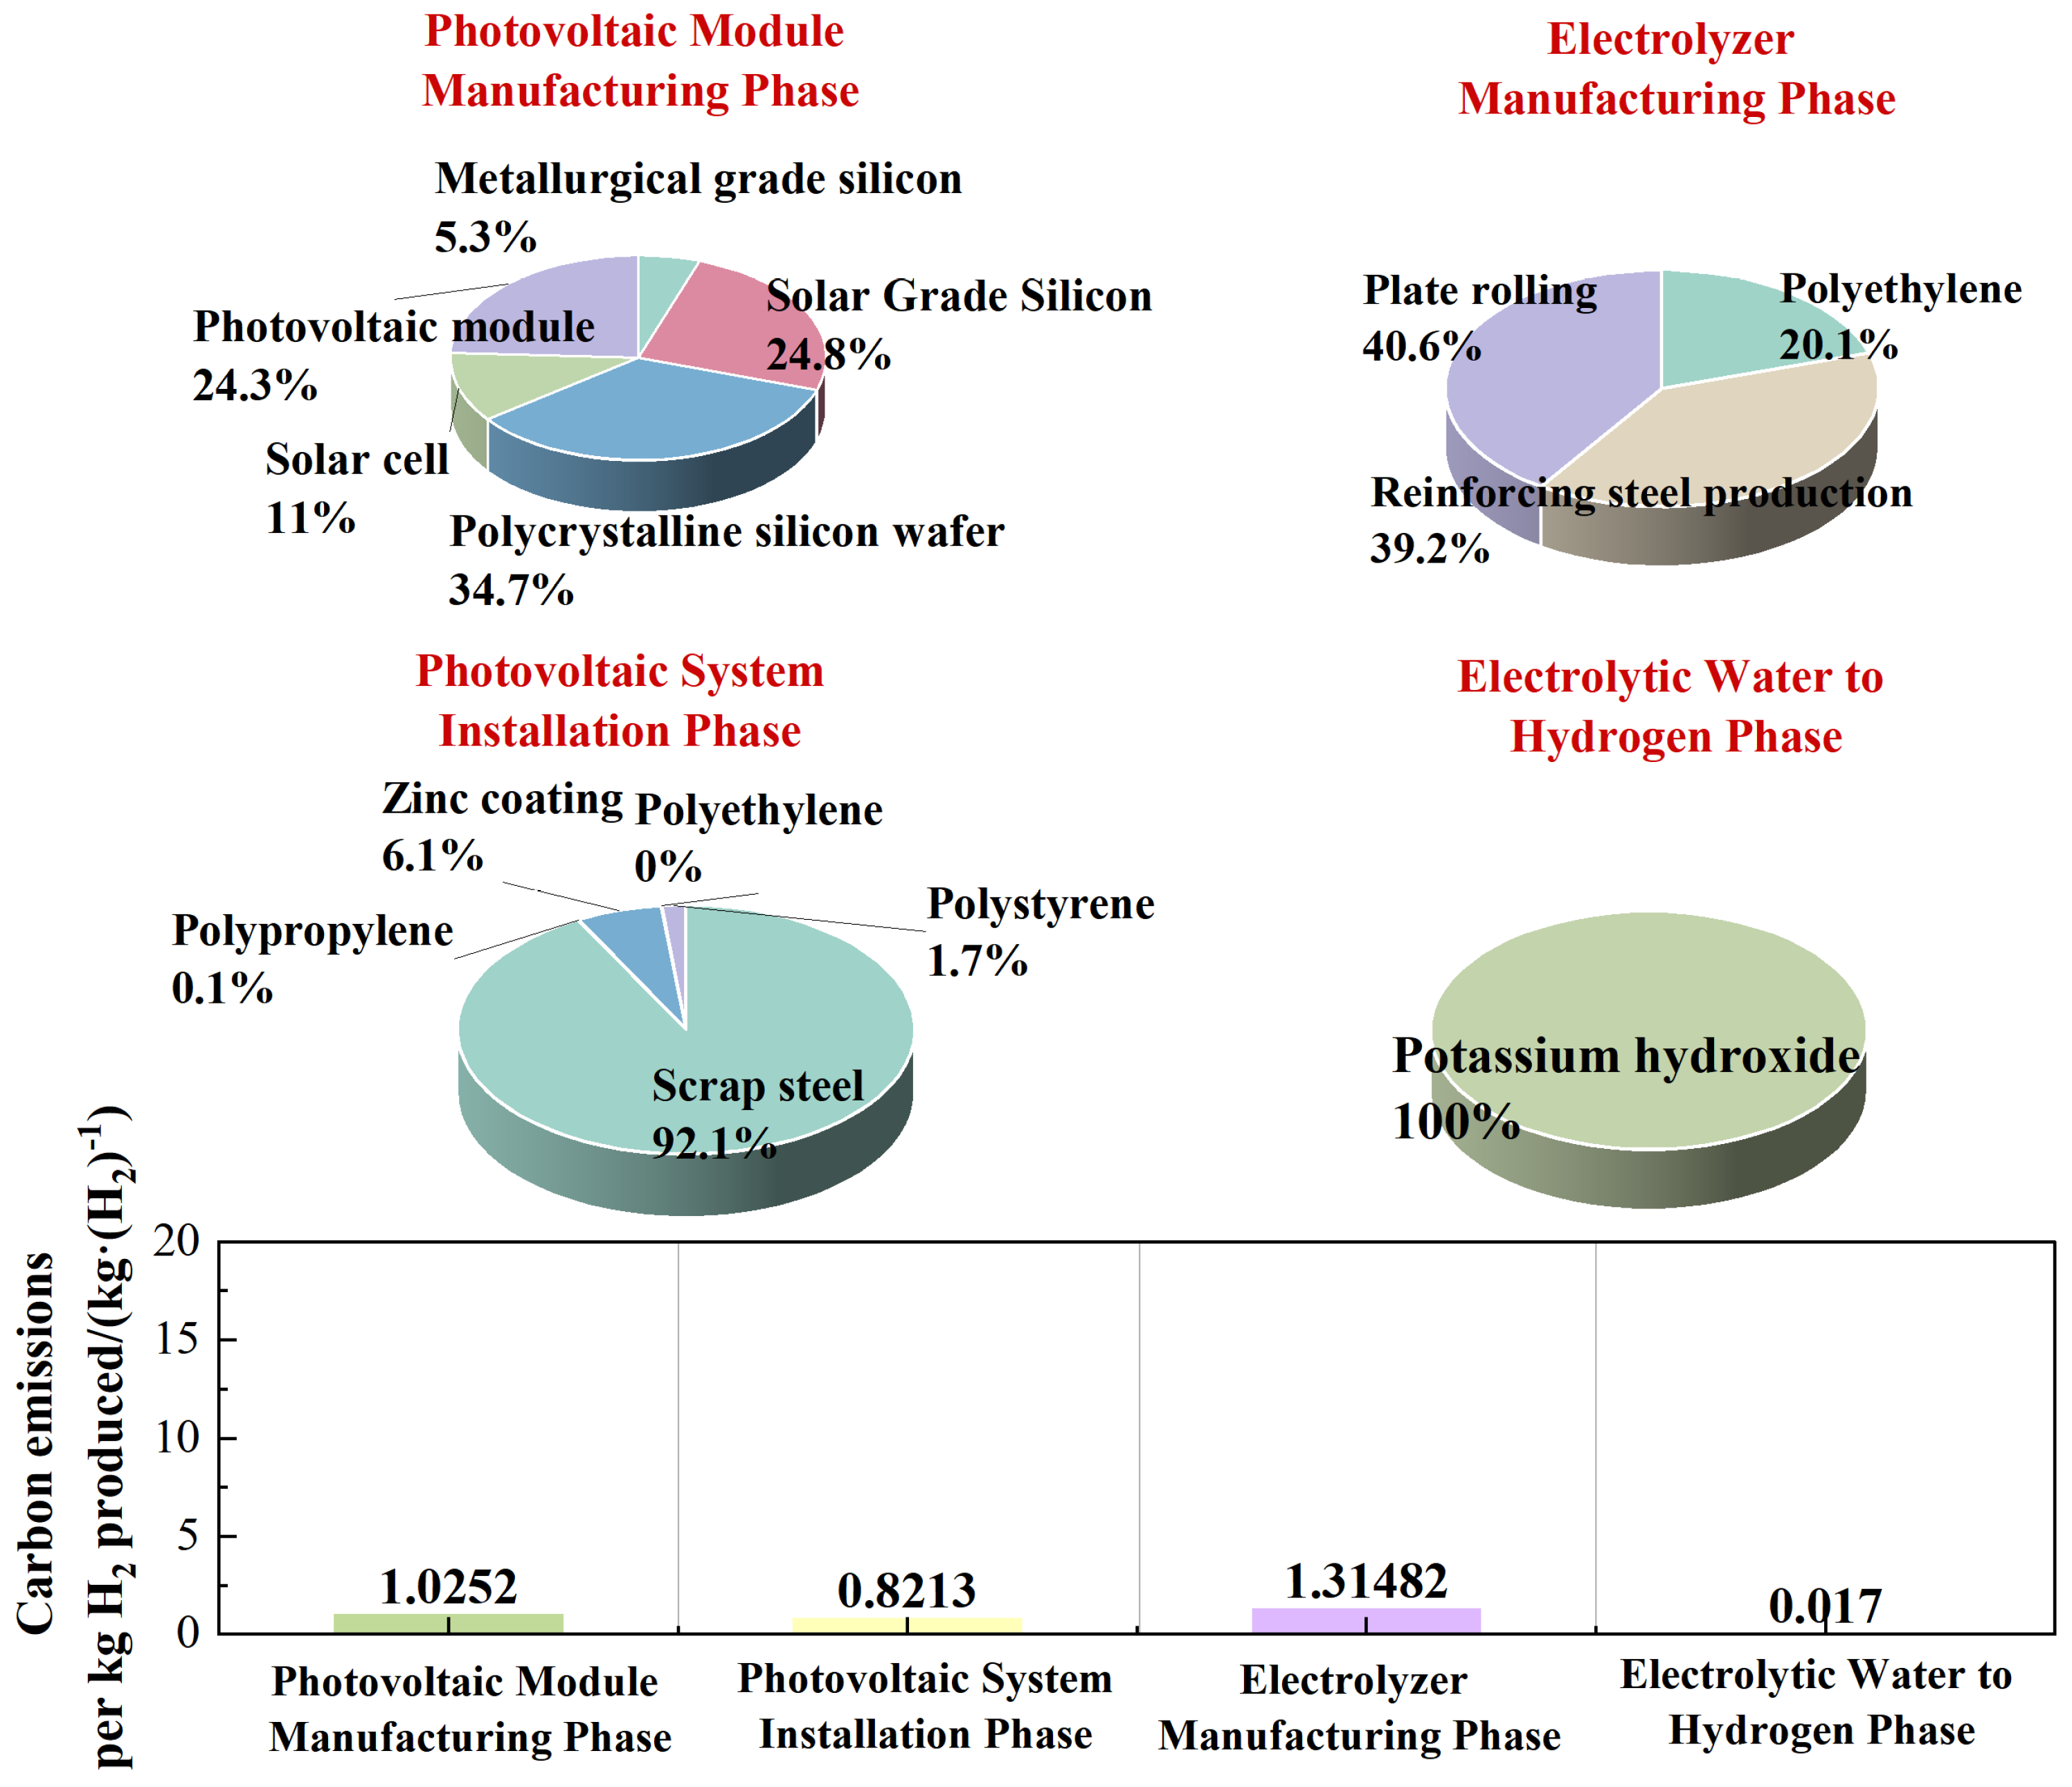
This study utilized Simapro Craft to conduct simulation and modeling of the four carbon emission models constructed above, and the results indicated that the full life cycle carbon emissions of PV hydrogen production were 3.17 kgCO2/kgH2. As shown in Figure 7, for the production of 1 kg H2, the carbon emissions during the installation stage of the PV system were 1.0252 kgCO2/kgH2, with zinc coating and polystyrene having relatively high proportions. The carbon emissions during the PV module manufacturing stage were 0.8213 kgCO2/kgH2. The detailed carbon emissions of the five sub-processes in the PV module manufacturing stage are shown in Figure 8. The carbon emissions during the electrolyzer manufacturing stage were 1.31482 kgCO2/kgH2. The carbon emissions during the electrolytic water hydrogen production stage were 0.017 kgCO2/kgH2. Overall, the electrolyzer manufacturing stage produced the most carbon emissions, followed by the PV system installation stage and the PV module manufacturing stage, while the electrolytic water hydrogen production stage had the least carbon emissions. The photovoltaic hydrogen production rate of 5 kg CO2/kgH2 cited in reference [21] is higher than the calculated value in this paper. The primary discrepancy lies in the photovoltaic module fabrication stage, specifically during the metallurgical-grade silicon process, where differing raw materials result in varying carbon emissions. Similarly, differing processes employed in the solar-grade silicon preparation also lead to variations in carbon emissions.

4.1.2. Analysis of the Full Life Cycle Carbon Emissions of Green Hydrogen Derivatives

  • Methanol Synthesis:
This study utilized Simapro Craft to conduct simulation and modeling of the four carbon emission models constructed above and obtained the unit carbon emissions of synthetic methanol.
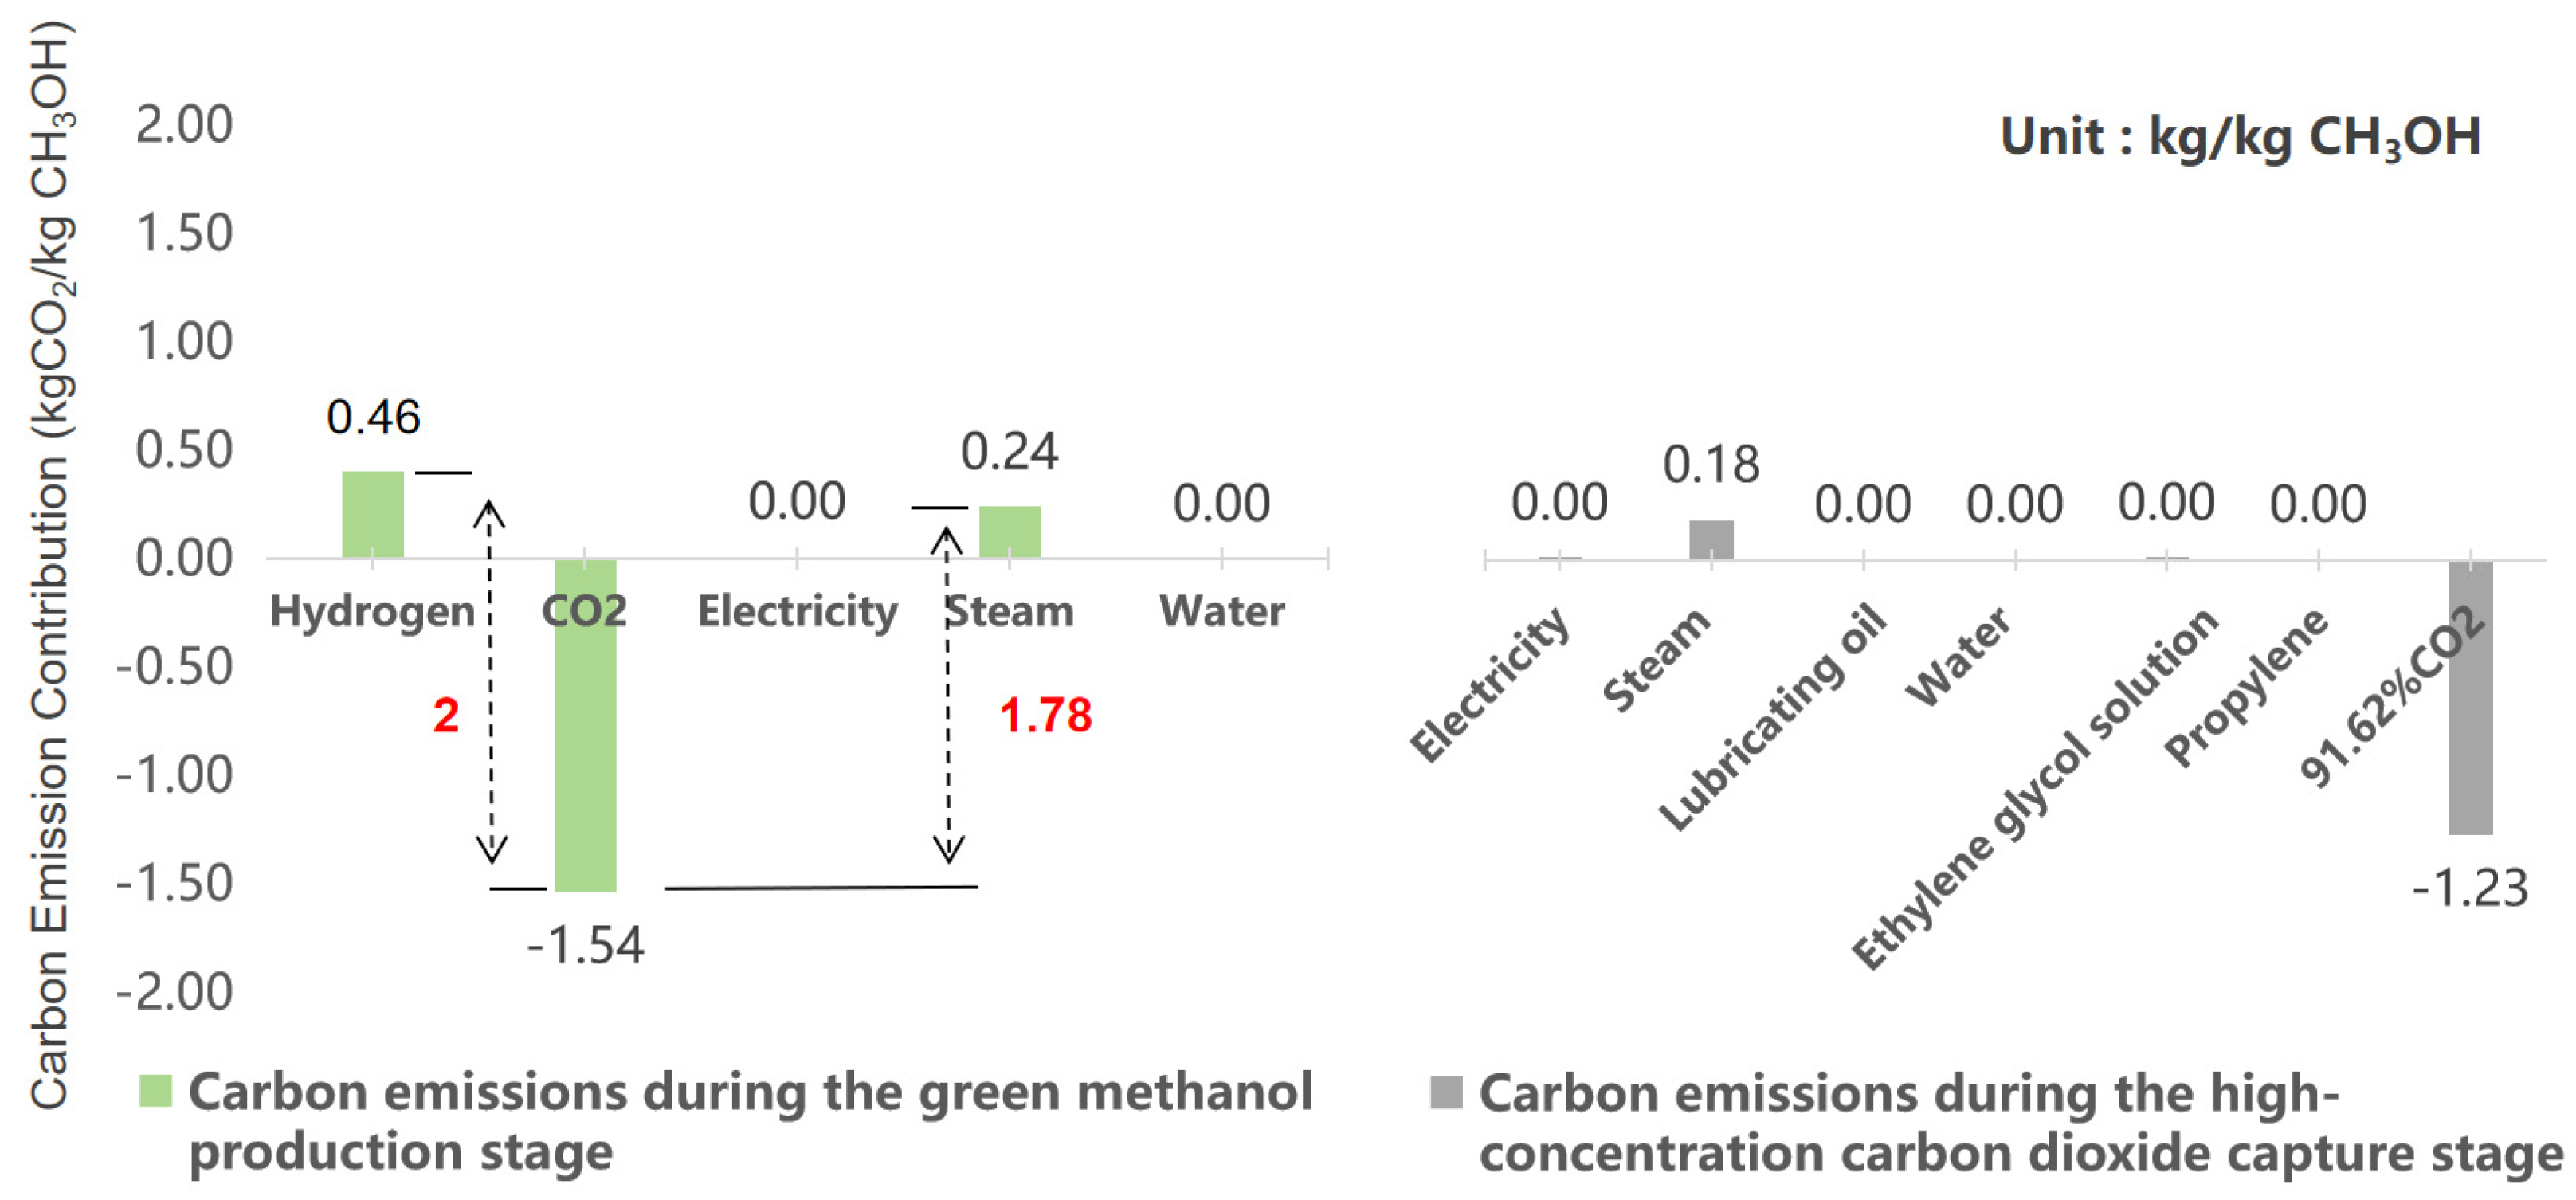
The full life cycle carbon emissions for producing 1 kg of methanol are −0.8318 kgCO2/kgCH3OH, putting the overall balance at a net-negative level. Transport adds only 0.0048 kg CO2, whereas the synthesis stage itself is negative at −0.8357 kgCO2 because the high-concentration industrial CO2 captured in the raw-material step (Figure 9) carries a credit of −1.54 kg CO2—far above the combined hydrogen, steam, and other inputs—so the production step is already a net sink. After including the small transport burden, the cradle-to-gate score stays clearly negative at −0.83 kgCO2/kgCH3OH.
It should be emphasized that this negative value is conditional: the credit stems from CO2 captured at an industrial source that has already surrendered its allowance under the national emissions-trading scheme. By routing this “paid-for” CO2 into methanol synthesis, the process delivers a climate benefit that would otherwise require separate carbon-utilization or geological-storage measures. Thus, the −0.83 kg CO2 is not an intrinsic property of the methanol molecule but a system-wide net benefit that arises only when (i) the CO2 is truly additional and would otherwise be vented, (ii) the emitter’s compliance liability has been accounted for, and (iii) all energy use for capture, compression, and transport is included within the system boundary.
  • Ammonia Synthesis:
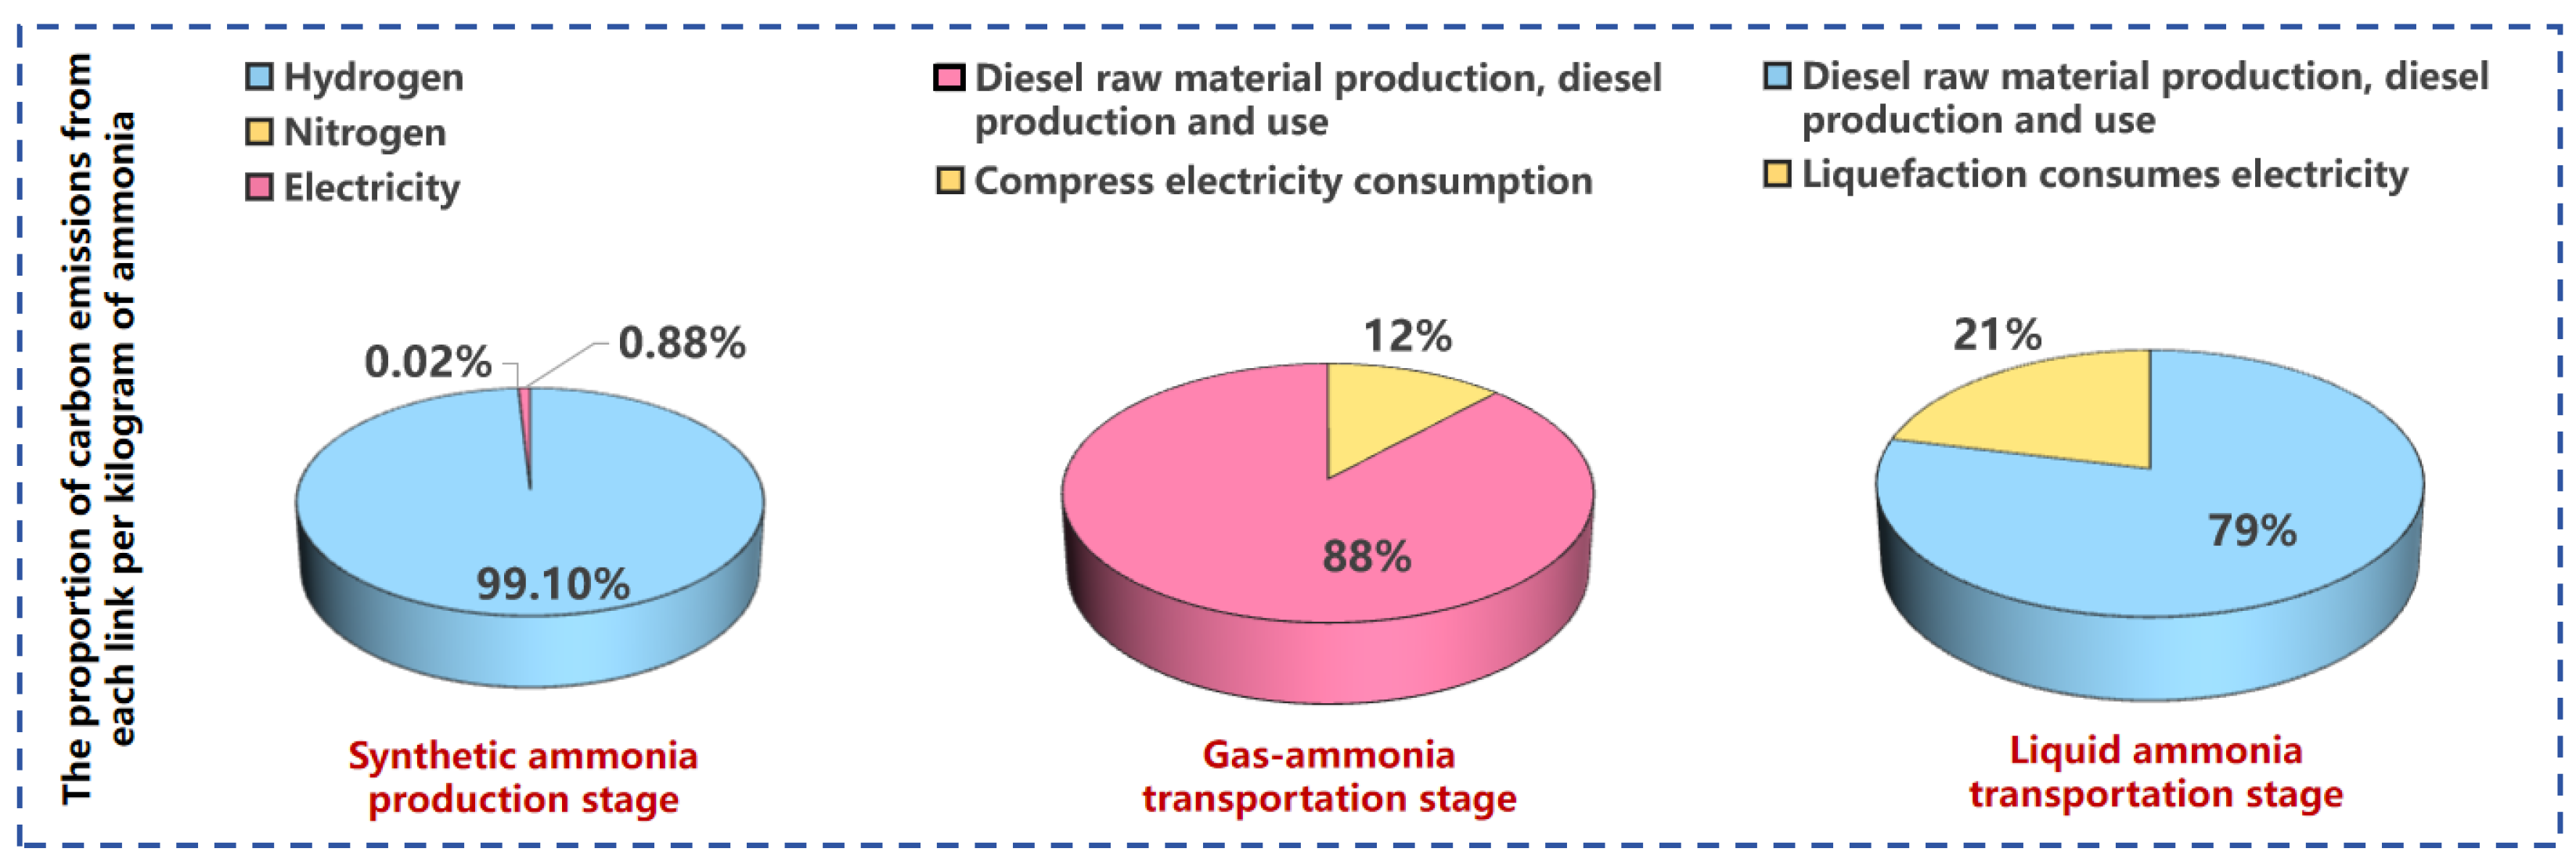
This study utilized Simapro Craft to conduct simulation and modeling of the four carbon emission models constructed above and obtained the unit carbon emissions of synthetic ammonia. As shown in Figure 10, the full life cycle carbon emissions of gaseous ammonia are approximately 0.5733 kgCO2/kgNH3. Among them, the production stage of synthetic ammonia contributes almost all of the cycle carbon emissions, while the emissions in the transportation stage account for less than 1%. The high carbon emissions in the production stage are mainly attributed to the significant hydrogen consumption, which alone emits 0.57 kgCO2/kgNH3. In the transportation stage, there are slight differences in carbon emissions between gaseous and liquid transportation methods. The full life cycle carbon emissions of liquid transportation are 0.5827 kgCO2/kgNH3, which is 0.009455 kgCO2/kgNH3 higher than that of gaseous transportation. This difference is due to the liquefaction process required before liquid ammonia transportation, which consumes more electricity than the compression process of gaseous ammonia.

4.2. Analysis of the Green Attributes of Green Hydrogen and Its Derivatives

Regarding the determination of green attributes, there are significant differences among different countries and institutions in the carbon emission thresholds for green hydrogen and its derivatives, which directly affects the “green” boundaries of related products. According to international common practices, the carbon emission threshold for green hydrogen is usually measured by the full life cycle carbon dioxide equivalent (kgCO2/kgH2), and the calculation results of this study can be compared horizontally with existing standards.
As shown in Table 6, in terms of hydrogen energy, both the European Union and Japan have set the carbon emission threshold for green hydrogen at 3.4 kgCO2/kgH2. The corresponding carbon emission differences for the PV and wind power paths are 0.23 and 1.97 kgCO2/kgH2 respectively. This indicates that under the renewable energy power structure, both are significantly below the threshold and have clear green attributes. In contrast, the threshold in the United States is set at 4 kgCO2/kgH2, and the carbon emission difference for the wind power path reaches 2.57 kgCO2/kgH2, providing a wider safety margin than the EU. In China, the threshold is 4.9 kgCO2/kgH2, with differences of 1.72 kgCO2/kgH2 and 3.47 kgCO2/kgH2 for the PV and wind power paths, respectively. From the calculation results, it can be seen that China has currently left a relatively large compliance space for green hydrogen projects.
However, from the perspective of engineering economics, renewable power hydrogen projects both domestically and internationally are difficult to achieve completely off-grid operation. Off-grid systems require the installation of 30% to 50% energy storage capacity based on the installed capacity to smooth out fluctuations in wind and solar power and ensure continuous hydrogen supply, which leads to a significant increase in initial investment and operation and maintenance costs, making the internal rate of return of the project difficult to meet the investment threshold. Although the grid-connected solution can reduce the energy storage configuration, the plant’s security load still requires 8% to 12% of grid power support, reducing the proportion of green electricity and requiring settlement at industrial electricity prices, significantly diluting the cost advantage per kilowatt-hour. Comprehensive calculations show that the current fully green power hydrogen production model is basically infeasible under the financial model, and the demonstration facilities that have been put into operation generally adopt grid-connected or hybrid power supply modes, objectively increasing the life cycle carbon emissions of hydrogen.
To assess the impact of grid-supplied electricity on the green-hydrogen attribute, a sensitivity analysis was conducted on grid-carbon intensity. Owing to significant differences in electrolyzer power consumption—which critically determine the upper tolerance of grid carbon intensity for maintaining renewable-hydrogen status—the following breakeven emission factors were derived. When grid electricity substitutes for photovoltaic power in a constant-load alkaline electrolyzer configuration, the threshold grid intensities are 0.28, 0.36 and 0.49 kg CO2/kWh to satisfy the EU/Japan, US, and Chinese renewable hydrogen standards, respectively. If wind-generated electricity is replaced by grid power while using a high-efficiency flexible alkaline stack (≈46 kWh/kgH2), the corresponding limits increase to 0.36, 0.46, and 0.62 kg CO2/kWh. Given China’s current average grid-emission factor of approximately 0.537 kg CO2/kWh, grid-based hydrogen produced with flexible electrolyzers can still meet the domestic “renewable hydrogen” criterion, whereas export-oriented projects will require either a lower-carbon grid or a higher penetration of dedicated renewable generation to comply with more stringent international benchmarks.
To break through the above bottlenecks, China has first released a group standard in the first stage to guide the implementation of “grid-connected renewable hydrogen” projects, aiming to solve technical bottlenecks such as the coordinated operation of large-scale alkaline electrolyzers, narrow power regulation range, and slow dynamic response. Currently, China is promoting the formulation of the latest national standard (the “Clean and Low-Carbon Hydrogen Evaluation Standard”), with the new industry standard benchmarking against the EU standard and planning to set the carbon footprint of clean hydrogen at 3.86 kgCO2/kgH2, with the aim of quickly aligning with international standards and promoting the sustainable development of the green hydrogen industry.
Further extending to the green attribute determination of green methanol, the EU currently uses approximately 0.64 kgCO2/kgCH3OH as the carbon emission threshold (converted from 28.2 gCO2/MJ), while the calculated difference for green methanol in this study is 1.47 kgCO2/kgCH3OH, which is already below this standard. This indicates that under the technical path of “renewable carbon + renewable hydrogen”, green methanol has a relatively large carbon emission space in the usage phase.
In terms of green ammonia, Japan has set its carbon emission threshold at 0.84 kgCO2/kgNH3. Calculations show that the carbon emission differences for gaseous ammonia and liquid ammonia are 0.27 and 0.26 kgCO2/kgNH3, respectively, indicating that it currently meets Japan’s carbon emission requirements. It is worth noting that the International Green Hydrogen Organization (GH2) has proposed a carbon emission threshold for green ammonia only for the “green hydrogen to green ammonia” process segment, with the emission threshold being only 0.3 kgCO2/kgNH3.

4.3. Analysis of Carbon Emission Reduction Benefits of Green Hydrogen and Its Derivatives

Based on the data disclosed and predicted in reports such as the “China Energy Outlook 2060 (2024 Edition)” released by the Research Institute of Sinopec, the current consumption volume of green hydrogen and its derivatives in China and the consumption volume trends at key future nodes are shown in Figure 11.
It can be seen that the consumption volumes of green hydrogen, green ammonia, and green methanol in 2024 are at the initial stage, and they will start to grow rapidly from 2030 and continue to increase until 2060. This indicates the maturity of the preparation technology of green hydrogen and its derivatives, the expansion of the preparation scale, the increase in preparation projects, and the rapid growth in demand for green hydrogen, green ammonia, and green methanol at the consumption end.
Based on the future demand for green hydrogen and its derivatives and the full life cycle carbon emission factors of the three types of products, the carbon emission reduction benefits of green hydrogen, ammonia, and methanol substitution are further calculated. According to Sinopec’s China Energy Outlook 2060 (2024 Edition), Yundao Capital’s 2024 China Green Ammonia Industry Research Report, and international and domestic trends in China’s hydrogen, ammonia, and methanol industrial structures disclosed by YouNeng Network, it is evident that green hydrogen in China primarily replaces gray hydrogen (i.e., coal-based and natural gas-based hydrogen production). Ammonia primarily replaces gray ammonia (coal-based ammonia), and green methanol primarily replaces natural gas-based methanol. Therefore, the baseline emission factors for the environmental benefits of green hydrogen, green ammonia, and green methanol correspond to coal-based hydrogen production [42], natural gas-based hydrogen production [42], coal-based ammonia production [41], and natural gas-based methanol production, respectively [43], and it is assumed that half of the green hydrogen is produced from PV hydrogen production and the other half from wind power hydrogen production. The specific carbon emission reduction benefits are shown in Figure 12.
Overall, the carbon emission reduction benefits of green hydrogen, green ammonia, and green methanol show a significant upward trend over time. The carbon emission reduction benefit of green hydrogen reaches 1.766 billion tons of CO2 in 2060, that of green ammonia reaches 66.62 million tons of CO2, and that of green methanol reaches 30 million tons of CO2. Specifically, due to the faster growth trend of green hydrogen consumption compared to green ammonia and green methanol, its carbon emission reduction benefit growth rate is faster. Considering that the full life cycle carbon emissions of wind power hydrogen production are lower than those of PV hydrogen production, the proportion of wind power hydrogen production may be higher than that of PV hydrogen production in the future, so the carbon emission reduction benefit of green hydrogen may be even higher. For green ammonia and green methanol, the main growth in carbon emission reduction benefits comes after 2045. Due to the complexity and differences in the green ammonia preparation process, even if they are all coal-based ammonia, their full life cycle carbon emissions show significant differences. Therefore, the increase in the carbon emission reduction benefit of green ammonia in Figure 12 is relatively fast.

5. Conclusions

  • Main Research Findings:
A unified LCA model covering the entire process from “wind and solar power generation-electrolysis of water to produce hydrogen-synthesis of methanol/ammonia-product transportation” was established. For the first time, the manufacturing stages of key equipment such as wind turbines, PV modules, and electrolyzers, as well as the negative carbon effect of CO2 capture, were included in the system boundary.
The calculation results show that the full life cycle carbon emissions of wind power hydrogen and PV hydrogen are 1.43 kg and 3.17 kgCO2/kgH2, respectively, both lower than the 4.9 kg threshold for renewable hydrogen in China. The emissions from green hydrogen in the synthesis of methanol and ammonia are −0.83 kgCO2/kgCH3OH and 0.57 kgCO2/kgNH3, respectively.
Based on the demand scenarios in “China Energy Outlook 2060”, green hydrogen, green ammonia, and green methanol can contribute 1.766 billion tons, 66.62 million tons, and 30 million tons of CO2 reduction, respectively, in 2060, becoming key paths for deep decarbonization in the chemical, transportation, and metallurgical industries.
  • Policy and Development Recommendations:
In the near term (2025–2030), “negative carbon methanol” should be taken as a breakthrough. Relying on the northwest wind and solar bases, build a “wind and solar—green hydrogen—negative carbon methanol” demonstration project, and control the full life cycle emissions of green hydrogen within 2.35 kgCO2/kgH2. As soon as possible, include such projects in the CCER methodology and form a replicable and scalable accounting template.
In the medium term (2030–2040), seize the rapid growth of “low-threshold green ammonia”. Through dynamic efficiency subsidies, green freight corridors, and “carbon price difference” trading mechanisms, reduce the emissions of green ammonia to below 0.4 kgCO2/kgNH3, and establish a liquid ammonia intermodal transportation network from coastal ports to inland chemical parks.
In the long term (2040–2060), build a “wind, solar, hydrogen, ammonia, and methanol” zero-carbon industrial cluster. In the “Three Norths” region, build gigawatt-level offshore wind power + hydrogen energy bases, continuously iterate key equipment and materials, and drive the emissions of green hydrogen down to below 2 kg. At the same time, take advantage of tariff advantages to build an “Asian green hydrogen, ammonia, and methanol trade circle” to support the achievement of the domestic 2 billion tons of CO2 reduction target in 2060.
  • Limitations and Future Research Directions:
In this study, the carbon emissions from the manufacturing stage of equipment such as synthesis reactors, compressor units, and large storage tanks were not included in the definition of the boundaries of the ammonia synthesis and methanol synthesis systems. The main reason is that these devices have a large single-unit scale and a long operating life of several decades. It is expected that the embodied carbon emissions, when allocated to each kilogram of ammonia or methanol product, will be extremely low. Moreover, there is a lack of detailed lists and regionalization factors for equipment of corresponding specifications in public databases, resulting in insufficient data availability. Although ignoring these emissions has a limited impact on the overall results at this stage, if a more detailed LCA calculation is to be conducted in the future, on-site investigations will still be necessary to obtain information on equipment quality, material composition, and supply chain to complete this potential emission source. Future research should plan to rely on integrated renewable energy demonstration projects to collect on-site construction and operation data to further reduce model uncertainty.

Author Contributions

Conceptualization, L.M. and M.H.; methodology, L.M. and M.H.; software, D.Z. and J.X.; validation, W.Q. and L.M.; formal analysis, L.M. and M.H.; investigation, W.Q. and K.H.; resources, L.M. and W.Q.; data curation, D.Z. and J.X.; writing—original draft preparation, M.H., D.Z. and J.X.; writing—review and editing, L.M. and K.H.; visualization, D.Z., J.X. and M.H.; supervision, L.M. and T.F.; project administration, T.F.; funding acquisition, T.F. All authors have read and agreed to the published version of the manuscript.

Funding

This research was funded by Research on CGNNE’s CCER Methodology Baseline for Green Hydrogen and Its Derivatives and the Multi-Market Coupling Model, grant number “Z083622024061”, and the APC was funded by CGN Wind Power Company Limited.

Institutional Review Board Statement

Not applicable.

Informed Consent Statement

Not applicable.

Data Availability Statement

The original contributions presented in this study are included in the article. Further inquiries can be directed to the corresponding author.

Conflicts of Interest

Author Lili Ma was employed by the company CGN Wind Power Company Limited. Author Wenwen Qin was employed by the company CGN Wind Power Company Limited. The remaining authors declare that the research was conducted in the absence of any commercial or financial relationships that could be construed as a potential conflict of interest. The funders had no role in the design of the study; in the collection, analyses, or interpretation of data; in the writing of the manuscript; or in the decision to publish the results.

Abbreviations

The following abbreviations are used in this manuscript:
IRENAInternational Renewable Energy Agency
AEAAmmonia Energy Association
LCALife Cycle Assessment
PVPhotovoltaic

References

  1. Abbasi, K.R.; Shahbaz, M.; Zhang, J.J.; Irgan, M.; Alvarado, R. Analyze the environmental sustainability factors of China: The role of fossil fuel energy and renewable energy. Renew. Energy 2022, 187, 390–402. [Google Scholar] [CrossRef]
  2. Zou, C.N.; Zhao, Q.; Zhang, G.S.; Xiong, B. Energy revolution: From a fossil energy era to a new energy era. Nat. Gas Ind. B 2016, 3, 1–11. [Google Scholar] [CrossRef]
  3. Wang, J.N.; Azam, W. Natural resource scarcity, fossil fuel energy consumption, and total greenhouse gas emissions in top emitting countries. Geosci. Front. 2024, 15, 101757. [Google Scholar] [CrossRef]
  4. Höök, M.; Tang, X. Depletion of fossil fuels and anthropogenic climate change—A review. Energy Policy 2013, 52, 797–809. [Google Scholar] [CrossRef]
  5. Feng, S.H.; Shafiei, M.W.M.; Ng, T.F.; Ren, J. The intersection of economic growth and environmental sustainability in China: Pathways to achieving SDG. Energy Strategy Rev. 2024, 55, 101530. [Google Scholar] [CrossRef]
  6. Izuchukwu, A.; Asomah, J.K.; Onoh, U.C. Assessing the Impact of Global Agreements on Combating Climate Change and Advancing Sustainable Development and Global Climate Change. Int. J. Geogr. Environ. Manag. 2024, 10, 2695–1878. [Google Scholar]
  7. Adanma, U.M.; Ogunbiyi, E.O. A comparative review of global environmental policies for promoting sustainable development and economic growth. Int. J. Appl. Res. Soc. Sci. 2024, 6, 954–977. [Google Scholar] [CrossRef]
  8. Dong, H.X.; Deng, Q.Y.; Li, C.J.; Liu, N.; Zhang, W.Z.; Hu, M.Y.; Xu, C.B. A comprehensive review on renewable power-to-green hydrogen-to-power systems: Green hydrogen production, transportation, storage, re-electrification and safety. Appl. Energy 2025, 390, 125821. [Google Scholar]
  9. Guban, D.; Muritala, I.K.; Roeb, M.; Sattler, C. Assessment of sustainable high temperature hydrogen production Technologies. Int. J. Hydrogen Energy 2020, 45, 26156–26165. [Google Scholar] [CrossRef]
  10. Cao, L.C.; Yu, I.K.M.; Xiong, X.X.; Tsang, D.C.W.; Zhang, S.C.; Clark, J.H.; Hu, C.W.; Ng, Y.H.; Shang, J.; Ok, Y.S. Biorenewable hydrogen production through biomass gasification: A review and future Prospects. Environ. Res. 2020, 186, 109547. [Google Scholar] [CrossRef]
  11. Dong, H.R.; Fu, Y.B.; Jia, Q.Q.; Zhang, T.; Meng, D.Q. Low carbon optimization of integrated energy microgrid based on life cycle analysis method and multi time scale energy Storage. Renew. Energy 2023, 206, 60–71. [Google Scholar] [CrossRef]
  12. Chang, M.; Thellufsen, J.Z.; Zakeri, B.; Pickering, B.; Pfenninger, S.; Lund, H.; Alberg Østergaard, P. Trends in tools and approaches for modelling the energy Transition. Appl. Energy 2021, 290, 116731. [Google Scholar] [CrossRef]
  13. Palmer, O.; Radet, H.; Camal, S.; Girard, R. Green and low-carbon hydrogen-the impact of classification rules and subsidies on asset sizing and energy sourcing for electrolytic hydrogen production. In Proceedings of the 2024 IEEE 34th Australasian Universities Power Engineering Conference (AUPEC), Sydney, Australia, 20–22 November 2024; pp. 1–6. [Google Scholar]
  14. Liu, D.; Wang, J.Y.; Rameezdeen, R.; Wang, H. Evolutionary dynamics of promoting green methanol industry based on Public-private partnership cooperation: A case study in China. Int. J. Hydrogen Energy 2025, 148, 149684. [Google Scholar] [CrossRef]
  15. Rodriguez-Pastor, D.A.; Soltero, V.M.; Chacartegui, R. Green methanol production from photovoltaics in Europe. Renew. Energy 2025, 254, 123751. [Google Scholar] [CrossRef]
  16. Schubert, T. Production routes of advanced renewable C1 to C4 alcohols as biofuel components–A review. Biofuels Bioprod. Biorefining 2020, 14, 845–878. [Google Scholar] [CrossRef]
  17. Gao, H.; Wang, X.K.; Wu, K.; Zheng, Y.R.; Wang, Q.Z.; Shi, W.; He, M. A Review of Building Carbon Emission Accounting and Prediction Models. Buildings 2023, 13, 1617. [Google Scholar] [CrossRef]
  18. Shi, W.; Li, W.; Qiao, F.W.; Wang, W.J.; An, Y.; Zhang, G.W. An Inter-provincial carbon quota study in China based on the contribution of clean energy to carbon Reduction. Energy Policy 2023, 182, 113770. [Google Scholar] [CrossRef]
  19. Finnveden, G.; Hauschild, M.Z.; Ekvall, T.; Guinée, J.; Heijungs, R.; Hellweg, S.; Koehler, A.; Pennington, D.; Suh, S. Recent developments in Life Cycle Assessment. J. Environ. Manage 2009, 91, 1–21. [Google Scholar] [CrossRef]
  20. Qin, W.L.; Rong, N. Low-Carbon and Economical Optimal Scheduling of an Integrated Energy System with Hydrogen Energy Cascade Based on a Whole Life Cycle Approach. Power Syst. Clean Energy 2025, 41, 145–154. [Google Scholar]
  21. Zheng, L.X.; Zhao, D.Q.; Qi, X.L.; Chen, Y.S. Research on Energy Efficiency, Carbon Emission and Economy of Hydrogen Production Routes in China Based on Life Cycle Assessment Method. J. Eng. Thermophys. 2022, 43, 2305–2317. (In Chinese) [Google Scholar]
  22. de Kleijne, K.; Huijbregts, M.A.J.; Knobloch, F.; Zelm, R.V.; Hilbers, J.P.; de Coninck, H.; Hanssen, S.V. Worldwide greenhouse gas emissions of green hydrogen production and transport. Nat. Energy 2024, 9, 1139–1152. [Google Scholar] [CrossRef]
  23. Bai, Z.; Hao, W.J.; Li, Q.; Hao, H.L.; Wen, C.F.; Guo, S.; Huang, X.K. Capacity configuration optimization of wind-solar hydrogen production based on life cycle assessment. Integr. Intell. Energy 2024, 46, 1–11. [Google Scholar]
  24. Qian, J.J.; Xu, D.L.; Yuan, L.; Li, G.H.; Gao, R.Y.; Xu, B.S. Low-carbon Economic Operation Model of Integrated Energy System Considering the Whole Process Carbon Footprint and Flexible Output Models. Guangdong Electr. Power 2023, 36, 19–29. [Google Scholar]
  25. Huang, X.Y.; Xie, M.H.; Li, X.W.; Jiang, L.Y. Comparative Life Cycle Assessment and Carbon Footprint of Typical Hydrogen Energy Products. Environ. Sci. 2024, 45, 5641–5649. (In Chinese) [Google Scholar]
  26. Chu, Y.B.; Zhou, K.L.; Hu, R.; Yang, Z.W. Diversified hydrogen production methods can reduce carbon dioxide emissions and energy consumption across Chinese cities. Commun. Earth Environ. 2025, 6, 471. [Google Scholar] [CrossRef]
  27. Liu, D.; Liu, Y.M.; Sun, K. Policy impact of cancellation of wind and photovoltaic subsidy on power generation companies in China. Renew. Energy 2021, 177, 134–147. [Google Scholar] [CrossRef]
  28. Bonacina, C.N.; Gaskare, N.B.; Valenti, G. Assessment of offshore liquid hydrogen production from wind power for ship refueling. Int. J. Hydrogen Energy 2021, 47, 1279–1291. [Google Scholar] [CrossRef]
  29. Tan, Z.F.; Tan, C.X.; Liang, Y. Techno-Economic Evaluation of Distributed Photovoltaic Hydrogen Production—Cost benet analysis based on the perspective of the entire lifecycle. Price Theory Pract. 2024, 3, 95–100. (In Chinese) [Google Scholar]
  30. Rinker, G. Minimum work associated with separating nitrogen from air: An exergy analysis. F1000Research 2024, 13, 158. [Google Scholar] [CrossRef]
  31. Adeli, K.; Nachtane, M.; Faik, A.; Saifaoui, D.; Boulezhar, A. How green hydrogen and ammonia are revolutionizing the future of energy production: A comprehensive review of the latest developments and future prospects. Appl. Sci. 2023, 13, 8711. [Google Scholar] [CrossRef]
  32. Du, Y.Y.; Huang, H.; Liu, H.B.; Zhao, J.Y.; Yang, Q.Z. Life Cycle Assessment of Abandonment of Onshore Wind Power for Hydrogen Production in China. Sustainability 2024, 16, 5772. [Google Scholar] [CrossRef]
  33. Yu, G.; Chen, Q.Q.; Wang, D.F.; Tang, Z.Y. Strategy-based optimization and life cycle environmental impact assessment of a stable photovoltaic power-to-hydrogen system. Energy Convers. Manag. 2024, 315, 118747. [Google Scholar]
  34. Estevez, R.; Aguado-Deblas, L.; Bautista, F.M.; López-Tenllado, F.J.; Romero, A.A.; Luna, D. A Review on Green Hydrogen Valorization by Heterogeneous Catalytic Hydrogenation of Captured CO2 into Value-added Products. Catalysts 2022, 12, 1555. [Google Scholar] [CrossRef]
  35. Li, G.; Ma, Z.R.; Zhao, J.; Zhou, J.L.; Peng, S.P.; Li, Y.L.; Wang, B.D. Research progress in green synthesis of ammonia as hydrogen-storage carrier under ‘hydrogen 2.0 economy’. Clean Energy 2023, 7, 116–131. [Google Scholar] [CrossRef]
  36. Qin, R.; Wang, P.Y.; Lin, C.; Cao, F.; Zhang, J.Y.; Chen, L.; Mu, S.C. Transition Metal Nitrides: Activity Origin, Synthesis and Electrocatalytic Applications. Acta Phys.-Chim. Sin. 2020, 37, 2009099. [Google Scholar] [CrossRef]
  37. Zhang, J.X.; Wang, Z.H.; He, Y.; Li, M.Y.; Wang, X.D.; Wang, B.; Zhu, Y.Q.; Cen, K.F. Comparison of onshore/offshore wind power hydrogen production through water electrolysis by life cycle assessment. Sustain. Energy Technol. Assess. 2023, 60, 103515. [Google Scholar] [CrossRef]
  38. Méndez, L.; Forniés, E.; Garrain, D.; Vázquez, A.P.; Souto, A.; Vlasenko, T. Upgraded metallurgical grade silicon and polysilicon for solar electricity production: A comparative life cycle assessment. Sci. Total Environ. 2021, 789, 147969. [Google Scholar] [CrossRef]
  39. Gerloff, N. Comparative Life-Cycle-Assessment analysis of three major water electrolysis technologies while applying various energy scenarios for a greener hydrogen production. J. Energy Storage 2021, 43, 102759. [Google Scholar] [CrossRef]
  40. Cheng, Y.B. Lifecycle Carbon Emission Analysis of Low-Carbon Methanol Fuel. Green Pet. Petrochem. 2023, 8, 9–16. (In Chinese) [Google Scholar]
  41. Wang, M.H.; Chen, Z.Y.; Wang, W.; Ren, L.; Liu, J.Z.; Ou, X.M. Carbon footprint analysis of China’s ammonia energy production-storage-transportation-utilization full-chain for different application scenarios. Clean Coal Technol. 2024, 30, 1–12+187. (In Chinese) [Google Scholar]
  42. Liu, M.H.; Huang, X.; Li, S.; Shi, Y.X.; Yu, C.Q.; Cai, N.S. Carbon Emission and Energy Efficiency Analysis of Ammonia Production Routes in China from Life-cycle perspective and prospects. Sci. Sin. (Technol.) 2024, 54, 1329–1346. (In Chinese) [Google Scholar] [CrossRef]
  43. Tian, J.X.; Chen, W.; Sun, H.D.; Sun, K.Y.; Lv, Q.L. Current Status and Recommendations for Green Methanol Development. Pet. Refin. Chem. Eng. 2025, 56, 149–155. [Google Scholar]
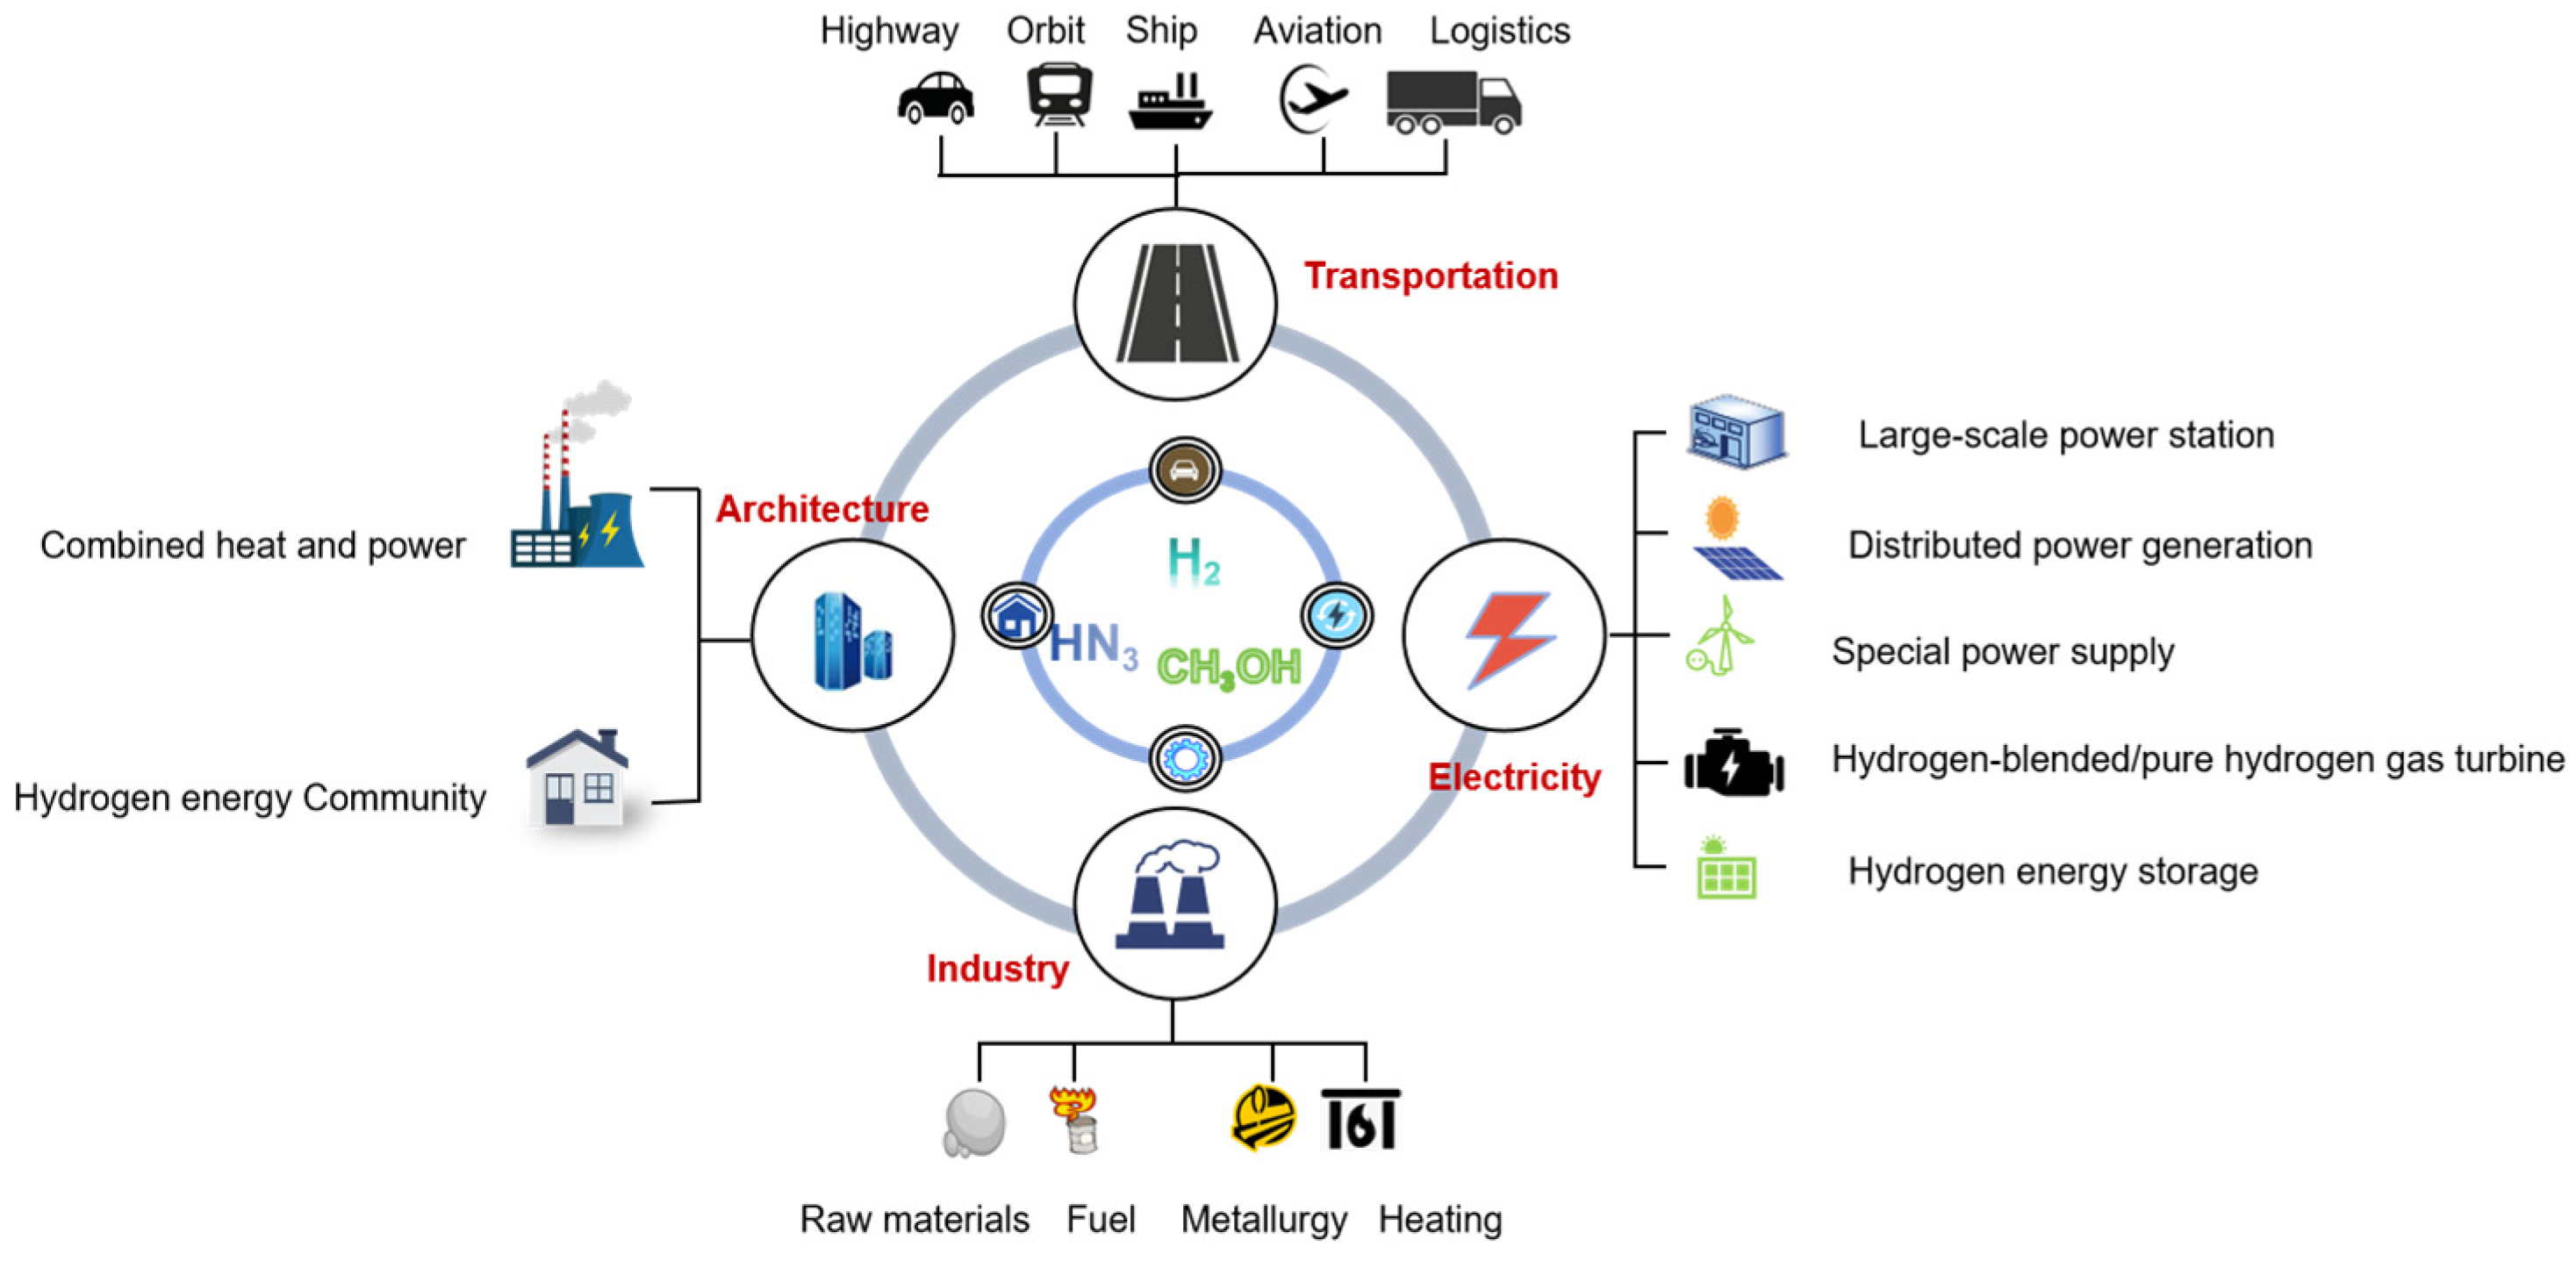
Figure 1. Applications of green hydrogen and its derivatives.
Sustainability 17 09077 g001
Figure 2. Boundary of wind power hydrogen production system.
Sustainability 17 09077 g002
Figure 3. Boundary of PV hydrogen production system.
Sustainability 17 09077 g003
Figure 4. Boundary of the synthetic methanol system.
Sustainability 17 09077 g004
Figure 5. Boundary of the ammonia synthesis system.
Sustainability 17 09077 g005
Figure 6. Life cycle carbon emissions of wind power hydrogen production project.
Sustainability 17 09077 g006
Figure 7. Life cycle carbon emissions of PV hydrogen production project.
Sustainability 17 09077 g007
Figure 8. Life cycle carbon emissions in each stage of PV module manufacturing.
Sustainability 17 09077 g008
Figure 9. Carbon emissions in the production process of methanol from green hydrogen.
Sustainability 17 09077 g009
Figure 10. Proportion of carbon emissions in each stage of ammonia synthesis from green hydrogen.
Sustainability 17 09077 g010
Figure 11. Forecast of green hydrogen and its derivatives consumption demand at key time nodes.
Sustainability 17 09077 g011
Figure 12. (a) Carbon emission reduction benefits of green hydrogen in future years; (b) carbon emission reduction benefits of green ammonia and green methanol in future years.
Sustainability 17 09077 g012
Table 1. Data list of each link in wind power hydrogen production.
StageList
Onshore Wind Turbine Component
Manufacturing Phase
Cement:
3.42 × 10⁻³ kg
Copper:
4.6 × 10⁻⁵ kg
Glass fiber:
1.06 × 10⁻⁴ kg
Neodymium iron boron:
6 × 10⁻⁶ kg
Iron:
9.99 × 10⁻⁴ kg
Onshore Wind
Farm Construction Phase
Aluminum:
2.09 × 10⁻⁴ kg
Cast iron:
1.6 × 10⁻⁴ kg
Cement:
3.67 × 10⁻² kg
Iron:
1.37 × 10⁻² kg
Alkaline Water Electrolysis
Hydrogen Production System Construction Phase
Acrylonitrile butadiene styrene:
1.07 × 10⁻⁴ kg
Aluminum:
6.02 × 10⁻⁴ kg
Copper:
2.68 × 10⁻³ kg
Graphite:
5.76 × 10⁻⁴ kg
Nickel:
2.01 × 10⁻² kg
Potassium hydroxide:
1.46 × 10⁻² kg
Iron:
1.84 × 10⁻¹ kg
Zirconium oxide:
1.2 × 10⁻³ kg
Electric power:
4.951 × 101 kWh
Alkaline Water Electrolysis Hydrogen Production
System Operation and Maintenance Phase
Electric power:
0.575 × 101 kWh
Water:
1 × 10⁻² m3
Table 2. Data list of each link in PV hydrogen production.
StageData List
PV Module Manufacturing PhaseMetallurgical grade siliconCharcoal
1.7 × 10⁻³ kg
silica sand
2.7 × 10⁻² kg
Petroleum:
5 × 10⁻³ kg
Solar grade siliconLime:
5.8 × 10⁻³ kg
Graphite:
5.4 × 10⁻⁵ kg
Polycrystalline silicon waferSodium hydroxide:
3.8 × 10⁻⁵ kg
Acetic acid:
5.6 × 10⁻⁴ kg
Acrylic acid:
2.8 × 10⁻⁵ kg
Brass:
7.45 × 10⁻⁵ kg
Steel:
2.8 × 10⁻⁵ kg
Nickel:
1 × 10⁻⁵ kg
Solar cellNitric acid:
2.4 × 10⁻⁴ kg
Ammonia:
3.3 × 10⁻⁴ kg
Aluminum:
5.4 × 10⁻⁴ kg
Steel:
1.56 × 10⁻⁷ kg
Polystyrene:
4.0722 × 10⁻⁶ kg
PV moduleMethanol:
2.1556 × 10⁻⁵ kg
Aluminum:
1.374 × 10⁻² kg
Copper:
1.35 × 10⁻³ kg
Iron:
7.768 × 10⁻² kg
PV System Installation PhaseConcrete:
2 × 10⁻⁵ m3
Polypropylene:
9 × 10⁻⁴ kg
Zinc coating:
3.12 × 10⁻² m3
Polyethylene:
9 × 10⁻⁴ kg
Polystyrene:
4.54 × 10⁻³ kg
Electrolyzer Manufacturing PhasePolyethylene:
4.64 × 10⁻¹ kg
Steel production: 2.323 × 10⁻¹ kgSteel plate rolling:
2.323 × 10⁻¹ kg
Electrolyzed Water to Hydrogen PhaseCooling water:
8.81 × 10⁻² kg
Potassium hydroxide:
3.7 × 10⁻³ kg
Table 3. List of materials for methanol synthesis production and transportation.
StageData List
High-concentration CO2 Capture [40]91.62% CO2:
1.23 kg
Propylene:
3.27 × 10⁻⁵ kg
Ethylene glycol solution:
2.42 × 10⁻⁶ kg
Water:
1.19 kg
Lubricating oil:
7.25 × 10⁻⁷ kg
Steam:
4.38 × 10⁻¹ kg
Electricity:
7.99 × 10⁻² kWh
Green Hydrogen ProductionPV/wind power for green hydrogen:
2.305 × 10⁻¹ kg
Green Methanol Production [40]Green hydrogen (using hydrogen production calculation results):
1.99 × 10⁻¹ kg
Captured CO2:
1.46 kg
Electricity:
1.69 × 10⁻¹ kg
Steam:
5.91 × 10⁻¹ kg
Recirculating water:
7.45 × 10² kg
Green Methanol TransportationDiesel feedstock production, diesel production, diesel use:
1.288 × 10⁻⁵ kg·km−1
Table 4. List of materials for green ammonia production and transportation.
StageData List
Air Separation Nitrogen ProductionElectricity:
2.5 × 10⁻² kWh
Green Hydrogen ProductionPV/wind power for green hydrogen:
2.46 × 10⁻¹ kg
Green Ammonia Synthesis ProductionGreen Hydrogen:
2.305 × 10⁻¹ kg
Nitrogen:
1.1487 kg
Electricity:
1.3986 kWh
Circulating Water:
7.45 × 101 kg
Green Gaseous Ammonia Tanker Transportation [39]Diesel feedstock production, diesel production, diesel use:
2.361 × 10⁻⁵ kg·km−1
Compression Electricity Consumption:
1.8 × 10⁻¹ kWh
Green Liquid Ammonia Tanker Transportation [39]Diesel feedstock production, diesel production, diesel use:
2.125 × 10⁻⁵ kg·km−1
Liquefaction Electricity Consumption:
6 × 10⁻¹ kWh
Table 5. Stages of each scenario set.
Phase MeaningIdentifier WF H 2 PV H 2 MeOH N H 3
Power generation equipment manufacturing M M _ WF M _ PV
Power plant construction C C _ WF C _ PV
Electrolyzer installation construction E E _ alk E _ el
Electrolyzer operation and maintenance O O _ alk O _ el
Hydrogen production (reuse) H 2 _ prod
High-concentration CO2 capture C O 2 _ cap
Air separation nitrogen production ASU
Operation of the synthesis device syn MeOH _ syn N H 3 _ syn
Product transportation tr MeOH _ tr N H 3 _ tr
Table 6. Comparison of carbon emissions of green hydrogen/ammonia/methanol with international standards.
Green hydrogen carbon emissions (unit: kgCO2/kgH2)
Country/InstitutionCO2 equivalent thresholdDoes PV green hydrogen meet the standard (Yes/No)PV green hydrogen differenceDoes WF green hydrogen meet the standard (Yes/No)WF green hydrogen difference
European Union3.4Yes0.23Yes1.97
Japan3.4Yes0.23Yes1.97
United States4Yes0.83Yes2.57
China4.9Yes1.73Yes3.47
Green methanol carbon emissions (unit: kgCO2/kgCH3OH)
Country/InstitutionCO2 equivalent thresholdDoes green methanol meet the standard (Yes/No)Green methanol difference
European Union0.64Yes1.47
Green ammonia carbon emissions (unit: kgCO2/kgNH3)
Country/InstitutionCO2 equivalent thresholdDoes gaseous ammonia meet the standard (Yes/No)Gaseous ammonia differenceDoes liquid ammonia meet the standard (Yes/No) Liquid ammonia difference
Japan0.84Yes0.27Yes0.26
International Green Hydrogen Organization0.3 (green hydrogen to green ammonia)----
Disclaimer/Publisher’s Note: The statements, opinions and data contained in all publications are solely those of the individual author(s) and contributor(s) and not of MDPI and/or the editor(s). MDPI and/or the editor(s) disclaim responsibility for any injury to people or property resulting from any ideas, methods, instructions or products referred to in the content.