Article

Assessment of Ecological Quality Dynamics and Driving Factors in the Ningdong Mining Area, China, Using the Coupled Remote Sensing Ecological Index and Ecological Grade Index

1
School of Geosciences and Surveying Engineering, China University of Mining and Technology-Beijing, Beijing 100083, China
2
Inner Mongolia Research Institute, China University of Mining and Technology-Beijing, Ordos 017001, China
3
Jizhong Energy Group, Xingtai 054000, China
4
College of Mining and Geomatics Engineering, Hebei University of Engineering, Handan 056006, China
*
Author to whom correspondence should be addressed.
Sustainability 2025, 17(20), 9075; https://doi.org/10.3390/su17209075 (registering DOI)
Submission received: 1 August 2025 / Revised: 1 October 2025 / Accepted: 10 October 2025 / Published: 13 October 2025
(This article belongs to the Special Issue Design for Sustainability in the Minerals Sector)

Abstract

In response to the sustainability challenges of mining, restrictive policies aimed at improving ecological quality have been enacted in various countries and regions. The purpose of this study is to examine the environmental changes in the Ningdong mining area, located on the Loess Plateau, over the past 25 years, due to many factors, such as coal mining, using the area as a case study. In this study, Landsat satellite images from 2000 to 2024 were used to derive the remote sensing ecological index (RSEI), while the RSEI results were comprehensively analyzed using the Sen+Mann-Kendall method with Geodetector, respectively. Simultaneously, this study utilized land use datasets to calculate the ecological grade (EG) index. The EG index was then analyzed in conjunction with the RSEI. The results show that in the time dimension, the ecological quality of the Ningdong mining area shows a non-monotonic trend of decreasing and then increasing during the 25-year period; The RSEI average reached its lowest value of 0.279 in 2011 and its highest value of 0.511 in 2022. In 2024, the RSEI was 0.428; The coupling matrix between the EG and RSEI indicates that the ecological environment within the mining area has improved. Through ecological factor-driven analysis, we found that the ecological environment quality in the study area is stably controlled by natural topography (slope) and climate (precipitation) factors, while also being disturbed by human activities. This experimental section demonstrates that ecological and environmental evolution is a complex process driven by the nonlinear synergistic interaction of natural and anthropogenic factors. The results of the study are of practical significance and provide scientific guidance for the development of coal mining and ecological environmental protection policies in other mining regions around the world.

1. Introduction

The Ningdong mining area is located in the northwestern part of the Loess Plateau [1], which is known for its unique geography and fragile ecological environment [2]. Mining activities on this plateau have further accelerated the evolution of its ecological environment, with coal energy accounting for 53.2% of China’s energy consumption in 2024, and 4.78 billion tons of coal mined in 2024 [3]. There is no doubt that coal resources play a vital role in human development [4], but long-term mining activities have led to a variety of problems, including gangue accumulation and declining vegetation cover [5]. These environmental issues increasingly conflict with China’s ecological protection goals [6].
Traditionally, mine ecological environment monitoring relies on manual inspection, which is inefficient and expensive to meet modern monitoring requirements [7]. The development of remote sensing has compensated for the shortcomings of manual inspection to a certain extent. Remote sensing has become a powerful tool for ecological environment monitoring with its large-scale and long-term sequence monitoring [8]. Ecological environment monitoring of mining areas is of vital importance [9].
In 2006, in order to standardize the ecological environment evaluation criteria nationwide, the Chinese state department formulated a technical criterion for eco-environmental status evaluation (hereinafter referred to as the criterion) [10]. The criterion introduced the traditional ecological index (EI), but the EI itself is difficult to obtain, and the rationality of the index is insufficient [11].
In 2013, Xu proposed the remote sensing ecological index (RSEI) [12], which has received widespread attention since its introduction. The index can exclude the influence of human factors on the weight of indicators [13], and other advantages have been widely used in the monitoring and evaluation of ecological conditions. In 2015, Luo et al. used RSEI to assess the ecological changes in Changning City [14]. Wu et al. carried out ecological evaluations based on RSEI on the Yongding mining area [15], which was the first time that RSEI was utilized for monitoring the mining area. Wang et al. used RSEI to analyze the ecological changes in the wetland of Manas Lake in Xinjiang [16], RSEI is widely used in ecological monitoring processes in different environments, such as cities, mining areas, wetlands, deserts, etc., in order to reveal the influencing factors affecting the changes in RSEI in a closer way. In 2023, Wang et al. used the Geodetector in order to reveal the influencing factors affecting the changes in RSEI in more detail [17]. Meanwhile, improved RSEI indices, such as MRSEI, are employed to study changes in the ecological environment [18]. The RSEI combined with other factors has emerged as a new research direction. Indices similar to RSEI, such as the EG index, have also been utilized to analyze ecological changes in the Yellow River Delta Nature Reserve [19]. Combining RSEI with other indicators, such as EG index analysis, represents a viable and innovative new approach.
This study aims to analyze ecological and environmental changes in the Ningdong mining area by integrating the RSEI framework with EG index analysis. Currently, there are relatively few studies on long-term time-series monitoring of the ecological quality of the Ningdong mining area on the Loess Plateau, especially since the beginning of the 21st century, when sustainable development has gradually become a consensus in various countries and regions. In order to meet the needs of mine monitoring, RSEI and its continuous improvement are powerful tools for tracking and evaluating the surface ecological environment in mining areas. This study leverages the Google Earth Engine (GEE) to process Landsat imagery and calculate RSEI values, enabling the analysis of ecological environment quality trends and driving factors within the Ningdong mining area over the 25-year period from 2000 to 2024. Simultaneously, coupling the RSEI and EG indicators enables precise identification of the internal ecological environment within mining areas. Finally, this study fills a gap in the research related to the long-term time-series ecological monitoring of the Ningdong mining area and provides actionable insights for sustainable land management.

2. Study Area Overview and Data Acquisition

2.1. Study Area Overview

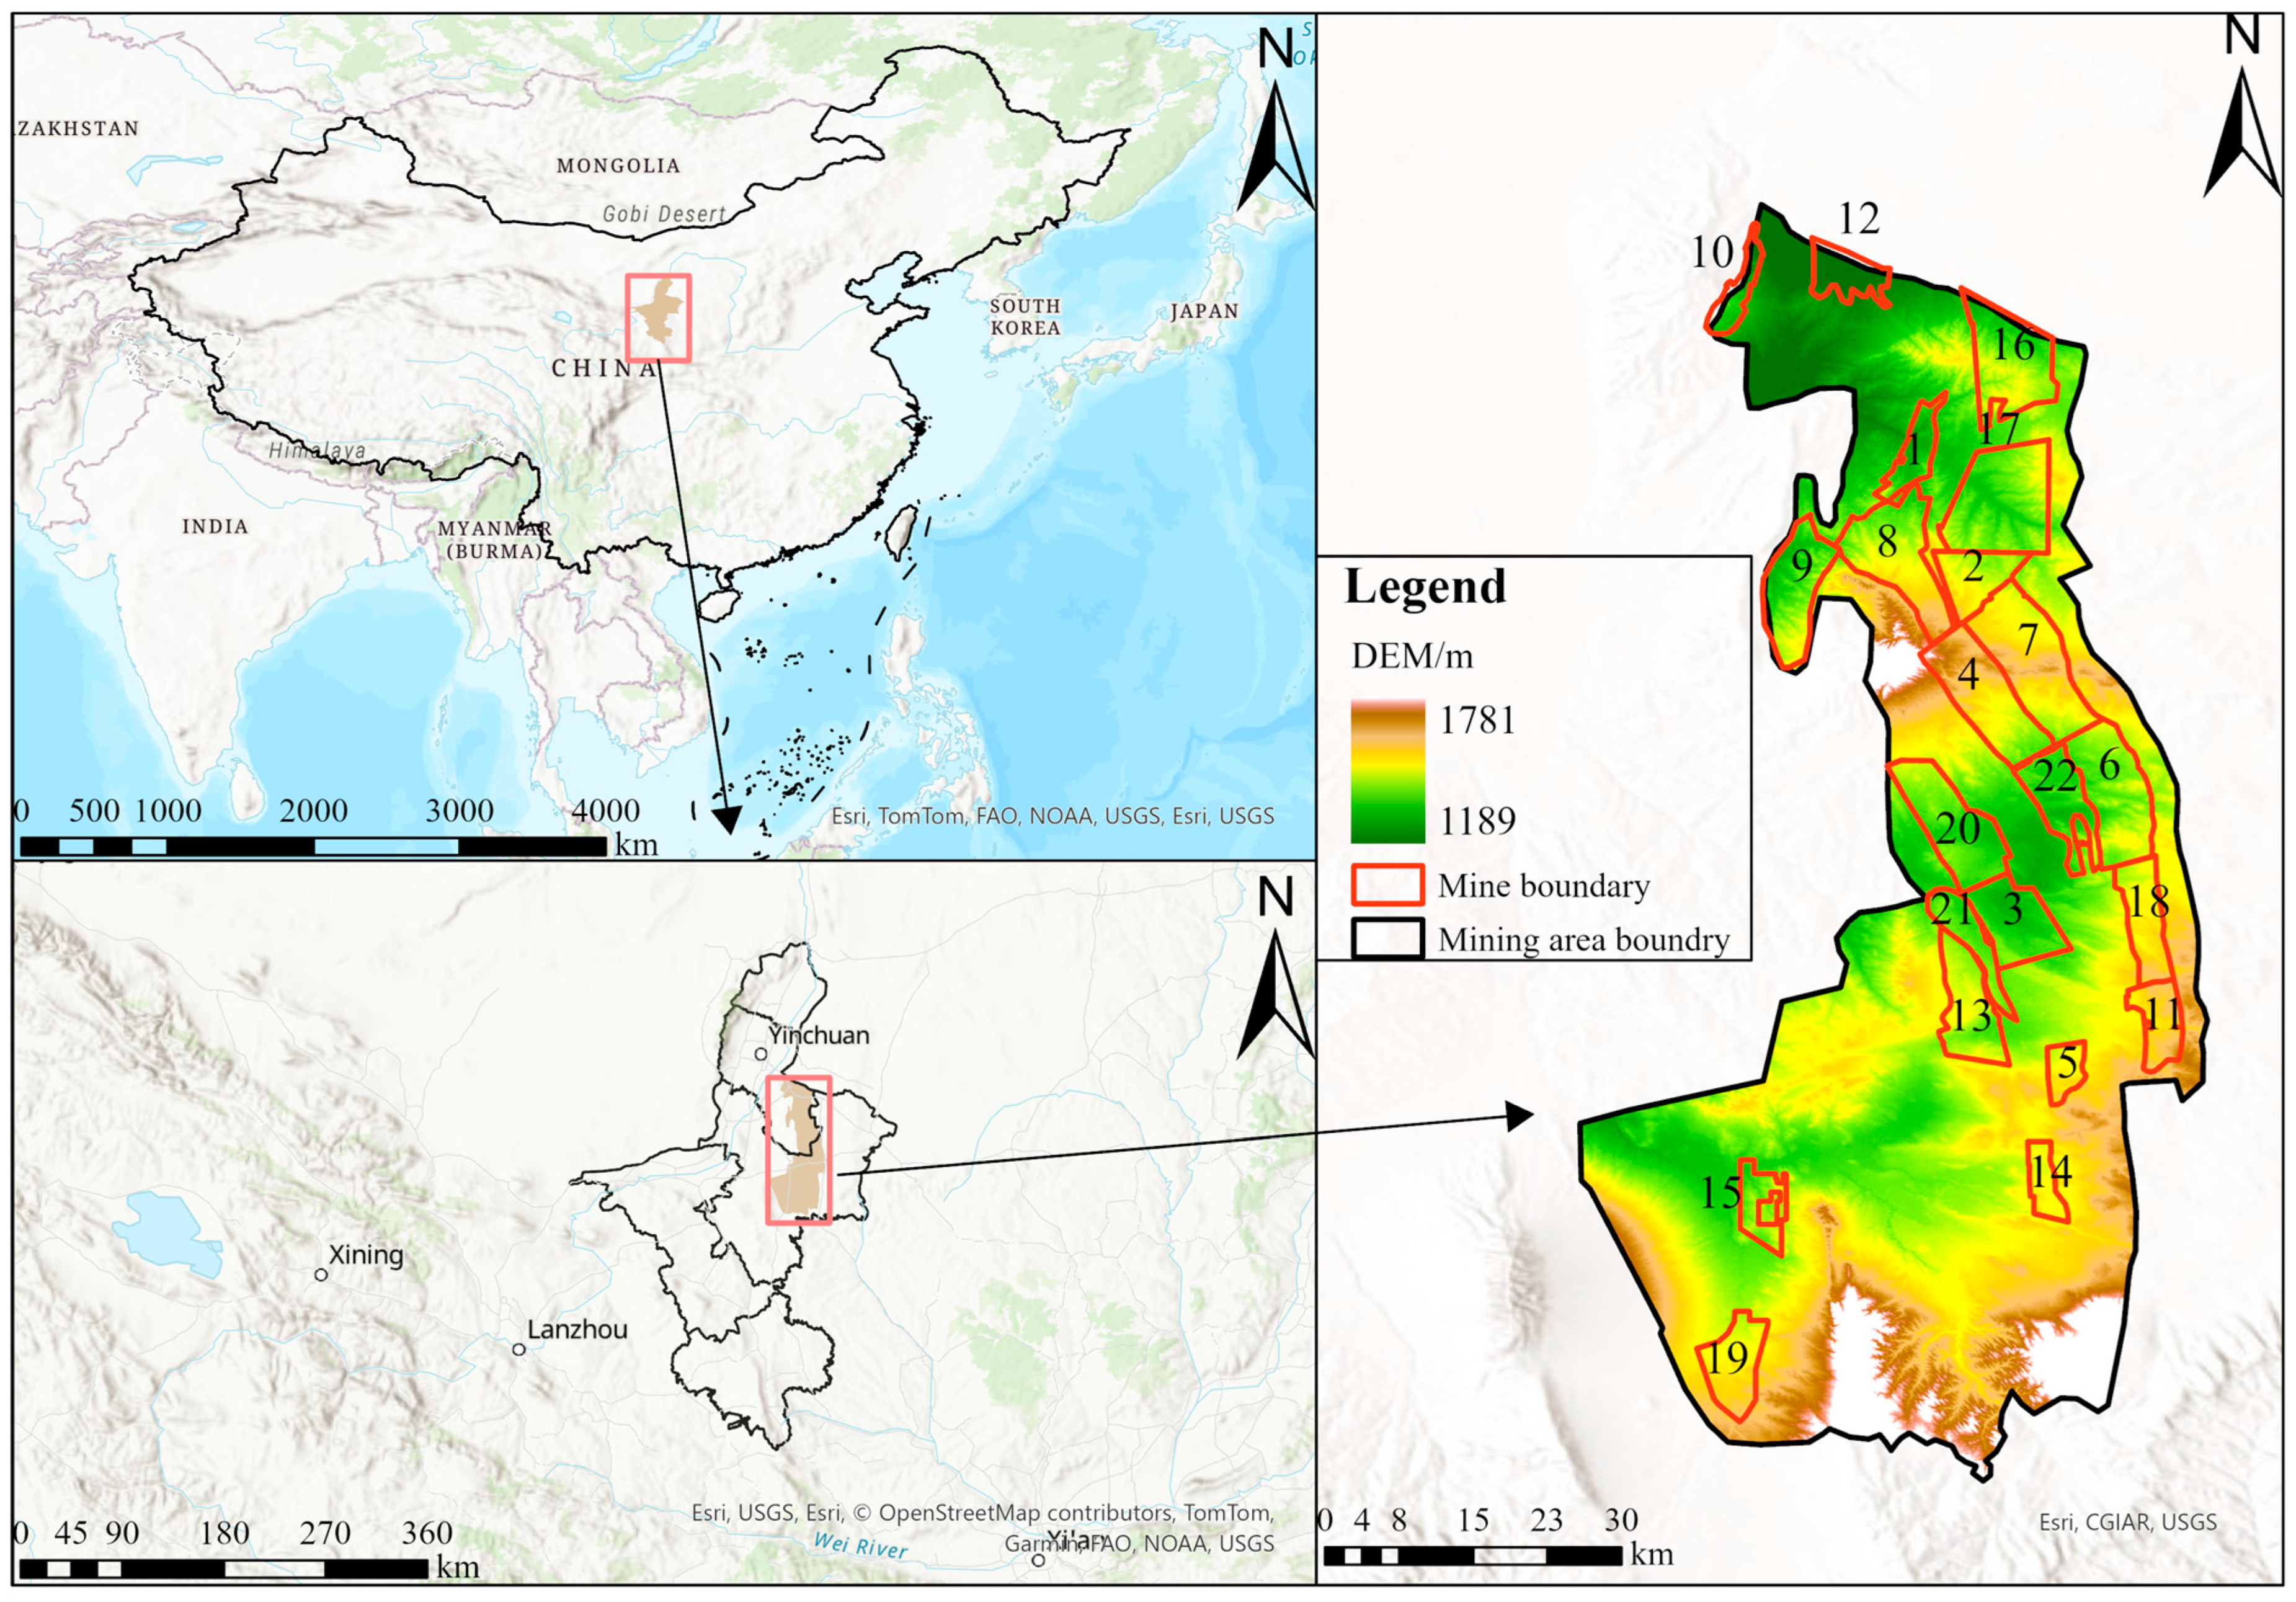
The Ningdong mining area is situated on the northern Loess Plateau of Ningxia within the arid and desert regions of Northwest China. It is located in the northeastern part of the Ningxia Hui Autonomous Region, bordering the western Ordos Region to the east, Pingluo County to the north, and the Helan Mountains to the west, with the Yellow River traversing its periphery [20].The Ningdong region encompasses an area of approximately 3486 km2, spanning 75–95 km from north to south and 20–35 km from east to west. The climate of Ningdong has a temperate continental regime with cold, dry winters, and short, hot summers. The mean annual temperature ranges from 5.9 °C to 8.5 °C, with extreme highs of 38.3 °C and lows of −29.4 °C. Annual precipitation averages approximately 260 mm and is predominantly concentrated in the summer months from July to September. The topography of Ningdong varies considerably, although it is generally flat with minor undulations and some areas featuring low hills. The vegetation cover is sparse, primarily consisting of grassland and xerophytic plant taxa, with an uneven distribution. The surviving vegetation is predominantly composed of cold and drought-resistant shrubs and herbaceous taxa. The dominant soil type is light-gray calcareous soil, which is mainly distributed in the northern part of the region. In contrast, the southern areas have sandy soils with low organic matter content [21]. The Figure 1 shows a location map of the Ningdong mining area and a schematic diagram of the distribution of coal mines, which have an annual output of over one million tons.
Figure 2 depicts the topographic features of field sampling sites surrounding a typical coal mine in the Ningdong mining area. The composite image comprises photographs from six sampling locations, namely (a) Lingxin, (b) Hongliu, (c) Maliantai, (d) Maiduoshan, (e) Shicaocun, and (f) Yangchangwan. These sampling sites exhibit typical arid and semi-arid topography, characterized by sparse surface vegetation dominated by drought-tolerant shrubs and grasslands. Soil exposure is high, with surfaces predominantly grayish-yellow or light brown. The terrain consists mainly of gentle hills and eroded landscapes, featuring relatively smooth undulations. The Ningdong mining area exhibits a unique fragile landscape, where ecological changes are particularly pronounced. The use of RSEI and EG analysis to assess ecological environment changes is particularly effective in such areas. Selecting this area as the research zone aligns with the mining district development plan and serves as a standard model for the sustainable development of the mining industry.

2.2. Data Sources

We used the GEE to access Landsat datasets. We selected and processed Landsat images, spanning 2000–2024, covering the study area, and performed cloud removal. Detailed information on the remote sensing imagery is provided in Table 1.
The image data were obtained from the public data archive of the GEE platform (https://developers.google.com/earth-engine/datasets (accessed on 2 April 2025)). Cloud masks were generated using CFMASK (C Function of Mask) for Landsat images acquired during the peak vegetation season (June to September). Subsequently, images of the study area exhibiting minimal cloud cover were mosaicked and synthesized. Land surface temperature (LST) was derived from the thermal infrared bands, which were resampled to a 30 m resolution. Climate data, including precipitation and temperature, were obtained from the Science data bank platform (https://www.scibd.cn/en (accessed on 3 April 2025)). Topographic data were obtained from the GEE (https://developers.google.com/earth-engine/ (accessed on 4 April 2025)). Slope and aspect were calculated from this topography data in ArcGIS Pro software. Land use data were sourced from the China Land Cover Dataset (CLCD) released by Wuhan University, with a basic resolution of 30 m.

3. Methods

This study employed the GEE platform to calculate the RSEI and EG indices. The RSEI provided a general reflection of ecological and environmental change trends within the mining area. RSEI trends were analyzed using the Theil–Sen slope estimator and Mann–Kendall significance test. In the results analysis, spatial overlay analysis was conducted between the RSEI and EG indices to precisely identify the ecological environment within the mining area. A geographical detector model was applied to analyze the driving factors influencing the RSEI. The specific process is illustrated in Figure 3.

3.1. Remote Sensing Ecological Index

Xu [12] introduced RSEI, a remote sensing-based method for evaluating ecological conditions. The RSEI enables rapid urban ecological monitoring by integrating four components, i.e., greenness, wetness, heat, and dryness, using principal component analysis (PCA). The computational framework is defined as in the following Equation (1):
R S E I = f G r e e n n e s s , W e t n e s s , H e a t , D r y n e s s
where greenness (vegetation abundance) was measured using the normalized difference vegetation index (NDVI). Wetness (soil moisture) was quantified using the tasseled cap wetness index (WET). Dryness (aridity) was expressed as the normalized difference band soil index (NDBSI). Heat (surface temperature) derived from the LST.
(1)
Greenness Component
The NDVI, which is widely used for vegetation monitoring due to its capacity to quantify regional vegetation cover [22], was selected as the greenness indicator. The calculations are as follows:
N D V I = ( ρ N I R ρ R E D ) ρ N I R + ρ R E D
where ρ N I R and ρ R E D represent the surface reflectance in the near-infrared and red-light bands, respectively.
(2)
Wetness Component
The wetness component (WET), derived from the tasseled cap transformation, effectively reflects the water content and moisture status of water bodies and vegetation in the region, respectively [23]. For different generations of Landsat sensor data, the WET was calculated using the following equations:
OLI Data [23]:
W e t = 0.1511 ρ b l u e + 0.1973 ρ g r e e n + 0.3283 ρ r e d + 0.3407 ρ N I R 0.7117 ρ m i r 1 0.4559 ρ m i r 2
ETM+ data [23]:
W e t = 0.2626 ρ b l u e + 0.2141 ρ g r e e n + 0.0926 ρ r e d + 0.0656 ρ N I R 0.7629 ρ m i r 1 0.5388 ρ m i r 2
TM data [23]:
W e t = 0.0315 ρ b l u e + 0.2021 ρ g r e e n + 0.3102 ρ r e d + 0.1594 ρ N I R 0.6706 ρ m i r 1 0.6109 ρ m i r 2
where, ρ b l u e , ρ g r e e n , ρ r e d , ρ N I R , ρ m i r 1 , and ρ m i r 2 represent the band reflectance of blue, green, red, NIR, shortwave infrared 1, and shortwave infrared 2, respectively, from Landsat satellites. During computation, band-specific convolution functions are employed to standardize formulas across different sensors. For calculating long-term WET, Formula (5) is uniformly applied in the GEE.
(3)
Heat Component
The heat component (LST), derived from the surface temperature inversion using the radiative transfer equation [24], reflects localized thermal variations. These temperature dynamics represent indicators of ecological quality, as represented by the following calculation formula:
I λ = B T ε τ + R a + 1 ε R a τ
where I λ   is the intensity of the thermal radiation at a wavelength of λ ; B T is the intensity of the thermal radiation at temperature T; ε is the surface-specific reflectance; τ is the atmospheric transmittance; R a is the upward radiant brightness; R a is the downward radiant luminance, where B T can be calculated by the following equation:
B T = I λ R a 1 ε R a τ ε τ
In a complete surface temperature inversion process, I λ is typically a known value while B T is an unknown quantity. Therefore, Equation (7) represents an alternative formulation of Equation (6), enabling the inversion of B T from the known sensor value I λ .
The surface temperature data can be calculated using Planck’s law for the relationship between the intensity of thermal radiation, temperature, and wavelength, as follows:
L S T = K 2 ln 1 + K 1 B T 273.15
where L S T is the heat component, while K 1 and K 2 are band-related constants; their specific band constants are listed in Table 2.
(4)
Dryness Component
The study area includes urban construction zones and wastelands, which lack vegetation and contribute to surface desiccation. Increased urban construction exacerbates ecological degradation. The dryness indicator [25] is calculated as follows:
I N D B S = I B S + I B I 2
I B S = ρ S W I R 1 + ρ r e d ρ N I R + ρ b l u e ρ S W I R 1 + ρ r e d + ρ N I R + ρ b l u e
I B I = 2 ρ S W I R 1 ρ S W I R 1 + ρ N I R ρ N I R ρ N I R + ρ r e d ρ g r e e n ρ g r e e n + ρ S W I R 1 2 ρ S W I R 1 ρ S W I R 1 + ρ N I R + ρ N I R ρ N I R + ρ r e d + ρ g r e e n ρ g r e e n + ρ S W I R 1
where I B I , I B S ,   a n d   I N D B S are the building index, wasteland bare soil index, and dryness component, respectively.
Before conducting the PCA, the four indices, namely greenness (NDVI), wetness (WET), dryness (NDBSI), and heat (LST), were normalized. This standardized dataset underwent band combination, followed by PCA processing. The first principal component (PC1) was selected as the RSEI when its variance contribution met a predefined threshold. During RSEI calculations, the contribution rate threshold for PC1 is typically set at 60%. The normalization formula is as follows:
I I = I I m i n I m a x I m i n
R S E I = P C 1 P C 1 m i n P C 1 m a x P C 1 m i n
where I I represents the band index after normalization, I is the original band index, and I m a x   a n d   I m i n represent the maximum and minimum values of the index in a certain year, respectively. P C 1 is the preliminarily computed remote sensing eco-index RSEI, and P C 1 m a x   a n d   P C 1 m i n represent the maximum and minimum values of P C 1 , respectively. After processing, the remote sensing ecological index RSEI value ranges from [0, 1]. The smaller value indicates the most degraded ecological environment, while the larger value indicates the most intact ecological environment.

3.2. Ecological Grade Index

Compared to RSEI, the EG index is primarily derived from land use types. Due to significant differences in ecological functions among various land use types, the EG index effectively evaluates the ecological status of a specific area by calculating the average ecological grade of that region. By coupling the RSEI with the EG index, the ecological status of the study area can be accurately revealed. The EG index is calculated using the following formula:
E G i = j = 1 n E G i j × A i j j = 1 n A i j
where E G i represents the ecological grade index for region i; E G i j denotes the ecological grade index for land use type j in region i; A i j denotes the area of land use type j within region i. E G i serves as a negative indicator; the lower the value of E G i , the higher the ecological comprehensive function of the study area, indicating a favorable ecological condition in that region.
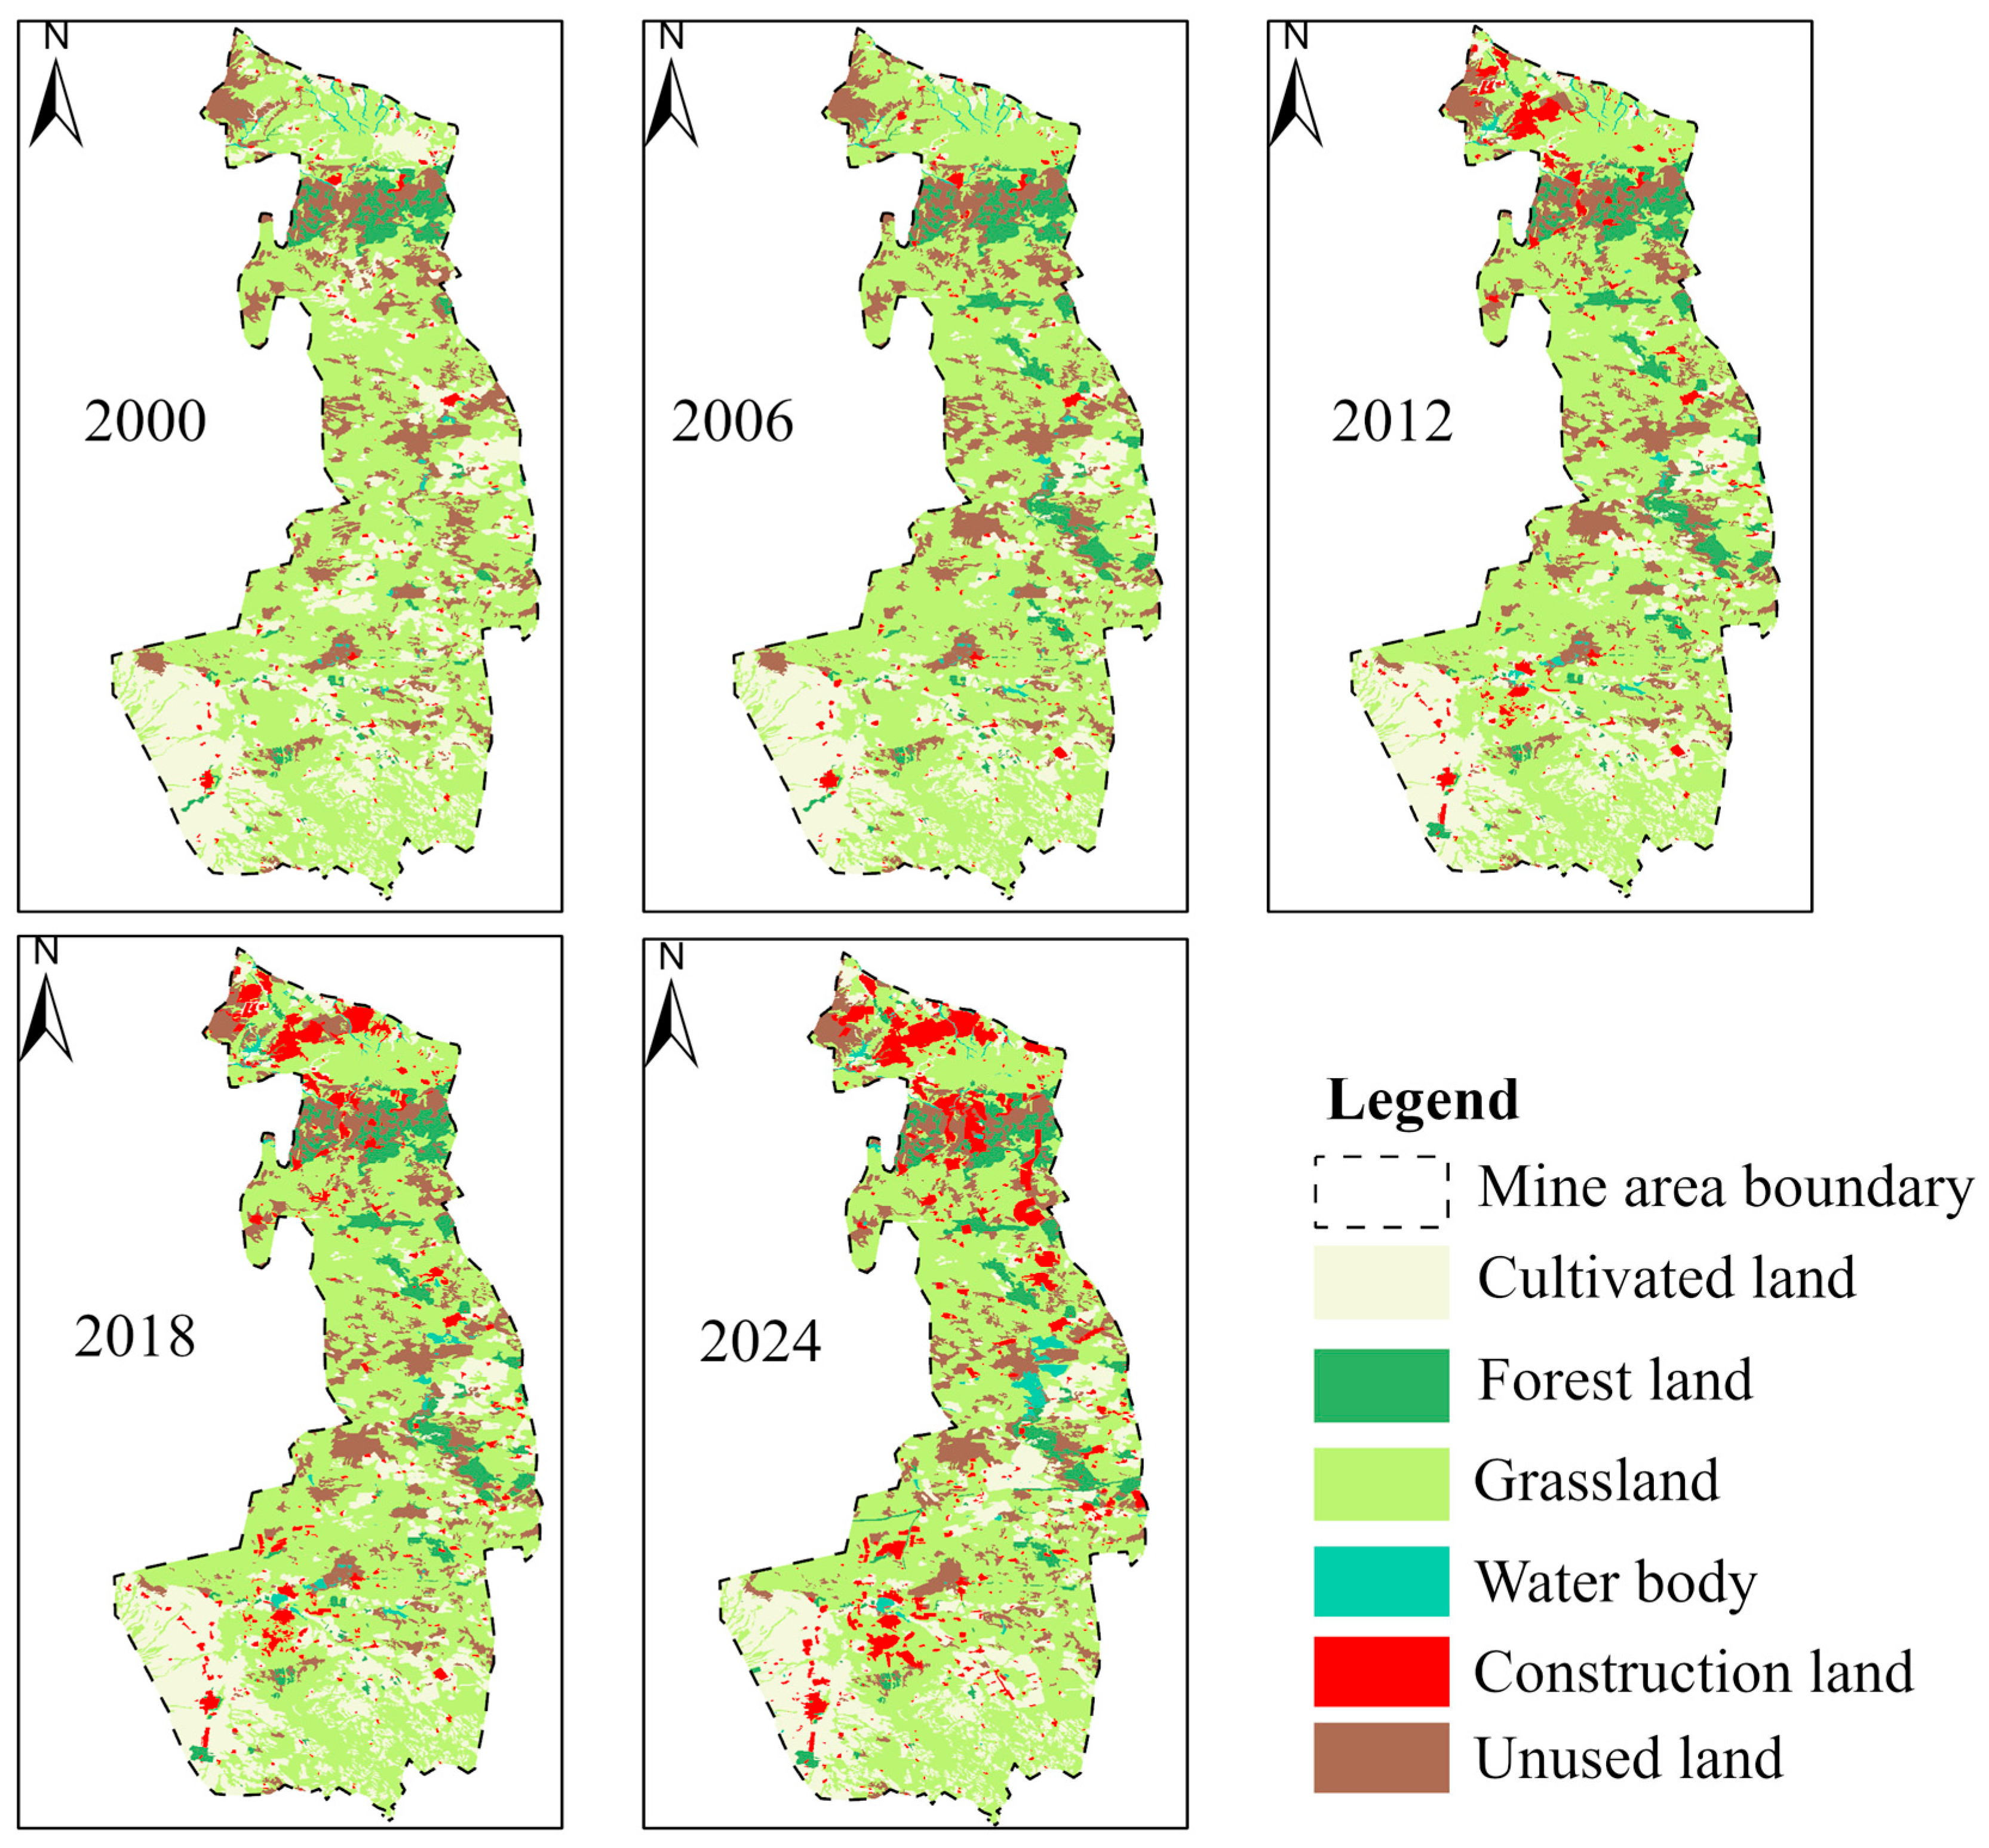
Different land use types provide distinct ecosystem services and contribute differently to the value of ecosystem services, resulting in varying levels of importance. This study builds upon research by Shao et al. [26] concerning the ecological functions of various land types and their transformations. Based on the ecological grades of land use types proposed by LI et al. [27], and in combination with the current land use status of the study area (Figure 4), an ecological grade table for the seven land use types in the study area was adjusted, as shown in Table 3.

3.3. Trend Analysis Using the Theil–Sen Median Slope and the Mann–Kendall Significance Test

Theil–Sen median slope estimation (Sen) is a non-parametric method for estimating the trend of a time series, which is computationally efficient and insensitive to measurement errors and outliers. Therefore, it is suitable for the trend analysis of long-term time series [28]. The Mann–Kendall (MK) significance test is used to assess the significance of the trend in a time series. It does not require the samples to follow a normal distribution and can handle missing values and outliers well [29]. The Sen slope combined with the MK significance test is a common method for estimating the trend in a time series and determining significance, which is calculated as follows:
S R S E I = M e d i a n R S E I J R S E I I j i
where S R S E I is the Sen slope estimator of the trend of the RSEI time series; S R S E I > 0   indicates that the RSEI time series has an increasing trend; and S R S E I < 0 indicates that the RSEI time series has a decreasing trend. Median is the median function; i and j are time series ordinal numbers, 0 < i < j < n , n is the length of the time series, and R S E I I and R S E I J are the RSEI values of the i-th and j-th moments, respectively. Equations (16)–(19) are as follows:
S = i = 1 n 1 j = i + 1 n s i g n R S E I J R S E I I
s i g n R S E I J R S E I I = 1   R S E I J R S E I I > 0 0   R S E I J R S E I I = 0 1   R S E I J R S E I I < 0
V a r S = n n 1 2 n + 5 p = 1 R t p t p 1 2 t p + 5 18
Z = S 1 v a r S   S > 0   0   S = 0 S + 1 v a r S   S < 0
where S is the test statistic; v a r S is the variance of S: the same values of the time series are divided into groups. g is the number of groups; t, p is the number of the same values in each group. For a given confidence level, if ||Z|≥Z_(1 − α/2), i.e., at the confidence level α (significance test level), a significant upward or downward trend is observed in the time series data. |Z| is greater than or equal to 1.645, 1.960, and 2.576, respectively. This implies that it passes the significance test at the confidence levels of 90%, 95%, and 99%, respectively. Here, we selected the 95% confidence level for the significance test.

3.4. Geodetector

Geodetector is a statistical method designed to analyze geographical spatial patterns. Geodetector can be used to discover the strength of the influence of driving factors on research indicators. This quantifies the driving forces of environmental factors on the spatial heterogeneity of geographic phenomena [30]. The factor detector module evaluates the intensity of the influence of individual factors on RSEI using the following equation:
P D , H = 1 1 n σ 2 h = 1 L n h σ h 2
where the factor explanatory power P D , H is between 0 and 1, with higher values indicating that the factor D has a greater effect on the H, RSEI. The total number of samples is n, the indicator factor is L, and the sample size and variance are n h and σ h 2 , respectively. The interaction detector evaluates whether the interaction between independent variables enhances, diminishes, or remains independent to explain the spatial heterogeneity of the dependent variable. This interaction effect is quantified by comparing the explanatory power p(x1) of individual factors with the combined power p(x1 ∩ x2). The pairwise interaction results are summarized in Table 4.

4. Results and Analyses

4.1. Analysis of Spatial Variation in RSEI

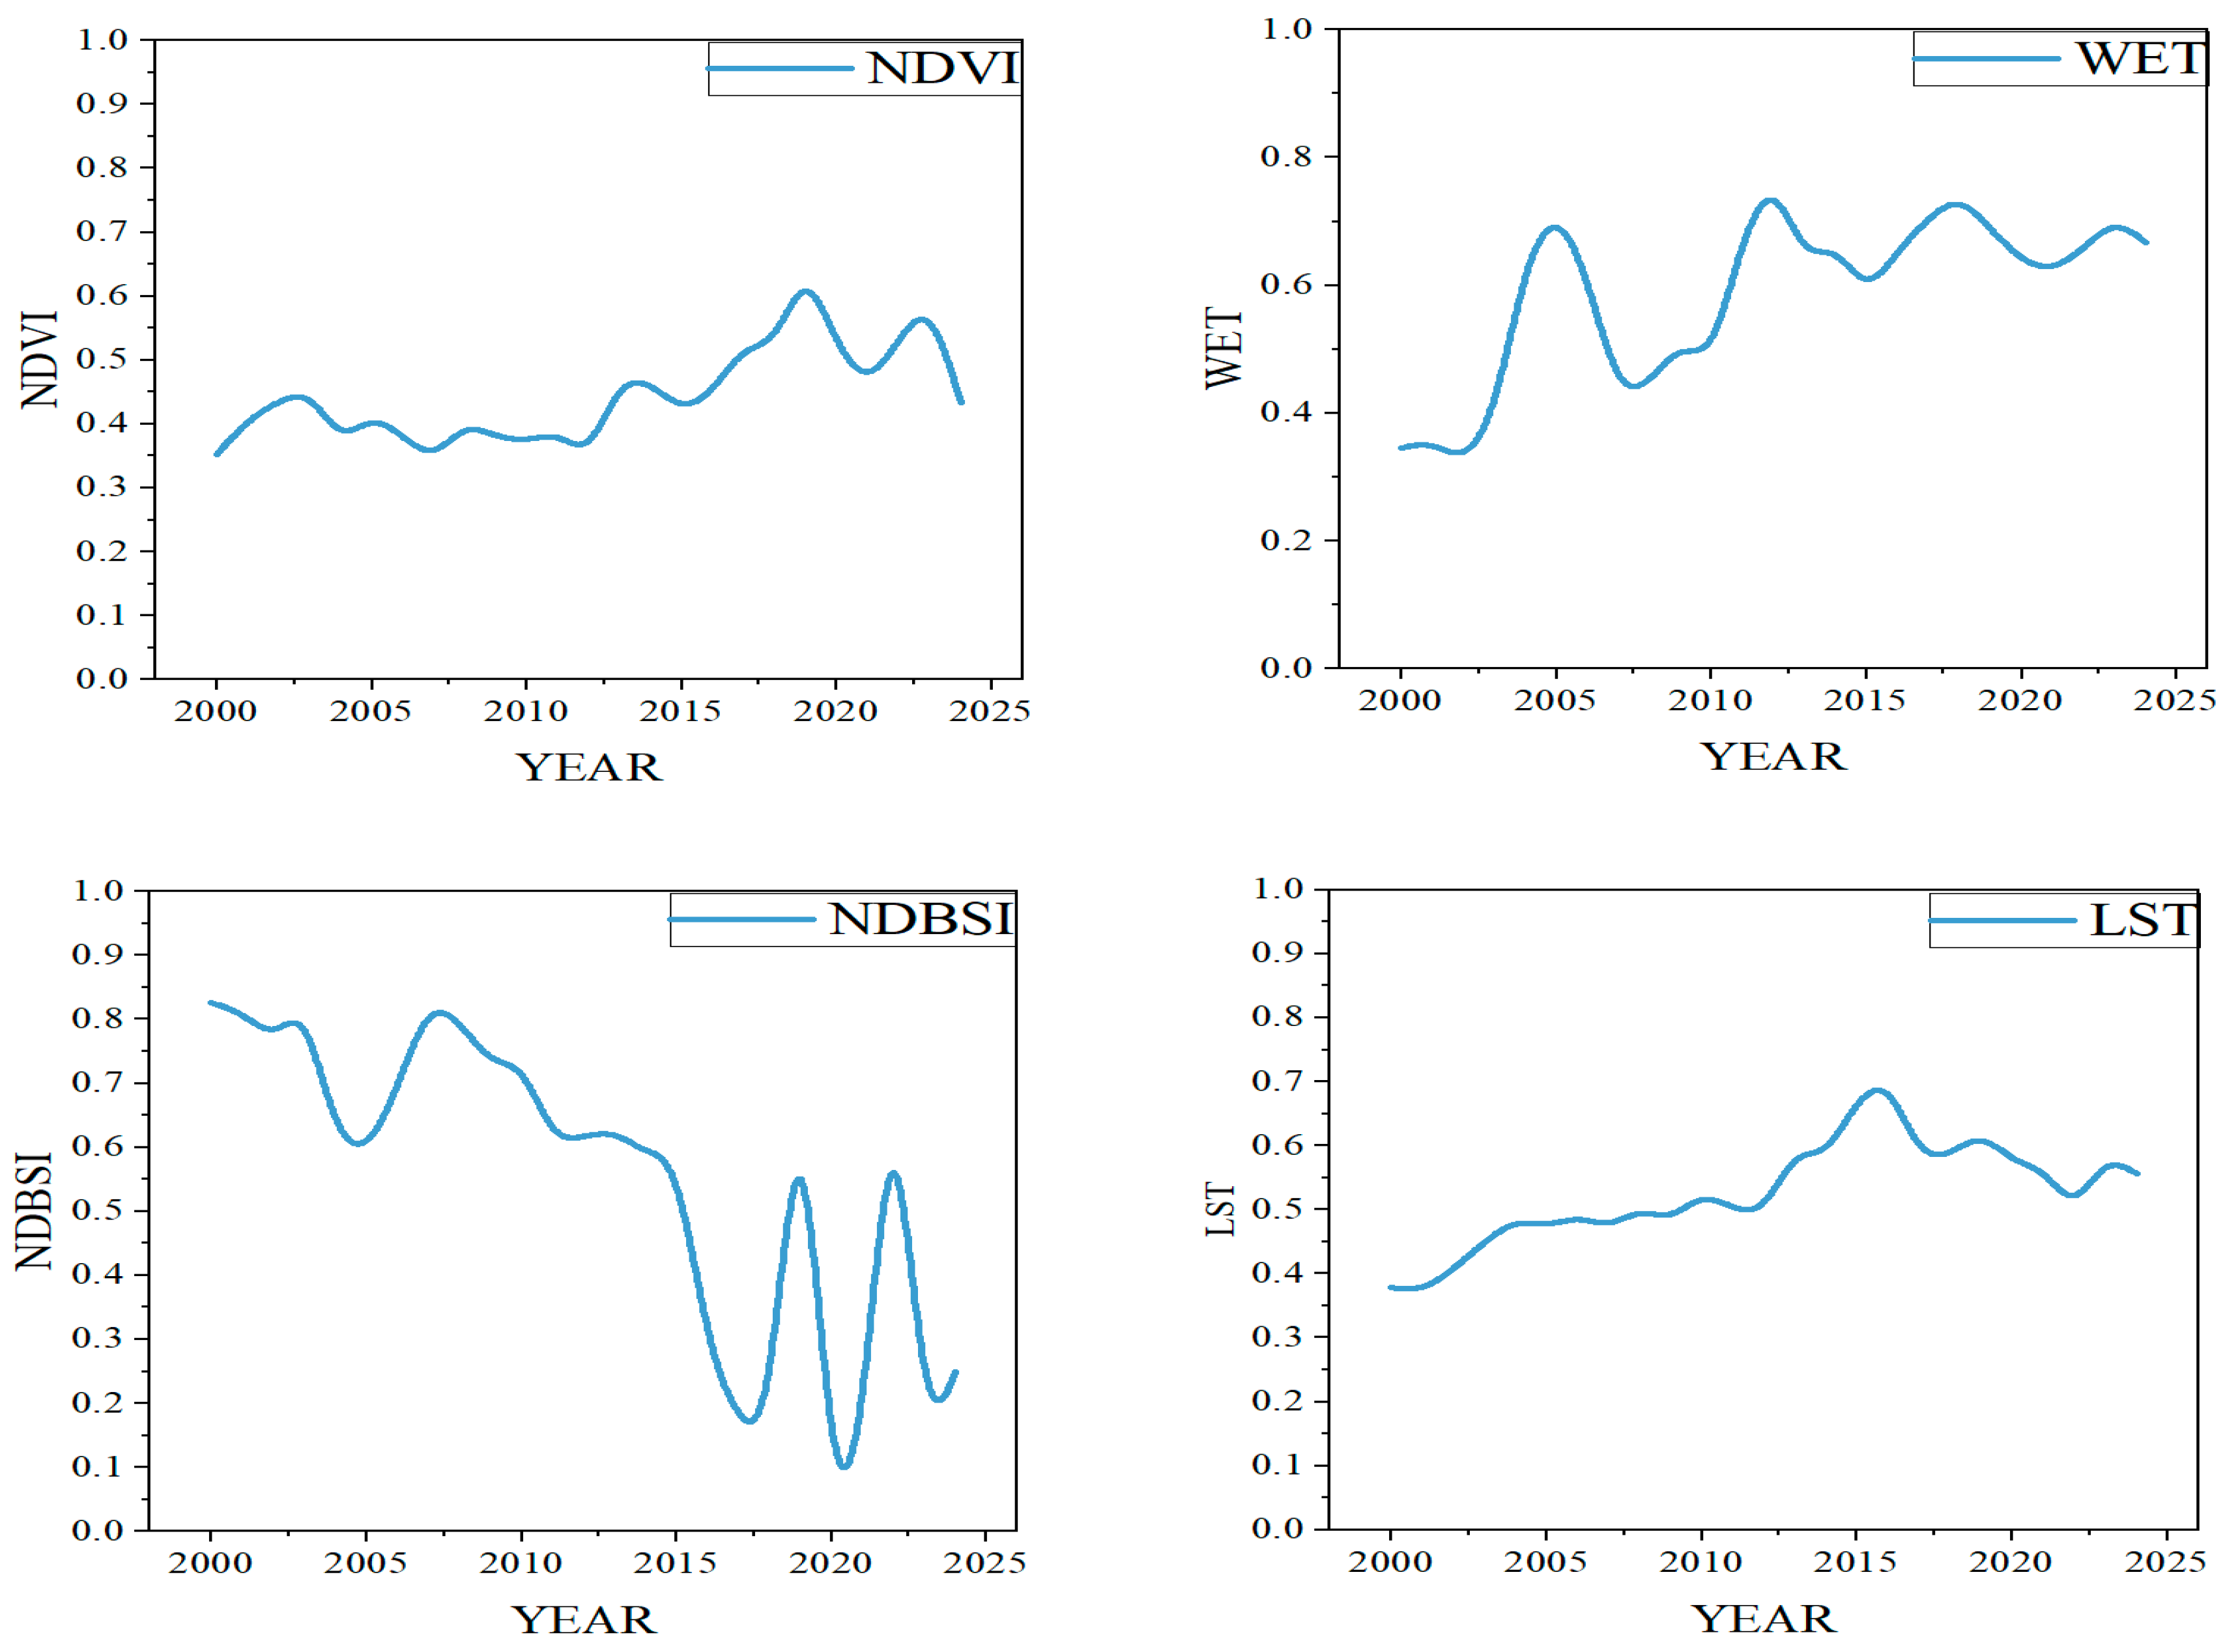
Remote sensing imagery was processed using the GEE platform. This enabled the derivation of RSEI values and their constituent indices (NDVI, WET, NDBSI, and LST) for the Ningdong mining area from 2000–2024. The contribution of the first principal component post-PCA consistently exceeded 60% across most observations, confirming its validity as a primary ecological characteristic. Figure 5 illustrates the temporal variations in NDVI, WET, NDBSI, and LST over the study period. The y-axis values are spatial averages of the indices in the region of a given year. The normalized metric values are shown in Table 5.
Landsat imagery spanning 2000–2024 was used to derive the ecological indices of greenness (NDVI), wetness (WET), dryness (NDBSI), and heat (LST). These indices were normalized, band-synthesized, and subjected to PCA to calculate the RSEI. This reflects the ecological quality of the Ningdong mining area over 25 years. The RSEI ranges from 0, i.e., the poorest ecological conditions to 1, representing optimal ecological conditions, with higher values indicating superior environmental quality.
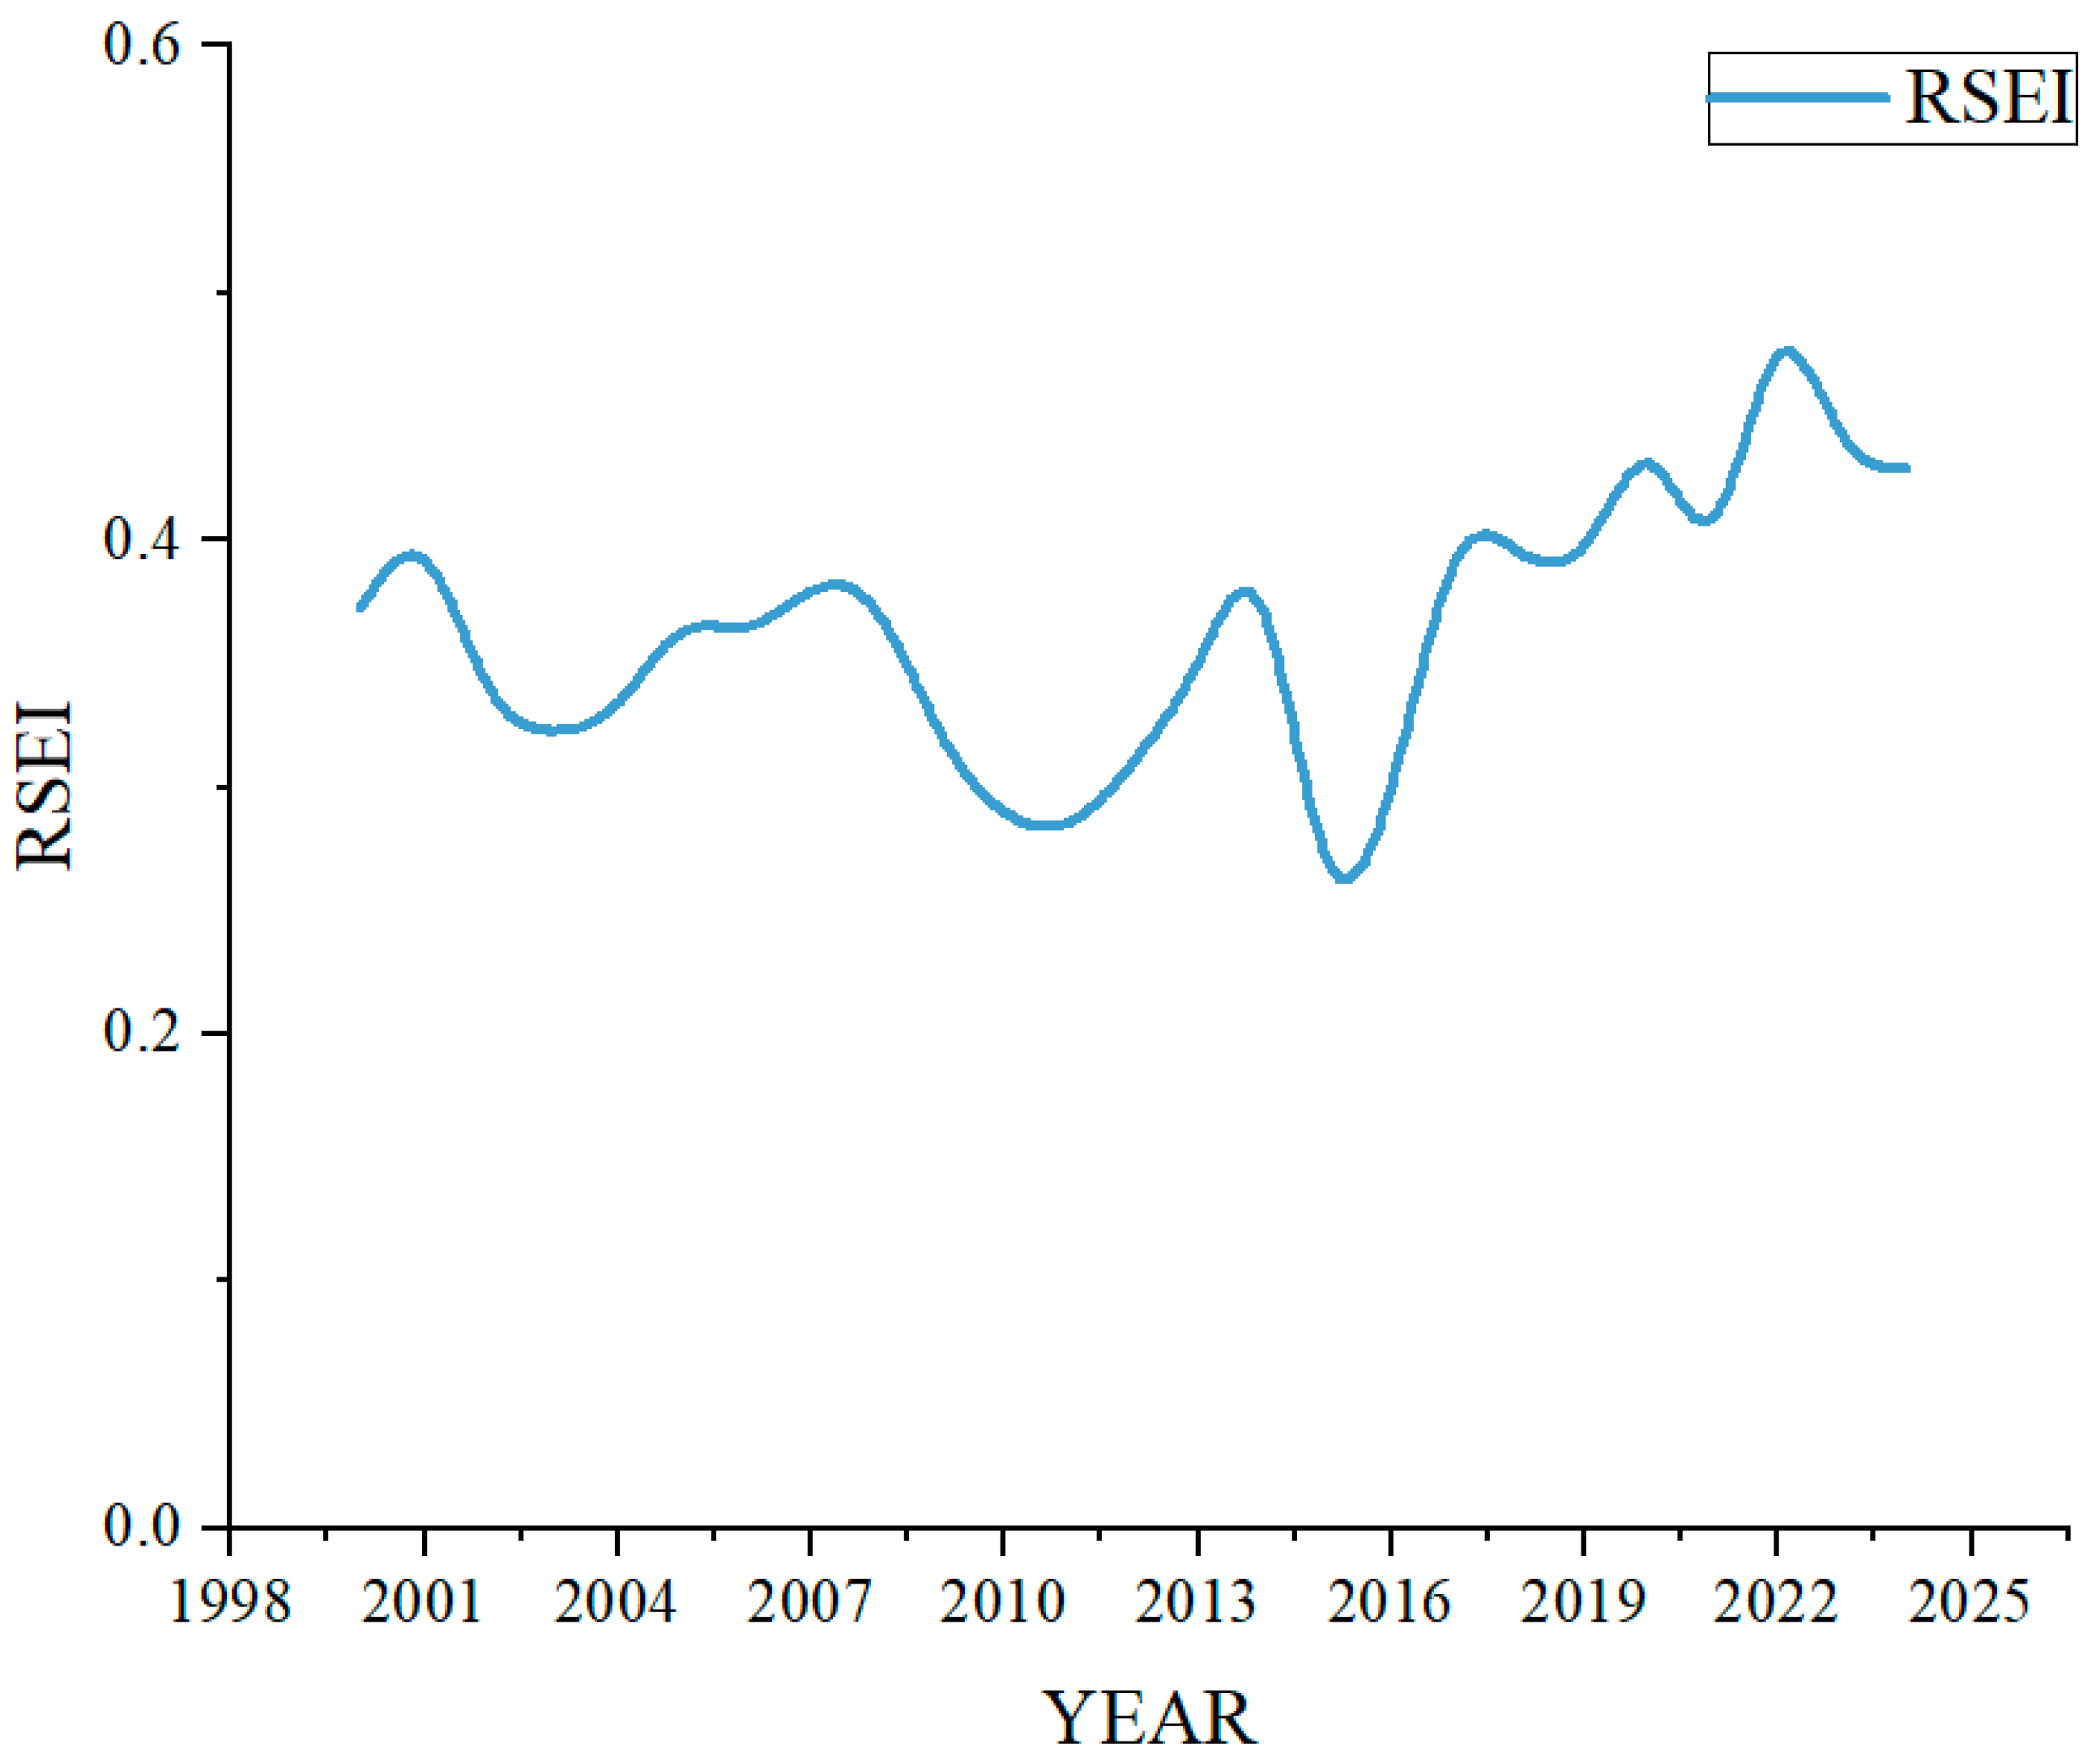
As shown in Figure 6, the distribution of each indicator in the three-dimensional feature space is used to examine their relationship with the RSEI index. The red orbs represent the RSEI data points in 3D space. The blue, green and orange data points represent the projected points of RSEI in the three orthogonal 2D coordinate planes, respectively. Figure 6a shows a three-dimensional projection of NDVI, WET, and RSEI, which have a positive impact on the ecosystem; Figure 6b shows a three-dimensional projection of NDBSI, LST, and RSEI, which have a negative impact on the ecosystem. The top of the scatter plot represents areas with good ecological conditions, mainly regions with high humidity and high vegetation coverage [31]; the RESI change curve is shown in Figure 7.
Figure 8 illustrates the temporal variation in RSEI values from 2000–2024, with more pronounced fluctuations observed during the study period.
We used two fitting methods to analyze changes in RSEI. First, second-order global fitting was used to reveal the overall U-shaped pattern of RSEI. Secondly, segmented fitting was used to investigate the transitive mechanism of RSEI.
As shown in Figure 8a, where 95% confidence intervals are shown in red, for the second-order fit, it is demonstrated by R 2 = 0.41 that the RSEI variation rejects the simple linear assumption, and that the U-shaped trajectory of its existence implies a turn. The location of the critical turning point was analyzed using mathematical methods. Solving the equation yielded an X value of 2012.3, corresponding to a slope of zero. Therefore, we selected 2012 as the turning point for segmented research.
As shown in Figure 8b, the two segments are fitted in segments with 2012 as the turning point. The results of the fit show correlation strengths with reasonable p absolute values between 0.577 and 0.599, which is a medium-strength correlation (usually |p| > 0.5 is practically significant). The R2 at the plausible ends of the model’s explanatory power are close to 30%. It is shown that the linear model explains significantly more variation than the random noise level (especially for macroecological data).
The RSEI showed a declining trend between 2000 and 2012, followed by an upward trajectory from 2013 to 2024, peaking at 0.511 in 2022. A detailed analysis of RSEI trends (Figure 5) identified the lowest values during the 25-year period clustered around 2012, as evidenced by coordinate points including (2010, 0.286), (2011, 0.279), (2012, 0.308), (2015, 0.231), and (2016, 0.288). Here, the x- and y-axes denote the study years and the annual mean RSEI, respectively. Regression analysis partitioning the timeline in 2012 showed distinct ecological phases. A significant decline phase was observed from 2000 to 2012 (slope = −0.00605) followed by accelerated recovery from 2013 to 2024 (slope = 0.01239). The post-2012 recovery rate, quantified by the slope magnitude ratio (|−0.00605| < 0.01239), exceeded the prior degradation rate by 105%, demonstrating enhanced restoration efficacy. Despite the interannual fluctuations exemplified by the 2015 minimum (0.23165), the overarching trajectory shows measurable improvement, with the RSEI increasing from 0.372 to 0.428 in 2000 and 2024, respectively, representing a 15.2% net gain over the study period.
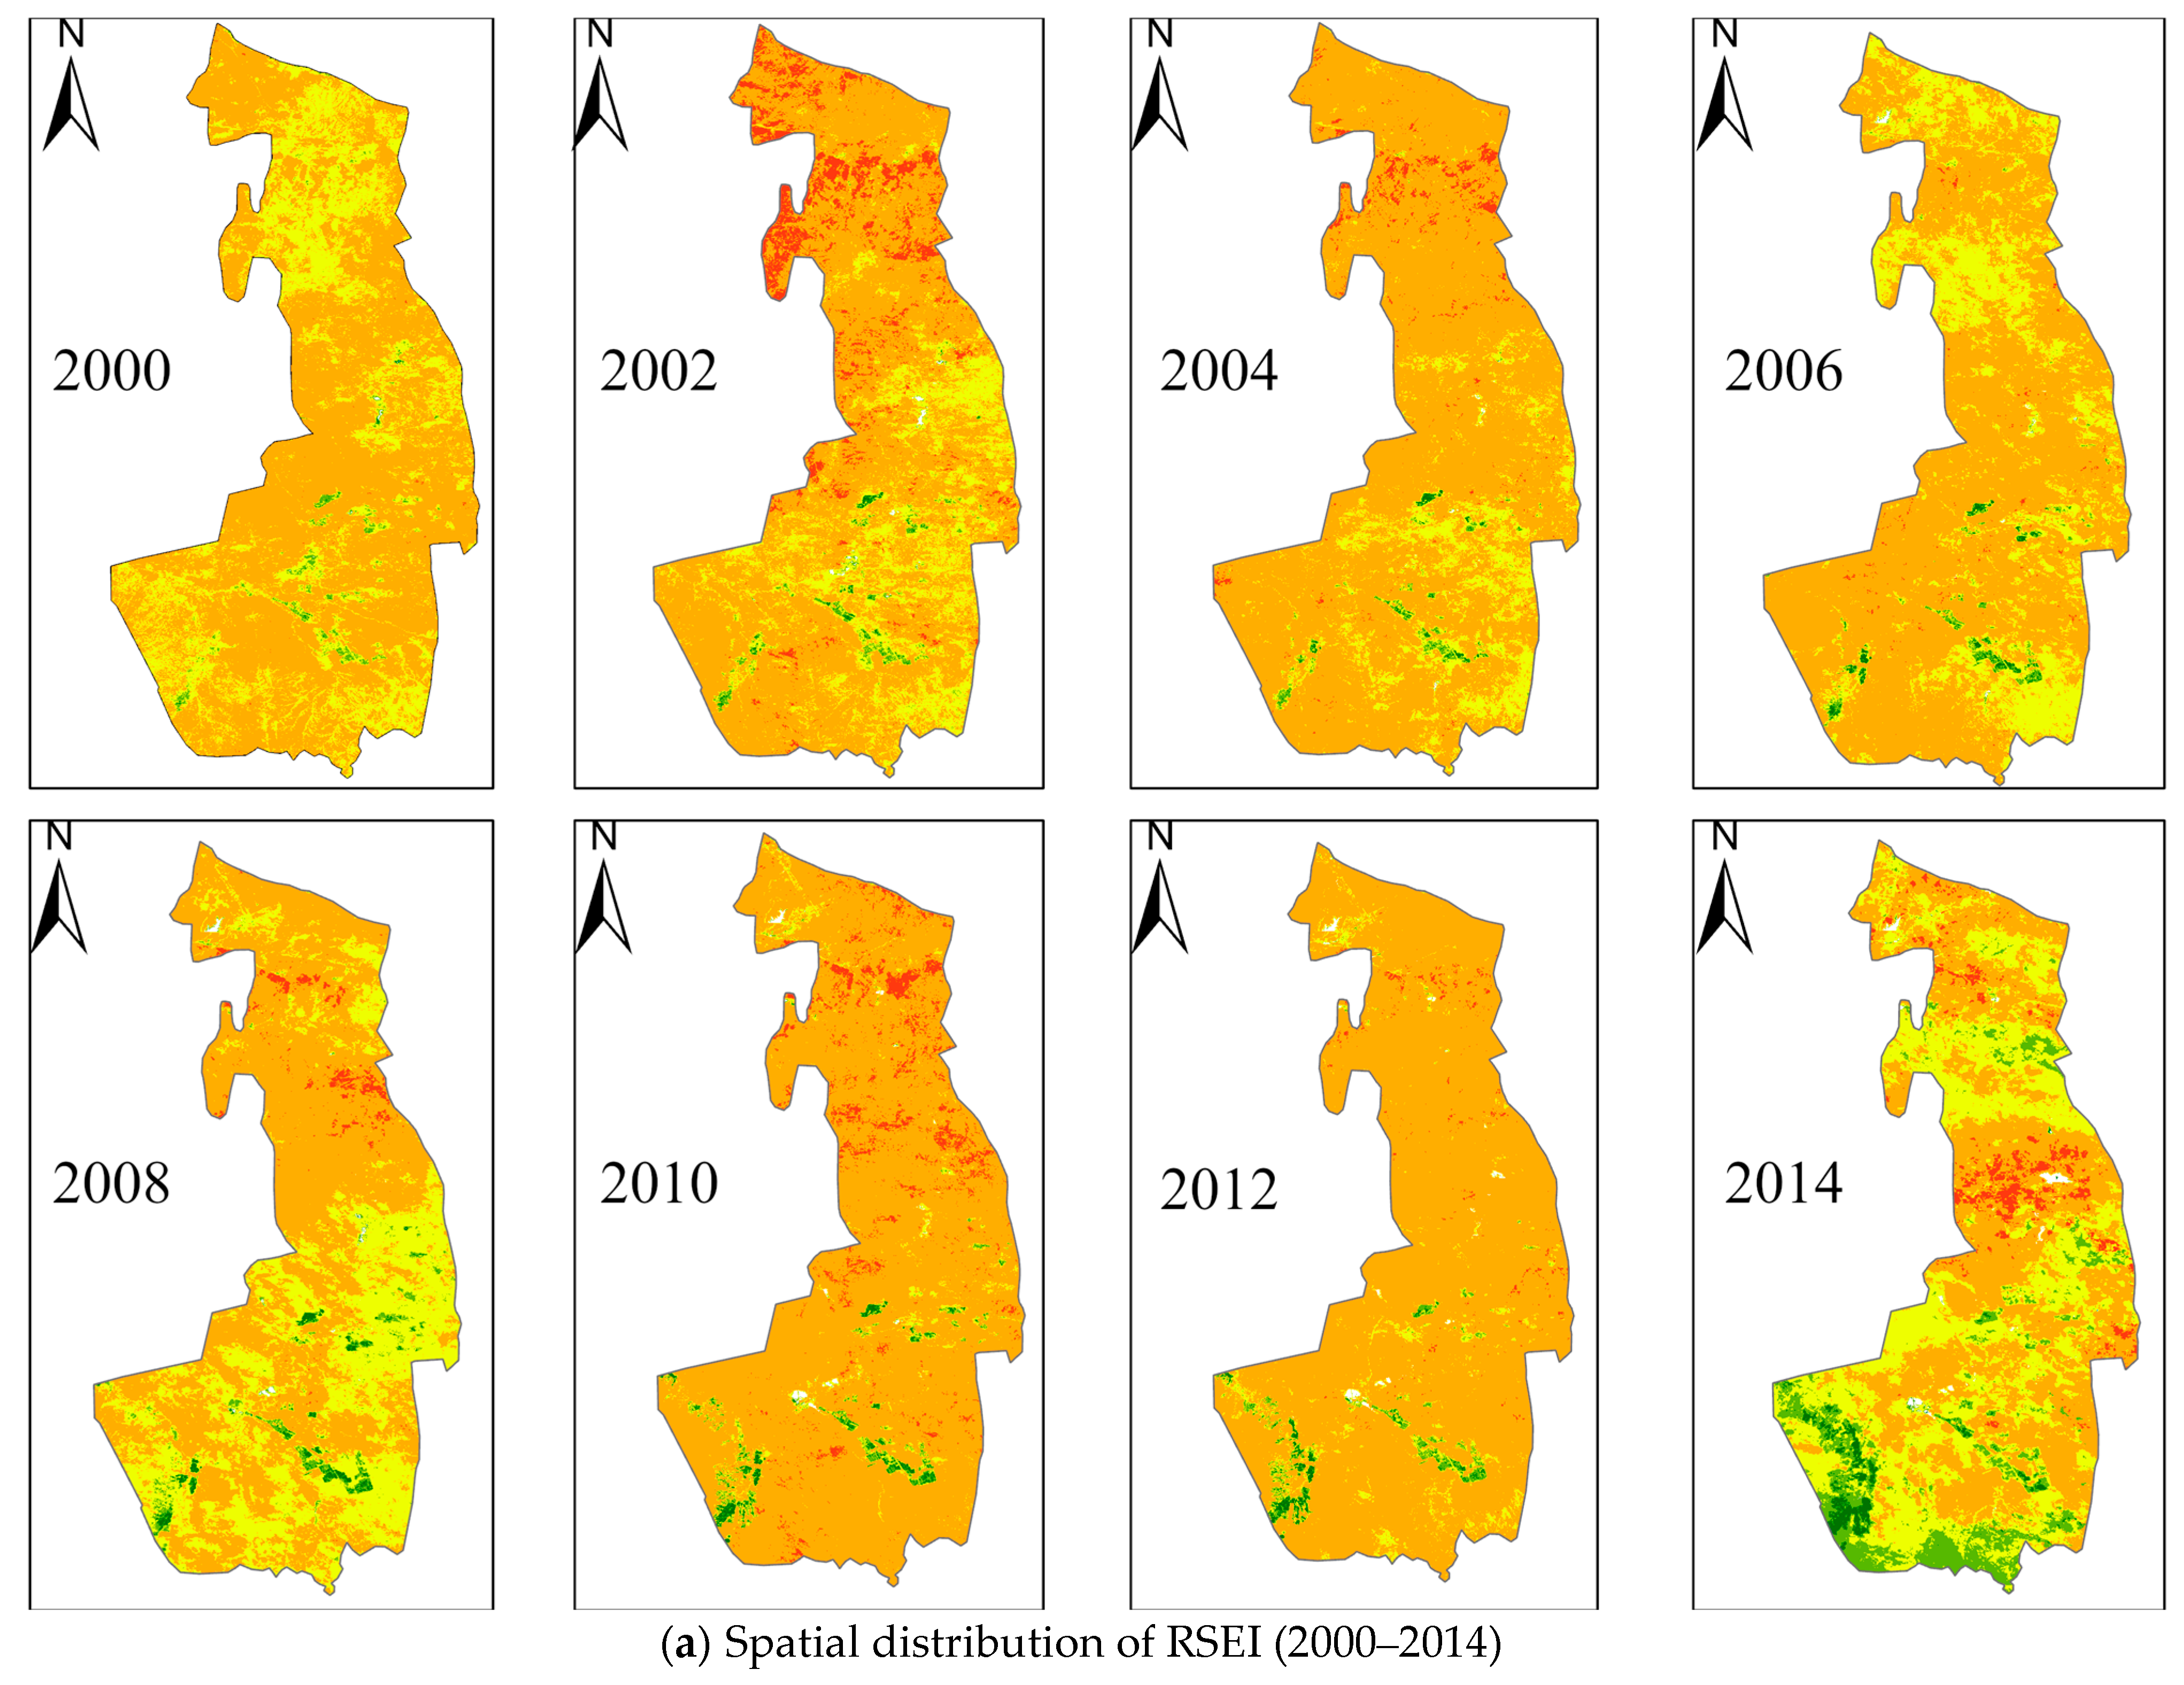
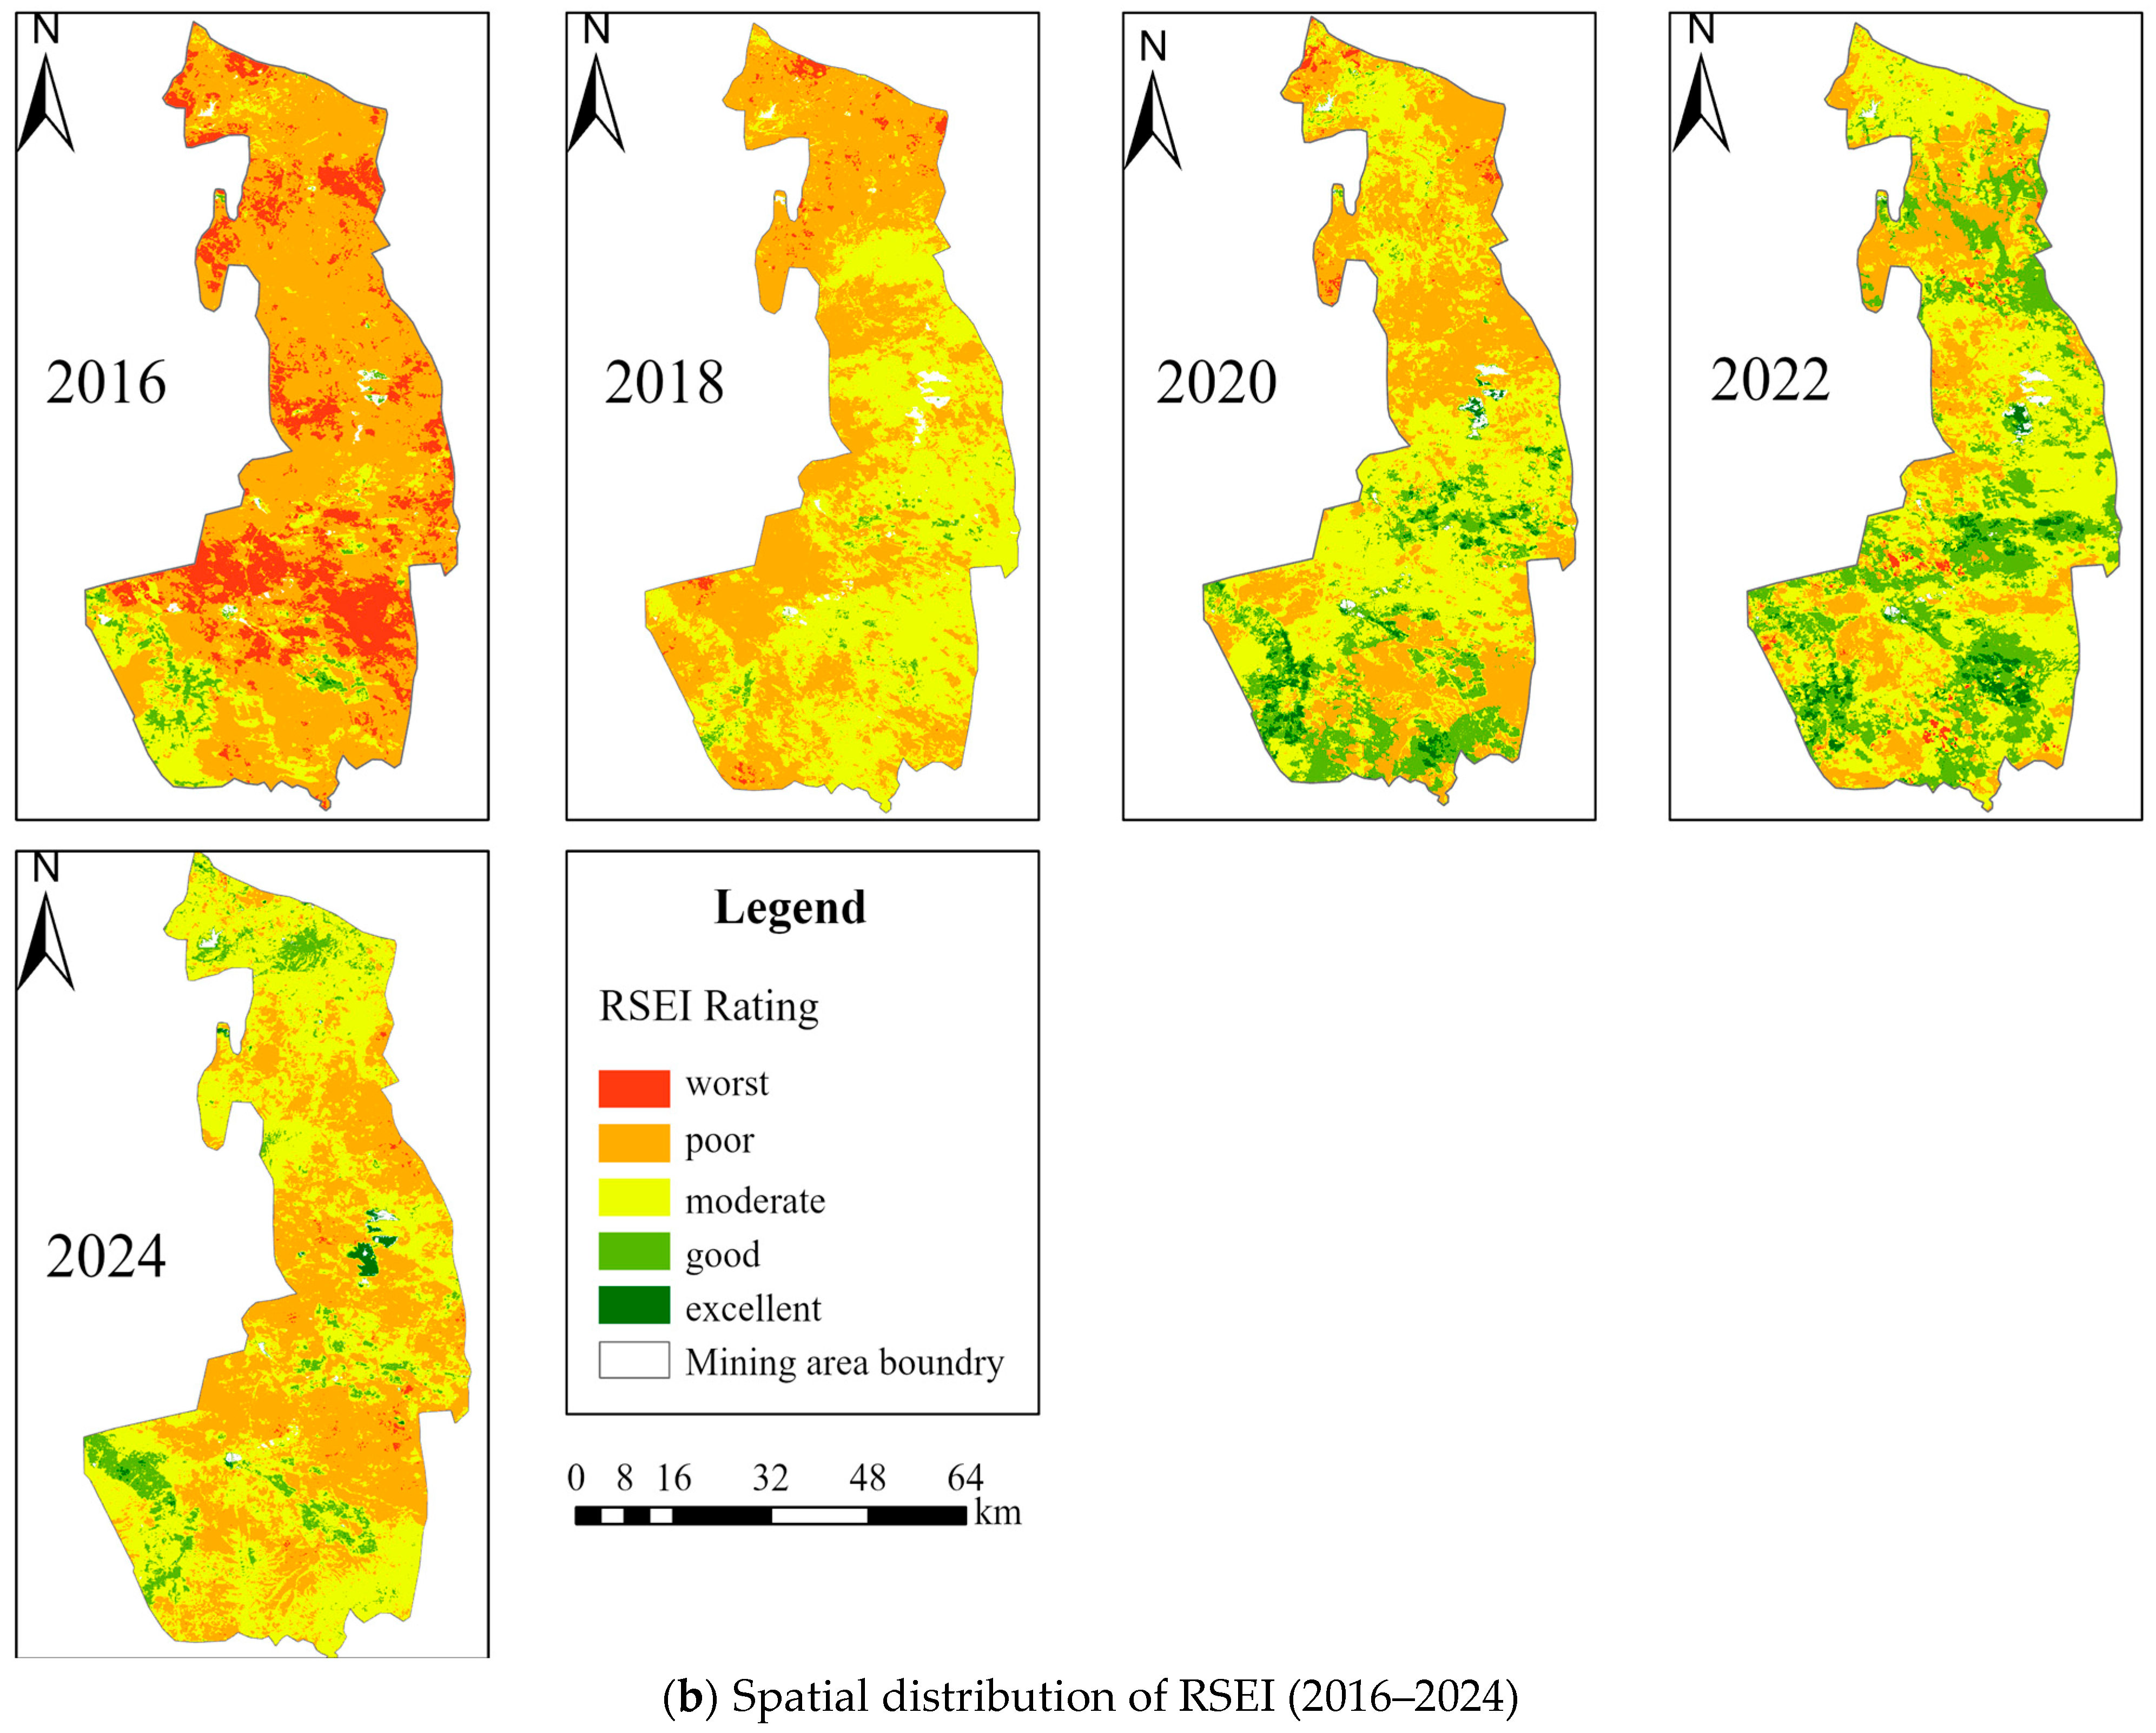
To assess ecological quality in the Ningdong mining area, RSEI values were classified into the following five grades: worst (0–0.2), poor (>0.2–0.4), moderate (>0.4–0.6), good (>0.6–0.8), and excellent (>0.8–1). The spatial distribution of the RSEI grades across the coal base is presented in Figure 9. Historical data indicate consistently low proportions (<5% annually) of worst-grade areas, with the moderate grade dominating (>60% coverage) in most study years.

4.2. Analysis of RSEI Time Variation

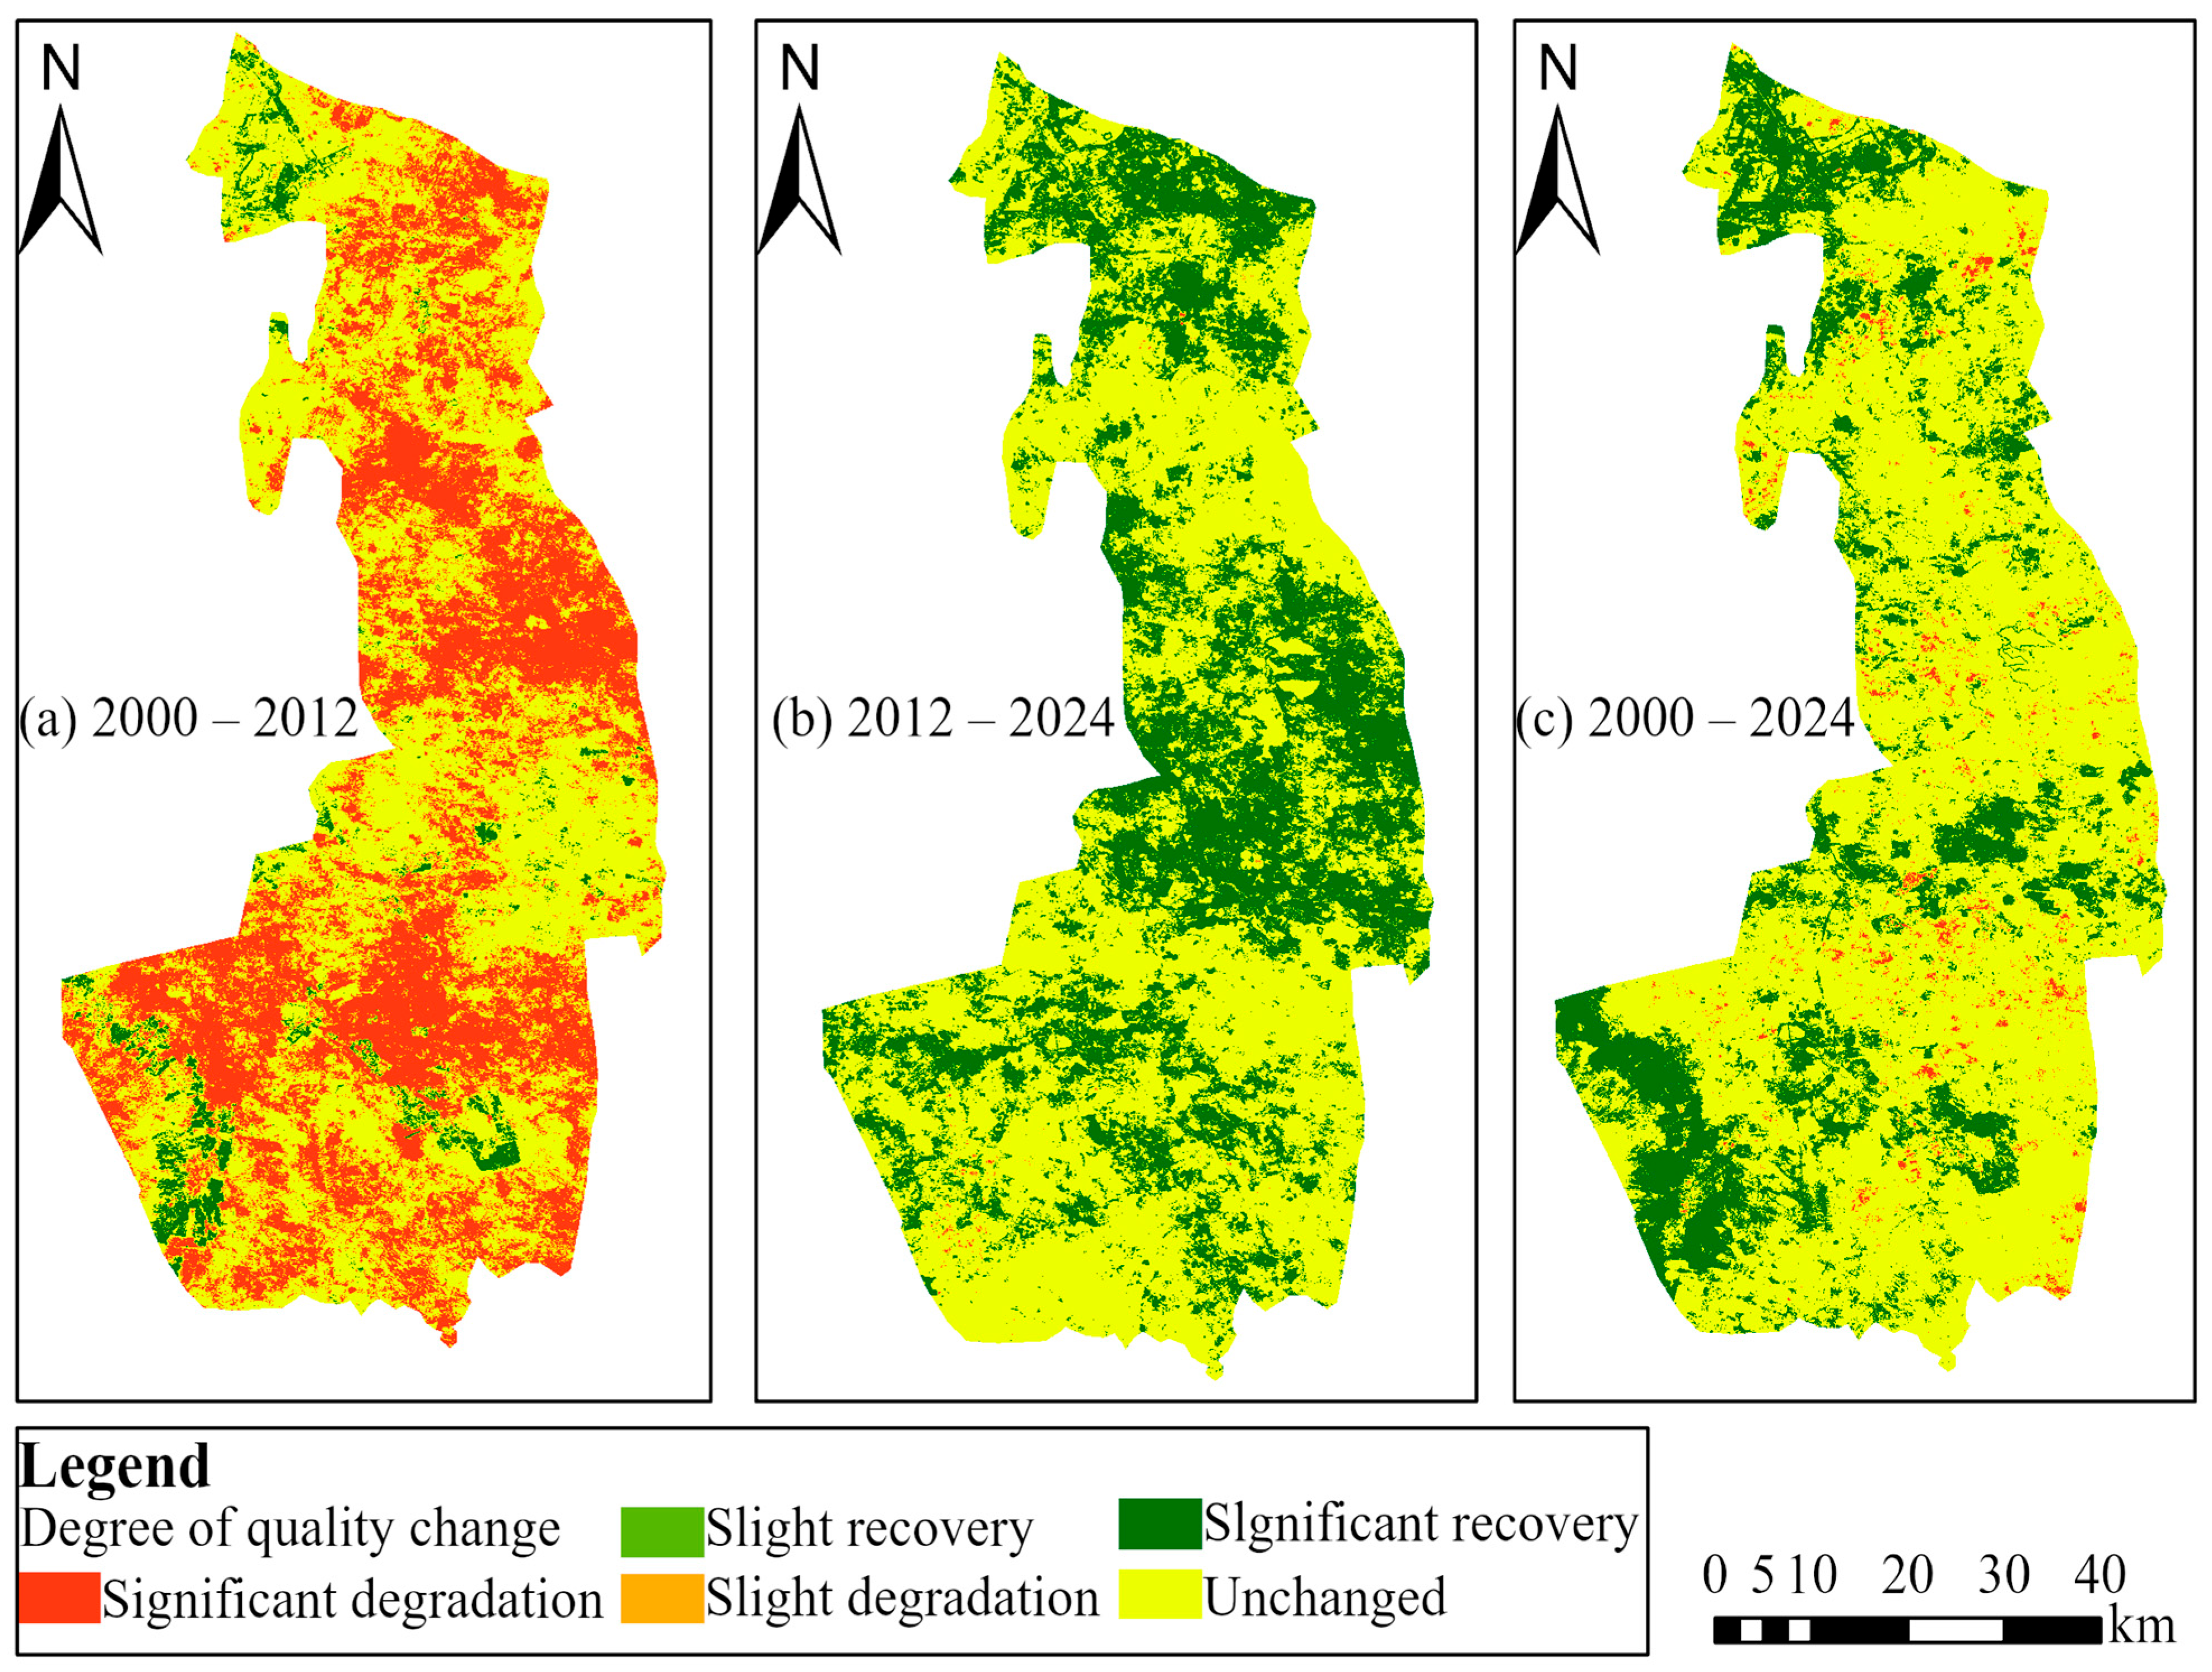
The RSEI transition matrix was constructed using the Theil–Sen median slope and MK significance tests with three temporal nodes (2000, 2012, and 2024). Figure 10 demonstrates that from 2000 to 2012, the RSEI showed a declining trend in most regions, while from 2012 to 2024, the RSEI exhibited an upward trend in most regions. Overall, from 2000 to 2024, the RSEI values in most regions increased or remained unchanged. As a national coal production base in the Loess Plateau of China, the ecosystem of the Ningdong mining area is affected by surface coal extraction activities. Gangue and slag accumulation increases the bare soil area, reduces soil moisture, and decreases vegetation cover, driving RSEI decline [32].
Combining Figure 11 and Table 6 and Table 7, we analyzed changes in the areas of different ecological categories.
Overall, the quality of the ecological environment in 2024 has improved significantly compared to 2000. In 2000, the ecological environment structure was extremely unhealthy, with the “Poor” grade dominating, accounting for 73.10% of the total area, while high-quality ecosystems (combined “Excellent” and “Good” grades) accounted for only 1.01% of the total area. By 2024, the proportion of “Poor” ratings fell significantly to 43.77%. At the same time, the proportion of high-quality ecosystems has significantly increased to 8.86% (“Excellent” 2.04% + “Good” 6.82%). The proportion of “Moderate” areas has increased from 25.85% to 48.41%, while “Worst” areas remain at extremely low levels, indicating that the overall quality of ecosystems is moving towards a healthier direction.
Between 2000 and 2012, the ecological environment underwent significant changes. Although the proportion of the “Worst” rating increased slightly from 0.04% to 0.60%, the core issue lies in the continued expansion of the “Poor” rating, which rose sharply from 73.10% in 2000 to 92.39% in 2012. At the same time, “Moderate” shrank from 25.85% to only 4.75%, and the proportion of high-quality ecosystems also remained low (only 2.26% in 2012). This reflects that the ecosystem in 2000 was mainly in a moderate state, with a small amount of high-quality ecology, but it has since deteriorated on a large scale to a state dominated by poor ecology, with a significant decline in ecological quality.
Since 2012, the quality of the ecological environment has continued to improve. From 2012 (92.39%) to 2024 (43.77%), the proportion of “Poor” ratings has plummeted by nearly 50 percentage points. Large-scale repairs were carried out simultaneously in the “Moderate” area, with the proportion rising from 4.75% to 48.41%. The expansion of high-quality ecosystems is even more groundbreaking; “Excellent” areas rose from 0.54% to 2.04%, an increase of nearly three times, while “Good” areas rose from 1.72% to 6.82%, an increase of nearly five times. During this period, the proportion of “Worst” areas was further reduced, which fully demonstrates that ecological governance achieved tangible results in 2012. This reversal correlates with the post-2012 environmental governance policies of China prioritizing ecological–economic synergy [33]. The system structure has successfully transitioned from a fragile model dominated by “Poor” areas to a healthy development pattern based on “Moderate” areas with steady growth in high-quality ecology.

4.3. Precise Ecological Identification of Mining Areas by Coupling the RSEI and EG Indices

The EG index calculation is performed in the GEE. When calculating the EG index, we ensure that the EG index and RSEI maintain spatiotemporal consistency between one another. The EG index is normalized and its values are inverted. Higher EG values after processing indicate a better ecological environment. The calculated EG index results for each year are shown in Table 8 and Table 9 below.
To better illustrate the changes in the EG index, a curve is used to more effectively reflect the historical trends of the EG index, as shown in Figure 12. The EG index and RSEI exhibit a broadly consistent trend in their time series. In the initial years of the time series, the EG index remained at a relatively high level. By the 2010s, the EG index had declined to a lower level. Subsequently, the EG index rose and gradually stabilized at a higher level. Observing the EG index values, the annual variations within the study area are relatively small, indicating that no large-scale disruptive changes in land use types have occurred. These values also suggest that the sensitivity and carrying capacity of ecosystems within the mining area are relatively limited.
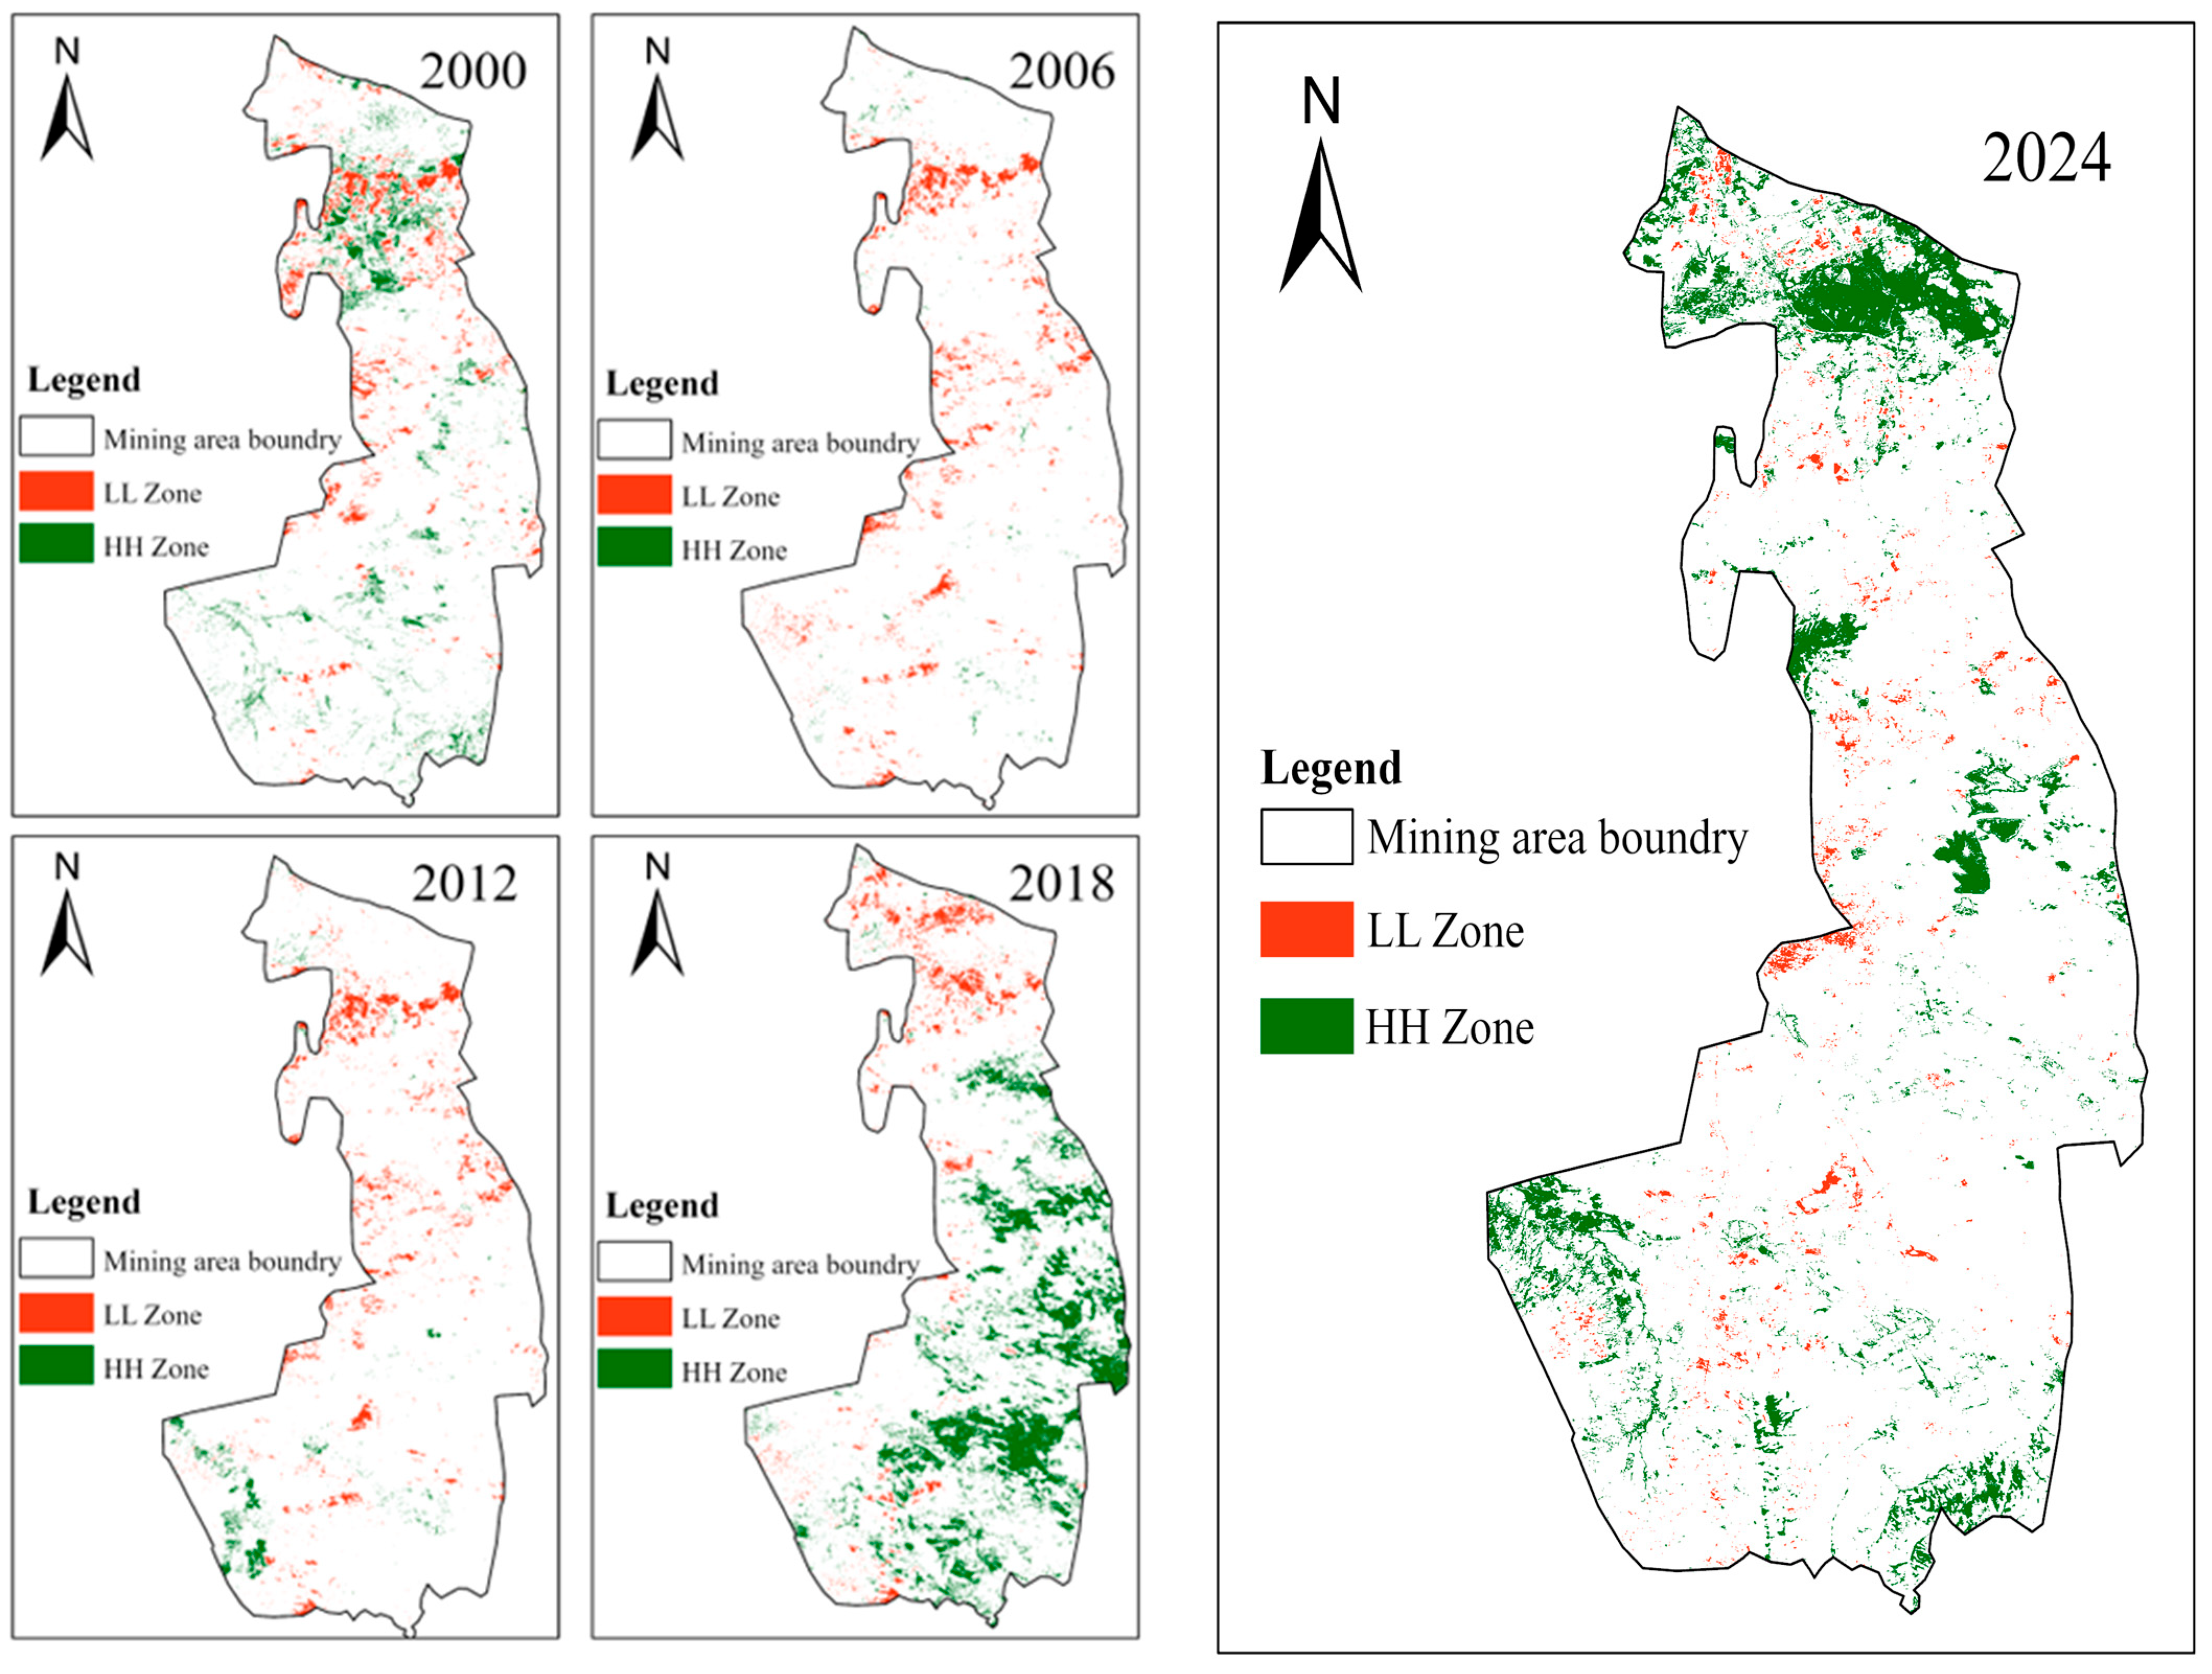
To accurately identify subtle environmental changes within the mining area, a spatial overlay analysis was conducted between the EG index and the RSEI. The spatial overlay results are shown in Figure 13 below. The results indicate that the ecological environment of this mining area has undergone a structural improvement over the past 24 years, transitioning from localized degradation to overall enhancement. This change has specifically manifested as the HH zones, representing green areas with the most optimal ecological conditions; these zones have evolved from scattered distributions in 2000 to forming large contiguous areas by 2018 and 2024. Some of the superior ecological environments within the mining area, such as forested and water-body zones, have been well preserved. In areas with poorer ecological conditions (LL zones), the red zones indicating the most severe ecological problems have significantly decreased in size. The general trend of ecological and environmental changes in the mining area revealed by the coupled matrix analysis is similar to the results obtained from the standalone RSEI analysis.

4.4. Analysis of Ecological Quality Drivers

The RSEI is intrinsically linked to four components, i.e., the greenness (NDVI), wetness (WET), dryness (NDBSI), and heat (LST). NDVI and WET exhibit positive correlations with RSEI, whereas NDBSI and LST are negatively correlated with RSEI [34]. Consequently, ecological quality drivers should be investigated beyond these indicators by focusing on natural, environmental, and anthropogenic factors. Six driving factors were selected for this analysis, including conventional environmental variables, i.e., elevation, slope, aspect, temperature, and precipitation, as well as the annual coal production of individual mines within the mining area.
An analysis of impact factor data from 2019 to 2024 was conducted. During this period, coal mining enterprises maintained relatively stable annual coal production targets. Therefore, RSEI is classified as the target y-value to be detected. Certain factors, such as elevation, slope gradient, aspect, and annual coal production, are categorized as static factors, while precipitation and temperature—which exhibit more pronounced annual variations—are classified as dynamic factors. The RSEI, static factors, and dynamic factors within the coal mine area are shown in Table 10, Table 11, Table 12 and Table 13 below.
A driving factor analysis was conducted on the driving factors from 2019 to 2024, calculating the mean q-value for each factor. This mean value provides an intuitive and accurate reflection of the explanatory power of each individual factor on the RSEI value of Y. The q-value details and their explanatory power rankings are shown in Table 14 and Table 15 below.
Through factor analysis, the extent of influence of each driving factor on the ecological quality of the Ningdong mining area was examined. Here, a larger q-value indicates a stronger impact of the factor on the RSEI. In terms of single-factor explanatory power ranking, the factors were ranked as follows: X2 Precipitation > X5 Slope > X1 Temperature > X3 Annual coal production > X4 Elevation > X6 Aspect. Precipitation and slope are the primary independent factors influencing RSEI, while the isolated effect of aspect is relatively weak.
Precipitation is considered the primary driver, exacerbating moisture loss in the arid, temperate continental climate of the Loess Plateau in northwest China. In the southern part of the Ningdong mining area, where precipitation is relatively high, some coal mines—such as the Yinxing No. 2 Coal Mine—exhibit high RSEI performance. In the northern part of the mining area, where conditions are typically drier, the Lingxin Coal Mine exhibits lower RSEI performance. This phenomenon underscores the role of precipitation in maintaining soil moisture and vegetation cover [35] Elevation and aspect exhibited weaker individual influences. Steeper slopes (>5°) amplify erosion risks through accelerated surface runoff, which strips topsoil and organic matter, ultimately degrading soil fertility and hydrological stability. This is particularly pronounced in mountainous regions, such as the Loess Plateau [36]. These areas experience reduced soil depth (<30 cm on slopes >15°), diminished water retention capacity (−40% compared to gentle slopes), and constrained vegetation diversity, with slope-dependent microclimates further altering solar exposure and precipitation patterns [37].
Geodetector analysis showed that all significant factor interactions showed synergistic enhancement effects, surpassing the individual contributions. The detection results are shown in Figure 14. The results indicate that the spatial distribution of RSEI is driven by multiple factors acting in concert, with synergistic effects observed between these factors. Their combined effect on RSEI is stronger than the simple sum of their individual effects. The combination of precipitation and slope, as well as precipitation and elevation, exhibits exceptionally strong explanatory power in most years. This indicates that the coupling of hydrotemperate conditions with topographic features is a key factor controlling macro-ecological patterns [38]. The interaction between annual coal production and precipitation was particularly pronounced prior to 2021. Human activities (mining) operate on a specific natural baseline and amplify impacts on the ecological environment. For example, mining in areas with steep slopes and concentrated precipitation will result in more significant ecological damage effects [39]. In summary, the ecological environment quality in the study area during 2019–2024 is stably controlled by natural topography (slope) and climate (precipitation) factors, while also being disturbed by human activities (coal mining). Experimental results indicate that ecological and environmental evolution is a complex process driven by the nonlinear synergistic interaction of natural and anthropogenic factors.

5. Discussion

5.1. Feasibility and Advantages of Coupling RSEI with EG for Precise Analysis

This study employs a coupled RSEI and EG index to conduct a sensitive analysis of changes in the mining area’s ecosystem over the past two decades.
A single index, such as the RSEI, can broadly illustrate the evolutionary trends of the internal ecological environment within a mining area. However, it falls short in capturing the complex and dynamic changes occurring within the mining area’s ecosystem. The EG index clearly distinguishes structural components within mining areas—such as forested land, water bodies, and developed land—based on land use types. However, the EG index cannot detect changes in ecological quality within the same land use type. For example, it cannot distinguish between a healthy forest area and a degraded, sparse forest area. RSEI, based on remote sensing spectral information, can acutely reflect changes in apparent ecological conditions, such as vegetation growth and surface temperature. However, RSEI inadequately characterizes the inherent, structural functions of ecosystems. Therefore, in mining areas characterized by fragile ecosystems and complex ecological evolution, integrating the EG index with the RSEI enables a comprehensive and precise ecological assessment.
The principle of spatial overlay analysis is illustrated in Figure 15. During analysis, we employed a weighted overlay methodology. The EG index and RSEI were each categorized into three distinct groups and reclassified as “1”, “2”, and “3”. The “10” in “EG × 10 ” and the “1” in “RSEI × 1 ” represent the weighting factor in the weighted summation, respectively. Weighted superposition yields nine distinct new matrices. The code “33” represents areas where both the RSEI and EG indices show the highest values simultaneously, indicating relatively good ecological conditions within these regions. The code “11” represents areas where both the RSEI and EG indices show the lowest values simultaneously, indicating poor ecological conditions within these regions. The matrix with the other codes indicates that the ecological environment of the mining area is in a moderate state.

5.2. Analysis of Ecological Changes in the Ningdong Mining Area and Recommendations

The purpose of this paper is to study the ecological environment changes in the Ningdong mining area and the analysis of driving factors. The results show that the ecological environment quality in Ningdong mining area shows a trend of decreasing and then increasing, and that this trend is non-monotonic. Overall, the results of the study are in line with expectations, as Guo et al. in 2005 had already proposed ecological restoration of the Ningdong mining area [40], while Fan et al. in 2011 analyzed the ecological security of the Ningdong mining area, pointing out that the situation facing the ecological security of Ningdong is very serious [41], which is similar to the inflection point of the RSEI change in 2012 over a period of 25 years, as mentioned in this thesis. RSEI reflects the quality of the ecological environment, and it has become a consensus that anthropogenic factors will lead to a decline in the quality of the ecological environment [42]. The RSEI’s improvement is reflected in the study of Gu et al. [43], as it is the same as in this paper. The reason for the ecological environment change in the mining area is mainly due to anthropogenic policy intervention; in 2005, the unique thesis of “Lucid Waters and Lush Mountains are Invaluable Assets” was put forward [44], and it gradually became the official attitude of Chinese society to consider the relationship between the economy and the environment [45]. Thus, a number of ecological restoration techniques have been applied to coal-generated gangue mountains [46]. Furthermore, this study demonstrates that ecological and environmental changes in mining areas are influenced by a complex nonlinear process involving both natural factors and anthropogenic factors (mining activities).The ecological quality of the Ningdong mining area in the 21st century has changed from poor to good, which is a stronger argument for the feasibility of sustainable development under the guidance of human beings [47].
In order to ensure the sustainable development of mining activities in the Ningdong mining area, the following opinions can be given through this study. In steep slopes and rainy areas, priority is given to the implementation of soil and water conservation projects to reduce the negative impacts of soil erosion on NDVI and WET [48]. In high-temperature mining areas, the interaction between coal mining and temperature indicates that the heat island effect in mining areas exacerbates ecological degradation, and that greening of mining areas and covering of bare ground surfaces need to be strengthened to reduce the surface temperature (LST) [49]. Using the spatial distribution characteristics of RSEI, priority restoration is implemented in ecologically fragile areas, while sustainable mining models are promoted in areas with better ecological restoration. Slope and precipitation are core natural drivers, and it is recommended that the coupling effect of topography and climate be prioritized in ecological planning, such as by laying out ecological corridors in low-slope, high-precipitation areas [50].

5.3. Study Limitations and Directions for Further Research

The following limitations exist in this study and need to be addressed in the future.
Currently, a singular indicator for coal production exists, with annual production used to indicate the coal mining intensity. This approach overlooks critical factors, such as mining depth, area, and lifespan. It is recommended to incorporate multi-dimensional mining data, such as mining intensity per unit area, to enhance the accuracy of the driver analysis.
Data temporal resolution and completeness limitations in remote sensing are significant because the data are synthesized annually. This annual synthesis makes it challenging to capture seasonal ecological fluctuations, such as short-term drought events. This issue could potentially be addressed in the future by integrating data with higher temporal resolution, such as those from MODIS.

6. Conclusions

This study examines the evolution of ecological and environmental quality in the Ningdong mining area over the past 25 years, primarily using the RSEI in conjunction with the EG index. We employed the GEE platform and the Landsat dataset available within the GEE for our analysis, and assessed the RSEI using trend analysis, significance testing, and geographic detector analysis. Spatial overlay analysis was employed to combine RSEI and EG for enhancing ecological recognition accuracy. We also used geographic detectors to reveal the extent to which static and dynamic factors influence the ecological environment. Our main findings are as follows.
(1)
At present, the ecological environment of the Ningdong mining area is at a relatively high level. The RSEI in 2024 is 0.428 and the EG index value is 0.55. Over the past 25 years, the ecological environment quality in the Ningdong mining area has undergone significant changes. Analysis using the RSEI and EG index reveals that the ecological environment quality in the mining area showed a declining trend before the 2010s and an upward trend after the 2010s. Overall, the ecological environment of the Ningdong mining area is showing signs of improvement.
(2)
Ecological and environmental changes in mining areas constitute complex nonlinear processes influenced by multiple factors. Natural factors within mining areas, such as precipitation and slope, have a significant impact on the ecological environment. The interaction between human activities (mining) and natural factors also has a significant impact on the ecological environment. The findings above suggest that during coal mining operations in mining areas, efforts should be made to limit mining intensity in steep slope regions and prioritize the implementation of soil and water conservation projects to reduce soil erosion.
This study provides scientific guidance for the development of policies on coal mining and ecological and environmental protection in the Ningdong mining area. At the same time, the findings emphasize the importance of continuous remote sensing monitoring over a long period of time in assessing and mitigating the ecological and environmental impacts of mining activities and promote the practice of sustainable development in the mining sector.

Author Contributions

C.H.: Writing—original draft, Visualization, Methodology, Conceptualization. P.L.: Writing—review and editing, Investigation, Funding acquisition. H.X.: Visualization, Supervision. Y.P.: Validation, Supervision. Y.Z. (Yongliang Zhang): Validation, Supervision. X.H.: Supervision. J.J.: Supervision. Y.Z. (Yuling Zhao): Supervision. All authors have read and agreed to the published version of the manuscript.

Funding

This work was supported in part by Deep Earth Probe and Mineral Resources Exploration—National Science and Technology Major Project (Granted NO.2025ZD1011304); National Natural Science Foundation of China (No. 52274169); the 2023 Science and Technology Support Project for the Construction of Ordos City’s Innovation Demonstration Zone under the Sustainable Development Agenda (Grant No. ZD20232304).

Institutional Review Board Statement

Not applicable.

Informed Consent Statement

Not applicable.

Data Availability Statement

Data will be made available on request.

Acknowledgments

The authors would like to acknowledge the open dataset of satellite images provided by the USGS and the open survey data published by local Chinese governments.

Conflicts of Interest

Author Xiaoqing Han is employed by Jizhong Energy Group. The remaining authors declare that the research was conducted in the absence of any commercial or financial relationships that could be construed as a potential conflict of interest.

Abbreviations

The following abbreviations are used in this manuscript:
RSEIRemote sensing ecological index
EIEcological index
NDVINormalized difference vegetation index
NDBSINormalized difference build-up and bare soil index
LSTLand surface temperature

References

  1. Song, S.J.; Zhang, J.J.; Yang, S.; Liu, Z.J.; Jiang, N.; Chen, P.; Liu, H.; Wei, J.; Liu, L.; Chen, B.; et al. Exploration and Considerations on Soil and Water Loss Response in Coal Mining Subsidence Areas of the Upper and Middle Reaches of the Yellow River. Green Min. 2024, 2, 169–182. [Google Scholar]
  2. Liu, G.B.; Shangguan, Z.P.; Yao, W.Y.; Yang, Q.K.; Zhao, M.J.; Dang, X.H.; Guo, M.; Wang, G.; Wang, B. Ecological Effects of Ecological Engineering on the Loess Plateau. Bull. Chin. Acad. Sci. 2017, 32, 11–19. [Google Scholar] [CrossRef]
  3. National Bureau of Statistics of China. 2024 National Economic Development and Statistical Bulletin; China Statistics Press Co., Ltd.: Beijing, China, 2025. [Google Scholar]
  4. Cai, N.G. Clean Utilization of Coal is an Important Direction to Solve Energy and Environmental Problems. Coal Econ. Res. 2013, 33, 38–42. [Google Scholar] [CrossRef]
  5. Lü, Z.H.; Feng, Y.D.; Niu, F.X.; Liu, X.L.; Jin, Y.J.; Zhu, Z.Z.; Ye, W.Q. Integrated Technology and Application for Effective Disposal of Multiple Pollutants in Jinjiazhuang Coal Mine. China Coal 2020, 46, 74–83. [Google Scholar] [CrossRef]
  6. Zhang, J.Y. Analysis of Coal Economy Operation Strategies under the Concept of Sustainable Development. Marketing 2022, 24, 75–77. [Google Scholar]
  7. Li, Y.L.; Liu, H.B.; Wu, Z.K.; Lei, B.B. Mine Ecological Environment Monitoring System Based on Cloud Platform Technology. Sci. Technol. Innov. 2025, 7, 64–67. [Google Scholar]
  8. Nie, J. Operational Remote Sensing Monitoring and Prediction of Snow Disasters. China Disaster Reduct. 2005, 5, 40–41. [Google Scholar]
  9. Li, Z.X.; Liu, J.; Lü, T.; Wang, M.Q. Construction and Evaluation of Geographically Weighted Remote Sensing Ecological Index for Mining Area Ecological Monitoring. Trans. Chin. Soc. Agric. Eng. 2024, 40, 233–243. [Google Scholar]
  10. HJ/T 192-2006; Technical Criterion for Ecosystem Status Evaluation (Industry Standard-Environmental Protection). Ministry of Ecology and Environment of the People’s Republic of China: Beijing, China, 2015.
  11. Ye, Y.H.; Liang, Y.X.; Shen, Y.Q.; Xie, L.S. Issues for Discussion in Technical Criterion for Ecosystem Status Evaluation (Trial). Trop. Geogr. 2009, 29, 404–406. [Google Scholar]
  12. Xu, H.Q. The Creation and Application of Urban Remote Sensing Ecological Index. Acta Ecol. Sin. 2013, 33, 7853–7862. [Google Scholar]
  13. Chen, Y.X.; Ning, X.G.; Zhang, H.C.; Lan, X.Q.; Chang, Z.B. Review of Remote Sensing Ecological Index (RSEI) Model and Its Applications. Remote Sens. Nat. Resour. 2024, 36, 28–40. [Google Scholar]
  14. Luo, C.; Liu, H.; Qi, L.Y. Assessment of Ecological Changes Based on Remote Sensing Indices: A Case Study of Changning City. Remote Sens. Land Resour. 2014, 26, 145–150. [Google Scholar]
  15. Wu, Z.J.; Wang, M.M.; Chen, S.J.; Zou, D. Monitoring and Evaluation of Ecological Environment’s Spatio-Temporal Variation in Mine Based on RSEI in Yongding Mine. Ecol. Sci. 2016, 35, 200–207. [Google Scholar] [CrossRef]
  16. Wang, L.C.; Jiao, L.; Lai, F.B.; Zhang, N.M. Evaluation of Ecological Changes Based on a Remote Sensing Ecological Index in a Manas Lake Wetland, Xinjiang. Acta Ecol. Sin. 2019, 39, 2963–2972. [Google Scholar] [CrossRef]
  17. Wang, F.; Li, W.H.; Lin, Y.M.; Nan, X.X.; Hu, Z.R. Spatiotemporal Pattern and Driving Forces Analysis of Ecological Environment Quality in Typical Ecological Zones of the Yellow River Basin from 1990 to 2020. Environ. Sci. 2023, 44, 2518–2527. [Google Scholar] [CrossRef]
  18. Tan, L.T.; Wu, X.L. Analysis of ecological quality evolution and driving factors in Xiantao City from the perspective of MRSEI. Sci. Surv. Mapp. 2025, 50, 160–170. Available online: https://link.cnki.net/doi/10.16251/j.cnki.1009-2307.2025.07.016 (accessed on 1 May 2025).
  19. Shi, S.X.; Xu, S.Y.; Meng, Z.Q. Spatiotemporal changes of ecological status in the Yellow River Delta National Nature Reserve. Acta Ecol. Sin. 2025, 45, 7808–7822. Available online: https://link.cnki.net/doi/10.20103/j.stxb.202501030009 (accessed on 1 May 2025).
  20. Zhai, W.; Huang, Y.L.; Ma, K.; Dong, J.H.; Zhang, J.X.; Zhao, Y.D.; Chen, F.; Ren, Y.; Lü, F.; Zhang, P.; et al. Key Technologies for Intelligent Coal-Water Regulation and Ecological Restoration in Arid and Semi-Arid Mining Areas. 30 July 2019. Available online: https://kns.cnki.net/kcms2/article/abstract?v=_GofKS1StuTu5Y6n-7ZGsLlBZLTD_PjShD65hcwhRypoJolpD0xmK2TLkGGZbeZ6PGVdSCZnqtH7z5-U8fBSqSjdyF_J0gHYK6dF2dYUlQ-ERTCuEpT52ATEumywIE3_wUQYLGpkOR4pdzylguz4Wd-vd8QdMcA52dDtC9Rd44lm_p3mGotmAMZTN__ylOz1&uniplatform=NZKPT&language=CHS (accessed on 24 March 2025).
  21. Jiao, M.N. Study on Speciation Characteristics of Soil Heavy Metals and Ecological Restoration Pathways in Ningdong Energy and Chemical Industry Base. Master’s Thesis, Ningxia University, Yinchuan, China, 2020. [Google Scholar] [CrossRef]
  22. Ye, H.M.; Huang, J.; Xu, Y.; Tang, X.H.; Li, Y.T.; Ling, G.D.; Lan, X. Ecological Quality Evaluation of Huangshi City Based on Modified Remote Sensing Ecological Index. Environ. Sci. Technol. 2025, 48, 211–224. [Google Scholar] [CrossRef]
  23. Li, S.J.; Zhang, K.K.; Xie, B.N.; Wang, S.W.; Li, Z.G. Ecological Environment Quality Evaluation and Cause Analysis of Korla Region Based on Remote Sensing. Arid. Land Geogr. 2024, 47, 2064–2074. [Google Scholar]
  24. Yao, C.; Zhao, H.Y.; Ren, Y.H.; Wang, J.; Wang, L. Analysis of Urban Ecological Environment Quality Change in Taiyuan Based on Remote Sensing Ecological Index. J. Meteorol. Environ. 2024, 47, 85–91. [Google Scholar] [CrossRef]
  25. Wang, Y.Q.; Huang, H.P.; Zhu, W.L.; Yang, G.; Yu, K. Construction and Application of High-Resolution Remote Sensing Ecological Index. J. Remote Sens. 2024, 28, 2896–2909. [Google Scholar] [CrossRef]
  26. Shao, Q.Q.; Zhao, Z.P.; Liu, J.Y.; Fan, J.W. The characteristics of land cover and macro ecological changes in the Three Rivers Headwater Region in recent 30 years. Geogr. Res. 2010, 29, 1439–1451. Available online: https://kns.cnki.net/kcms2/article/abstract?v=H1ADs8FciQ-5oQjit36enoJJX6JdbjuX2hv57M0zhcuZZYX-B9f2f-8AVpXHpuMZTUljuLH-7bkmkCGP0uWs3r-UFD-ScgV2Sm_hg8ihYlf_wwkc-rKDvwAy8oXlusWZA6naWD1wv43qe3AsEuyhykKRdAxrfrAAlZh0Ht95XQqjh6r6kYQFfw==&uniplatform=NZKPT&language=CHS (accessed on 2 May 2025).
  27. Li, Y.R.; Cao, Z.; Long, H.L.; Liu, Y.S.; Li, W.J. Dynamie analysis of ecological environment combined with land cover and NDVl changes and implications for sustainable urban-nural development: The case of Mu Us Sandv Land, China. J. Clean. Prod. 2017, 142, 697–715. [Google Scholar] [CrossRef]
  28. Cao, Y.; Chen, Z.X.; Mo, J.F.; Sun, Y.L.; Yan, H. Spatiotemporal Evolution Characteristics and Driving Factors of Forest NEP in Southwest China. Acta Ecol. Sin. 2025, 7, 3252–3266. [Google Scholar] [CrossRef]
  29. Li, Y.Y.; Zhang, Y.J.; Jiang, Y.; Li, C.J. Spatiotemporal Variation Characteristics of Gross Primary Productivity in Desert Grasslands of Urumqi and Its Response to Climate Change. Pratacultural Sci. 2024, 41, 2792–2808. [Google Scholar]
  30. Wang, J.F.; Xu, C.D. Geodetector: Principle and Prospect. Acta Geogr. Sin. 2017, 72, 116–134. [Google Scholar]
  31. Song, Y.F.; He, Y.R.; Liu, L.; Liu, S.Y.; Kang, R.H. Spatiotemporal Evolution Analysis of Ecological Environment Quality in Helan Mountain Based on Landsat-8. Sci. Surv. Mapp. 2025, 50, 82–93. [Google Scholar] [CrossRef]
  32. Zhang, J.X.; Zhang, Q.; Zhou, N.; Li, M.; Huang, P.; Li, B.Y. Research Progress and Prospects of Coal-Based Solid Waste Backfill Mining Technology. J. China Coal Soc. 2022, 47, 4167–4181. [Google Scholar] [CrossRef]
  33. Wang, L.; He, J.H. The Internal Logic and Strategic Choices of New Quality Productive Forces Promoting High-Quality Development of Private Economy. Reform 2024, 12, 61–71. [Google Scholar]
  34. Zhang, Y.X.; Zhan, Q.W. Ecological Quality Evaluation of Poyang Lake Ecological Economic Zone Based on RSEI. Beijing Surv. Mapp. 2024, 38, 1166–1171. [Google Scholar] [CrossRef]
  35. Sun, B.; Wang, Y.; Guo, Y.; Wu, J.M.; Li, C.L.; Huang, H.G. Spatiotemporal Dynamic Changes and Influencing Factors of Vegetation Coverage in Xilingol Grassland from 2000 to 2020. Chin. J. Grassl. 2024, 46, 11–22. [Google Scholar] [CrossRef]
  36. Liu, F.; Zhang, M.S.; Dong, Y.; Ding, W.Q.; Zhang, X.; Ma, J. Analysis of Spatiotemporal Distribution Patterns of Geological Disasters in Yulin City Based on Records from 1984 to 2022. northwest. Geol. 2023, 56, 204–213. [Google Scholar]
  37. Huang, J.P.; Zhang, Z.Z. Research on Susceptibility of Geological Disasters in Alpine Mountain Mines Based on Machine Learning. J. China Univ. Min. Technol. 2024, 53, 960–976. [Google Scholar] [CrossRef]
  38. Liu, Y.; Li, B.; Gu, G.C.; Li, H.S.; Wang, X.X. Design of Lightweight Shortwave Infrared Autocollimation Hyperspectral Imager. Acta Opt. Sin. 2024, 44, 246–254. [Google Scholar]
  39. Wang, Z.X. Landslide Susceptibility Analysis Combining Negative Sample Selection and Neural Network Model Prediction. Master’s Thesis, Guilin University of Technology, Guilin, China, 2024. [Google Scholar] [CrossRef]
  40. Guo, M.J.; Yu, X.Y. Discussion on Mining Damage Control and Ecological Reconstruction Mode in Ningdong Mining Area. Northwest Coal 2005, 4, 33–35. [Google Scholar]
  41. Fan, X.S.; Han, Y.W. Ecological Security Assessment of Ningdong Mining Area. Soil Water Conserv. China 2011, 11, 56–59. [Google Scholar] [CrossRef]
  42. Yi, W.Y.; Su, W.C.; Luo, S.Q. Evaluation of Land Ecological Security in Guiyang City from 2002 to 2012. Guizhou Agric. Sci. 2014, 42, 170–173. [Google Scholar]
  43. Gu, Y.C.; Meng, D.; Zhao, Y.; Hua, Y.W. Study on Ecological Environment Quality Changes in Abandoned Mining Areas Based on Remote Sensing: A Case Study of Maoming Oil Shale Mining Area. J. Cap. Norm. Univ. (Nat. Sci. Ed.) 2024, 45, 19–29. [Google Scholar] [CrossRef]
  44. Bao, H.J. Clear Waters and Green Mountains are Invaluable Assets. People’s Daily, 24 April 2006; p. 010. [Google Scholar]
  45. Shen, M.H. Theoretical Logic of the Concept “Clear Waters and Green Mountains are Invaluable Assets”. Zhejiang Acad. J. 2025, 3, 145–154. [Google Scholar] [CrossRef]
  46. Wu, C.L.; Hou, X.L.; Yang, J.Y.; Zhao, T.N.; Deng, Y.Y.; Ma, W.Z.; Gong, Z.H.; Zeng, W.J.; Lu, Z.Y.; Wu, G.W. Evaluation of Ecological Restoration Technology Models for Gangue Hills in Ningdong Coal Base. Acta Ecol. Sin. 2025, 45, 461–474. [Google Scholar] [CrossRef]
  47. Niu, W.Y. Connotation of Sustainable Development Theory: Commemorating the 20th Anniversary of the UN Rio Earth Summit. China Popul. Resour. Environ. 2012, 22, 9–14. [Google Scholar]
  48. Fan, Y.H.; Lu, Z.H.; Cheng, J.L.; Zhou, Z.X.; Wu, G. Main Ecological Environmental Problems and Ecological Reconstruction Techniques in Chinese Coal Mining Areas. Acta Ecol. Sin. 2003, 10, 2144–2152. [Google Scholar]
  49. Zhao, J.J.; Lu, M.X.; Gu, H.H.; Yuan, X.T.; Li, F.P. Study on Ecological Restoration Effects in Mining Areas Based on Vegetation Coverage Changes. Min. Res. Dev. 2018, 38, 115–118. [Google Scholar] [CrossRef]
  50. He, Z.J.; Luo, L.T.; Du, Y.C.; Gou, L.N. Strategies for Emission Reduction and Carbon Sequestration in Mine Ecological Restoration under Carbon Neutrality Background. Multipurp. Util. Miner. Resour. 2022, 2, 9–14+56. [Google Scholar]
Figure 1. Location Map of the Ningdong mining area and distribution of coal mines. (1) Lingxin, (2) Shicao Village, (3) Yin Xing No. 2, (4) Maiduo Mountain, (5) Song Xinzhuang, (6) Shuangma No. 1, (7) Hongliu, (8) Yangchangwan, (9) Zaoquan, (10) Sirenjiazhuang, (11) Jinjiaqu, (12) Maliantai, (13) Xinqiao, (14) Huian, (15) Yong’an, (16) Qingshuiying, (17) Meihuajing, (18) Jinfeng, (19) Wei’er, (20) Yin Xing No. 1, (21) Yue’erwan, and (22) Shuangma No. 2.
Sustainability 17 09075 g001
Figure 2. Field photographs of the landscape at the six studied coal mining areas.
Sustainability 17 09075 g002
Figure 3. Study methods overview.
Sustainability 17 09075 g003
Figure 4. Temporal land use maps of the study area (2000, 2006, 2012, 2018, and 2024).
Sustainability 17 09075 g004
Figure 5. Variation curves for NDVI, WET, NDBSI, and LST from 2000 to 2024.
Sustainability 17 09075 g005
Figure 6. Three-dimensional spatial patterns of remote sensing indices and RSEI confidence region analysis.
Sustainability 17 09075 g006
Figure 7. RSEI variation curve.
Sustainability 17 09075 g007
Figure 8. Non-monotonic evolution of RSEI: U-shaped transition and segmented dynamics driven by policy intervention.
Sustainability 17 09075 g008
Figure 9. RSEI classification by year.
Sustainability 17 09075 g009aSustainability 17 09075 g009b
Figure 10. Changes in RSEI by year.
Sustainability 17 09075 g010
Figure 11. Clustered bar and percentage stacked composite chart of ecological quality dynamics.
Sustainability 17 09075 g011
Figure 12. EG index variation curve.
Sustainability 17 09075 g012
Figure 13. Temporal evolution of HH/LL clusters of environmental quality based on EG and RSEI (2000–2024).
Sustainability 17 09075 g013
Figure 14. Results of the factor interaction detection: heatmaps of interaction q-values for variable pairs (2019–2024).
Sustainability 17 09075 g014
Figure 15. Schematic diagram of the weighted overlay integration model for RSEI and EG.
Sustainability 17 09075 g015
Table 1. Remote sensing imagery data.
SensorResolutionTimePeriodGEE Datasets
Landsat 5 TM30 m2000–2011June to SeptemberLANDSAT/LT05/C02/T1_L2
Landsat 7 ETM+30 m2012June to SeptemberLANDSAT/LE07/C02/T1_L2
Landsat 8 OLI30 m2013–2020June to SeptemberLANDSAT/LC08/C02/T1_L2
Table 2. Values of K 1 and K 2 in the heat indicator.
Waveband K 1 / ( W · m 2 · S r 1 · μ m 1 ) K 2 / K
Landsat 5 B6607.761260.56
Landsat 7 B6666.091282.71
Landsat 8 B10774.891321.08
Table 3. Land use types and their ecological grade index in the study area.
Land Use and Land Cover TypeEcological GradeEcological Land
Water body1YES
Wetland1YES
Forest2YES
Shrubland3YES
Grassland4YES
Cultivated land5NO
Construction land6NO
Barren land7NO
Table 4. Two-by-two factorial interaction results.
Comparison of p(x1), p(x2) with p(x1 ∩ x2)Factor Interaction Results
p(x1 ∩ x2) > max(p(x1), p(x2))Bilinear enhancement
p(x1 ∩ x2) > p(x1) + p(x2)Nonlinear enhancement
p(x1 ∩ x2) = p(x1) + p(x2)Mutually independent
min(p(x1), p(x2)) < p(x1 ∩ x2) < max(p(x1), p(x2))Linear deceleration
p(x1 ∩ x2) < min(p(x1), p(x2))Nonlinear attenuation
Table 5. Indicator values.
RSEINDVIWETNDBSILSTPercentage (%)
20000.3720.3520.3450.8260.37762.56
20010.4120.4060.3550.8090.37260.96
20020.3280.4360.3230.7680.40862.70
20030.3190.4520.3930.8260.45064.27
20040.3280.3700.6380.6140.48562.37
20050.3720.4150.7220.5890.47363.58
20060.3580.3790.6140.6940.49062.59
20070.3830.3430.4260.8290.47158.59
20080.3820.4020.4450.7980.50266.82
20090.3160.3800.5100.7280.48166.25
20100.2860.3730.4790.7340.52768.97
20110.2790.3870.6770.6080.50270.45
20120.3080.3470.7700.6160.49372.06
20130.3450.4700.6380.6260.59570.22
20140.4130.4650.6650.5900.58084.79
20150.2310.4180.5850.5850.67279.65
20160.2880.4490.6530.2860.70580.67
20170.4170.5220.7040.1700.58285.54
20180.3910.5220.7420.1480.58371.82
20190.3850.6500.6880.7820.62184.37
20200.4560.5210.6370.1180.57477.19
20210.3720.4590.6220.1290.56579.92
20220.5110.5310.6570.7740.49582.16
20230.4290.5950.7050.1320.58480.77
20240.4280.4330.6660.2490.55677.83
Table 6. Temporal distribution matrix of RSEI ecological class areas (2000–2012).
Ecological Class2000 ( k m 2 )2002 ( k m 2 )2004 ( k m 2 )2006 ( k m 2 )2008 ( k m 2 )2010 ( k m 2 )2012 ( k m 2 )
Worst1.392 250.263 62.661 767.935 42.700 153.000 20.039
Poor2463.928 2445.636 2867.746 2527.589 2023.048 3004.961 3105.284
Moderate871.446 631.106 406.195 52.190 1197.719 125.575 159.591
Good33.094 38.982 28.203 12.563 84.939 54.557 57.757
Excellent0.940 4.844 5.744 10.456 22.019 22.276 18.308
Table 7. Temporal distribution matrix of RSEI ecological class areas (2014–2024).
Ecological Class2014 ( k m 2 )2016 ( k m 2 )2018 ( k m 2 )2020 ( k m 2 )2022 ( k m 2 )2024 ( k m 2 )
Worst109.384 631.987 41.088 21.374 28.439 13.642
Poor1574.917 2231.431 1700.492 1315.977 827.962 1470.820
Moderate1309.992 416.613 1582.091 1479.357 1590.826 1626.880
Good319.590 79.882 36.545 489.984 844.275 229.284
Excellent46.776 1.078 0.003 54.162 68.587 19.995
Table 8. EG index values (2000–2012).
Year2000200120022003200420052006200720082009201020112012
EG index0.560 0.550 0.554 0.560 0.552 0.551 0.543 0.540 0.540 0.542 0.541 0.5410.541
Table 9. EG index values (2013–2024).
Year201320142015201620172018201920202021202220232024
EG index0.541 0.550 0.547 0.548 0.548 0.548 0.548 0.547 0.547 0.545 0.549 0.550
Table 10. RSEI values for each coal mine (2019–2024).
Coal Mine Name201920202021202220232024
Lingxin 0.277 0.2490.410 0.259 0.411 0.275
Shicao Village 0.444 0.3080.410 0.293 0.486 0.314
Yin Xing No. 2 0.439 0.3530.509 0.379 0.544 0.571
Maiduo Mountain 0.395 0.3370.319 0.270 0.461 0.381
Song Xinzhuang 0.414 0.4180.530 0.352 0.580 0.413
Shuangma No. 1 0.417 0.3390.393 0.292 0.544 0.465
Hongliu 0.409 0.3330.359 0.274 0.552 0.384
Yangchangwan 0.346 0.2940.413 0.302 0.403 0.288
Zaoquan 0.273 0.280.310 0.299 0.377 0.259
Sirenjiazhuang 0.321 0.210.332 0.294 0.375 0.245
Jinjiaqu 0.453 0.4830.455 0.393 0.558 0.470
Maliantai 0.207 0.2990.378 0.331 0.468 0.326
Xinqiao 0.431 0.4360.556 0.485 0.622 0.503
Huian 0.511 0.3830.491 0.359 0.530 0.468
Yong’an 0.350 0.3510.452 0.399 0.389 0.359
Qingshuiying 0.276 0.2880.318 0.290 0.456 0.378
Meihuajing 0.352 0.3080.366 0.291 0.514 0.324
Jinfeng 0.438 0.4130.506 0.362 0.517 0.507
Wei’er 0.415 0.5620.639 0.563 0.571 0.549
Yin Xing No. 1 0.413 0.3330.382 0.318 0.414 0.412
Yue’erwan 0.414 0.3570.509 0.382 0.480 0.545
Shuangma No. 2 0.431 0.4030.419 0.334 0.485 0.520
Table 11. Static factors for each coal mine.
Coal Mine NameAnnual Coal Production
(10 kt)
Elevation
(m)
Slope
(°)
Aspect
(°)
Lingxin 3901324.3793.624182.211
Shicao Village 6001401.3253.213157.147
Yin Xing No. 2 2201335.3012.308167.537
Maiduo Mountain 8001437.2473.210155.797
Song Xinzhuang 1201418.0642.500186.257
Shuangma No. 1 4001374.0003.131184.354
Hongliu 8001426.6463.469171.474
Yangchangwan 12001400.6962.868173.383
Zaoquan 5001357.7083.285191.215
Sirenjiazhuang 2401307.1174.538164.704
Jinjiaqu 4001450.2583.044195.070
Maliantai 3601250.9392.923181.623
Xinqiao 2401385.4742.285155.618
Huian 1501410.4382.384175.236
Yong’an 1201369.0742.827190.394
Qingshuiying 10001366.4803.127167.162
Meihuajing 12001363.5463.066184.798
Jinfeng 4001422.1893.014184.437
Wei’er 1501423.6221.946170.967
Yin Xing No. 1 4001354.2502.425167.794
Yue’erwan 1801357.7722.260162.098
Shuangma No. 2 4001342.2112.816179.299
Table 12. Dynamic factors of each coal mine (temperature).
Coal Mine Name2019 (°C)2020 (°C)2021 (°C)2022 (°C)2023 (°C)2024 (°C)
Lingxin 21.227 21.095 20.864 21.422 21.768 21.927
Shicao Village 21.227 21.095 20.864 21.422 21.768 21.927
Yin Xing No. 2 21.474 21.360 21.135 21.635 22.009 22.166
Maiduo Mountain 20.954 20.831 20.605 21.135 21.479 21.624
Song Xinzhuang 20.899 20.754 20.519 21.069 21.407 21.539
Shuangma No. 1 20.899 20.754 20.519 21.069 21.407 21.539
Hongliu 20.954 20.831 20.605 21.135 21.479 21.624
Yangchangwan 21.227 21.095 20.864 21.422 21.768 21.927
Zaoquan 20.954 20.831 20.605 21.135 21.479 21.624
Sirenjiazhuang 21.784 21.659 21.438 21.986 22.287 22.476
Jinjiaqu 20.899 20.754 20.519 21.069 21.407 21.539
Maliantai 21.784 21.659 21.438 21.986 22.287 22.476
Xinqiao 20.606 20.437 20.201 20.767 21.056 21.187
Huian 20.606 20.437 20.201 20.767 21.056 21.187
Yong’an 21.146 20.988 20.776 21.298 21.617 21.767
Qingshuiying 21.227 21.095 20.864 21.422 21.768 21.927
Meihuajing 21.227 21.095 20.864 21.422 21.768 21.927
Jinfeng 20.899 20.754 20.519 21.069 21.407 21.539
Wei’er 20.309 20.129 19.915 20.467 20.736 20.880
Yin Xing No. 1 21.474 21.360 21.135 21.635 22.009 22.166
Yue’erwan 20.899 20.754 20.519 21.069 21.407 21.539
Shuangma No. 2 20.954 20.831 20.605 21.135 21.479 21.624
Table 13. Dynamic factors of each coal mine (precipitation).
Coal Mine Name2019 (mL)2020 (mL)2021 (mL)2022 (mL)2023 (mL)2024 (mL)
Lingxin 305.987 252.430 267.449 245.972 310.783 213.756
Shicao Village 305.987 252.430 267.449 245.972 310.783 213.756
Yin Xing No. 2 309.805 308.617 289.496 285.235 316.772 259.292
Maiduo Mountain 319.656 305.967 296.076 286.712 325.953 257.475
Song Xinzhuang 369.703 321.723 339.543 327.273 367.106 290.660
Shuangma No. 1 369.703 321.723 339.543 327.273 367.106 290.660
Hongliu 319.656 305.967 296.076 286.712 325.953 257.475
Yangchangwan 305.987 252.430 267.449 245.972 310.783 213.756
Zaoquan 319.656 305.967 296.076 286.712 325.953 257.475
Sirenjiazhuang 290.997 215.706 237.198 213.656 294.292 180.770
Jinjiaqu 369.703 321.723 339.543 327.273 367.106 290.660
Maliantai 290.997 215.706 237.198 213.656 294.292 180.770
Xinqiao 406.405 302.819 356.137 341.721 394.160 294.430
Huian 406.405 302.819 356.137 341.721 394.160 294.430
Yong’an 362.083 291.004 316.802 305.687 354.719 267.739
Qingshuiying 305.987 252.430 267.449 245.972 310.783 213.756
Meihuajing 305.987 252.430 267.449 245.972 310.783 213.756
Jinfeng 369.703 321.723 339.543 327.273 367.106 290.660
Wei’er 396.360 277.219 331.424 316.447 381.289 268.668
Yin Xing No. 1 309.805 308.617 289.496 285.235 316.772 259.292
Yue’erwan 369.703 321.723 339.543 327.273 367.106 290.660
Shuangma No. 2 319.656 305.967 296.076 286.712 325.953 257.475
Table 14. Various influence factor q-values.
YearX1X2X3X4X5X6
20190.372 0.324 0.225 0.396 0.223 0.146
20200.593 0.644 0.253 0.389 0.469 0.120
20210.322 0.456 0.397 0.215 0.546 0.116
20220.356 0.553 0.545 0.143 0.665 0.147
20230.362 0.346 0.156 0.322 0.371 0.269
20240.373 0.532 0.213 0.194 0.475 0.130
mean0.396 0.476 0.298 0.277 0.458 0.155
Table 15. Explanatory power.
FactorsX1 TemperatureX2 PrecipitationX3 Annual Coal ProductionX4 ElevationX5
Slope
X6
Aspect
q-value0.396 0.476 0.298 0.277 0.458 0.155
Power rank314526
Disclaimer/Publisher’s Note: The statements, opinions and data contained in all publications are solely those of the individual author(s) and contributor(s) and not of MDPI and/or the editor(s). MDPI and/or the editor(s) disclaim responsibility for any injury to people or property resulting from any ideas, methods, instructions or products referred to in the content.