Article

Evaluating Eutrophication and Water Clarity on Lake Victoria’s Ugandan Coast Using Landsat Data

by
Moses Kiwanuka
1,2,
Randy Leslie
3,
Anthony Gidudu
4,
John Peter Obubu
5,
Assefa Melesse
1 and
Maruthi Sridhar Balaji Bhaskar
1,*
1
Department of Earth and Environment, Florida International University, Miami, FL 33199, USA
2
Department of Civil Engineering, Ndejje University, Luwero 7088, Uganda
3
Department of Civil Engineering, Florida International University, Miami, FL 33199, USA
4
Department of Geomatics and Land Management, Makerere University, Kampala 7062, Uganda
5
Department of Water Quality Management, Ministry of Water and Environment, Kampala 20026, Uganda
*
Author to whom correspondence should be addressed.
Sustainability 2025, 17(20), 9056; https://doi.org/10.3390/su17209056 (registering DOI)
Submission received: 18 August 2025 / Revised: 1 October 2025 / Accepted: 8 October 2025 / Published: 13 October 2025
(This article belongs to the Special Issue Sustainable Future of Ecohydrology: Climate Change and Land Use)

Abstract

Satellite remote sensing has emerged as a reliable and cost-effective approach for monitoring inland water quality, offering spatial and temporal advantages over traditional in situ methods. Lake Victoria, the largest tropical lake and a critical freshwater resource for East Africa, faces increasing eutrophication driven by nutrient inflows from agriculture, urbanization, and industrial activities. This study assessed the spatiotemporal dynamics of water quality along Uganda’s Lake Victoria coast by integrating field measurements (2014–2024) with Landsat 8/9 imagery. Chlorophyll-a, a proxy for algal blooms, and Secchi disk depth, an indicator of water clarity, were selected as key parameters. Cloud-free satellite images were processed using the Dark Object Subtraction method, and spectral reflectance values were correlated with field data. Linear regression models from single bands and band ratios showed strong performance, with adjusted R2 values of up to 0.88. When tested on unseen data, the models achieved R2 values above 0.70, confirming robust predictive ability. Results revealed high algal concentrations for nearshore and clearer offshore waters. These models provide an efficient framework for monitoring eutrophication, guiding restoration priorities, and supporting sustainable water management in Lake Victoria.

1. Introduction

As one of the most vital freshwater resources in East Africa, Lake Victoria requires continuous monitoring to safeguard its water chemistry and ensure the sustainability of its essential ecosystem services. Lake Victoria is the second-largest freshwater lake in the world and the largest tropical lake, with a surface area of 68,800 km2 [1,2], and is home to Kenya (6%), Tanzania (51%), and Uganda (43%). Water quality monitoring is crucial for Lake Victoria due to its importance to more than 40 million people who largely depend on it for agricultural, fishing, and navigation purposes, as well as its rich habitat for a vast array of aquatic life [1,3]. This vital water body plays a major role in sustainable development and regional ecological environment protection [4]. However, it has faced elevated nutrient levels from runoff, agricultural farms, and urbanization [5,6,7,8], resulting in eutrophic conditions, which threaten the lake’s water quality, fisheries, productivity, and could cause a setback to the ecology. Despite the practical value of Lake Victoria, its ecological health has been steadily deteriorating due to nonpoint and point-source pollutants. Furthermore, considerable eutrophication has occurred, which is a significant challenge in multiple aquatic ecosystems due to increased nitrogen and accumulated phosphorus nutrient loading, leading to the growth of harmful algal blooms caused by cyanobacteria [9,10]. This decline in water quality and increased water treatment costs are related to the abstraction points for water supply plants by the National Water and Sewerage Corporation (NWSC), a government agency responsible for supplying clean drinking water in Uganda, which are located closer to the most polluted nearshore [11]. Four of the fifteen recently designated cities (Jinja, Entebbe, Wakiso, and Masaka) lie within Lake Victoria’s Ugandan watershed and could potentially aggravate this problem due to the high population and urbanization. This development means that Lake Victoria will experience an increased pressure of unknown magnitude, worsening the lake’s water quality if appropriate planning measures are not implemented in new cities. This necessitates the urgent need for continuous monitoring at fine spatial-temporal scales [12,13], including decision making, policy formulation, and reviews on water quality, to ensure sustainable usage of the lake.
One sustainable monitoring technique for inland waters is the use of multispectral satellite remote sensing, which utilizes multiple satellites, including Landsat, Sentinel, PlanetScope, MODIS, and others. This technique has vast advantages over traditional techniques, such as near-real-time monitoring, being less costly, and having unlimited operation in time and space [14,15]. Its potential to provide long-term monitoring in hard-to-reach areas or where traditional monitoring programs are absent is also highly advantageous. The most studied parameters of interest to multiple stakeholders include chlorophyll-a (Chla), turbidity, Secchi disk depth (SDD), total nitrogen (TN), and total phosphorus (TP). Chla, an optically active constituent associated with phytoplankton, serves as a reliable proxy for the algal concentration in the water column [16,17]. It plays a key role in photosynthesis by absorbing solar energy, particularly in the blue and red regions of the electromagnetic spectrum, while reflecting light in the green region. Remote sensing of Chla is primarily based on the relationships among reflectance, absorption, and backscattering coefficients [18,19]. Reflectance in the red and near-infrared (NIR) regions is known for mapping Chla, because of its inherent and apparent optical properties. However, the spectral sensitivity of the used instruments, such as Landsat, can alter this due to their limitation in separating Chla signals from the influence of other optical factors. The red region shows a strong absorption peak, although it can be influenced by Colored Dissolved Organic Matter (CDOM) and Total Suspended Material (TSM) [20,21]. In contrast, the NIR region typically exhibits increased reflectance caused by enhanced scattering from algal biomass, which correlates with elevated Chla levels in most phytoplankton species. Nitrogen and phosphorus are optically weak water quality constituents, making them challenging to monitor directly via remote sensing techniques [22]. These nutrients do not significantly absorb light, which limits their ability to be detected through spectral methods. However, they play crucial roles in driving green and blue–green algal (cyanobacterial) blooms [19]. Although nitrogen and phosphorus do not directly affect the visible spectrum of water, they influence the water’s color indirectly by promoting algal growth. They are typically measured as Total Nitrogen (TN) and Total Phosphorus (TP). TP encompasses various forms of inorganic, organic, and dissolved phosphorus, most of which are found as phosphates (PO4) in nature. Its levels can be linked to water transparency, as measured by Secchi disk depth (SDD) through an exponential relationship consistent with Carlson’s trophic state index [23,24,25]. Few studies have explored the use of remote sensing to estimate nitrogen and phosphorus concentrations [26,27]. However, research by [28,29] revealed strong correlations between nitrogen and chlorophyll-a absorption and fluorescence, with TN and TP influencing Chla dynamics. These relationships, however, depend on the nutrients that limit algal growth in the specific water body under study. Turbidity is the reduction in light penetration through the water column caused by suspended particles. It primarily consists of nonalgal materials that increase the reflectance in the visible and near-infrared (NIR) regions of the spectrum. This impairs underwater light availability and contributes to the transport of nutrients and contaminants [30]. Several studies have effectively estimated turbidity via spectral band ratios [31,32,33,34].
One of the main reasons for assessing the spatial distribution of Chla is to derive an integrated measure of a lake’s condition through the Trophic Status Index (TSI). The TSI reflects the total biomass in a water body across spatial and temporal scales [2,35]. Over the years, several methodologies have been developed for TSI assessment, including the National Sanitation Foundation Water Quality Index (for U.S. waters), the Water Quality Index of Canada [36], and other region-specific indices. Among these, Carlson’s TSI [37] has become the most widely applied and remains the standard for holistic evaluation of eutrophication in inland waters [2,35].
Previously, scholars conducting studies on Lake Victoria’s water quality utilized traditional techniques [7,38], such as onsite water sampling techniques, which predominantly focus on biophysical and chemical aspects. These techniques are known to be limited both in time and space, are costly, and inefficient in providing a general representation of the entire water body, owing to their point sampling nature. For the context of Uganda, few field campaigns are known, as shown by the in situ data used. As a result, there is a need for efficient monitoring techniques such as satellite remote sensing [14], which has been widely adopted by multiple scholars with promising results [2,22,39,40,41,42,43]. Satellite remote sensing data with seamless spatial coverage have been used for regional and global water quality monitoring. With the current advancements in remote sensing techniques and the development of new satellites, large-scale water quality monitoring has undergone significant improvements. Reference [44] utilized a fast repetition rate fluorometer to study the light conditions and photosynthetic efficiency of Murchison Bay, whereas a study by [45] utilized a spectroradiometer device and Sentinel-2 satellite images in the Google Earth engine to study the estimation of Chla in Winam Bay. Furthermore, the authors in [42] monitored the water quality of Murchison Bay in Lake Victoria via Landsat 7 & 8 satellite imagery. Reference [2] utilized MODIS data to model Chla in Lake Victoria.
Different monitoring models for Chla and TSI were developed. However, the MODIS dataset is limited by its coarse spatial resolution in monitoring small-to-medium areas; hence, moderate-to-high-spatial-resolution satellites, such as Landsat 8 and 9, Sentinel 2A & 2B, and PlanetScope, are needed. However, in Ugandan coastal waters, little to no work has been performed on the use of Landsat 8 & 9 satellite data for water monitoring purposes. This gap cannot simply be bridged by transferring results from other lakes or sub-basins, because the Ugandan coastal waters of Lake Victoria exhibit unique optical and ecological conditions. These nearshore areas are shallow, highly dynamic, and strongly influenced by nutrient-rich inflows from rapidly urbanizing centers such as Kampala, Entebbe, and Masaka. As a result, sediment resuspension, algal bloom patchiness, and mixed-pixel effects produce reflectance patterns that differ from those observed in clearer or deeper waters where Landsat algorithms have been calibrated, such as Lake Okeechobee in the USA or Lake Erie in North America [22,46]. Therefore, region-specific calibration and validation are essential to ensure the accuracy of remote sensing models in Uganda’s portion of Lake Victoria. While Landsat-based analyses remain relatively scarce for Ugandan coastal waters, several recent post-2020 studies have successfully applied higher-resolution sensors such as Sentinel-2 (and other multispectral platforms) to map water quality and blooms in other Lake Victoria sub-basins. For example, Sentinel-2 and field spectroradiometer approaches have been used in the Winam Gulf and adjacent sub-basins to derive chlorophyll-a and algal bloom indicators [45], and larger basin-scale studies have adopted Sentinel-2 indices and time-series to map water indices and boundary dynamics [47]. These Sentinel-2 studies benefit from finer spatial resolution (10–20 m) and higher revisit frequency via multi-sensor constellations, which improves detection of nearshore patchiness and small bloom features that may be under-represented at Landsat’s 30 m pixel scale. Citing and contrasting these Sentinel-2 (and other recent) efforts highlights the novelty of applying Landsat 8/9 specifically to Ugandan coastal waters, where open-access, medium-resolution Landsat imagery could still provide an affordable, operational monitoring option if appropriately validated against in situ data.
This study seeks to address the identified gap by integrating freely available Landsat 8 and 9 C2L2 satellite data for water quality monitoring along Uganda’s Lake Victoria coast. The specific objectives were to (1) analyze the spatiotemporal trends in key water quality parameters between 2014 and 2024, and (2) develop and validate satellite-based models for predicting chlorophyll-a (Chla), Secchi disk depth (SDD), and the trophic state index (TSI). In this work, TSI modeling was restricted to Chla- and SDD-based formulations because these parameters had the most comprehensive in situ coverage and are optically active, making them suitable for satellite retrieval. In contrast, total nitrogen (TN) and total phosphorus (TP) data were sparsely sampled during our campaigns and, consistent with prior studies, lack strong direct spectral signatures for remote sensing applications [22,26]. While this limitation highlights the importance of future research to leverage denser nutrient datasets and advanced modeling techniques such as machine learning [48], their exclusion in the present study was justified for the regression-based TSI framework. Overall, this study provides a cost-effective approach for assessing eutrophication and water clarity, offering a valuable complement to limited in situ monitoring resources in the region.

2. Methodology

2.1. Study Area

The study was conducted in Uganda along Napoleon Bay and Murchison Bay, extending toward Lake Victoria’s Masaka landing site (Lambu). Lake Victoria is the largest tropical lake in the world and is fed mainly by direct rainfall and 23 rivers connecting the whole lake across the five countries [49]. However, this study focused on Ugandan coastal areas, mainly Murchison Bay and Masaka. The lake has a relatively shallow and gentle slope along its shores, meaning that any slight change in water level affects a considerably large offshore area [50]. The lake is located at an altitude of 1134 masl and has average and maximum depths of 40 m and 80 m, respectively. This area was chosen because it has not received significant research attention and is experiencing rapid growth in its domestic and agricultural industries. As a result, its shallow coastal waters have degraded over time due to the high inflow of discharge and nutrients from the watershed. The area records an average annual temperature of 24 °C, with an annual rainfall of approximately 2400 mm on the Ugandan side, accounting for 82% of the inflow, whereas basin discharge contributes 18%. The Ugandan portion of Lake Victoria’s coastal waters is under intense and growing human pressure. Population growth in nearby urban centers has been rapid; Kampala’s population increased from approximately 0.8 million in 1991 to 1.5 million in 2014 [51]. The 2024 National Population and Housing Census further reports that Wakiso District, which encompasses much of the peri-urban shoreline, now hosts more than 3.4 million residents, making it the most populous district in Uganda [51]. Such growth has accelerated demand for land, housing, and services along the shoreline. Land-use change analysis in the Murchison Bay catchment shows dramatic shifts over the past three decades: built-up land expanded from 20.6% in 1984 to nearly 49.6% in 2015, while agricultural land declined from 43.9% to 26.1%, forest cover from 23.8% to 17.5%, and wetlands from 11.8% to 5.1% [52]. These transformations, driven largely by urbanization, industrial development, and wetland encroachment, have reduced natural buffer functions and increased nutrient and sediment inflows to the lake [53,54]. At the wider basin scale, similar patterns of conversion of agricultural land and wetlands into settlements and industrial zones have been documented [55]. Together, rapid population growth, agricultural expansion, deforestation, and urban sprawl represent the major anthropogenic pressures exacerbating eutrophication and water quality degradation in Lake Victoria’s Ugandan coastal waters.

2.2. Data Collection

In Situ Water Sampling and Satellite Data

A total of 32 sampling points were established across the Ugandan coastal waters of Lake Victoria, covering Napoleon Bay, Murchison Bay, and Masaka landing site, as shown in Figure 1. Not all sites were sampled in every campaign between 2014 and 2024 due to logistical and weather-related constraints; however, a core subset of stations in each bay was consistently revisited during all campaigns to ensure temporal comparability, while the remaining sites were sampled opportunistically to broaden spatial coverage. In situ sampling was conducted using a stratified design, with stations selected to represent nearshore, mid-lake, and offshore zones, as well as variation in shoreline development. These samples were obtained across various campaigns, from 1 July 2014, 1 November 2014, 26 November 2014, 12–13 March 2015, 27–28 July 2015, 30 October 2015, 30 October 2017, 4–7 January 2020, 20 June 2022, 21–25 May 2023, 31 January 2024, and 1–5 February 2024. Care was taken to consider clear skies and cloud-free days. In situ sampling was performed to coincide with the satellite overpass time [2,56]. The collected samples were stored in a cool container for further analysis in the laboratory, as described by [2]. The analyzed parameters included Chla, nutrients (total nitrogen (TN) and total phosphorus (TP)), turbidity, and SDD. The combined dataset had 239 samples of chlorophyll-a, 206 samples of Secchi disk depth, 124 samples of total nitrogen (TN), 108 samples of total phosphorus (TP), and 83 samples of turbidity were collected across campaigns. While all parameters were measured during each campaign, resource and laboratory constraints limited the number of processed samples for TN, TP, and turbidity, resulting in lower overall counts compared to chlorophyll-a and Secchi depth. These latter parameters were prioritized in the analysis because of their more complete temporal coverage and stronger optical properties for satellite retrieval. Because total nitrogen (TN) and total phosphorus (TP) were sampled far less frequently than chlorophyll-a and Secchi depth (124 TN and 108 TP records versus 240 Chla and 206 SDD records), and because TN/TP are optically weak (i.e., they do not have strong direct spectral signatures and are often inferred indirectly through their influence on optically active constituents), we did not include TN and TP directly in the satellite-derived TSI regressions. Many researchers and authors have probed the relevance of using single-point samples to validate estimated concentrations of the studied parameters from satellite images, especially Chla, due to bloom patchiness [57,58,59], which is due to their ability to misrepresent the estimates. In this study, multiple samples were taken at each sampling point to represent the existing water quality chemistry by considering the parameters’ mean values. Existing matching Landsat 8 & 9 Operational Land Imager (OLI) images were downloaded on 5 May 2024, from the USGS Glovis website (https://glovis.usgs.gov/) with a lag of ±1 day. The ±1-day matching rule adopted in this study is consistent with previous research, where acceptable temporal lags between in situ sampling and satellite overpasses have ranged from +3 h to as much as 7 days [60,61,62,63,64]. This approach is commonly applied in large inland water bodies where logistical and environmental constraints make perfect alignment impractical. While shorter lags generally improve the fidelity of matchups, longer lags can introduce greater uncertainty, particularly under bloom patchiness conditions when Chla concentrations may change rapidly. In our case, the ±1-day window represents a balance between minimizing temporal mismatch and maximizing data availability. Nevertheless, users should interpret results with caution during bloom periods, as small timing differences can influence the accuracy of satellite—in situ comparisons. Previous studies have shown that Chla correlations are strongest within the same day, with errors increasing by ~15–25% once matchups exceed 2–3 days, and substantially beyond 3 days due to bloom patchiness and rapid biomass turnover [58,60]. Landsat data were used because they are available as open-source data, and the reduced temporal resolution is caused by Landsat 8 and Landsat 9, which range from 16 to 8 days. During this study, C2L2 reflectance images were used. Extra observational care was used as quality control on all images used to ensure that no atmospheric interference, such as cloud cover and shadows, affected proper pixel value extraction.

2.3. Data Processing

Effective data preprocessing is essential for accurate analysis of water quality parameters, as it ensures the reliability of both statistical assessments and modeling results. In this study, we addressed common data quality issues such as missing values and outliers, which often arise from equipment errors, challenging field conditions, or inconsistencies during sampling. Proper handling of these issues helps prevent distorted statistics and avoids introducing errors into modeling processes. Missing data were addressed via linear interpolation techniques, whereas outliers were identified via the interquartile range (IQR) method, flagging any values falling outside 1.5 times the IQR above the third quartile or below the first quartile [43]. This was only performed for Chla and SDD, which were to be used for model development and had fewer missing values, as shown in Table 1. However, in situ data points with multiple missing values, often due to concentrations falling below detectable limits, were excluded from the analysis.
Satellite imagery corresponding to the dates of in situ sampling was processed via the ERDAS ER Mapper and Esri ArcGIS Pro (version 3). To further minimize residual atmospheric effects, the Dark Object Subtraction (DOS) method was applied to the Landsat 8/9 L2 reflectance data. Although L2 products are atmospherically corrected by the USGS, tropical environments often exhibit persistent haze and aerosol variability that can introduce uncertainties in reflectance. DOS was therefore used as an additional refinement step to improve consistency between in situ measurements and satellite reflectance values. Dark objects (pixels with near-zero reflectance in the visible spectrum, typically deep-water areas) were identified, and their minimum reflectance values were subtracted from each band to correct for atmospheric scattering. This supplementary correction has been widely applied in similar studies [46] and ensures reproducibility of the preprocessing workflow. Individual spectral bands were merged into a single composite image, combining relevant information to support visual interpretation and further analysis.

2.3.1. Spectral Band Analysis and Modeling

The Dark Object-Subtracted (DOS) spectral values of seven selected spectral bands (1–7) at each monitoring sampling station were used to extract surface reflectance values, as shown in Table 2. Using established spectral relationships, these DOS spectral reflectance values were then used to estimate the concentrations of Chla, TN, TP, and turbidity. This study examined multiple parameters (Chla, SDD, and turbidity) that are optically sensitive to the spectral reflectance signature. The first step was to obtain matching Landsat 8 & 9 surface reflectance values in the visible and near-infrared (NIR) regions via ER Mapper 2022 Ver 16.7 and ESRI ArcGIS Pro 3.3. These data were corrected for atmospheric haze via the Dark Object Subtracted Band (DOSB) method. The second step involved obtaining the best subsets by ascertaining the correlation between the in situ parameters and the spectral reflectance values via Minitab statistical software Ver 21.4.2 made by Minitab, LLC, State College, PA, USA. This was performed after the dataset was split into training (70%) and testing (30%) sets. The best subset of predictors was selected by evaluating multiple statistical criteria collectively rather than relying on any single measure. Specifically, model selection considered the coefficient of determination (R2), adjusted R2, predicted R2, Mallow’s Cp, and the S-value (standard error of estimate). While R2 generally increases with the number of predictors, adjusted R2 and predicted R2 were used to account for predictor contribution and guard against overfitting. Mallow’s Cp helped balance model complexity against explanatory power, and the S-value provided an indication of overall model fit. The final models were chosen based on the optimal balance of these metrics, with adjusted R2 given particular weight because it penalizes unnecessary predictors. The third step involved developing regression models. Among the developed models, the best model was based on the highest predictive power while minimizing the number of predictors and passed the Durbin-Watson statistic (DWS) test for autocorrelation [46]. While ordinary least squares regression was adopted in this study for its interpretability and alignment with prior research, we acknowledge that high collinearity among spectral bands may limit robustness in some models. Future studies could consider alternative approaches such as ridge regression or partial least squares (PLS), which are more effective in addressing multicollinearity in multispectral datasets. For all mapped products (Chla, SDD, and TSI variants), the Landsat QA_PIXEL cloud and shadow masks were applied consistently. Note that linear combinations used in the TSI(SDD) single-band model can compress the dynamic range over bright clouds (due to opposite-signed coefficients), so any apparent cloud ‘suppression’ in the display is a visualization artifact rather than a valid retrieval.

2.3.2. Trophic State Index (TSI) Modeling

The lake’s TSI was initially obtained by considering the four major in situ parameters (Chla, SDD) as described by [2,37], as shown by Equations (1) and (2). The following equations were used to calculate the TSI based on Chla and SDD, as adapted by [37]. Because TN and TP had comparatively sparse in situ coverage and are not optically active constituents, TSI models in this study were limited to Chla and SDD. These two chosen parameters had a fairly good number of in situ data points compared with phosphorus.
T S I S D D = 10 ( 6 I n S D I n 2 )
T S I C h l a = 10 ( 6 2.04 0.68 I n C h l a I n 2 )
The obtained TSI (SDD) and TSI (Chla) values were correlated with the spectral single bands, and their respective reciprocating ratios were used to identify the optimal subsets for further analysis via Minitab statistical software.

2.3.3. Algorithm Evaluation Metrics

In this study, multiple evaluation metrics, such as the coefficient of determination (R2), mean absolute error (MAE), mean absolute percentage error (MAPE), and root mean square error (RMSE), were used for error evaluation as adopted by other scholars [2,60,65]. R2 indicates the algorithm’s ability to account for the variability of response variables, which is usually the highest value. The MAE measures the average absolute differences between estimated and measured values, RMSE calculates the square root of the average of the squared prediction errors, and the MAPE assesses the average magnitude of the errors between estimated and actual values as a percentage of the actual values. The lower values for RMSE, MAE, and MAPE indicate higher accuracy of the developed algorithms. These metrics aid in determining the covariance, uncertainty measures such as bias, and the scatter between the estimated and measured values.
R 2 = 1 i = 1   n ( X i X s ) 2 i = 1   n ( X i X m ) 2
R M S E = i = 1 n X i X s 2 n
M A P E = 1 n i = 1 n | X i X s | 100 X i
M A E = 1 n i = 1 n | X i X s |
where Xi, Xs, and Xm are measured values, estimated values, and average values of the measured parameters, respectively, while n is the number of values.

3. Results and Discussion

3.1. In Situ Water Quality Parameter Temporal Variation

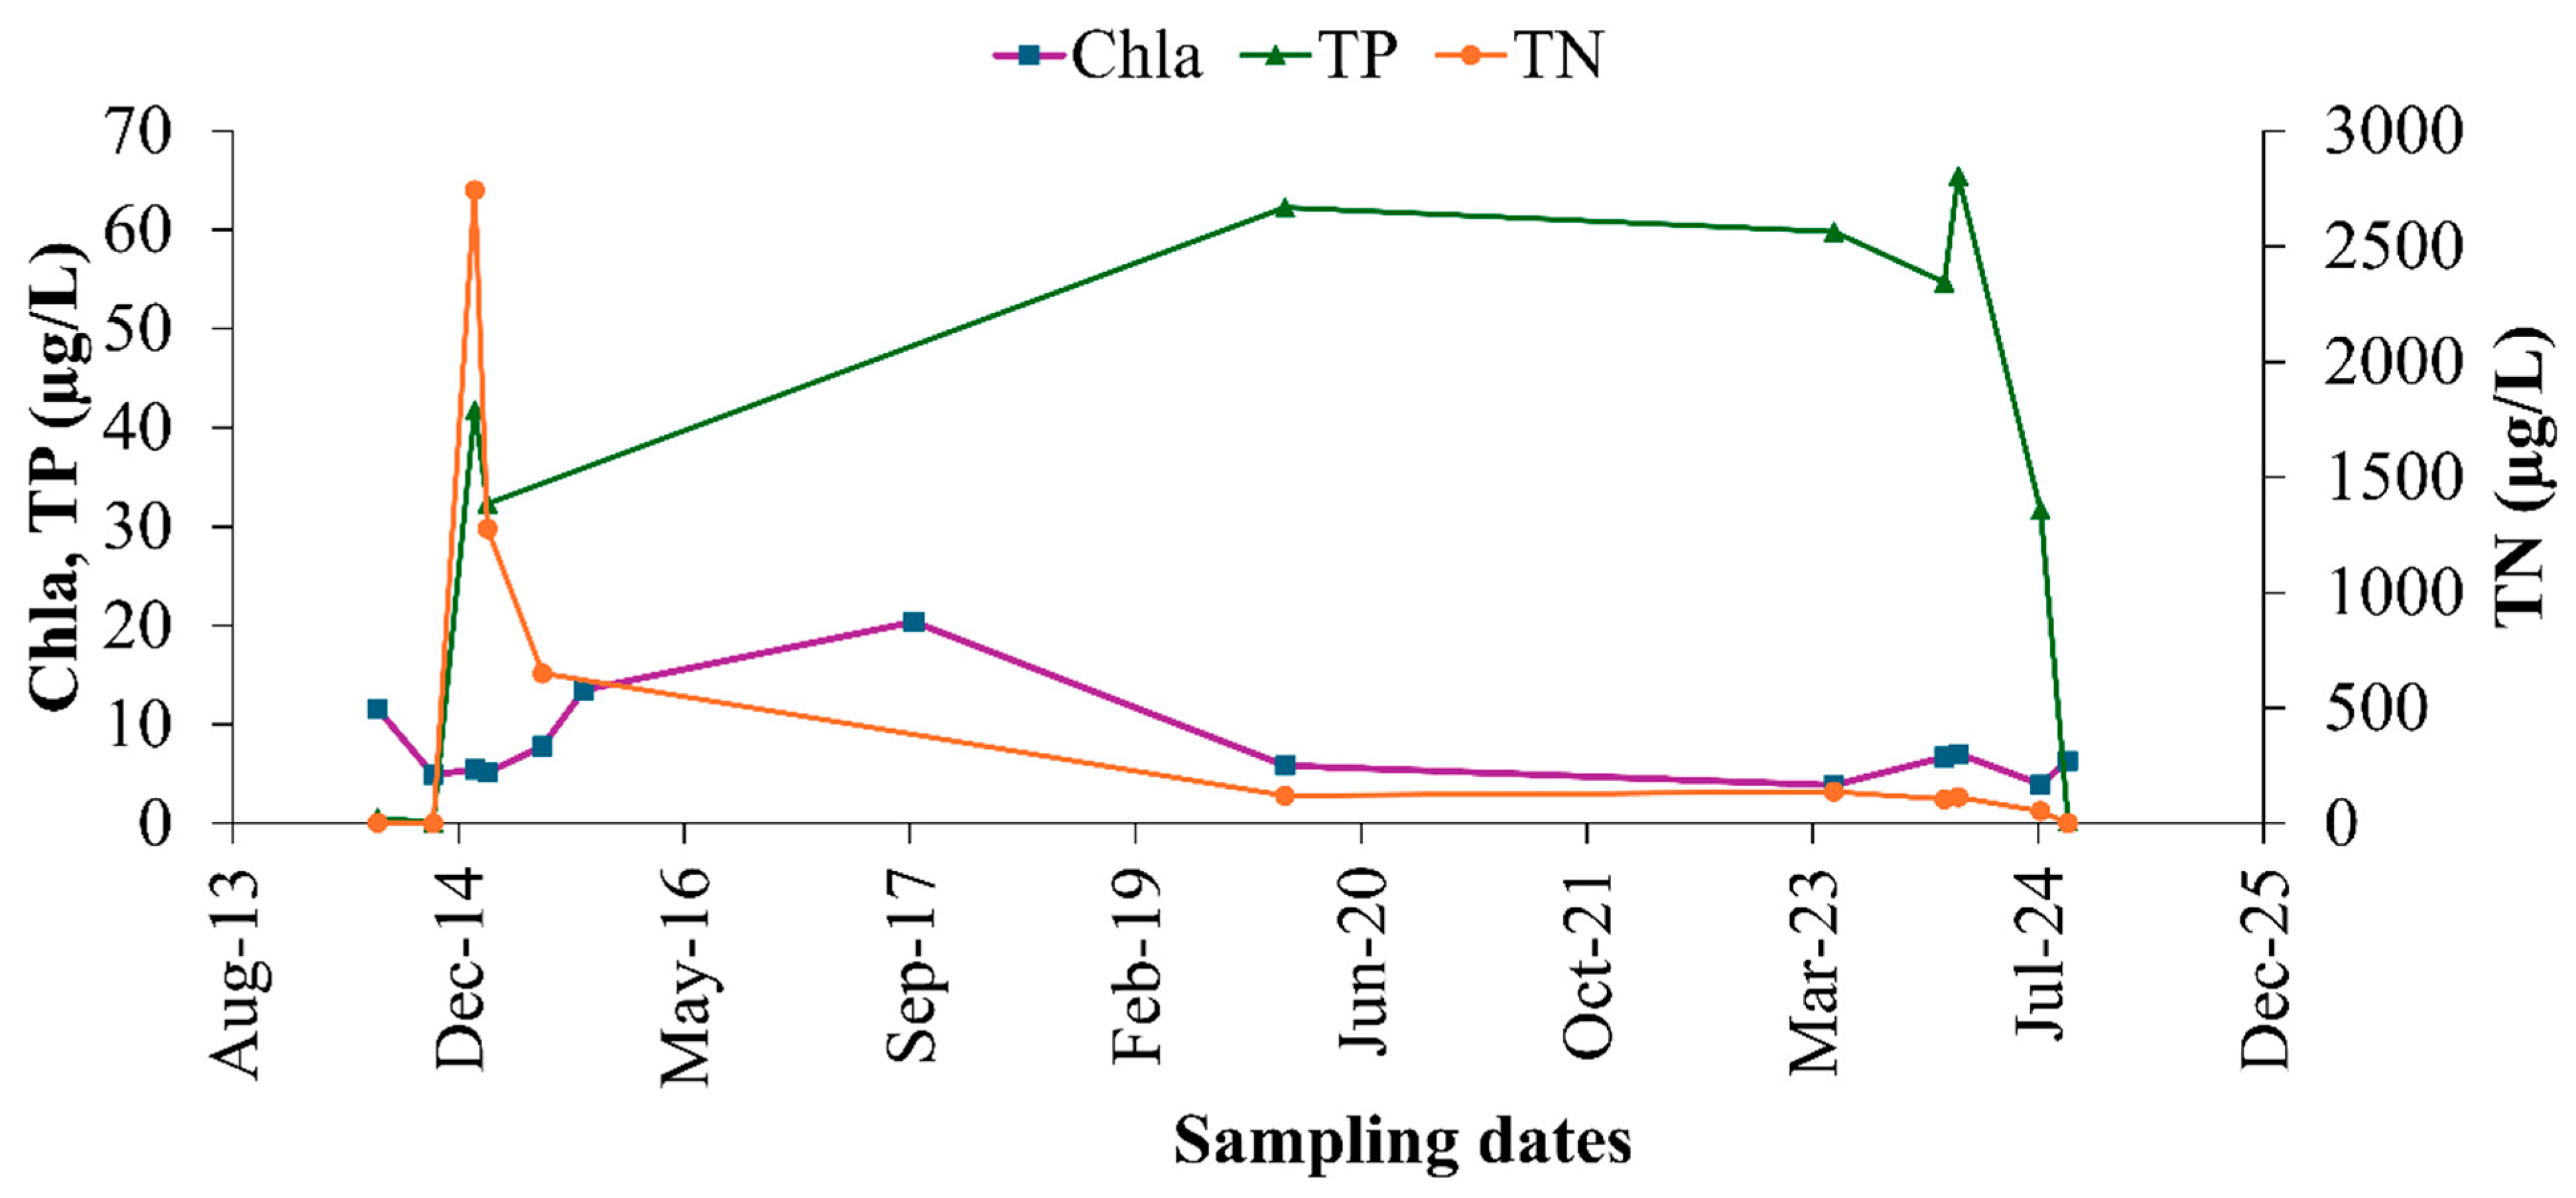
The biogeochemical characteristics of Ugandan lakes vary significantly due to variations in regional climate, human activities, and geomorphology. On-site water quality parameters, such as SDD, Chla, total nitrogen (TN), total phosphorus (TP), and turbidity (Turb), were recorded as shown in Table 1 by their statistical summary. Notably, the in situ data were sparsely collected. The graphs below illustrate the variation in the parameters studied over a decade. However, it is worth noting that the sampling was sporadic. As shown in Figure 2, the initial trends in Chla, TP, and TN fluctuated, with notable sharp increases in TP and TN, whereas Chla slightly increased in 2014. The sharp increase in TP and TN indicates major external nutrient inputs, likely from runoff (agricultural and industrial), waste discharge, and/or extreme rainfall events [2,30] from the watershed, which could have led to the occurrence of algal blooms, resulting in an increase in Chla. TN declined significantly, especially after 2016, to almost zero, leading to nitrogen-limited conditions where phosphorus was readily available, but the potential occurrence of algae could have been constrained by nitrogen. This decline may partly reflect reduced fertilizer application and improved nutrient management practices within agricultural catchments of Uganda’s Lake Victoria basin, as reported in recent basin-wide land-use studies [5]. Hydrological flushing during extreme rainfall events may have further accelerated TN depletion in surface waters. The Chla concentration followed a moderate peak in 2017, which coincided with relatively high available TP but was limited by low TN. However, it should be noted that cyanobacteria can fix nitrogen from the atmosphere into the aquatic ecosystems from unusable to usable forms [66]. As per this case, this was most likely not the case. The TP remained high for an extended period (from 2017 to 2024) before experiencing a sharp decline in July 2024. This means that a more significant accumulation of phosphorus in the lake threatens to fuel prolonged algal blooms under favorable conditions, such as those with ambient temperatures, adequate precipitation, effective water circulation, and sufficient wind. Lakes are generally saturated with phosphorus, as shown by the highly elevated trend. A lake is likely to experience another occurrence of high Chla concentrations if conditions become favorable, particularly with less wind and higher temperatures, leading to warm surface water. From July 2024, both nutrients (TP and TN) decreased to almost zero, although this decrease was most likely to have occurred over a short period of time. This can be attributed to a significant flushing event and biological uptake, such as algal blooms consuming available nutrients. The evidence of a general decrease in Chla is similar to that experienced in the 1960s [67,68]. This suggests that the primary driving factor for primary productivity is the availability of light rather than only nutrients.
The SDD is used to quantitatively measure how deep light penetrates the water column, whereas turbidity represents suspended particles in the water. The SDD and turbidity are inversely related. As shown in Figure 3, turbidity increased significantly in December 2014, whereas the SDD decreased. This coincides with the previously observed high values of TP, TN, and Chla in Figure 1, suggesting a possible algal bloom or sediment resuspension event. The presence of an algal bloom reduces the lake’s water clarity. This followed a decline in the turbidity levels from 2014 to 2019, while the SDD increased. This can be attributed to the possible reduction in the number of algal bloom events. From 2019 to 2024, turbidity levels rose steadily, with a peak in July 2024 and a corresponding decline in Secchi depth. This aligns with the nutrient decreases and moderate chlorophyll-a levels observed in Figure 2. The increase in turbidity level could have been driven by sediment resuspension and heavy runoff rather than algal blooms. The turbidity peak in July 2024 was most likely due to a high inflow or flushing event, as indicated by the decreases in TP and TN shown in Figure 2. The increased flow can resuspend existing sediments, which temporarily increases turbidity and reduces clarity. The inverse relationship between Secchi Disk Depth (SDD) and turbidity observed in this study is a well-established principle in aquatic optics, a fact continuously reinforced by modern remote sensing research. Turbidity, a measure of reduced light penetration from suspended particles, is a primary indicator of water quality degradation. Contemporary studies have advanced beyond foundational methods, using newer sensors and analytical techniques to refine water clarity estimates. For example, recent work has leveraged the improved spectral and spatial resolution of satellites like Landsat 8/9 to more accurately map turbidity in optically complex inland and coastal waters [69]. Furthermore, the application of machine learning algorithms to fuse data from multiple satellite constellations has become a common approach to improve the accuracy and temporal resolution of water clarity and chlorophyll-a retrievals, as demonstrated by [60]. Therefore, our findings align with this extensive and evolving body of research, confirming that the dynamics between water clarity and suspended matter in Lake Victoria are consistent with those observed globally.
To further evaluate the relationships among nutrients and algal biomass, we performed a Pearson correlation analysis between key water quality parameters (Table 3). Results show that TN was moderately and positively correlated with Chla (r = 0.50), while TP showed a weaker positive correlation (r = 0.24). Secchi depth was negatively correlated with Chla (r = −0.39), indicating reduced water clarity with higher algal concentrations. Turbidity also showed a weak positive correlation with Chla (r = 0.27). These results statistically support the nutrient–algae dynamics described above.

3.2. Satellite Remote Sensing Correlation with in Situ Parameters

Modeling optically active water quality parameters (Chla, turbidity, and SDD) with satellite spectral bands via statistical techniques has been adopted by previous researchers despite the variation in the satellites used [2,70,71,72]. However, this has been on a small scale in East Africa, particularly in Uganda. Matching satellite images aligned with the in situ data collection dates were used to obtain atmospherically corrected surface spectral reflectance values for further analysis. The DOS spectral reflectance band values strongly correlated with the in situ water quality parameters were used after finding their best subsets via Minitab statistical software, resulting in predictive linear monitoring algorithms for Chla, turbidity, and SDD. However, the algorithm for turbidity yielded poor results in terms of the coefficient of determination (R2 = 0.23) and was, therefore, discarded. The poor performance of the turbidity model (R2 = 0.23) was primarily due to the limited number of in situ turbidity measurements that matched cloud-free Landsat 8/9 overpasses. This reduced dataset constrained model development and resulted in weak correlations compared to parameters with more frequent matchups, such as chlorophyll-a and Secchi disk depth. The best spectral single-band models had adjusted R2 values of 0.79 and 0.87, respectively, whereas those for the spectral ratio band models were 0.68 and 0.88 for Chla and SDD, respectively. Equations (7)–(10) show the above-stated algorithms for Chla and SDD. These equations represent the best-performing models after systematically testing multiple band combinations, as detailed in Section 2.3.1. Model selection was based on adjusted R2, predicted R2, RMSE, MAE, Mallow’s Cp, and S-value, and validation was conducted on independent test data (70% training, 30% testing). Weaker models (e.g., the turbidity algorithm with R2 = 0.23) were discarded, while the final models reported here achieved the strongest balance of predictive accuracy and robustness (see Table 4). It is worth noting that the Dark Object Subtraction (DOS) step was applied as a supplementary refinement to the Landsat 8/9 L2 reflectance products. While L2 data are atmospherically corrected, DOS helped minimize residual haze and improved consistency between the satellite-derived reflectance and in situ measurements, thereby enhancing the accuracy of the regression models. The developed algorithms were validated within the concentration ranges of 0.40–25 µg/L for Chla and 0.1–4 m for SDD. Predictions outside these calibration ranges were flagged as uncertain rather than clipped, to ensure that extreme conditions such as algal bloom events were still captured, albeit with reduced confidence. High Chla concentrations, particularly during bloom events nearshore Lake Victoria, are known to introduce model uncertainties due to spectral saturation, increased scattering, and mixed-pixel effects. Users should therefore interpret predictions above the validated thresholds with caution, as errors are expected to increase under such conditions. To support operational use, calibration range overlays were added to the validation figures (Figure 4 and Figure 5). These overlays provide visual context for the model’s intended applicability and highlight conditions under which predictions may be less reliable. This adjustment strengthens transparency and helps guide water managers in interpreting the models under both typical and extreme eutrophic conditions [73]. Another important source of model uncertainty arises from the ±1-day temporal matching between in situ sampling and satellite overpasses. Previous studies have shown that temporal lags of +3 h up to 7 days can still yield acceptable correlations for inland water quality monitoring [60,61,62,63,64]. However, Chla concentrations are susceptible to short-term variability and bloom patchiness, which may lead to increased errors when the lag extends beyond a few hours. While our ±1-day approach represents a balance between data availability and temporal fidelity, users should interpret results cautiously during bloom events, as rapid changes in algal biomass may not be fully captured in the satellite–in situ matchups. This aligns with findings in the literature, where chlorophyll-a retrieval errors increase progressively with lag, remaining reliable within 0–1 days but deteriorating markedly beyond 3 days, whereas Secchi depth tends to tolerate slightly longer lags, though with reduced predictive certainty [59,62].To assess the performance and validity of the multi-band regression models, we conducted diagnostic tests, including the evaluation of Variance Inflation Factors (VIFs) and the statistical significance of individual predictors. VIF values below 10 were considered acceptable, while higher values indicated potential collinearity among bands. Only predictors with strong statistical support (p < 0.05) were included in the final models, and non-significant terms (e.g., DOSB5 in the TSI(SDD) model, p = 0.14) were noted but not further interpreted. Across the models, most predictors were highly significant (p < 0.01) with VIF values generally <10–15 for key terms, suggesting that while some collinearity is inherent to multispectral data, the models retained stability as shown in Table 5. This diagnostic approach ensures that the equations presented are not only statistically significant but also robust against multicollinearity issues. It should be noted that while ordinary least squares regression provided interpretable and comparable models in this study, advanced techniques such as ridge regression or partial least squares (PLS) could further strengthen robustness against multicollinearity in future applications.
The best spectral single-band algorithms were used
C h l a = 4.088 + 0.000799   B 1 0.01613   B 2 + 0.02831   B 4 0.01353   B 6
where B1, B2, B4, and B6 represent the DOS surface reflectance values from the coastal/aerosol, blue, red, and SWIR1 bands, respectively. The model indicates that the Chla concentration increases with increasing reflectance in B1 and B4 and decreases with increasing reflectance in B2 and B6. This is consistent with the known spectral characteristics of Chla, which absorbs strongly in the blue and red wavelengths and is influenced by suspended matter in the SWIR region.
S D D = 3.639 0.000813   B 1 + 0.00479   B 2 0.00439   B 3
where Band 1 (coastal/aerosol), Band 2 (blue), and Band 3 (green) represent the surface reflectance values. The positive coefficients for B2 indicate that higher blue reflectance is associated with increased water clarity, which is consistent with clearer water allowing deeper light penetration. In contrast, negative coefficients for B1 and B3 suggest that increased reflectance in the coastal and green bands corresponds to reduced SDD, likely due to scattering from suspended sediments, especially those closer to the shoreline.
The best spectral ratio band algorithms were used.
C h l a = 17.21 5.37   R 21 + 19.64   R 52 10.84   R 43 16.47   R 54
S D D = 3.707 2.564   R 42 + 1.583   R 43 + 2.702   R 61 2.166   R 62
The lake’s trophic state index was calculated on the basis of two in situ parameters (Chla and SDD), known as TSI (Chla) and TSI (SDD), Via equations described by [37]. After a correlation analysis (TSI_insitu and spectral reflectance values), the best spectral single and ratio models were obtained, as shown below.
Single-band models were used.
T S I ( S D D ) = 43.49 + 0.006757   B 1 0.05311   B 2 + 0.03825   B 3 + 0.00662   B 5
The TSI increases with increasing reflectance in Bands 1 (aerosol), 3 (green), and 5 (NIR), whereas it decreases with increasing reflectance in Band 2 (blue). This is consistent with the understanding that lower water clarity (higher TSI) corresponds to reduced blue reflectance and elevated reflectance in the green and NIR regions due to the presence of suspended matter or algal blooms. Band 1 also contributes positively, likely reflecting surface scattering effects.
T S I ( C h l a ) = 42.42 + 0.004085   B 1 0.05057   B 2 + 0.07357   B 4 0.03749   B 7
where B1 (aerosol), B2 (blue), B4 (red), and B7 (SWIR 2) are spectral reflectance bands. Band 1 had a positive coefficient, indicating an increase in reflectance in this band, which is often affected by surface scattering and aerosols and correlates with higher trophic levels, likely reflecting increased surface turbidity. The negative coefficient for Band 2 aligns with the known strong absorption of Chla in the blue region, where more transparent waters exhibit higher reflectance, and eutrophic waters show a marked decrease. Band 4, with the most significant positive coefficient, captures the red absorption trough of chlorophyll a. As the algal biomass increases, the absorption in this band strengthens, contributing significantly to the estimation of the Chla-derived TSI.
The negative coefficient for Band 7 indicates an inverse relationship between the reflectance and the TSI (Chla). This reflects a reduction in the SWIR reflectance with increasing water content or denser vegetation along the water edge, which is often associated with turbidity and higher eutrophication levels.
Spectral ratio models were used.
T S I ( C h l a ) = 46.82 + 47.18   R 52 44.05   R 54 8.50   R 61
T S I ( S D D ) = 34.55 + 22.91   R 42 12.39   R 43 21.57   R 71 + 18.76   R 72

3.3. Application of Predictive Models

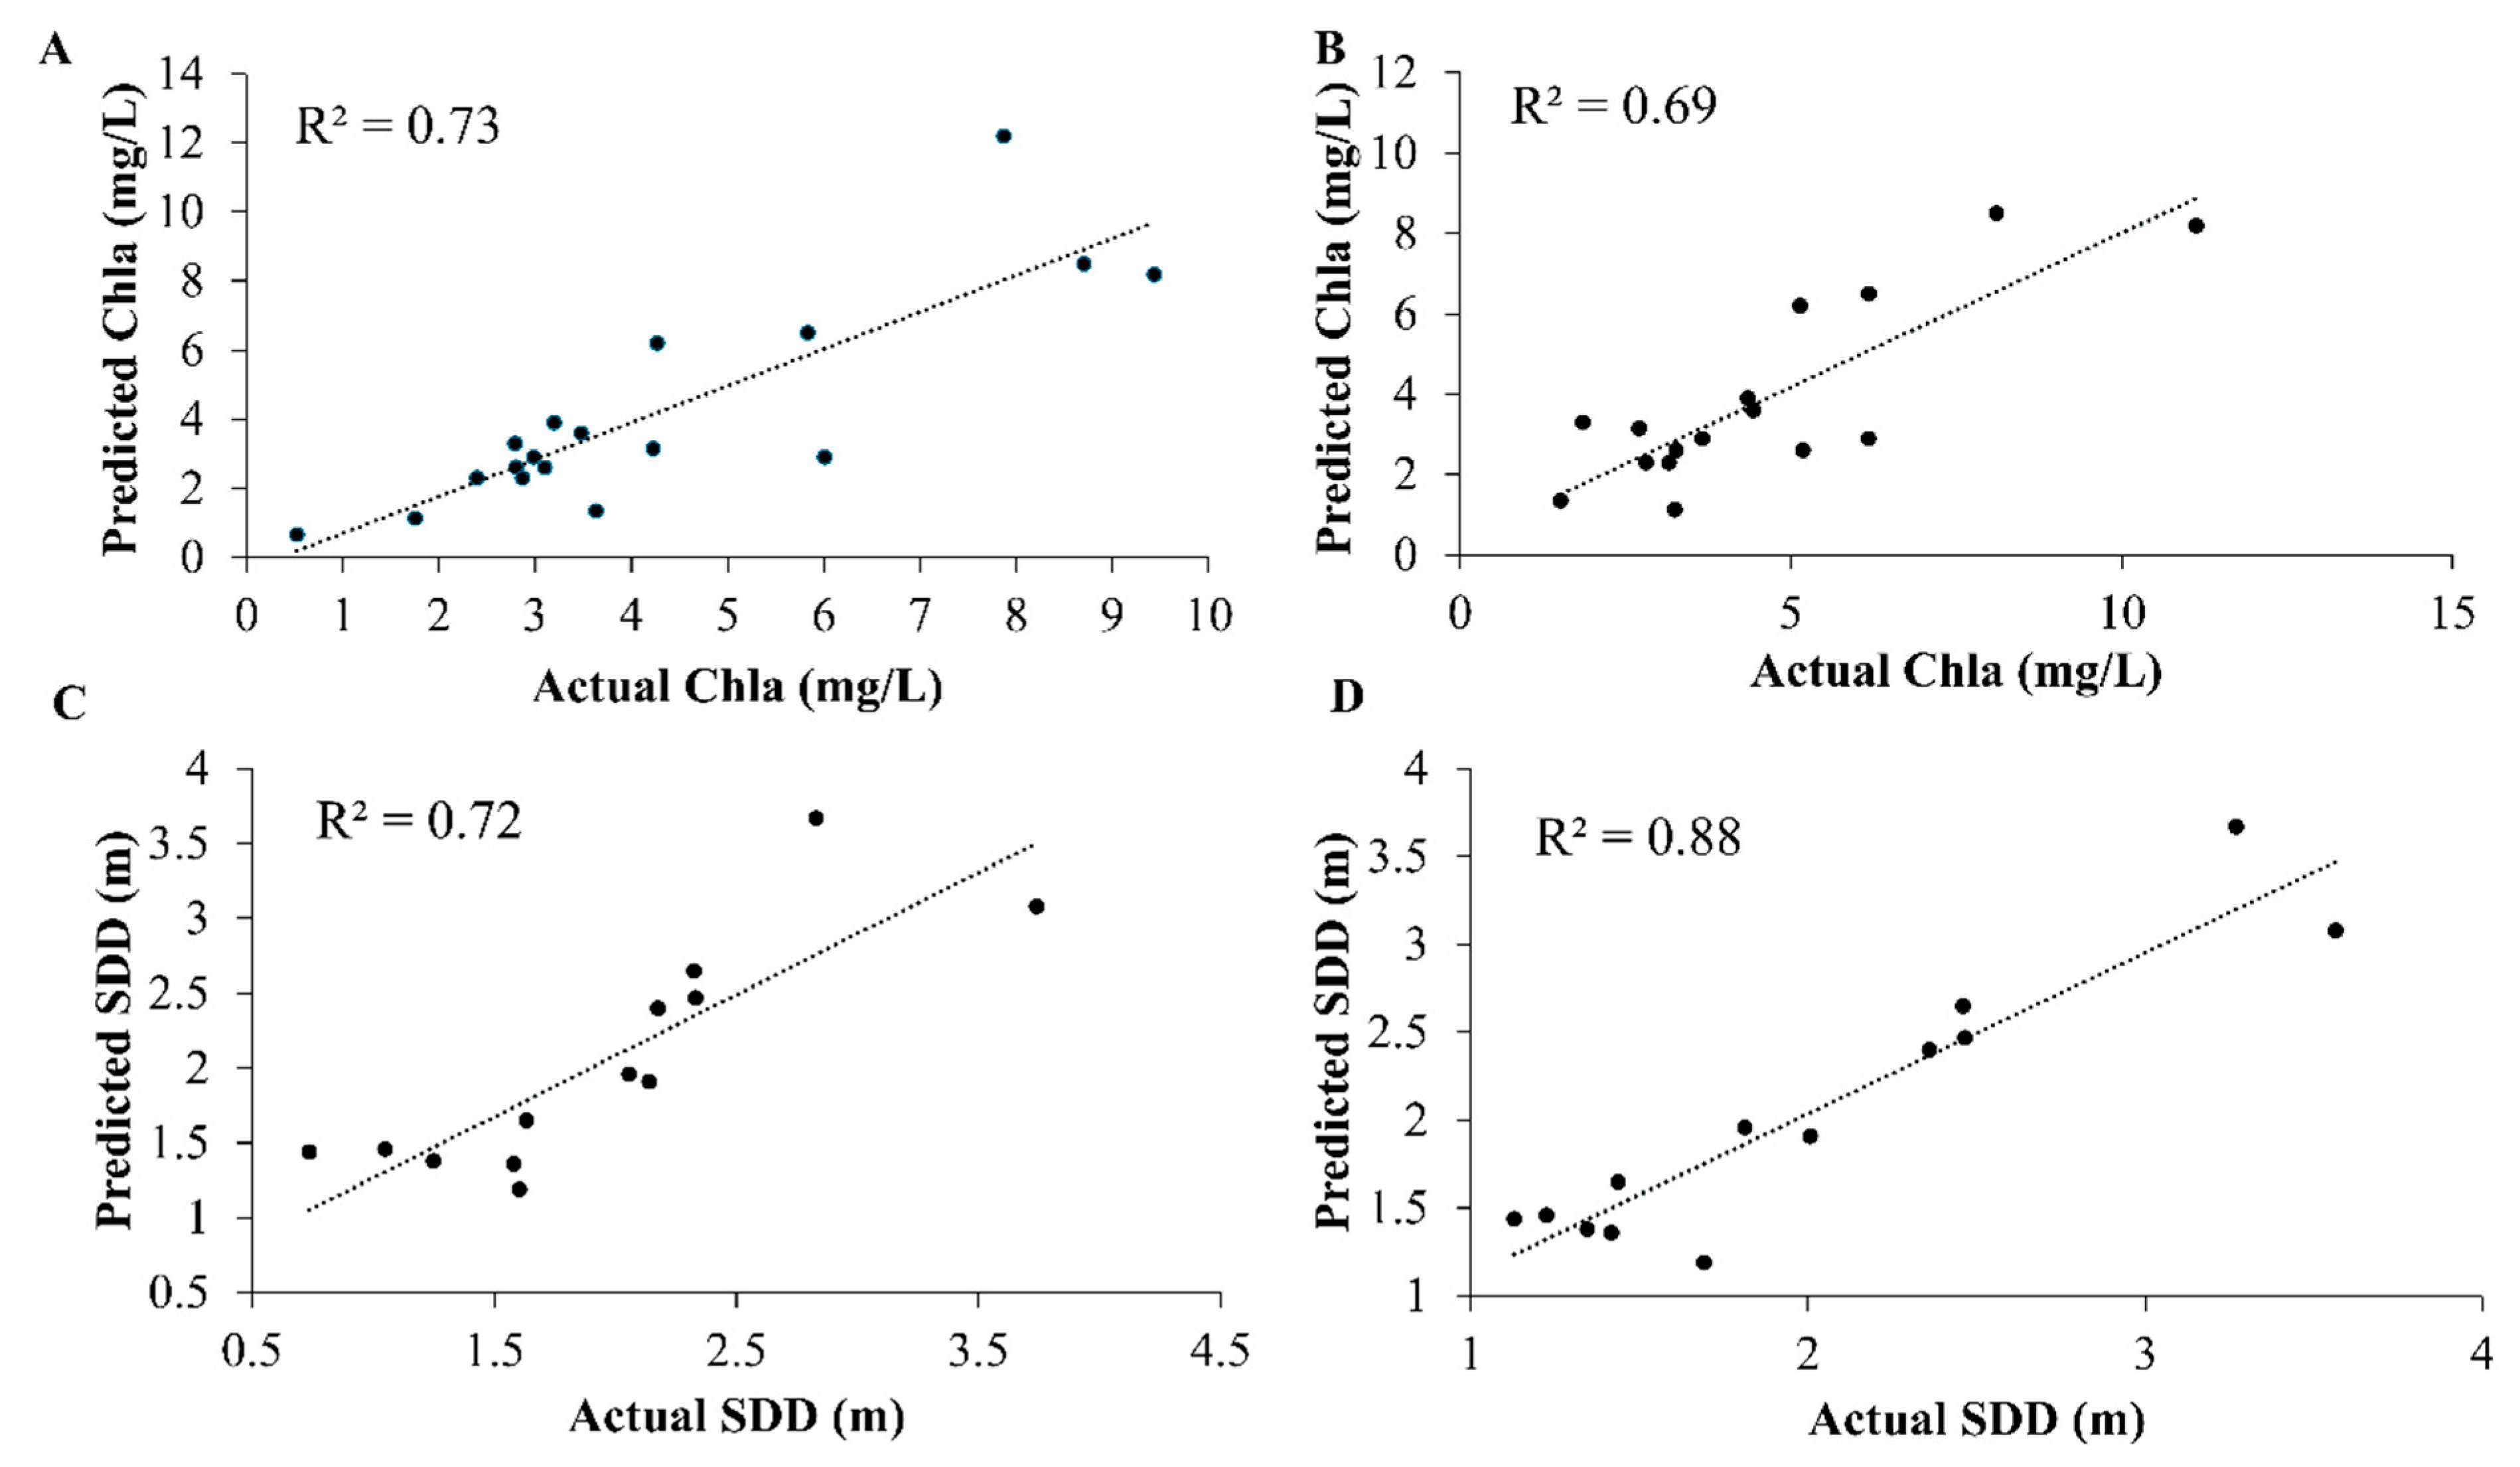
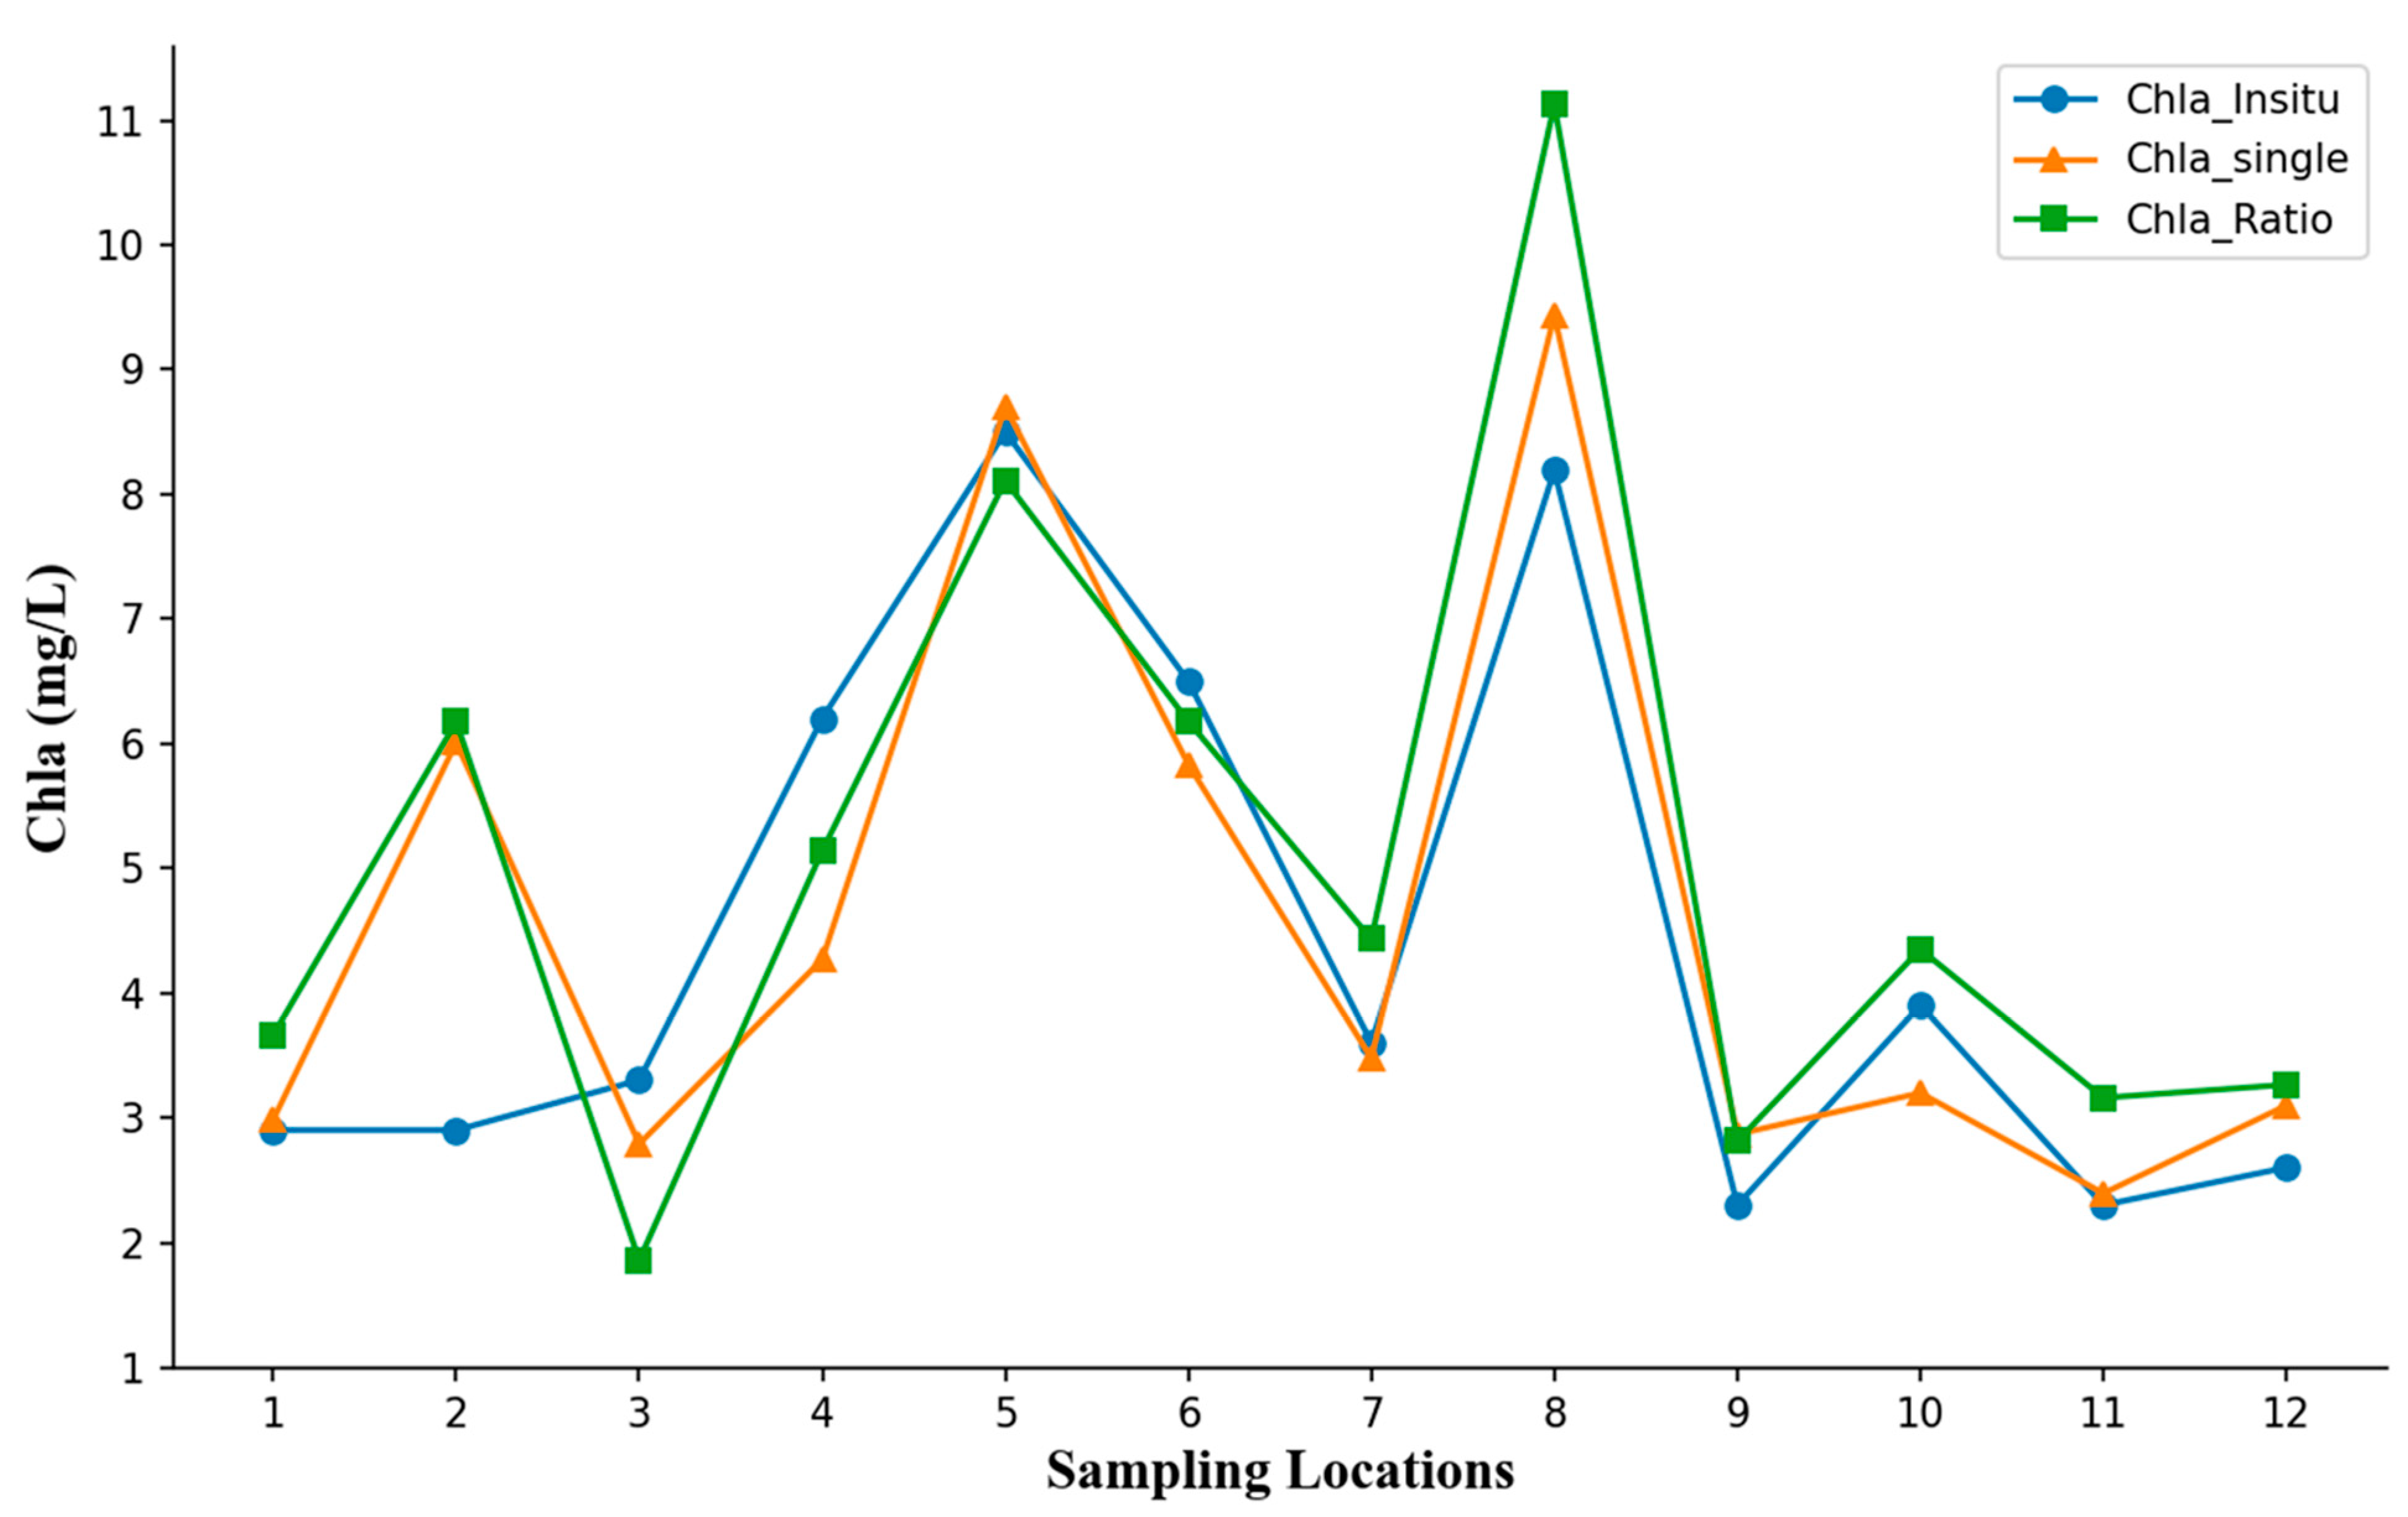
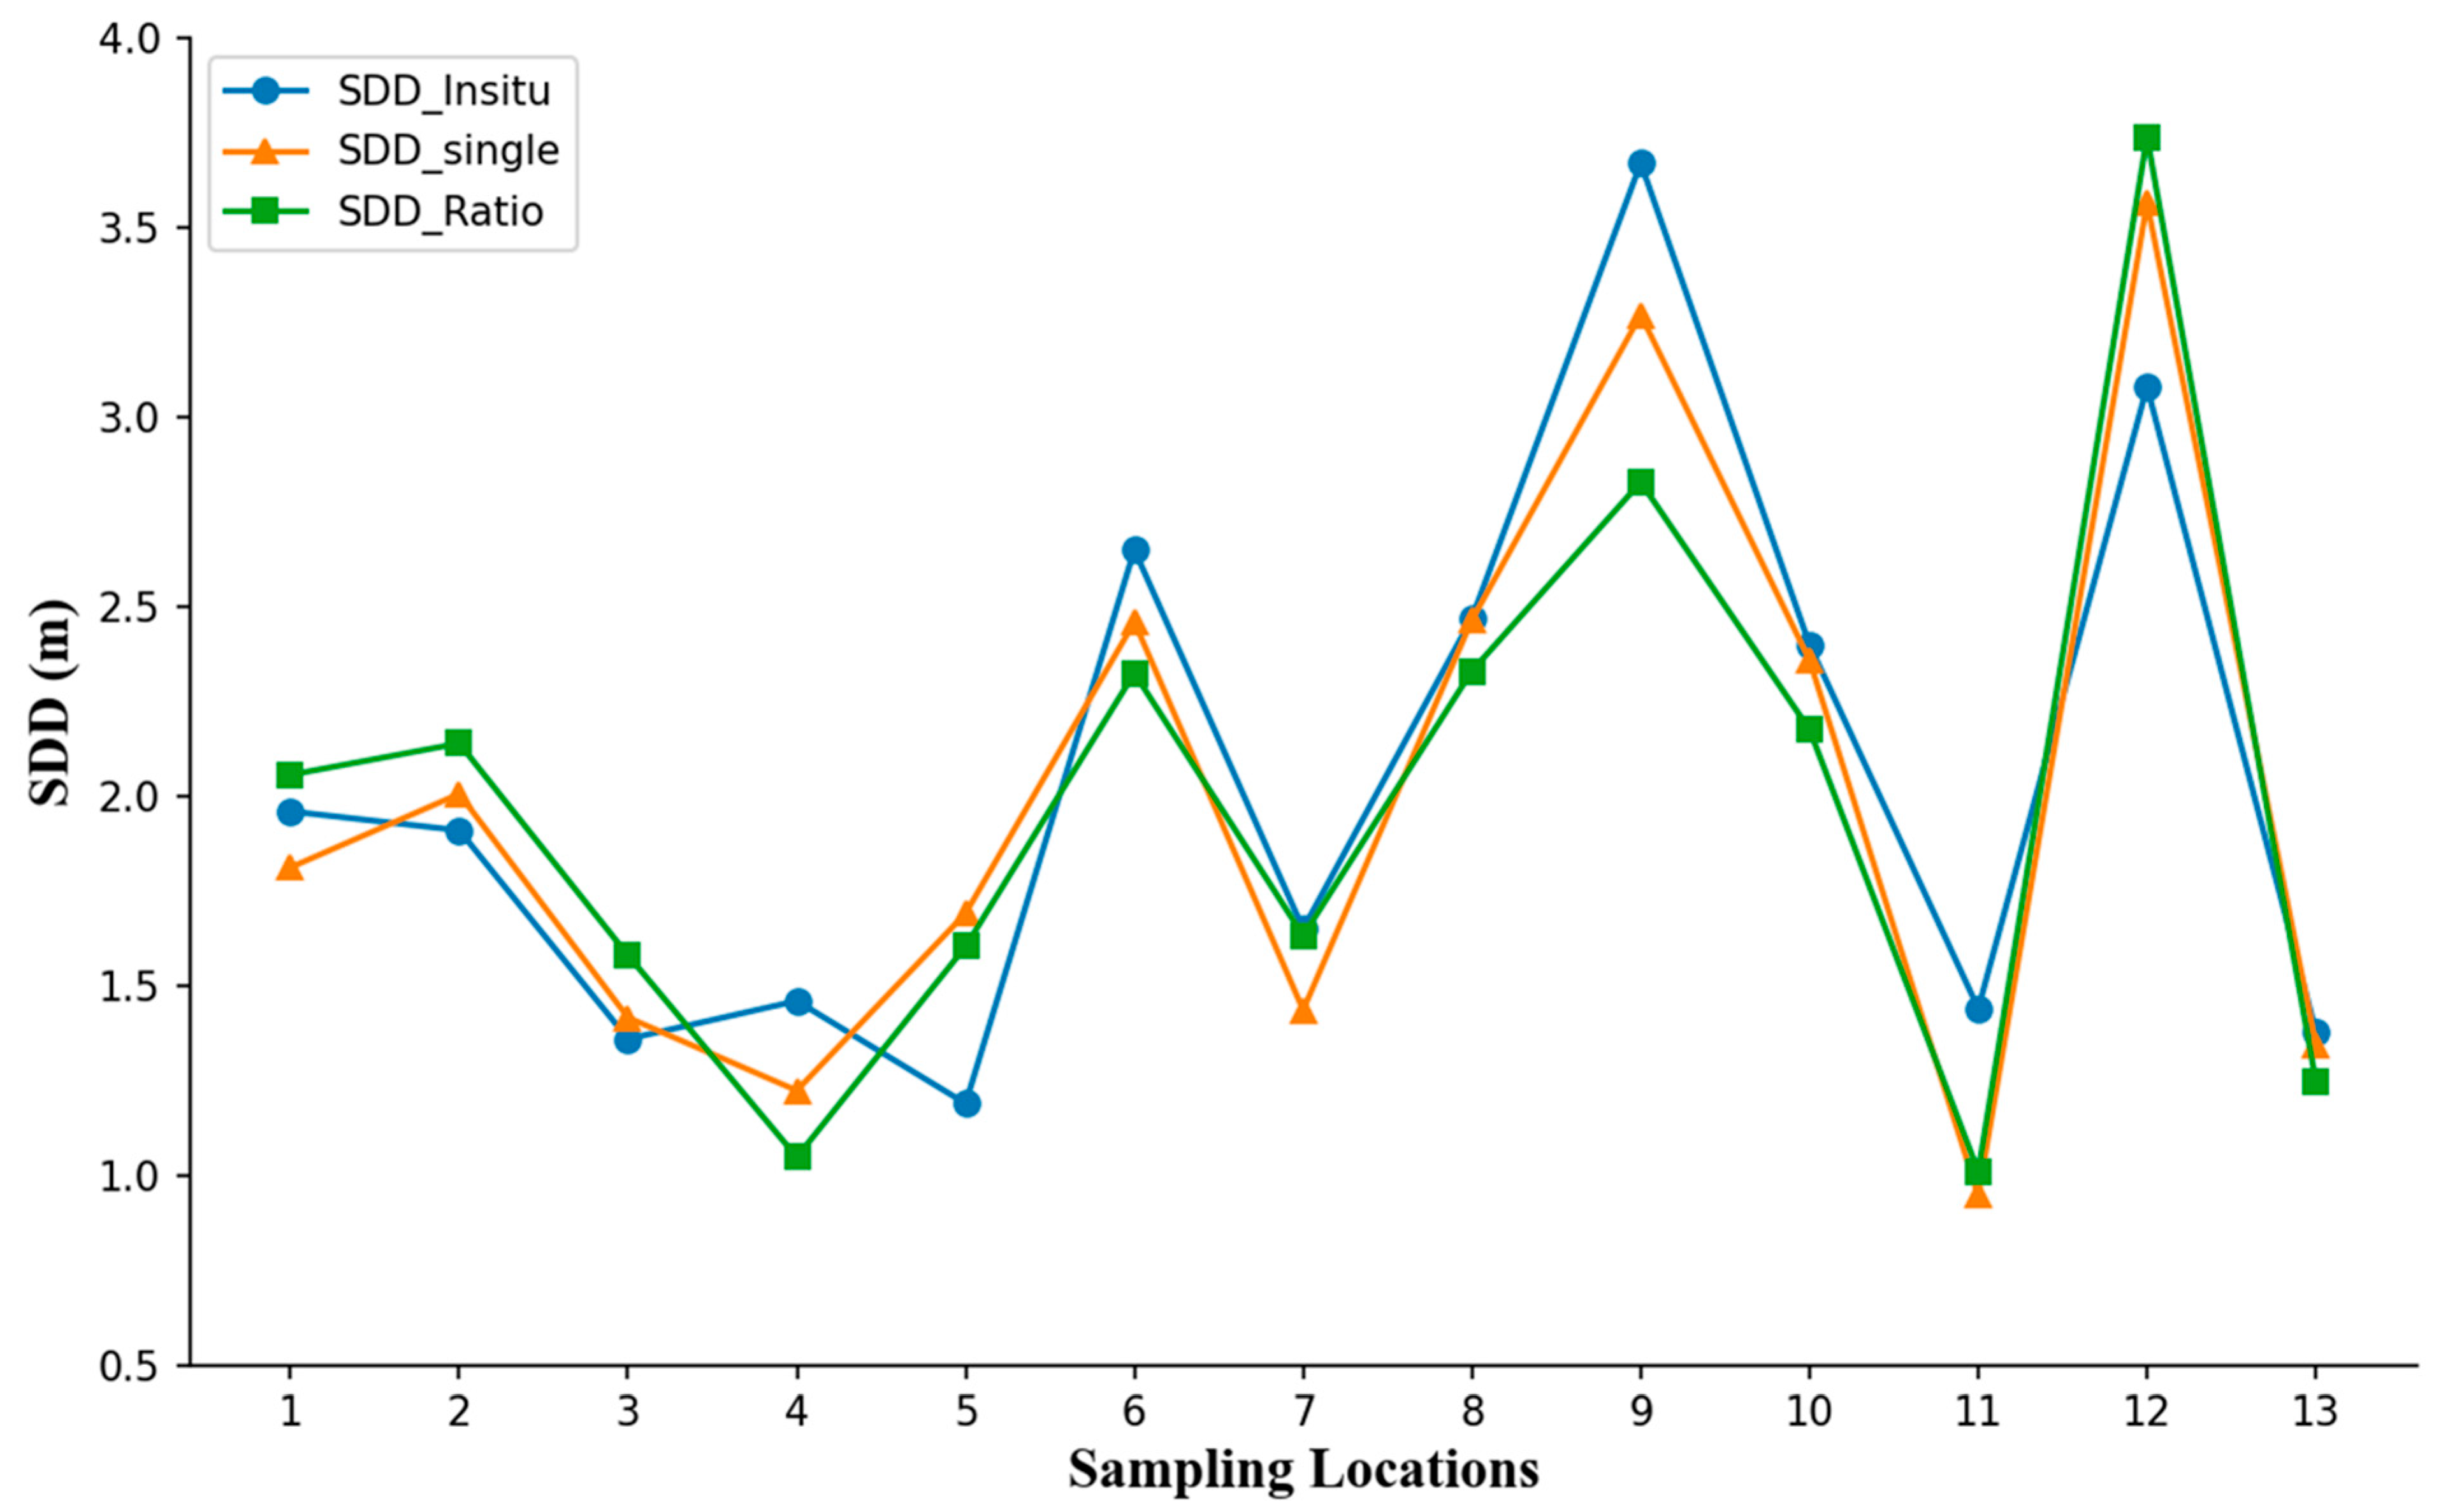
The developed algorithms were tested on unseen data (data left out during model development) from the sampled stations for both parameters (Chla and SDD), yielding significantly good results, with R2 values of 0.73 and 0.72 for the spectral single-band models and 0.69 and 0.88 for the spectral ratio bands, as shown in the plots (Figure 6). The combined trend analysis plots for both parameters revealed similar trends between the onsite and estimated measurements via the developed algorithms (Figure 7 and Figure 8). However, variations are also observed, especially at the peaks (the highest points) and troughs (the lowest points). As shown in Figure 7, both models overestimated the Chla values at sampling locations 2 and 8. In contrast, Figure 8 shows that both models underestimate the SDD values at sampling locations 4 and 9. At location 8 in Figure 7, the models yielded higher estimated values than did the in situ measurements. The average estimated values were close to the in situ measurements, with slight variations in some of the estimated measurements. This may be because satellite derivatives were modeled from a monthly dataset rather than a one-day in situ collection [2]. These discrepancies are most likely caused by localized bloom patchiness and short-term variability, which can produce sharp concentration gradients not fully captured by the 30 m Landsat pixel size. In near-shore stations, additional influences such as sediment resuspension, wastewater inflows, and mixed-pixel effects may also contribute to model under- or overestimation. Furthermore, the ±1-day temporal lag between in situ sampling and satellite overpasses may amplify mismatches during highly dynamic bloom events. Other evaluation metrics are shown in Table 4. The chlorophyll-a models yielded MAPE values of 32% (single-band) and 44% (ratio-based), which are within the expected range for inland, optically complex waters such as Lake Victoria. These relatively high errors are largely attributable to bloom patchiness and short-term variability, where localized peaks in chlorophyll-a can change rapidly between in situ sampling and satellite overpasses. Despite this, the corresponding R2 and RMSE values indicate that the models capture the overall spatial and temporal dynamics of eutrophication reliably and are suitable for operational monitoring.
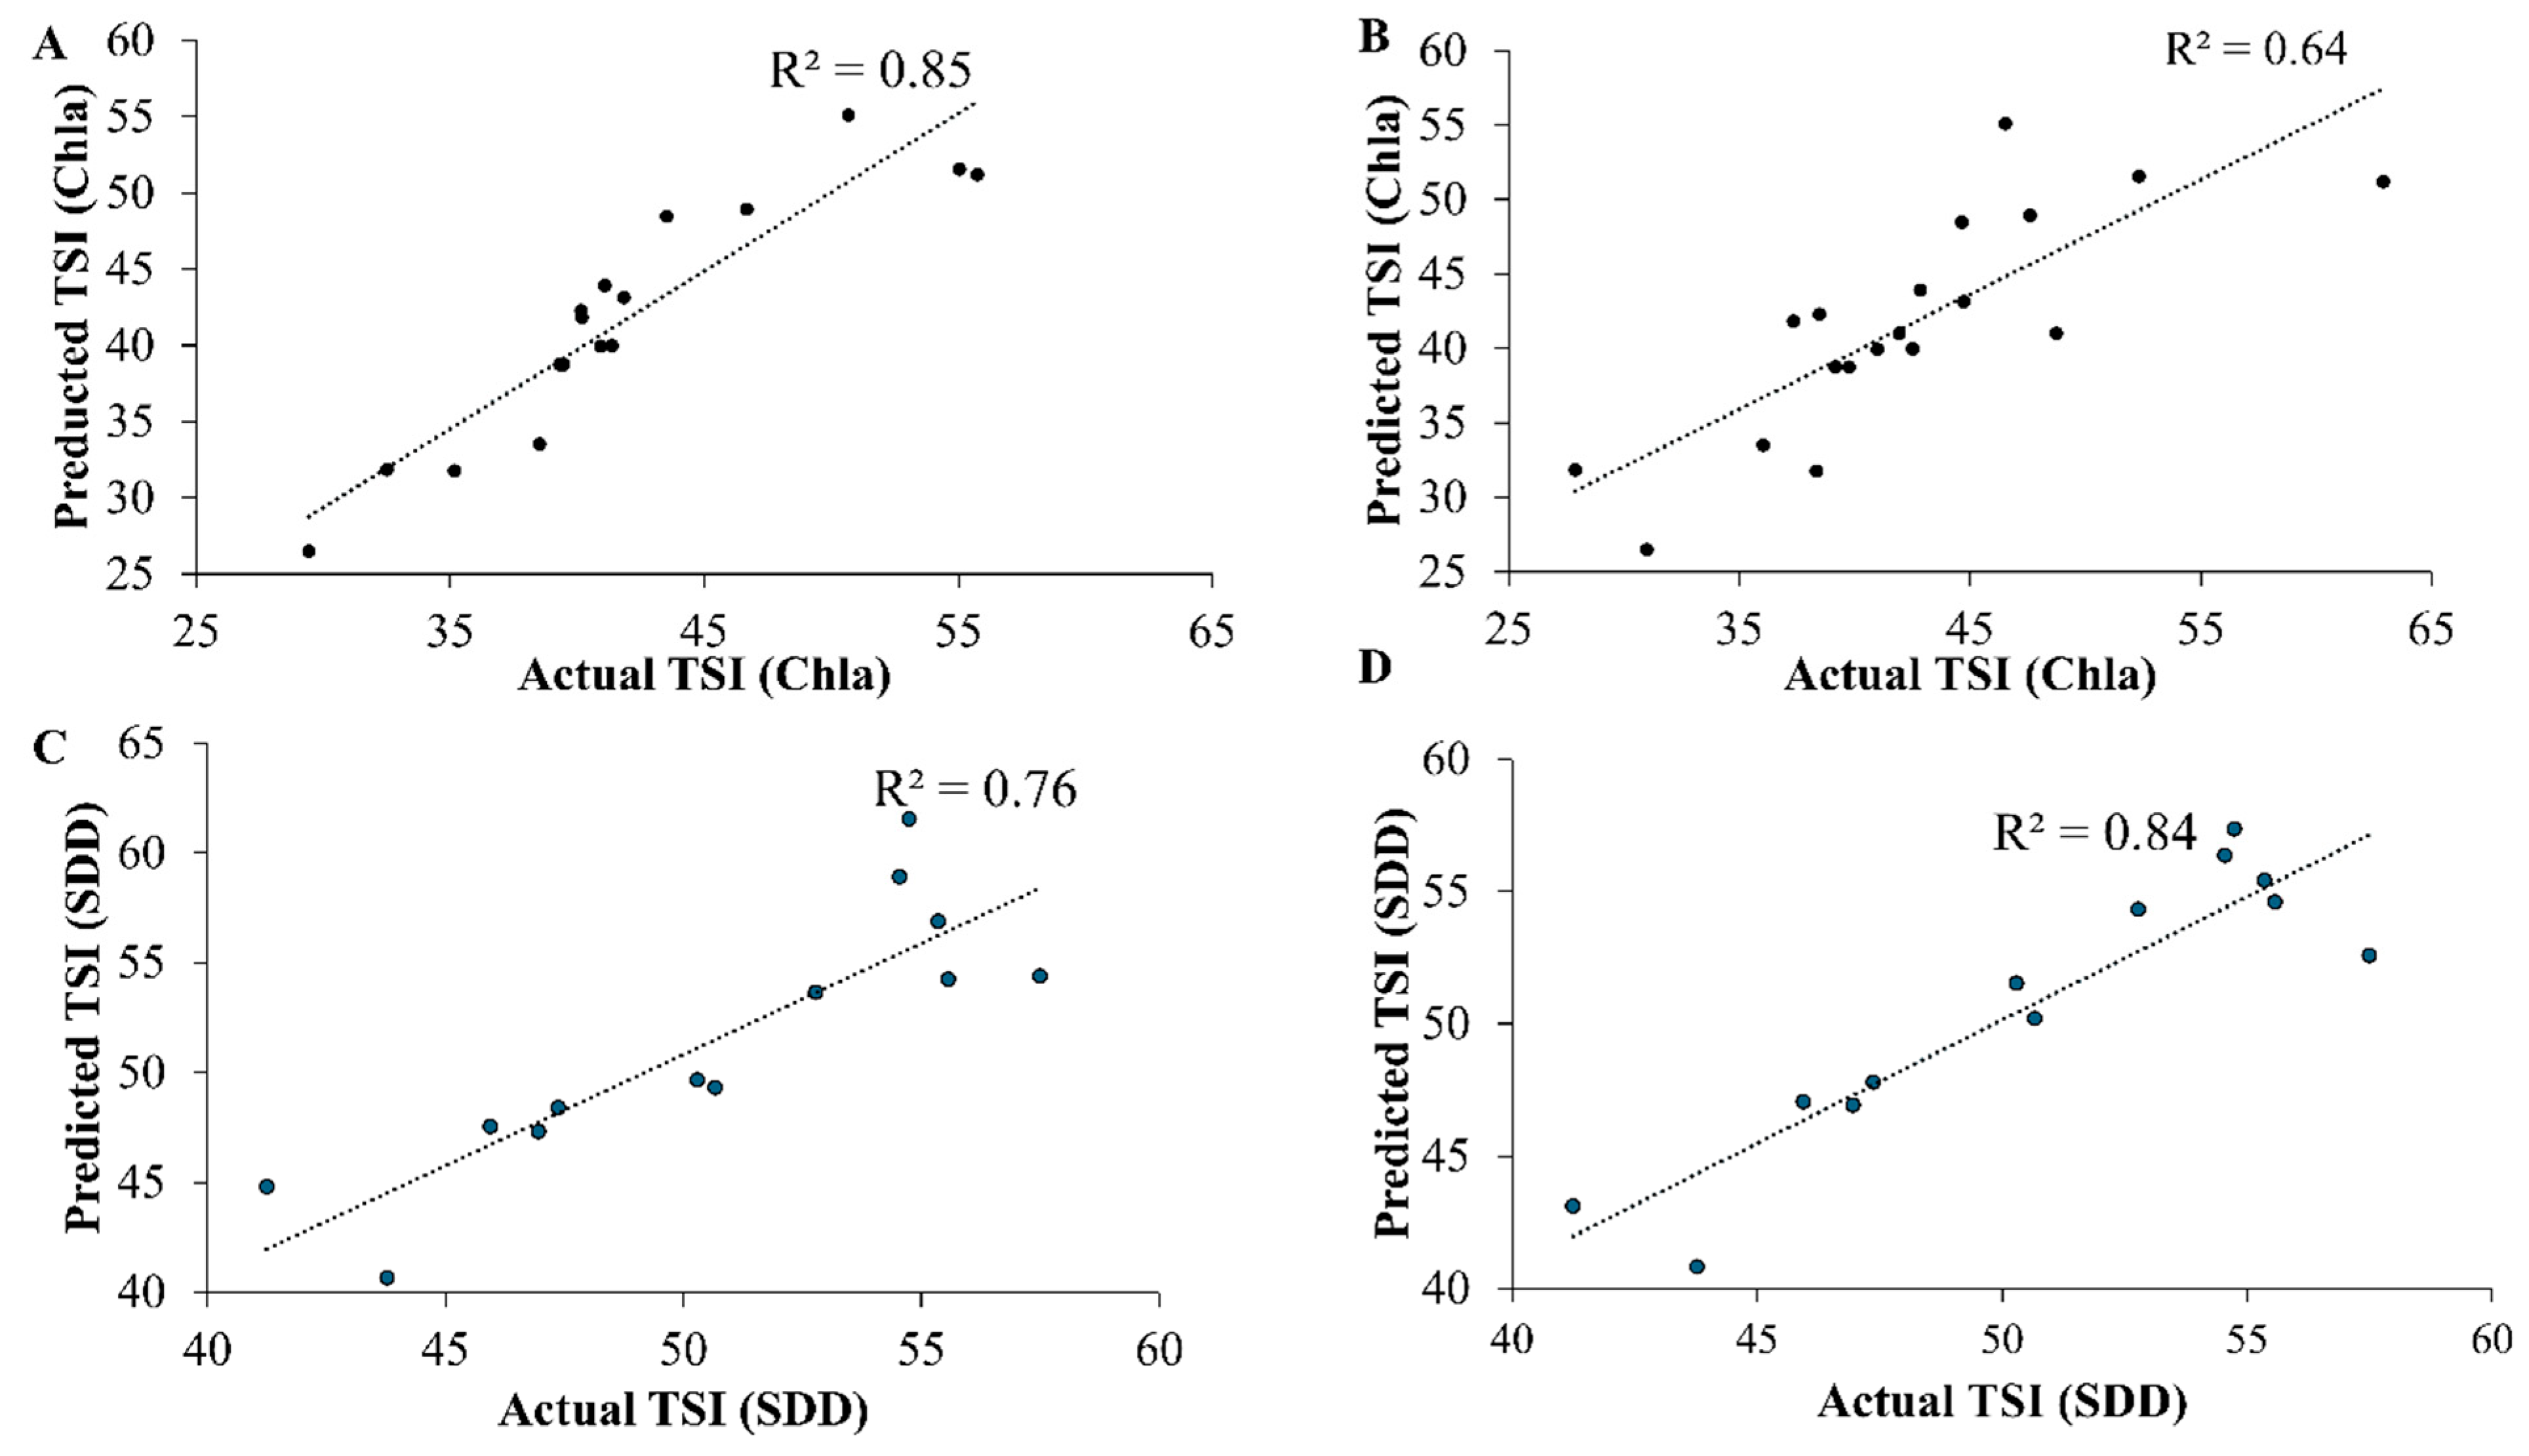
The single-band model for TSI (Chla) exhibited a strong correlation (R2 = 0.85) between the predicted and actual values (Figure 9A). This indicates that the model performed well, accounting for approximately 85% of the variance in the actual TSI values. In contrast to the single-band model, the ratio model demonstrated a moderate correlation (R2 = 0.64) between the predicted and actual TSIs (Chla). This model is less accurate than the single-band model, but it can still predict the lake’s TSI. The single-band TSI (SDD) model exhibited a reasonably strong correlation (R2 = 0.76), accounting for 76% of the variation in the actual SDD-derived TSI (Figure 9C). The spectral ratio model (Figure 9D) demonstrated a strong correlation (R2 = 0.84), indicating robust predictive performance.
The developed models were applied to selected Landsat 8 images to understand the spatial variability of the parameters being studied. However, remote sensing has one of the significant challenges that hinder the mapping of areas of interest, which is high cloud cover [2]. In this study, the clouds are shown (Figure 3 and Figure 4) as white patches (no data portions) in the spatial maps. These white patches correspond to pixels flagged by the Landsat QA_PIXEL cloud and shadow masks. While such pixels were excluded during model development and validation, they remain visible in the mapped outputs because fully cloud-free imagery was not available for all study dates. The Chla concentrations (Figure 4) in Lake Victoria are relatively high around the shoreline areas extending a few kilometers into the lake, whereas relatively low concentrations occur in the middle section. The higher Chla concentrations indicate higher productivity due to higher nutrient concentrations than those in the middle section from surface runoff (point and nonpoint sources) and uncontrolled mixing of the lake (shallow sections) with waste disposal effluents [71] as a result of anthropogenic activities such as agriculture, urbanization, and settlement within the watershed [1]. Higher Chla concentrations are indicative of the presence of an algal bloom. As shown in Figure 4, the SDD values were lower near the lake’s shoreline, extending a few meters into the lake. This is mainly attributed to the point and nonpoint sources influencing turbidity, lowering the SDD (higher turbid waters). In contrast, less turbid waters were observed in the middle sections of the lake, leading to higher SDD values. From the mapped TSI values (Figure 5), the lake exhibited trophic states ranging from mesotrophic to eutrophic, which was consistent with previous studies performed by [2] on the use of MODIS satellite data. However, a few sections much closer to the shoreline exhibited characteristics of the hypereutrophic state. The areas closer to the shoreline were highly eutrophic, indicating the possibility of harmful algal blooms. The largest section of the lake exhibited a mesotrophic state (blue color) in Figure 5. Similar patterns have been reported across other Lake Victoria sub-basins in recent years. For example, Sentinel-2 studies in Winam Gulf and Murchison Bay (2020–2024) identified steep nearshore–offshore Chla gradients driven by nutrient inputs and limited mixing [45,74]. Basin-wide analyses also show that Chla hotspots are localized near urbanized catchments, while offshore waters remain less eutrophic. These parallels suggest that Ugandan nearshore dynamics are consistent with regional eutrophication trends, though local wastewater discharges, such as those from Entebbe and Masaka, amplify bloom severity in our study area. Satellite remote sensing has been largely hindered by atmospheric interference due to high cloud cover. In the spatial maps below, the white patches indicate cloud cover (no data), and care must be taken when interpreting TSI estimates closer to the clouds, as they may be influenced by their shadows. However, in the TSI(SDD) single-band map, the negative coefficient on the blue band (B2) can offset the positive contributions from B1, B3, and B5, reducing the dynamic range over bright cloud pixels and giving the appearance of cloud suppression. These pixels remain flagged as cloud/shadow in the QA mask and should not be interpreted as valid water retrievals. In addition to cloud masking, several other factors limited model accuracy. Retrievals in optically complex waters with high suspended sediments or dissolved organic matter were less reliable, especially during runoff or resuspension events. Recent studies have further demonstrated that in turbid coastal environments, standard ocean-color Chla products often overestimate concentrations by 48–170%, necessitating rigorous quality control to ensure reliability. Reference [75] showed that after applying reflectance-based QC tests, correlations between satellite and in situ Chla improved markedly (R2 = 0.80–0.89). Band-ratio models also showed sensitivity to spectral differences and mixed-pixel effects in narrow nearshore zones, as observed in other studies [60]. Temporal mismatches within the ±1-day window, combined with the patchy nature of algal blooms, further contributed to residual errors. It should also be noted that while all parameters were measured during each campaign, resource and laboratory constraints limited the number of processed samples for TN, TP, and turbidity, resulting in fewer usable data points compared to Chla and SDD. This imbalance does not undermine the validity of the models developed in this study, as we focused on parameters with the strongest spectral response and most complete temporal coverage. However, future studies would benefit from more balanced and systematically processed datasets across all parameters, which would support the development of more comprehensive models and facilitate the application of advanced approaches such as machine learning [76]. These issues highlight the need for complementary field validation and multi-sensor approaches in future applications.
It is important to note that while regression models were calibrated within relatively narrow in situ ranges (TSI(Chla) ≈ 25–60; TSI(SDD) ≈ 40–60), mapped predictions sometimes extend beyond these ranges (e.g., TSI(Chla up to ~75, TSI(SDD down to ~28)). These wider ranges reflect model extrapolation under bloom-prone or highly turbid conditions and, although retained to capture potential extremes, should be interpreted with caution as they carry higher uncertainty.

4. Conclusions

Lake Victoria’s eutrophication has increased over the last few decades, highlighting the need to understand its origins and drivers. Satellite remote sensing is the most cost-effective and reliable technique for monitoring inland water bodies, especially lakes, because of its wide spatial coverage [77]. This is due to the urgent need for continuous monitoring and understanding of general water quality chemistry by the relevant protection authorities to take appropriate action to improve and maintain water quality. Based on in situ data variation, the nutrient dynamics of the lake indicate phosphorus saturation, leading to periodic algal blooms under favorable conditions. A sharp increase in TP and TN in 2014 triggered blooms, whereas a decline in TN after 2016 created nitrogen-limited conditions. A mid-2024 flushing event temporarily reduced nutrients and turbidity, but phosphorus accumulation poses a long-term risk. The water clarity trends indicate that sediment resuspension and runoff have significant impacts on turbidity. We recommend implementing strict effluent regulations, particularly for point sources, and enforcing seasonal fertilizer application laws to minimize runoff, especially during rainy seasons. Given that most nutrients in lakes originate from agricultural and industrial sources, these measures are crucial for reducing external nutrient inputs and mitigating water quality deterioration. We also developed linear monitoring algorithms for Chla, SDD, and TSI using single spectral bands and spectral ratios. The derived models were based on bands. We compared the in situ data for Chla and SDD with those from the developed models, and they were strongly correlated. We calculated in situ TSI values on the basis of SDD and Chla as described by the Carlson equations [37]. The obtained TSI values were correlated with the satellite spectral reflectance pixel values to ascertain correlated bands and their ratios. The developed TSI (Chla) and TSI (SDD) models yielded good correlations, which led to satellite estimates that were identical to the in situ TSI values obtained by considering Carlson’s equations. Satellite estimates indicate that the lake was primarily mesotrophic, with a few sections exhibiting eutrophic and hypereutrophic tendencies, particularly near the shorelines. This clearly confirms that the TSI can be easily estimated via Landsat 8/9 images, which is cost-effective and timely. It is important to note that the developed algorithms are validated for chlorophyll-a concentrations between 0.40 and 25 µg/L and Secchi disk depths between 0.1 and 4 m. Predictions beyond these ranges should be treated with caution, as uncertainties increase under bloom conditions and other extreme events. While the chlorophyll-a models exhibited MAPE values of 32% and 44%, these errors are consistent with expectations for optically complex inland waters where bloom patchiness drives short-term variability, and the models remain robust for operational monitoring when considered alongside their strong R2 and RMSE values. A similar approach was developed using MODIS imagery [2], which is limited by its coarse spatial resolution, restricting its application to smaller inland water bodies; therefore, the use of a moderate spatial resolution is more suitable. The findings point to several site-specific interventions. First, upgrading and expanding wastewater treatment in Entebbe and Kampala is critical, as untreated effluents remain a dominant nutrient source. Second, protecting and restoring wetlands in Nakivubo and Murchison Bay can recover lost nutrient-buffering capacity [52,54]. Third, scaling up agricultural best management practices such as buffer strips, precision fertilizer application, and erosion control can reduce diffuse nutrient loading [55]. Finally, establishing an integrated monitoring framework that combines Landsat 8/9 and Sentinel-2 imagery with targeted field campaigns can improve early detection of bloom events in Uganda’s coastal waters.
For future studies, we recommend applying artificial intelligence (AI) techniques, including machine learning and deep learning, to integrate multiple satellite datasets for robust monitoring and prediction of water quality [5,43,60]. This is because machine learning models can capture multiple data trends more effectively than linear regression models can, especially in terms of nonlinearity in the data.

Author Contributions

Conceptualization, M.S.B.B.; Methodology, M.K. and M.S.B.B.; Validation, M.K. and M.S.B.B.; Formal analysis, M.K., R.L. and M.S.B.B.; Investigation, M.K. and M.S.B.B.; Resources, M.S.B.B.; Data curation, M.K., R.L., A.G., A.M. and J.P.O.; Writing—original draft, M.K.; Writing—review & editing, R.L., A.G., J.P.O., A.M. and M.S.B.B.; Visualization, M.K. and M.S.B.B.; Supervision, M.S.B.B.; Project administration, M.S.B.B.; Funding acquisition, M.S.B.B. All authors have read and agreed to the published version of the manuscript.

Funding

This research was partially funded by the NASA Florida Space Grant Consortium (FSGC) under the award number Task No. 04, FSGC-8, and FIU University Graduate School through the Dissertation Evidence Acquisition award and Dissertation Year Fellowship.

Institutional Review Board Statement

Not applicable.

Informed Consent Statement

Not applicable.

Data Availability Statement

The original contributions presented in this study are included in the article. Further inquiries can be directed to the corresponding authors.

Conflicts of Interest

The authors declare no conflict of interest.

References

  1. Nyamweya, C.; Lawrence, T.J.; Ajode, M.Z.; Smith, S.; Achieng, A.O.; Barasa, J.E.; Masese, F.O.; Taabu-Munyaho, A.; Mahongo, S.; Kayanda, R. Lake Victoria: Overview of research needs and the way forward. J. Great Lakes Res. 2023, 49, 102211. [Google Scholar] [CrossRef]
  2. Gidudu, A.; Letaru, L.; Kulabako, R.N. Empirical modeling of chlorophyll a from MODIS satellite imagery for trophic status monitoring of Lake Victoria in East Africa. J. Great Lakes Res. 2021, 47, 1209–1218. [Google Scholar] [CrossRef]
  3. Nyamweya, C.; Nyaboke, H.; Aura, C.; Momanyi, K.; Mlaponi, E.; Odoli, C.; Njiru, J. Lake Victoria’s bounty: A case for riparian countries’ blue economic investment. Front. Environ. Sci. 2022, 10, 952654. [Google Scholar] [CrossRef]
  4. Wu, G.; Chen, C.; Liu, Y.; Fan, X.; Niu, H.; Liu, Y. Developing a High-Resolution Seamless Surface Water Extent Time-Series over Lake Victoria by Integrating MODIS and Landsat Data. Remote Sens. 2023, 15, 3500. [Google Scholar] [CrossRef]
  5. Oyege, I.; Katwesigye, R.; Kiwanuka, M.; Mutanda, H.E.; Niyomukiza, J.B.; Kataraihya, D.J.; Kica, S.; Egor, M. Temporal trends of water quality parameters, heavy metals, microplastics, and emerging organic pollutants in Lake Victoria and its basin: Knowns, knowledge gaps, and future directions. Environ. Nanotechnol. Monit. Manag. 2024, 22, 100962. [Google Scholar] [CrossRef]
  6. Kiwanuka, M.; Mutanda, H.E.; Niyomukiza, J.B.; Nakasagga, E. Assessment of suitability of drinking water from the springs in Urban slums of Kampala. Environ. Chall. 2023, 10, 100667. [Google Scholar] [CrossRef]
  7. Nantaba, F.; Wasswa, J.; Kylin, H.; Palm, W.-U.; Bouwman, H.; Kümmerer, K. Occurrence, distribution, and ecotoxicological risk assessment of selected pharmaceutical compounds in water from Lake Victoria, Uganda. Chemosphere 2020, 239, 124642. [Google Scholar] [CrossRef]
  8. Obubu, J.P.; Mengistou, S.; Odong, R.; Fetahi, T.; Alamirew, T. Determination of the connectedness of land use, land cover change to water quality status of a shallow lake: A case of Lake Kyoga Basin, Uganda. Sustainability 2021, 14, 372. [Google Scholar] [CrossRef]
  9. Bugenyi, F.; Magumba, K. The present physicochemical ecology of Lake Victoria, Uganda. In Limnology, Climatology and Paleoclimatology of the East African Lakes; Routledge: London, UK, 2019; pp. 141–154. [Google Scholar]
  10. Mchau, G.J.; Makule, E.; Machunda, R.; Gong, Y.Y.; Kimanya, M. Harmful algal bloom and associated health risks among users of Lake Victoria freshwater: Ukerewe Island, Tanzania. J. Water Health 2019, 17, 826–836. [Google Scholar] [CrossRef]
  11. Nalumenya, B.; Rubinato, M.; Catterson, J.; Kennedy, M.; Bakamwesiga, H.; Wabwire, D. Assessing the Potential Impacts of Contaminants on the Water Quality of Lake Victoria: Two Case Studies in Uganda. Sustainability 2024, 16, 9128. [Google Scholar] [CrossRef]
  12. Zheng, G.; DiGiacomo, P.M. Uncertainties and applications of satellite-derived coastal water quality products. Prog. Oceanogr. 2017, 159, 45–72. [Google Scholar] [CrossRef]
  13. Schaeffer, B.A.; Schaeffer, K.G.; Keith, D.; Lunetta, R.S.; Conmy, R.; Gould, R.W. Barriers to adopting satellite remote sensing for water quality management. Int. J. Remote Sens. 2013, 34, 7534–7544. [Google Scholar] [CrossRef]
  14. Kintu, I.M.; Gidudu, A.; Letaru, L. Assessment of lake Victoria’s trophic status using satellite-derived Secchi disk depth. In Earth Observations and Geospatial Science in Service of Sustainable Development Goals, Proceedings of the 12th International Conference of the African Association of Remote Sensing and the Environment; Springer: Cham, Switzerland; pp. 79–87.
  15. Obubu, J.P.; Yoshihiko, I.; Rodgers, M.; Tatsuyuki, S.; Rebecca Walugembe, N. Application of Gon’s algorithm to monitor productivity using Sentinel-2 Multi-spectral Instrument in Lake Kyoga, Uganda. Phys. Chem. Earth Parts A/B/C 2025, 141, 104070. [Google Scholar] [CrossRef]
  16. Hoepffner, N.; Sathyendranath, S. Effect of pigment composition on absorption properties of phytoplankton. Mar. Ecol. Prog. Ser. 1991, 73, 11–23. [Google Scholar] [CrossRef]
  17. O’Reilly, J.E.; Maritorena, S.; Siegel, D.A.; O’Brien, M.C.; Toole, D.; Mitchell, B.G.; Kahru, M.; Chavez, F.P.; Strutton, P.; Cota, G.F. Ocean color chlorophyll a algorithms for SeaWiFS, OC2, and OC4: Version 4. SeaWiFS Postlaunch Calibration Valid. Anal. 2000, 3, 9–23. [Google Scholar]
  18. Gordon, H.R.; Brown, O.B.; Jacobs, M.M. Computed relationships between the inherent and apparent optical properties of a flat homogeneous ocean. Appl. Opt. 1975, 14, 417–427. [Google Scholar] [CrossRef]
  19. Sagan, V.; Peterson, K.T.; Maimaitijiang, M.; Sidike, P.; Sloan, J.; Greeling, B.A.; Maalouf, S.; Adams, C. Monitoring inland water quality using remote sensing: Potential and limitations of spectral indices, bio-optical simulations, machine learning, and cloud computing. Earth-Sci. Rev. 2020, 205, 103187. [Google Scholar] [CrossRef]
  20. Niroumand-Jadidi, M.; Bovolo, F.; Bruzzone, L. Water quality retrieval from PRISMA hyperspectral images: First experience in a turbid lake and comparison with sentinel-2. Remote Sens. 2020, 12, 3984. [Google Scholar] [CrossRef]
  21. Ruddick, K.G.; Gons, H.J.; Rijkeboer, M.; Tilstone, G. Optical remote sensing of chlorophyll a in case 2 waters by use of an adaptive two-band algorithm with optimal error properties. Appl. Opt. 2001, 40, 3575–3585. [Google Scholar] [CrossRef]
  22. Hajigholizadeh, M.; Moncada, A.; Kent, S.; Melesse, A.M. Land–lake linkage and remote sensing application in water quality monitoring in lake okeechobee, Florida, USA. Land 2021, 10, 147. [Google Scholar] [CrossRef]
  23. Kutser, T.; Arst, H.; Miller, T.; Käärmann, L.; Milius, A. Telespectrometrical estimation of water transparency, chlorophyll-a and total phosphorus concentration of Lake Peipsi. Int. J. Remote Sens. 1995, 16, 3069–3085. [Google Scholar] [CrossRef]
  24. Wang, Y.; Xia, H.; Fu, J.; Sheng, G. Water quality change in reservoirs of Shenzhen, China: Detection using LANDSAT/TM data. Sci. Total Environ. 2004, 328, 195–206. [Google Scholar] [CrossRef]
  25. Wu, C.; Wu, J.; Qi, J.; Zhang, L.; Huang, H.; Lou, L.; Chen, Y. Empirical estimation of total phosphorus concentration in the mainstream of the Qiantang River in China using Landsat TM data. Int. J. Remote Sens. 2010, 31, 2309–2324. [Google Scholar] [CrossRef]
  26. Li, J.; Wang, J.; Wu, Y.; Cui, Y.; Yan, S. Remote sensing monitoring of total nitrogen and total phosphorus concentrations in the water around Chaohu Lake based on geographical division. Front. Environ. Sci. 2022, 10, 1014155. [Google Scholar] [CrossRef]
  27. Xiong, J.; Lin, C.; Cao, Z.; Hu, M.; Xue, K.; Chen, X.; Ma, R. Development of remote sensing algorithm for total phosphorus concentration in eutrophic lakes: Conventional or machine learning? Water Res. 2022, 215, 118213. [Google Scholar] [CrossRef]
  28. Hood, R.R.; Subramaniam, A.; May, L.R.; Carpenter, E.J.; Capone, D.G. Remote estimation of nitrogen fixation by Trichodesmium. Deep Sea Res. Part II Top. Stud. Oceanogr. 2001, 49, 123–147. [Google Scholar] [CrossRef]
  29. Hanson, C.E.; Waite, A.M.; Thompson, P.A.; Pattiaratchi, C.B. Phytoplankton community structure and nitrogen nutrition in Leeuwin Current and coastal waters off the Gascoyne region of Western Australia. Deep Sea Res. Part II Top. Stud. Oceanogr. 2007, 54, 902–924. [Google Scholar] [CrossRef]
  30. Dörnhöfer, K.; Oppelt, N. Remote sensing for lake research and monitoring–Recent advances. Ecol. Indic. 2016, 64, 105–122. [Google Scholar] [CrossRef]
  31. Gitelson, A.A.; Dall’Olmo, G.; Moses, W.; Rundquist, D.C.; Barrow, T.; Fisher, T.R.; Gurlin, D.; Holz, J. A simple semi-analytical model for remote estimation of chlorophyll-a in turbid waters: Validation. Remote Sens. Environ. 2008, 112, 3582–3593. [Google Scholar] [CrossRef]
  32. Kallio, K.; Kutser, T.; Hannonen, T.; Koponen, S.; Pulliainen, J.; Vepsäläinen, J.; Pyhälahti, T. Retrieval of water quality from airborne imaging spectrometry of various lake types in different seasons. Sci. Total Environ. 2001, 268, 59–77. [Google Scholar] [CrossRef]
  33. Lacaux, J.; Tourre, Y.; Vignolles, C.; Ndione, J.; Lafaye, M. Classification of ponds from high-spatial resolution remote sensing: Application to Rift Valley Fever epidemics in Senegal. Remote Sens. Environ. 2007, 106, 66–74. [Google Scholar] [CrossRef]
  34. Shafique, N.A.; Fulk, F.; Autrey, B.C.; Flotemersch, J. Hyperspectral remote sensing of water quality parameters for large rivers in the Ohio River basin. In Proceedings of the First Interagency Conference on Research in the Watershed, Benson, AZ, USA, 27–30 October 2003; pp. 216–221. [Google Scholar]
  35. Devi Prasad, A. Carlson’s trophic state index for the assessment of trophic status of two lakes in Mandya district. Adv. Appl. Sci. Res. 2012, 3, 2992–2996. [Google Scholar]
  36. Rocchini, R.; Swain, L. The British Columbia Water Quality Index; Water Quality Branch, EP Department, Ministry of Environment, Land and Park: Victoria, BC, Canada, 1995; p. 13. [Google Scholar]
  37. Carlson, R.E. A trophic state index for lakes 1. Limnol. Oceanogr. 1977, 22, 361–369. [Google Scholar] [CrossRef]
  38. Okungu, J.; Peterlis, O. Pollution Loads into Lake Victoria from the Kenyan Catchment; Ministry of Environment and Natural Resources: Kisumu, Kenya, 2002.
  39. Aroko, R.; Deus, D.; Ngereja, Z. Comparison of Multiple Linear Regression and Artificial Neural Network Models in retrieving Water Quality Parameters using Remotely Sensed Data: Lake Victoria (Tanzanian) Water. South Afr. J. Geomat. 2025, 14, 167–190. [Google Scholar] [CrossRef]
  40. Gholizadeh, M.; Melesse, A. Study on spatiotemporal variability of water quality parameters in Florida Bay using remote sensing. J. Remote Sens. GIS 2017, 6, 1000207. [Google Scholar] [CrossRef]
  41. Tang, Y.; Feng, Y.; Fung, S.; Xomchuk, V.R.; Jiang, M.; Moore, T.; Beckler, J. Spatiotemporal deep-learning-based algal bloom prediction for Lake Okeechobee using multisource data fusion. IEEE J. Sel. Top. Appl. Earth Obs. Remote Sens. 2022, 15, 8318–8331. [Google Scholar] [CrossRef]
  42. Bhaskar, M.S.; Gidudu, A. Effect of landscape changes on the water quality of Murchison bay. Int. J. Adv. Remote Sens. GIS 2020, 9, 3350–3363. [Google Scholar] [CrossRef]
  43. Kiwanuka, M.; Oyege, I.; Balaji Bhaskar, M.S. Spatial and Temporal Dynamics of Water Quality in Lake Okeechobee Using Remote Sensing and Its Impact on Environmental Health. Remote Sens. 2025, 17, 3197. [Google Scholar] [CrossRef]
  44. Ssebiyonga, N.; Erga, S.R.; Hamre, B.; Stamnes, J.J.; Frette, Ø. Light conditions and photosynthetic efficiency of phytoplankton in Murchison Bay, Lake Victoria, Uganda. Limnologica 2013, 43, 185–193. [Google Scholar] [CrossRef]
  45. Vincent, O.; Gavin Akinyi, M. Spectral Reflectance and Algal Bloom Monitoring of Lake Victoria Using Remote Sensing Techniques, Winum Gulf of Kenya. Earth Sci. 2023, 12, 90–98. [Google Scholar] [CrossRef]
  46. Vincent, R.K.; Qin, X.; McKay, R.M.L.; Miner, J.; Czajkowski, K.; Savino, J.; Bridgeman, T. Phycocyanin detection from LANDSAT TM data for mapping cyanobacterial blooms in Lake Erie. Remote Sens. Environ. 2004, 89, 381–392. [Google Scholar] [CrossRef]
  47. Ali, M.; Ali, T.; Gawai, R.; Dronjak, L.; Elaksher, A. The Analysis of Land Use and Climate Change Impacts on Lake Victoria Basin Using Multi-Source Remote Sensing Data and Google Earth Engine (GEE). Remote Sens. 2024, 16, 4810. [Google Scholar] [CrossRef]
  48. Sani, I.S.; Manurung, P.; Fagge, A.U. NDWI–NDBI Overlay–Based Analysis of Coastal Fence Expansion and Hydrological Changes in Victoria Island, Lagos, Nigeria (2010–2015), with Machine Learning Validation. Remote Sens. Sustain. Ocean. 2024. [Google Scholar] [CrossRef]
  49. Olaka, L.A.; Ogutu, J.O.; Said, M.Y.; Oludhe, C. Projected climatic and hydrologic changes to Lake Victoria Basin Rivers under three RCP emission scenarios for 2015–2100 and impacts on the water sector. Water 2019, 11, 1449. [Google Scholar] [CrossRef]
  50. Vuai, S.; Ibembe, J.; Mungai, N. Spatial Variation of Nutrients in Sondu-Miriu and Simiyu-Duma Rivers: Implication on Sources and Factors Influencing their Transportation into the Lake Victoria. J. Earth Sci. Clim. Change 2012, 3, 1000119. [Google Scholar]
  51. UBOS. The National Population and Housing Census 2024—Final Report—Volume 1 (Main); Uganda Bureau of Statistics: Kampala, Uganda, 2024; p. 434.
  52. Kiggundu, N.; Abugri Anaba, L.; Banadda, N.; Wanyama, J.; Kabenge, I. Assessing land use and land cover changes in the Murchison Bay catchment of Lake Victoria basin in Uganda. J. Sustain. Dev. 2018, 11, 44–55. [Google Scholar] [CrossRef]
  53. Banadda, E.; Kansiime, F.; Kigobe, M.; Kizza, M.; Nhapi, I. Landuse-based nonpoint source pollution: A threat to water quality in Murchison Bay, Uganda. Water Policy 2009, 11, 94–105. [Google Scholar] [CrossRef]
  54. Anaba, L.A.; Banadda, N.; Kiggundu, N.; Wanyama, J.; Engel, B.; Moriasi, D. Application of SWAT to assess the effects of land use change in the Murchison Bay catchment in Uganda. Comput. Water Energy Environ. Eng. 2017, 6, 24–40. [Google Scholar] [CrossRef]
  55. Wasige, J.E.; Groen, T.A.; Smaling, E.; Jetten, V. Monitoring basin-scale land cover changes in Kagera Basin of Lake Victoria using ancillary data and remote sensing. Int. J. Appl. Earth Obs. Geoinf. 2013, 21, 32–42. [Google Scholar] [CrossRef]
  56. Kahru, M.; Kudela, R.M.; Anderson, C.R.; Manzano-Sarabia, M.; Mitchell, B.G. Evaluation of satellite retrievals of ocean chlorophyll-a in the California Current. Remote Sens. 2014, 6, 8524–8540. [Google Scholar] [CrossRef]
  57. Galat, D.L.; Verdin, J.P. Patchiness, collapse and succession of a cyanobacterial bloom evaluated by synoptic sampling and remote sensing. J. Plankton Res. 1989, 11, 925–948. [Google Scholar] [CrossRef]
  58. Kutser, T. Passive optical remote sensing of cyanobacteria and other intense phytoplankton blooms in coastal and inland waters. Int. J. Remote Sens. 2009, 30, 4401–4425. [Google Scholar] [CrossRef]
  59. Matthews, M.W.; Bernard, S.; Robertson, L. An algorithm for detecting trophic status (chlorophyll-a), cyanobacterial-dominance, surface scums and floating vegetation in inland and coastal waters. Remote Sens. Environ. 2012, 124, 637–652. [Google Scholar] [CrossRef]
  60. Cao, Z.; Ma, R.; Liu, M.; Duan, H.; Xiao, Q.; Xue, K.; Shen, M. Harmonized chlorophyll-a retrievals in inland lakes from Landsat-8/9 and Sentinel 2A/B virtual constellation through machine learning. IEEE Trans. Geosci. Remote Sens. 2022, 60, 4209916. [Google Scholar] [CrossRef]
  61. Olmanson, L.G.; Bauer, M.E.; Brezonik, P.L. A 20-year Landsat water clarity census of Minnesota’s 10,000 lakes. Remote Sens. Environ. 2008, 112, 4086–4097. [Google Scholar] [CrossRef]
  62. Kloiber, S.M.; Brezonik, P.L.; Olmanson, L.G.; Bauer, M.E. A procedure for regional lake water clarity assessment using Landsat multispectral data. Remote Sens. Environ. 2002, 82, 38–47. [Google Scholar] [CrossRef]
  63. Tan, W.; Liu, P.; Liu, Y.; Yang, S.; Feng, S. A 30-year assessment of phytoplankton blooms in Erhai Lake using Landsat imagery: 1987 to 2016. Remote Sens. 2017, 9, 1265. [Google Scholar] [CrossRef]
  64. Darryl, K.; Jennifer, R.; Jason, G.; Brian, Z.; Mike, C.; Glen, T.; Joseph Bishop, a. Monitoring algal blooms in drinking water reservoirs using the Landsat-8 Operational Land Imager. Int. J. Remote Sens. 2018, 39, 2818–2846. [Google Scholar] [CrossRef] [PubMed]
  65. Zhang, S.; Wang, L.; Wang, Y.; Zhang, X.; Zhu, Y.; Ma, G. Monitoring of low Chla concentration in Hulun Lake based on fusion of remote sensing satellite and ground observation data. Remote Sens. 2024, 16, 1811. [Google Scholar] [CrossRef]
  66. Nawaz, T.; Joshi, N.; Nelson, D.; Saud, S.; Abdelsalam, N.R.; Abdelhamid, M.M.; Jaremko, M.; Rahman, T.U.; Fahad, S. Harnessing the potential of nitrogen-fixing cyanobacteria: A rich bio-resource for sustainable soil fertility and enhanced crop productivity. Environ. Technol. Innov. 2024, 36, 103886. [Google Scholar] [CrossRef]
  67. Talling, J. The depletion of carbon dioxide from lake water by phytoplankton. J. Ecol. 1976, 64, 79–121. [Google Scholar] [CrossRef]
  68. Deirmendjian, L.; Descy, J.P.; Morana, C.; Okello, W.; Stoyneva-Gärtner, M.P.; Bouillon, S.; Borges, A.V. Limnological changes in Lake Victoria since the mid-20th century. Freshw. Biol. 2021, 66, 1630–1647. [Google Scholar] [CrossRef]
  69. Pahlevan, N.; Smith, B.; Alikas, K.; Anstee, J.; Barbosa, C.; Binding, C.; Bresciani, M.; Cremella, B.; Giardino, C.; Gurlin, D. Simultaneous retrieval of selected optical water quality indicators from Landsat-8, Sentinel-2, and Sentinel-3. Remote Sens. Environ. 2022, 270, 112860. [Google Scholar] [CrossRef]
  70. Giardino, C.; Pepe, M.; Brivio, P.A.; Ghezzi, P.; Zilioli, E. Detecting chlorophyll, Secchi disk depth and surface temperature in a sub-alpine lake using Landsat imagery. Sci. Total Environ. 2001, 268, 19–29. [Google Scholar] [CrossRef] [PubMed]
  71. Gidudu, A.; Banura, C.; Namugga, A. Monitoring water quality on Lake Victoria using MODIS imagery. Int. J. Technoscience Dev. 2016, 3, 1–47. [Google Scholar]
  72. Duan, H.; Zhang, Y.; Zhang, B.; Song, K.; Wang, Z.; Liu, D.; Li, F. Estimation of chlorophyll-a concentration and trophic states for inland lakes in Northeast China from Landsat TM data and field spectral measurements. Int. J. Remote Sens. 2008, 29, 767–786. [Google Scholar] [CrossRef]
  73. Kiwanuka, M.; Balaji, B.M.S.; Leslie, R. Developing Satellite Remote Sensing Models for Water Quality Monitoring on Lake Victoria Region of Uganda. AGU Fall Meet. Abstr. 2024, 2024, H11K-0826. [Google Scholar]
  74. Nakkazi, M.T.; Nkwasa, A.; Martínez, A.B.; van Griensven, A. Linking land use and precipitation changes to water quality changes in Lake Victoria using earth observation data. Environ. Monit. Assess. 2024, 196, 1104. [Google Scholar] [CrossRef]
  75. Moradi, M.; Zoljoodi, M. Validation of standard ocean-color chlorophyll-a products in turbid coastal waters: A case study on statistical evaluation and quality control tests in the Persian Gulf. J. Mar. Syst. 2023, 240, 103875. [Google Scholar] [CrossRef]
  76. Li, L.; Sun, B.; Xue, C.; Zheng, Z.; Ma, Y. An Enhanced Transfer Learning Remote Sensing Inversion of Coastal Water Quality: A Case Study of Dissolved Oxygen. IEEE J. Sel. Top. Appl. Earth Obs. Remote Sens. 2025, 18, 21065–21076. [Google Scholar] [CrossRef]
  77. Dube, T.; Mutanga, O.; Seutloali, K.; Adelabu, S.; Shoko, C. Water quality monitoring in sub-Saharan African lakes: A review of remote sensing applications. Afr. J. Aquat. Sci. 2015, 40, 1–7. [Google Scholar] [CrossRef]
Figure 1. Lake Victoria, along with the sampling locations (Ugandan coastal area).
Sustainability 17 09056 g001
Figure 2. Temporal changes in the concentrations of chlorophyll a (Chla), total phosphorus (TP), and total nitrogen (TN) from 2014 to 2024 via mean in situ data from all the sampled stations in Lake Victoria.
Sustainability 17 09056 g002
Figure 3. Temporal changes in the Secchi disk depth and turbidity from 2014 to 2024 using mean in situ data from all the sampled stations in Lake Victoria.
Sustainability 17 09056 g003
Figure 4. Landsat 8 mapped images for chlorophyll-a and Secchi disk depth were obtained on 15 March 2015. (1,3) Single-band model, (2,4) spectral ratio model. The shaded regions indicate the validated calibration ranges (0.40–25 µg/L for Chla and 0.1–4 m for SDD), beyond which model predictions are flagged as uncertain due to increased error potential.
Sustainability 17 09056 g004
Figure 5. Landsat 8 mapped images TSI (Chla) and TSI (SDD) were obtained on 15 March 2015. (1,3) Single-band model, (2,4) spectral ratio model. The shaded regions indicate the validated calibration ranges (30–75) for TSI(Chla) and (28–70) for TSI (SDD), beyond which model predictions are flagged as uncertain due to increased error potential.
Sustainability 17 09056 g005
Figure 6. Comparison of the actual vs. predicted values of the chlorophyll-a (A,B) and Secchi disk depth (C,D) of Lake Victoria via the dark object subtracted (DOS) single band (A,C) and spectral ratio models (B,D). (N_Train = 45, N_Test = 20) for Chla data and (N_Train = 39, N_Test = 14) for SDD.
Sustainability 17 09056 g006
Figure 7. Variation in Chla in situ with estimated image Chla (spectral single and ratio models).
Sustainability 17 09056 g007
Figure 8. Variation in the SDD in situ with the estimated image SDD (spectral single and ratio models).
Sustainability 17 09056 g008
Figure 9. Comparison of the actual vs. predicted values of the TSI based on the chlorophyll-a (A,B) and Secchi disk depth (C,D) of Lake Victoria via the dark object subtracted (DOS) single band (A,C) and spectral ratio models (B,D). (N_Train = 45, N_Test = 20) for TSI(Chla) and (N_Train = 39, N_Test = 14) TSI(SDD).
Sustainability 17 09056 g009
Table 1. Statistical Summary for In situ Water Quality data.
ParametersMeanStd DevMinMaxRangeSample SizeMissing
Data
Chla 7.5911.200.09125.40125.3123925
TN414.42609.560.184283.194283.01124140
TP26.6926.200.02100.73100.71104160
SDD2.590.890.804.603.8020658
Turb1.521.72010.5010.5083181
Table 2. Landsat 8/9 spectral bands.
BandsWavelength
(Micrometers)
Band 1—Aerosols0.43–0.45
Band 2—Blue0.45–0.51
Band 3—Green0.53–0.59
Band 4—Red0.64–0.67
Band 5—Near-Infrared (NIR)0.85–0.88
Band 6—Shortwave Infrared (SWIR) 11.57–1.65
Band 7—Shortwave Infrared (SWIR) 22.11–2.29
Table 3. Pearson’s correlation for in situ parameters.
ParametersChla (µg/L)TN (µg/L)TP (µg/L)SDD (m)Turb (NTU)
Chla (µg/L)1.000.500.24−0.390.27
TN (µg/L)0.501.000.33−0.320.56
TP (µg/L)0.240.331.000.33−0.23
SDD (m)−0.39−0.320.331.000.25
Turb (NTU)0.270.56−0.230.251.00
Table 4. Other Evaluation Metrics.
MetricChla (Single)
µg/L
Chla (Ratio) µg/LTSI_Chla (Single)TSI_Chla (Ratio)SDD
(Single)
(m)
SDD
(Ratio)
(m)
TSI_SDD
(Single)
TSI_SDD (Ratio)
RMSE1.502.813.264.700.420.272.892.02
MAE0.991.721.591.850.340.212.281.54
MAPE (%)32.0944.426.208.8213.5311.384.523.04
Table 5. Diagnostic Test Results.
ModelSignificant Predictors
(p < 0.05)
VIF RangeNotes
SDD (R42,R43,R61,R62)R42, R43, R61, R621.66–3.00All predictors are significant, and acceptable VIFs
Chla (R21,R52,R43,R54)R21, R52 (R43 and R54 borderline)3.86–12.83R43 and R54 borderline, collinearity observed (VIF > 10)
TSI(Chla) (R52,R54,R61)R52, R54, R611.09–2.38All predictors are significant, low VIFs
TSI(SDD) (R42,R43,R71,R72)R42, R43, R71, R721.49–5.06All predictors are significant, and acceptable VIFs
TSI(Chla) (B1,B2,B4,B7)B1, B2, B4, B73.91–30.62All predictors significant, but DOSB2–B7 show high collinearity
TSI(SDD) (B1,B2,B3,B5)B1, B2, B3, B58.74–40.49Significant, high collinearity across predictors
Chla (B1, B2, B4, B6)B1, B2, B4, B65.80–40All predictors significant; however, high VIF values (>30 for B4, B6). Residuals suggest mild heteroscedasticity.
SDD (B1,B2,B3)B1, B2, B315.45–50.6High collinearity, interpret cautiously
Disclaimer/Publisher’s Note: The statements, opinions and data contained in all publications are solely those of the individual author(s) and contributor(s) and not of MDPI and/or the editor(s). MDPI and/or the editor(s) disclaim responsibility for any injury to people or property resulting from any ideas, methods, instructions or products referred to in the content.