Article

Low-Carbon Economic Dispatch of Integrated Energy Systems for Electricity, Gas, and Heat Based on Deep Reinforcement Learning

1
School of Automation Electrical Engineering, Lanzhou Jiaotong University, Lanzhou 730070, China
2
Research Institute of Photothermal Energy Storage, Lanzhou Jiaotong University, Lanzhou 730070, China
*
Author to whom correspondence should be addressed.
Sustainability 2025, 17(20), 9040; https://doi.org/10.3390/su17209040 (registering DOI)
Submission received: 16 September 2025 / Revised: 10 October 2025 / Accepted: 11 October 2025 / Published: 13 October 2025

Abstract

Under the background of “dual-carbon”, the development of energy internet is an inevitable trend for China’s low-carbon energy transition. This paper proposes a hydrogen-coupled electrothermal integrated energy system (HCEH-IES) operation mode and optimizes the source-side structure of the system from the level of carbon trading policy combined with low-carbon technology, taps the carbon reduction potential, and improves the renewable energy consumption rate and system decarbonization level; in addition, for the operation optimization problem of this electric–gas–heat integrated energy system, a flexible energy system based on electric–gas–heat is proposed. Furthermore, to address the operation optimization problem of the HCEH-IES, a deep reinforcement learning method based on Soft Actor–Critic (SAC) is proposed. This method can adaptively learn control strategies through interactions between the intelligent agent and the energy system, enabling continuous action control of the multi-energy flow system while solving the uncertainties associated with source-load fluctuations from wind power, photovoltaics, and multi-energy loads. Finally, historical data are used to train the intelligent body and compare the scheduling strategies obtained by SAC and DDPG algorithms. The results show that the SAC-based algorithm has better economics, is close to the CPLEX day-ahead optimal scheduling method, and is more suitable for solving the dynamic optimal scheduling problem of integrated energy systems in real scenarios.

1. Introduction

With the depletion of traditional fossil fuels and the advancement of renewable energy technologies, countries worldwide are actively reshaping their energy mix to diminish their reliance on conventional fossil-based energy sources. The development of integrated energy systems (IES), enhancing energy efficiency, and boosting the capacity to integrate intermittent renewable sources via heterogeneous energy networks, represents pivotal pathways towards achieving a low-carbon, sustainable energy future [1,2].
Certain power grids in China’s “Three North” regions feature a high penetration of distributed renewable energy and are coupled with intricate gas and heat networks, forming a typical multi-energy flow integrated energy system. Power-to-gas (P2G) technology converts surplus wind power or off-peak electricity into hydrogen, which can be further synthesized into methane. This enables a two-way interaction between the power grid and the gas grid, offering a novel pathway for renewable energy integration [3]. Ref. [4] proposed a two-stage joint operation strategy involving P2G and Hydrogen fuel cells (HFCs) to promote wind power utilization while reducing energy losses and carbon emissions. Ref. [5] introduced P2G and carbon capture technologies, proposing an optimized scheduling strategy for an IES with carbon capture-electricity-to-gas coupling, which enhanced the renewable energy absorption rate. Addressing photovoltaic (PV) uncertainty, Ref. [6] demonstrated that the joint operation of hydrogen fuel cells and cogeneration units improves the rationality of PV consumption and equipment output. Ref. [7] utilized the thermal energy storage characteristics of heating pipelines to improve the operational flexibility of combined heat and power (CHP) systems and constructed a flexibility evaluation method for generalized thermal energy storage models to quantitatively analyze the flexibility of district heating networks.
The primary problem facing the integrated energy system is the coordinated optimization and scheduling of multi-energy flows. Ref. [8] established a comprehensive optimization model, which was solved by the non-dominated ranking genetic algorithm (NSGA-II) with the goals of operating cost, carbon emissions, and energy efficiency utilization, and the Pareto optimal frontier solution set was output. Ref. [9] established a steady-state energy flow and carbon flow calculation model for the integrated electricity–gas–hydrogen energy system and performed iterative calculations using the Newtonian method. Ref. [10] applied the fully distributed internal point conjugate gradient method to the problem of correcting equations in the distributed optimal scheduling of integrated electrical energy systems. Ref. [11] studied the scheduling strategy of the integrated electrical–gas–thermal energy system at multiple time scales and constructed a data-driven optimization model for the split-brud rod. Ref. [12] used an improved multi-objective optimization algorithm to enhance the operational economy and energy efficiency and to reduce the carbon emission level of the integrated electric–heat–hydrogen–cooling energy system. Ref. [13] addressed the uncertainty and correlation between wind power and electricity/gas loads by calculating the probabilistic optimal power flow model of the electric-gas interconnection system using the three-point estimation method of Nataf transformation. Ref. [14] considered the influence of wind and solar uncertainty and constructed a stochastic scheduling model for integrated energy virtual power plants. This model couples “coal-fired” power generation with electricity–carbon–hydrogen–chemical coupling, aiming to maximize benefits.
In the establishment of the optimal scheduling model, the stochastic programming method shows obvious advantages in reducing the operating cost of the system compared with the deterministic method. Ref. [15] considered adding hydrogen vehicle emission reductions to carbon trading and used the Monte Carlo algorithm to generate scenarios for wind and solar output uncertainty. Stochastic programming uses random sampling, chance constraint generation, and other methods to convert uncertainty problems into deterministic models and calculate the operating status of the system through multiple scenarios. However, the large number of scenarios increases both the computational burden and solving difficulty. Therefore, it is necessary to balance calculation accuracy with computational load. Robust optimization is mainly aimed at optimizing the operation of the system in extreme scenarios. Ref. [16] used stochastic optimization and robust optimization to deal with the uncertainty of load-side power generation measurement. It also added a coordination strategy to the second-stage optimization objectives, bringing the real-time optimization results closer to the global optimization value. However, the former faces a bottleneck in computational efficiency due to its heavy reliance on scenario generation, while the latter suffers from model complexity and a difficult trade-off between economic efficiency and conservatism. More importantly, these traditional methods belong to “static” optimization—once the model or parameters are determined, they struggle to adaptively learn new uncertainty patterns online, demonstrating limited capability in coping with continuously dynamic real-world environments.
In recent years, artificial intelligence technology has flourished, with reinforcement learning (RL) as a model-free approach. It does not need to understand environmental changes in advance, has strong adaptability to many uncertainties and interferences, makes optimal decisions through continuous learning and interaction, and has good generalization ability, so it is more and more important in the optimal control of the power system. Ref. [17] used a deep Q-network (DQN) to adaptively respond to random fluctuations in power generation and demand, solving the energy management problem. Ref. [18] used the Nash equilibrium Q-learning algorithm to enable the coordinated scheduling of integrated energy microgrids. Ref. [19] used the double deep expected Q-network (DDEQN) algorithm to efficiently solve the real-time stochastic economic scheduling problem of microgrids. However, the above reinforcement learning methods often discretize actions, which not only reduces the accuracy of optimization decisions but also increases the number of discrete actions exponentially due to the increase in action dimensions, causing “dimensional disasters” that are difficult to solve. At present, some studies have begun to explore continuous control deep reinforcement learning models. Ref. [20] used the deep deterministic policy gradient (DDPG) algorithm to enable dynamic regulation of the integrated electrical–heat–gas energy system. Ref. [21] used the DDPG algorithm to solve the continuous control problem in the coordinated and optimized operation of active distribution networks. However, existing studies still exhibit two main limitations: Firstly, at the algorithmic level, the DDPG algorithm itself suffers from issues such as hypersensitivity to hyperparameters, limited exploration efficiency, and Q-value overestimation, which may lead to training instability and suboptimal policy performance; secondly, at the system modeling level, most existing works focus on traditional electricity–heat–gas-coupled systems, failing to deeply integrate hydrogen energy as a key low-carbon carrier with carbon capture, utilization, and trading mechanisms, thereby restricting the system’s deep decarbonization and operational flexibility under the “dual-carbon” goals.
Based on the Soft Actor–Critic (SAC) framework, this paper constructs a deep reinforcement learning method for the operation of the hydrogen-coupled electrothermal integrated energy system (HCEH-IES). This method enables the algorithm to adaptively learn the characteristics of uncertain variations in wind power, photovoltaics, and various loads, thereby realizing optimal system scheduling under multiple scenarios.
(1) An HCEH-IES model is constructed, with the optimization objective being the minimization of the sum of the system’s comprehensive operating costs, carbon capture and utilization costs, and carbon trading costs.
(2) The optimal scheduling of the integrated energy system is formulated as a Markov Decision Process (MDP), and the system’s state space, action space, and reward function are defined.
(3) The SAC algorithm is utilized to optimize the dynamic energy scheduling of the system. The feasibility and effectiveness of the proposed optimal scheduling strategy and model are verified by comparing results obtained using different optimization algorithms and scenarios.

2. Hydrogen-Coupled Electro-Thermal Integrated Energy System Architecture

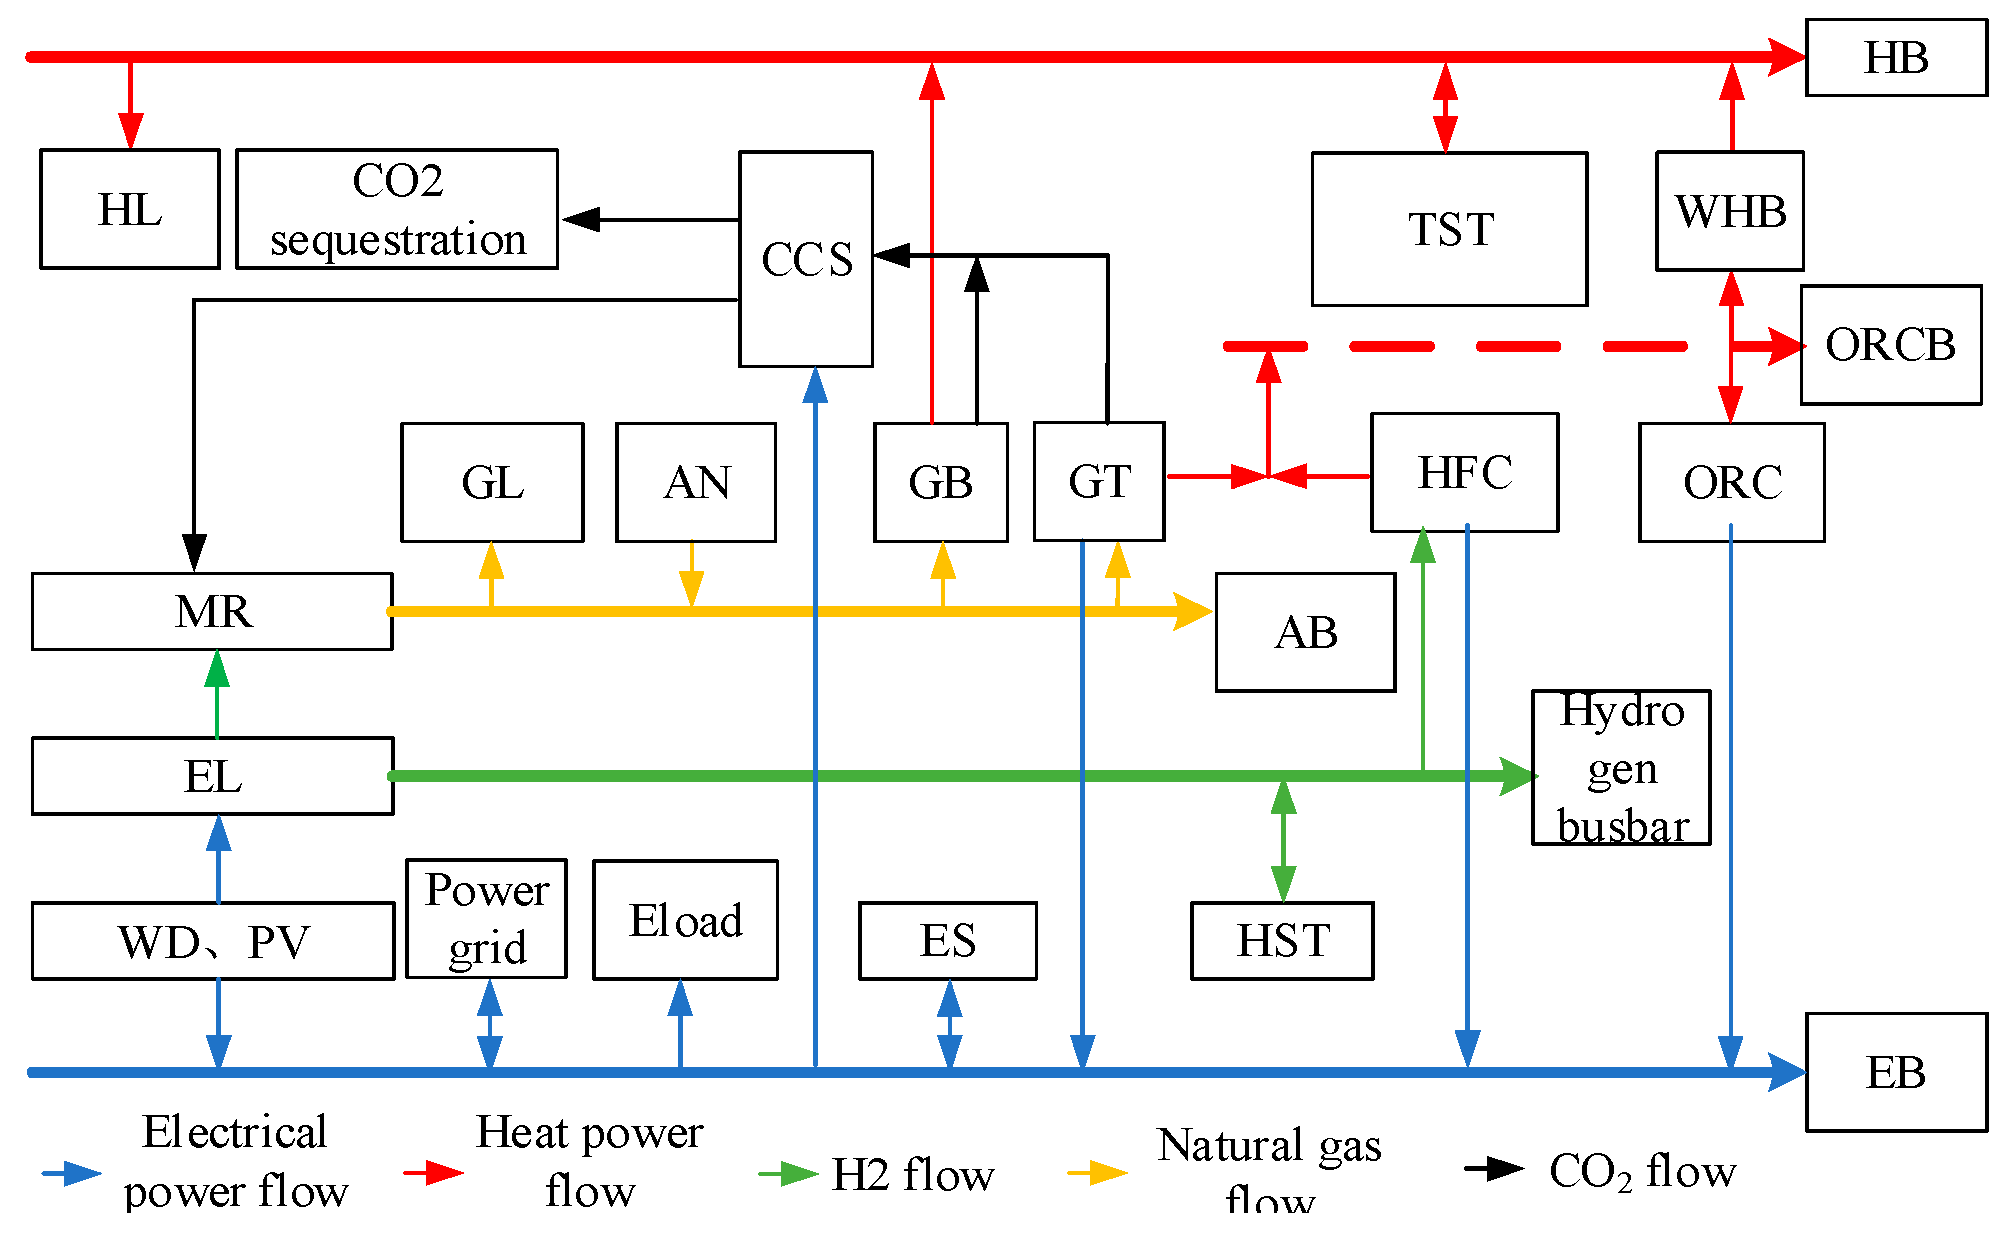
The system structure is shown in Figure 1 and is mainly composed of energy supply, energy conversion, energy storage, and load. The supply side mainly includes the upper gas grid, wind turbine photovoltaic, and upper gas network. The conversion side is mainly composed of an electrolyzer (EL), methane reactor (MR), gas turbine (GT), gas boiler (GB), hydrogen fuel cell (HFC), waste heat power generation device based on organic Rankine cycle (ORC), and waste heat boiler (waste heat boiler, WHB); the energy storage end is mainly the electricity storage (ES), thermal storage tank (TST), and hydrogen storage tank (HST). On the energy load side, users are aggregated and uniformly characterized as electrical loads, gas loads, and heat loads.
Flow of energy and matter. We explicitly describe the core flows: electrical flow: from PV/WT/Grid, through converters (P2G, EL), to electrical loads and storage (ES). Gas flow: from the superior gas grid and the methane reactor (MR), through gas turbines (GT) and gas boilers (GB), to gas loads. Hydrogen flow: from electrolyzers (AWE, PEM) to storage (HST) and then to hydrogen fuel cells (HFC) or the methane reactor (MR). Heat flow: from cogeneration units (GT, HFC, GB), waste heat recovery (WHB, ORC), to heat loads and storage (TST). CO2 flow: from the gas turbine’s flue gas to the carbon capture system (CCS) and then to the methane reactor for utilization or to storage.

3. Modeling of Hydrogen-Coupled Electric–Thermal Integrated Energy Systems

3.1. Coupled Modeling of a Two-Stage Power-to-Gas and Carbon Capture (P2G-CCS) System

(1)
Post-combustion carbon capture
In this paper, the installation of CCS in gas units for low-carbon flexible transformation is considered, and the mathematical model of carbon capture equipment is as follows:
P t C C S = P t R + P T G P t R = δ ccs M t C C S M t C C S = κ η ccs M G C O 2 ( G t G T + G t G B )
This model captures the energy cost of carbon capture, which is crucial for economic dispatch. The variable P t C C S represents the operational energy consumed per unit of CO2 captured, making carbon capture a dispatchable resource with an associated cost. The captured M t C C S becomes a feedstock for the P2G process, linking the carbon and gas networks.
P t R is the operating energy consumption power at time t; P T G is to fix carbon capture energy consumption; δ ccs is the energy consumption per unit of carbon capture; κ is the flue gas split ratio; η ccs is the carbon capture efficiency; M G C O 2 is the CO2 molar mass; G t G T and G t G B consume natural gas at t times, respectively.
(2)
Two-stage P2G
P2G is a mathematical model for energy conversion efficiency. These equations model the core energy conversion process of P2G.
H t A W E = η A W E q e h P t A W E h r z H t P E M = η P E M q e h P t P E M h r z G t M R = η M R h r z H t M R g r z
These equations model the core energy conversion process of P2G. η M R : electrolyzer and methane reactor efficiencies. These are core parameters determining the economic viability of the electro-hydrogen–gas conversion pathway. H t M R , G t M R : hydrogen production rate and gas production rate. These decision variables serve as key control mechanisms for integrating renewable energy and producing green gas.
H t A W E and H t P E M are the hydrogen production volume of the AWE and PEM electrolyzers at t moment; P t A W E and P t P E M are the electrical power consumed by the AWE and PEM electrolyzers at the t moment; η A W E and η P E M are the energy conversion efficiency for ALK and PEM electrolyzers; q e h is the heat energy that can be converted by a unit of electrical energy; h r z is the calorific value of hydrogen per unit volume; g r z is the calorific value per unit volume of natural gas.
Finally, methane reactors need to consume carbon dioxide in the process of synthesizing methane. Considering that the amount of CO2 supplied by CCS may not be fully utilized, the excess is stored. At the same time, the amount of CO2 consumed by the H2G process at some point may not be fully supplied, so CO2 needs to be purchased. The CO2 required for H2G is
M t M R = q e h ρ C O 2 1000 g r z G t M R M t C C S = M t H 2 G + M t C S M t M R = M t buy + M t C C S
where M t M R is the amount of CO2 required for the H2G process at t moment; M t C S is the amount of CO2 stored at the time t; g r z is the calorific value of natural gas per unit volume; ρ C O 2 is the density of CO2; M t buy and M t C C S are the amount of CO2 purchased by the H2G process and the amount of CO2 provided by CCS, respectively.

3.2. Cogeneration System Modeling

(1)
SOFC-GT cogeneration
The system mathematical model is as follows:
S t G T = P t G T + Q t G T P t G T = η G T , e G t G T Q t G T = η G T , h G t G T S t H F C = P t H F C + Q t H F C P t H F C = η H F C , e H t H F C Q t H F C = η H F C , h H t H F C Q t G B = η G B G t G B
where S t G T is the total output of the gas turbine at the time of t; P t G T is the power supply to gas turbines at t time; Q t G T is the heating power for gas turbines at t time; η G T , e and η G T , h are the power and heating efficiency for gas turbines; P t H F C is the power supply to hydrogen fuel cells; Q t H F C is the power for heating hydrogen fuel cells; S t H F C is the total output of hydrogen fuel cells; η H F C , e and η H F C , h are the electrical and thermal efficiency of hydrogen fuel cells; H t H F C is the hydrogen power consumed by the hydrogen fuel cell t at the moment; Q t G B is the heat generation power for the boiler at t moment; η G B is the heat conversion efficiency of gas boilers; G t G B is the natural gas power consumed by the gas boiler at the t moment.
(2)
Waste heat utilization
The heat energy of waste heat is supplied to the heat load through the waste heat boiler, and the excess part is generated through the ORC waste heat power generation device. The mathematical model of the waste heat utilization system is as follows:
Q t s u m = Q t H F C + Q t G T 0 φ t O R C , φ t W H B 1 φ t O R C + φ t W H B = 1 P t O R C = η O R C φ t O R C Q t s u m Q t W H B = η W H B φ t W H B Q t s u m
where Q t s u m is the heat energy collected by the waste heat bus of the system at time t; φ t O R C , φ t W H B are the proportion of waste heat utilized by the ORC waste heat power generation device and waste heat boiler input at t moment, respectively. P t O R C is the power generation of the ORC waste heat power generation device at t moment; η O R C the power generation efficiency of the ORC waste heat power generation device; Q t W H B is the heat output of the waste heat boiler at the time of t; η W H B is the efficiency of the waste heat boiler.

3.3. Carbon Trading Model

In this paper, the carbon quota is allocated free of charge, and the total carbon quota of the system is composed of the carbon quota of the power purchase unit, the carbon quota of the gas purchase unit, and the incentive quota of the green power unit:
M t q u o t a = M t g r i d + M t g a s + M t D G M t g r i d = t = 1 T θ e P t g r i d M t g a s = t = 1 T θ g χ P t G T + Q t G T + Q t G B M t D G = t = 1 T θ r ( P t P V + P t W D )
where M t q u o t a is the total carbon emission quota; M t g r i d , M t g a s , and M t D G , respectively, are the carbon emission quotas for purchasing electricity from the power grid, purchasing gas from the higher-level gas grid, and the carbon quotas for green power incentives; θ e , θ g , and θ r are the carbon emission quota per unit of electricity and thermal power and the carbon quota of green power unit incentives, respectively. P t g r i d is the thermoelectric power conversion coefficient; P t P V and P t W D , respectively, represent the power generation of photovoltaics and wind turbines at time t.
Actual system carbon emissions consist of carbon emissions from equipment that interacts with the higher grid, purchases natural gas, and is a primary energy source.
M t Z = M t I N + M t E + M t G M t I N = M t G T + M t G B M t C S M t M R M t E = ε E t = 1 k P t g r i d M t G = ε G t = 1 k G t L o a d
where M t I N is the carbon emissions generated within the system at time t; M t E is carbon emissions generated by interaction with the superior power grid at the time of t; M t G is the carbon emission of the gas load; G t Load is the natural gas load at the time of t; ε G is the carbon emission coefficient per unit of electricity in the regional power grid where the system is located; G t b u y is the carbon emission coefficient of natural gas.
The net carbon emissions of the system are the difference between actual carbon emissions and carbon allowances and can be expressed as follows:
M t n e t = M t Z M t q u o t a
This carbon trading mechanism internalizes the cost of emissions into the economic objective. The actual emissions M t Z are calculated from interactions with the grid and gas consumption. The net emissions M t n e t directly translate into a cost (if positive) or revenue (if negative) through the carbon price k C O 2 b u y , creating a financial incentive for low-carbon operation.

4. Dynamic Optimization Scheduling Based on Deep Reinforcement Learning

The above hydrogen-coupled electrothermal integrated energy system model is transformed into a deep reinforcement learning model. This paper uses a deep reinforcement learning algorithm to solve the optimization decision-making problem with uncertainty factors, focusing on the dynamic optimization scheduling under the intermittent and random fluctuation of the user-side load of renewable energy generation in the integrated energy system.

4.1. Flexible Movement Evaluation Deep Reinforcement Learning

In the research field of integrated energy system optimization and regulation, this paper introduces the SAC algorithm to construct the regulation model of HCEH-IES and adopts the rolling optimization strategy to formulate the dynamic operation regulation scheme.
SAC is an offline learning algorithm, and its core innovation is to integrate the principle of maximum entropy into the strategy learning framework. The intelligences are motivated to not only maximize the long-term cumulative rewards but also to maintain the diversity of action choices during the learning process. The actual environment is often dynamically changing and full of uncertainty, and traditional algorithms may perform poorly when the environment changes because of over-reliance on specific optimal actions. The SAC algorithm, on the other hand, can better cope with these changes due to the diversity of its actions and can quickly adjust its strategy to maintain a better performance even when the environmental conditions change unexpectedly.
The discounted cumulative reward function J and the objective function π * for SAC at any time slot t are
J = t = 0 T E ( s t , a t ) ~ ρ π [ r s t , a t + α H π ϕ s t ]
π * = arg max π φ t = 0 T E ( s t , a t ) ~ ρ π [ r s t , a t + α H π φ s t ]
where π is the agent action strategy, which is essentially the probability distribution of the agent’s action choice; s t and a t are r s t , a t , the current environmental state of the agent, the action output by the policy, and the reward value of the environment feedback to the agent, respectively; ( s t , a t ) ~ ρ π is the temperature coefficient of action entropy, where H π ϕ s t is used to characterize the influence of action entropy on reward; ϕ is for the strategy action trajectory; it is the action entropy of the policy in the state, which is the network parameter representing the policy.
Action entropy is used to characterize the uncertainty of the policy π with respect to action selection. SAC maximizes the action entropy by introducing action entropy so that the actions output by its policy π during iterative training are as dispersed as possible, which allows the intelligent to consider more choice behaviors without omitting any potentially useful action choices. The action entropy is defined as
H π ϕ s t = E ( s t , a t ) ~ ρ π [ ln π ϕ π ϕ a t s t ]
As an Actor–Critic algorithm, the Actor network of SAC is responsible for modeling the action policy π ϕ , and the Critic network evaluates the policy obtained by the Actor network using the value function Q ψ a t s t . The Q-value function and the state-value function of SAC are defined as follows, respectively:
Q ψ a t s t = γ E ( s t , a t ) ~ ρ π [ V s t + 1 ] + r s t , a t Γ π Q ψ a t s t
V s t + 1 = E ( s t , a t ) ~ ρ π [ Q ψ a t s t α ln π ϕ ( a t s t )
where γ is the reward discount factor; E ( s t , a t ) ~ ρ π [ V s t + 1 ] represents the sum of the expectations of all states ρ π under trajectory s t + 1 ; Γ π is the Bellman operator of strategy π .
SAC performs gradient backward updating of the parameters ϕ and ψ of the Actor and Critic networks, respectively, to obtain the optimal operation policy and Q-value function.
J Q ψ = E ( s t , a t ) ~ D [ 1 2 Q ψ s t , a t ( ( r t ( s t , a t ) + γ E s t + 1 ~ ρ [ V ψ ¯ ( s t + 1 ) ] ) ) 2 ]
J π ψ = E s t ~ D D K L [ π ϕ ( s t ) ] exp ( 1 α ) ( s t ) Z ψ ( s t )
where V ψ ¯ ( s t + 1 ) , the new state value function, is updated for the Critic network; Z ψ ( s t ) is an allocation function for normalization; D is the updated sample set; D K L | | represents the Kullback–Leibler (KL) divergence calculation to characterize the distance between two distributions.

4.2. State Space

The observed state of the system includes the electricity/gas/heat load demand, PV/wind turbine power, external energy price, and the charge state of the energy storage equipment at the moment t − 1. For the low-carbon economic dispatch of the integrated energy system, the state can be expressed as follows:
s t = P t L o a d , G t L o a d , Q t L o a d , P t P V , P t W D , k t E , k t G , S O C t 1 E S , S O C t 1 T S T , S O C t 1 H S T

4.3. Action Space

The goal of low-carbon economic dispatch for integrated energy systems is to determine the optimal unit output profile. The actions in the low-carbon economic dispatch of the integrated energy system can be expressed as follows:
a t = P t E S , S t G T , S t H F C , P t E S , P t T S T , P t H S T
where P t E S , P t T S T , and P t H S T are the outputs of electric energy storage, heat storage tank, and hydrogen storage tank t at the moment.
The SAC action space constraints are
S O C t E S = ( 1 μ E S ) S O C t 1 E S + ( P t E S , c h η E S , c h P t E S , d i s / η E S , d i s ) / E E S S O C E S , min S O C t E S S O C E S , max 0 P t E S , c h f t E S , c h P E S , max 0 P t E S , d i s f t E S , d i s P E S , max f t E S , c h + f t E S , d i s = 1 P t E S = f t E S , c h P t E S , c h + f t E S , d i s P t E S , d i s
where S O C t E S is the state of charge of the power storage equipment at time t; μ E S is the electrical loss coefficient of the power storage equipment; P t E S , c h and P t E S , d i s are the charging and discharging power of the storage equipment, respectively; η E S , c h and η E S , d i s charge and discharge efficiency, respectively; E E S is the capacity of the power storage equipment; S O C E S , max and S O C E S , min are the upper and lower limits of the charging state of the power storage equipment, respectively; P E S , max the maximum charging and discharging power of the power storage equipment; f t E S , c h and f t E S , d i s are the charging and discharging state of the device at the time of t; P t E S is the net output of electric energy storage in the t period.

4.4. Reward Functions

Intelligent bodies maximize their cumulative returns through continuous learning during the scheduling cycle, and the setting of the reward function is generally related to the objective function of the system. The intelligent body reward mechanism designed in this paper includes the objective function F and the action-constrained penalty Fc, in which the action-constrained penalty Fc mainly includes the penalty for power overruns in interactions with the power-gas network, the penalty for overrunning the output of the unit, the penalty for overrunning the rate of change of output, and the penalty for overcharge and overdischarge of the energy storage equipment. The reward function guides the intelligent body to take actions to minimize the objective function while executing the constraints. This is accomplished by using the next reward function:
r s t , a t = ω 1 F s t , a t + ω 2 F c s t , a t
where ω 1 is the scaling factor of cost control; ω 2 is the scaling factor for the execution of the constraint penalty.

4.4.1. Objective Function

The total operating cost F of the system consists of two parts: the integrated operating cost F1 and the carbon control cost F2.
F = min ( F 1 + F 2 )
(1)
Comprehensive Running Costs
Comprehensive operating costs include the cost of higher-level grid interactions, the cost of gas purchased from the natural gas grid, and the operation and maintenance costs of each piece of equipment.
F 1 = min ( C g r i d + C g a s + C t m a )
C g r i d = t = 1 T k t E P t g r i d C g a s = t = 1 T k t G G t b u y C m a = t = 1 T m = 1 M k m P t m
where C g r i d is the power purchase cost of the superior power grid; C g a s is the cost of purchasing gas for the gas network; k t E and k t G are the time-of-use electricity price of the t-period natural gas price; P t g r i d is the interaction power with the superior power grid at the time of t; G t b u y is to purchase gas volume from the superior; C m a is the cost of operation and maintenance of system equipment; k m is the unit maintenance cost of the M type of equipment; P t m is the input or output power of the m type of device.
(2)
Cost of Carbon Control
Carbon control costs mainly include carbon purchase costs incurred in the methanization process, carbon capture, storage, utilization equipment operation and maintenance costs, and carbon trading costs.
F 2 = min ( C b u y + C m a + C t r a )
C C O 2 b u y = t = 1 T k C O 2 b u y M t b u y C c c u s m a = t = 1 T n = 1 N k n P t n C t r a = t = 1 T k C O 2 t r a M t n e t
where C C O 2 b u y is the cost of carbon purchase; k C O 2 b u y is the price of CO2 per unit; M t b u y is the purchase CO2 volume for t moments; C c c u s m a is the cost of operation and maintenance of carbon capture and utilization equipment; k n is the unit price of natural gas; G t b u y is the purchase gas power for t moment; C m a is the cost of operation and maintenance of system equipment; k n is the unit maintenance cost of the nth type of equipment; P t n is the input or output power of the equipment for the nth type of carbon capture; C t r a is the carbon trading costs; k C O 2 t r a is the carbon trading price; M t n e t is a net carbon emission for the system.

4.4.2. Constraints

(1)
Power Balance Constraints
In order to satisfy the electric–hydrogen energy demand for each time period in the system, the power balance constraints as well as the external energy supply constraints in the system are shown as follows:
P t P V + P t W D + P t G T + P t H F C + P t O R C + P t E S + P t g r i d = P t A W E + P t P E M + P t C C S + P t L o a d Q t W H B + Q t G B + Q t T S T = Q t L o a d H t A W E + H t P E M + H t H S T = H t M R + H t H F C G t b u y + G t M R = G t G T + G t G B + G t L o a d
where P t P V is the output of the photovoltaic power station in the t period; P t W D is the output for the fan in the t period; P t L o a d is the electrical load of the t period; Q t T S T is the net output for thermal energy storage in the t period; Q t L o a d is the heat load in the t period; G t b u y is the purchasing natural gas for the t period; G t L o a d is the gas load in the t period; H t H S T is the net output of the hydrogen storage tank in the t period.
(2)
Interactive power constraints with higher-level electrical networks
P g r i d , min P t g r i d P g r i d , max G b u y , min G t b u y G b u y , max
where P g r i d , max and P g r i d , min are the upper and lower limits of the interactive power between the system and the main power grid, respectively; G b u y , max and G b u y , min are the upper and lower limits of the interaction power between the system and the main gas network, respectively.
(3)
Equipment output constraints
P A W E , min P t A W E P A W E , max P P E M , min P t P E M P P E M , max G M R , min G t M R G M R , max S G T , min S t G T S G T , max S H F C , min S t H F C S H F C , max Q G B , min Q t G B Q G B , max
where P A W E , max and P A W E , min are the upper and lower limits of the power consumed by electrolysis; P P E M , max and P P E M , min re the upper and lower limits of the electrical power consumed by electrolysis; G M R , max and G M R , min are the upper and lower limits of gas production power of methane reactors, respectively; S G T , max and S G T , min are the upper and lower limits of the total output of gas turbines; S H F C , max and S H F C , min are the upper and lower limits of the total output of hydrogen fuel cells; Q G B , max and Q G B , min are the upper and lower limits of the thermal power of gas boilers.
(4)
Equipment output climbing constraints
Δ P E L , min P t + 1 E L P t E L Δ P E L , max Δ G M R , min G t + 1 M R , C H 4 G t M R , C H 4 Δ G M R , max Δ S G T , min S t + 1 G T S t G T Δ S G T , max Δ S H F C , min S t + 1 H F C S t H F C Δ S H F C , max
where Δ P E L , max and Δ P E L , min are the upper and lower limits of the electrolyzer power ramp, Δ G M R , max and Δ G M R , min are the upper and lower limits of methane reactor gas production power; Δ S G T , max and Δ S G T , min are the upper and lower limits of the total power of gas turbines; Δ S H F C , max and Δ S H F C , min are the upper and lower limits of the total output of hydrogen fuel cells.

5. Examples

5.1. Example Description

Simulation analysis is performed for the HCEH-IES built in Figure 1. This paper verifies the ability of reinforcement learning for offline training and online optimization of the model in this paper and conducts a comparative analysis of the three designed scenarios, as well as compares the ability of different optimization algorithms to solve the model. Under the premise of giving priority to meeting load demand, making full use of renewable energy sources, choosing appropriate optimal scheduling strategies, reducing the comprehensive operation cost and carbon control cost of the system, and finally planning the output of each unit. The parameters of each unit within HCEH-IES are shown in Appendix A.

5.2. Training Convergence Analysis

A total of 4000 cycles are trained in this simulation. In offline training, the SAC algorithm has the highest reward function value and the fastest convergence speed. The SAC reward curve gradually stabilizes in 3000 training cycles and converges to the reward value interval of −3.2 × 10⁷–3.22 × 10⁷, while the DDPG algorithm stabilizes only in 3500 training cycles, and the training results are poor. For detailed specifications, see Appendix B.

5.3. Analysis of Scheduling Results

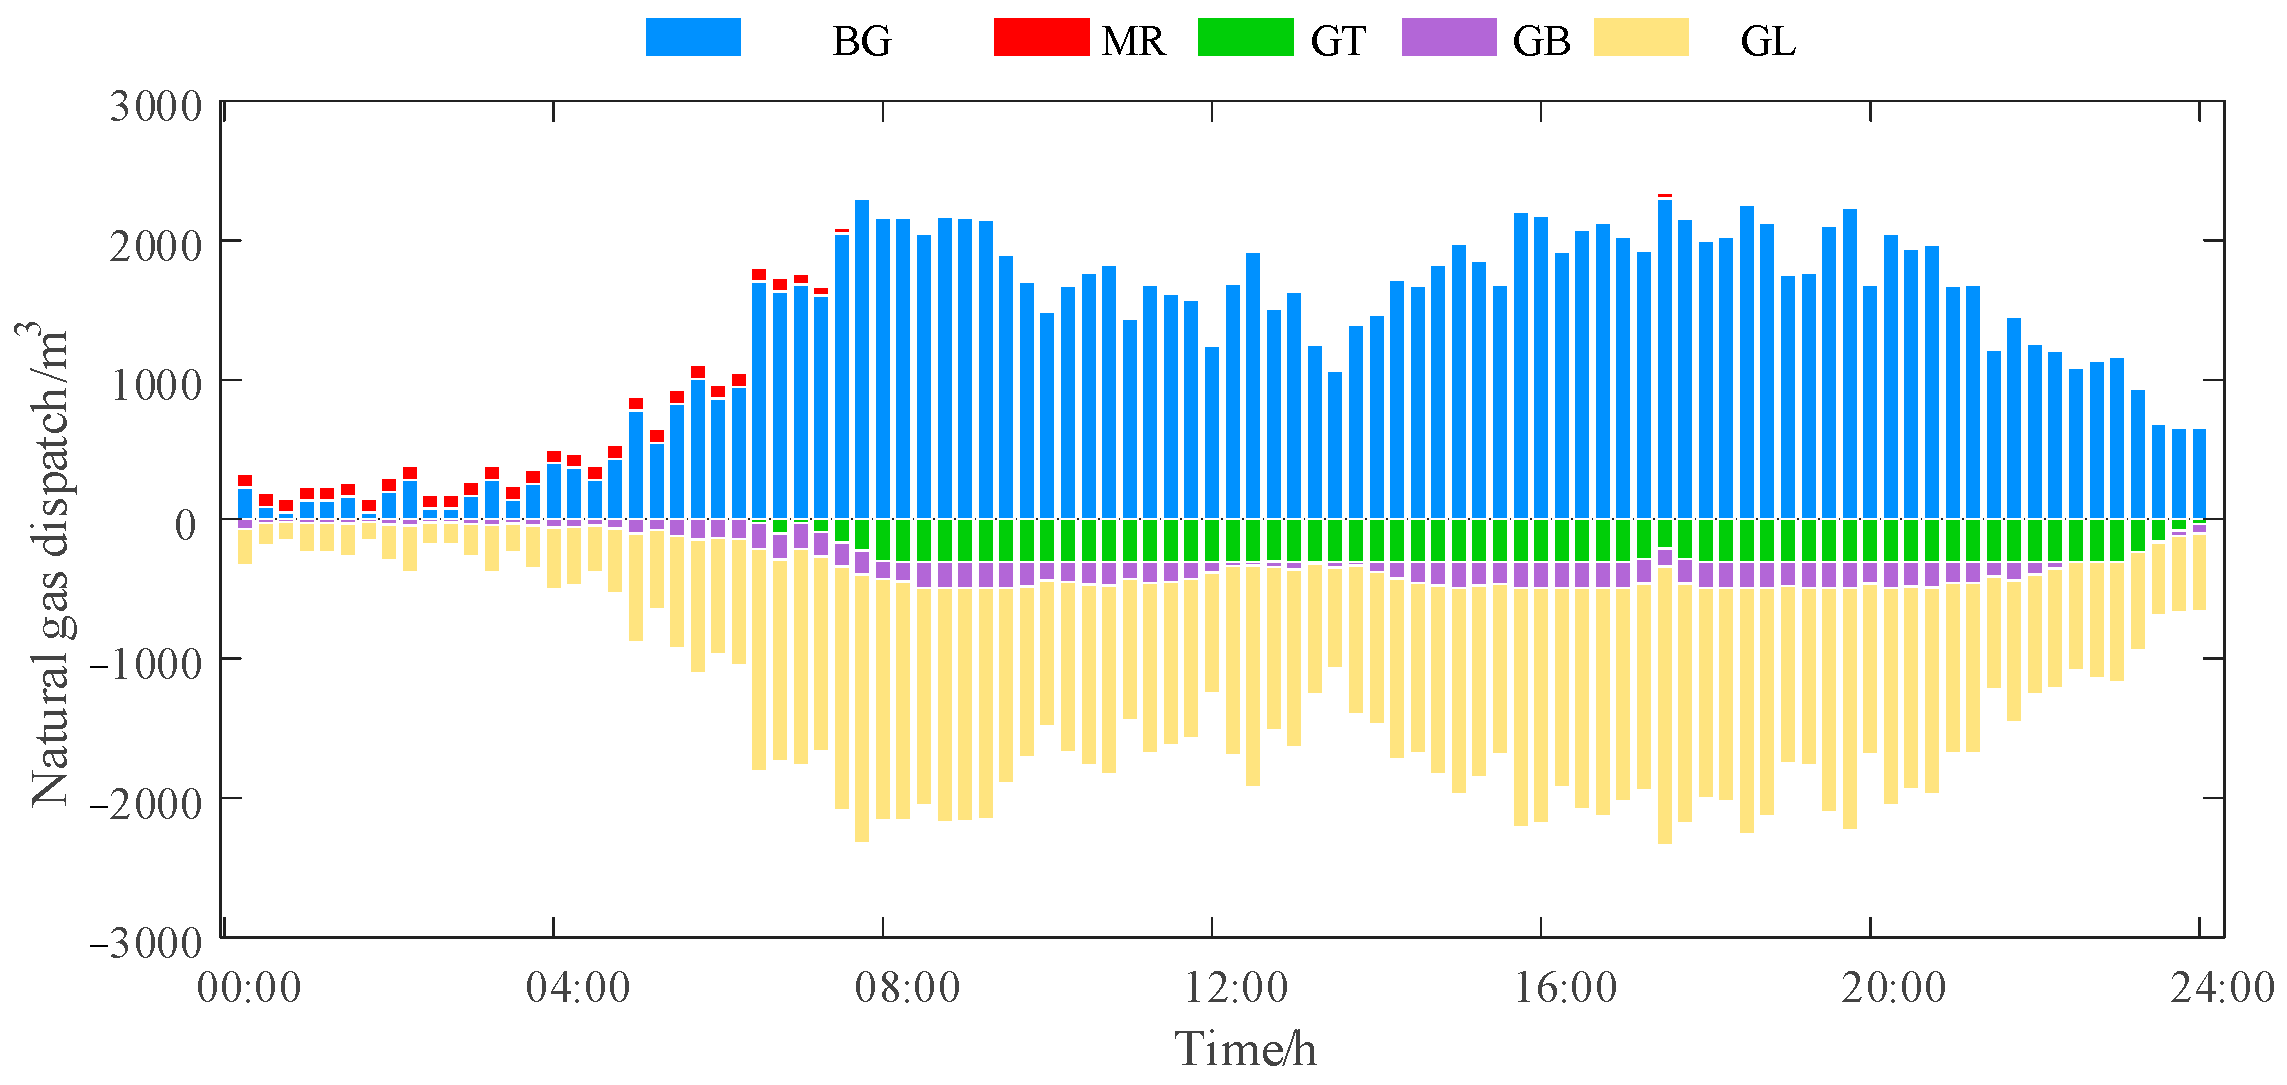
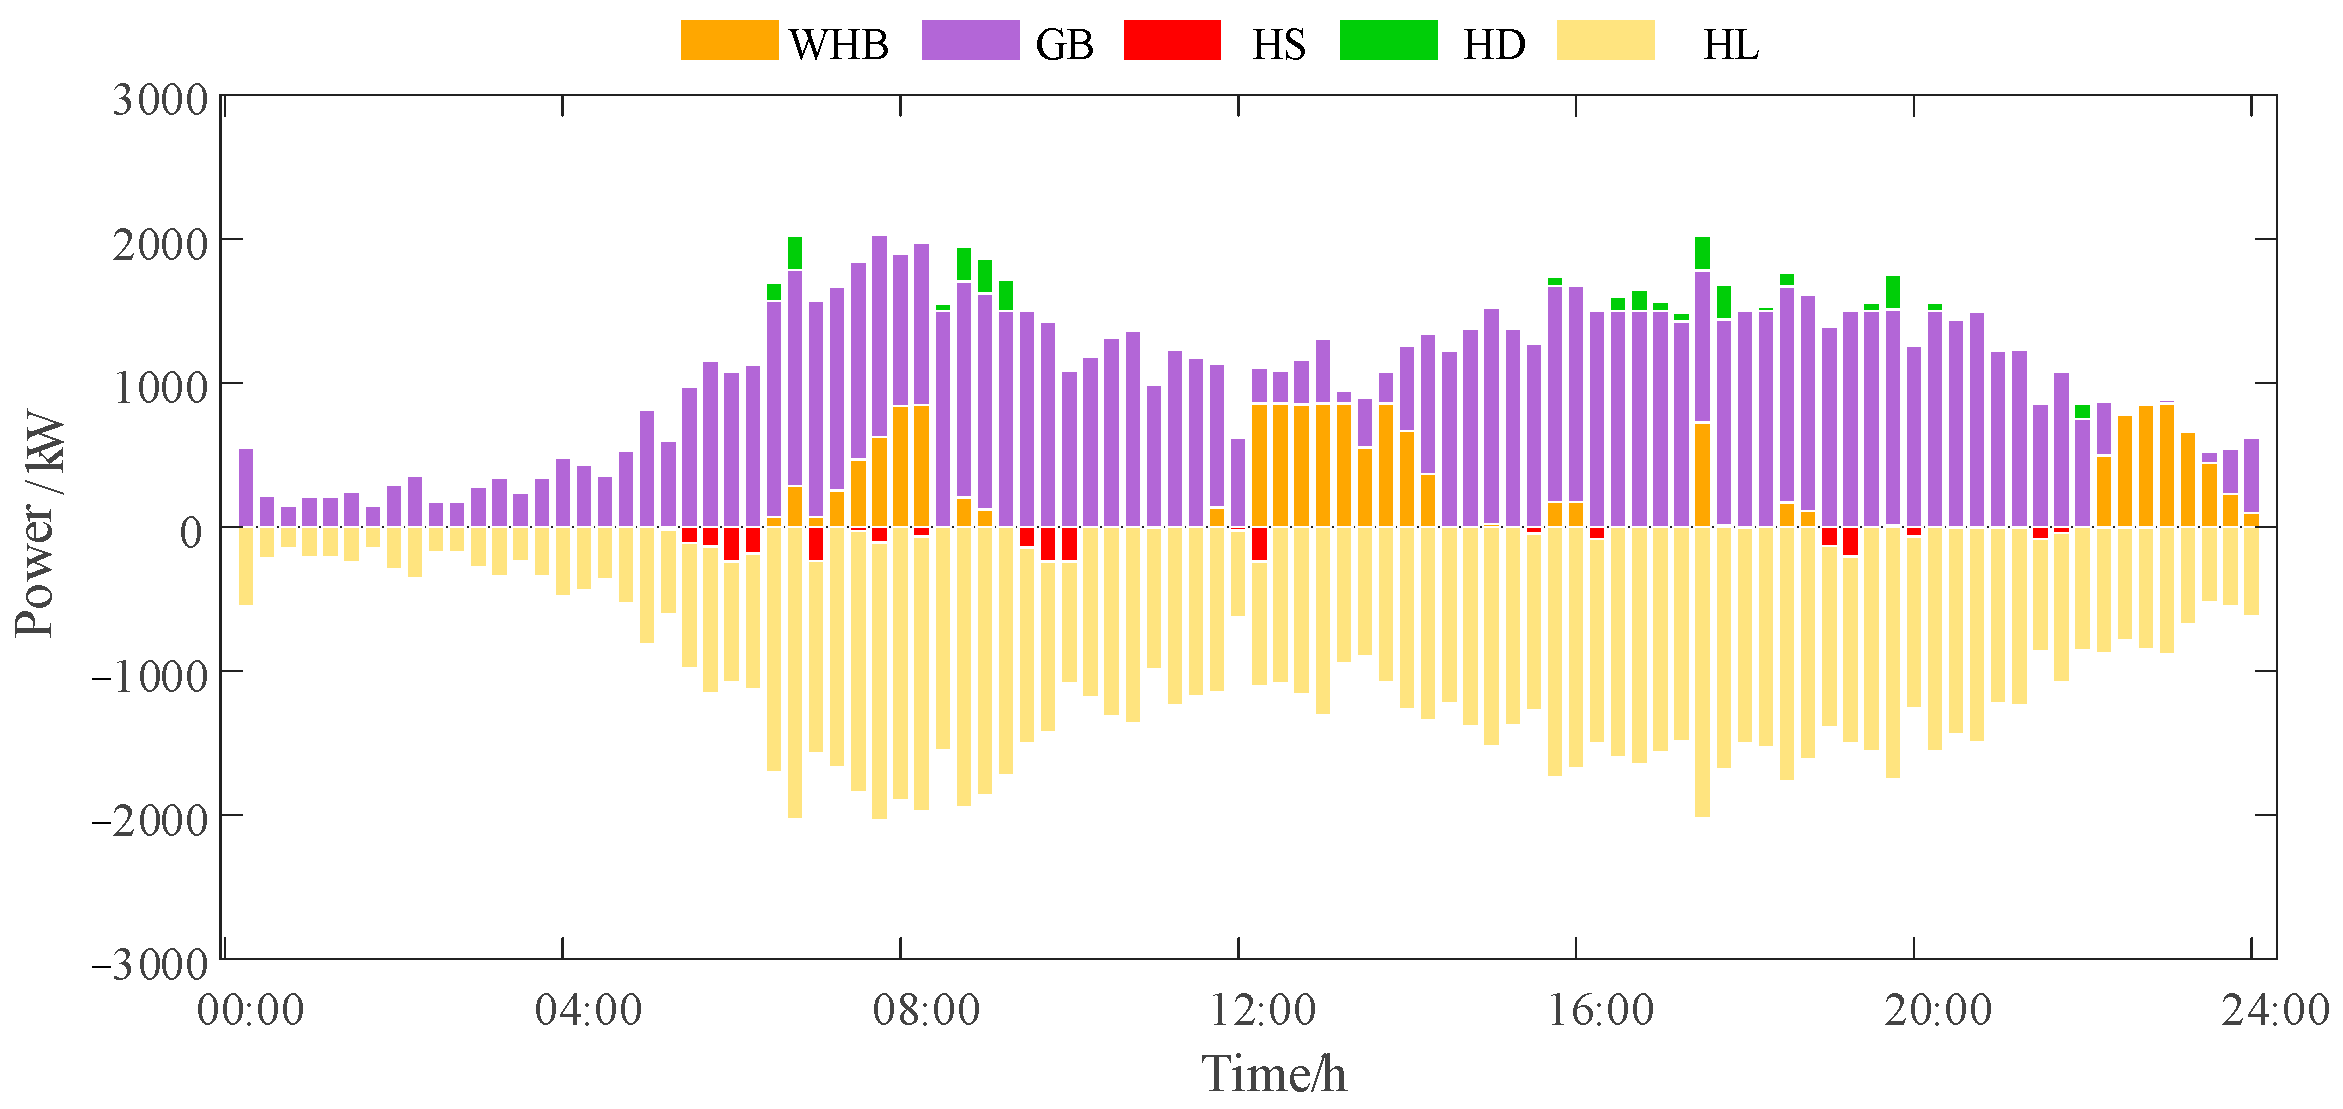
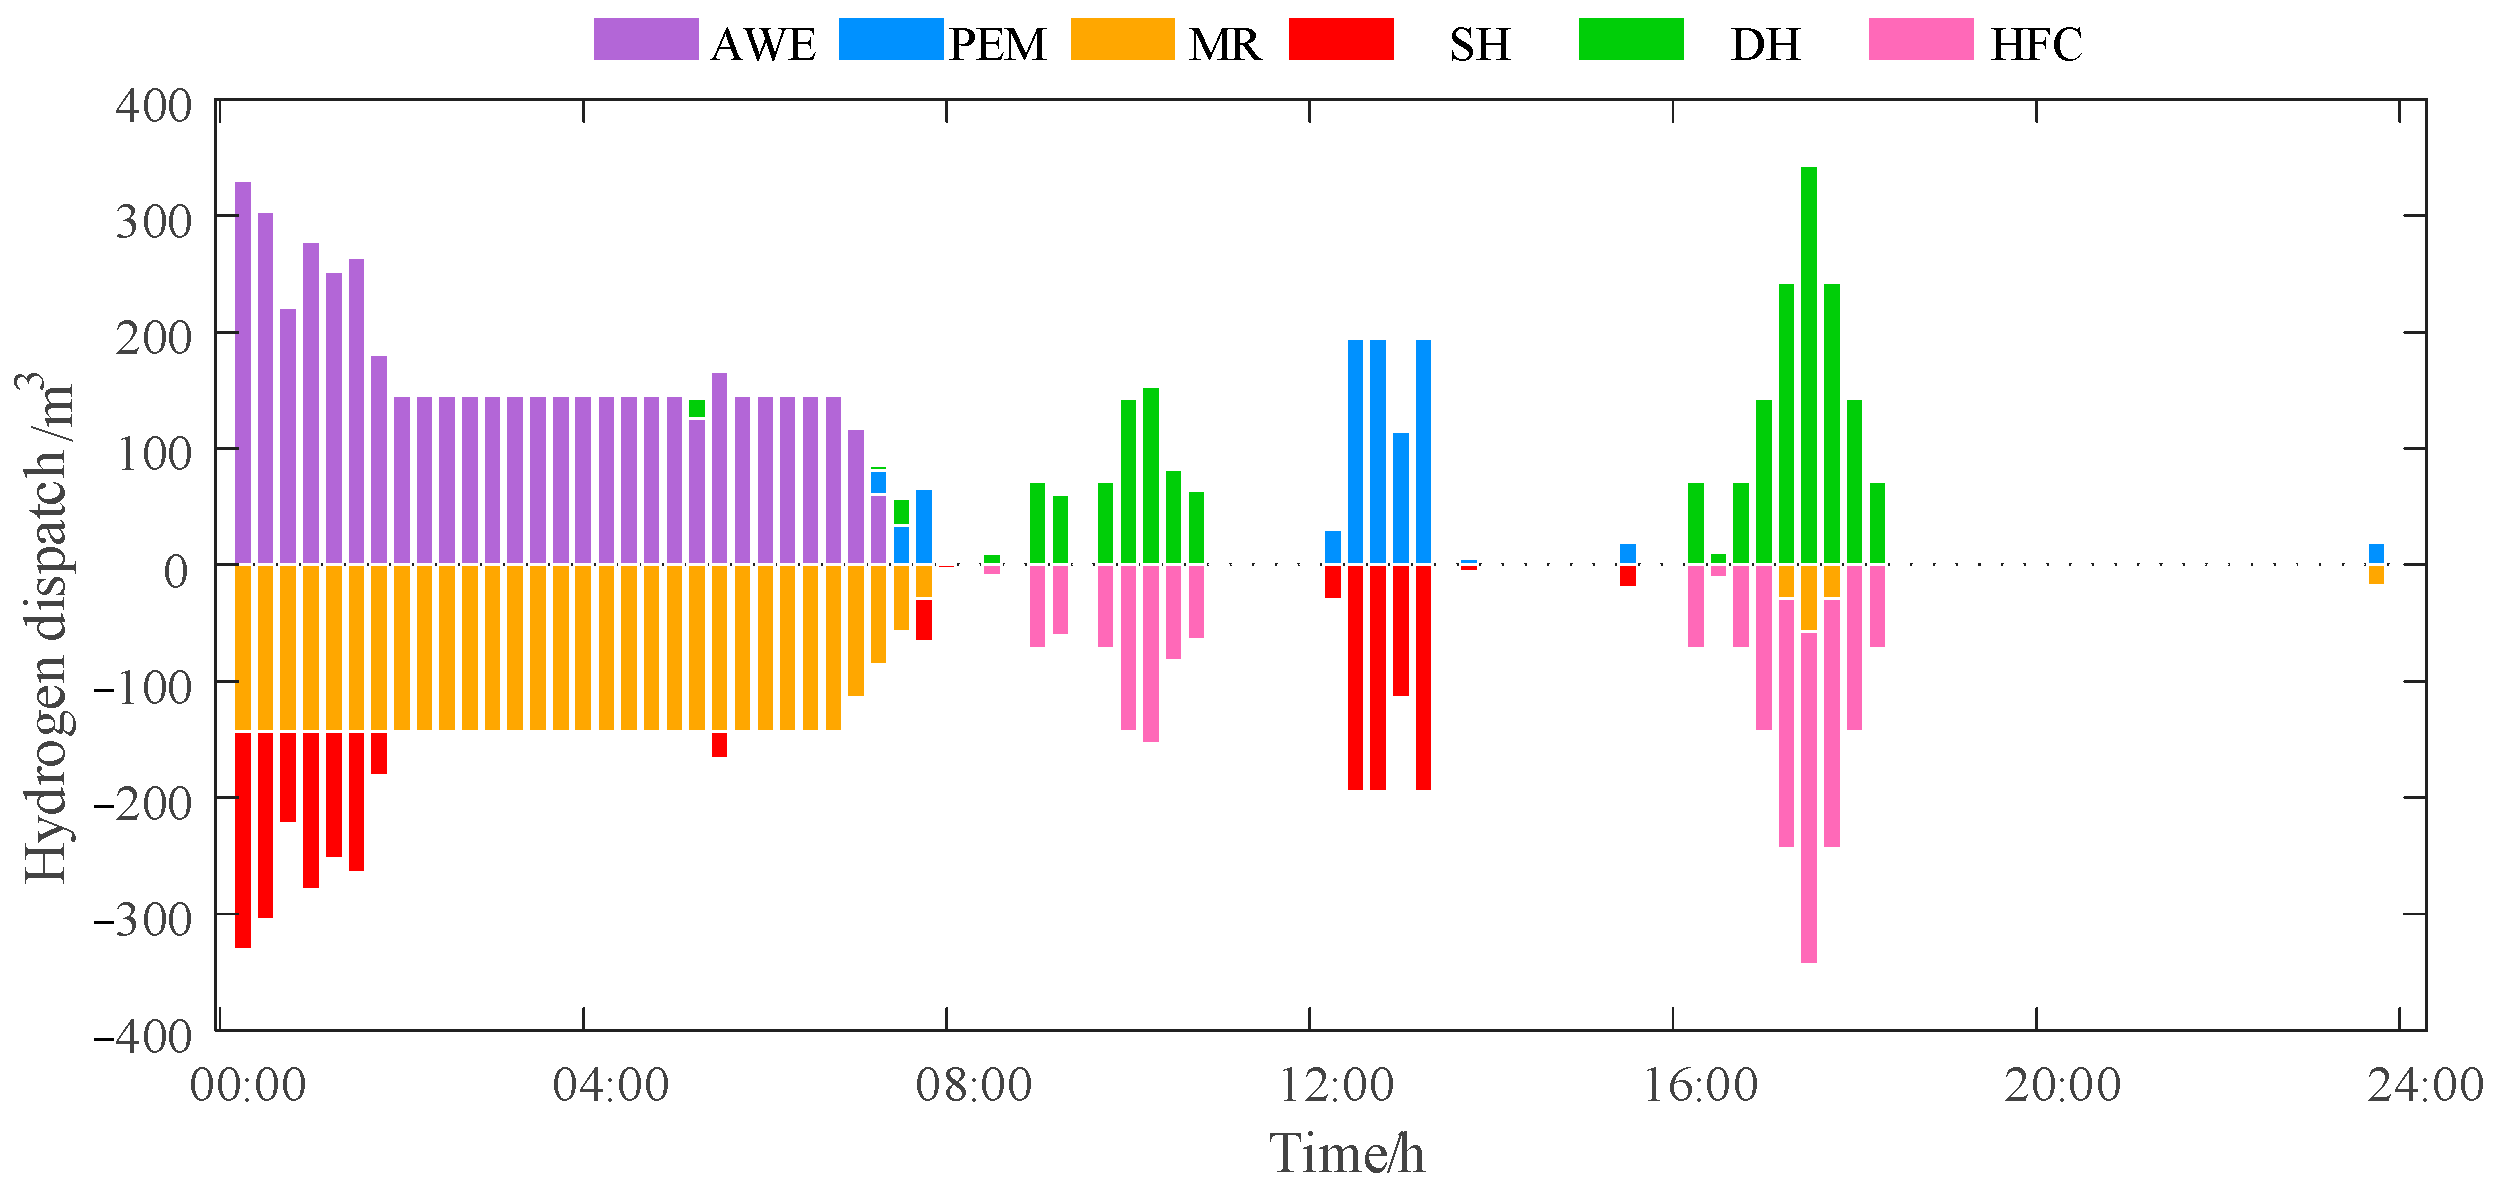
After training the algorithmic network using historical data, the resulting network is saved and applied to the dynamic economic scheduling of the system. The results of scheduling actions are shown in Figure 2, Figure 3, Figure 4 and Figure 5.
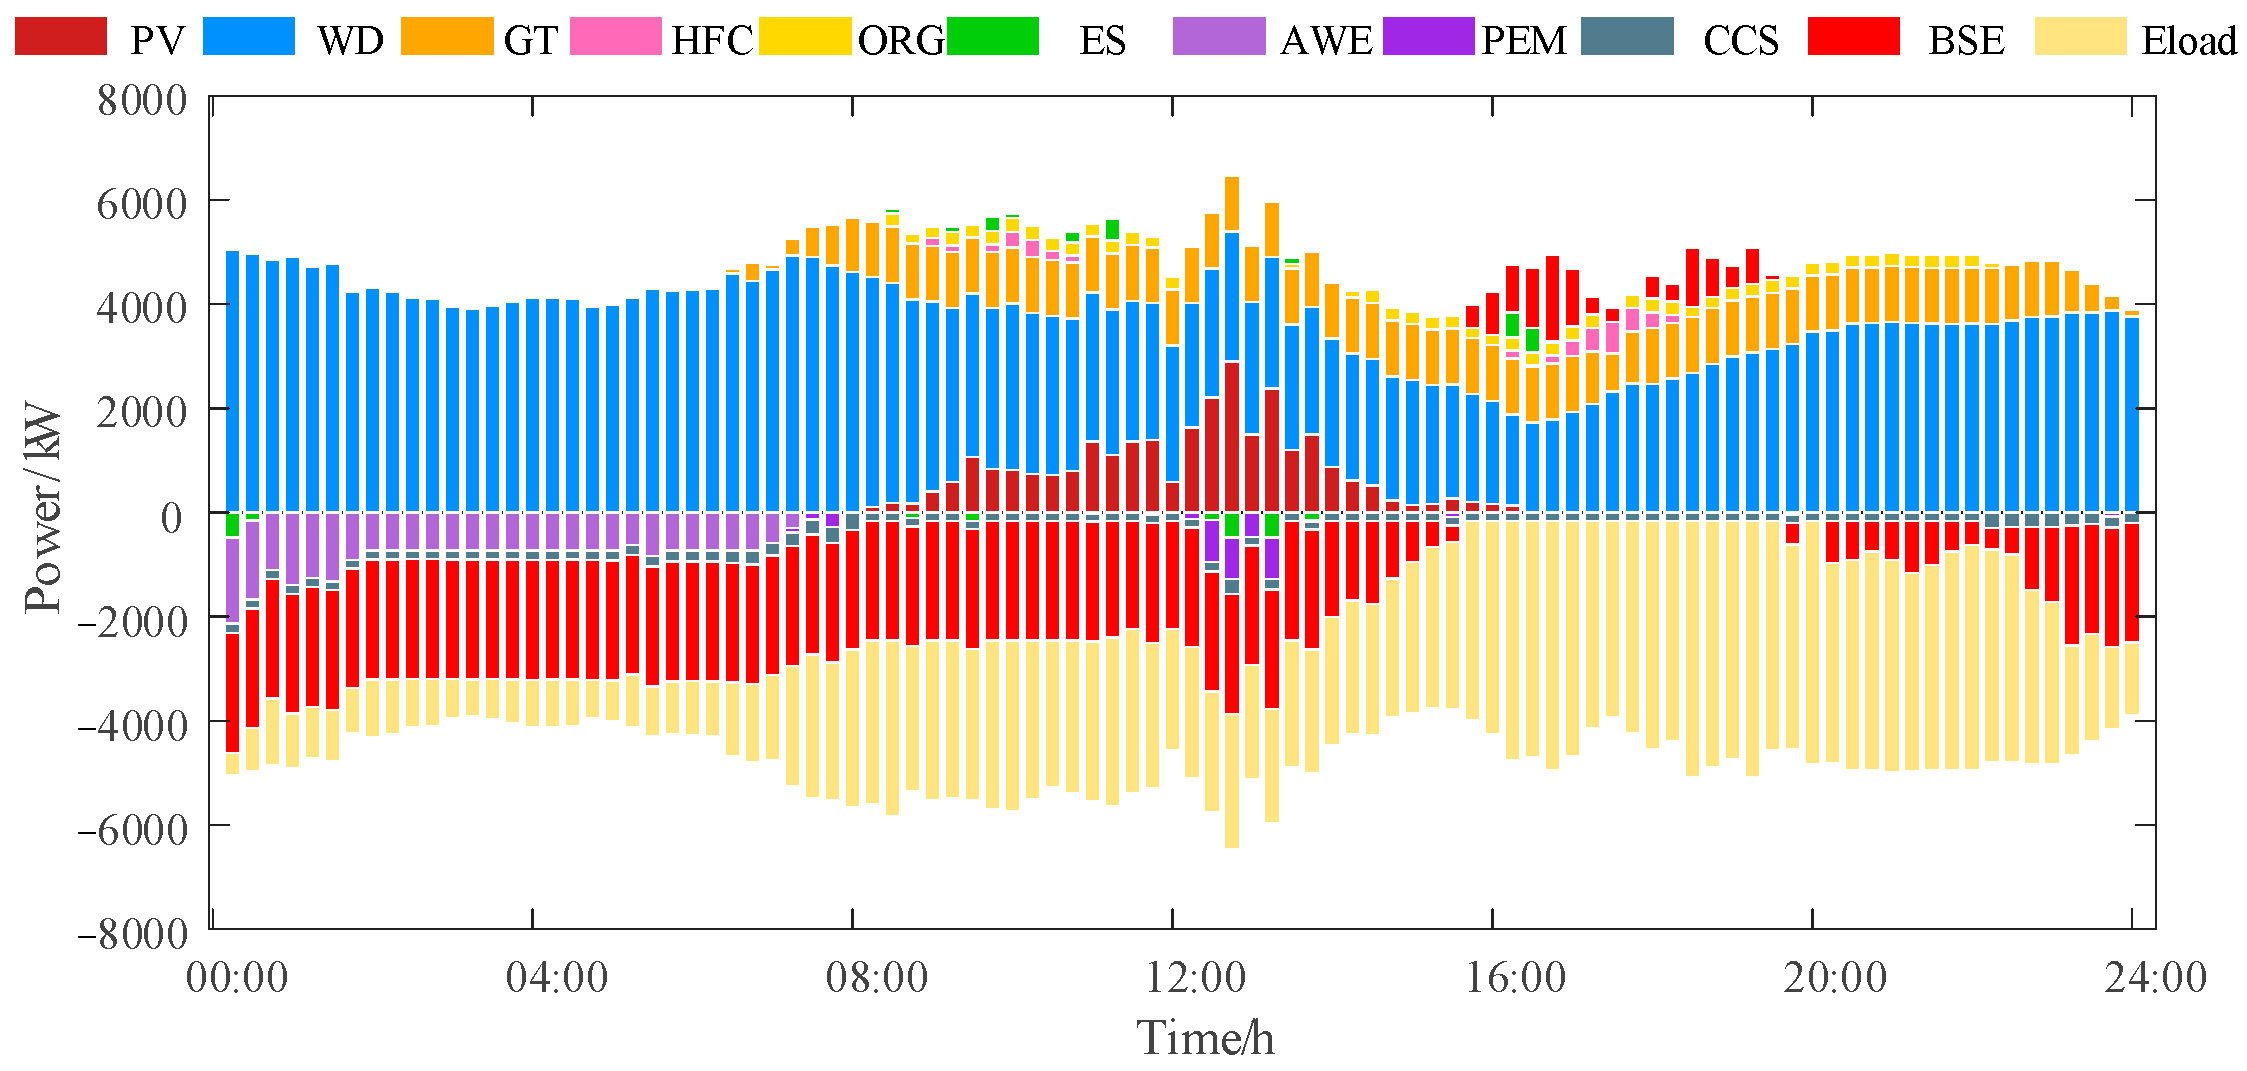
As shown in Figure 2, power dispatch exhibits characteristics of multi-timescale collaborative optimization. During 00:00–04:00, there is PV plant shutdown, wind turbine as the main power supply of renewable energy, gas turbine low power operation to fill the gap between wind power and electric load, and hot standby maintained. Due to wind power overcapacity, the system sells power to the grid. During 04:00–06:00, wind turbine power drops and gas turbine power increases to ensure the stability of the electric load. From 06:00 onwards, the increase in light makes the power of photovoltaic power generation rise, and the system continues to optimize the dispatch to maintain electric balance. After 6:00, solar power generation increases but experiences a timing mismatch with peak electricity demand. At this time, the system coordinates gas turbines, hydrogen fuel cells, and low-temperature waste heat power generation units to form a diversified, complementary power supply structure. Notably, during the 18:00 to 20:00 peak load period, the system achieved peak shaving and valley filling by preemptively discharging stored energy, adjusting P2G operation strategies, and promptly activating hydrogen fuel cells. This demonstrates that the SAC algorithm has mastered forward-looking decision-making capabilities in power dispatch, effectively mitigating renewable energy fluctuations through multi-energy flow conversion.
The thermal load scheduling in Figure 3 clearly demonstrates the system’s full utilization of thermal inertia. From 00:00 to 04:00, during low-load periods, the system maintains baseline heating solely through fluctuating operation of gas boilers, while thermal storage units perform intermittent heat storage. This “valley-filling” operation reserves capacity for subsequent adjustments. From 06:00 onwards, as thermal load increases, the system synchronously boosts output from both gas and waste heat boilers while activating thermal storage units for heat release, establishing a “storage-supply” coordination mode. During the high-load period from 08:00 to 20:00, the gas boiler, waste heat boiler, and thermal storage units operate in a coordinated state. Through multi-heat-source control, this achieves a balance between heating reliability and economic efficiency. This optimized scheduling, based on the thermal system’s spatiotemporal characteristics, demonstrates the unique advantages of integrated energy systems in thermal energy management.
Figure 4 illustrates the pivotal role of the gas network in multi-energy conversion. During 00:00–04:00, due to the low heat demand for production and life, the gas boiler maintains the basic heat supply in a fluctuating mode, the power of the waste heat boiler is small, and the heat storage device intermittently carries out heat storage with small power. From 06:00 onwards, the heat load starts to rise, the power of the gas boiler increases significantly, the power of the waste heat boiler increases synchronously, and the heat storage tank participates in heat storage during part of the time period. During 08:00–20:00, accompanied by a continuous growth or fluctuation of the heat from 08:00 to 20:00, along with the continuous growth or fluctuation of heat load, gas boilers, waste heat boilers, and heat storage tanks operate synergistically to increase the heat supply. The methane reactor increased its output around 20:00. This strategic arrangement responded to the anticipated growth in gas load while leveraging its time-varying operational characteristics to participate in system regulation. Throughout the entire scheduling process, the natural gas system ensured gas volume balance and operational safety for the multi-energy system through the dual safeguards of “purchased gas + P2G gas production”.
Figure 5 illustrates the core value of hydrogen energy dispatch in energy conversion. Between 00:00 and 04:00, alkaline electrolyzers maximize low-cost wind power for large-scale hydrogen production while proton exchange membrane electrolyzers remain on standby. This differentiated operation demonstrates the system’s precise control over hydrogen production economics. Simultaneously, methane reactors continuously consume hydrogen to synthesize natural gas, while hydrogen storage tanks handle surplus storage, forming a complete “production-storage-consumption” hydrogen management chain. Between 14:00 and 16:00, PEM electrolyzers significantly increase output—aligned with their rapid response characteristics—to smooth power fluctuations during this period. During the peak hydrogen consumption period from 18:00 to 20:00, the system achieved precise matching of hydrogen supply and demand by coordinating electrolyzer load reduction, hydrogen fuel cell power generation, and hydrogen tank release. This multi-timescale hydrogen management strategy fully demonstrates hydrogen’s critical role in enhancing system flexibility and facilitating renewable energy integration.

5.4. Comparison of Methods

(1)
Model Comparison
The following scenarios are set up to verify the superiority of this paper’s model:
Scenario 1: Introducing gas-fired units and a carbon trading mechanism, without adding hydrogen fuel cells to form a cogeneration system, and without carbon capture utilization technology.
Scenario 2: Based on scenario 1, carbon capture technology is added, and electrolytic hydrogen is converted to natural gas for utilization.
Scenario 3: Based on scenario 2, two-stage P2G is used, and hydrogen fuel cells and ORC low-temperature power generators are introduced to form a cogeneration system.
From Table 1, it can be seen that scenario 1 only deploys gas units, does not build a cogeneration system, and lacks technical means such as electricity-to-gas, resulting in significantly high gas grid interaction costs. Scenario 2 integrates carbon capture technology on the basis of scenario 1 and directly converts electrolyzed hydrogen into natural gas for utilization, which effectively reduces natural gas procurement expenditure by supplementing gas sources, reducing the gas grid interaction cost to 108,204.95 CNY. However, due to the constraints of the carbon trading mechanism, the additional carbon purchase cost was 1576.83 CNY. Scenario 3 uses two-stage power-to-gas (P2G) technology to introduce hydrogen fuel cells and ORC cryogenic power generation devices to build a cogeneration system, although the complexity of the system increases and changes the natural gas demand structure, resulting in the gas grid interaction cost rising to 113,808.10 CNY, however, its grid interaction cost is −59,777.26 CNY, achieving significant benefits, which is attributed to the fact that the cogeneration system improves energy utilization efficiency and grid interaction benefits through energy allocation optimization and interactive collaboration.
Carbon control cost analysis: Scenario 1 does not involve carbon capture technology, so both carbon purchase costs and carbon capture and storage costs are zero. Scenario 2 introduces carbon capture technology, generating carbon purchase costs of 1576.83 CNY, carbon capture and storage costs of 866.22 CNY, and carbon trading costs of 18,116.87 CNY, initiating carbon emission control through technological and market-based measures. Scenario 3 continues relevant mechanisms and technologies, with carbon purchase costs of CNY 1246.84, carbon capture and storage costs of CNY 836.31, and carbon trading costs of CNY 17,551.39. Due to system optimization, some costs have been adjusted, but overall, carbon emission control and management continue.
(2)
Algorithm comparison
To comprehensively evaluate the effectiveness of the proposed optimization scheduling strategy, this study employs both mathematical programming and deep reinforcement learning (DRL) methods for comparative analysis. Specifically, the commercial solver CPLEX (IBM ILOG CPLEX Optimization Studio) is introduced to solve the deterministic day-ahead optimization problem of the HCEH-IES model, providing a theoretical optimal solution as a benchmark under idealized forecasting conditions. Meanwhile, two representative DRL algorithms—deep Q-network (DQN) and deep deterministic policy gradient (DDPG)—are also optimized and applied to solve the same model.
From Table 2, the computational costs for the SAC, DDPG, and DQN algorithms are CNY 95,601.14, CNY 97,629.78, and CNY 99,287.60, respectively. Calculations show that the operational cost increases relative to CPLEX for the SAC, DDPG, and DQN algorithms are approximately 2.76%, 4.94%, and 6.72%, respectively. Among these, the SAC algorithm exhibits a lower total operational cost than both DDPG and DQN, and its results are closer to those of CPLEX’s current optimal scheduling method. It is important to emphasize that CPLEX achieves theoretical optimal solutions under ideal conditions where all source-load data is fully known. In contrast, the SAC algorithm develops scheduling strategies adaptable to uncertainty through interactive learning in dynamic environments. CPLEX’s marginally superior economic performance in deterministic settings validates its theoretical advantage while highlighting SAC’s effectiveness and robustness in scenarios closer to real-world operations. Compared to DDPG and DQN, SAC’s operational costs were CNY 75,846.92, CNY 76,957.37, and CNY 77,633.45, respectively, demonstrating cost advantages that indicate greater efficiency in resource utilization or computational logic. Regarding carbon control costs, SAC incurred CNY 19,493.30, lower than DDPG’s CNY 20,672.41 and DQN’s CNY 21,654.15, demonstrating greater effectiveness in carbon emission control strategies.
This study adopts the SAC algorithm primarily based on the following considerations: First, this algorithm can adaptively learn the random fluctuation characteristics of wind and solar power generation and multi-energy loads through interaction with the environment without relying on precise predictive models; second, it possesses online learning and real-time adjustment capabilities, making it better suited for dynamic scheduling scenarios.

6. Conclusions

In this paper, an optimization method for the scheduling and operation of a hydrogen-coupled electrothermal integrated energy system is proposed. The source-side structure of the system is optimized by integrating carbon trading policies with low-carbon technology to improve the renewable energy consumption rate and system decarbonization level. Furthermore, to address the uncertainties in system source-load and the insufficient exploration in existing reinforcement learning algorithms, a deep reinforcement learning method based on Soft Actor–Critic (SAC) is proposed. The adaptive learning control strategy is obtained through interactions between agents and the energy system. The following conclusions are drawn:
(1) The proposed HCEH-IES framework and its optimization methodology, which synergizes carbon trading mechanisms with low-carbon technologies like P2G-CCS, increased the renewable energy consumption rate to over 85%. This architecture effectively matches the energy consumption of carbon capture and electrolytic hydrogen production with renewable generation profiles, resulting in a 12.7% reduction in total carbon emissions in scenario 3 compared to scenario 1, empirically demonstrating its significant effectiveness in enhancing the system’s carbon reduction capability.
(2) The hybrid hydrogen production system, comprising AWE and PEM electrolyzers, operated in a complementary manner to meet hydrogen demand while effectively utilizing low-cost wind power and surplus PV generation, contributing approximately 15% to the system’s flexibility regulation potential. The diversified utilization of hydrogen through power generation in fuel cells, methanation, and direct storage fully unlocks its potential as a cross-seasonal storage medium and a coupling hub for multi-energy flows, proving crucial for the system’s low-carbon and economic operation.
(3) Based on the deep reinforcement learning method of soft SAC, the adaptive optimization of control strategies is realized through the interaction learning between agents and energy systems. Compared with traditional reinforcement learning algorithms, this method can reduce the total cost of HCEH-IES and effectively improve the low-carbon and economic efficiency of the system.
Author Contributions

Data curation, X.L.; writing—original draft preparation, Y.Z.; writing—review and editing, D.F.; supervision, X.Y. and J.W. All authors have read and agreed to the published version of the manuscript.

Funding

This research received funding from the National Natural Science Foundation of China (52567011); the Central Government Guidance Fund for Local Development (25ZYJA014); the Gansu Provincial Major Science and Technology Special Project (22ZD6GA063); and the Dunhuang Science and Technology Support Project (200501, 200502).

Data Availability Statement

Data cannot be shared publicly due to confidentiality agreements with the participants. Data are available upon reasonable request from the corresponding author (fanduojin@lzdctc.com) for researchers who meet the criteria for access to confidential data.

Conflicts of Interest

The authors declare no conflicts of interest.

Abbreviations

The following abbreviations are used in this manuscript:
HCEH-IESHydrogen-Coupled Electrothermal Integrated Energy System
SACSoft Actor–Critic
P2GPower to Gas
CCSCarbon Capture and Storage
GTGas Turbine
GBGas-Fired Boiler
DDPGDeep Deterministic Policy Gradient
SOFCSolid Oxide Fuel Cell
DQNDeep Q-Network

Appendix A

Equipment Parameters
EquipmentParameterValue
AECMaximum/Minimum Power Consumption/kW1650/300
Maximum/Minimum Power Consumption/kW0.7
Power Ramp-up Coefficient0.25
Maintenance Cost/CNY/kWh0.022
PEMMaximum/Minimum Power Consumption/kW1000/0
Energy Conversion Efficiency0.85
Maintenance Cost/CNY/kWh0.056
Methane reactorMaximum/Minimum Gas Production/m3100/0
Energy Conversion Efficiency0.7
Power Ramp-up Coefficient0.2
Maintenance Cost/CNY/m30.04
SOFCMaximum/Minimum Total Power/kW800/0
Electrical Conversion Efficiency0.6
Thermal Conversion Efficiency0.2
Power Ramp-up Coefficient0.25
Maintenance Cost/CNY/kWh0.04
GTMaximum/Minimum Total Power Output/kW2300/0
Electrical Conversion Efficiency0.35
Thermal Conversion Efficiency0.4
Power Ramp-up Coefficient0.25
Maintenance Cost/CNY/kWh0.04
GBMaximum/Minimum Total Power Output/kW1200/0
Energy Conversion Efficiency0.8
Power Ramp-up Coefficient0.25
Maintenance Cost/CNY/kWh0.04
EquipmentParameterValue
ORCEnergy Conversion Efficiency0.2
Maintenance Fee/CNY/kWh0.04
WHBEnergy Conversion Efficiency0.7
Maintenance Cost/CNY/kWh0.05
CCSFlue gas diversion ratio0.8
Level of carbon capture0.9
Fixed Carbon Capture Energy Consumption/kWh160
Energy consumption per unit of carbon capture (kWh/t)270
Maintenance Cost/CNY/kWh0.04
BESCapacity/kWh1500
Maximum Input/Output (kW)480
Self-dispersion coefficient0.005
Energy Storage Efficiency0.95
Maximum/Minimum Charge State0.9/0.2
Maintenance Cost/CNY/kWh0.026
TESCapacity/kWh1500
Maximum Input/Output (kW)0.2
Self-dispersive coefficient0.01
Energy Storage Efficiency0.95
Maximum/Minimum Thermal Load State0.9/0.2
Maintenance Cost/CNY/kWh0.016
HESCapacity/m32000
Maximum Input/Output per m30.25
Self-dispersion coefficient0.006
Energy Storage Efficiency0.98
Maximum/Minimum Hydrogen Loading State0.9/0.2
Maintenance Cost/CNY/kWh0.032

Appendix B

Hyperparameters and other parameters
ParameterValue
q e h 3600 (kJ/kwh)
h r z 12,586 (kJ/m3)
g r z 3600 (kJ/m3)
ρ g 0.71428 (kg/m3)
M g 16
M C O 2 44
k C C S 30 CNY/t
k C O 2 t r a 400 CNY/t
θ e , θ g , θ r 0.799, 0.324,0.5 (t/kwh)
ε E , ε G 0.867, 0.367 (t/kwh)
Reward Discount Factor0.96
Actor Network Learning Rate1 × 10−4
Critic Network Learning Rate3 × 10−4
Q-value Network Learning Rate4 × 10−4
Soft Update Coefficient4 × 10−4
Number of Hidden Layers in Network4
Number of Neurons in Hidden Layer256
Experience Buffer Capacity80,000

References

  1. Yue, X.; Cai, H.; Gu, C.; Shen, X. Cost-benefit analysis of integrated energy system planning considering demand response. Energy 2020, 192, 116632. [Google Scholar] [CrossRef]
  2. Zhang, H.; Yuan, T.; Tan, J.; Kai, S.; Zhou, Z. Hydrogen energy system planning framework for unified energy system. Proc. CSEE 2022, 42, 83–94. [Google Scholar]
  3. Chen, D.; Liu, F.; Liu, S. Optimization of virtual power plant scheduling coupling with P2G-CCS and doped with gas hydrogen based on stepped carbon trading. Power Syst. Technol. 2022, 46, 2042–2053. [Google Scholar]
  4. Cui, Y.; Yan, S.; Zhong, W.; Wang, Z.; Zhang, P.; Zhao, Y.P. Optimal thermoelectric dispatching of regional integrated energy system with power-to-gas. Power Syst. Technol. 2020, 44, 4254–4263. [Google Scholar]
  5. Meng, M.; Ma, S.; Zhao, H.; Tao, X. Bi-level optimal operation strategy of integrated energy system with concentrating solar power plant and CCS-P2G[J/OL]. J. N. China Electr. Power Univ. (Nat. Sci. Ed.) 2023, 1–10. Available online: http://kns.cnki.net/kcms/detail/13.1212.TM.20231016.1007.002.html (accessed on 11 December 2023).
  6. Han, Z.; Li, Z.; Zhang, W.; Liu, K.; Dong, H.; Yuan, T. Economic operation strategy of hydrogen integrated energy system considering uncertainty of photovoltaic output power. Electr. Power Autom. Equip. 2021, 41, 99–106. [Google Scholar]
  7. Jiang, Y.; WAN, C.; Botterud, A.; Song, Y.; Xia, S. Exploiting Flexibility of District Heating Networks in Combined Heat and Power Dispatch. IEEE Trans. Sustain. Energy 2020, 11, 2174–2188. [Google Scholar] [CrossRef]
  8. Zhang, T.; Guo, Y.; Li, Y.; Yu, L.; Zhang, J. Optimization scheduling of regional integrated energy systems based on electric-thermal-gas integrated demand response. Power Syst. Prot. Control 2021, 49, 52–61. [Google Scholar]
  9. Liu, H.; Wang, D.; Jia, H.; Dou, Z.; Zhang, C.; Wang, S. Construction and Analysis of Energy Carbon Security Region Model of Electric GasHydrogen Integrated Energy System. Power Syst. Technol. 2025, 49, 73–83. [Google Scholar]
  10. Luo, Q.; Zhu, J.; Zhu, H.; Li, H.; Guo, T. A Fully Distributed Optimal Dispatch Method for Integrated Electricity and Gas Systems with Superlinear Convergence. Power Syst. Technol. 2025, 49, 1816–1825. [Google Scholar]
  11. Yang, M.; Zhu, Y.; Yu, X. Distributionally robust low-carbon scheduling of integrated energy system considering source—load collaborative carbon reduction under multiple time scales. Electr. Power Autom. Equip. 2025, 45, 34–42. [Google Scholar]
  12. Chen, R.; Tsay, Y.S.; Zhang, T. A multi-objective optimization strategy for building carbon emission from the whole life cycle perspective. Energy 2023, 262, 125373. [Google Scholar] [CrossRef]
  13. Sun, G.; Chen, S.; Wei, Z.; Chen, S.; Li, Y. Probabilistic optimal power flow of combined natural gas and electric system considering correlation. Autom. Electr. Power Syst. 2015, 39, 11–17. [Google Scholar]
  14. Cui, Y.; Sun, X.; Cheng, D.; Xu, Y.; Zhu, H.; Zhao, Y. Stochastic Low-carbon Scheduling of Integrated Energy Virtual Power Plant Considering“Coal—fired+” Coupling Power Generation and the Coupling of Electricity-carbon-hydrogen-chemical. Power Syst. Technol. 2025, 49, 2388–2397. [Google Scholar]
  15. Li, J.; Cheng, R.; Zhou, B.; Liu, J.; Mao, T.; Zhao, W.; Wang, T.; Huang, G.; Xu, Y. Stochastic Optimal of Integrated Energy System in Low-Carbon ParksConsidering Carbon Capture Storage and Power to Hydrogen. Electr. Power 2024, 57, 149–156. [Google Scholar]
  16. Liu, C.; Li, R.; Yin, Y. Two-stage optimization for community integrated energy system based on robust stochastic model predictive control. Electr. Power Autom. Equip. 2022, 42, 1–7. [Google Scholar]
  17. Wang, X.; Zhao, Q.; Zhao, L.; Yang, T. Energy management approach for integrated electricity-heat energy system based on deep Q-learning network. Electr. Power Constr. 2021, 42, 10–18. [Google Scholar]
  18. Liu, H.; Li, J.; Ge, S.; Zhang, P.; Chen, X. Coordinated scheduling of grid-connected integrated energy microgrid based on multi-agent game and reinforcement learning. Autom. Electr. Power Syst. 2019, 43, 40–50. [Google Scholar]
  19. Feng, C.; Zang, Y.; Wen, F.; Ye, C.; Zhang, Y. Energy management strategy for microgrids based on deep expectation Q-network algorithm. Autom. Electr. Power Syst. 2022, 46, 14–22. [Google Scholar]
  20. Yang, T.; Zhao, L.; Liu, Y.; Feng, S.; Pen, H. Dynamic economic dispatch for integrated energy system based on deep reinforcement learning. Autom. Electr. Power Syst. 2021, 45, 39–47. [Google Scholar]
  21. Gong, J.; Liu, Y. Active distribution network coordination optimization based on deep determination strategy gradient algorithm. Autom. Electr. Power Syst. 2020, 44, 113–120. [Google Scholar]
Figure 1. Structure of the hydrogen-coupled electrothermal integrated energy system (HCEH-IES).
Sustainability 17 09040 g001
Figure 2. Results of optimal scheduling of electrical loads.
Sustainability 17 09040 g002
Figure 3. Results of gas load optimization scheduling.
Sustainability 17 09040 g003
Figure 4. Heat load optimization scheduling results.
Sustainability 17 09040 g004
Figure 5. Hydrogen load optimization scheduling results.
Sustainability 17 09040 g005
Table 1. Optimize the comparison of scheduling results.
ScenarioPower Grid Interaction Cost/CNYGas Network Interaction Cost/CNYEquipment Operation and Maintenance Cost/CNYCarbon Purchase Cost/CNYCarbon Capture and Storage Cost/CNYCarbon Trading Cost/CNYTotal Cost/CNY
1−49,686.20110,188.2017,895.480021,339.1099,990.24
2−44,139.57108,204.9519,729.021576.83866.2218,116.87104,511
3−59,777.26113,808.1021,816.081246.84836.3117,551.3995,601.14
Table 2. Comparative analysis results of different methods.
AlgorithmRunning Cost/CNYCarbon Control Cost/CNYTotal Cost/CNY
CPLEX74,182.2418,856.2093,038.44
SAC75,846.9219,493.3095,601.14
DDPG76,957.3720,672.4197,629.78
DQN77,633.4521,654.1599,287.60
Disclaimer/Publisher’s Note: The statements, opinions and data contained in all publications are solely those of the individual author(s) and contributor(s) and not of MDPI and/or the editor(s). MDPI and/or the editor(s) disclaim responsibility for any injury to people or property resulting from any ideas, methods, instructions or products referred to in the content.