Abstract
Within the context of global climate change and China’s commitment to the “Dual Carbon” goals (carbon peak and carbon neutrality), this study proposes a novel taxonomy of market-based environmental regulations, dividing them into investment-driven and tax-based supervisory mechanisms. Using panel data from 30 Chinese provinces between 2010 and 2023, we empirically investigate their differential effects on carbon emissions. Results indicate that both regulatory approaches significantly curb carbon emissions, each exhibiting distinct nonlinear patterns: an inverted-U curve for investment-oriented measures and a U-shaped trajectory for tax-oriented policies, implying that excessively stringent tax supervision may lead to a rebound in emissions due to effects such as the “resource curse” and “innovation crowding-out.” Industrial structure transformation functions as a common mediating channel, while green innovation efficiency exerts a distinct moderating influence. Both policy types demonstrate adverse spatial spillover effects, with no support found for the “pollution haven” or “race to the bottom” hypotheses. This study offers new empirical insights into how environmental regulations facilitate green and low-carbon transition through market mechanisms, providing valuable implications for designing ecological policy systems that harmonize emission reduction efficiency with sustainability in China and other emerging economies.
1. Introduction
Within the current global context of escalating climate concerns, governments worldwide are actively engaged in reducing carbon emissions and advancing carbon neutrality objectives [1]. As the largest developing country and carbon emitter, China explicitly announced its dual carbon goals—peaking carbon emissions by 2030 and achieving carbon neutrality by 2060—at the 75th United Nations General Assembly in 2020. This commitment has significantly accelerated the development and refinement of its domestic environmental regulation system. Unlike the European Union’s market mechanism-led approach or the United States’ emphasis on technology-driven solutions and federal-state collaboration, China’s policy framework prioritizes top-down target decomposition and coordination with industrial policies. While China has taken a global lead in areas such as renewable energy investment and electric vehicle adoption, there remains room for improvement in terms of institutional flexibility and incentives for corporate autonomous innovation—especially compared to Asian peers like South Korea and Japan, where related efforts began earlier [2,3,4,5]. As a major economy still undergoing industrialization and urbanization, China’s carbon reduction pathway is characterized by high total emissions, tight timelines, and pronounced structural challenges. Both central and local governments exert substantial influence on national carbon emission governance through the enactment and revision of environmental laws and regulations, market guidance, and public awareness campaigns.
As a primary means for central and local governments to directly influence carbon emissions, environmental regulation holds pivotal importance in contemporary low-carbon economic development. Owing to variations in industrial policy preferences, resource endowments, and development levels across China’s provincial regions, environmental regulation has formed a multi-level governance framework combining top-level central design with differentiated local implementation. However, this framework still faces structural challenges in practice. From the perspective of heterogeneity in regulatory enforcement dynamics, the central government strengthens constraints through command-and-control instruments such as laws and regulations, total emission control targets, and environmental inspections. In contrast, local governments, often caught between economic growth pressures and environmental targets, exhibit significant regional variations in regulatory intensity, sometimes leading to “campaign-style governance” and “regulatory paradoxes.” Although this administrative command-driven model yields rapid results, it suffers from excessive rigidity, high corporate compliance costs, and insufficient incentives for technological innovation. Moreover, its effectiveness is often undermined by local protectionism, making sustained environmental improvements difficult to achieve. While voluntary public participation mechanisms—such as environmental information disclosure and public engagement—play a role, their binding force remains weak due to underdeveloped social organizations and uneven public environmental awareness.
Within this setting, the advantages of market-based environmental regulations are increasingly prominent: through economic instruments like emissions trading, environmental taxes, and green investments, these mechanisms internalize environmental costs, allow firms flexibility in choosing emission reduction pathways, reduce the overall social cost of pollution control, and continuously stimulate green technological innovation via price signals, creating positive incentives for policy implementation. Market mechanisms not only effectively compensate for the inflexibility of government command-based regulations and the weakness of voluntary public mechanisms but also promote regional collaborative governance by establishing cross-regional environmental factor markets. This offers a new pathway to overcome the “one-size-fits-all” dilemma in environmental regulation and achieve a dynamic balance between economic development and environmental protection.
The key contribution of this research lies in its pioneering heterogeneous distinction and measurement of market-based regulations into incentive-oriented and supervision-oriented types, revealing their fundamentally distinct nonlinear patterns and underlying mechanisms. Although both belong to the category of market-based regulations, their operational logic differs essentially: tax supervision-oriented regulation primarily internalizes environmental costs by explicitly increasing the price of pollution emissions or resource consumption, forcing enterprises to bear direct economic consequences for polluting activities. Its core objective is to “penalize pollution” by raising costs to curb negative externalities. In contrast, investment incentive-oriented regulation focuses on reducing the initial investment thresholds and operational costs for enterprises adopting clean technologies, upgrading environmental equipment, or conducting green R&D through fiscal or financial means. Its core principle is to “reward cleanliness” by providing positive incentives to guide enterprises toward environmentally friendly pathways. From the perspective of the Porter Hypothesis, tax supervision-oriented regulation represents “making it more costly to do bad” by increasing compliance costs, while investment incentive-oriented regulation embodies “making it more profitable to do good” by enhancing innovation compensation. This fundamental difference in incentive direction may lead to significantly different policy outcomes in stimulating technological innovation, short-term compliance cost pressures, and long-term transition motivations. In China’s context, where market-based innovation compensation is generally insufficient, resource allocation mechanisms remain imperfect, and pressures for an orderly market transition are mounting, there is an urgent need for more detailed comparative research and empirical analysis on heterogeneous market-based environmental regulations. This will not only provide a theoretical basis for precisely calibrated policy design but also offer important insights into how to construct sustainable development pathways that balance environmental benefits, economic efficiency, and technological dynamism through market mechanisms.
2. Literature Review and Hypothesis Proposal
2.1. Market-Based Environmental Regulation and Carbon Emissions
Market-based environmental regulation denotes a governmental strategy that employs market mechanisms as opposed to direct intervention to attain environmental policy goals [6]. These measures predominantly encompass market-based instruments such as pollution discharge fees, environmental taxes, environmental investments, and subsidies [7]. Prior studies suggest that, relative to command-based and public voluntary environmental regulations, market-based approaches afford emitters greater decision-making flexibility and constitute a potent avenue for modulating carbon emissions. However, their effectiveness is highly dependent on the maturity of market mechanisms [8]. Consequently, this assertion of effectiveness must be viewed cautiously, as it heavily relies on the robustness of market mechanisms—a factor that varies significantly between developing and developed countries, potentially limiting the universal applicability of market-based regulations. This study focuses on market-based environmental regulations, further categorizing them into incentive-oriented regulations (implemented through environmental investments and subsidies) and supervision-oriented regulations (implemented through pollution discharge fees and environmental taxes), to examine their effectiveness within China’s context.
The “strong Porter Hypothesis” contends that innovation benefits can fully offset compliance costs, thereby effectively reducing carbon emissions [9]. Incentive-oriented market environmental regulations utilize environmental investments as instruments for innovation, channeling capital into low-carbon technology R&D, energy efficiency enhancements, and clean production. This may foster breakthrough technologies leading to structural emission reductions [10,11]. Additionally, process optimization and resource recycling significantly enhance total factor productivity [12], realizing innovation compensation. Furthermore, such regulations grant firms flexibility in choosing emission reduction strategies, providing continuous incentives to break away from carbon-intensive technological lock-in, expedite the iteration of low-carbon technologies, and reduce costs, thereby strengthening long-term carbon reduction effects through dynamic evolution. Thus, this type of regulation can drive innovation compensation and efficiency improvements, resulting in a sustained and deepening inhibitory effect on carbon emissions [13].
However, real-world outcomes are varied, mainly owing to the pronounced dual externality inherent in green innovation. This is mainly due to the lack of innovation compensation and the misallocation of resources. This kind of behavior eventually leads to a green innovation deficit, complicating the balance between innovation benefits and compliance costs, and thus giving rise to the “weak Porter Hypothesis”. Additionally, constrained by path dependency in extant production practices, firms may opt to increase carbon emissions rather than pursue green innovation, giving rise to the “green paradox” [14,15,16].
Supervision-oriented market-based environmental regulations primarily function by imposing pollution discharge fees and environmental taxes to increase corporate compliance costs, thereby compelling enterprises to adopt green emission reduction measures. The theoretical foundation of this approach originates from the concept of Pigouvian taxes in welfare economics. Arthur C. Pigou, the founder of welfare economics, first proposed the Pigouvian tax solution in his seminal work ‘The Economics of Welfare’ (1932), advocating for the internalization of external environmental costs through taxation on polluters. This mechanism transforms the externalities of environmental pollution into internal costs for emitters, thereby controlling environmental pollution [17].
Although supervision-oriented regulations function through market mechanisms, it is important to recognize that, compared to incentive-oriented regulations, they frequently entail government intervention and depend on robust regulatory systems, thus embodying a certain degree of coerciveness and representing a more stringent form of market-based environmental regulation. By internalizing the external costs of corporate carbon emissions, supervision-oriented regulations compel enterprises to undertake green innovation and other behaviors to achieve emission reduction effects [18]. For example, Ahmed (2020), in an analysis of 20 OECD countries, showed that stringent environmental policies can stimulate green technological innovation, thereby promoting emission reduction [19]. Samour et al. (2024), drawing on data from European nations, revealed that both environmental taxes and the adoption of IFRS markedly reduce consumption-based carbon emissions [20].
However, such regulations may lead to high compliance costs, and their impact on carbon emissions is not straightforwardly positive. Market mechanisms often exhibit institutional deficiencies in the early stages of regulation. Limitations such as narrow industry coverage in carbon emission trading systems, reliance on free quota allocations, low environmental tax and fee standards, and significant regional disparities can result in resource mismatches, potentially hindering productivity development [21,22]. Moreover, existing scholarship has not adequately examined the unintended consequences of supervision-oriented regulations, such as the relocation of emitters to regions with lower environmental standards or the shift to other unregulated forms of pollution.
Examined through the theoretical lenses of the strong/weak Porter Hypothesis and the green paradox, numerous researchers have observed that the effect of environmental regulation on carbon emissions may demonstrate a nonlinear relationship [23,24]. Zhang et al. (2014) took China’s steel industry as the research object and found that the direct impact of environmental regulation on carbon emissions conformed to an inverted U-shaped curve [25]. Chen et al. (2020) determined that this nonlinear influence displays heterogeneous patterns contingent on environmental regulation intensity, with the primary mechanisms being synergistic effects and technological innovation effects [26]. Yuan et al. (2018), inspecting data from China’s manufacturing sector, evaluated both the weak and strong Porter Hypotheses concerning environmental regulation’s impact on technological innovation [27]. Their research indicates that there is a nonlinear relationship between environmental regulations and carbon emissions, and this relationship may vary due to industry heterogeneity. Danish et al. (2020), in a study of BRICS countries, established that environmental regulation can effectively facilitate carbon reduction in most instances and aids in forming an inverted U-shaped curve between income and pollution, implying that this nonlinear relationship might also be present in other emerging economies [28]. Conversely, in their examination of EU countries, found that the promotion of renewable energy substantially contributes to emission reduction, whereas the effectiveness of environmental regulations fluctuates based on policy type and enforcement stringency. For instance, the 2020 Climate and Energy Package was efficacious, whereas the ratification of the Kyoto Protocol did not produce significant outcomes [29]. Current academic discourse still lacks a thorough exploration of the intrinsic mechanisms underlying this nonlinear relationship, particularly the fundamental reasons for nonlinear manifestations under different regulatory types.
In summary, existing research has established the theoretical foundation that market-based environmental regulations affect carbon emissions through both incentive and constraint mechanisms, while also revealing the complexity and contentiousness of their effects. On one hand, incentive-based regulations, grounded in the “Porter Hypothesis,” guide green innovation yet are constrained by dual externalities and path dependency, potentially leading to “weak Porter effects” or even the “green paradox.” On the other hand, supervision-oriented regulations internalize environmental costs based on the Pigouvian tax principle but may suffer from institutional deficiencies, high compliance costs, and regional disparities, resulting in low emission reduction efficiency. It is worth noting that many studies have shown that the impact of environmental regulation on carbon emissions exhibits nonlinear characteristics such as an inverted U-shaped curve and industry heterogeneity. Its effectiveness strongly depends on regulatory intensity, market maturity, and the response strategies of market entities. However, existing literature also somewhat overlooks the moderating role of institutional environments and market structures, pays insufficient attention to unintended policy consequences, and lacks long-term effect evaluations. Building upon the foregoing literature review, this paper puts forward the following Research Hypothesis 1.
Hypothesis 1:
Market-based environmental regulations inhibit carbon emissions, and a nonlinear relationship may exist between market-based environmental regulations and carbon emissions.
2.2. Market-Based Environmental Regulations, Transformation of Industrial Structure and Carbon Emissions
Market-based environmental regulations may considerably suppress carbon emissions by propelling the transformation of the industrial structure. Industrial restructuring constitutes an essential prerequisite for late-developing countries to expedite economic development [30]. This structural shift occurs since different stages of a nation’s development are usually driven by different leading industries.
Environmental regulations compel the upgrading of industrial structures and spur technological innovation, thereby inverting the direction of the impact that industrial structure and technological innovation exert on carbon emissions [31]. Investment incentive-oriented market-based environmental regulations guide production factors to concentrate on high-tech and low-emission industries by reducing the cost and investment risk of adopting clean technologies. In comparison, tax supervision-oriented regulations raise the marginal compliance costs for high-carbon industries, squeeze the profit margins of traditional heavily polluting sectors, and compel reallocation of resources.
Market-based environmental regulations guide the transition of the industrial structure towards a technology-intensive and service-oriented model, systematically reducing energy dependency per unit of GDP. Firstly, the increased proportion of low-carbon industries directly reduces the scale of high-emission economic activities. Secondly, industrial upgrading weakens the carbon dependency of economic growth through technological progress and efficiency improvements, ultimately achieving a structural decline in total carbon emissions [32,33,34].
This mechanism is evident across different economies: Cai et al. (2023) highlighted that industrial structure optimization is a key mediating mechanism in China’s pathway to carbon neutrality through green technological progress [35]. Albulescu et al. (2020) also found that the “pollution halo effect” brought by foreign direct investment (FDI) in EU countries promotes industrial structure upgrading through technology spillovers, thus reducing carbon emissions [29]. Samour et al. (2024), in an investigation of South Asian countries, illustrated that environmental regulations not only directly diminish ecological footprints but also alleviate the adverse environmental impacts of economic growth, non-renewable energy use, and FDI inflows, while augmenting the positive effects of renewable energy use [20]. This further signifies that environmental regulations attain emission reduction by driving energy structure optimization and industrial upgrading.
In summary, market-based environmental regulations not only directly influence corporate emission reduction behaviors but also impose a profound inhibitory effect on carbon emissions by driving systematic transformation of the industrial structure. Current studies generally hold an optimistic view that environmental regulations can achieve emission reduction through industrial structure transformation. However, this perspective overlooks the path dependency inherent in industrial restructuring and the efficacy of institutional constraints. This paper assesses two types of environmental regulations: investment incentive-oriented regulations promote the scale expansion of low-carbon industries through targeted factor agglomeration, while tax supervision-oriented regulations accelerate the phase-out of high-carbon production capacity by cost constraints. Together, they propel the evolution of the industrial structure toward an advanced form characterized by high technology and service-oriented dominance. Collectively, they drive the progression of the industrial structure toward a more advanced form defined by high technology and service-oriented dominance. This transformation process not only directly curtails the proportion of high-emission industries but also structurally contains carbon emissions by boosting total factor productivity and reducing energy-related carbon dependency. Based on the above mechanistic analysis, Hypothesis 2 is proposed.
Hypothesis 2:
Market-based environmental regulations modulate the carbon emission effect through industrial structure upgrading.
2.3. Market-Based Environmental Regulations, Green Innovation Efficiency and Carbon Emissions
Existing scholars usually regard innovative behavior as an explanatory mechanism for the impact of environmental regulations on carbon emissions but seldom considers the function of green innovation efficiency within this causal pathway. This omission could precipitate substantial misjudgments regarding policy effectiveness. As Chang et al. (2023) explicitly demonstrated in their study on China [5], investment-based environmental regulations are the most effective in promoting green innovation and its corresponding emission reduction effects, as they encourage green knowledge innovation that may yield long-term benefits. In contrast, expenditure-based regulations exhibit poorer outcomes due to their potential to induce short-term opportunistic behavior among enterprises. This finding lends direct support to the idea that green innovation efficiency is pivotal for comprehending the differential effects of environmental regulations. Nonetheless, the study did not underscore the intrinsic emission reduction effects of the environmental regulations themselves.
The efficacy of emission reduction effects of market-based environmental regulations might fluctuate with the level of green innovation efficiency, and this variation manifests differently across categories of market-based regulations. Existing studies lack a comprehensive understanding of the formation mechanisms of green innovation efficiency: firstly, there is insufficient analysis of knowledge spillovers and learning effects; secondly, the indispensable role of absorptive capacity—the capability of firms identify, assimilate, and apply external knowledge—has not been thoroughly incorporated.
From the perspective of the operational mechanism of investment incentive-oriented market regulations, their core logic lies in using fiscal means to correct the positive externalities of green innovation. This effectively lowers the marginal cost for enterprises to pursue in low-carbon innovation technologies. Consequently, even firms with low innovation efficiency may continue their innovation activities, as they can still benefit from environmental subsidies regardless of minimal outcomes. In contrast, highly efficient firms might allocate these funds not only to innovation but also to expanding production scope or other activities [11,36]. When the increase in carbon emissions resulting from production expansion surpasses the emission reduction effects achieved through innovation, a phenomenon of rising carbon emissions may occur.
Supervision-oriented regulations rely on cost pressures to force innovation, but their effectiveness is highly dependent on enterprises’ resource allocation capabilities—a point largely overlooked in existing research. Highly efficient firms can transform this pressure into innovation momentum, achieving tangible emission reduction outcomes. In contrast, less efficient firms, often lagging in the market, exhibit poorer emission reduction performance. When regulatory intensity continuously increases, passive emission reduction measures may fail to effectively curb carbon emissions, leading to a “crowding-out effect.” Less efficient firms may respond passively due to compliance burdens, potentially shifting production capacity to traditional industries, ultimately resulting in increased carbon emissions [19,37,38].
In summary, green innovation efficiency serves as a key moderating variable for understanding the differential manifestations of market-based environmental regulations. However, existing studies often overlook critical factors such as knowledge spillover effects, learning mechanisms, and enterprises’ resource allocation capacities. Investment incentive-oriented environmental regulations reduce corporate innovation costs through subsidies, yet may weaken efficiency constraints, leading inefficient firms to rely on subsidies to maintain or even expand production, while efficient firms might divert resources to non-emission reduction activities, potentially resulting in unintended increases in carbon emissions. Conversely, tax supervision-oriented environmental regulations force firms to innovate through cost internalization. Highly efficient enterprises can effectively transform this pressure into emission reduction outcomes, whereas less efficient firms may be compelled to shrink or relocate production capacity due to compliance cost pressures, consequently causing carbon emissions to rise rather than fall. Based on these significant differences in moderating pathways, this paper proposes Hypotheses 3a and 3b:
Hypothesis 3a:
Investment incentive-oriented market environmental regulation exerts a negative moderating effect on carbon emissions through the influence of green innovation efficiency.
Hypothesis 3b:
Tax supervision-oriented market environmental regulation exerts a positive moderating effect on carbon emissions through the influence of green innovation efficiency.
All hypotheses are presented in the table in the Appendix A.
3. Model Specification and Data Description
3.1. Model Specification
3.1.1. OLS Regression
To examine the relationship between provincial-level environmental regulations and carbon emissions, the following OLS panel regression model is constructed:
In Equations (1) and (2), denotes the province, denotes the year. The explained variable, , represents the provincial-level carbon emissions. The core explanatory variable, , represents the environmental regulation intensity. Control variables include: (1) Production scale, measured by , representing the number of employed persons; (2) Infrastructure Level, measured by , representing the level of production and living infrastructure in the region; (3) Energy consumption level, measured by , representing electricity consumption per hour; (4) Population growth level, measured by , representing the local fertility rate in the provincial region. are the coefficients of the explanatory variables, is the constant term, represents provincial fixed effects, represents time fixed effects, and is the residual term.
In Equation (2), represents the squared term of environmental regulation, which is used to describe the potential nonlinear relationship between provincial-level environmental regulation and carbon emissions. All other variables remain consistent with those in Equation (1).
3.1.2. Mediation Effect Model
To examine the mediating role of green innovation in the impact of environmental regulation on carbon emissions, the following mediation effect regression model is constructed:
In Equations (3)–(5), denotes the province, denotes the year. The industrial structure transformation is measured by , representing the provincial industrial structure advancement index. All other variables remain consistent with those in Equation (1).
3.1.3. Moderating Effect Model
To examine the moderating role of green innovation efficiency in the impact of environmental regulation on carbon emissions, the following moderating effect regression model is constructed:
In Equation (6), denotes the province, denotes the year. Green innovation efficiency is measured by , representing the green technology research and development productivity of each province. * represents multiplication, and represents the interaction term between and .All other variables remain consistent with those in Equation (1).
3.2. Data Sources and Descriptive Statistics
3.2.1. Explained Variable
Carbon emission levels constitute the explained variable. The estimation procedure adheres to the methodology prescribed by the IPCC, calculating carbon emissions from the combustion of eight fossil fuel types. The aggregate carbon emissions are computed by multiplying the consumption of each energy type by its corresponding emission factor and summing the products. represents the consumption of various types of energy, and represents their emission coefficients.The datasets are derived from the China Energy Statistical Yearbook [39], China Statistical Yearbook [40]. The calculation formula is presented below:
3.2.2. Core Explanatory Variables
Various methods exist for measuring environmental regulation. This study focuses specifically on market-based environmental regulation (MER). Considering data availability and completeness, we primarily construct two types of market-based environmental regulation indicators: investment incentive-oriented and tax supervision-oriented.
First, building upon the work of Han et al. (2016), this study utilizes the ratio of completed investment in industrial pollution control to the value-added of the secondary industry to proxy for investment incentive-oriented market environmental regulation [41]. Regarding city-level data, the completed investment in industrial pollution control is estimated by multiplying the provincial-level investment figure by the city’s share, wherein the share is ascertained by the ratio of the city’s industrial solid waste discharge to that of its province.
Second, Environmental Taxes and Fees (Reve). This paper comprehensively employs the logarithm of the sum of pollution discharge fees and environmental tax revenues divided by the number of enterprises to characterize tax supervision-oriented market environmental regulation. Following the approach of Song et al. (2022) and based on obtaining provincial-level data on pollution discharge fees and environmental taxes, adjustments are made [42]. Due to ongoing adjustments in the statistical caliber of environmental taxes and fees, the constructed time-series data for this indicator includes metrics such as pollution discharge fee revenue, total collected pollution discharge fees, pollution discharge fees entered into the treasury, and environmental tax revenue. The following adjustment strategy is adopted: the amount of pollution discharge fees entered into the treasury is adjusted according to the historical amounts recorded, while environmental tax revenue is adjusted using the first year of environmental tax implementation as an overlapping period. The data are sourced from the China Statistical Yearbook, China Insurance Yearbook, China Environment Yearbook, China Environmental Statistical Yearbook, provincial statistical yearbooks, and the National Bureau of Statistics database.
3.2.3. Mediating Variable
This paper adopts industrial structure transformation as the mediating variable. Reflecting the developmental traits of China’s contemporary stage, the degree of industrial structure advancement is utilized to quantify this transformation. The information technology revolution since the 1970s has deeply influenced the industrial structures of major industrialized nations, giving rise to a trend of “tertiarization” (transition towards a service-based economy). This trend aligns with the characteristics of industrial structure transformation in China’s current developmental phase and serves as a core driver for transitioning towards a technology-intensive and low-carbon service-oriented economic structure.
Following the technique of Gan et al. (2011), this study gauges industrial structure advancement using the ratio of the output value of the tertiary industry to that of the secondary industry [43]. This indicator plainly reveals the propensity of the economic structure toward servitization and unambiguously signals whether the industrial structure is advancing in a “service-oriented” direction. It not only captures internal structural optimization within the non-agricultural sectors but also underscores the inhibitory effect of a service-led economic transformation on carbon emissions: the energy consumption per unit output of the service sector is considerably lower than that of the industrial sector. Therefore, an increase in the servitization level directly curtails the scale of high-carbon activities. Concurrently, through knowledge spillover and technology diffusion effects, it boosts overall economic efficiency, thereby systematically lowering carbon emission intensity. Hence, this ratio represents a superior metric. An upward trajectory in this value signifies that the economy is advancing toward servitization and the industrial structure is undergoing upgrading. The data are sourced from the China Statistical Yearbook, China Social Statistical Yearbook, provincial statistical yearbooks, and the National Bureau of Statistics database.
3.2.4. Moderating Variable
Green innovation efficiency primarily reflects the ability of each province to utilize resources effectively for green innovation under market-based environmental regulations, thereby achieving emission reduction outcomes. This efficiency is most directly manifested in the productivity of green technology research and development (R&D) across provinces. Therefore, this paper employs a Slacks-Based Measure Data Envelopment Analysis (SBM-DEA) model to measure green technology R&D productivity in various regions of China. The measurement incorporates multiple dimensions, including human capital, capital, energy inputs, as well as technological, economic, and ecological benefits. Factors such as “innovation failure” and “environmental pollution” are treated as undesirable outputs and integrated into the evaluation framework for green technology R&D productivity.
Drawing upon the non-radial, non-angular SBM-DEA model founded on slack variables, as introduced by Tone (2001) [44], this research redefines the input and output indicators for regional innovation activities. It is measured from three perspectives: “R&D investment”, “innovation failure” and “environmental pollution”. The data are sourced from the China Statistical Yearbook, China Environment Yearbook, China Environmental Statistical Yearbook, provincial statistical yearbooks, and the National Bureau of Statistics database.
3.2.5. Control Variables
- (1)
- Production Scale: Carbon emissions are inherently a byproduct of economic activities. Following the scale effect theory, the expansion of economic scale is typically accompanied by increased energy consumption and carbon emissions. To control for the fundamental impact of the overall scale of economic activity on carbon emissions at the provincial level, this study selects provincial employment numbers as a proxy variable. Labor, as a core input factor in the production function, directly determines the level of economic activity and the corresponding total energy demand. Differences in provincial employment numbers reflect the spatial distribution characteristics of economic activity density and serve as an important structural factor influencing regional total carbon emissions.
- (2)
- Infrastructure Level: Infrastructure construction constitutes a vital component of capital stock, and its scale and structure profoundly shape a region’s energy consumption patterns and carbon emission pathways through the “lock-in effect.” Large-scale infrastructure development, particularly the expansion of energy-intensive industries, directly drives up contemporaneous carbon emissions. This study selects the proportion of provincial secondary industry value-added to GDP as a proxy for infrastructure level, primarily based on the following considerations: the secondary industry serves as the main carrier of infrastructure and the primary sector of energy consumption. Its scale largely reflects a region’s industrialization-oriented infrastructure development level, which aligns with China’s current developmental stage. This indicator effectively captures the rigid demand for energy consumption and helps control for carbon emission disparities arising from differences in developmental stages.
- (3)
- Energy Consumption Level: Final energy consumption, particularly fossil fuel combustion, constitutes the most direct source of carbon dioxide emissions. Controlling for the total scale of energy consumption is crucial for accurately identifying the emission reduction effects of environmental regulations. This study selects electricity consumption per hour as a proxy variable. This indicator directly measures the scale of final energy inputs required for the operation of the economic system. Given that electricity accounts for a significant and continuously growing share of China’s energy consumption, it effectively represents the overall energy consumption level.
- (4)
- Birth Rate: Demographic factors represent one of the fundamental long-term drivers influencing carbon emissions. This study introduces the birth rate to control for the long-term environmental impacts of demographic structure changes. The birth rate not only affects long-term total energy demand by altering the scale of future consumer populations (population scale effect) but also indirectly shapes long-term carbon emission trajectories by modifying current population age structures (e.g., youth dependency ratio), which influence societal consumption-saving patterns, labor supply, and energy consumption preferences. Controlling for this variable helps distinguish between the effects of environmental regulations and potential demographic transition effects.
All the above data were obtained from the China Statistical Yearbook, China Social Statistical Yearbook, provincial statistical yearbooks, and the National Bureau of Statistics database.
3.2.6. Descriptive Statistics
Table 1 presents the descriptive statistics of the main variables. As shown in the table, the mean value of carbon emissions in the sample is 19.258, with a standard deviation of 1.008, a minimum value of 15.695, and a maximum value of 20.887. The mean value of investment incentive-oriented market environmental regulation is 0.003, with a standard deviation of 0.003, a minimum value of 0, and a maximum value of 0.031. The mean value of tax supervision-oriented market environmental regulation is 2.941, with a standard deviation of 2.287, a minimum value of 0.161, and a maximum value of 17.321. The comparatively larger standard deviation of the tax supervision-oriented regulation indicates a higher degree of variability across observations. The distribution maps of these main variables are shown in Figure 1, Figures (a) and (b) respectively show the provincial carbon emission distribution in 2010 and 2023. Figures (c) and (d) respectively demonstrate the distribution of investment incentive-oriented market environmental regulation in 2010 and 2023. Figures (e) and (f) respectively demonstrate the distribution of tax regulatory environmental regulations in 2010 and 2023. Detailed descriptions of other variables are omitted here for brevity.

Table 1.
Variable Descriptive Statistics.
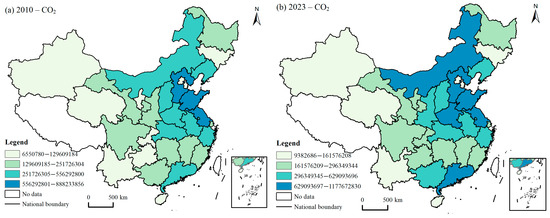
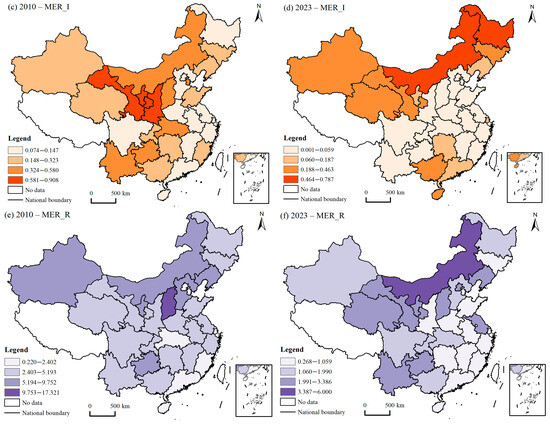
Figure 1.
Main variables distribution map of provinces in China.
4. Results Analysis
4.1. Results of OLS Regression
This study employs the OLS regression method to investigate the impact of market-based environmental regulations are categorized into investment incentive-oriented and tax supervision-oriented types. The regression results are presented in Table 2.
Table 2.
OLS Regression Results.
As evidenced in Column (1), investment incentive-oriented market-based environmental regulation imposes a statistically significant adverse effect on carbon emissions. After the inclusion of control variables and accounting for two-way fixed effects, its coefficient is estimated at −5.912, which is statistically significant at the 1% level. Correspondingly, Column (2) suggests that supervision-oriented market-based environmental regulation also manifests a significantly negative influence on carbon emissions, registering a coefficient of −0.500 under identical conditions, significant at the 1% level. These empirical results validate Hypothesis 1.
Pertaining to investment incentive-oriented regulations, government policies such as subsidies and tax incentives lower the cost of green innovation for enterprises, effectively counterbalancing the positive externalities of green technology R&D. This motivates firms to augment investment in clean technologies, ultimately facilitating a transition to low-carbon production processes. This observation corroborates the central argument of the Porter Hypothesis, indicating that well-designed incentive policies can balance environmental performance and economic performance through innovative compensation effects.
Conversely, supervision-oriented environmental regulations oblige enterprises to internalize environmental considerations into their production decisions by increasing the cost of pollution. This approach not only prompts high-emission firms to adopt end-of-pipe treatment technologies for short-term emission reduction but also forces innovation-capable enterprises to reduce compliance costs through process innovations or energy substitutions.
As shown in Column (3), the nonlinear relationship between investment incentive-oriented market-based environmental regulation and carbon emissions is confirmed. The quadratic term of this regulatory type (MER_I2) exhibits a coefficient of −211.334, significant at the 1% level. This denotes the presence of an inverted U-shaped nonlinear relationship between investment incentive-oriented regulation and carbon emissions. Column (4) uncovers the nonlinear relationship between tax supervision-oriented market-based environmental regulation and carbon emissions, where the quadratic term of this regulatory type (MER_R2) shows a coefficient of 0.001, also significant at the 1% level. This implies a U-shaped nonlinear relationship between tax supervision-oriented regulation and carbon emissions.
Regarding the “inverted U-shaped” relationship observed in investment incentive-oriented regulations, the mechanism lies in the changing marginal effects of regulatory intensity at different stages. In the initial phase of low intensity, policies such as environmental investment subsidies significantly reduce the marginal cost of green technological innovation for enterprises, effectively stimulating their innovative vitality. The resulting “innovation compensation” effect dominates the reduction in carbon emissions. However, when the incentive intensity exceeds a certain threshold, it may trigger resource misallocation in the market: on one hand, firms with low innovation efficiency may engage in “strategic innovation” or even expand high-carbon production capacity to obtain subsidies, leading to a “green paradox”; on the other hand, highly efficient innovators may allocate excess subsidy funds to expanding production scale rather than deepening innovation, where the carbon increment from output expansion could offset or even exceed the carbon reduction from technological progress, thus activating the “Jevons paradox.” Consequently, excessively high incentive intensity may instead undermine emission reduction efficiency.
Regarding the “U-shaped” relationship observed in tax supervision-oriented regulations, this finding appears inconsistent with previous studies that reported either U-shaped patterns or promoting effects. At moderate intensity levels, policies such as environmental taxes and pollution discharge fees effectively force enterprises to adopt short-term emission reduction measures—including end-of-pipe treatment, energy efficiency improvements, or fuel substitution—by increasing the marginal cost of carbon emissions. During this stage, the “cost constraint” effect dominates, leading to a continuous decline in carbon emissions.
However, when regulatory intensity exceeds a certain threshold, excessively high compliance costs crowd out productive investments and innovation resources, resulting in an “innovation crowding-out effect.” Faced with substantial cost pressures, enterprises rationally shift their strategies away from long-term green technology innovation toward paying fines or taxes to maintain existing high-carbon production, or they reduce R&D budgets and adhere to conventional high-carbon technological pathways. When firms are compelled to allocate significant resources to compliance expenditures due to pollution discharge fees, these non-productive investments divert funds that could otherwise be used for low-carbon technology R&D or process upgrades, creating a “resource curse of environmental policy.” Ultimately, this leads to stagnation in technological advancement and may even trigger a rebound in carbon emissions.
4.2. Robustness Checks
This study assesses the robustness of the model by incorporating additional control variables. The baseline regression results of the model are reported in columns (1) and (2) of Table 3. Meanwhile, the nonlinear relationship between environmental regulations and carbon emissions was also examined, as shown in columns (3) and (4) of Table 3. All the results are basically consistent with the OLS results, enhancing the stability of the model.
Table 3.
Robustness Test Results.
4.3. Endogeneity Tests
Although this investigation controlled for potential confounding variables during model specification and strengthened the reliability of the conclusions through a series of robustness tests, concerns persist regarding potential reverse causality between the intensity of market-based environmental regulations and carbon emission intensity, which could compromise the validity of the findings. To tackle this endogeneity issue, this paper applies a Generalized Method of Moments (GMM) model. The specific outcomes are presented in Table 4.
Table 4.
Endogeneity Tests.
The GMM (Generalized Method of Moments) method is particularly effective in verifying and addressing endogeneity issues, as it minimizes the deviation between sample moments and population moments by constructing moment conditions, and uses instrumental variables to isolate the correlation between explanatory variables and perturbation terms, thereby obtaining consistent estimates. Specifically, GMM assumes the existence of an exogenous instrumental variable Z that satisfies E [Z ‘ε] = 0, which can handle omitted variables, simultaneity, or dynamic endogeneity (such as lagged dependent variables in panel data), especially in dynamic panel models where internal lag tools automatically generate moments to improve estimation efficiency. When verifying endogeneity, the Hausman test can be used to compare OLS and GMM estimates, and internal diagnostics such as AR (1)/AR (2) and Hansen/Sargan can be used to indirectly confirm whether endogeneity has been alleviated. If the diagnosis is successful, it indicates that GMM has successfully corrected the bias. This method is more robust than Simple IV and is suitable for heteroscedastic or small sample scenarios. It is widely used for causal identification of endogeneity problems in empirical economic research. Therefore, this article added the GMM method for endogeneity testing, as shown in Table 4 (GMM). In the dynamic panel GMM estimation, the AR (2) test statistic is −1.480 and not significant, which supports the null hypothesis. This indicates that the exogeneity of lagged second-order and above variables as instrumental variables holds and satisfies the basic assumption of the Arellano Bond model. At the same time, the Hansen test statistic of 11.42 is not significant, which cannot reject the null hypothesis that all instrumental variables are valid. This indicates that the selected instrumental variables overall meet the exogeneity requirements, and the model estimates are consistent and have no significant bias. This result jointly verifies the robustness of the GMM setting and avoids potential endogeneity bias.
4.4. Channels and Mechanisms Analysis
4.4.1. Mediation Effect Analysis
To validate the mediating role of industrial structure upgrading in the impact of market-based environmental regulations on carbon emissions, a mediation model regression was conducted. Mediation effect analysis is chiefly employed to evaluate the role of a mediating variable (M) between an independent variable (X) and a dependent variable (Y), specifically investigating the indirect effect of X on Y through M. The Sobel test is a traditional method for testing mediation effects, evaluating the significance of the indirect effect through standardized path coefficients and standard errors. Its simplicity makes it suitable for preliminary verification of mediation. Goodman-1 and Goodman-2 are variants of the Sobel test, primarily used to adjust for bias or correct estimations in path coefficients. The Bootstrap test is a commonly used method in modern mediation analysis, which estimates the distribution of the indirect effect through repeated sampling.
The core task of mediation testing is to confirm whether the independent variable indirectly affects the dependent variable through the mediator. Different testing methods provide multi-level verification. Employing diverse tests enhances the robustness of the conclusions, particularly under varying sample sizes and data distributions. These tests help researchers determine the significance of the mediation effect and evaluate the magnitude of the mediator’s role in the pathway. Using different methods to verify the mediation effect avoids potential biases in the model and ensures the accuracy of the path analysis.
Therefore, this study conducted these mediation tests. The specific results are presented in Table 5. Industrial structure transformation under investment incentive-oriented market environmental regulation passed all tests. In contrast, industrial structure transformation under tax supervision-oriented market environmental regulation did not pass the direct effect test of the Bootstrap method, indicating that tax supervision-oriented market environmental regulation likely affects carbon emissions through the complete mediation effect of industrial structure transformation.
Table 5.
Mediation Effect Tests.
The mediating role of industrial structure upgrading in the process through which environmental regulation affects carbon emissions was analyzed using mediation effect tests. The specific results are presented in Table 6.
Table 6.
Results of the Mediating Effect.
Based on the empirical results, both investment incentive-oriented and supervision-oriented market-based environmental regulations can markedly suppress carbon emissions through the critical channel of promoting industrial structure upgrading, as evidenced by the regression results in Table 6. Specifically, the coefficient for the impact of investment incentive-oriented market environmental regulation on industrial structure advancement is 11.853, significant at the 1% level, denoting its significant promotive effect on industrial advancement. The coefficient for the impact of industrial structure advancement on carbon emissions in this pathway is −0.118, significant at the 1% level, demonstrating that industrial advancement significantly curbs carbon emissions. Thus, investment incentive-oriented market environmental regulation can restrain carbon emissions through the mediating effect of industrial structure advancement. The coefficient for the impact of tax supervision-oriented market environmental regulation on industrial structure advancement is 0.062, significant at the 1% level, indicating that this regulatory type can significantly improve industrial advancement. The coefficient for the impact of industrial structure advancement on carbon emissions is −0.120, also significant at the 1% level, showing that industrial advancement significantly inhibits carbon emissions. It is particularly noteworthy that the direct effect of tax supervision-oriented environmental regulation on carbon emissions is not significant in this model, pointing to a case of complete mediation.
Although both types of market-based environmental regulations can suppress carbon emissions through the mediating effect of industrial structure advancement, their transmission pathways differ significantly. As a market-based coercive mechanism, tax supervision-oriented environmental regulation operates through a complete mediation effect of industrial upgrading. Its core advantages lie in the strong certainty of the emission reduction pathway and the Pareto improvement in resource allocation. As a price-based instrument, pollution discharge fees internalize the cost of carbon emissions, creating a stable and predictable market signal. This ensures that the exit of high-carbon industries and the expansion of low-carbon industries become the sole transmission channel for emission reduction, avoiding the implementation biases potentially associated with other policies. Simultaneously, it leverages market competition to trigger “creative destruction” automatically screening and eliminating marginal high-carbon firms and reallocating production factors to high-productivity, low-carbon sectors, thereby achieving strict synchronization between industrial structure optimization and emission reduction at the macro level.
However, this pathway also exhibits significant drawbacks. First, the rigidity of transition costs may undermine policy effectiveness. Faced with substantial sunk costs and technological transition barriers—especially for firms with high asset specificity—the rational choice based on cost considerations may be to pay pollution fees rather than pursue green transformation. This can lead to a mere shift rather than a fundamental reduction in carbon emissions, potentially even resulting in increased emissions in the long run. Second, the lack of innovation incentives poses a long-term risk. According to Acemoglu’s theory of directed technical change [45], the direction of technological evolution is driven by relative profitability. As a pure cost-constraint tool, the pollution discharge fee, while forcing resources towards existing low-carbon industries, fails to effectively incentivize long-term R&D investment in disruptive green technologies within incumbent high-carbon industries. High-carbon producers under exit pressure lack the motivation to innovate, while emerging low-carbon producers tend to adopt mature technologies for quick returns. This ultimately locks the low-carbon technological pathway into existing paradigms, inhibiting the dynamic technological progress required for deep decarbonization.
4.4.2. Moderating Effect Analysis
This study utilizes a moderated regression model, centralizing both the core explanatory variables and the moderating variable. The findings are presented in Table 7. Among them, GE×MER_I and GE×MER_R represent the interaction terms between the core explanatory variable and the moderating variable.
Table 7.
Results of the Moderating Effect.
Column (1) illustrates the moderating effect of green innovation efficiency on the impact of investment incentive-oriented market environmental regulation on carbon emissions. In this process, the coefficient for investment incentive-oriented regulation is −2.988, significant at the 5% level. The coefficient for the interaction term between green innovation efficiency and investment incentive-oriented regulation is 10.716, significant at the 1% level. This indicates that green innovation efficiency exerts a significant negative moderating effect on the relationship between investment incentive-oriented regulation and carbon emissions.
From Column (2), which represents the moderating effect of green innovation efficiency on the impact of tax supervision-oriented market environmental regulation on carbon emissions, the coefficient for tax supervision-oriented regulation is −0.012, significant at the 1% level. The coefficient for the interaction term between green innovation efficiency and tax supervision-oriented regulation is −0.011, significant at the 5% level. This indicates that green innovation efficiency exerts a significant positive moderating effect on the relationship between tax supervision-oriented regulation and carbon emissions.
How should the differential moderating effects of green innovation efficiency on the two types of market-based environmental regulations be explained? From the perspective of investment incentive-oriented market environmental regulation, green innovation efficiency exerts a negative moderating effect. This means that the higher the green innovation efficiency, the weaker the inhibitory effect of investment incentive-oriented market environmental regulation on carbon emissions. In regions with high green innovation efficiency, market mechanisms are more developed, and the capacity to identify and seize market opportunities and optimize resource allocation is stronger. Consequently, their innovative activities can more easily obtain innovation compensation from the market. In this context, if they continue to receive substantial environmental investments and subsidies, rather than allocating these additional policy resources to high-risk, long-cycle breakthrough green technology innovations, they are more inclined to rely on existing technologies and pathways to expand their production scale.
In this scenario, although existing innovations can reduce carbon emissions to some extent, the investment incentive-oriented environmental regulation further stimulates an increase in their total output. If the magnitude of total output growth exceeds the rate of decrease in unit emissions, the total carbon emissions may instead rise. This phenomenon, resulting from resource misallocation, is the so-called “Jevons Paradox,” where improved efficiency paradoxically leads to an increase in total consumption.
From the perspective of tax supervision-oriented market environmental regulation, provinces with high innovation efficiency can transform regulatory pressure into motivation for “directed innovation,” rapidly developing applicable technologies tailored to local emission reduction needs. In this context, high-efficiency regions possess more robust innovation networks and lower marginal R&D costs, enabling them to achieve greater emission reductions at a lower cost when responding to price-based instruments like carbon taxes. In contrast, less efficient market actors may struggle to obtain sufficient innovation compensation through their innovative activities, resulting in poorer emission reduction outcomes. As tax supervision-oriented market environmental regulation carries a degree of coerciveness, this “pressure-capability” matching effect is further amplified within a strict and predictable regulatory environment. This mechanism corrects resource misallocation in the market and establishes a positive feedback loop characterized by “regulation strengthening innovation, and innovation enhancing the efficiency of emission reduction.”
From a long-term perspective, this pathway also helps explain the nonlinear relationship between the two types of market-based environmental regulations and carbon emissions: For investment incentive-oriented market environmental regulation, the initial resource misallocation may lead to an increase in carbon emissions. However, as the intensity of this type of regulation continues to rise, the marginal returns from further expanding production scale will diminish, while the benefits of engaging in green innovation activities will increase. For long-term development, the emission reduction effects of technological advancements will eventually outweigh the marginal gains from scale expansion. Consequently, a greater proportion of environmental investments will be allocated to substantive green innovation activities, thereby generating a suppressive effect on carbon emissions. Although tax supervision-oriented market environmental regulation suppresses emissions through cost constraints, as its intensity increases, even regions with high innovation efficiency may find it difficult to sustain innovation activities solely through the benefits obtained from innovation compensation. In this scenario, market entities are more inclined to adopt path-dependent coping strategies, such as excessive investment in energy-intensive end-of-pipe treatment technologies. These technologies themselves may rely on traditional energy sources, leading to an increase in indirect carbon emissions. Simultaneously, continuous compliance expenditures weaken the R&D investment capacity of regions with lower innovation efficiency, creating an “innovation crowding-out effect”—where higher environmental compliance costs drive a tendency to reduce exploratory innovation in favor of relying on mature yet carbon-intensive technological lock-ins. This ultimately results in increased rather than decreased carbon emissions at the provincial level.
5. Further Discussion
5.1. Analysis of Spatial Spillover Effects
When studying the impact of environmental regulation on carbon emissions, this effect may exhibit significant mutual influence across geographical space. For instance, government-led “race to the bottom” competition and the “pollution haven hypothesis” are potential manifestations.
To examine the spatial impact of market-based environmental regulations on carbon emissions, this paper constructs a Spatial Durbin Model (SDM), as shown in Equation (5):
In the equation, denotes the spatial autoregressive coefficient; represents the coefficient of the spatial interaction term; corresponds to the spatial weight matrix; and encompasses the same set of control variables as previously defined.
5.2. Moran’s I
Prior to developing spatial models, Moran’s I indices for both the carbon emission index and the market-based environmental regulation index were computed using a spatial weight matrix based on geographical distance. As shown in Table 8, Moran’s I for carbon emissions is statistically significant during the period from 2014 to 2021, and Moran’s I for environmental regulation is significant in most years. Thus, the construction of spatial models is empirically justified.
Table 8.
Moran’s I.
As shown in Table 8, from 2010 to 2023, Moran’s I values for carbon emissions fluctuated between 0.078 and 0.094, with the vast majority of years showing significance at the 1% level, indicating significant spatial autocorrelation characteristics of carbon emissions. Moran’s I values for investment incentive-oriented market-based environmental regulation ranged from 0.012 to 0.298, with the vast majority of years significant at the 1% level, demonstrating significant spatial autocorrelation. Moran’s I values for tax supervision-oriented market-based environmental regulation varied between 0.01932 and 0.346, with all years significant at the 1% level, confirming its pronounced spatial autocorrelation features.
The regression results are presented in Table 9. Columns (1) and (2) depict the spatial effects of investment incentive-oriented market-based environmental regulation. The direct effects (main effects) in the Spatial Durbin Model are consistent with the OLS regression results, indicating a statistically significant negative correlation between the enhancement of investment incentive-oriented regulation and carbon emissions, with a coefficient of −4.480, significant at the 1% level. This suggests that increasing the level of investment incentive-oriented market-based environmental regulation contributes to reducing carbon emissions. Simultaneously, the results in column (2) show that the spatial spillover effect (Wx) also indicates that the enhancement of investment incentive-oriented regulation suppresses carbon emissions in neighboring areas, with a coefficient of −7.779, significant at the 1% level.
Table 9.
Results of Spatial Durbin Model.
Columns (3) and (4) represent the spatial effects of tax supervision-oriented market-based environmental regulation. The direct effects (main effects) in the Spatial Durbin Model align with the OLS regression results, demonstrating a statistically significant negative correlation between the enhancement of tax supervision-oriented regulation and carbon emissions, with a coefficient of −0.002, significant at the 1% level. This indicates that increasing the level of tax supervision-oriented market-based environmental regulation helps reduce carbon emissions. Furthermore, the results in column (4) reveal that the spatial spillover effect (Wx) also shows that the enhancement of tax supervision-oriented regulation inhibits carbon emissions in neighboring regions, with a coefficient of −0.012, significant at the 10% level.
Market-based environmental regulations do not generate effects such as a “race to the bottom” or “pollution haven effect,” which may be attributed to the inherent advantages of such market-based mechanisms compared to direct government mandates, thereby leading to these observed spatial spillover outcomes: firstly, the gradual formation of a unified market, where market-based environmental regulations grant market entities greater autonomy in decision-making, and since this competition is primarily driven by market mechanisms, coupled with the continuous improvement of China’s unified national market, entities operating in an environment characterized by the free flow of factors of production are more inclined to pursue innovation and upgrading rather than engaging in locational arbitrage; secondly, the spillover of low-carbon technologies through market activities, as emphasized by endogenous growth theory, knowledge is non-rivalrous, and within market activities, provinces with stringent environmental regulations may take the lead in developing low-carbon technologies, which then spill over to neighboring provinces through channels such as industrial chain linkages, human capital mobility, and innovation demonstration effects; thirdly, the emergence of a market-led “race to the top,” where compared to directly mandated government environmental regulations, the public can more directly influence market-based environmental regulations, and as public demand for “green” products in the market increases alongside rising environmental concerns, the political space for government-led “race to the bottom” strategies is continually diminished, giving rise to a market-driven “race to the top.”
6. Conclusions
This study investigates the impact of heterogeneous market-based environmental regulations—categorized as investment incentive-oriented and tax supervision-oriented—on carbon emissions using panel data from 30 Chinese provinces (2010–2023) analyzed via OLS and spatial effect models. The results indicate that both types generally suppress emissions, albeit through distinct nonlinear pathways: an inverted U-shaped relationship for investment-oriented regulation, attributed to the “green paradox” from resource misallocation, and a U-shaped curve for tax-oriented regulation, due to innovation crowding-out effects. Industrial structure advancement serves as a significant mediator—exhibiting complete mediation for tax-oriented measures and partial mediation for investment-oriented ones, reflecting the former’s structural rigidity. Moreover, green innovation efficiency moderates these relationships, with Jevons Paradox providing explanatory insight into their nonlinearity. Importantly, both regulation types demonstrate negative spatial spillover effects, countering the “race to the bottom” hypothesis and underscoring the efficacy of market-based instruments within China’s unified market framework.
6.1. Policy Recommendations
Building upon the above research conclusions, the following recommendations are proposed:
- (1)
- Focus on the emission reduction effects of heterogeneous market-based environmental regulations and improve the toolkit of market-oriented environmental regulatory policies. To prevent the deterioration of carbon emissions due to environmental regulations caused by imperfect systems, it is necessary to strengthen the service function of policies for market mechanisms, improve the green financial system, unify credit evaluation standards, and innovate financial products and services. Integrate policy tools and give full play to the decisive role of the market mechanism in resource allocation.
- (2)
- Refine the “Buffer-Compensation-Orientation” logical framework of environmental regulations to leverage the synergistic effects of industrial transformation and green emission reduction. First, implement a tiered carbon pricing mechanism to provide a transition window for high-carbon enterprises, alleviating the impact of sunk costs caused by asset specificity and avoiding the “pay-to-pollute rather than transform” lock-in trap. Simultaneously, introduce innovation-oriented supplementary policies, such as R&D tax credits and industrialization subsidies for disruptive low-carbon technologies, to correct the distortion of technological direction by purely price-based tools. This will incentivize enterprises to shift resources from passive compliance to active innovation, ensuring both the efficiency of industrial structure upgrading in emission reduction and fostering endogenous momentum for long-term deep decarbonization.
- (3)
- Strengthen the green innovation protection mechanism to ensure innovation efficiency. Research shows that the efficiency of green innovation has heterogeneous effects on different environmental regulations. Therefore, it is suggested to improve the market innovation protection mechanism, ensure the allocation efficiency of innovation resources, supervise the flow of innovation funds, prevent the “greenwashing” behavior in the market, and implement differentiated policies for enterprises with different innovation capabilities.
- (4)
- Accelerate the construction of a unified market to leverage market advantages. This study demonstrates that market-based environmental regulations have positive spatial spillover effects on carbon reduction in neighboring regions, as market entities in a unified market with free factor mobility are more inclined to choose innovation and upgrading rather than locational arbitrage. Therefore, it is recommended to expand the coverage of carbon markets, improve price formation mechanisms, diversify trading products, and accelerate the refinement of the carbon emission trading system to ensure the uniformity and consistency of market policies.
6.2. Research Limitations and Future Prospects
Although this study has made certain progress in theoretical and empirical analysis, several limitations remain. Future research could be further deepened in the following aspects:
- (1)
- Data granularity. This study is based on provincial-level panel data and does not delve into enterprise or industry-level analysis. Future research could integrate micro-level enterprise data to further reveal the differential impact mechanisms of environmental regulations on carbon emissions behavior across heterogeneous firms.
- (2)
- Temporal coverage of the sample. The sample in this study concludes in 2023 and does not fully encapsulate the most recent developments following the comprehensive implementation of the “Dual Carbon” policy. Future studies could track longer-term data to evaluate policy continuity and dynamic adjustment effects.
- (3)
- Lack of international comparison. This study focuses on Chinese provincial data and lacks comparative analysis with other countries or regions. As carbon emission markets become increasingly standardized and unified globally, cross-national comparative research could be conducted to explore the similarities, differences, and applicability conditions of market-based environmental regulations under different institutional contexts.
Author Contributions
Conceptualization, Z.L.; methodology, Z.L.; software, Z.L., Y.C.; validation, Z.L., Y.C. and M.G.; formal analysis, Z.L.; investigation, Z.L., M.G.; resources, Z.L.; data curation, Z.L.; writing—original draft preparation, Z.L.; writing—review and editing, Z.L.; visualization, Z.L., Y.C.; supervision, Z.L., M.G.; project administration, Z.L.; funding acquisition, Y.C. All authors have read and agreed to the published version of the manuscript.
Funding
This research was funded by The Scientific Research Fund of Yunnan Provincial Department of Education for the year 2024, grant number [2024Y084].
Institutional Review Board Statement
Not applicable.
Informed Consent Statement
Not applicable.
Data Availability Statement
The data presented in this study are available on request from the corresponding author.
Conflicts of Interest
The authors declare no conflict of interest.
Appendix A
Hypothesis
| Hypothesis 1 | Market-based environmental regulations inhibit carbon emissions, and a nonlinear relationship may exist between market-based environmental regulations and carbon emissions. |
| Hypothesis 2 | Market-based environmental regulations modulate the carbon emission effect through industrial structure upgrading. |
| Hypothesis 3a | Investment incentive-oriented market environmental regulation exerts a negative moderating effect on carbon emissions through the influence of green innovation efficiency. |
| Hypothesis 3b | Tax supervision-oriented market environmental regulation exerts a positive moderating effect on carbon emissions through the influence of green innovation efficiency. |
References
- Mi, Z.; Zheng, J.; Meng, J.; Ou, J.; Hubacek, K.; Liu, Z.; Coffman, D.; Stern, N.; Liang, S.; Wei, Y.-M. Economic development and converging household carbon footprints in China. Nat. Sustain. 2020, 3, 529–537. [Google Scholar] [CrossRef]
- Pan, L.; Han, W.; Li, Y.; Wu, H. Legitimacy or efficiency? Carbon emissions transfers under the pressure of environmental law enforcement. J. Clean. Prod. 2022, 365, 132766. [Google Scholar] [CrossRef]
- Sanstad, A.H. Abating Carbon Dioxide Emissions from Electric Power Generation: Model Uncertainty and Regulatory Epistemology. J. Leg. Stud. 2015, 44, S423–S445. [Google Scholar] [CrossRef]
- Brunel, C.; Johnson, E.P. Two birds, one stone? Local pollution regulation and greenhouse gas emissions. Energy Econ. 2019, 78, 1–12. [Google Scholar] [CrossRef]
- Chang, Y.-T.; Zhang, N. Environmental efficiency of transportation sectors in China and Korea. Marit. Econ. Logist. 2017, 19, 68–93. [Google Scholar] [CrossRef]
- Li, M.; Gao, X. Implementation of enterprises’ green technology innovation under market-based environmental regulation: An evolutionary game approach. J. Environ. Manag. 2022, 308, 114570. [Google Scholar] [CrossRef] [PubMed]
- Song, W.; Han, X. Heterogeneous two-sided effects of different types of environmental regulations on carbon productivity in China. Sci. Total. Environ. 2022, 841, 156769. [Google Scholar] [CrossRef] [PubMed]
- Luo, Y.; Salman, M.; Lu, Z. Heterogeneous impacts of environmental regulations and foreign direct investment on green innovation across different regions in China. Sci. Total Environ. 2021, 759, 143744. [Google Scholar] [CrossRef]
- Porter, M.E. America’s green strategy. Sci. Am. 1991, 264, 168. [Google Scholar] [CrossRef]
- Ghosal, V.; Stephan, A.; Weiss, J.F. Decentralized environmental regulations and plant-level productivity. Bus. Strat. Environ. 2019, 28, 998–1011. [Google Scholar] [CrossRef]
- Lyu, H.; Ma, C.; Arash, F. Government innovation subsidies, green technology innovation and carbon intensity of industrial firms. J. Environ. Manag. 2024, 369, 122274. [Google Scholar] [CrossRef]
- Yuan, B.; Ren, S.; Chen, X. Can environmental regulation promote the coordinated development of economy and environment in China’s manufacturing industry?—A panel data analysis of 28 sub-sectors. J. Clean. Prod. 2017, 149, 11–24. [Google Scholar] [CrossRef]
- Jaffe, A.B.; Palmer, K. Environmental Regulation and Innovation: A Panel Data Study. Rev. Econ. Stat. 1997, 79, 610–619. [Google Scholar] [CrossRef]
- Jaffe, A.B.; Newell, R.G.; Stavins, R.N. A Tale of Two Market Failures: Technology and Environmental Policy. Ecol. Econ. 2005, 54, 164–174. [Google Scholar] [CrossRef]
- Popp, D.; Newell, R.G.; Jaffe, A.B. Chapter 21—Energy, the Environment, and Technological Change. In Handbook of the Economics of Innovation; Elsevier: New York, NY, USA, 2010. [Google Scholar]
- Sinn, H.W. Public Policies Against Global Warming: A Supply Side Approach; International Tax & Public Finance: Magdeburg, Germany, 2008. [Google Scholar]
- Pigou, A.C. The Economics of Welfare, 4th ed.; Macmillan and Co., Ltd.: London, UK, 1932. [Google Scholar]
- Zheng, D.; Shi, M. Multiple environmental policies and pollution haven hypothesis: Evidence from China’s polluting industries. J. Cleanr Prod. 2017, 141, 295–304. [Google Scholar] [CrossRef]
- Ahmed, K. Environmental policy stringency, related technological change and emissions inventory in 20 OECD countries—ScienceDirect. J. Environ. Manag. 2020, 274, 111209. [Google Scholar] [CrossRef]
- Samour, A.; Musah, M.; Mati, S.; Amri, F. Testing the impact of environmental taxation and IFRS adoption on consumption-based carbon in European countries. Environ. Sci. Pollut. Res. 2024, 31, 34896–34909. [Google Scholar] [CrossRef]
- Gollop, F.M.; Roberts, M.J. Environmental Regulations and Productivity Growth: The Case of Fossil-fueled Electric Power Generation. J. Politi-Econ. 1983, 91, 654–674. [Google Scholar] [CrossRef]
- Gray, W.B. The cost of regulation: OSHA, EPA and the productivity slowdown. Am. Econ. Rev. 1987, 77, 998–1006. [Google Scholar]
- Van der Ploeg, F.; Maria, C.D. Imperfect Environmental Policy and Polluting Emissions: The Green Paradox and Beyond. Int. Rev. Environ. Resour. Econ. 2012, 6, 153–194. [Google Scholar] [CrossRef]
- Van der Ploeg, F.; Withagen, C. Is there really a green paradox? J. Environ. Econ. Manag. 2012, 64, 342–363. [Google Scholar] [CrossRef]
- Zhang, H.; Wei, X.P. Green Paradox or Forced Emission-reduction: Dual Effect of Environmental Regulation on Carbon Emissions. J. China Popul. Resour. Environ. 2014, 24, 9. [Google Scholar]
- Chen, Y.; Fan, X.; Zhou, Q. An Inverted-U Impact of Environmental Regulations on Carbon Emissions in China’s Iron and Steel Industry: Mechanisms of Synergy and Innovation Effects. Sustainability 2020, 12, 1038. [Google Scholar] [CrossRef]
- Yuan, B.; Li, C. Innovation-driven Chinese industrial green total factor productivity under environmental regulation. Ind. Econ. Res. 2018, 5, 101–113. [Google Scholar]
- Danish; Ulucak, R.; Khan, S.U.; Baloch, M.A.; Li, N. Mitigation pathways toward sustainable development: Is there any trade-ff between environmental regulation and carbon emissions reduction? Sustain. Dev. 2019, 28, 813–822. [Google Scholar] [CrossRef]
- Albulescu, C.T.; Artene, A.E.; Luminosu, C.T.; Tămășilă, M. CO2 emissions, renewable energy, and environmental regulations in the EU countries. Environ. Sci. Pollut. Res. 2019, 27, 33615–33635. [Google Scholar] [CrossRef]
- Cherney, H.; Srinivasan, T.N. Handbook of Development Economics; Elsevier: Amsterdam, The Netherlands, 1988. [Google Scholar]
- Zhang, Y.; Liu, Z.; Zhang, H. The impact of economic growth, industrial structure and urbanization on carbon emission intensity in China. Nat. Hazards 2014, 73, 579–595. [Google Scholar] [CrossRef]
- Hu, Y.; Ren, S.; Wang, Y. Can carbon emission trading scheme achieve energy conservation and emission reduction? Evidence from the industrial sector in China. Energy Econ. 2020, 85, 104590. [Google Scholar] [CrossRef]
- Yin, J.; Zheng, M.; Chen, J. The effects of environmental regulation and technical progress on CO2 Kuznets curve: An evidence from China. Energy Policy 2015, 77, 97–108. [Google Scholar] [CrossRef]
- Yuan, H.; Feng, Y.; Lee, C.-C.; Cen, Y. How does manufacturing agglomeration affect green economic efficiency? Energy Econ. 2020, 92, 104944. [Google Scholar] [CrossRef]
- Cai, J.; Zheng, H.; Vardanyan, M.; Yang, S. Achieving Carbon Neutrality Through Green Technological Progress: Evidence from China. Energy Policy 2023, 173, 113397. [Google Scholar] [CrossRef]
- Lee, K.H.; Min, B. Green R&D for eco-innovation and its impact on carbon emissions and firm performance. J. Clean. Prod. 2015, 108, 534–542. [Google Scholar] [CrossRef]
- Yuan, B.; Xiang, Q. Environmental regulation, industrial innovation and green development of Chinese manufacturing: Based on an extended CDM model. J. Clean. Prod. 2018, 176, 895–908. [Google Scholar] [CrossRef]
- Chen, Z.; Zhang, X.; Chen, F. Do carbon emission trading schemes stimulate green innovation in enterprises? Evidence from China. Technol. Forecast. Soc. Chang. 2021, 168, 120744. [Google Scholar] [CrossRef]
- National Bureau of Statistics of China. China Energy Statistical Yearbook 2010–2023. Available online: https://www.chinayearbooks.com/china-energy-statistical-yearbook-2022.html (accessed on 10 June 2025).
- National Bureau of Statistics of China. China Statistical Yearbook 2010–2023. Available online: https://www.stats.gov.cn/english/ (accessed on 10 June 2025).
- Han, C.; Zhang, W.; Shan, S. Regulatory Governance, Public Demands and Environmental Pollution: An Empirical Analysis Based on the Interaction of Environmental Governance Strategies among Regions. Financ. Trade Econ. 2016, 9, 144–161. [Google Scholar] [CrossRef]
- Song, P.; Zhu, Q.; Zhang, H. Interaction of Environmental Regulation Implementation and Pollution Control in Urban Agglomerations. China Popul. Resour. Environ. 2022, 32, 49–61. [Google Scholar]
- Gan, C.; Zheng, R.; Yu, F. The Impact of China’s Industrial Structure Transformation on Economic Growth and Fluctuation. Econ. Res. J. 2011, 46, 4–16+31. [Google Scholar]
- Tone, K. A slacks-based measure of efficiency in data envelopment analysis. Eur. J. Oper. Res. 2001, 130, 498–509. [Google Scholar] [CrossRef]
- Acemoglu, D.; Aghion, P.; Bursztyn, L. The Environment and Directed Technical Change. Am. Econ. Rev. 2012, 102, 131–166. [Google Scholar] [CrossRef]
Disclaimer/Publisher’s Note: The statements, opinions and data contained in all publications are solely those of the individual author(s) and contributor(s) and not of MDPI and/or the editor(s). MDPI and/or the editor(s) disclaim responsibility for any injury to people or property resulting from any ideas, methods, instructions or products referred to in the content. |
© 2025 by the authors. Licensee MDPI, Basel, Switzerland. This article is an open access article distributed under the terms and conditions of the Creative Commons Attribution (CC BY) license (https://creativecommons.org/licenses/by/4.0/).