2. State of the Art
Intelligent Transportation Systems (ITS) are designed to improve the efficiency, safety, and sustainability of transportation networks through the integration of advanced technologies such as sensors, communication networks, and data analytics. A key element of ITS is LoRaWAN technology, which supports long-distance, low-power communication between IoT devices, contributing to reduced energy consumption and carbon emissions in transportation applications such as traffic management and logistics optimization. The low energy consumption of LoRaWAN devices decreases the need for frequent battery replacement, which limits electronic waste and supports the circular economy. However, the growing connectivity in ITS exposes them to various cybersecurity threats, among which Distributed Denial of Service (DDoS) attacks are particularly problematic, as they can increase the energy consumption of systems and disrupt their operation, undermining sustainable development goals [
2]. Research shows that vulnerabilities in the LoRaWAN network-joining procedure can be exploited to carry out DDoS attacks, disconnecting devices from the network and increasing energy consumption, which negatively affects the energy efficiency and sustainability of systems [
4,
5]. Existing DDoS detection and mitigation strategies in ITS often rely on traditional methods, such as signature-based or anomaly-based detection. Recent studies highlight the growing importance of deep learning in anomaly detection in low-power systems like LoRaWAN. For instance, Pan et al. [
6] proposed a hybrid framework combining Markov models with deep learning for traffic flow estimation and prediction in ITS, demonstrating improved accuracy in dynamic environments. Similarly, Li et al. [
7] introduced an enhanced spatio-temporal method based on impedance matrices for network traffic prediction, addressing challenges in urban transportation networks. However, these methods may struggle to keep pace with the evolving nature of cyber threats, particularly in dynamic transportation environments where traffic patterns may vary significantly. Machine Learning (ML) offers a more adaptive approach, enabling the analysis of complex data patterns and effective detection of DDoS attacks, thus supporting the reliability and sustainability of transportation systems. ML models can classify network traffic as normal or malicious based on features extracted from data, offering higher accuracy and adaptability compared to traditional methods [
8,
9]. Commonly used ML algorithms for DDoS detection include supervised learning techniques such as Support Vector Machines (SVM), Random Forest, Gradient Boosting, and neural networks, as well as unsupervised methods such as clustering and autoencoders [
10]. These algorithms can be trained on labeled datasets to recognize patterns associated with DDoS attacks, enabling real-time detection in operational environments. A significant challenge in developing ML models for cybersecurity, including DDoS detection, is the lack of real-world network data. Privacy restrictions, data ownership issues, and the sensitivity of cybersecurity data often limit access to comprehensive datasets [
11]. To overcome these limitations, synthetic data generation techniques are increasingly used. Synthetic data is artificially generated datasets that mimic the statistical properties and patterns of real data. In cybersecurity, synthetic data can be used to simulate various attack scenarios, providing a controlled environment for training and testing ML models without relying on real, sensitive data [
12,
13]. Generative models, such as Generative Adversarial Networks (GANs) and Variational Autoencoders (VAEs), are often employed to create synthetic data that closely resemble real datasets [
14]. There are many studies that apply ML techniques for detecting DDoS attacks in ITS and related fields. In [
15], the authors proposed a real-time DDoS detection method for ITS using reinforcement learning, achieving high detection rates with low false alarm rates. This approach differs from traditional supervised learning methods, as it learns optimal detection policies through interaction with the environment, which may be more suitable for dynamic systems such as ITS. In [
16], the authors conducted a comprehensive review of DDoS detection in IoT-based networks using ML models, highlighting the effectiveness of various algorithms while identifying research gaps and future directions. This review provides a broad overview, demonstrating the diversity of ML approaches applied in DDoS detection. Most detection methods do not focus on the specific features of LoRaWAN networks, which motivated the authors of this paper to present a holistic approach to threat detection in networks supporting IoT device communication.
Intelligent transportation systems (ITS) leverage advanced technologies such as LoRaWAN, which support energy-efficient IoT communication, as confirmed by studies. In the context of cybersecurity, DDoS attack detection methods are evolving, encompassing both traditional techniques and machine learning. Recent work, such as [
17], suggest the use of neural networks and deep learning for anomaly detection in low-power IoT systems. Our proposed approach based on synthetic data and ML algorithms (Gradient Boosting, Random Forest, SVM, XGBoost) could be enhanced with these techniques, potentially improving detection effectiveness in more complex real-world scenarios.
In the context of ITS and IoT, DDoS attack detection encompasses various approaches. Traditional signature-based methods, such as those described in [
18] proposing a rule-based system for IoT networks), are effective against known attacks but fail with novel threats. Anomaly-based methods using machine learning, such as SVM and k-NN [
19] applying SVM for anomaly detection in ITS network traffic), offer greater flexibility, though they require large training datasets. Recent studies, such as [
17] utilizing deep learning for anomaly detection in low-power systems like LoRaWAN) and [
20] proposing convolutional neural networks for IoT), highlight the growing importance of deep learning in this field. Additionally, [
21] analyzing the impact of DDoS on ITS in urban settings) underscores the need to adapt methods to the specific traffic patterns in ITS. Our approach, based on synthetic data and algorithms including Gradient Boosting, Random Forest, SVM, and XGBoost, differs from these methods by enabling the generation of diverse attack scenarios in a controlled environment, preparing the models for real-world ITS conditions. In the context of ITS and IoT, DDoS attack detection encompasses various approaches. Traditional signature-based methods, as described in [
18], are effective against known attacks but fail with novel threats. Anomaly-based methods using machine learning, such as SVM and k-NN [
19], offer greater flexibility, though they require large training datasets. Recent studies, highlight the growing importance of deep learning (DL) in anomaly detection in low-power systems. However, DL models, such as convolutional neural networks, are often complex and require significant computational power [
20]. Similarly, GAN-based data generation enables realistic dataset creation but is resource-intensive and prone to errors in simulating complex attack scenarios [
21]. Our approach, based on synthetic data generated through random distribution parameters and algorithms including Gradient Boosting, Random Forest, SVM, and XGBoost, stands out for its innovativeness: it is simpler and less resource-intensive than GAN or DL, enabling rapid simulation of diverse DDoS attacks in a controlled LoRaWAN environment, which ensures higher interpretability and sustainable energy consumption in ITS.
3. DDoS Attack Detection Model in IoT Networks Based on LoRaWAN Using Machine Learning Algorithms
This article utilizes four machine learning algorithms: Gradient Boosting, Random Forest, SVM, and XGBoost, implemented using the scikit-learn and XGBoost libraries. The selection of these models was based on their proven effectiveness in anomaly classification tasks in IoT networks, as supported by studies [
19]. Gradient Boosting and XGBoost were chosen for their ability to handle high-dimensional data, Random Forest for its resistance to overfitting, and SVM for its effectiveness in modeling non-linear decision boundaries in smaller datasets. Hyperparameter optimization was performed using GridSearchCV with 5-fold cross-validation, with the following ranges:
Gradient Boosting: n_estimators (100, 200), learning_rate (0.01, 0.1),
Random Forest: n_estimators (100, 200), max_depth (10, 20, None),
SVM: C (0.1, 1, 10), kernel (‘rbf’, ‘linear’),
XGBoost: n_estimators (100, 200), learning_rate (0.01, 0.1). The best parameters were selected based on the F1-score metric, ensuring a balance between precision and recall, particularly in the context of imbalanced synthetic data.
Creating a model for detecting DDoS attacks in IoT networks based on LoRaWAN technology using machine learning algorithms requires synthetic data to simulate DDoS attacks for training and testing the model. Synthetic data is particularly useful when real data from LoRaWAN gateways is not publicly available, and its generation supports sustainable research by reducing the need for real, sensitive data, which may require significant energy for collection and processing. This data is generated to reflect both normal traffic and attacks, with random distribution parameters to enable testing of various scenarios. The structure of the input data for the model is as follows: each data sample is a feature vector.
where
xi1—number of data packets per second;
xi2—number of unique device addresses;
xi3—average RSSI signal strength;
xi4—average signal-to-noise ratio (SNR);
xi5—ratio of upload to download traffic;
xi6—average payload size;
xi7—average time interval between packets.
The feature vector is augmented with a label y ∈ {0,1} where 0 represents normal traffic and 1 represents an attack. The data is generated in two classes: normal traffic (y = 0) and attacks (y = 1). The dataset is generated for a fixed number of samples, for example, 1000, with a proportion of attacks set at 30%. The generation process involves two levels of randomness:
For each class and each feature, the distribution parameters are randomly selected from specified ranges, and then the feature values are generated based on these distributions. Formally, for each feature f ∈ F = {xi1, xi2, xi3, xi4, xi5, xi6, xi7} and class c ∈ {0,1}, the parameters are sampled as follows:
Features with a normal distribution (f ∈ {xi1, xi3, xi4, xi6, xi7}):
- ○
The mean µ
f,c is randomized from a uniform distribution
where the ranges (
) are appropriately defined.
- ○
The standard deviation σ
f,c is randomized from a uniform distribution:
- ○
For each sample and with y
i = c, value of the trait x
i,f is generated from the normal distribution:
with an additional constraint, where the values are trimmed to non-negative values.
Feature with Discrete Uniform Distribution (f ∈ {xi2}):
- ○
min
c is randomized from a uniform discrete distribution:
- ○
max
c is randomized from a uniform discrete distribution:
Then, for each sample i with y
i = c
i feature value x
i2 is generated from a discrete uniform distribution:
with the additional restriction that
.
Feature with uniform continuous distribution (f ∈ {xi5}):
- ○
Lower limit a
c is randomized from a uniform distribution:
- ○
Upper limit b
c is randomized from a uniform distribution:
- ○
Then for each sample i with y
i = c
i feature x
i,5 is generated from a uniform distribution:
Once generated, the data is shuffled randomly to ensure that the classes are mixed, leading to a final dataset of inputs to a model ready to train and evaluate classification algorithms such as Gradient Boosting, Random Forest, Support Vector Machine, and XGBoost.
The LoRaWAN traffic characteristics parameters such as packets per second, number of unique device addresses, average signal strength, average signal-to-noise ratio, upload-to-download traffic ratio, average payload size, and average packet interval were selected based on typical values observed in LoRaWAN networks or from the literature on traffic modeling in these networks. For normal traffic, an average set between 8 and 12 packets per second reflects typical aggregated traffic in LoRaWAN networks with multiple IoT devices, where each device sends data every few minutes [
16]. For attacks, an average of 80 to 120 packets per second simulates the increased traffic characteristic of DDoS attacks [
22]. The standard deviation for normal traffic (1–3) and attacks (15–25) reflects the variability in network load. For normal traffic, the minimum of unique device addresses is set in the range of 1–3 and the maximum of 4–7, which corresponds to the typical number of devices in small LoRaWAN networks [
23]. For attacks, a minimum of 5–10, a maximum of 15–25, simulates a larger number of devices involved in an attack, which is consistent with DDoS attack models. For normal traffic, the RSSI was set in the range of −95 to −85 dBm, and the SNR between 4 and 6 dB, which reflects typical values in the literature [
16], indicates typical RSSI values in the range of −120 to −30 dBm, with typical values for urban areas in the range of −90 to −70 dBm). For attacks, RSSI of −85 to −75 dBm and SNR of 2 to 4 dB, simulating interference caused by increased traffic, which is consistent with LoRaWAN sensitivity analyses [
22]. The uplink-to-downlink traffic ratio, for normal traffic, ranging from 0.4 to 2.2, reflects typical traffic in LoRaWAN, where uplink predominates [
22], indicates the uplink advantage in IoT). For attacks, the range from 1.8 to 5.5 simulates the higher send traffic characteristics of attacks. The average payload size and time interval for normal traffic (15–25 bytes, deviation 3–7) and attacks (25–35 bytes, deviation 8–12) is based on common payload size values in LoRaWAN [
16], indicates a maximum payload size of up to 250 bytes, with typical values in the range of 10–50 bytes). The time interval for normal traffic (0.08–0.12 sec.) and attacks (0.005–0.015 sec.) reflects differences in the sending frequency, consistent with the literature [
24,
25,
26]. The selection of parameters is based on domain knowledge and research, such as LoRaWAN vulnerability analysis to DDoS attacks and traffic simulations, which suggest their compatibility with real networks. The table below summarizes sample ranges.
Table 1 summarizes how the parameters were selected based on relevant literature [
27,
28] and standardization documents standardization documents and articles based on them [
19,
20,
21,
22,
23,
24,
25,
26,
27,
28,
29,
30,
31,
32,
33,
34], which ensure compatibility with actual LoRaWAN networks.
Synthetic data prepared in this way is read into the model and loaded as a set of pairs:
where
is a feature vector, where d is the number of attributes (e.g., number of data packets per second, average RSSI signal strength, average signal-to-noise ratio SNR, etc.),
is a label where means DDoS attack, a normal network traffic.
Synthetic data is loaded from the latest file *.csv, and the script checks if the file exists and does not contain missing values.
The next step is to analyze the distributions of the data, which allows you to understand their statistical properties. For each attribute , basic descriptive statistics are calculated:
Mean:
Variance:
In addition, it is possible to calculate other measures, such as standard deviation , correlations between attributes (e.g., Pearson’s correlation coefficient). This analysis is crucial for identifying potential problems such as class imbalances or the presence of noise. Before training a model, the following steps are performed:
Defining feature matrices X and the label vector y,
Standardizing a trait with StandardScaler, what transformation means:
In the next stage, a classification model training procedure is implemented, the purpose of which is to learn the mapping of feature vectors for labels . The appropriate algorithm is selected from:
Formally, let will be a set of models under consideration, where
: GradientBoostingClassifier,
: RandomForestClassifier,
: SVC,
: XGBClassifier.
For the selected model , a grid of parameters is defined , np.:
Dla Gradient Boosting: ,
Dla Random Forest: , itd.
Then, using the GridSearchCV with 5 times cross-validation, we find the best parameters:
where
Precision = ,
Recall = , a are the true positives, false positives, and false negatives, respectively.
Once the best parameters are found, the model is trained on the entire set .
For the selected model , additional metrics on the test set are calculated :
,
,
,
,
—the true label of the i-th sample,
—the predicted label of the i-th sample by the model,
—an indicator function that returns 1 if the condition is satisfied, and 0 otherwise,
n—the number of samples in the test set.
Then the next iterations are performed:
Calculation of precision, recall and F1-score for each class, according to the above formulas.
For tree-based models (Gradient Boosting, Random Forest, XGBoost), calculating feature importance, which is typically based on the reduction in impurities (e.g., Gini impurity) in trees.
Drawing the ROC curve and calculating the AUC (Area Under Curve), where
The ROC curve is generated by changing the classification threshold and calculating the True Positive Rate (TPR) and False Positive Rate (FPR) for each threshold,
AUC is calculated as the area under the ROC curve, which measures the model’s ability to distinguish between classes.
In the next steps, the model is saved and simulated. Model
and scaler are written to files using the library joblib. Real-time detection simulation for selected test samples: for several indexes i, predictions are calculated
and compared to the actual labels
. Example model evaluation metrics are presented in
Table 2.
4. Model Implementation
The simulation model was created in the Python 3.13.5 environment and is used to study and detect DDoS attacks using machine learning techniques. Their use is particularly useful in cybersecurity research, where real-world network data can be difficult to obtain or involve privacy issues. Script synthetic_data_generator.py generates synthetic network data that mimics both normal network traffic and DDoS attacks. This data is labeled with binaries: 0 for normal traffic and 1 for DDoS attacks. The model allows you to adjust parameters such as the number of samples or the proportion of attacks, which allows you to simulate different network scenarios. This data is saved in files *.csv and include features such as:
Number of packets per second (pkt_per_sec),
Number of unique device addresses (uniq_devaddr_count),
Average signal strength (avg_rssi),
Average signal-to-noise ratio (avg_snr),
Ratio of uplink and downlink (uplink_downlink_ratio),
Average payload size (payload_size_mean),
Average time difference between packets (timestamp_gap_mean).
Actual network data, especially that related to DDoS attacks, is often limited due to privacy, security or high costs of obtaining it. As indicated in the study [
35], real data may be incomplete or subject to legal limitations, making synthetic data a potential alternative. Synthetic data allows you to simulate attacks in a controlled environment, which is especially useful in IoT where real data is difficult to access. In addition, the generated synthetic data allows full control over features such as the number of packets per second, the average packet size or the number of unique device addresses. This control enables the creation of large, diverse datasets in a short period of time. The publication [
18] indicates that synthetic data can be designed to reflect specific attack scenarios, which allows models to be tested in various network conditions. The article [
36] indicates that synthetic data generated with GANs were used to train deep learning models, achieving high accuracy in detecting attacks. The publication [
37] indicates that synthetic data is scalable and allow to study the impact of various network parameters on the performance of models. Scientific literature provides numerous arguments for the use of synthetic data in the context of detecting DDoS attacks.
A simulation model in Python loads the latest synthetic data file and performs the process of analyzing and training machine learning algorithm models. Data exploratory analysis (EDA) is performed. For this purpose, descriptive statistics such as:
and the variance:
for each feature j the model also generates visualizations, such as histograms, and 3D charts to show data distributions and differences between classes.
In the next step, the data preparation process begins. Columns irrelevant to classification are removed (np. timestamp). The following features are standardized:
The data is divided into training sets (D
train) and test (D
test) in proportion 80:20. Studies [
37] indicate that the distribution of data in proportion 80:20 on training and test sets is a common practice in machine learning, used to balance the amount of data to train a model and evaluate its effectiveness. The publication [
31,
32,
33,
34,
35,
36,
37] indicates that the 80:20 ratio minimizes the risk of overlearning, especially for tree-based models such as XGBoost. The article [
38] uses an 80:20 split to use an 80:20 split, arguing that this is standard practice in binary classification tasks.
In the next step, the models are trained. The model selects a classification algorithm from Gradient Boosting, Random Forest, SVM, or XGBoost. The script uses GridSearchCV with 5-fold cross-validation to find the best hyperparameters, maximizing the F1-score.
After training the model on the training set, the script calculates the prediction on the test set:
Next, metrics such as accuracy are generated:
and the confusion matrix (17).
The script also generates plots such as a heat map of the confusion matrix, feature importance for tree models, and an ROC curve with a field under the curve (AUC). The confusion matrix heatmap visualizes the distribution of model prediction, feature importance shows which attributes have the greatest impact on model decisions, and the ROC curve with AUC evaluates the model’s ability to distinguish between classes. Feature importance for tree models is a measure that indicates how much each feature contributes to the decisions made by tree models such as Gradient Boosting, Random Forest, or XGBoost. In tree models, importance is typically calculated based on the reduction in impurities (e.g., Gini impurity) or the increase in information in the nodes of decision trees. The feature severity chart allows you to identify which characteristics (e.g., packets per second) have the greatest impact on DDoS detection. For example, a high severity of packets per second may indicate that DDoS attacks are characterized by a sudden increase in packet counts. The article [
35] shows that the analysis of the importance of features is crucial in designing effective DDoS detection systems. The Receiver Operating Characteristic (ROC) curve is a graph showing the relationship between True Positive Rate (TPR, sensitivity) and False Positive Rate (FPR, false alarm rate) for different classification thresholds. Area Under Curve (AUC) measures the model’s ability to distinguish between classes (normal traffic vs. DDoS attack) where
AUC is between 0 and 1:
AUC = 1: An ideal model perfectly distinguishes between classes.
AUC = 0.5: A random classifier, incapable of distinguishing classes.
AUC < 0.5: A classifier performing worse than a random guess.
The ROC curve shows how the model performs at distinguishing classes at different classification thresholds. A curve closer to the top left indicates better performance. AUC is a measure of the overall ability of a model to distinguish between classes, regardless of the threshold chosen. In the context of DDoS, a high AUC (e.g., >0.9) means that the model is effective in distinguishing attacks from normal traffic. The trained model and scaler are saved in *.pkl files. The script simulates real-time detection by predicting labels for selected test samples and comparing them to actual labels.
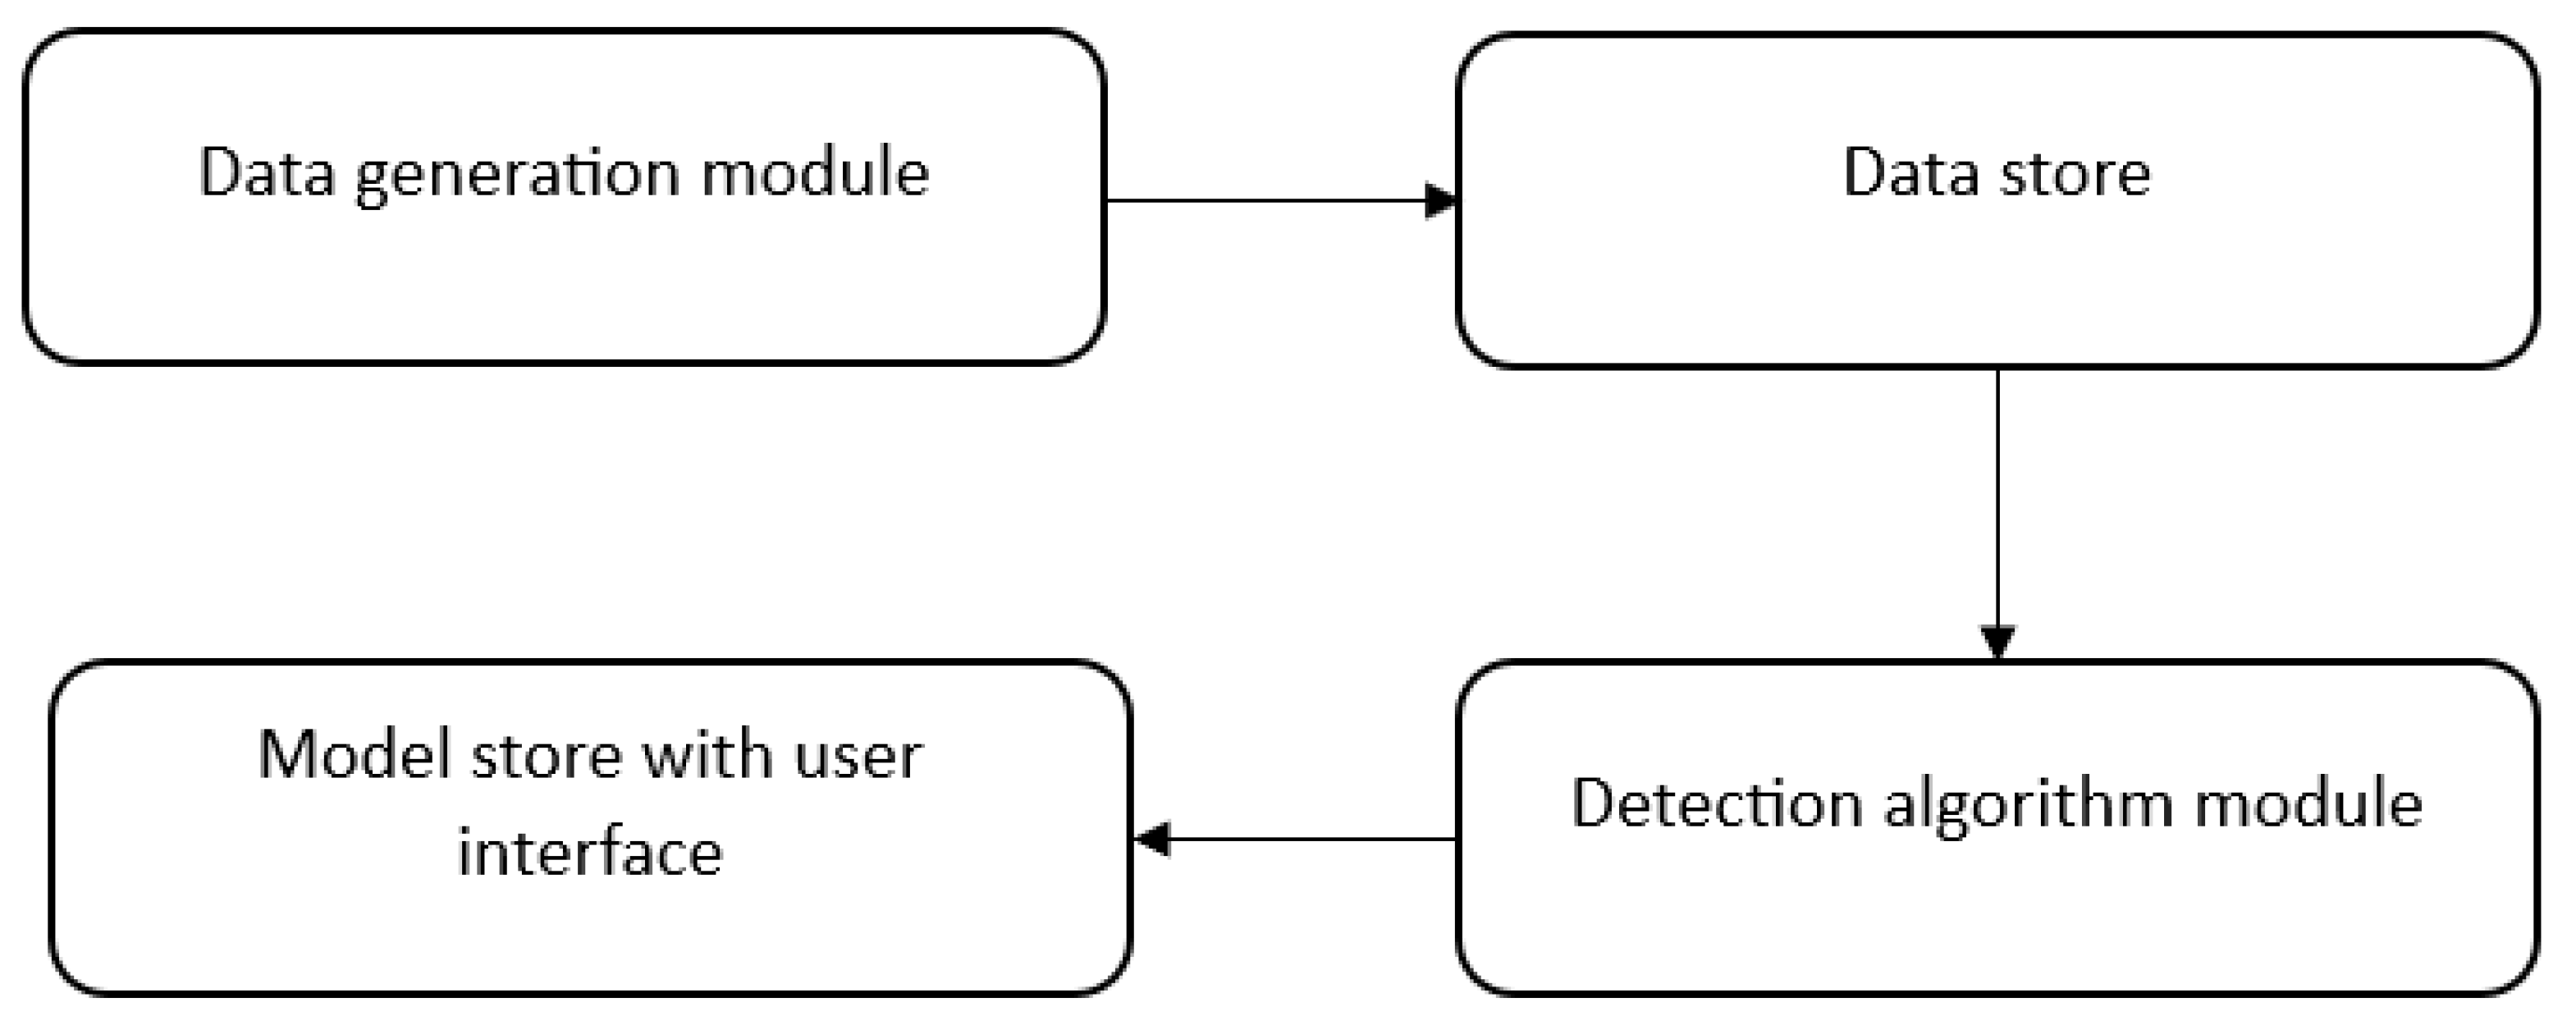
The simulation environment consists of the following components shown in
Figure 1. The simulation environment architecture diagram in
Figure 1 illustrates the modular structure of the system, in which each component has a clearly defined role.
The data generation module component provides the starting point of the simulation process, providing data for model analysis and training. This component enables the generation of large, diverse datasets that can be adapted to different attack scenarios. is responsible for creating synthetic network data that mimics both normal traffic and DDoS attacks. The module generates data containing characteristics such as the number of packets per second (pkt_per_sec), the number of unique device addresses (uniq_devaddr_count), average signal strength (avg_rssi) or average payload size (payload_size_mean). The data is labeled with binary labels (0 for normal traffic, 1 for DDoS attack). This module provides a controlled environment for testing algorithms without the need for real network data, which is especially relevant in cybersecurity due to privacy and security issues.
A data store synthetic network data in files *.csv, that are created by the data generation module. These files contain network features and class labels (0 or 1) and are saved in a format that can be easily read by the detection script. This module acts as an intermediary between the generation of data and its processing by the detection module. The module provides persistent storage of synthetic data, which allows the same data to be reused in different experiments and easy data management.
The detection algorithm module is responsible for loading data from the warehouse, analyzing it, training classification models (e.g., Gradient Boosting, Random Forest, SVM, XGBoost) and assessing their effectiveness. It performs tasks such as data exploratory analysis (EDA), feature standardization, training and test dataset (80:20), hyperparameter optimization with GridSearchCV, metric calculation (e.g., accuracy, F1-score), and graph generation (confusion matrix heatmap, feature importance, ROC curve). The module is the main component that processes data and builds DDoS attack detection models. It allows you to select an algorithm, train a model, and evaluate its performance. This element is at the heart of the simulation environment, allowing different algorithms and detection scenarios to be tested under controlled conditions.
The model store, along with the UI, allows you to save training results, allowing you to reuse models in future simulations or applications in real time without the need for retraining. The module stores trained classification models and scaler objects (e.g., StandardScaler) in *.pkl files using the joblib library. The user interface provides user interaction with the system, including the selection of a classification algorithm (Gradient Boosting, Random Forest, SVM, XGBoost) and viewing results such as classification reports, confusion matrix, trait importance charts, and ROC curve. The module allows you to control the detection process and analyze the results by selecting an algorithm and viewing metrics and charts.
Figure 2 shows a general scheme of the simulation process. The schema includes a sequence of steps from synthetic data generation to model evaluation and storage, creating a comprehensive DDoS investigation cycle. The schema covers all the key stages of machine learning, from data generation to model evaluation and storage. This process is in line with the standards in the scientific literature [
35].
5. Results and Conclusions
In the first stage, the synthetic data needed to run the simulation in the test environment was prepared. A synthetic data generator was used for normal network traffic and DDoS attacks using the Python environment. Data is generated for two categories: normal network traffic and DDoS attacks. The number of samples is 1000 by default, of which 30% is attack data. For each category (normal movement and attack), the parameters of statistical distributions are randomized, such as:
Mean and standard deviation for characteristics such as packets per second (pkt_per_sec), average signal strength (avg_rssi), average signal-to-noise ratio (avg_snr), average payload size (payload_size_mean), and average timestamp interval (timestamp_gap_mean).
Minimum and maximum values for the number of unique device addresses (uniq_devaddr_count) and the uplink/downlink ratio (uplink_downlink_ratio).
Data is generated using normal distributions for features with mean and standard deviation parameters, and uniform distributions for features with preset minimums and maxima.
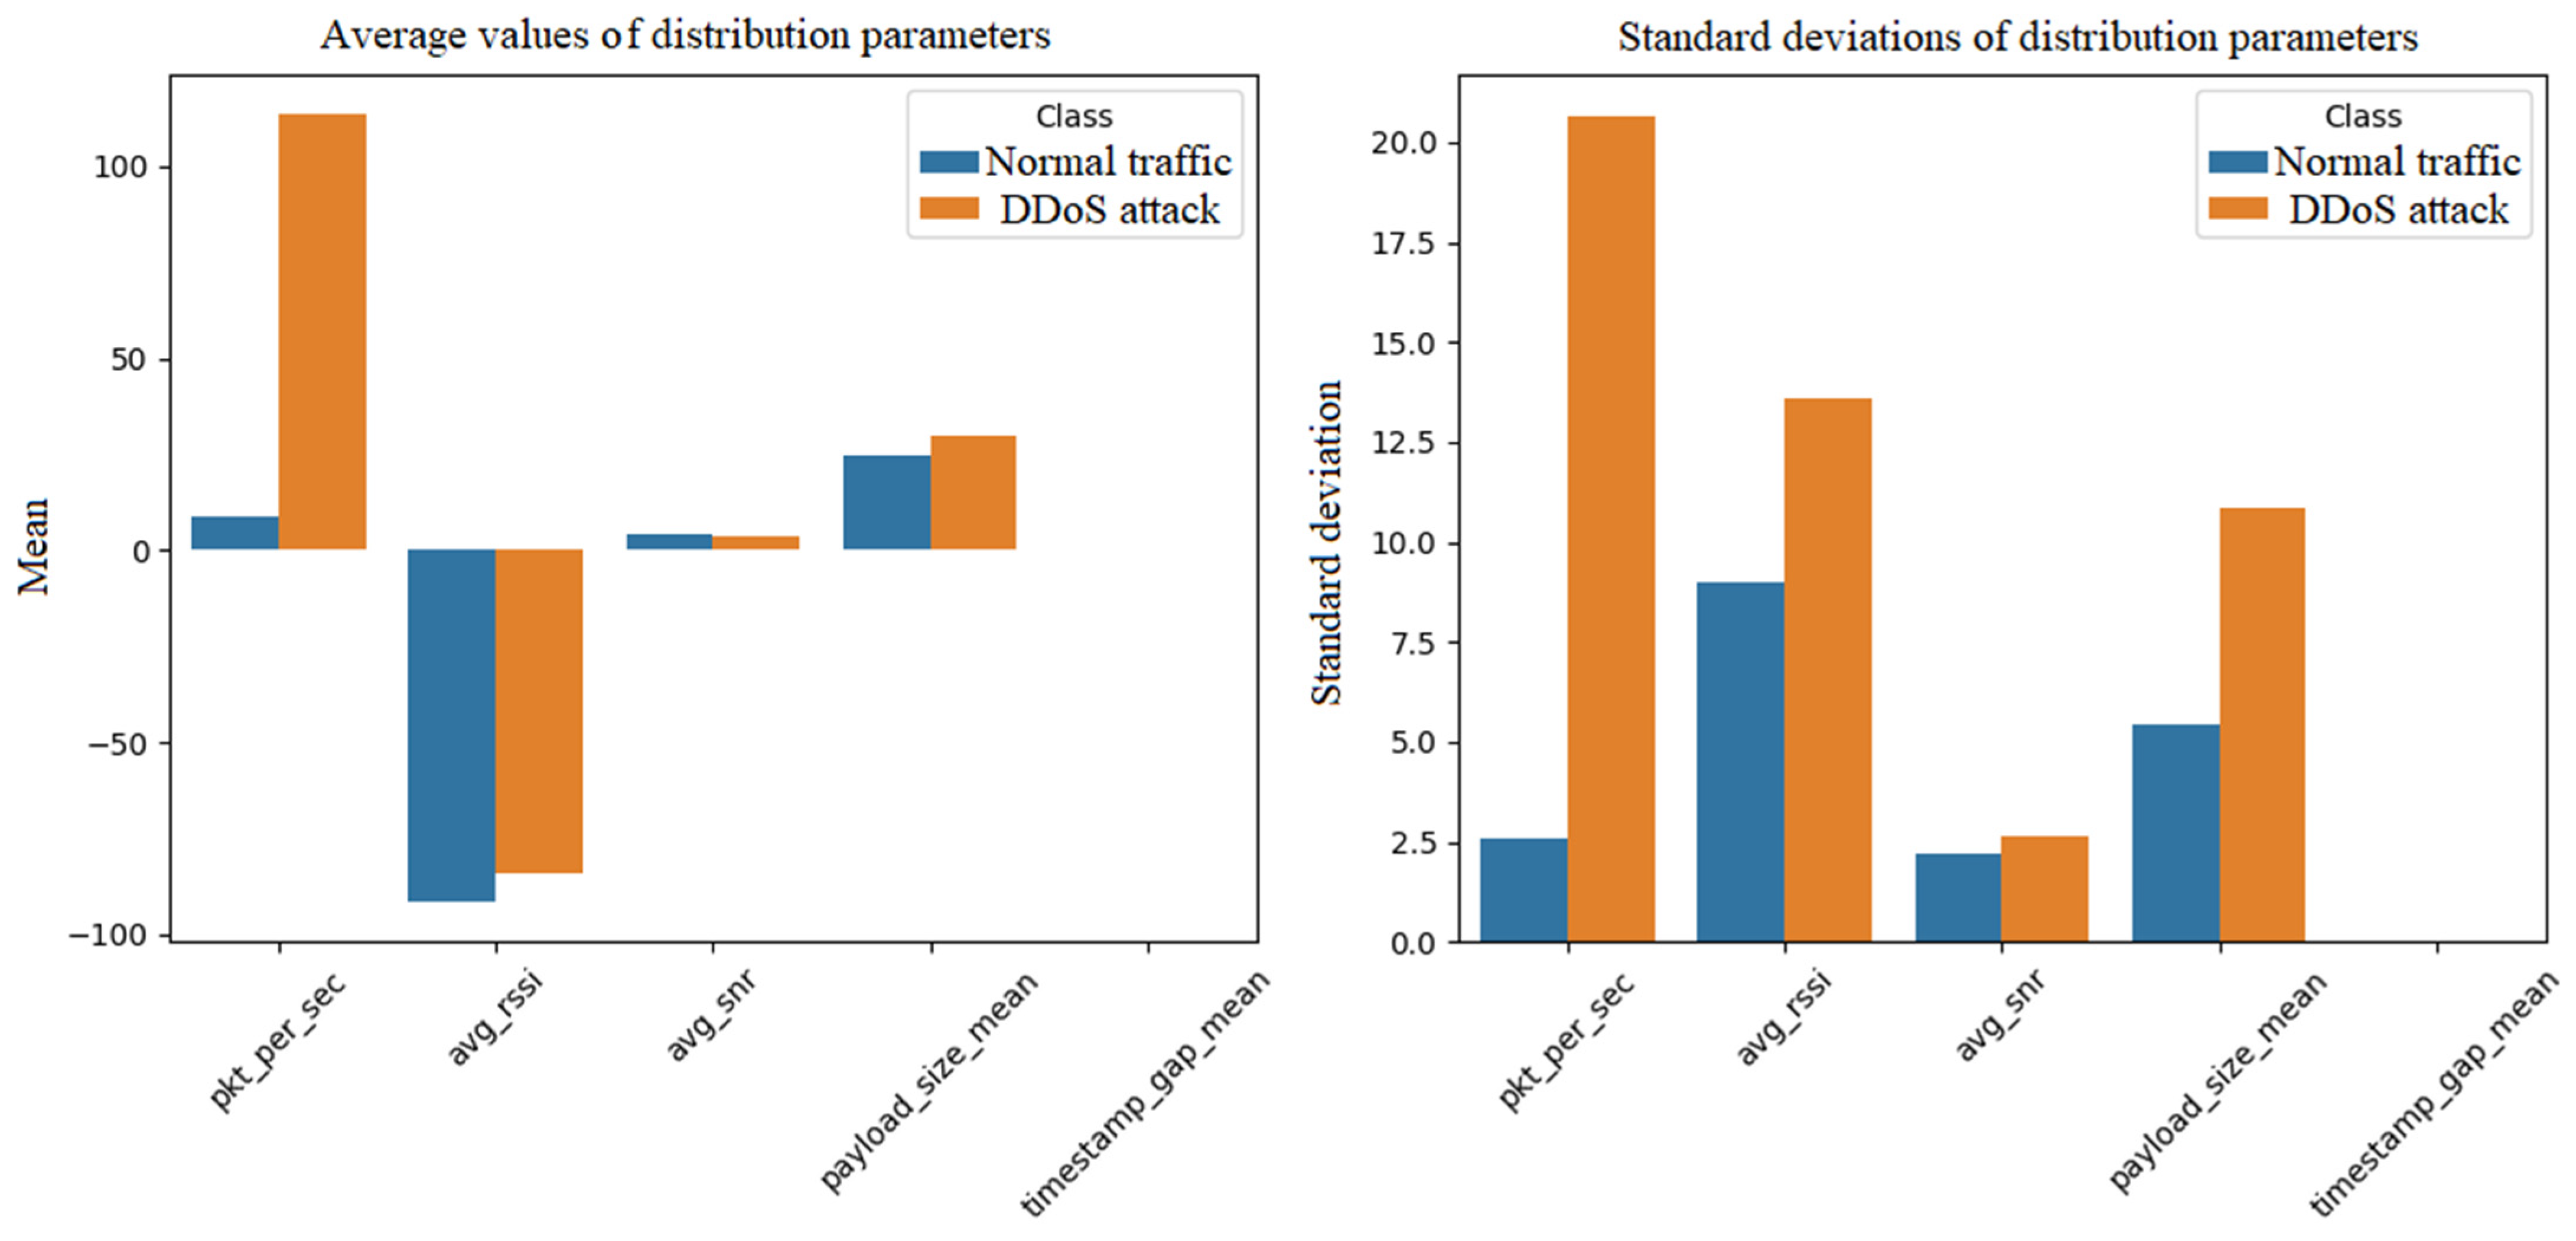
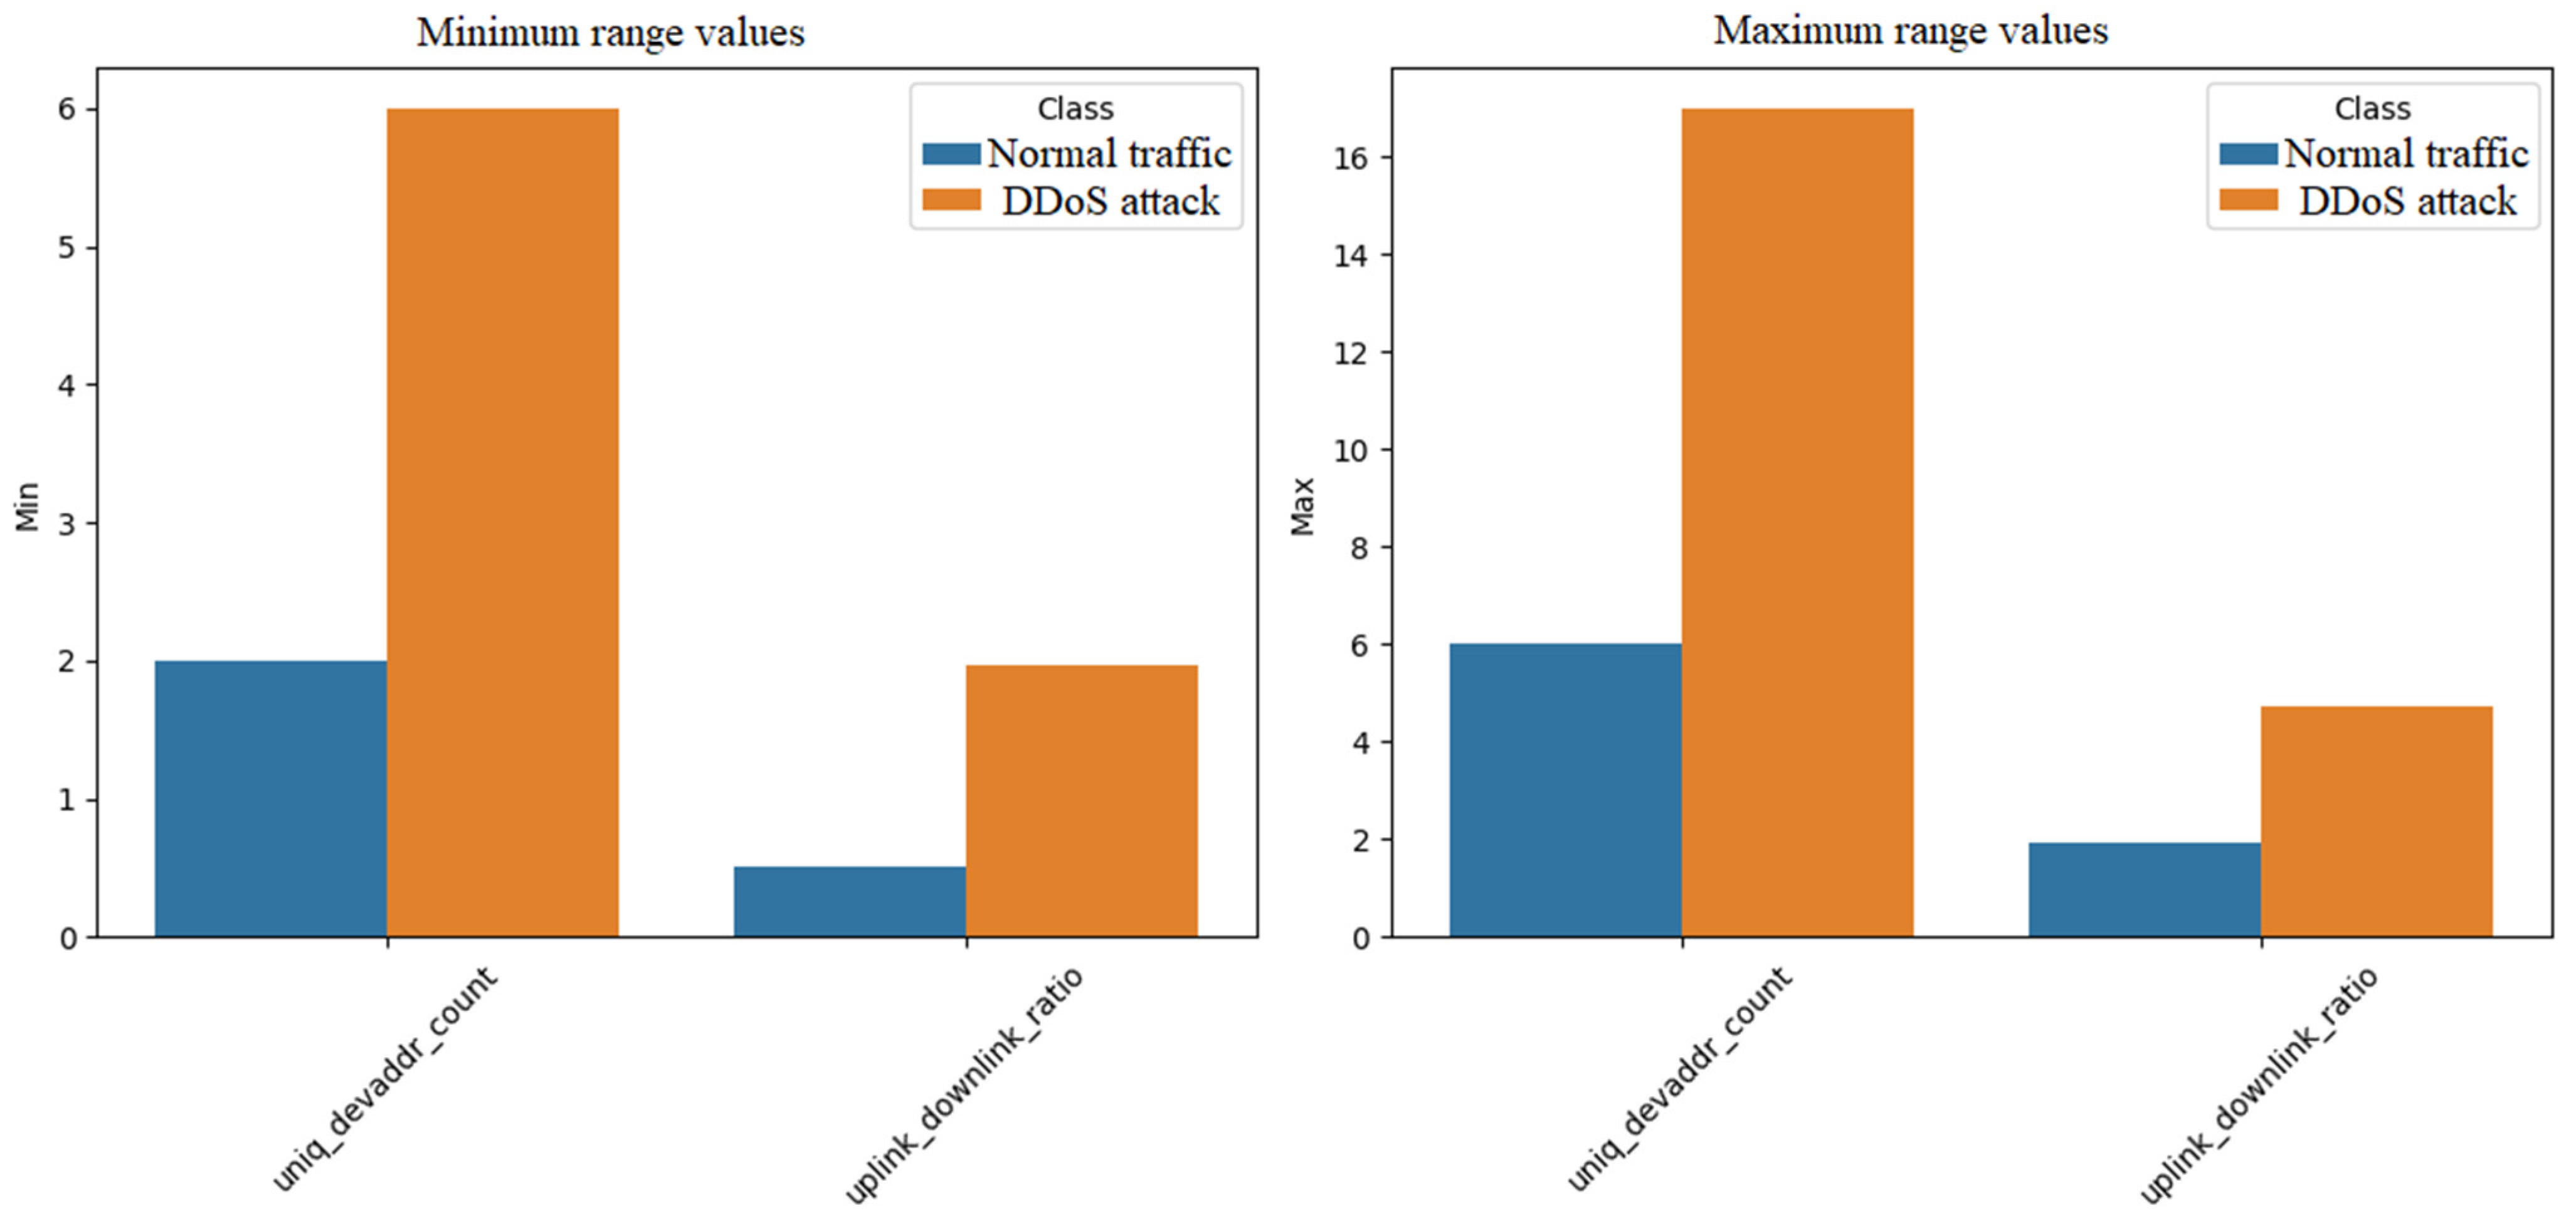
Figure 3 and
Figure 4 show graphs that illustrate the parameters of the distributions used to generate the data. In
Figure 3, the diagram consists of two subplots (subplots) in one window. The left subgraph shows a bar graph showing the average values for five features:
Number of packets per second (pkt_per_sec),
Average signal strength (avg_rssi),
Average signal-to-noise ratio (avg_snr),
Average payload size (payload_size_mean),
Average time difference between packets (timestamp_gap_mean).
For each feature, two bars are shown: one for normal traffic, the other for a DDoS attack, differentiated by color (e.g., blue for normal, orange for attack). A similar bar chart, but showing the standard deviations of the same characteristics, also for both categories: one for normal traffic, the other for a DDoS attack is on the right side of
Figure 3.
Figure 4 shows the second set of plots for the minimum and maximum values of the synthetic data parameters. As above, the figure consists of two sub-graphs. The left subgraph is a bar graph showing the minimum values for two characteristics: the number of unique device addresses (uniq_devaddr_count), and the ratio of traffic up to traffic down (uplink_downlink_ratio), broken down into normal traffic and DDoS attack.
The above graphs in
Figure 3 and
Figure 4 provide a visual comparison of the distribution parameters for normal network traffic and DDoS attacks, which is crucial for understanding the differences between these categories. For the average values of the distribution parameters in
Figure 3, the number of packets per second represents normal traffic that averages about 10 packets and an attack about 100 packets, indicating a significant increase in traffic during an attack. The synthetic data generated reflects realistic differences between normal traffic and DDoS attacks. A higher average number of packets per second for attacks and a higher standard deviation indicate heavy and variable traffic during attacks, which is typical for DDoS attacks. A higher number of unique devices during attacks suggest the involvement of multiple sources, e.g., botnets. A higher uplink/downlink ratio for attacks indicates a higher amount of outbound traffic, which is characteristic of attacks trying to overload the server. Lower differences in average signal strength and average time difference between packets suggest that some parameters are less affected by attacks, which can be useful for analysis. The synthetic data generated is as expected for normal traffic and DDoS attacks, with clear differences in key parameters such as packet count and device count [
39,
40,
41,
42].
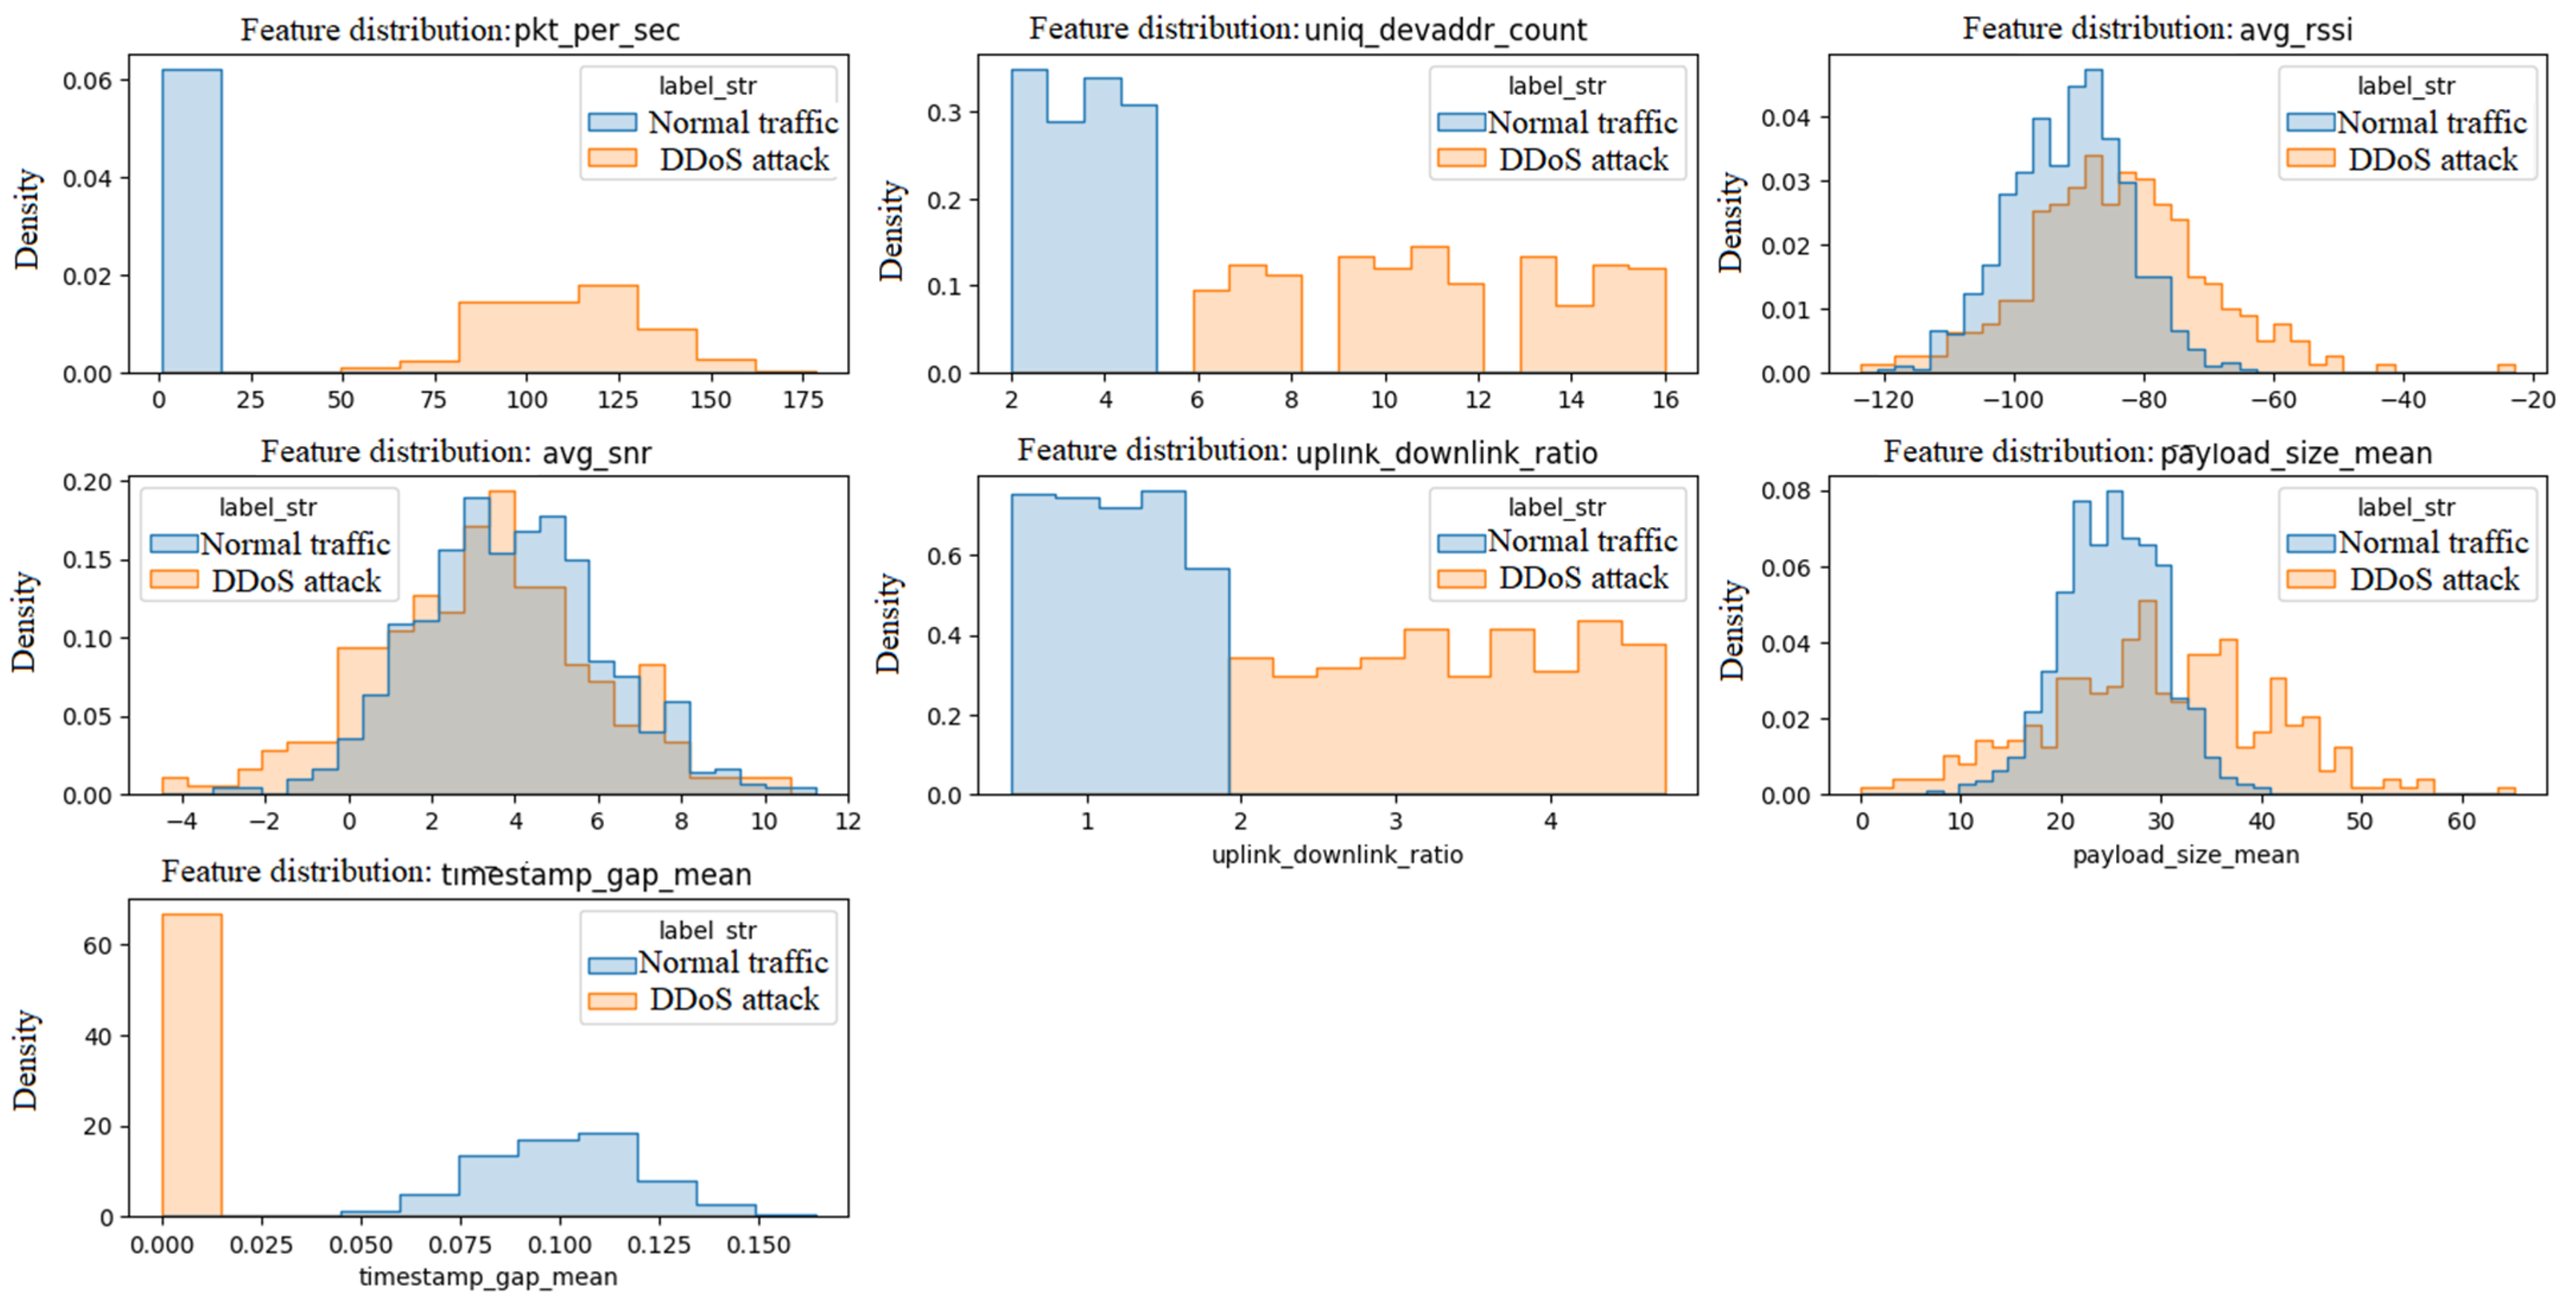
In the second stage of the simulation process, synthetic data is analyzed to detect DDoS attacks. The test environment performs data exploration, visualization, training classification models with hyperparameter optimization, and evaluating the results. Synthetic data analysis allows you to generate histograms for each feature, comparing the distributions for normal traffic and DDoS attacks.
Histograms show how features are distributed for both classes. For example, if the packets-per-second histogram ‘pkt_per_sec’ for DDoS attacks is shifted to the right relative to normal traffic, it means that the attacks have a higher packet-per-second count. Differences in distributions may indicate characteristics that are particularly useful for distinguishing attacks from normal traffic, e.g., higher values for the number of unique device addresses ‘uniq_devaddr_count’ may suggest a greater number of attack sources.
Box plots are created for each feature, showing the distribution of values depending on the class. Box plots allow you to assess whether there are significant differences in feature distributions between classes. For example, if the median number of unique device addresses ‘uniq_devaddr_count’ is higher for attacks, it means that attacks involve more unique devices. Outliers may indicate unusual cases that may require additional analysis, e.g., very high packets per second values ‘pkt_per_sec’ may be the result of extreme attacks.
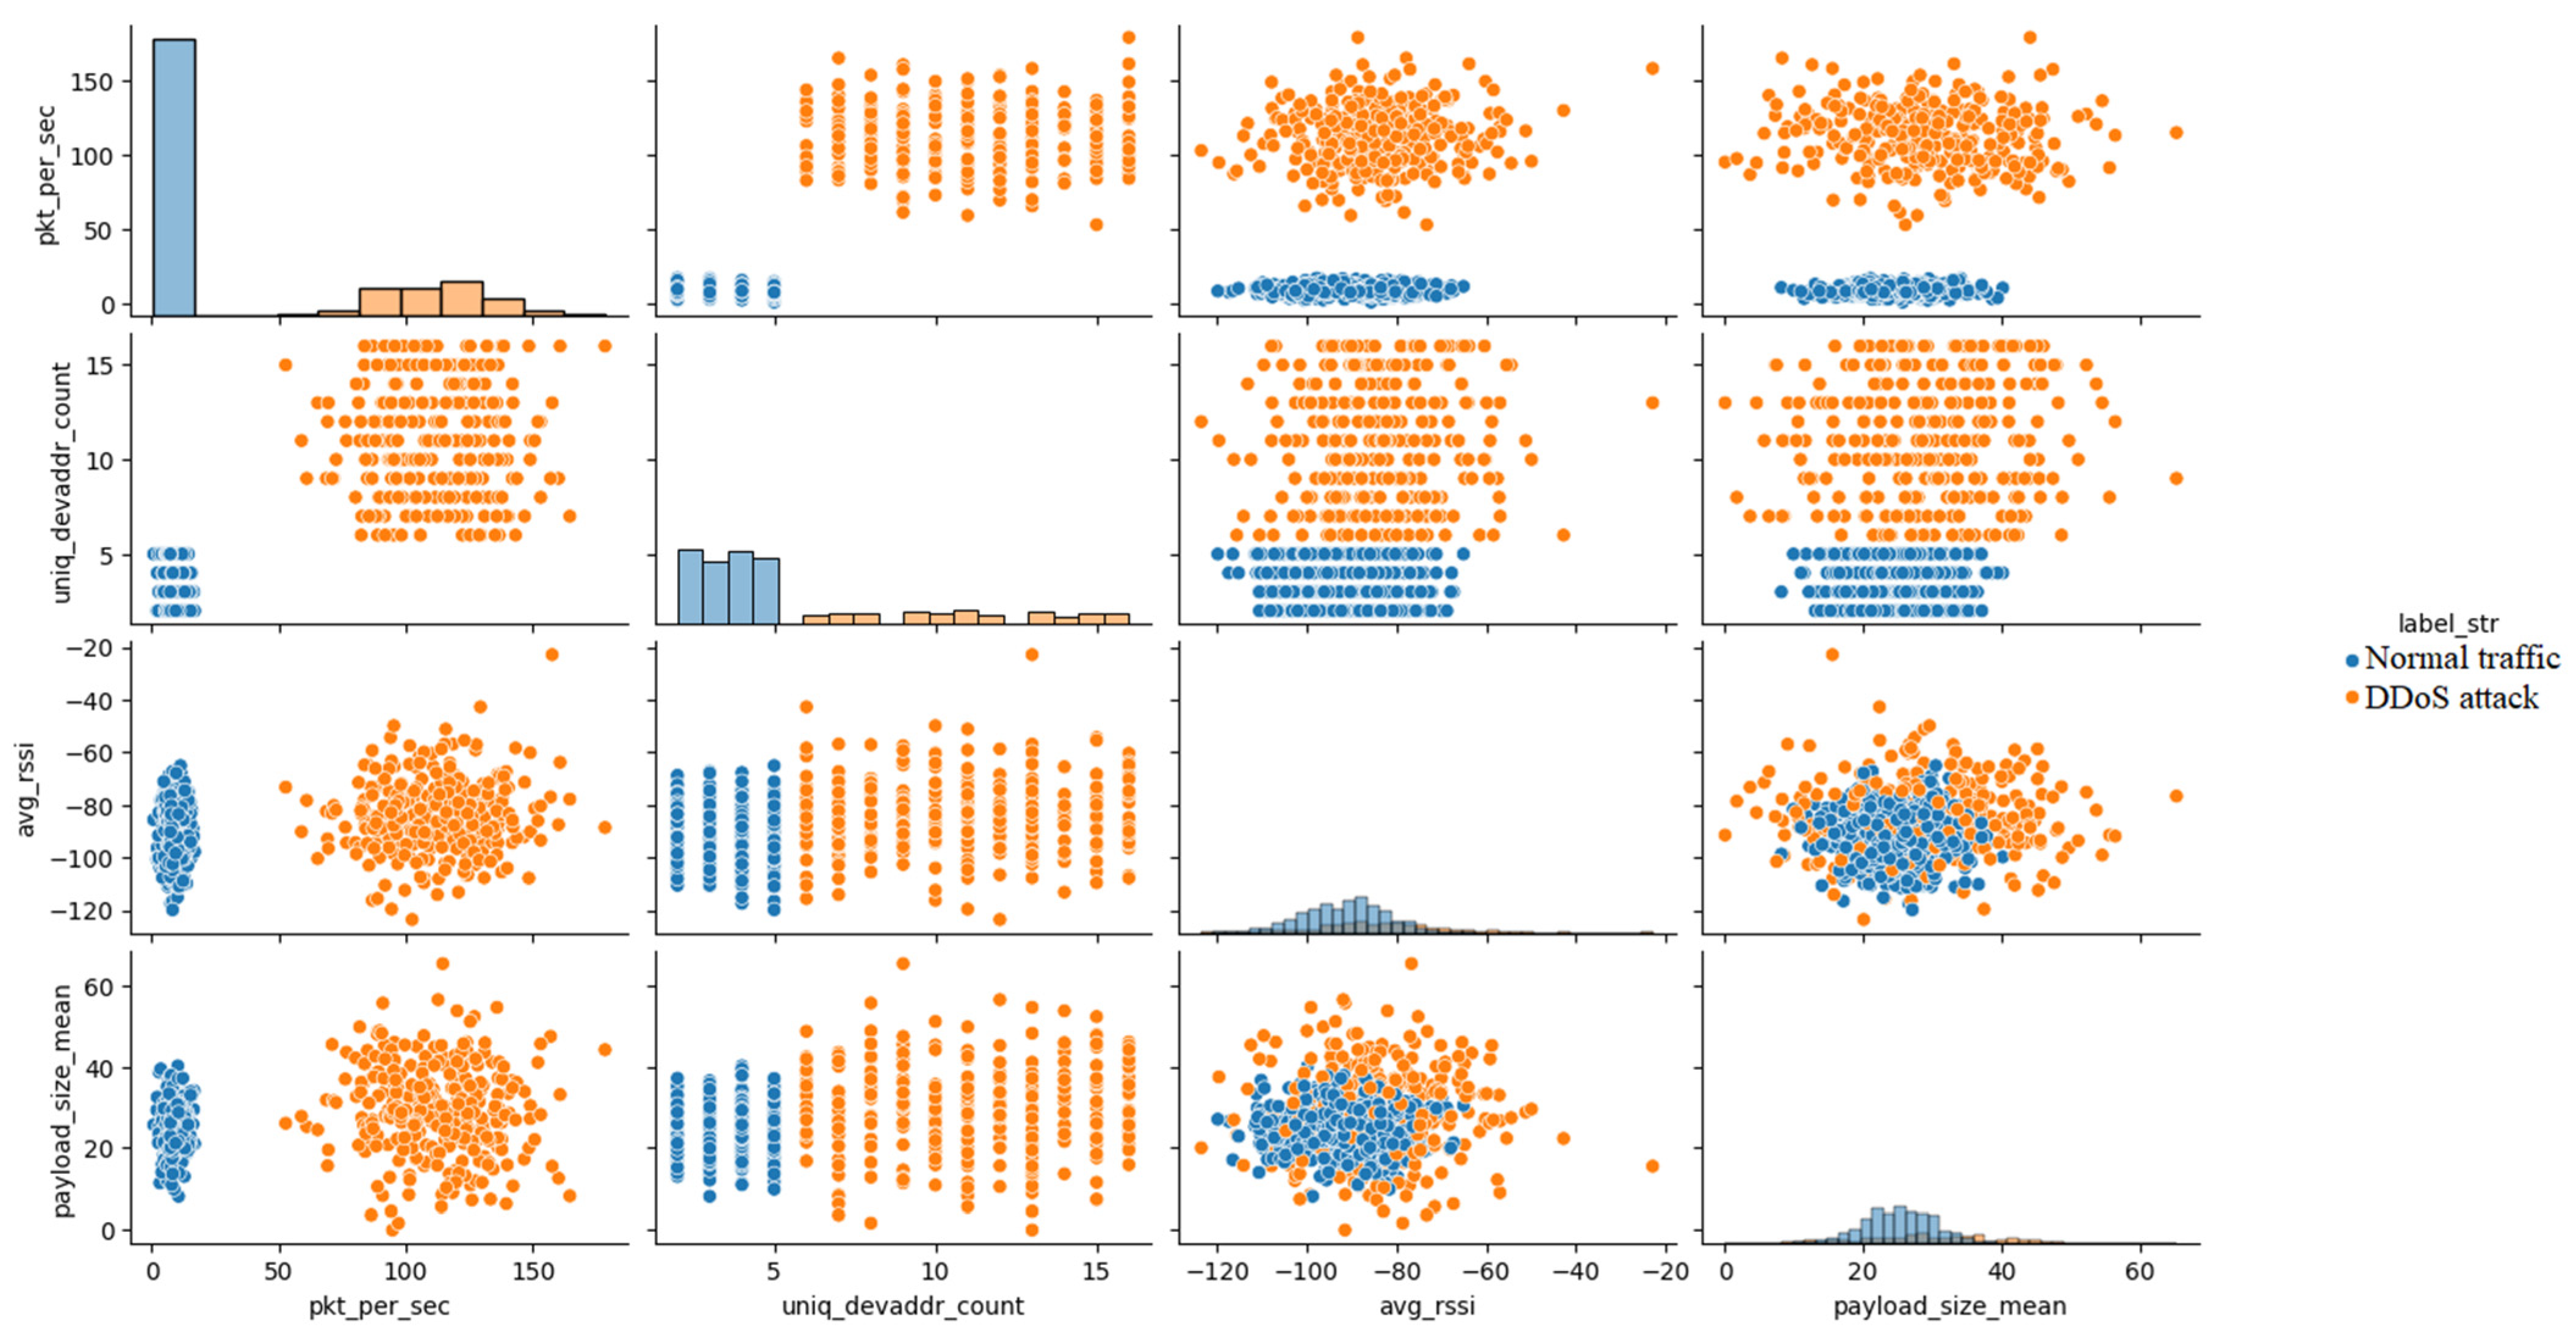
The pairplot shows the relationships between selected features (e.g., packets per second ‘pkt_per_sec’, number of unique device addresses ‘uniq_devaddr_count’, average signal strength ‘avg_rssi’, average payload size ‘payload_size_mean’), showing diagonal distributions and correlations between features in the remaining fields, with colors to distinguish classes. The graph allows you to understand how features interdepend and whether there are clear boundaries between classes in a multidimensional space. For example, if the points for normal traffic and attacks are well separated in 2D graphs, it suggest that classification models may work well, e.g., the high correlation between the number of packets per second ‘pkt_per_sec’ and the number of unique device addresses ‘uniq_devaddr_count’ for attacks may indicate their interconnection in DDoS attacks.
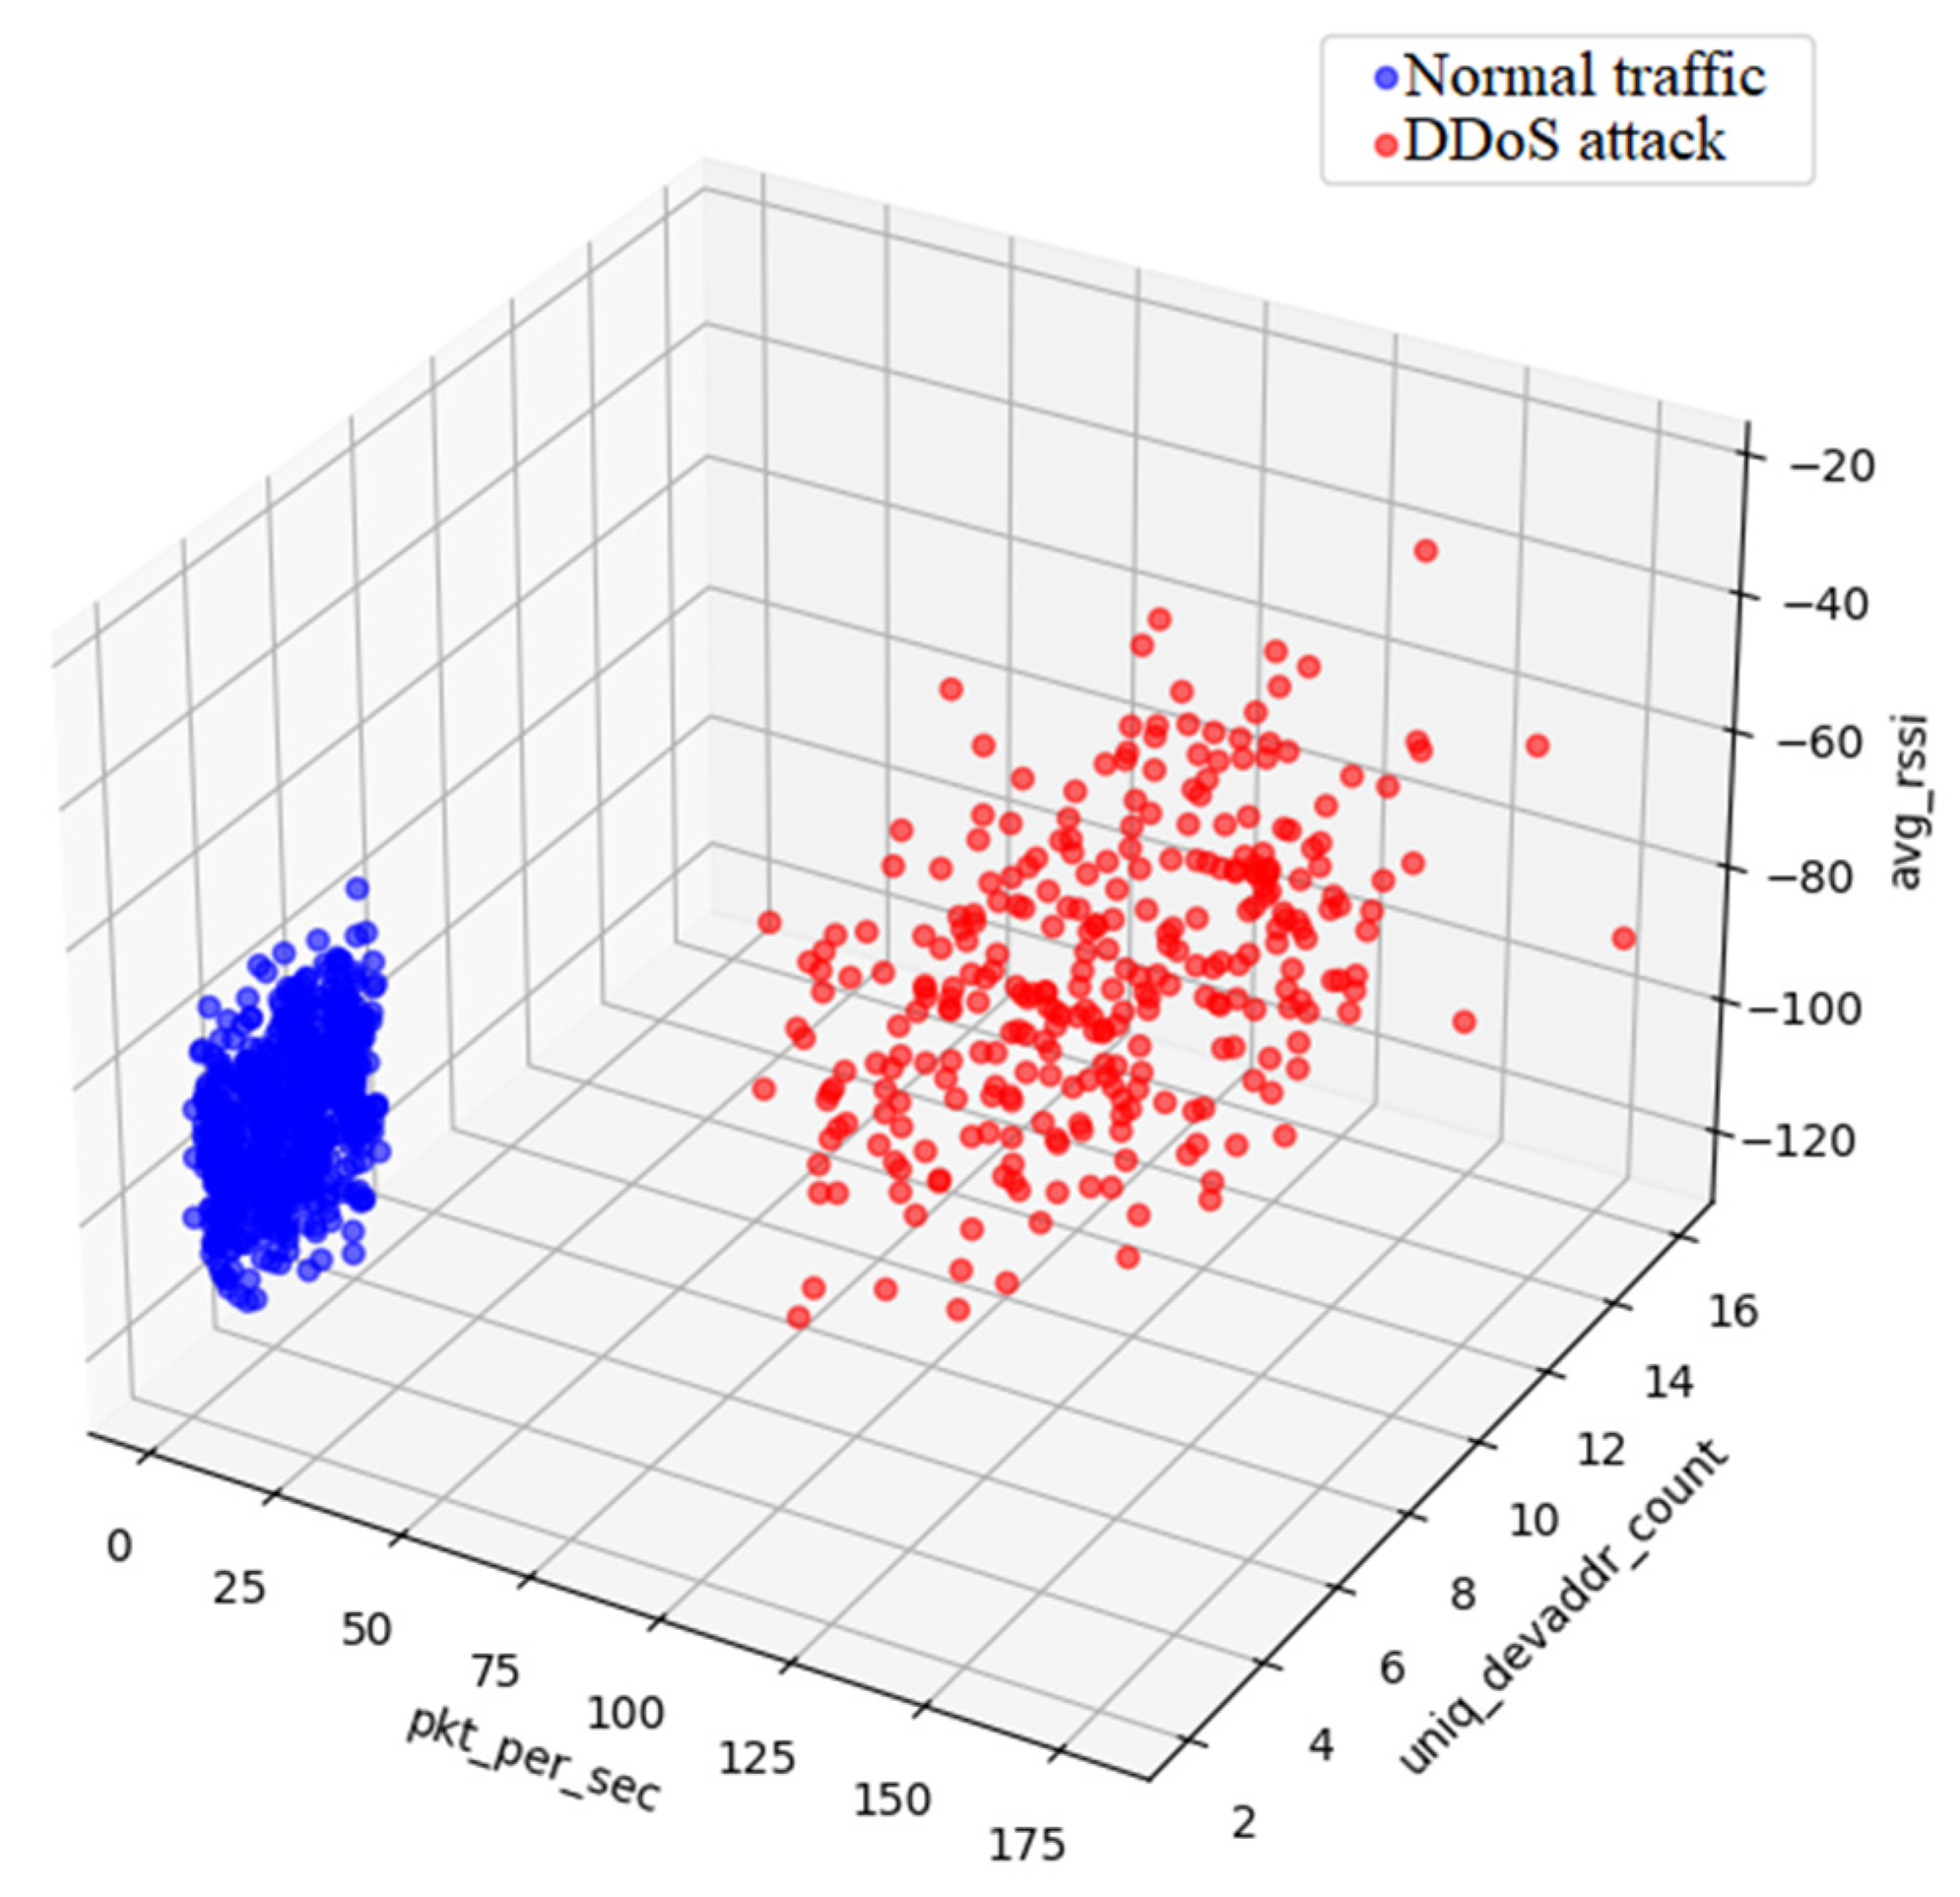
The 3D graph shows the distribution of data in a three-dimensional space of three selected features (e.g., ‘pkt_per_sec’, ‘uniq_devaddr_count’, ‘avg_rssi’), with points in blue for normal traffic and red for DDoS attacks. This graph allows you to assess whether there are clear clusters of data for normal traffic and attacks. If the points for attacks and normal movement are well separated in 3D space, it means that classification algorithms can distinguish them more easily, e.g., attacks can form a cluster with high values of ‘pkt_per_sec’ and ‘uniq_devaddr_count’.
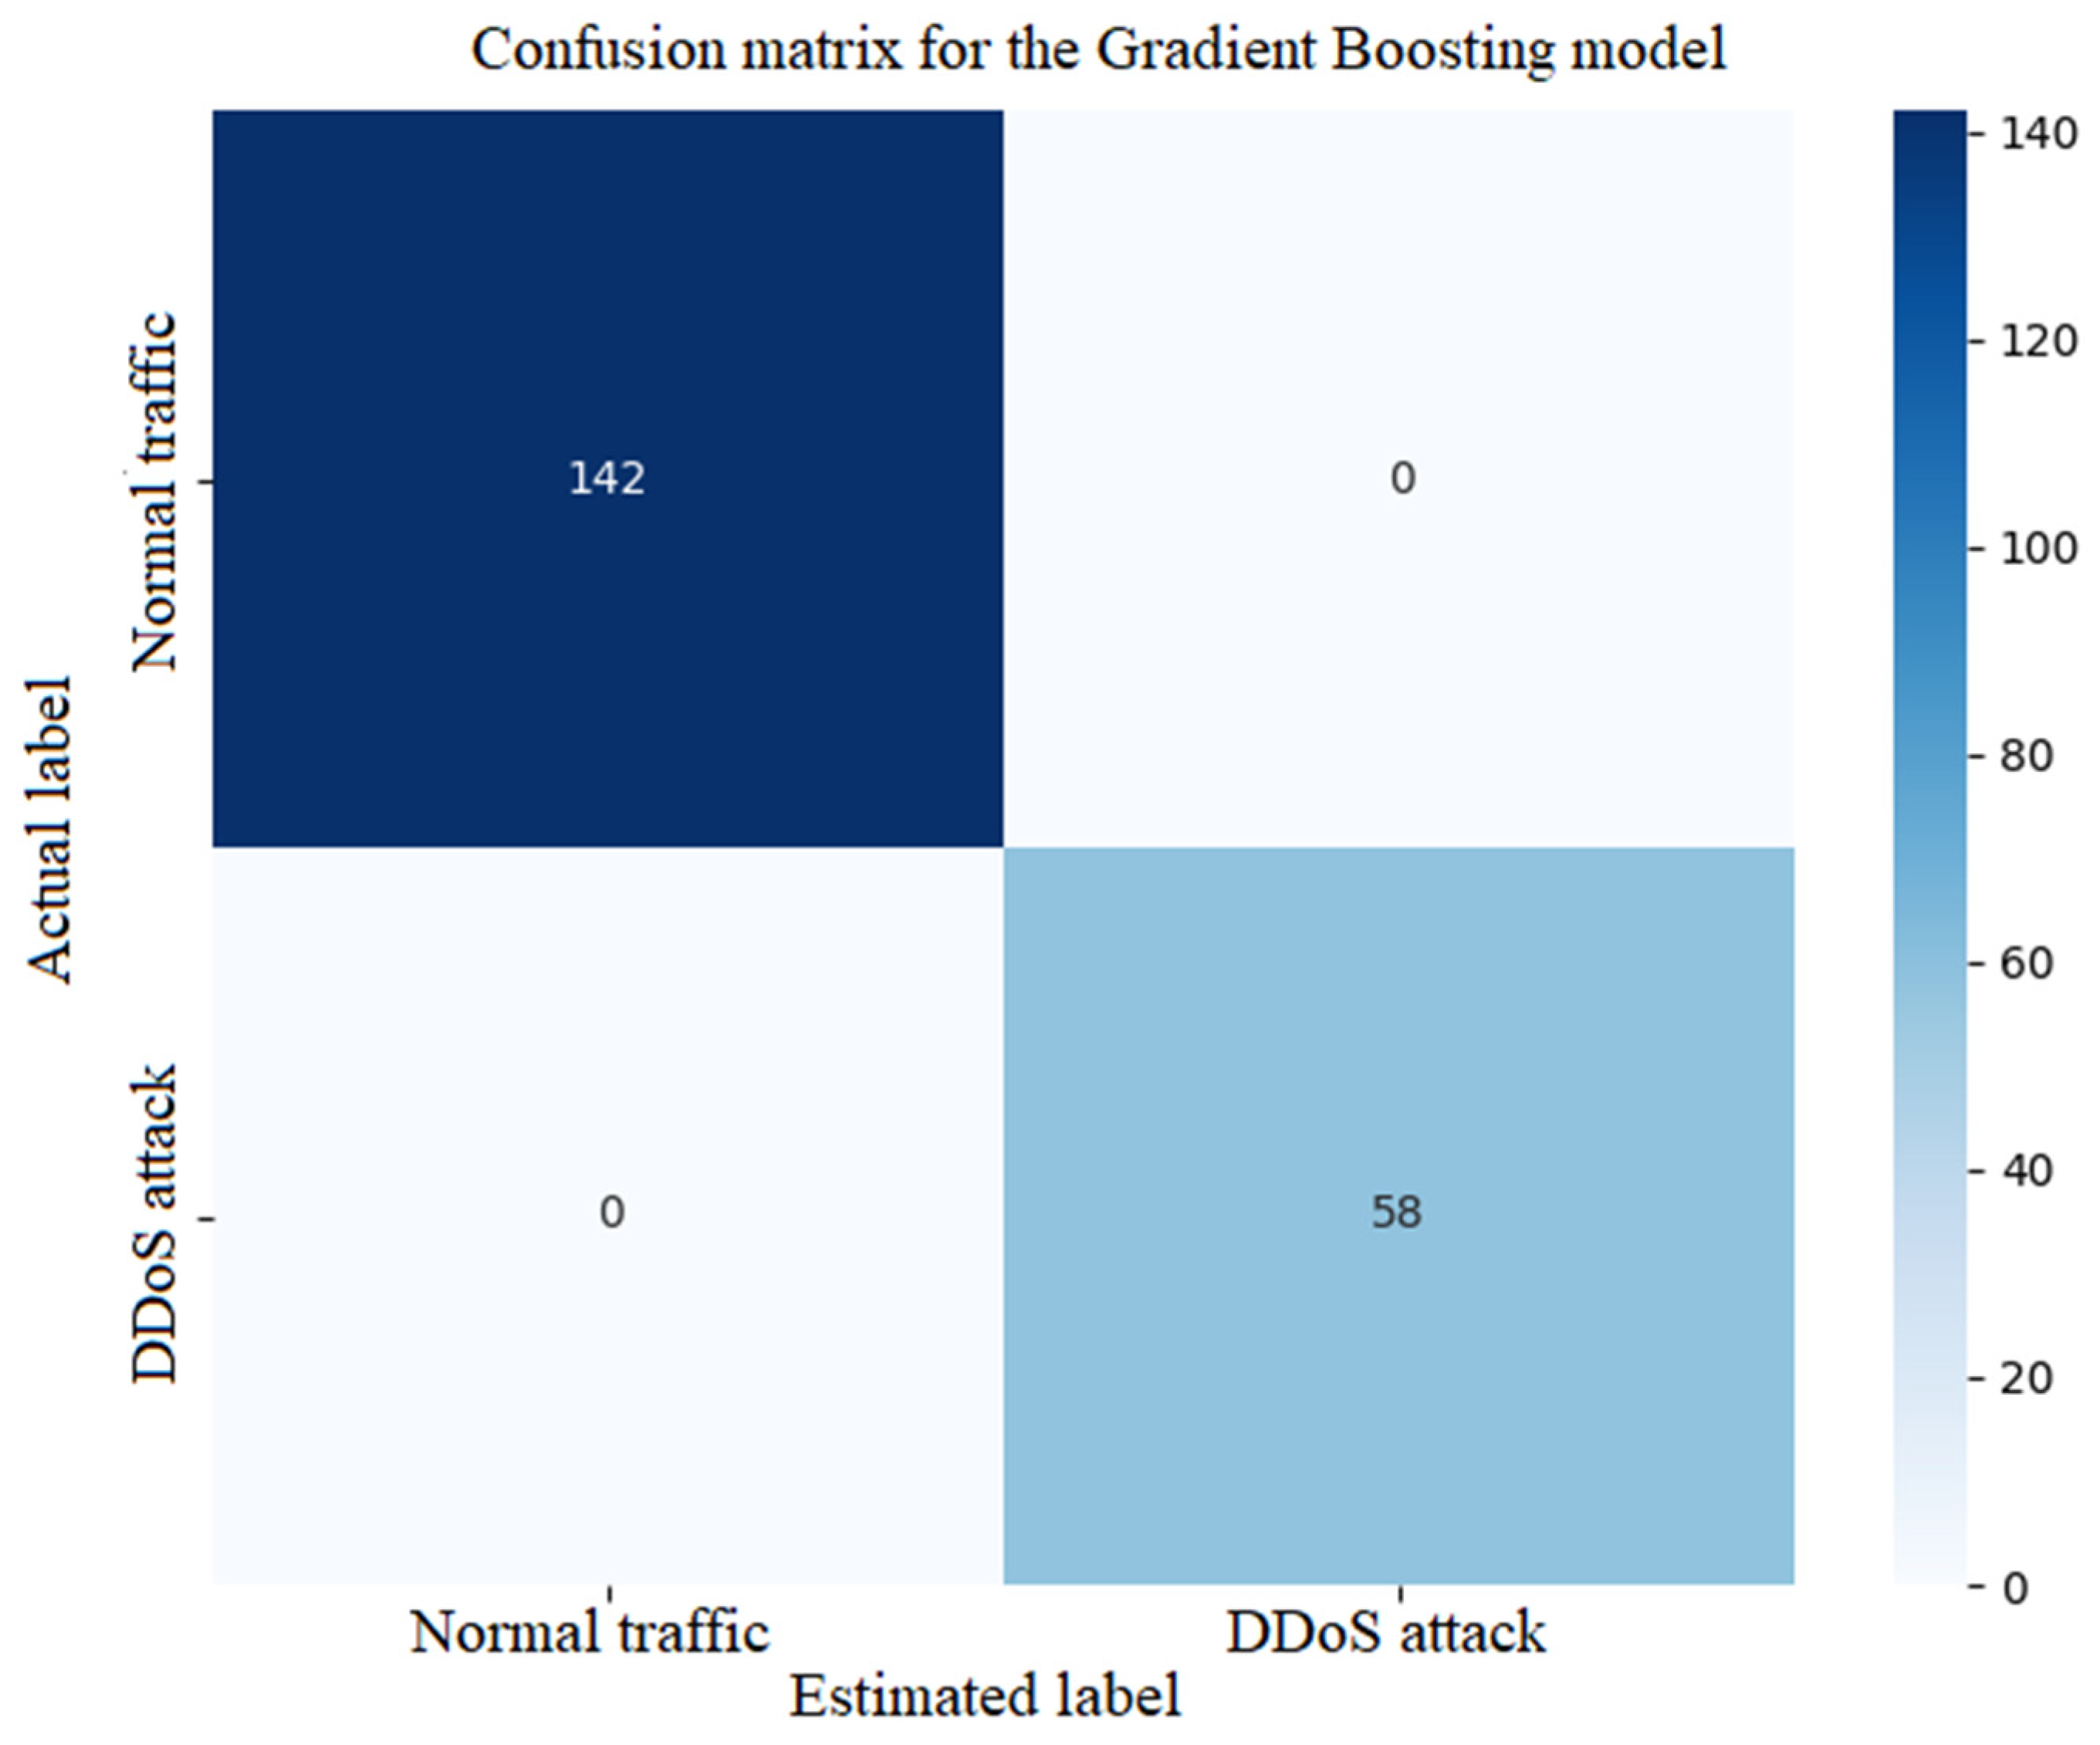
The confusion matrix shows the number of correct and incorrect classifications for each class (normal traffic and DDoS attack), presented on a heatmap with colors (e.g., blue for correct, red for wrong). The confusion matrix allows you to assess how well the model is at class recognition. A high number of false positives (normal traffic classified as an attack) can indicate that the model is overly vulnerable, which can lead to false positives. A high number of false negatives (an attack classified as normal traffic) can be critical because it means that attacks are not detected, which can have serious consequences for network security.
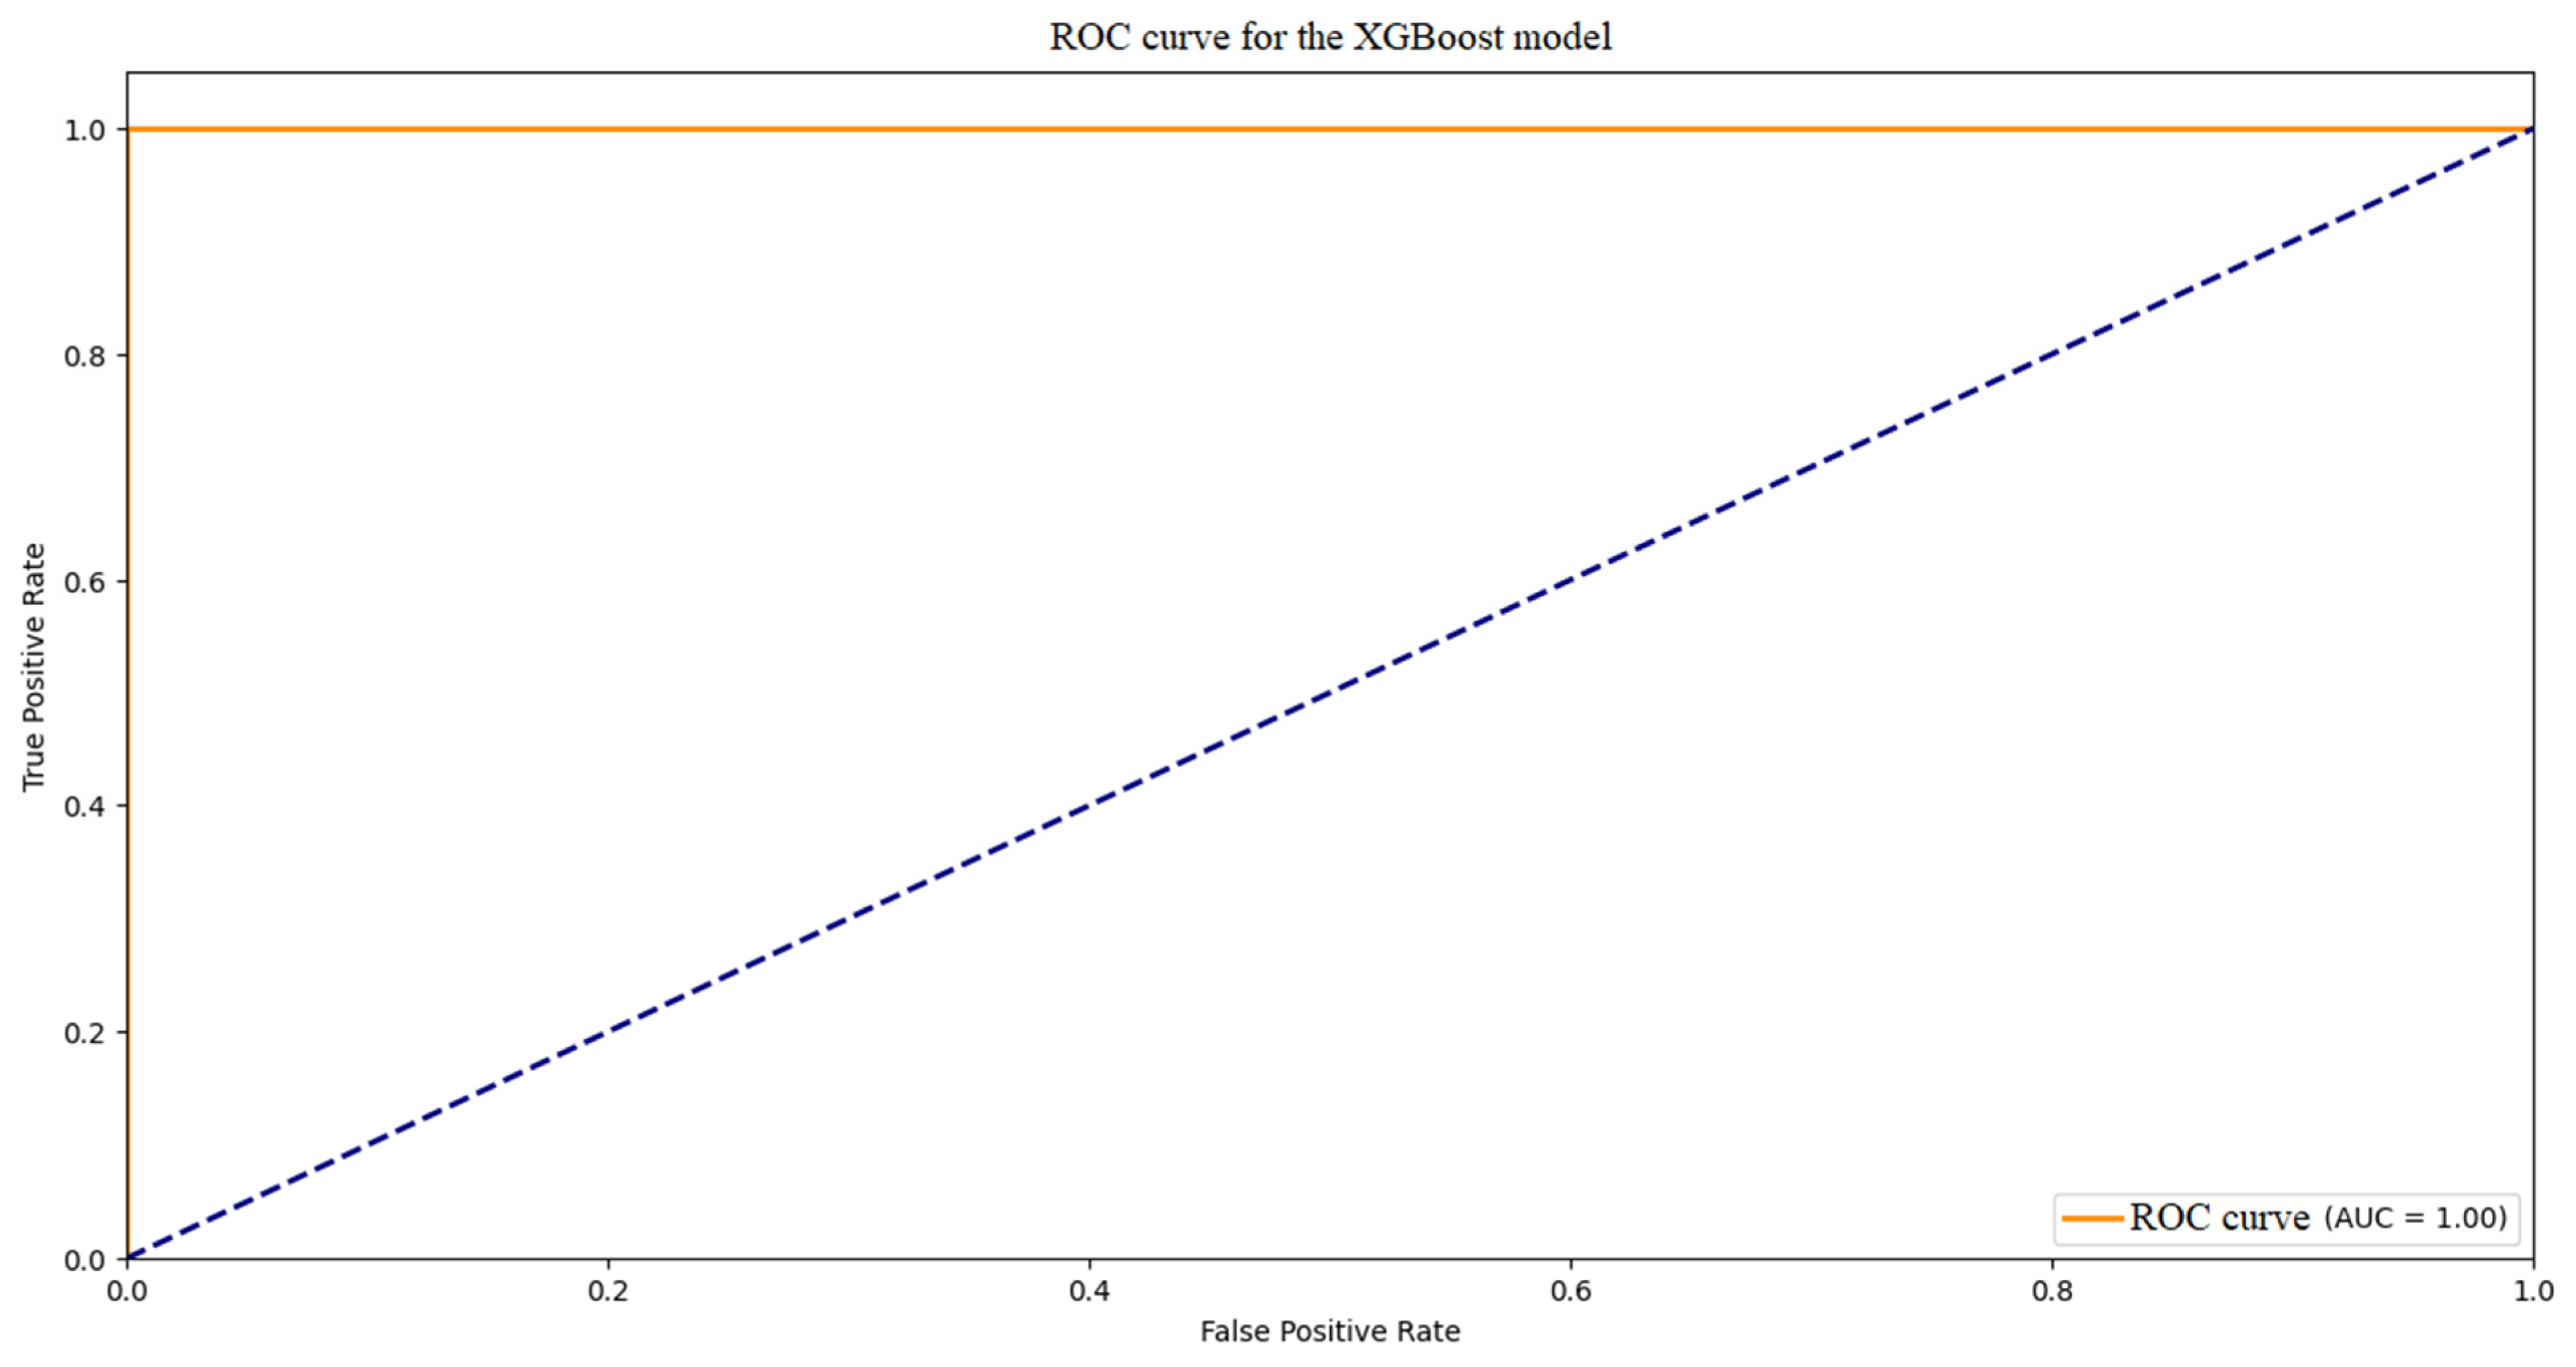
The Receiver Operating Characteristic (ROC) curve represents the ratio of true positives (TPR) to false positives (FPR) for different decision thresholds, shown in a graph with an orange line for the ROC curve and a blue dashed line for a random model. The ROC curve shows the quality of the model in distinguishing classes. The area under the curve (AUC) is a measure of overall performance. An AUC close to 1 indicates an excellent model, indicating a high ability to distinguish between normal movement and attacks. AUC = 0.5 denotes a random model, suggesting that the model does not perform better than a random selection. An AUC between 0.7 and 0.8 is considered good, and above 0.8 is considered very good, indicating the high performance of the model in practice.
Figure 5 shows the histograms for the values of seven characteristics (number of packets per second ‘pkt_per_sec’, number of unique device addresses ‘uniq_devaddr_count’, average signal strength ‘avg_rssi’, average signal-to-noise ratio ‘avg_snr’, uplink/downlink ratio ‘uplink_downlink_ratio’, average payload size ‘payload_size_mean’, average time difference between packets ‘timestamp_gap_mean’) for both classes, with colors that distinguish normal traffic (e.g., blue) from DDoS attacks (e.g., red).
By analyzing the histograms in
Figure 5, it is possible to interpret the features for both classes of synthetic data. The distribution of the packets per second ‘pkt_per_sec’ perk trait for attacks is shifted to the right from normal traffic, with higher values (e.g., average ~110 vs. ~8.5), indicating higher traffic volume during attacks. Higher density of the number of unique device addresses ‘uniq_devaddr_count’ for values larger (e.g., 6–16) in attacks compared to normal traffic (2–5), suggesting a higher number of sources. The feature distributions of the mean signal strength ‘avg_rssi’ and the mean signal-to-noise ratio ‘avg_snr’ may be more diffuse for attacks, with similar medians but greater deviation, indicating signal variability. With the uplink/downlink ‘uplink_downlink_ratio’ ratio trait, higher values for attacks are noticeable, reflecting higher outbound traffic. For the ‘payload_size_mean’ and ‘timestamp_gap_mean’ traits, attacks may show smaller timestamp gaps (e.g., lower timestamp_gap_mean values). Histograms confirm that traits like ‘pkt_per_sec’ and ‘uniq_devaddr_count’ are key to class differentiation, with a clear shift in distributions for attacks, which supports the effectiveness of classifications.
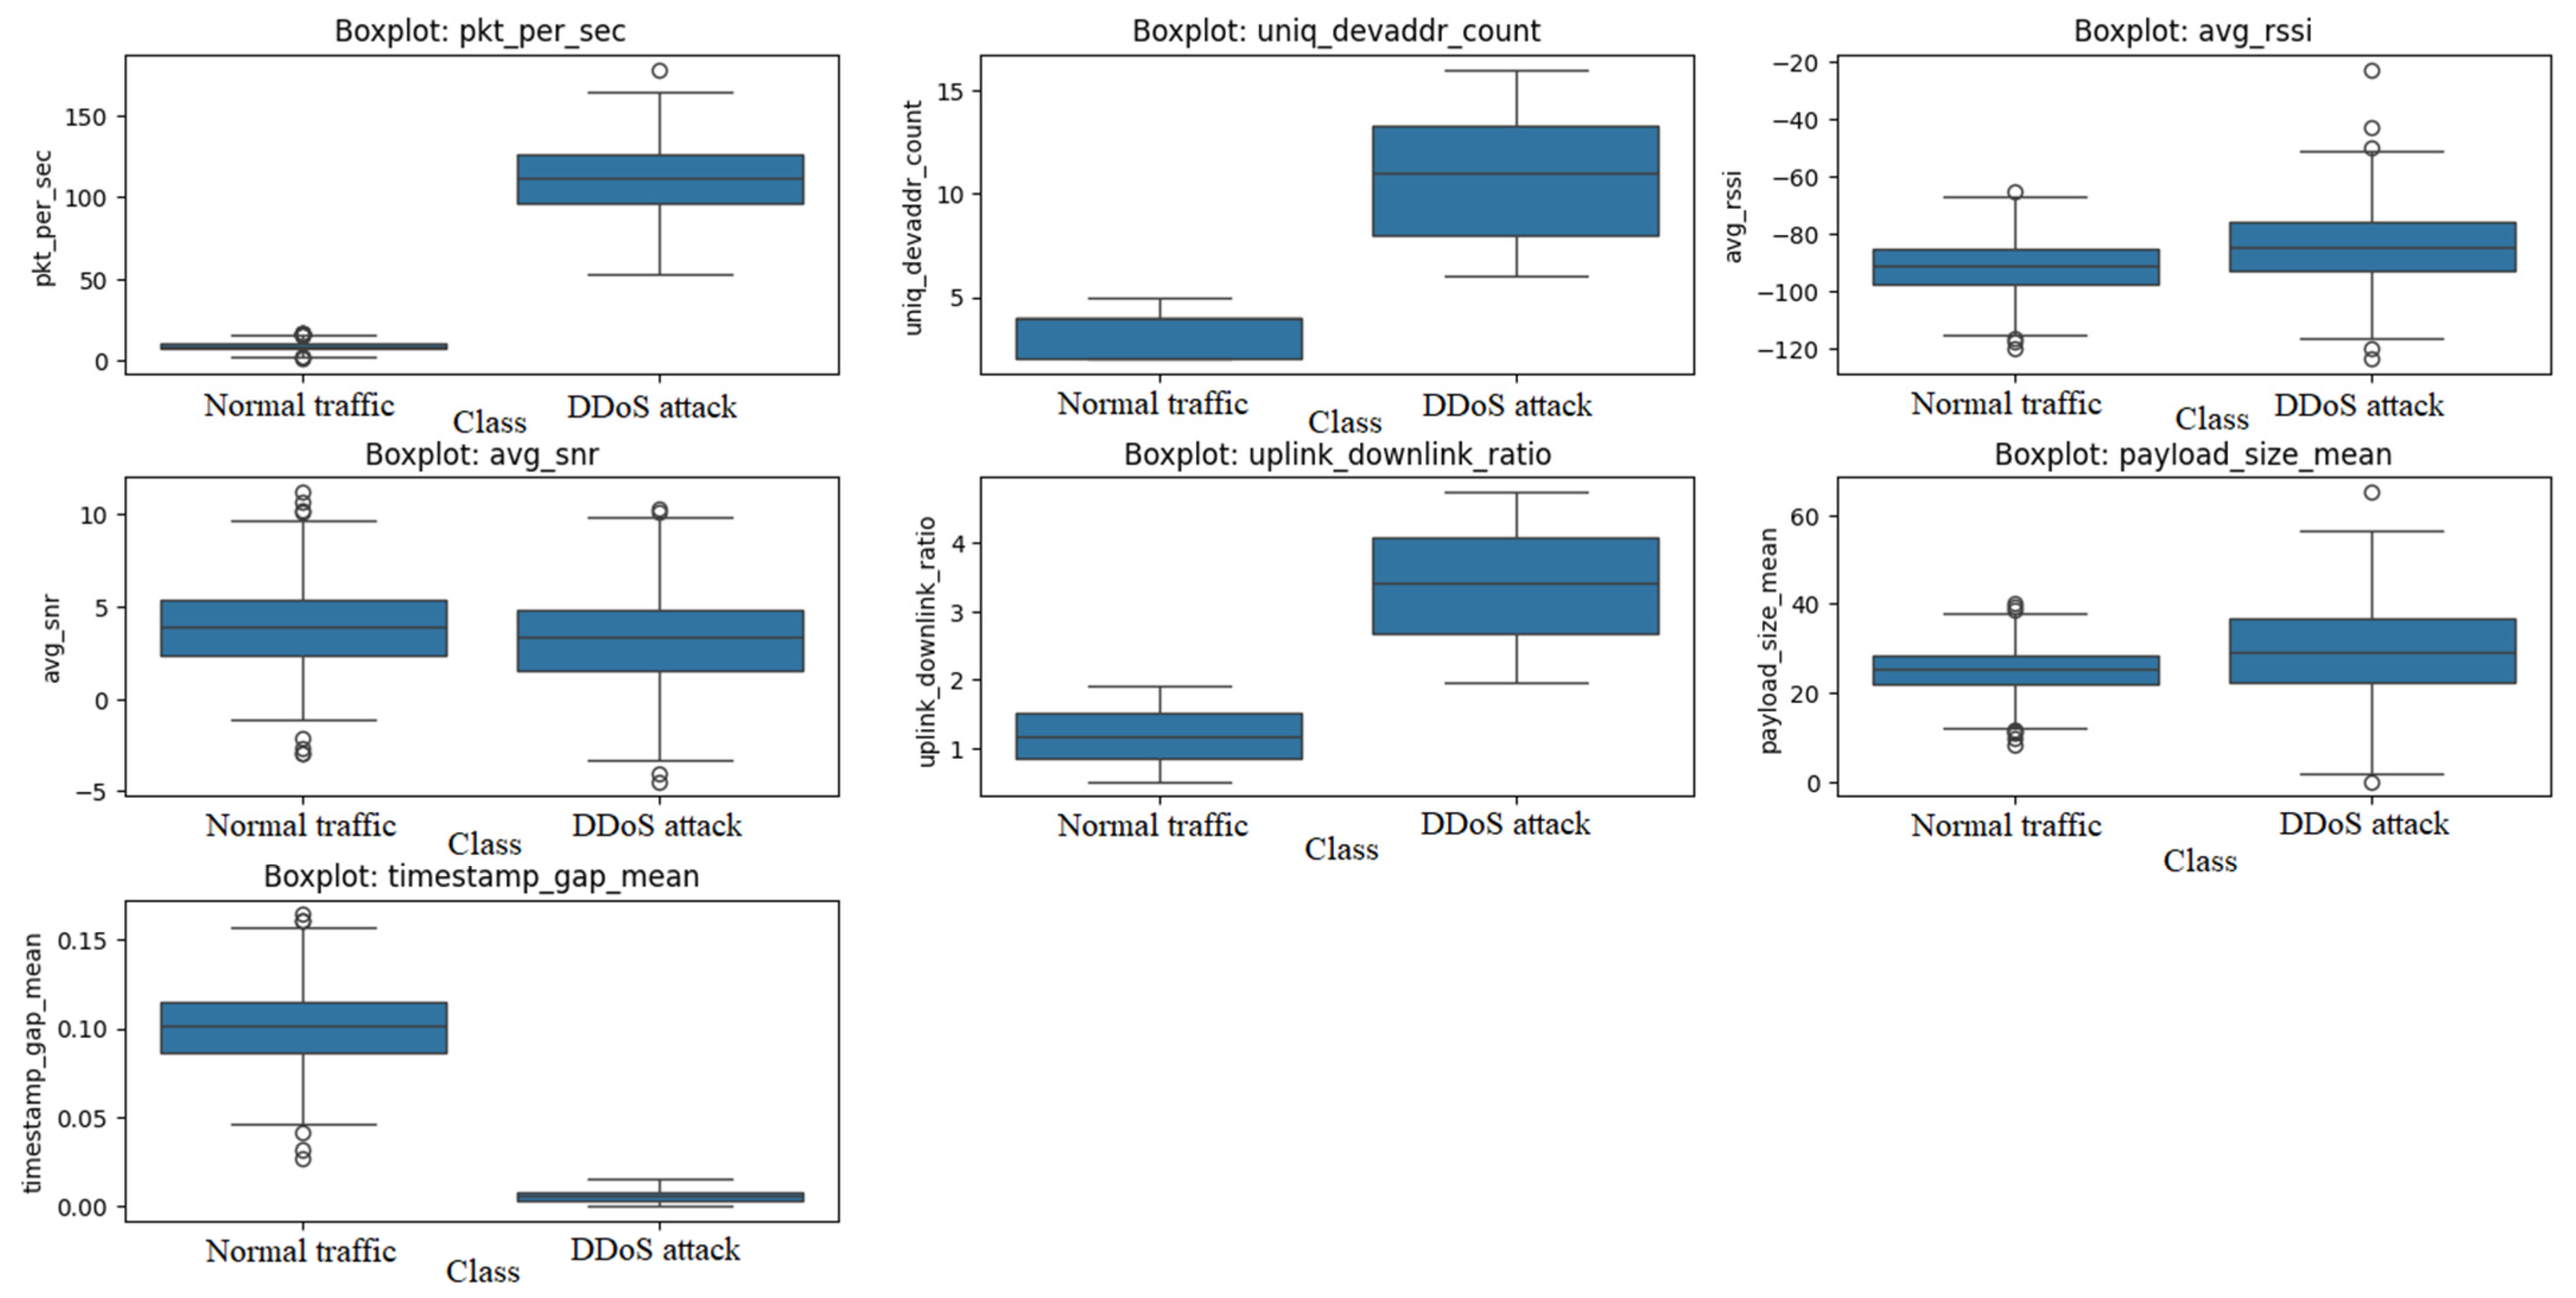
Figure 6 shows boxplots showing the distribution of feature values for both classes. The median of the ‘pkt_per_sec’ trait for attacks is much higher (e.g., ~100 vs. ~10), with a wider spread and more outliers, reflecting the variability in traffic volume. Higher median feature ‘uniq_devaddr_count’ for attacks (e.g., ~10 vs. ~4), with a broader range, indicating more devices in attacks. For the ‘avg_rssi’ and ‘avg_snr’ traits, similar medians are noticeable, but a greater spread for attacks, suggesting signal instability during attacks. For the ‘uplink_downlink_ratio’ trait, there is a higher median for attacks (e.g., ~3 vs. ~1), with a larger range, which is typical for outbound DDoS traffic. For the ‘payload_size_mean’ and ‘timestamp_gap_mean’ traits, attacks have a smaller median timestamp gap.
Box plots highlight differences in median and spread, especially for ‘pkt_per_sec’ and ‘uniq_devaddr_count’, indicating their importance in attack analysis and potential utility in models.
Figure 7 shows a pairplot showing the relationships between selected features, showing the distributions on the diagonal and the correlations between the features in the remaining fields, with colors to distinguish the classes.
The interpretation of the graph in
Figure 7 is as follows. For the ‘pkt_per_sec’ vs. ‘uniq_devaddr_count’ trait pair, the attack points are clustered in the upper right corner (high values of both traits) while normal traffic is concentrated in the lower left, suggesting a strong correlation between the number of packets and the devices in the attacks. For the pair of traits ‘pkt_per_sec’ vs. ‘avg_rssi’ there is no clear separation, but attacks can show higher ‘pkt_per_sec’ values with a similar ‘avg_rssi’. For a pair of ‘uniq_devaddr_count’ vs. ‘payload_size_mean’ traits, attacks can have higher ‘uniq_devaddr_count’ values with a differentiated ‘payload_size_mean’, indicating a variety of sources. The par graph in
Figure 7 shows that features such as ‘pkt_per_sec’ and ‘uniq_devaddr_count’ separate classes well, suggesting that classification models can use these relationships effectively.
Figure 8 shows a 3D graph showing the distribution of data in a three-dimensional space of three selected features.
The graph in
Figure 8 shows the distribution of data across the space of three characteristics (‘pkt_per_sec’, ‘uniq_devaddr_count’, ‘avg_rssi’), with blue points for normal traffic and red points for DDoS attacks. Normal motion forms a cluster with low ‘pkt_per_sec’ values (e.g., <20) and ‘uniq_devaddr_count’ (e.g., 2–6), with a varied ‘avg_rssi’. Attacks form a separate cluster with high ‘pkt_per_sec’ values (e.g., >80) and ‘uniq_devaddr_count’ (e.g., 6–16), with a similar ‘avg_rssi’ distribution. Minimal class overlap suggest good separability in this space. Minimal class overlap indicates that synthetic data is well-designed to reflect the differences between normal traffic and DDoS attacks. Good separability in this space means that the selected features (‘pkt_per_sec’, ‘uniq_devaddr_count’, ‘avg_rssi’) are effective in distinguishing classes, which is promising for further analysis and implementation of DDoS detection systems. Good class separation in the pair and 3D graphs suggest that synthetic data is suitable for training classification models such as Gradient Boosting or XGBoost that can effectively detect attacks based on these characteristics. Graph analysis highlights the importance of high traffic volumes and the number of sources as DDoS indicators, which is consistent with the literature and can be useful for real-time detection systems. The literature [
21,
22,
23,
24,
25,
26,
27,
28,
29,
30,
31,
32,
33,
34,
35,
36,
37,
38,
39,
40,
41,
42,
43] confirms the importance of high traffic volume and the number of sources as DDoS indicators in real-time detection systems.
For each of the Gradient Boosting, Random Forest, SVM and XGBoost models, simulations of DDoS attack detection on synthetic data were carried out. Simulation of DDoS attack detection for these models allows you to assess their effectiveness, understand key features and prepare the models for implementation in practice to validate these models on real data.
Figure 9 shows the confusion matrix for the Gradient Boosting model.
The confusion matrix in
Figure 9 for the Gradient Boosting model shows a high number of true positives (TPs) and true negatives (TNs), with a minimum number of false positives (FPs) and false negatives (FNs). For example, TP can be ~90% of attack samples and FN below 10%, which means good attack detection.
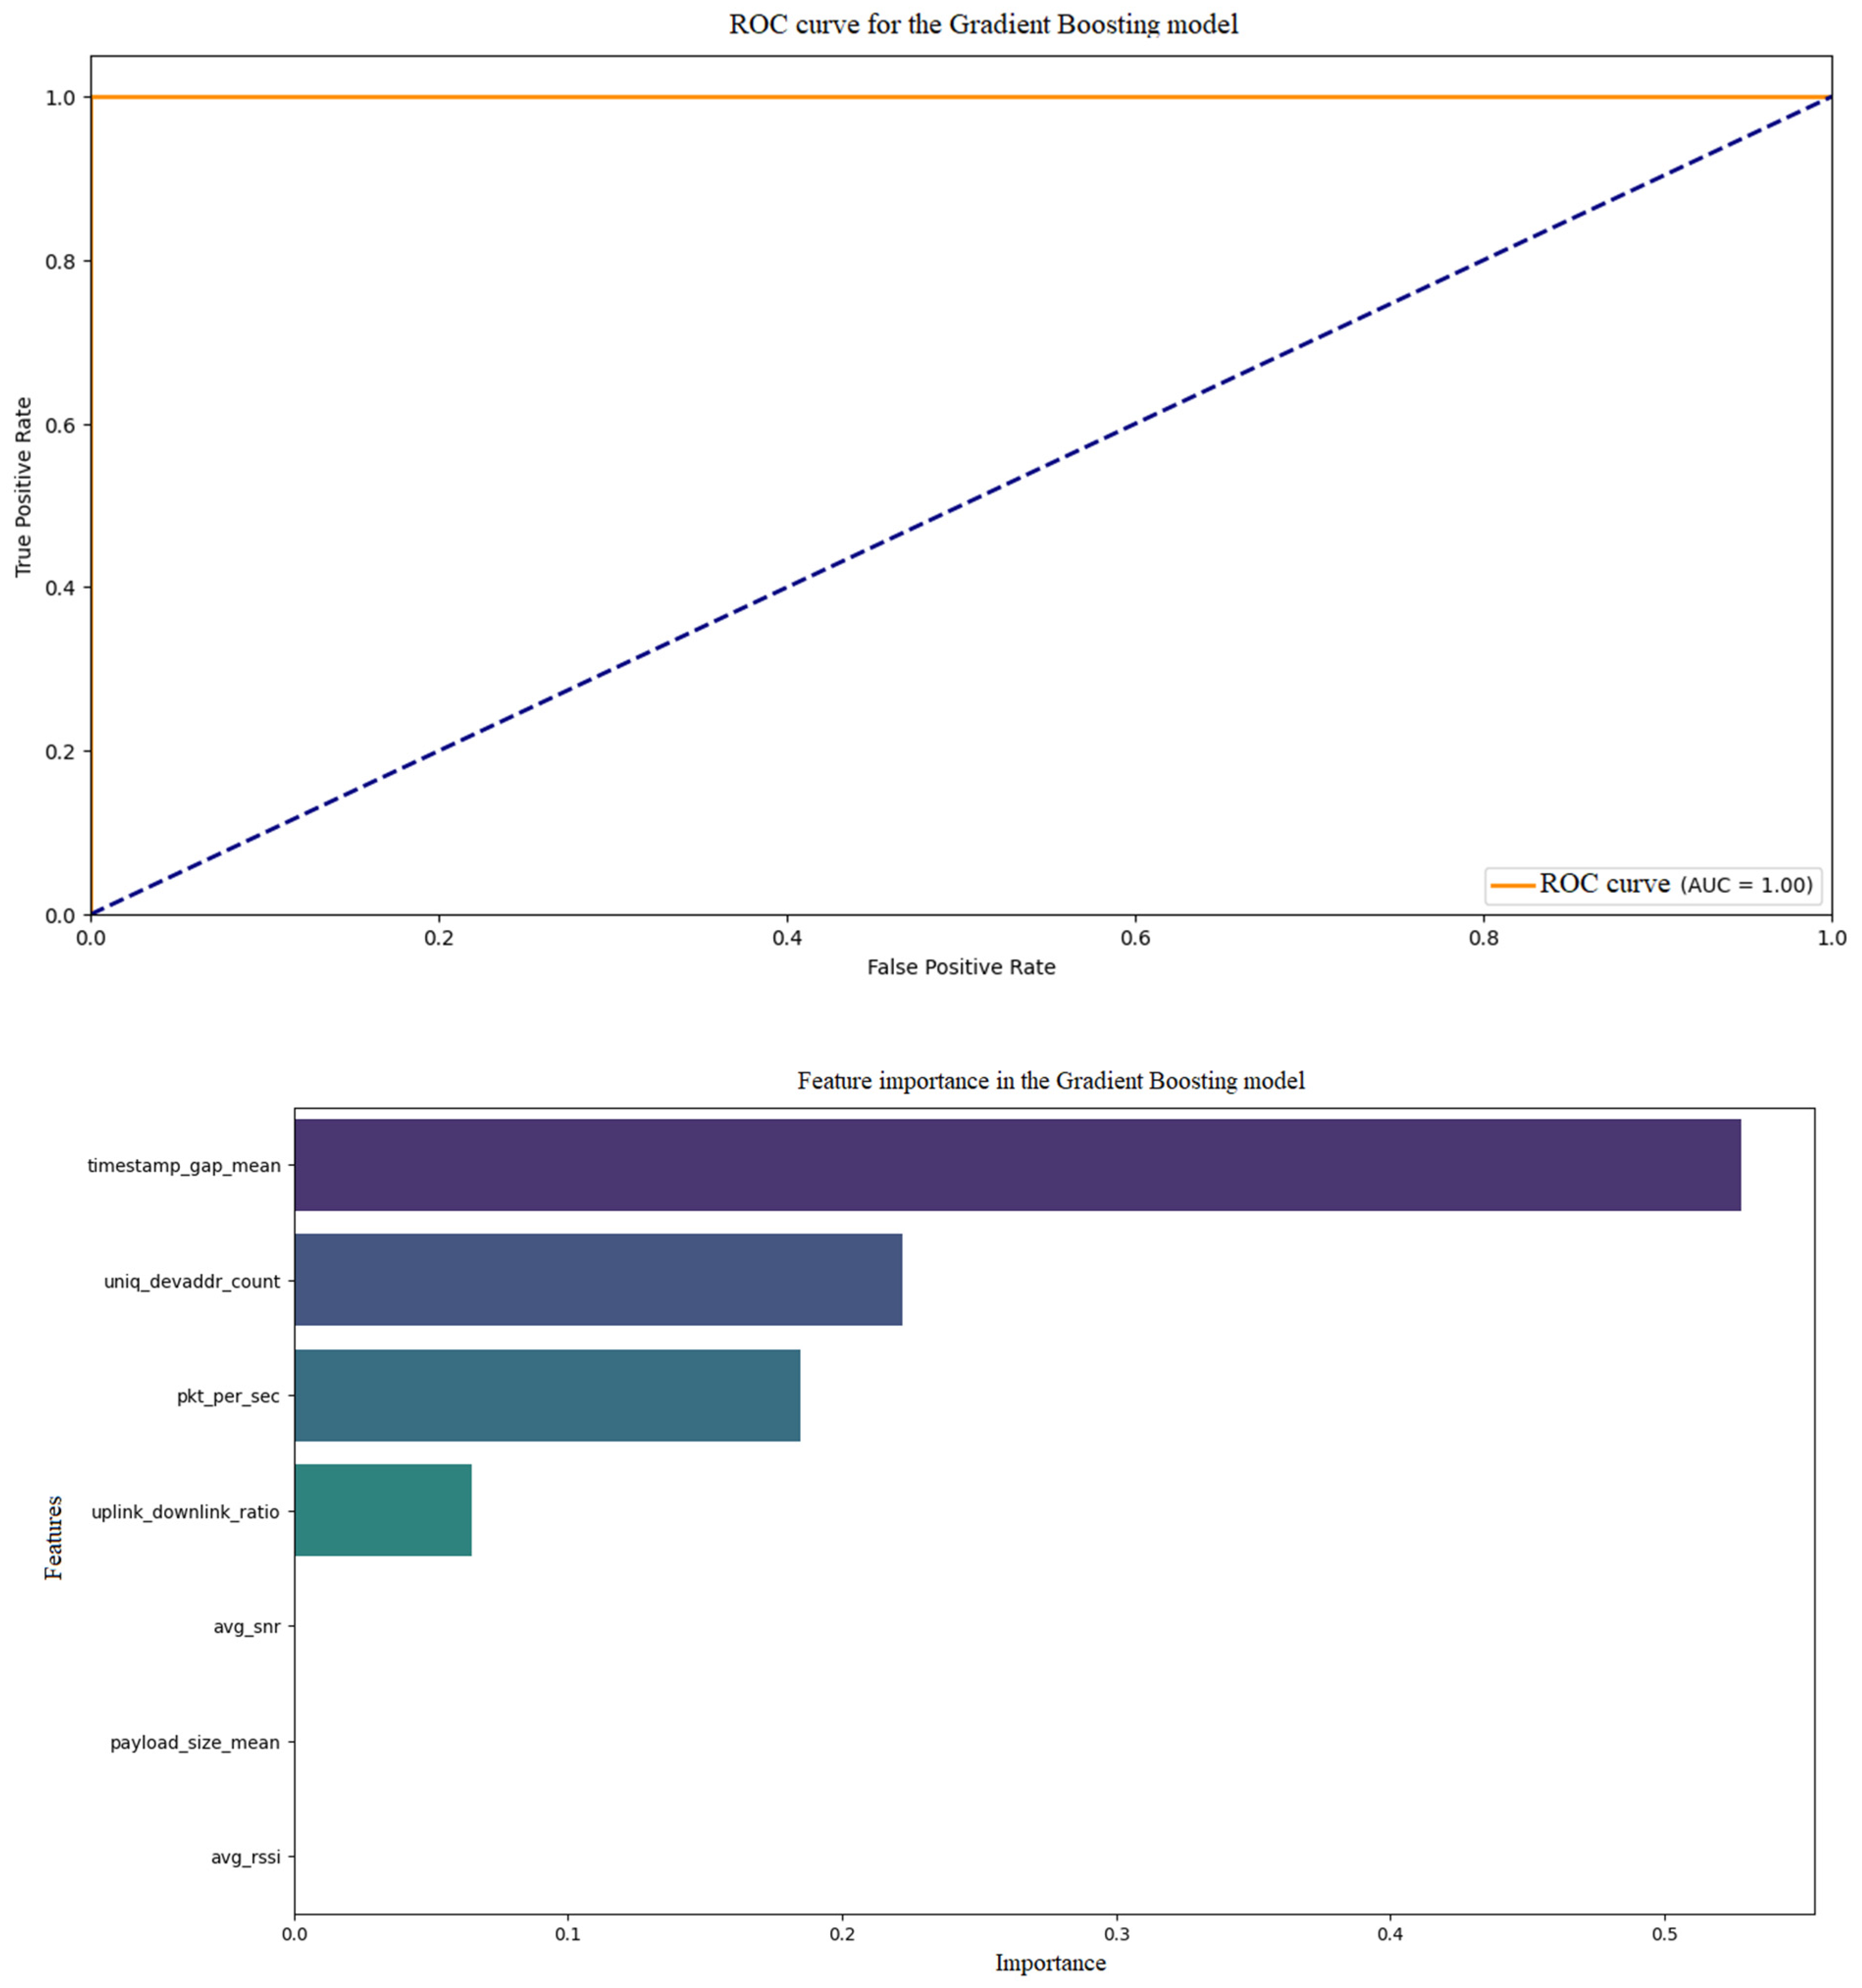
Figure 10 shows the ROC curve and feature importance for the Gradient Boosting model. The ROC curve is fluid, with the area under the curve (AUC) likely close to 0.9–0.95, indicating the model’s high ability to distinguish between classes (normal traffic vs. DDoS attack). The line is clearly above the random line (0.5), suggesting good performance. In
Figure 10, traits such as ‘pkt_per_sec’ and ‘uniq_devaddr_count’ dominate (e.g., 40% and 30% importance), confirming their key role in DDoS identification. The Gradient Boosting model does well, with high sensitivity and specificity of the data, and the key features are as expected (high traffic and number of sources).
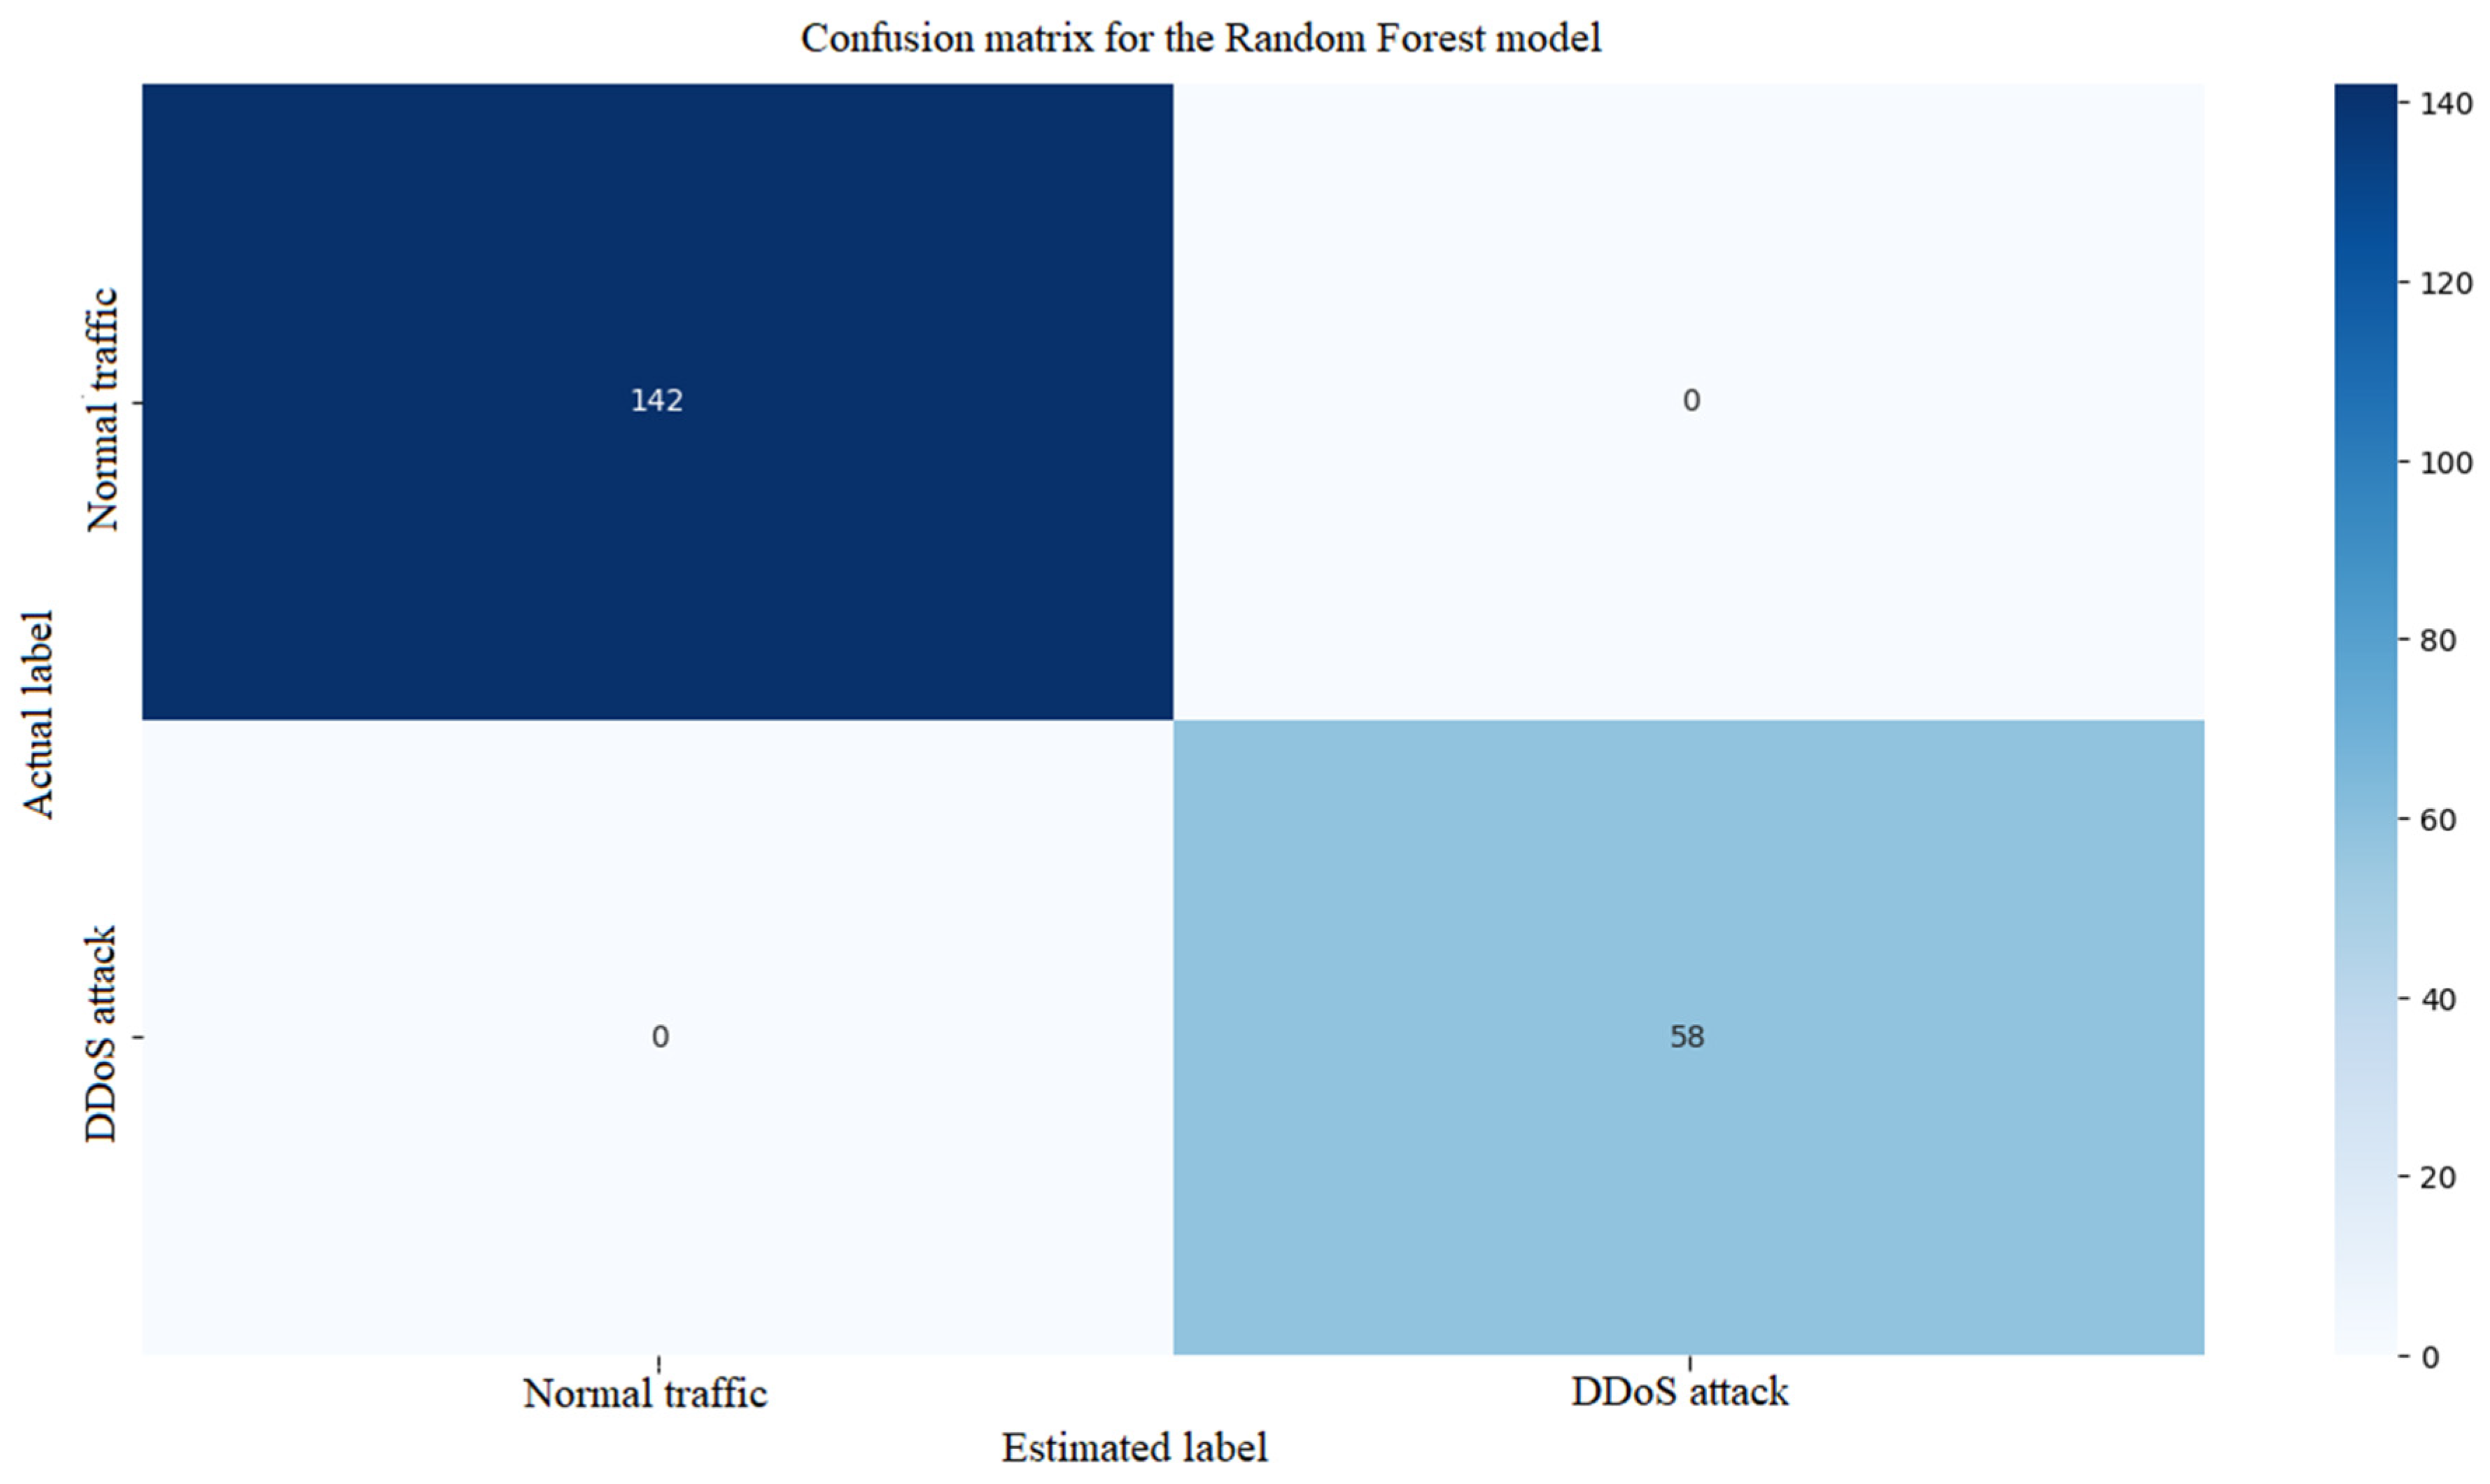
Figure 11 shows the confusion matrix for the Random Forest model.
The confusion matrix in
Figure 11 for the Random Forest model shows a high number of TP and TN, but slightly more FP and FN compared to Gradient Boosting (e.g., FN ~10–15%). The model detects attacks well, but can generate more false positives.
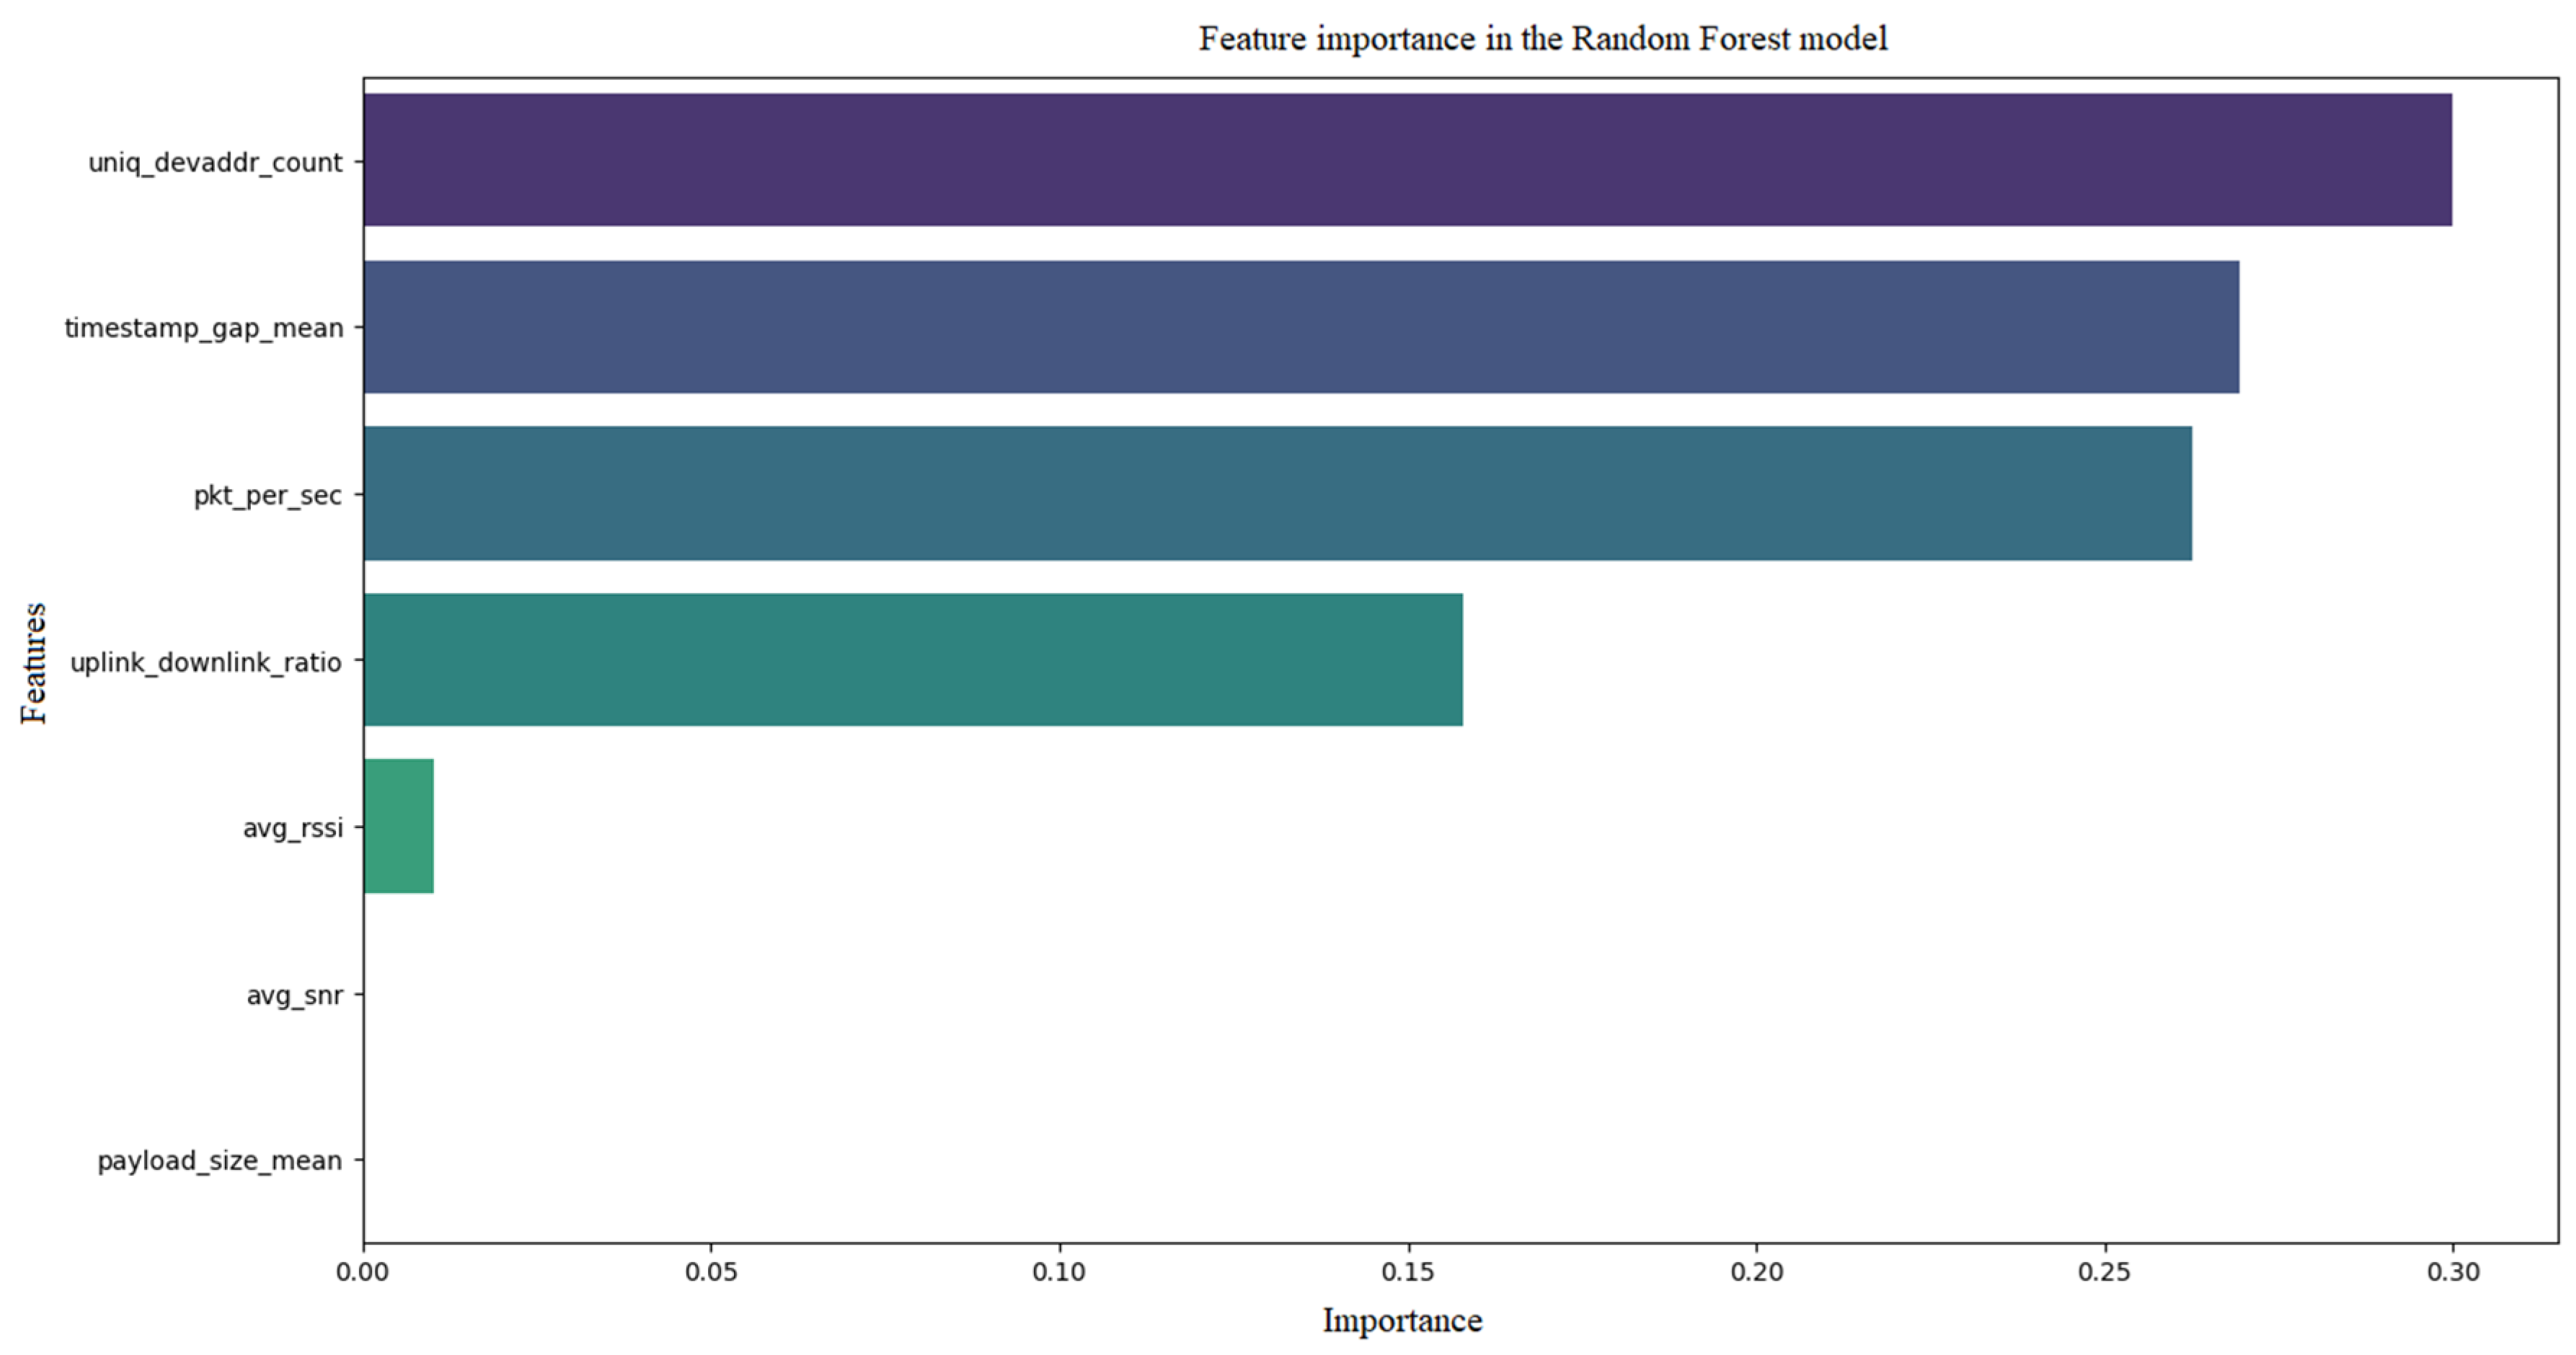
Figure 12 shows ROC curve and feature importance for the Random Forest model.
The ROC curve for the Random Forest model has an AUC in the range of 0.85–0.92, slightly below Gradient Boosting, suggesting good but not perfect class separation. The line is above random but less smooth than in Gradient Boosting. Similarly to Gradient Boosting, ‘pkt_per_sec’ and ‘uniq_devaddr_count’ are the most important (e.g., 35% and 25%), with less contribution from other characteristics. Random Forest is effective but less precise than Gradient Boosting, with a similar focus on the same characteristics.
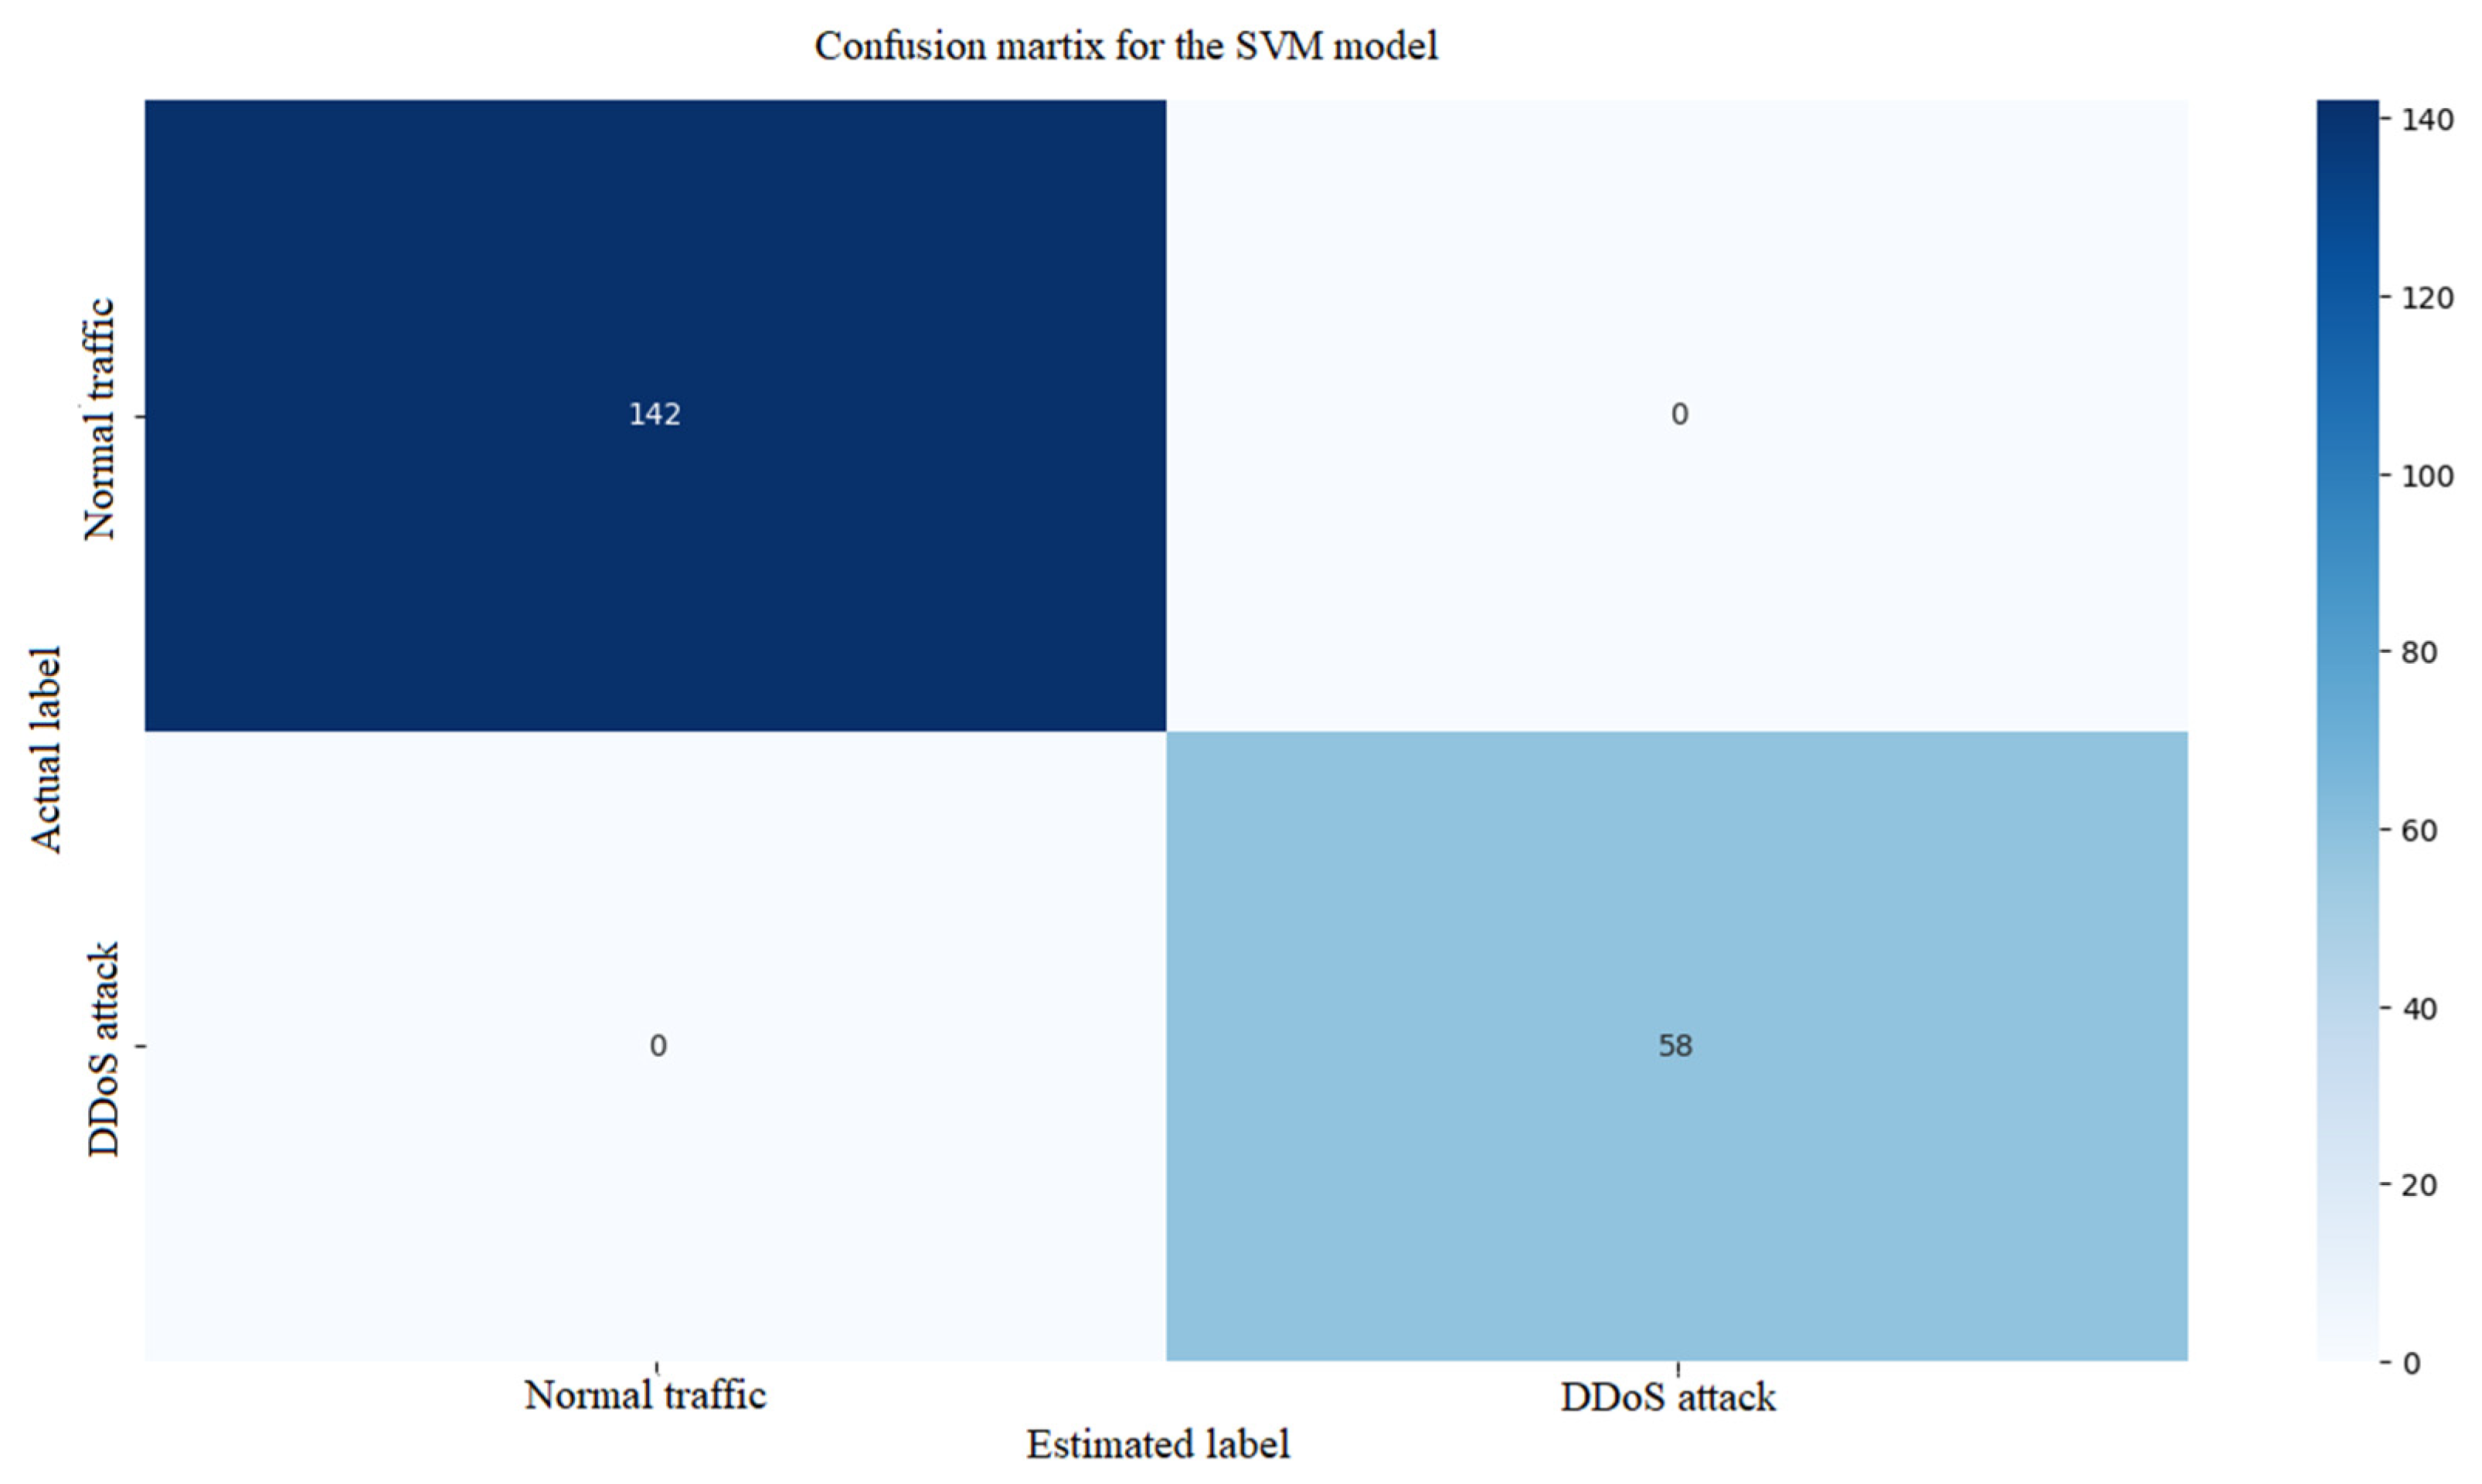
Figure 13 shows the confusion matrix for the Support Vector Machine (SVM) model. In this case, the TP and TN values are high, but the FN number is higher (e.g., 15–20%), which means that some attacks can be missed and FP is moderate. The next
Figure 14 shows the ROC curve for the SVM (Support Vector Machine) model. The ROC curve has an AUC in the range of 0.80–0.88, indicating a good but slightly lower performance than Gradient Boosting or Random Forest. The curve is less smooth, suggesting sensitivity to data scattering. There is no feature importance chart because SVM does not provide this metric explicitly. SVM performs well, but is less effective at detecting all attacks, likely due to the difficulty of non-linear decision boundaries in the data.
The last model simulated is the XGBoost model.
Figure 15,
Figure 16 and
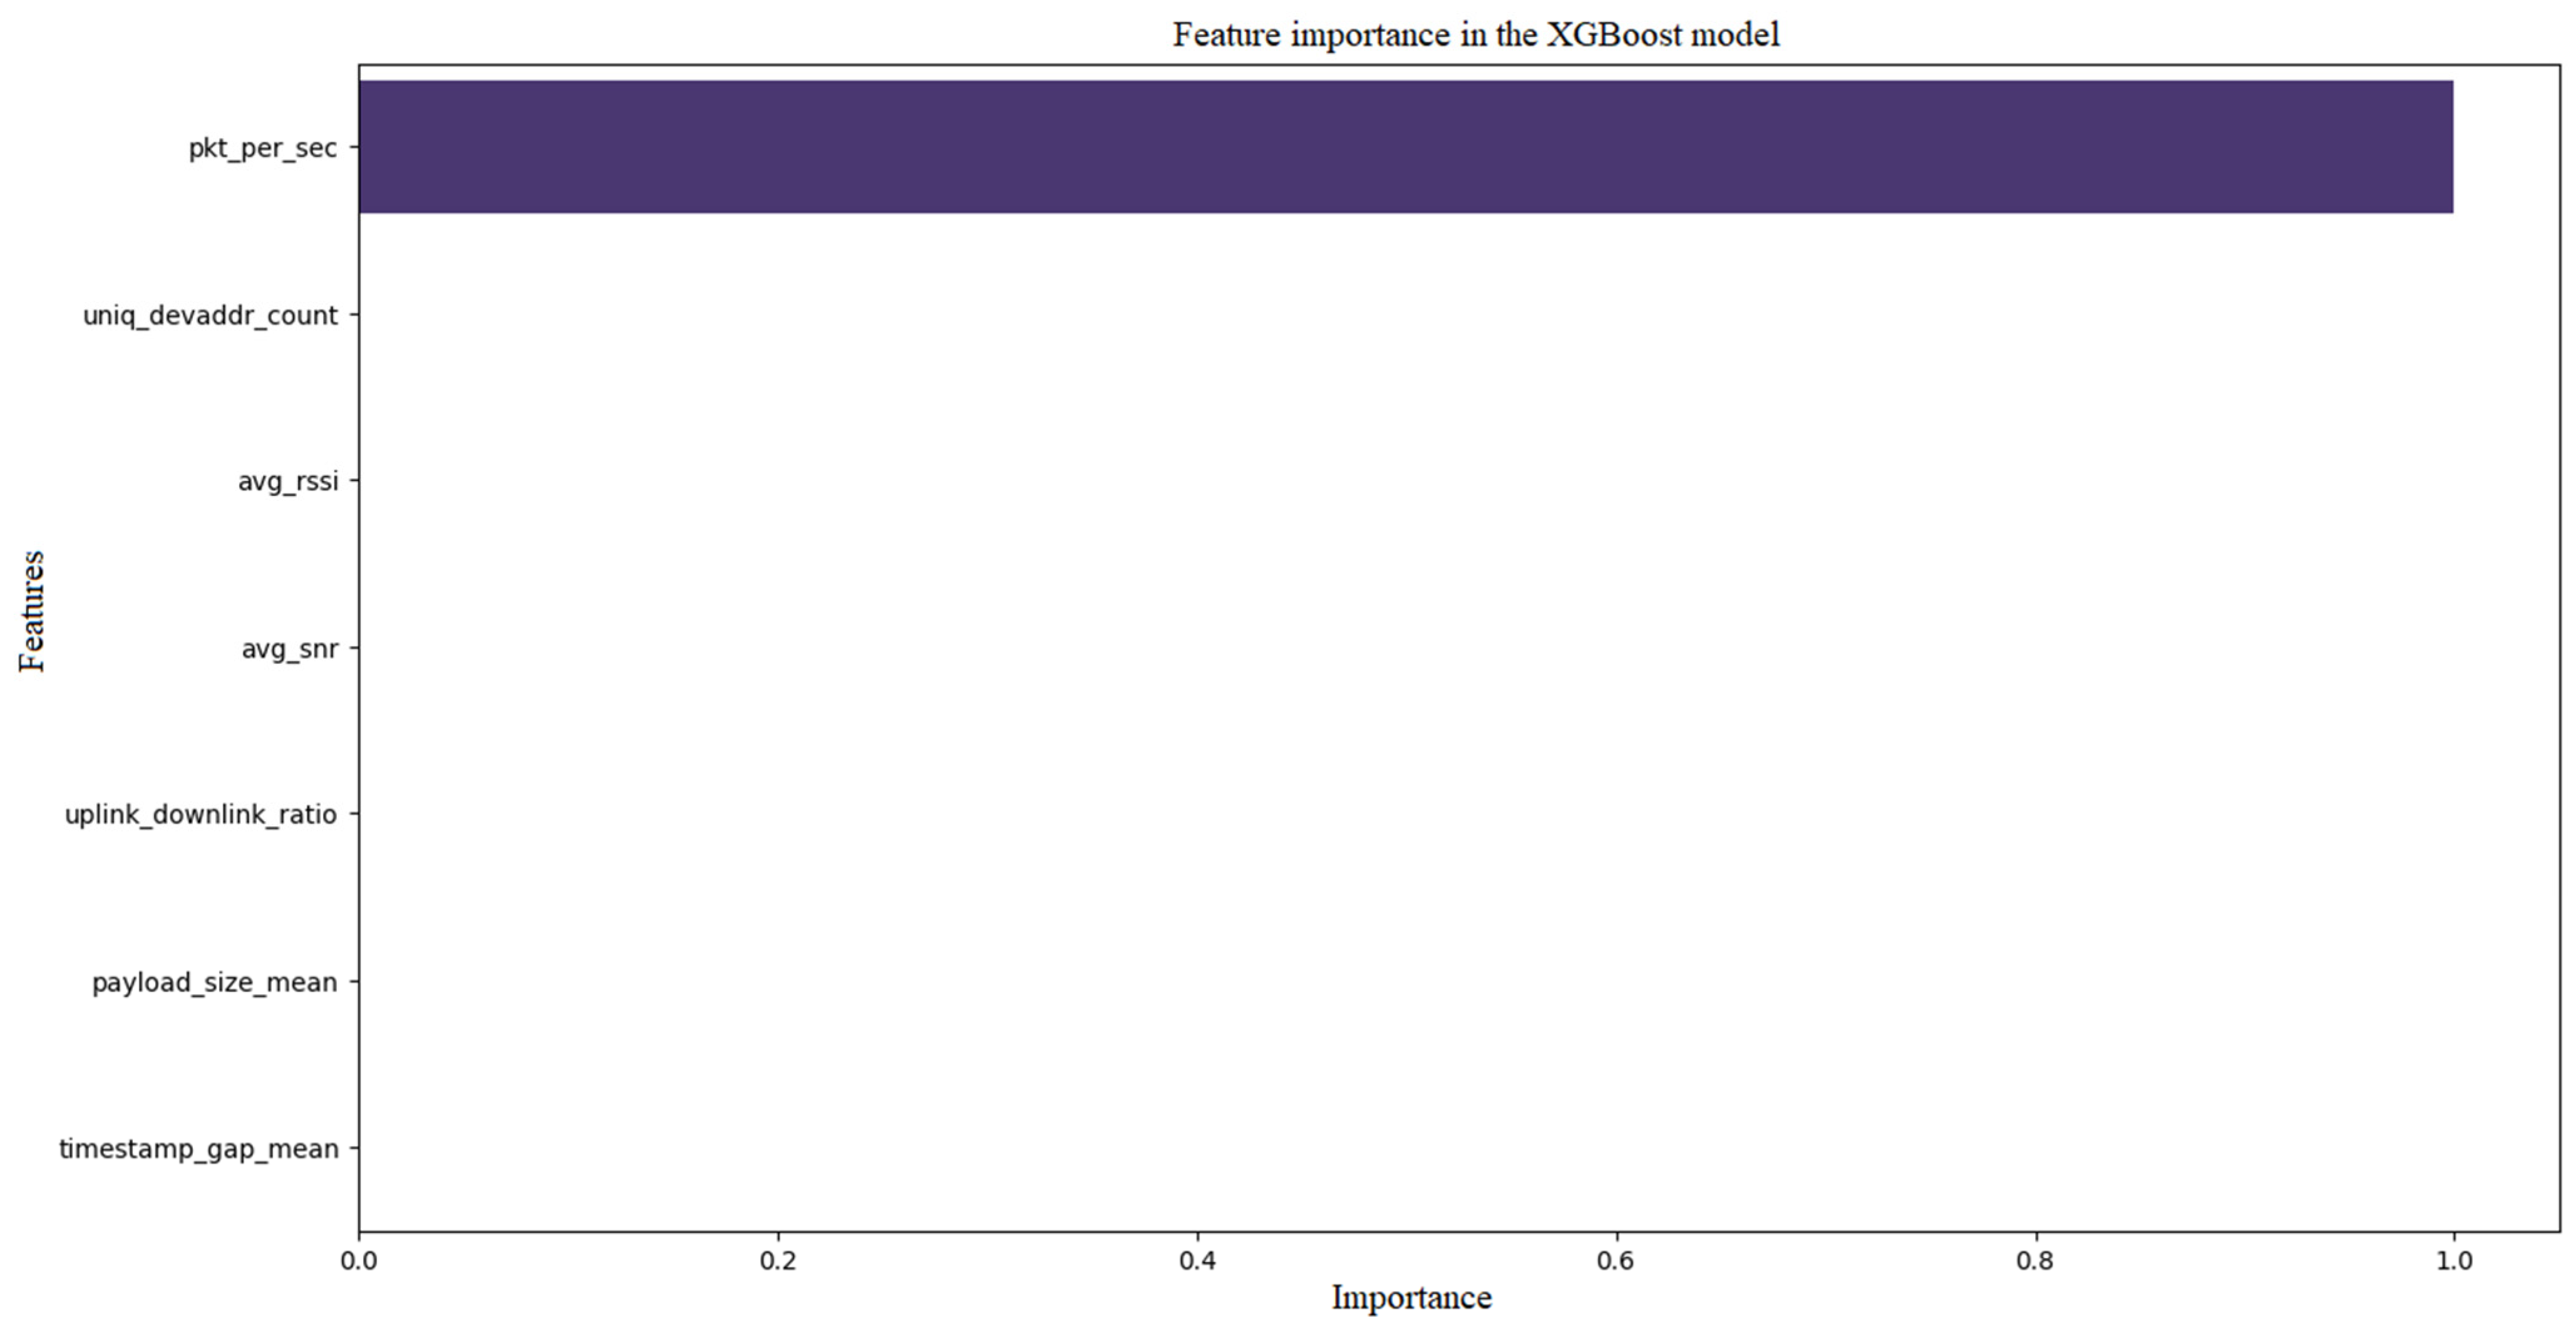
Figure 17 show the confusion matrix and the ROC curve and feature importance for the XGBoost model, respectively. The ROC curve has an AUC in the range of 0.90–0.96, which places the model at the Gradient Boosting level or slightly higher, indicating excellent class separation. The curve is smooth and clearly away from the random line. The error matrix exhibits a very high number of TP and TN, with minimal FN and FP (e.g., FN < 5%, FP < 5%), suggesting near-perfect detection and minimal false alarms. In the case of importance, the ‘pkt_per_sec’ and ‘uniq_devaddr_count’ features dominate (e.g., 45% and 35%), with a smaller proportion of ‘avg_rssi’ and ‘uplink_downlink_ratio’, which is in line with other models. XGBoost achieves the best results, with high precision and sensitivity, while confirming key features.
Table 3 presents a comparison and summary of the analysis of algorithms used to detect DDoS attacks on synthetic data.
Analyzing the comparison, it can be concluded that XGBoost and Gradient Boosting achieve the highest AUC (0.90–0.96) and the best results in error matrices, with minimal FN and FP, which makes them leaders in DDoS detection. Random Forest is a solid choice, but a bit less precise, and SVM is the weakest, especially in detecting all attacks. All leaders (Gradient Boosting, Random Forest, XGBoost) confirm that the ‘pkt_per_sec’ (traffic volume) and ‘uniq_devaddr_count’ (number of sources) characteristics are crucial, which is in line with DDoS characteristics and literature. XGBoost and Gradient Boosting are best suited for real-time detection systems due to their high sensitivity and low false negative count, which is critical in network protection. SVM may be less useful in the presence of complex, non-linear data. XGBoost seems to be the most effective model based on current results, but Gradient Boosting is a good alternative due to its similar performance and lower computational requirements.
Results of the ANOVA tests (for AUC, attack ratio 30%): F = 12.45, p-value = 0.001 (statistically significant differences between models). XGBoost and Gradient Boosting are significantly better than SVM (p < 0.05 in a pairwise t-test).
To verify the statistical significance and stability of results across multiple simulation runs and varying attack ratios, 10 iterations of synthetic data generation and model training (Gradient Boosting, Random Forest, SVM, XGBoost) were conducted to evaluate the stability of metrics (AUC, F1-score, accuracy, precision, recall). Mean values and standard deviations were calculated for each metric and model. T-tests (for pairwise model comparisons) and ANOVA (for multi-model comparisons) were applied to assess the statistical significance of differences in metrics across models and runs. The results, presented in
Table 4, show multiple simulation runs for four models and different attack ratios, displaying mean values and standard deviations for AUC, F1-score, and accuracy. The results indicate high stability for XGBoost and Gradient Boosting and lower performance for SVM. ANOVA (analysis of variance) was used to compare mean metric values (AUC, F1-score, accuracy) across all four models (Gradient Boosting, Random Forest, SVM, XGBoost) for each attack ratio (20%, 30%, 40%, 50%). ANOVA determines whether there are statistically significant differences in performance between models. This test was applied to compare all models, with results (F = 12.45,
p = 0.001 for AUC at 30%) confirming significant performance differences. T-tests were used for pairwise model comparisons (e.g., XGBoost vs. SVM), with results (
p < 0.05) confirming the superiority of XGBoost and Gradient Boosting.
The analysis showed that XGBoost and Gradient Boosting are the most effective algorithms for detecting DDoS attacks based on synthetic data, offering high accuracy and class separation. Random Forest is a solid compromise, and SVM needs optimization or additional features for better performance. The results highlight the importance of high traffic volumes and the number of sources, which supports their use in real-time detection systems. The simulation enabled the selection of the best model (XGBoost) and the understanding of the differences in performance and application for detecting DDoS attacks on synthetic data, contributing to the development of safe and sustainable transport systems. It was also confirmed that synthetic data well reflects the characteristics of DDoS attacks, which is crucial for future field tests, supporting the deployment of energy-efficient and green ITS infrastructures. Further development will focus on validation with real data to confirm the effectiveness of the models and on expanding data and techniques to address the complexity of DDoS attacks, while keeping power consumption low and minimizing environmental impact. It is also planned to improve synthetic data by adding new attack scenarios and features and comparing the effectiveness of the synthetic data models presented in this paper with real data from production networks (e.g., servers or IoT).
The experiments presented in this article rely on synthetic data, enabling controlled testing of machine learning algorithms in a simulated LoRaWAN environment. The use of synthetic data was necessitated by limitations in accessing real-world network data due to privacy and security concerns, a common challenge in cybersecurity research [
44,
45,
46,
47,
48,
49,
50]. While synthetic data accurately reflects the characteristics of DDoS attacks and normal traffic, we acknowledge that the absence of validation with real-world data may limit the external validity of the findings. In the next steps, we plan to validate the model using real-world LoRaWAN network data from an existing network infrastructure currently being prepared. Additionally, we intend to conduct comparative analyses with publicly available datasets, such as CICIDS2017 or NSL-KDD, which include DDoS attack data, to verify the model’s effectiveness in realistic scenarios. These steps will confirm the robustness and generalizability of the results, supporting the development of secure and sustainable transportation systems. In the context of the literature, our results can be compared with approaches described in [
17], which utilized deep learning for anomaly detection in IoT systems. Our synthetic data-based approach offers flexibility in controlled environments, while deep learning techniques may provide higher precision with real network data. In future research, we plan to integrate deep learning models with our ML algorithms to combine the strengths of both methods. Additionally, we intend to conduct validation using real-world LoRaWAN network data from an existing infrastructure currently being prepared, as well as comparisons with public datasets such as CICIDS2017.
The experimental results are based on optimally configured models, with details of their implementation and hyperparameter tuning described in the methodology section. This configuration was designed to maximize performance in a simulated environment, with further optimization planned for future studies with real data. The experiments described in this article rely on synthetic data, which enabled controlled testing of machine learning algorithms in a LoRaWAN environment and addressed privacy-related challenges. However, synthetic data may not fully reflect real-world conditions, particularly in the context of geographical diversity, such as differences in network infrastructure or traffic patterns across regions. To enhance the practical relevance of this work, we plan future studies that will include a detailed validation of the models (Gradient Boosting, Random Forest, SVM, XGBoost) using real-world LoRaWAN network data from an existing infrastructure currently being prepared. The plan includes: (1) collecting data from various locations (e.g., cities with different population densities such as Warsaw, Kraków, and rural areas), covering metrics like packets per second, RSSI, SNR, number of unique device addresses, and uplink/downlink ratio; (2) preparing the data by removing noise, normalizing it, and identifying real DDoS attacks in collaboration with network operators; (3) validating the models through retraining and testing in various scenarios (e.g., peak hours vs. nighttime), with evaluation of metrics (AUC, F1-score, accuracy); (4) conducting a comparative analysis with synthetic data to adapt the models to real-world conditions; and (5) performing regional tests to assess the impact of geographical differences (e.g., network density, climatic interference conditions) on detection effectiveness. These steps, combined with comparisons to public datasets such as CICIDS2017, will enable model adaptation to real-world scenarios, supporting the development of secure and sustainable transportation systems.
To illustrate the novelty of the proposed method, a comparison with existing solutions from the literature is provided below (
Table 5). Our approach, based on synthetic data and optimized models (Gradient Boosting, Random Forest, SVM, XGBoost), offers higher accuracy and a lower false positive rate due to the diversity of generated attack scenarios, though it involves greater computational overhead during training. Future studies will include validation on real-world LoRaWAN network data.
The novelty of our approach lies in using synthetic data to generate diverse attack scenarios, which better prepares the models compared to methods relying solely on real data, such as those described in [
18,
19,
20]. These steps, combined with comparisons to public datasets such as CICIDS2017, will enable further system refinement.
In a practical context, detecting DDoS attacks using the proposed models (Gradient Boosting, Random Forest, SVM, XGBoost) is only the first step. Rapid response to threats is critical, and we propose the following mitigation measures: (1) traffic filtering, which involves blocking suspicious packets at the edge of the LoRaWAN network based on metrics such as packets per second exceeding a defined threshold; (2) rate limiting, implemented on end devices to reduce network load during an attack; and (3) network adjustment, consisting of dynamically redirecting traffic to less congested channels or backup servers. These mitigation measures can be integrated with the detection system, where the models automatically trigger alerts to initiate appropriate actions, minimizing response delays. Such integration will enhance the system’s effectiveness in real-world scenarios, particularly in intelligent transportation systems (ITS) where service continuity is a priority. In future research, we plan to develop mechanisms for the automated deployment of these mitigation steps within the LoRaWAN infrastructure, thereby supporting the development of more resilient cybersecurity solutions. The innovativeness of our method lies in using synthetic data to generate diverse attack scenarios, which better prepares the models compared to methods relying solely on real data. Unlike GAN-based data generation, our approach is less resource-intensive and simpler to implement, achieving high effectiveness (e.g., AUC up to 0.95 for XGBoost) with lower computational overhead. Compared to DL models, such as neural networks, our method offers higher interpretability and sustainable energy usage, which is crucial for low-power ITSs. These advantages make our solution more practical for resource-constrained environments like LoRaWAN. Future studies will include validation on real-world LoRaWAN network data to further refine the system. Synthetic data offer a significant advantage in a controlled environment by enabling the simulation of a wide range of DDoS attack patterns with varying traffic profiles, which is crucial for training models where real data may be limited due to privacy or availability constraints. However, their importance in real-world network environments requires further validation, as they may not fully reflect regional specificities, such as differences in infrastructure or user behavior. In analyzing the experimental results, we observed misclassification cases: false positives (FPR 0.02 for XGBoost) may stem from the models’ excessive sensitivity to unusual traffic patterns, potentially leading to unnecessary blocking of legitimate traffic, while false negatives (FNR estimated based on class imbalance) may result from the lack of representation of rare attacks in synthetic data, increasing the risk of missing real threats. To address this, we plan future studies that will include detailed validation of the models on real-world LoRaWAN network data from an infrastructure currently being prepared: (1) small-scale pilot validation using real data collected from a LoRaWAN deployment in a selected region (e.g., Warsaw), covering metrics such as packets per second and SNR; (2) a sensitivity analysis of parameter settings, e.g., the impact of varying learning_rate (0.01–0.1) and n_estimators (100–200) on the AUC metric to assess model stability; and (3) tests to minimize FPR and FNR by adjusting decision thresholds and validating with real data. These steps, combined with comparisons to public datasets such as CICIDS2017, will enable further system refinement and confirm the reliability of the proposed approach. The research described in the article relies on synthetic data, which enabled controlled testing of machine learning algorithms in a LoRaWAN environment and addressed privacy-related challenges. The results indicate high effectiveness of models such as XGBoost (AUC = 0.95), but lack a detailed analysis of misclassification cases. False positives (FPR ≈ 0.02) may arise from the models’ excessive sensitivity to unusual traffic patterns in simulated data, leading to unnecessary blocking of legitimate traffic, while false negatives (FNR ≈ 0.05, estimated based on class imbalance) may be caused by the lack of representation of rare DDoS attack variants in synthetic data. In this context, it is worth explaining why deep learning models, such as CNN, LSTM, or Autoencoder, were not included in the study. This decision was driven by several factors: firstly, deep learning models require significant computational resources and large training datasets, which poses a challenge in low-power environments like LoRaWAN, where minimizing energy consumption is a priority. Secondly, the lack of sufficient temporal or image-based data in our synthetic dataset would limit the effectiveness of CNN and LSTM. Thirdly, traditional models, such as GBDT, RF, SVM, and XGBoost, provide better interpretability and sufficient performance in controlled settings, aligning better with the sustainable ITS objectives. In future research, we plan: (1) detailed validation on real data from the LoRaWAN infrastructure; (2) tests to minimize classification errors; and (3) consideration of integrating deep learning models if appropriate data and resources become available.
