Article

Port Sustainability and Probabilistic Assessment of Ship Moorings at Port Terminal Quays

by
Vytautas Paulauskas
1,*,
Donatas Paulauskas
1 and
Vytas Paulauskas
2
1
Marine Engineering Department, Klaipeda University, H. Manto Str. 84, LT-92294 Klaipeda, Lithuania
2
Faculty of Electrical and Electronics Engineering, Kaunas Technological University, Studentu Str. 48, LT-51368 Kaunas, Lithuania
*
Author to whom correspondence should be addressed.
Sustainability 2025, 17(20), 8973; https://doi.org/10.3390/su17208973
Submission received: 18 August 2025 / Revised: 3 October 2025 / Accepted: 8 October 2025 / Published: 10 October 2025
(This article belongs to the Special Issue Sustainable Maritime Transportation: 2nd Edition)

Abstract

The sustainability of a port is directly related to the time spent by ships in terminals and depends on the terminal, the technologies used in it, and external conditions. Currently used sustainable port terminal technologies allow a significant increase in the intensity of ship loading operations and, at the same time, shorten the time spent by ships at the quays. Since port construction processes take a lot of time, many ports have many quays every day that are not moored by ships. Ports try to attract passenger and cargo flows, but they are also not infinite. In individual port terminals, for example, container and Ro–Ro terminals, most of the time is spent on cargo processing inside the terminal, and only part of the time is spent on ship loading operations. Probabilistic assessment of ship mooring at quays allows an understanding of not only the optimal need for quays and modernization of their equipment, but at the same time for a more purposeful assessment of the possibilities of using quays, accepting diversification options and, therefore, optimizing the ports themselves as a sustainable port entity. The article presents a methodology for assessing berth occupancy focused on the development of a sustainable port based on probabilistic methods that would allow calculating potential berth occupancy. The developed methodology, compared to existing methodologies and models, allows for a more realistic assessment of the expected berth occupancy, using actual port and ship data. The presented theoretical and experimental research results confirm the suitability of the developed methodology for the development of a sustainable port and the possibilities of applying the developed methodology in any port, adapting it to specific port conditions.

1. Introduction

The main goal of sustainable ports and ships, like any commercial vehicle, is to safely transport as many passengers or cargo as possible. To achieve this goal, a ship should spend as little time in port as possible and move as much as possible; the revenue earned by a ship depends on the so-called ton miles [1,2]. Sustainable ports are also interested in serving passengers and processing cargo as quickly as possible—in other words, keeping ships in port as little as possible, since the main revenue of ports is revenue from passengers served and cargo processed (loaded onto or offloaded from ships) [2,3]. A sustainable port and its development means that the port is focused on economic growth, safe and good passenger and cargo handling, environmental protection, and social responsibility. A sustainable port also includes the application of green port principles, reducing environmental impact and promoting social equity. This approach ensures that ports can operate efficiently, safely, and optimally receive and serve ships, contributing to long-term prosperity while protecting the environment and providing benefits to the country and community.
One of the most important elements of a sustainable port is the optimal berthing of ships at the quays, which allows for optimal planning and development of quays or their partial use for other purposes. Therefore, the probability of berth occupancy by moored ships is one of the essential factors that allow sustainability in ports.
In this way, both ports and ships are interested in faster ship processing in ports. Over the past decades, port indicators have changed significantly; work in many ports has become much more intensive, and ships are berthing in ports and occupying berths for shorter periods of time [4]. Due to the significantly reduced time spent by ships in ports, the use of berths in many ports has decreased in terms of time, and the opportunity has arisen not only to use berths for other purposes but also to reduce the energy demand of ships. In the case where ships are connected to shore-based power grids, reducing the amount of pollutants emitted by ships and reducing the negative impact on the environment is important [3,5]. At the same time, port processes with cargo are changing, especially in container and Ro–Ro terminals, where a lot of additional work needs to be performed to receive cargo at the terminal, prepare it for loading onto ships, and properly store unloaded cargo from ships to minimize additional operations [6,7]. Currently, container terminals perform an average of 3–4 non-commercial movements per commercial movement (unloading from a vehicle to the terminal storage yard, loading onto a ship, unloading from a ship, and loading from the terminal to a vehicle). Non-commercial movements include the reloading of containers at the storage yard to reach the required container, the preparation of a batch of containers for loading onto a ship, and the unloading of some containers from a ship to the quay to reach a container destined for a specific port, which means that a lot of work has to be carried out at the terminals that is not directly related to ships [7,8].
It is very important to determine the real berthing time of ships as accurately as possible on the basis of probability theory and to create a methodology for assessing the berthing time of ships, based on the type of cargo, terminal capacity, ship parameters, and terminal loading equipment performance [9,10].
The article presents a methodology for assessing the berthing and docking time of ships in a sustainable port, using maximum allocation and dispersion methods, which allow assessing the required number of ships to ensure terminal capacity and the period of their berthing at the quay.
The article presents a method for assessing sustainable port activities using the principles of probability theory, focused on the optimal assessment of berth occupancy, using real port and ship data, and compares it to currently used methods, allowing for a more accurate assessment of port capabilities and the search for solutions for the sustainable development of a port or its parts.
One of the most important relationships between a sustainable port and a ship is to increase port efficiency by reducing ship presence in the port, and in order for a ship to generate as many ton-miles as possible over the same period, probabilistic berth occupancy assessment becomes one of the most important in achieving this goal [2,4,9,10,11,12].
The novelty and innovation of the article are based on the methodology, using elements of probability theory, for assessing berthing at the berths and at the same time optimizing the terminal infrastructure. The developed methodology can be adapted to any newly built port or terminal and existing ports and terminals. The limitations of the methodology are related to sustainable ports and multifunctional terminals, when terminals process various types of cargo, with different cargo processing.

2. Evaluation of Ship Berthing Time in Ports and Analysis of Sustainable Port Literature

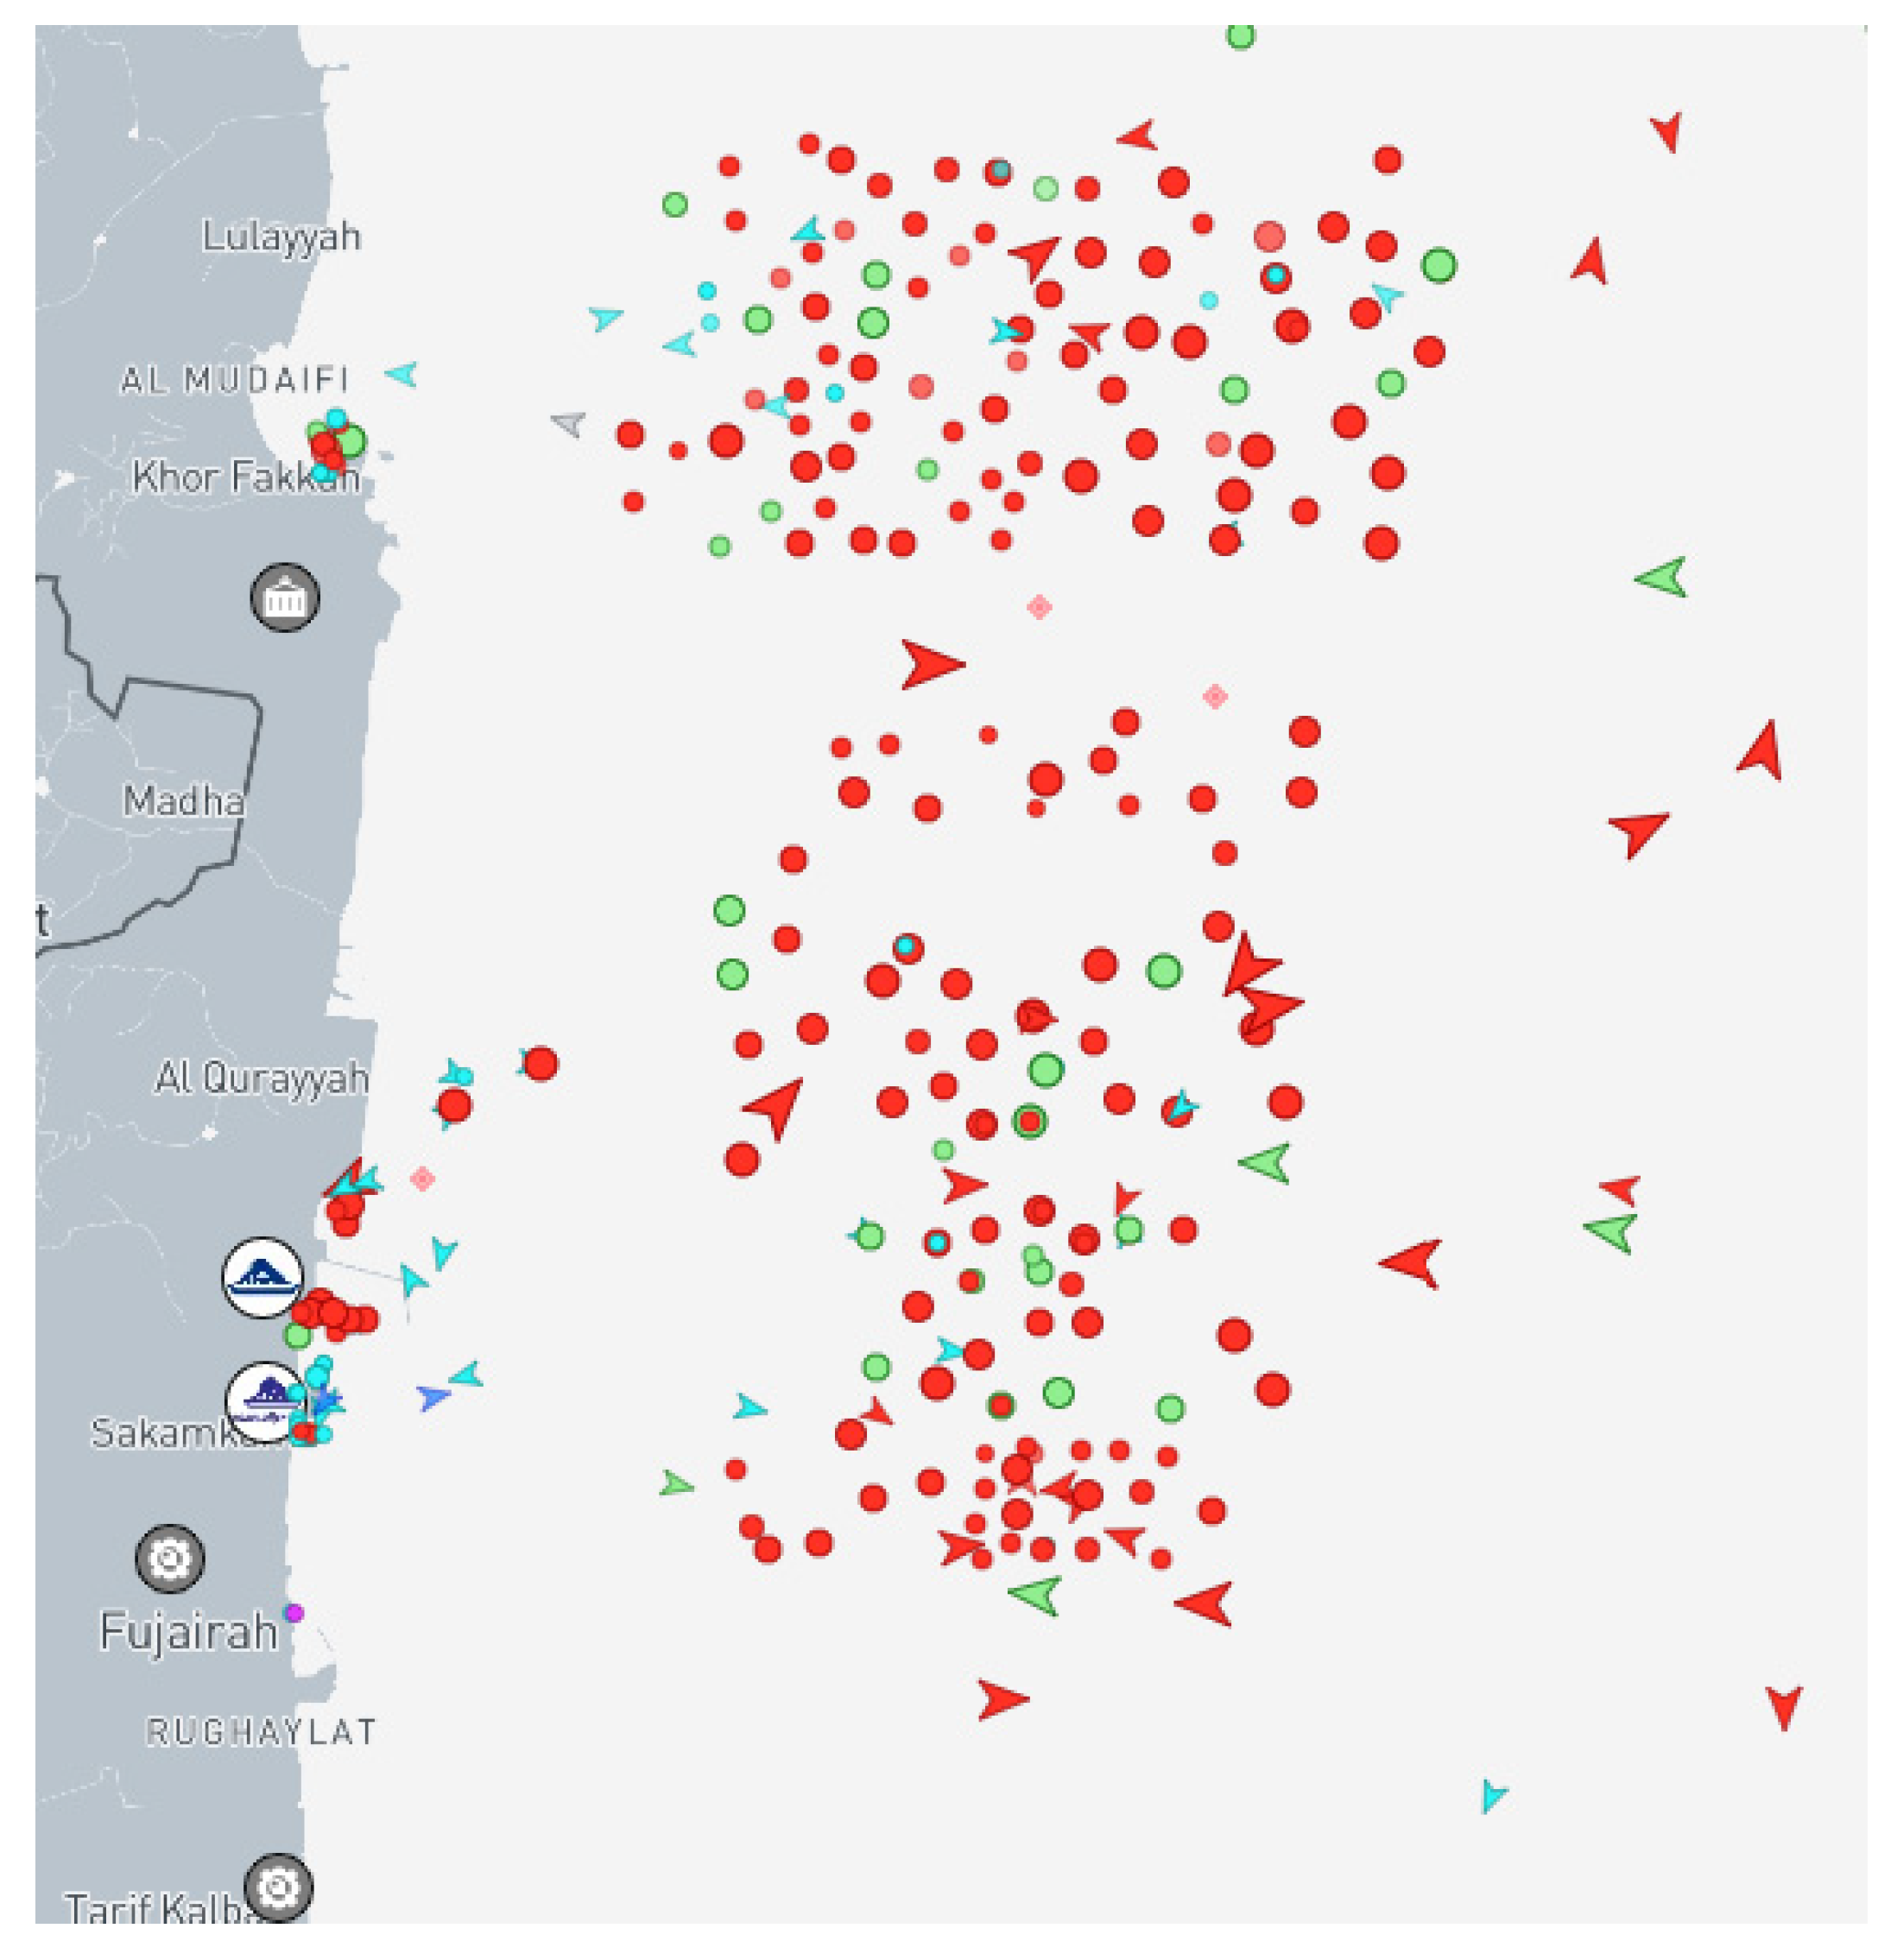
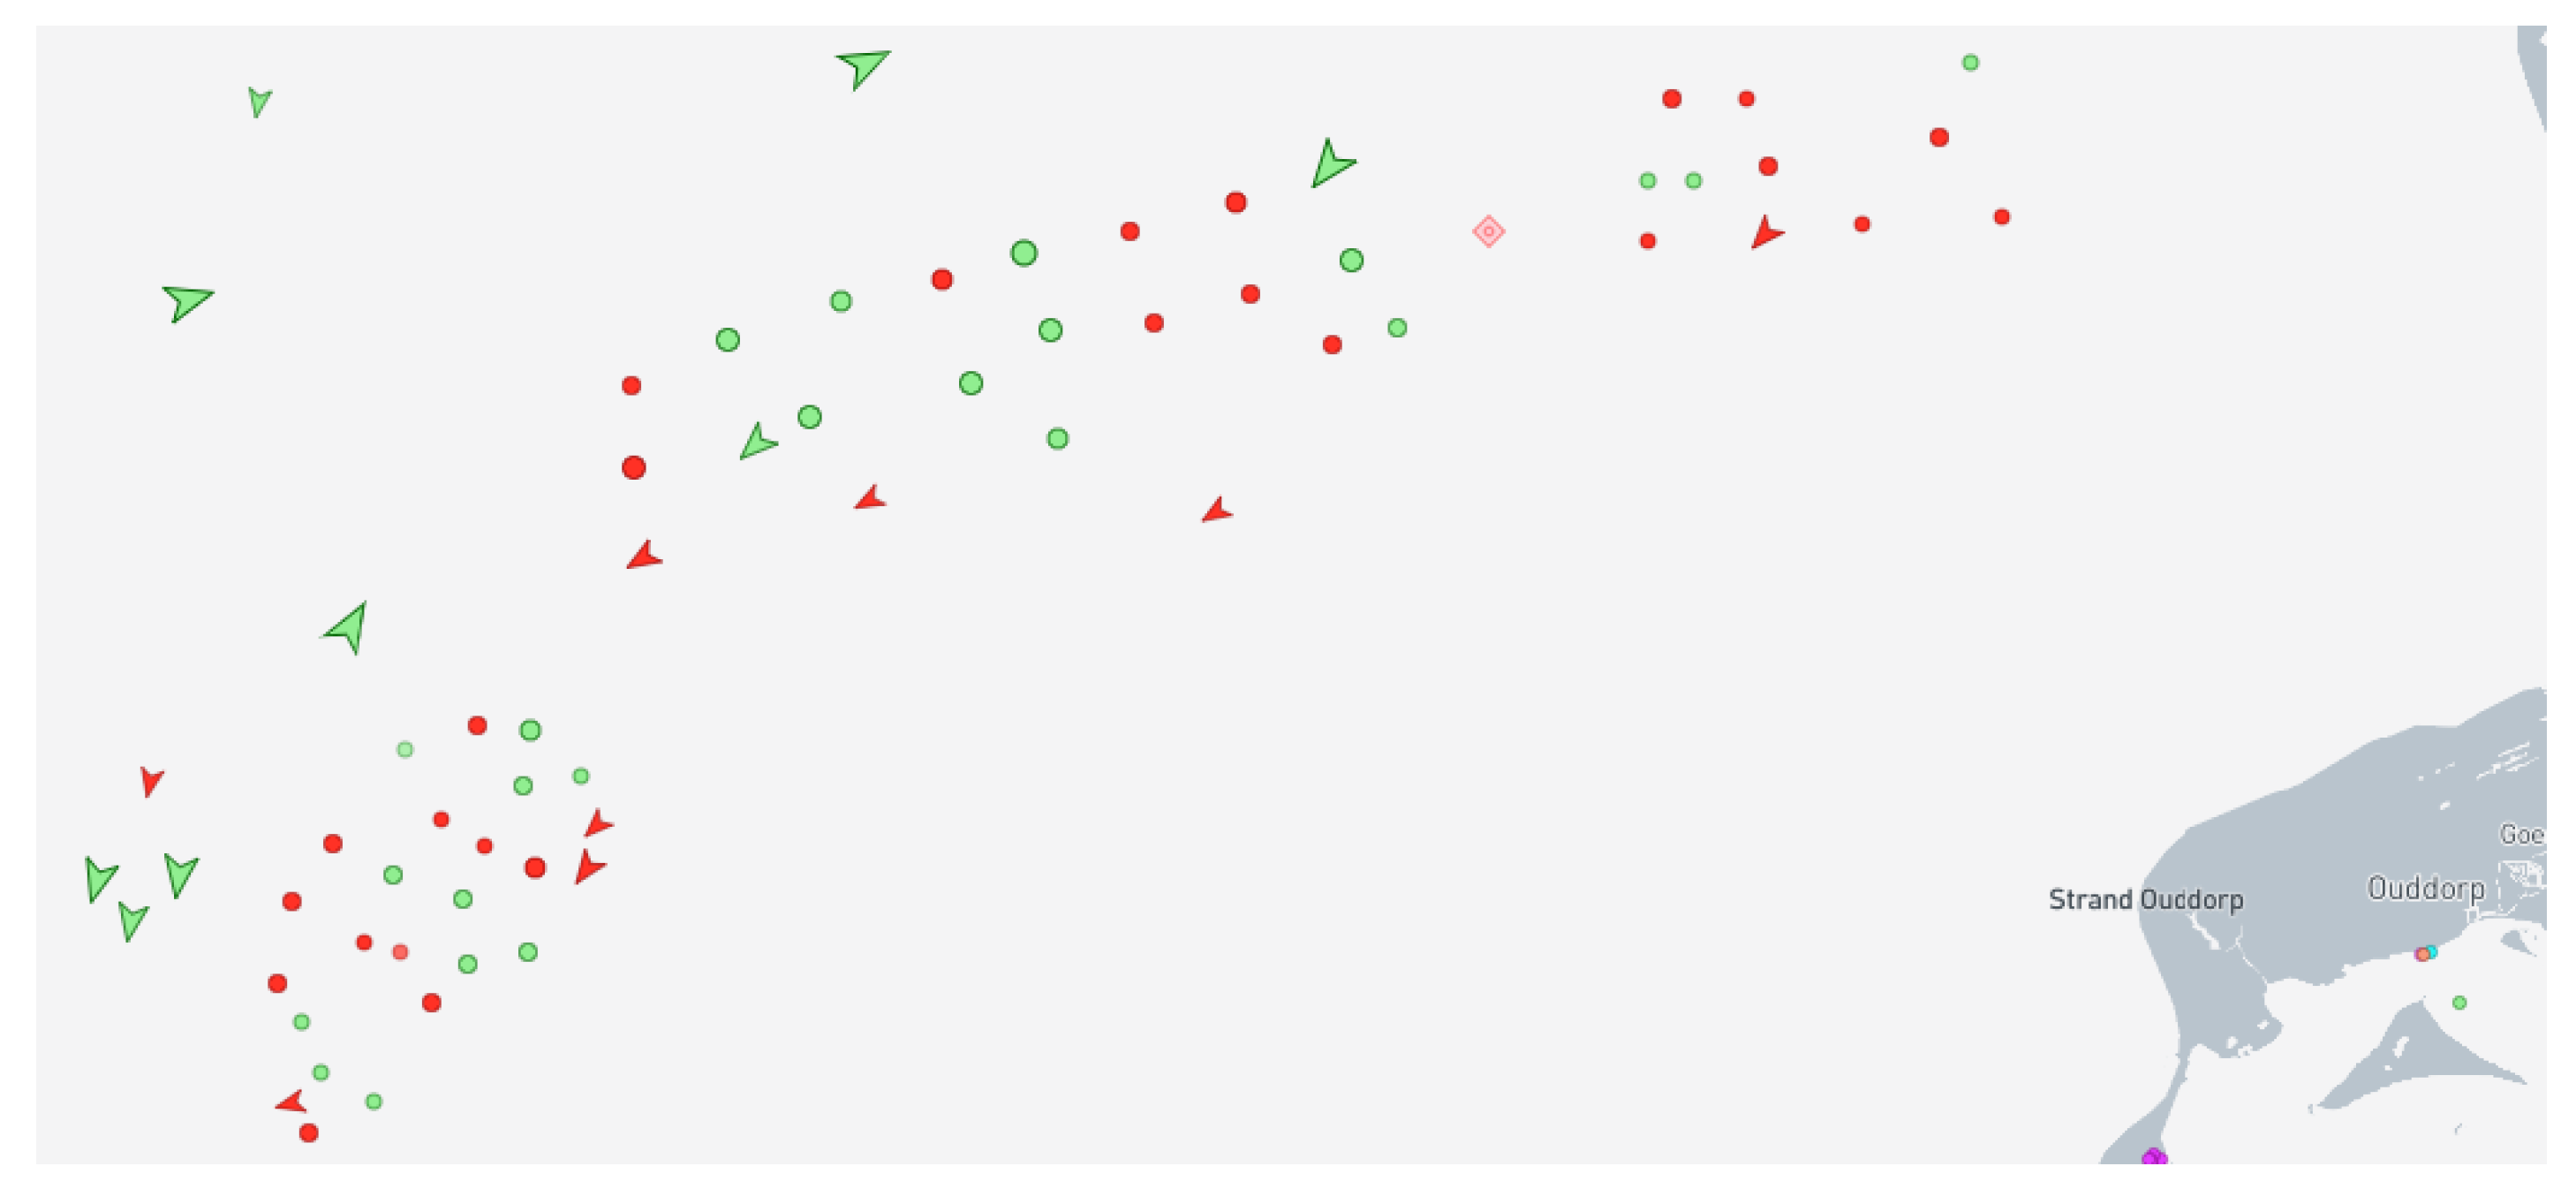
Ships mostly stay in ports as long as it is related to ship processing (passenger service and cargo unloading and loading), as ship operators try to maximize the ships’ opportunities to generate income, which is generated when ships, like any other means of transport, transport passengers or cargo [11,12,13,14,15,16]. In cases where ships are waiting for cargo, orders, etc., ships mostly stay at anchorages or other sea locations to minimize ship operating costs (port dues) [17,18]. Port dues depend on the ship’s parameters and, in most ports in the world, are calculated on the basis of the ship’s total tonnage; therefore, large ships mostly wait for loading operations in the open seas or at anchorages [19,20] (Figure 1, Figure 2 and Figure 3).
The port of Shanghai [19] is one of the largest in the world, but at the same time, many ships are waiting at anchorage, either because there are no places at specific berths or, most often, because the cargo is not ready at the terminal or is waiting for an order.
The port of Fujairah [21] is one of the largest oil ports in the world, and many tankers are at anchor waiting to be loaded or to receive orders.
The port of Rotterdam [22] is the largest in Europe and one of the largest in the world (tenth in the world port ranking) [23]; therefore, a large number of ships are moored at the approaches to the port, waiting for entry into the port or orders.
The berthing time of ships has been analyzed in the research works, but only the terminal capacity and terminal equipment or loading efficiency were taken as a basis [24,25,26,27,28], which, in most cases, is acceptable for small ships or lines (operating on lines) according to published schedules [29,30]. Currently, the situation and conditions of ships’ presence at berths have changed significantly; therefore, it is very important to have a mechanism (mathematical model) with the help of which it would be possible to decide more clearly and easily the optimal time when ships should be moored at berths and how long passenger service or cargo loading operations will be carried out.
Berth occupancy is important in many ports, and excessive and unjustified berthing of ships at berths in individual cases reduces the efficiency of terminals and ports as a whole; therefore, probabilistic assessment of berth occupancy becomes very important in the development of sustainable ports and port terminals.
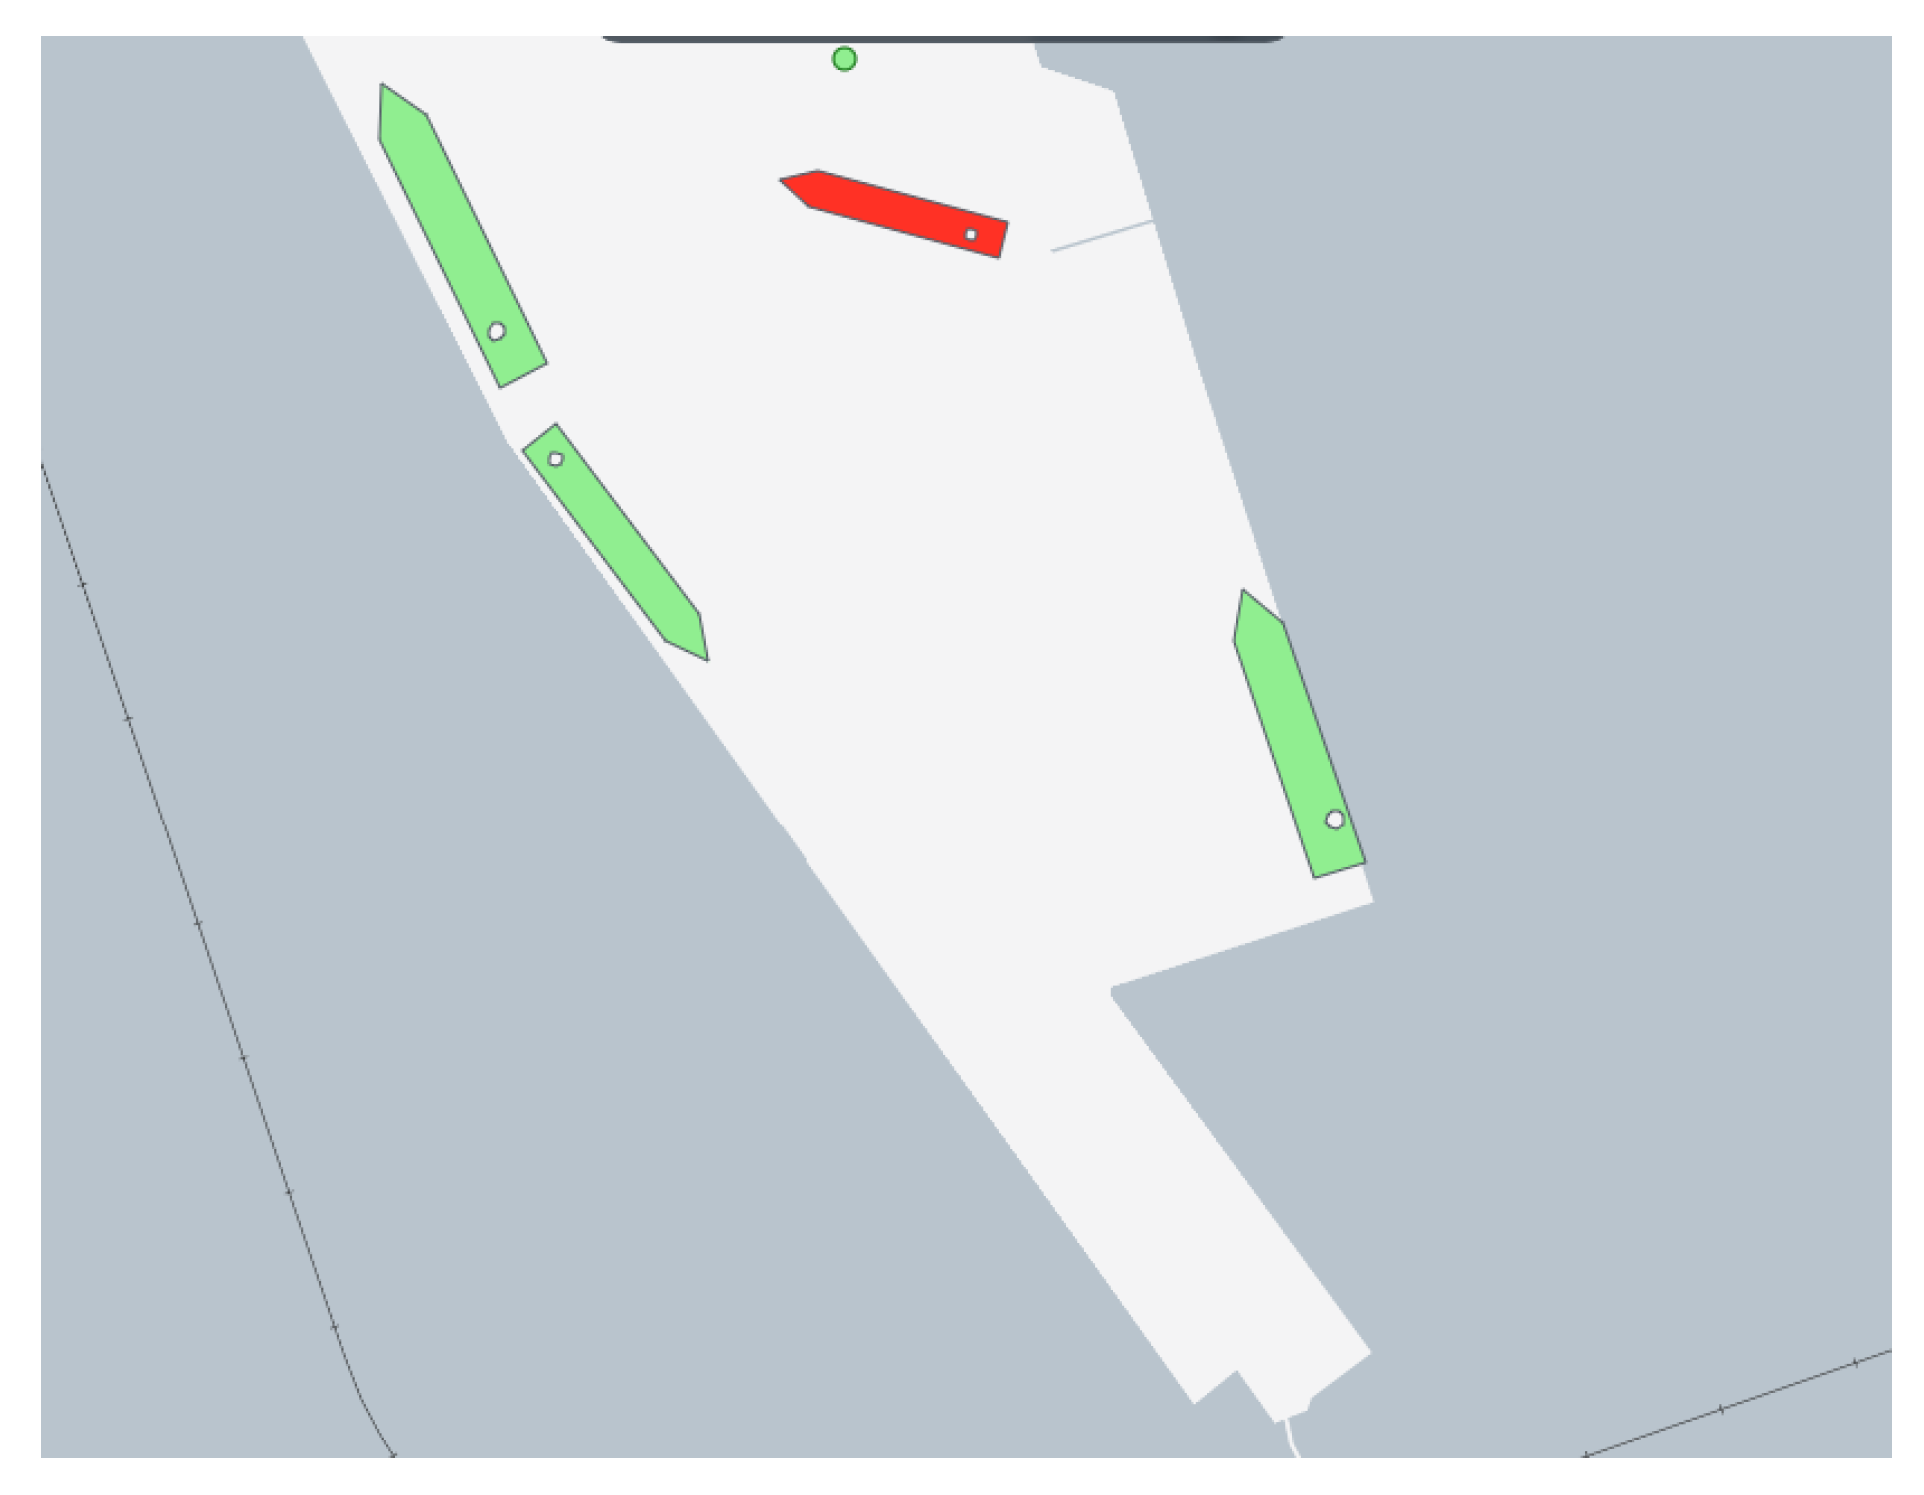
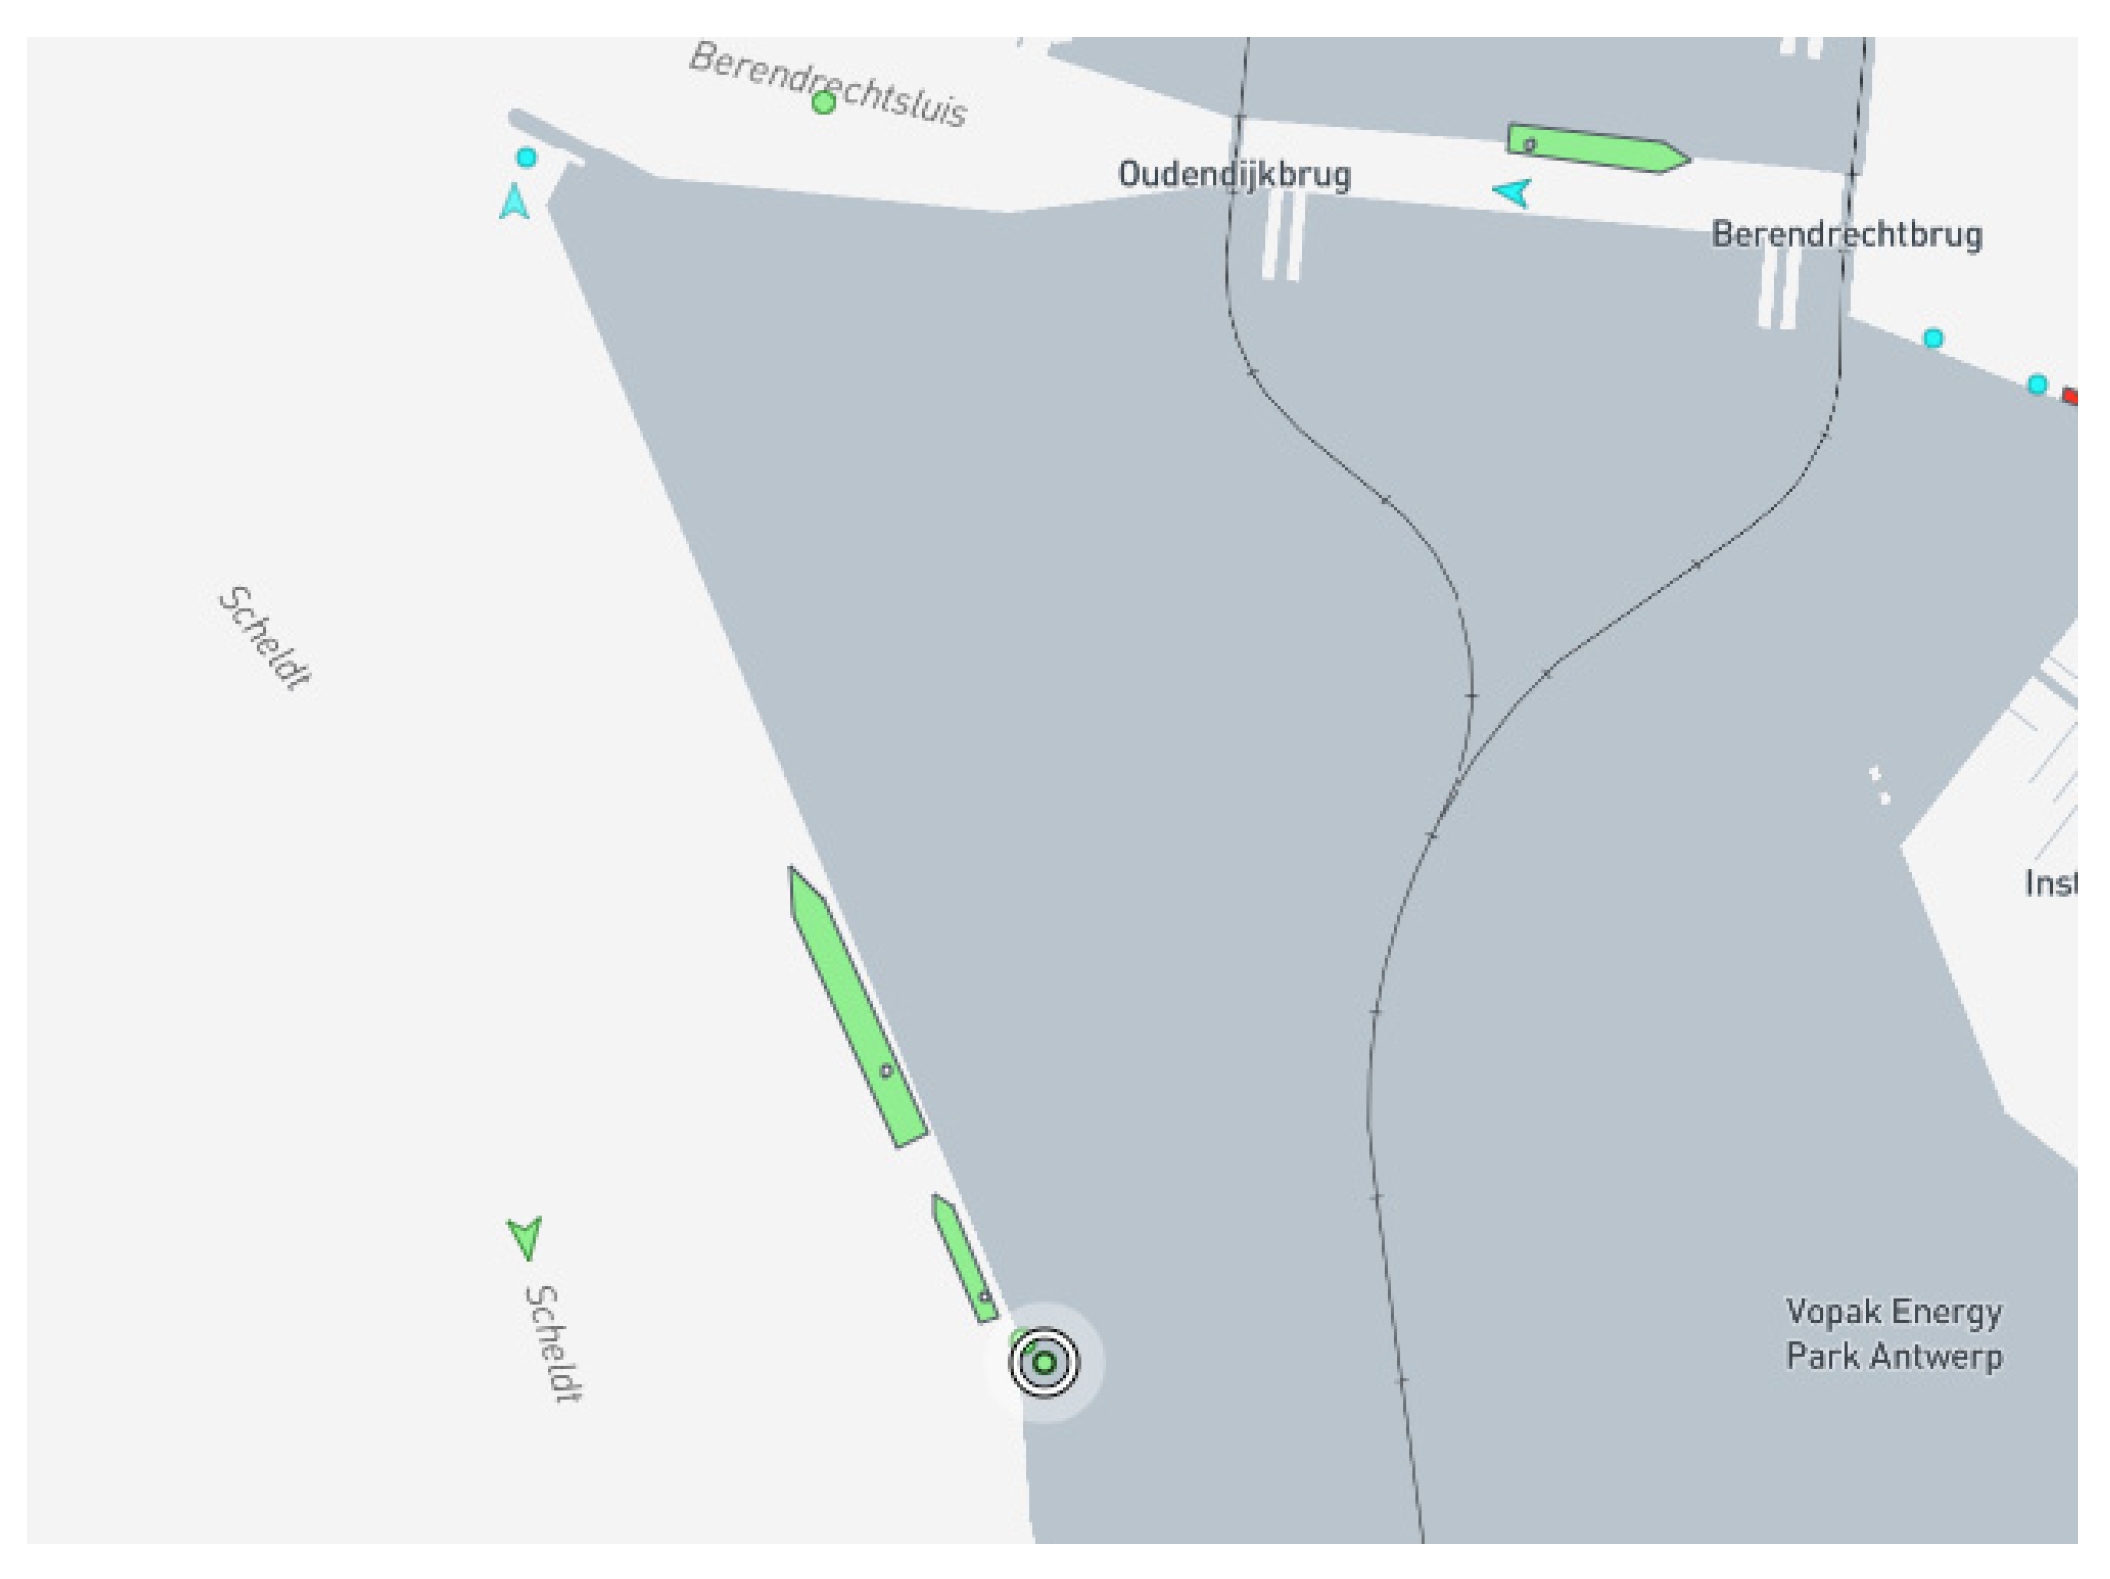
At the same time, when assessing the actual berthing of ships at the quays, with the terminal capacity fully utilized, most cases end up the same, as presented in Figure 4, Figure 5 and Figure 6.
In the southern part of the Malkų Bay of Klaipeda Port, there are three terminals that, in terms of sustainability, have practically reached and exceeded their theoretical loading capacities (planned during their planning and development). Thus, the container terminal, whose technical design capacity was calculated at about 450,000 TEU, today loads about 600,000 TEU. The “Vakaru krova” terminal, whose planned technical capacity was about 1.8 million tons, is currently loading more than 2 million tons, and the “Malku īlanka” terminal, whose planned technical capacity was about 1.5 million tons, is currently loading about 1.8 million tons. At the same time, the indicated terminals often do not have ships moored at separate quays.
The Antwerp container terminal on the Scheldt River at the large locks [31] has fully reached its planned technical capacity, but some of the quays are not occupied.
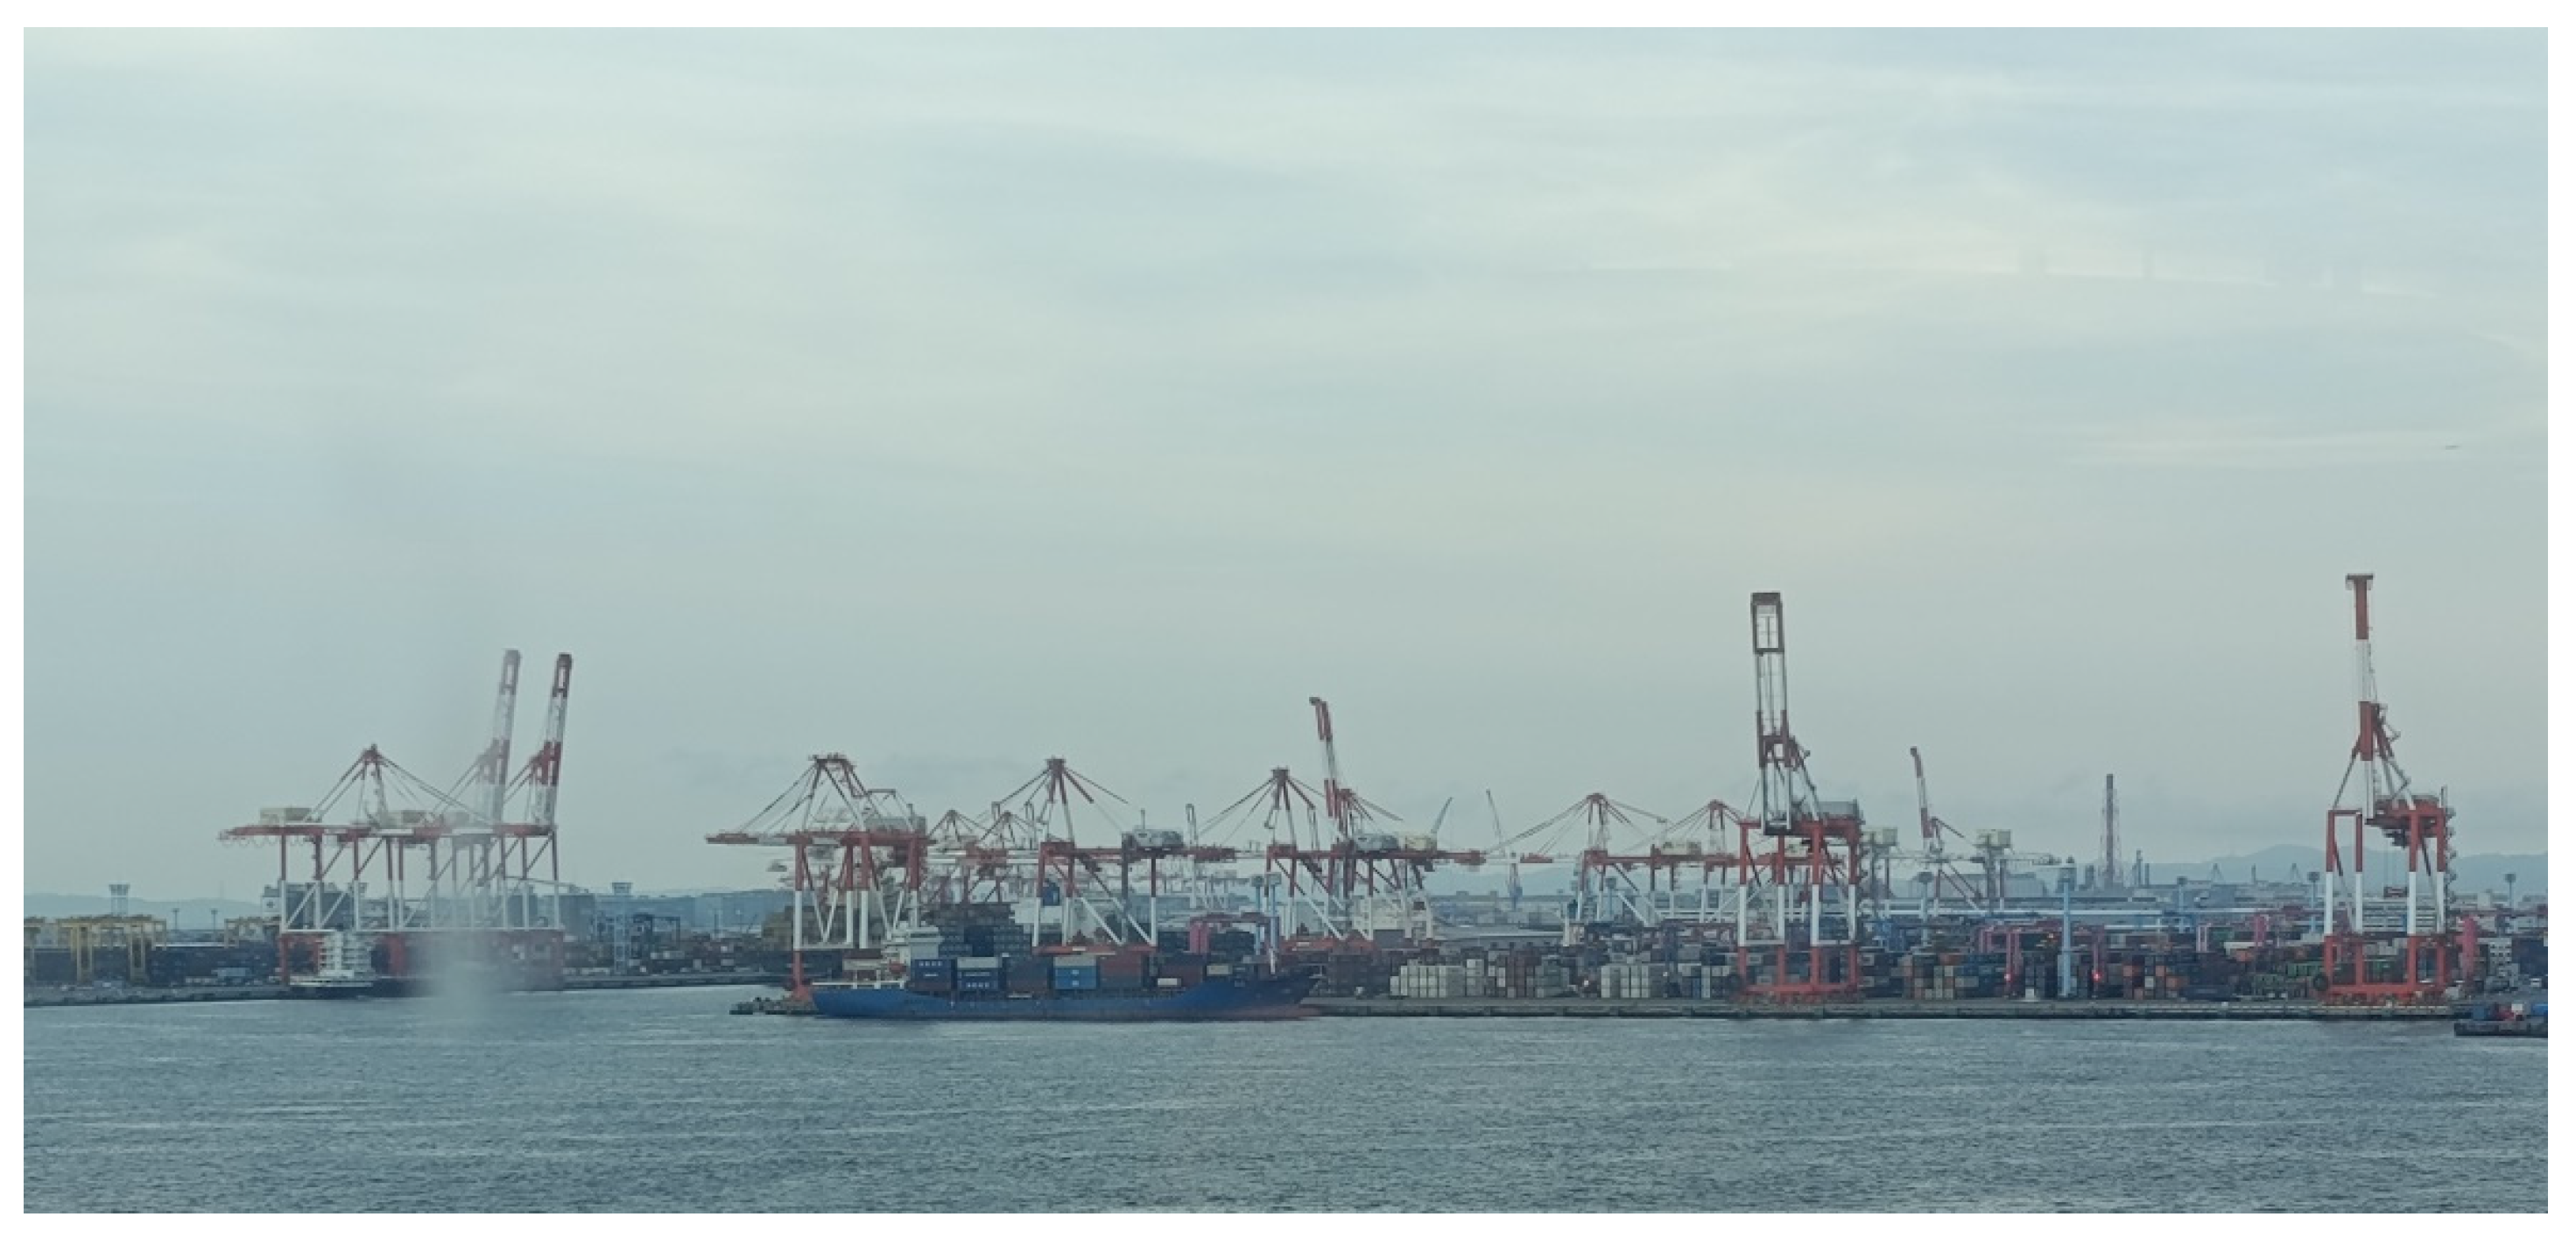
The general cargo terminal of the Shanghai port [19] has reached its planned technical capacity, but not all berths and not all the time are occupied. Many ports in the world reflect the same possibility; for example, the Yokohama container terminal (Figure 7), on average, is occupied no more than 30–35% of the time [32].
One of the reasons why in many ports there are always free berths is that when planning terminals and their technical capacities, part of the berth is not fully aligned with the berths’ capabilities, yet the more important factor is the implementation of new loading technologies, which significantly shortens the time of ship loading and unloading operations. The specified changes allow for a more sustainable and accurate assessment of the time ships spend at berths and to seek additional opportunities to use already constructed berths more efficiently or to optimize the number and length of berths when building new ports and terminals, since investments in these port infrastructure objects are very large.
The planning of liner ship arrivals is relatively simple, since ships, under normal navigation conditions, try to maintain ship arrival schedules at ports [6,29,30]. The planning of the arrival time of tramp ships at ports is difficult to regulate, not only due to stochastic processes in ship navigation routes, but also due to the order of entry into ports. Since they are entered last compared to passengers, Ro–Pax as well as Ro–Ro and cargo liner ships, therefore, require the assessment of tramp ship arrivals at ports, and the use of the principles of probability theory is important and allows for a clearer assessment of the berth occupancy situation from the perspective of port sustainability.
The analysis of the methodologies used for assessing ports and terminals has shown that the existing methods, based on simulation and traditional deterministic methods [9,18], do not fully assess the occupancy of berths, especially when the berths are mostly used by tramp ships. The arrival time of tramp ships to the port depends on many factors; therefore, probabilistic methods for assessing berth occupancy allow for a more accurate assessment of the potential berth occupancy, and at the same time, search for optimal solutions.
Based on statistics on the use of many port berths and an analysis of the literature sources, it can be stated that the ability to assess the sustainable and optimal number of port berths and their parameters, depending on the expected cargo flow and terminal capacity, is important, and it is necessary to develop a methodology that would allow this assessment to be carried out.

3. Theoretical Basis for the Probability of Ship Berthing at Sustainable Ports

Sustainable ports are characterized by many factors, and one of the main ones is optimal ship handling in the port, i.e., optimal berthing of ships at the quays for passenger service and cargo processing time. Optimal berthing of ships at the quays of the port, depending on cargo flows, terminal technical capacities, and loading technologies used, is based on the current situation of the port terminal, terminal technologies used, and can be estimated using probability theory.

3.1. Steps of Research Methodology

The following steps of the probability of the ships’ stay in ports research methodology were applied to conduct the research (Figure 8). After carrying out a review of the real ports’ situation and literature, the mathematical model was developed.
With the help of the developed mathematical model, probabilistic assessments of ship berthing in ports were performed, related to cargo flows, port terminal capacities, technologies used in terminals, and special conditions. Dispersion [33] and maximum distribution [34] methods were used to design the probability system of ship berthing in ports, as well as data obtained during experiments. The maximum distribution method could be applied when at least five measurements have been performed. Measurements of ship berthing at quays were performed in several port terminals. Probabilistic assessments of ship berthing in ports, which include the type of cargo flow, technical capacities of the port or terminal, cargo handling technologies used, and other possible factors, were performed in different ports for several ship types.
A case study was conducted to verify the theoretical calculations and practical application of the developed methodology. Based on the established assumptions, simulations were performed. Experiments were conducted based on the data of ports, shipping lines, and intermodal terminals in the selected countries and compared with the evaluation results of the developed methodology.

3.2. Mathematical Model

For the assessment of port activities, using probabilistic methods, it is necessary to assess individual factors and their interrelationships. Port activities can be divided into the following factors: ship calls to ports; port (channels, ship turning basins, approaches to quays, and quays) capabilities; and terminal capabilities to optimally serve passengers and process cargo. When using probabilistic assessment methods, it is very important to assess the interrelationships of factors, taking into account several main factors and their possible influence, using the conditional probability method [35]. With the help of this method, it is possible to assess the probability of individual factors and their possible mutual influence, i.e., the navigation factor, which means the possibilities of ship calls and the probability of minimal downtime; possible capabilities of port infrastructure and terminals and the probability of their use for cargo processing; the available or potential parameters of the port or terminal handling equipment for ship handling and the likelihood of their use; and the likelihood of other possible factors, such as hydro-meteorological and hydrological conditions, ship reception priority.
The following initial conditions were adopted for the creation of the mathematical model:
-
The technical capacity of the port or terminal to process a specific amount of cargo is known;
-
The parameters of the port or terminal infrastructure are known to allow the acceptance of a ship with maximum parameters;
-
The performance of the terminal loading equipment is consistent with the ship’s optimal moored time capabilities;
-
The hydro-meteorological conditions and the time during which ships cannot enter or leave the port, and when the operation of the terminal loading equipment is limited, are known;
-
Other important factors are possible that may limit the entry of ships into and exit from the port, as well as the operation of the terminal equipment, such as the waiting time of ships until passenger and passenger–cargo ships with priority enter the port, the time of technical maintenance of the loading equipment, and other similar factors.
The terminal loading capacity ( Q T ) over a specific time period (shift, day, week, month, and year) can be calculated as follows:
Q T = 1 η T ( T T M Q S k S Q k T M k T O T L O + T L O + T L m ) ,
where η T —terminal correlation coefficient, depends on the terminal conditions, i.e., if there is a correlation between terminal working time, ship loading time, additional operations time, and the time interval between ship moorings, it can range from 0.95 to 1.0 (units will be used in the case that there is no correlation between the previously specified time periods) [2,9,14]; T T M —total terminal working time during a specific period (shift, day, week, month, year, etc.); Q S —average ship loading capacity; k S Q —the ship’s lifting capacity utilization factor depends on the type of ship and the type of cargo, for example, for an LNG tanker it is up to 0.95 [17] and for a container ship it is from 0.50 up to 0.95 [14]; for a bulk carrier it is up to 0.95–0.99 [9], etc.; k T M —terminal working time limitation coefficient due to meteorological and other restrictions, which, depending on the terminal type, cargo type, and season, can amount to 0.75–0.95 (depends on the region and type of cargo) [6,7,9,14,17,29]; k T O —terminal operation time factor, which estimates the time for preparing for loading operations, breaks during the shift, time for cleaning the work area before the end of the shift, etc., and can amount to up to 0.90–0.95 depending on the type of terminal, type of cargo, traditions, etc. [6,14,17]; T L O —the time during which loading operations are carried out; T A O —the time during which additional operations are performed, such as ship inspection and issuance of certificates before loading the ship, for example, before loading grain, arranging documents after loading the ship, for example, cargo quantity, customs documents, etc. This amount can vary from a few minutes to several hours, depending on the type of terminal, type of cargo, local regulations, etc.; and T L m —time between ships mooring, including mooring operation time.
The ships’ real time at the port ( T L ) can be estimated by taking into account the operating conditions and characteristics of the terminal and port, as follows:
T L = 1 η L ( Q T q T k T T n T L L + T S F + T P + T B S + T A O ) ,
where η L —terminal and port correlation coefficient, and depends on the port conditions; q T —rate of one terminal loading line, t/h; k T T —terminal loading line working time coefficient, which depends on the terminal operating conditions and can be obtained from the terminal operating schedules; T S F —ship clearance time; T P —average pilot waiting time; T B S —time between ships mooring at a specific berth; T A O —additional operations time; and n T L L —the number of terminal loading lines used for loading per ship.
The entry of ships into ports is limited by hydro-meteorological factors. Many ports restrict the entry of large ships at wind speeds of 14 m/s and above. Hydro-meteorological restrictions are also imposed on port equipment, in particular, port cranes. The operation of port cranes is limited to 16 m/s for container cranes, and for typical port cranes, in most cases, restrictions are imposed at wind speeds of 18 m/s and above. In individual ports, port cranes are limited at wind speeds of 16 m/s and above. Therefore, at wind speeds of 16 m/s and above, there are restrictions on the entry of ships into the port and the operation of port equipment, particularly port cranes, which correlate with the possibilities of ships entering the port. In this way, a clear correlation emerges between ship calls at the port and port equipment limitations. The exact correlation coefficient can be calculated (estimated) based on statistics available for specific ports or by expert methods.
Terminals can regulate the time of ship berthing at the quays and, at the same time, increase terminal productivity and reduce ship berthing time at the terminal quays, and improve the economic efficiency of ships.
Forecasting of cargo flows is very important so that terminals can determine their capabilities as accurately as possible. For this purpose, linear or multi-criteria forecasting methods can be used [36,37]. In cases where the change in specific cargo flows is insignificant and, in particular, uniform, the linear forecasting method can be used. At the same time, it is necessary to note that the linear forecasting method is in most cases suitable for short-term forecasting, as at the same time, the development of port infrastructure and superstructure requires a sufficiently long period of time. Therefore, when planning port infrastructure and superstructure, it is necessary to have cargo flow forecasts for a sufficiently long period.
The multi-criteria forecasting method allows to forecast cargo flows for a relatively long time, assessing many factors, which can be mentioned as follows: the global economic situation, the economic situation of the port and its expected development, port infrastructure and superstructure development programs, the expected development of new economic areas in the port and the likelihood of new cargo flows, competitors’ development programs and their possible impact on expected cargo flows, the expected political situation in the world, in the port and in the country and its possible impact on expected cargo flows, and other factors that may affect expected cargo flows.
The mathematical model of multi-criteria forecasting for specific cargo flows ( Q C ) can be expressed as follows [36,37]:
Q C = ( Q C n + B T ) M m c ,
Here, Q C n —cargo flow at the last statistical point; B —forecasting coefficient, calculated based on available statistical data; T —forecasting period; and M m c —multi-criteria forecasting coefficient, which can be calculated as follows:
M m c = 1 η k 1 i F i k i ,
where η k —correlation coefficient, applied if there is similarity between factors and depends on the similarity of factors, can be obtained from the results of the analysis of a specific terminal; F i —factor values; and k i —factor weight coefficients, in all cases, their sum must be equal to one and is assessed by expert method or can be accepted based on statistical data.
The correlation coefficient of the flow forecast depends on the similarity of the factors; for example, a global economic crisis also affects regions that are important for the port.
The prediction accuracy can be calculated using the variance method using the following relationship [35,36]:
σ 2 = 1 n 1 ( Q i m ) 2 ,
where σ denotes the dispersion or density of the statistical data; n denotes the quantity of statistical data; Q i denotes the statistical data of the concrete respondents (port) ( i is the number of statistical data); and m denotes the average statistical data, which can be calculated as follows [35,36]:
m = 1 n Q i ,
The size of the error bar can be calculated as follows [35,36]:
σ = ± σ 2 ,
In this way, the deviation bar could be received as follows [35,36]:
δ = m ±   σ .
Given the planned cargo flow at the terminal and the terminal’s loading capabilities, it is possible to calculate the necessary terminal cargo storage area, the number of quays, and the probability of ships mooring at the berths. The required terminal storage capacity ( Q W ) for the forecasted cargo flow can be estimated as follows:
Q W = Q C T W k W / T T M ,
Here, T W —time of cargo storage at the terminal storage location; k W —terminal storage location (capacity) utilization factor, and can be accepted based on terminal statistics.
The required cargo storage area ( S W ) to store the required amount of cargo for the selected period can be calculated as follows:
S W = Q W / q W k S W ,
where q W —permissible load of the warehouse ( t m 2 ); k S W —storage area utilization coefficient, which can be accepted based on terminal statistics.
The required number of ships (voyages) to transport the planned amount of cargo, i.e., the number of ships ( N S ) that will have to be moored at the terminal quay, can be calculated as follows:
N S = Q C E S Q S ,
Here, Q S —average ship capacity; E S —ship intensity coefficient, which depends on adverse factors, such as adverse hydro-meteorological conditions, necessary ship maintenance time, port work disruptions due to hydro-meteorological conditions, terminal equipment maintenance time, organizational and other possible disruptions, which can be calculated as follows [36,37]:
E S = 1 P T S
Here, P T S —probability of ships arriving at the terminal and berthing at the terminal berths, which can be calculated as follows [37]:
P T S = 1 η T S ( 1 T S m T T M 1 T S t T T M 1 T S l T T M 1 T S o T T M 1 T T m T T M 1 T T t T T M 1 T T o T T M ) ,
Here, η T S —correlation coefficient, depending on the similarity of factors, and in most cases, its value is from 0.95 to 0.98, and exemplarily, due to a storm, a ship cannot enter the port, but at the same time, the port equipment (cranes) cannot work; T S m —number of storm days during the navigation period, taken from statistical data for a specific port area;   T S t —number of days necessary to perform technical maintenance of the ship during the navigation period (taken from statistical data for ships); T S l —waiting time of ships when entering ports, taken from statistical data for a specific port for a specific type of ship; T S o —other possible ship disruptions, such as changes in the ship’s crew, removal of port state control observations, etc.; T T m —number of days of terminal downtime due to hydro-meteorological conditions during the navigation period, taken from statistical data for a specific port; T T t —the number of terminal downtime days necessary for technical maintenance of terminal equipment during the navigation period, taken from the statistical data of a specific terminal; T T o —the number of terminal downtime days due to organizational problems during the navigation period, such as strikes, staff shortages, etc., taken from the statistical data of a specific terminal.
The number of ships to transport the projected amount of cargo, depending on the variation in ship size, can be calculated as follows:
N S q = E S N S k S ,
Here, k S —ship size variation coefficient, and depends on the type of ship, where for most ship types, it ranges from 0.6 to 1.0, and can be accepted based on terminal or quay statistics.
After calculating the necessary number of ships to transport the predicted cargo flow, having the ship loading time and the number of berths that can be loaded at the same time, the probability of an unoccupied berth(s) can be calculated as follows:
P T q = ( 1 T L T L M n q ) ,
Here, n q —number of ships loading bays at the terminal.
In this way, the probability of unoccupied berths at the terminal clearly shows the technical capabilities of the terminal to handle the forecasted cargo flow. The developed methodology can be distributed to cargo flows loaded at the terminal, i.e., when loading various cargoes at the terminal, the probability of unoccupied berths at the terminal can be written as follows:
P T q l = 1 η T ( 1 T L 1 T L M 1 n q 1 1 T L 2 T L M 2 n q 2 1 T L i T L M i n q i ) ,
Here, η T —terminal total correlation coefficient, and in most cases, its value is from 0.95 to 0.98, and exemplarily, due to a storm, a ship cannot enter the port, but at the same time, some of the port terminal equipment cannot work; N S q 1 , N S q 2 , N S q i —required number of ships to transport cargo flow i ; T L 1 , T L 2 ,   T L i —loading times of each ship of cargo flow i at the terminal; T L M 1 , T L M 2 , T L M i —terminal total times for processing cargo flow   i ; n q 1 , n q 2 , n q i —numbers of loading bays for processing cargo flow i .
The probability of unoccupied quays allows us to decide on the areas of unused quays and adjacent territories and to find optimal opportunities for better use of port quays and territories.
The probability of quay occupancy can be calculated as follows [35]:
P T q o = 1 P T q l ,
Using the maximum distribution method [34], depending on the adopted probability estimation coefficient, the obtained probability of ship arrivals and berth occupancy can be about 63% when applying a coefficient equal to 1, about 95% when applying a coefficient equal to 2, and about 99.7% when applying a coefficient equal to 3.
A probabilistic port terminal berth occupancy methodology has been developed, which allows for the optimization of individual port or port terminal berths, optimizing the presence of ships in the port, while developing sustainable ports and port terminals. It can be applied to any port or port terminal while searching for optimal berth utilization opportunities.

4. Case Study: Assessing Port Berths Occupied by Ships to Create Sustainable Ports

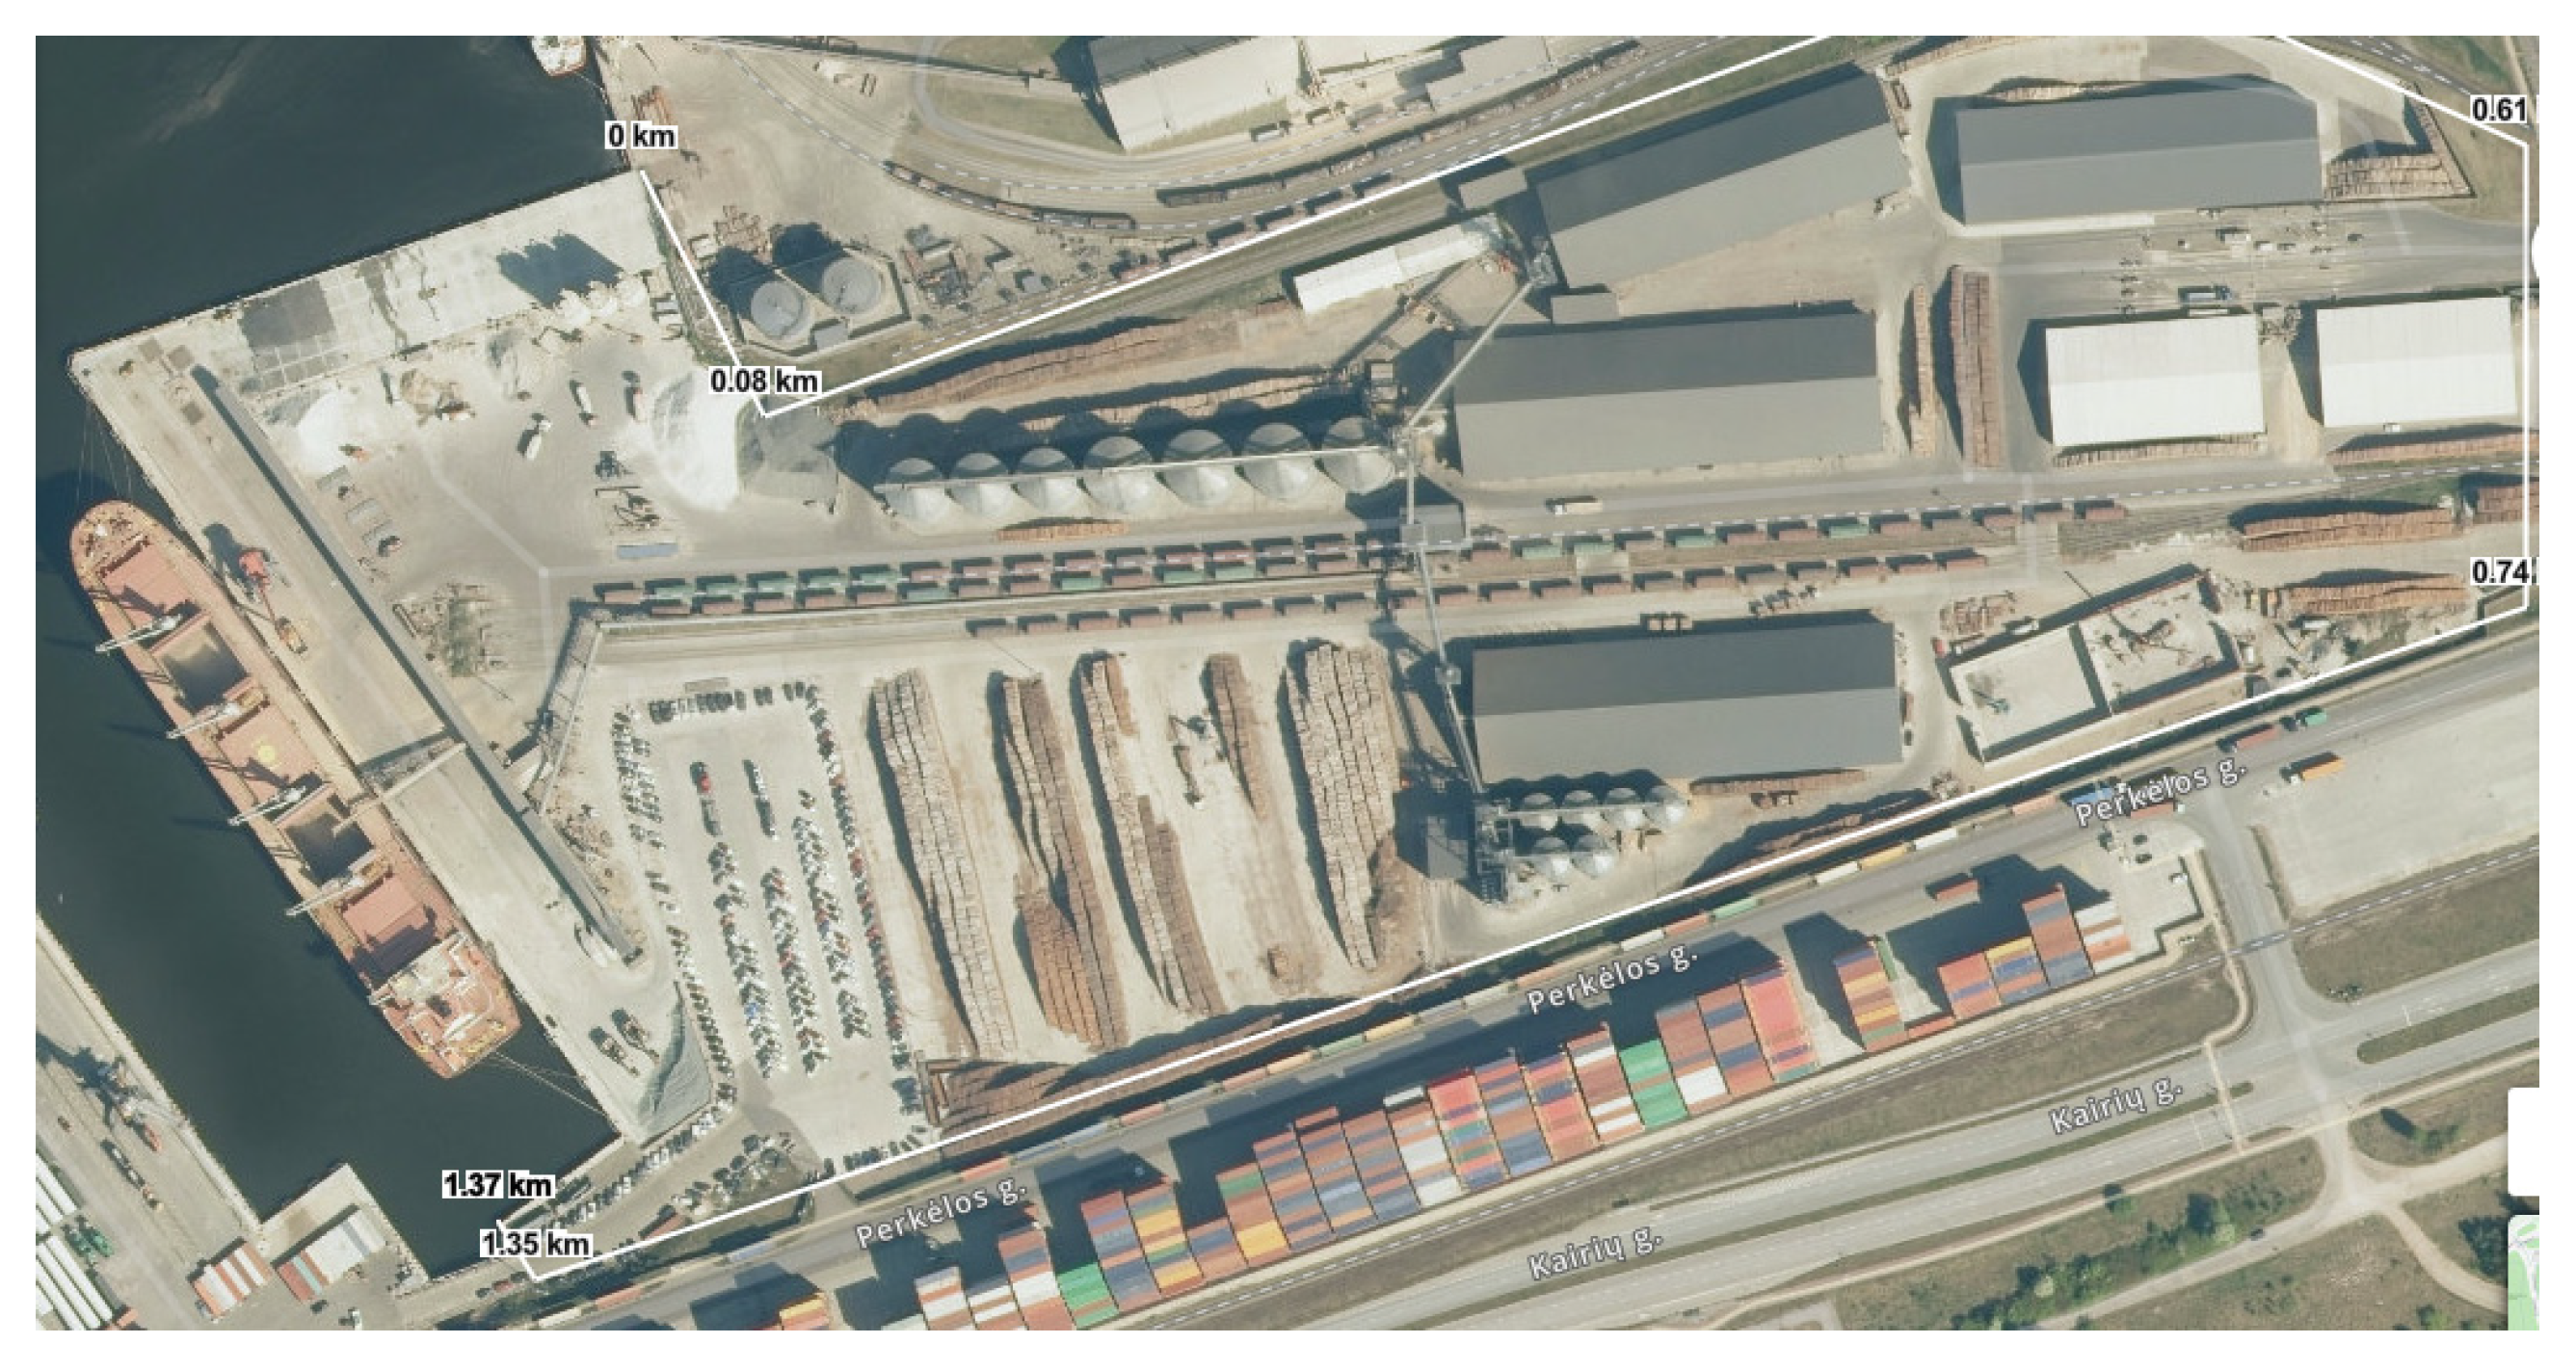
As a case study, a sustainable multifunctional port terminal with key sustainable terminal features was selected, which has reached its full planned design capacity and handles timber, grain, and other general cargo. The grain storage capacity is up to 100,000 t, timber storage capacity is up to 80,000 t, and other cargo storage capacity is up to 10,000 t. Over the past year, up to 1,000,000 t of grain, up to 600,000 t of timber, and up to 400,000 t of other cargo have been handled. The terminal can simultaneously store up to 320,000 t of various cargoes. The terminal uses about 90% of renewable electricity for its own needs and partially supplies it to ships moored at the terminal quays. The area of the terminal territory is about 12 ha (Figure 9).
The port infrastructure allows the analyzed terminal to receive up to PANAMAX-type ships with a carrying capacity of up to 60,000 tons. The terminal has two berths with a total length of about 450 m; the depth at one berth is 14 m, and at the other is 12 m. The average capacity of ships transporting grain is about 35,000 tons (handy size ships), the average capacity of ships is about 30,000 tons, timber is transported by ships with a capacity of up to 10,000 tons, and the average capacity of ships transporting other cargoes is about 4000 tons. The terminal’s loading equipment capacity for loading grain is up to 500 tons per hour (lauder), the intensity of wood loading is up to 200 tons per hour, and the capacity of other cargo-loading equipment is about 150 tons per hour.
The calculations also need to take into account possible adverse days due to hydro-meteorological conditions from statistical data (for the analyzed ships and terminal, this is an average of 20 days), holidays when the terminal is closed, i.e., Christmas, New Year’s, Easter, and individual public holidays (for the analyzed terminal—up to 10 days per year). It is necessary to adapt the legislative framework of the countries regarding non-working days for a specific port. It is also necessary to assess the time allocated for technical maintenance of terminal equipment when the equipment is not working or is not operating at full capacity (for the analyzed terminal, it is up to 6 days per year), where for ships, it is up to 5 days per year, as well as other likely terminal malfunctions (based on statistical data, it is up to 3 days per year for the terminal and up to 5 days per year for ships).
Considering the fact that unfavorable hydro-meteorological conditions may coincide with holidays and other terminal disruptions, it is necessary to assess the probability of correlation, i.e., it is necessary to accept the correlation coefficient, which under similar conditions in transport processes is from 0.95 to 0.99 (about 0.95 can be accepted) [33,36].
Taking into account the working time restrictions during the day, as well as the preparation time at the beginning of the shift (equipment testing) and the necessity to tidy up the workplace at the end of the shift, coffee and lunch breaks, the working time utilization coefficient for the analyzed terminal is about 0.83.
Timber handling after 7 years, using a multi-criteria forecasting method [35,36] and maintaining and developing the main elements of a sustainable port, should reach about 650,000 t. This result was obtained by taking into account the general world economic growth of about 1.2% per year, regional economic growth of about 2.3% per year, and the terminal capacity should increase by about 20%, using new, more modern technology. It is also necessary to assess the influence of competitors; the coefficient of this influence in the forecast period should reach up to 25%, since nearby ports also load similar cargo and have their own development programs. The influence of other factors on the analyzed terminal in the forecast period should reach about 10–15%.
The arrival of ships in ports, especially tramp ships, is a stochastic process and is associated not only with economic growth but also with reverse processes. Ro–Ro is particularly sensitive to economic developments in the port, since it transports mostly final (consumer) products and depends on a relatively small region. Container transport is less dependent on the economic situation, since very rarely do negative economic changes occur in the world at the same time. At the same time, the transport of bulk cargoes, such as ore, oil, fertilizers, grains and other similar goods, often reacts in the opposite direction, i.e., when the economic situation worsens, and countries that have raw materials and other similar goods try to place them on the market in order to receive appropriate income; therefore, a situation is often observed in ports when, during economic crises, the flow of bulk cargoes through ports increases.
When assessing specific cargo flows, it is necessary to adapt the presented coefficients in the presented methodology to specific cargo flows and to assess the frequency of ship arrivals, assuming that liner ships maintain a probability of arrival on time of at least 63–68%, while the probability of arrival of tramp ships is from 30 to 60%. In this way, reducing the number of berths, depending on economic conditions, is quite risky, especially for tramp ships transporting bulk cargo.
As an example, the timber cargo flow and its forecast are analyzed using the multi-criteria forecasting method [35,36] after 7 years. Timber handling statistics and forecasts are presented in Table 1.
When assessing the terminal timber handling capacity ( Q T ), assuming a terminal correlation coefficient ( η T ) of about 0.9, a ship load factor ( k S Q ) of about 0.9, a terminal work limitation coefficient ( k T M ) of about 0.2, a terminal work time limitation coefficient ( k T O ) of about 0.05, an average ship loading time ( T L O ) of about 30 h, an average ship cargo clearance time ( T L O ) of about 3 h, and an average ship mooring time ( T L m ) of about 3 h, the terminal timber handling capacity ( Q T ) is about 660,000 t per year.
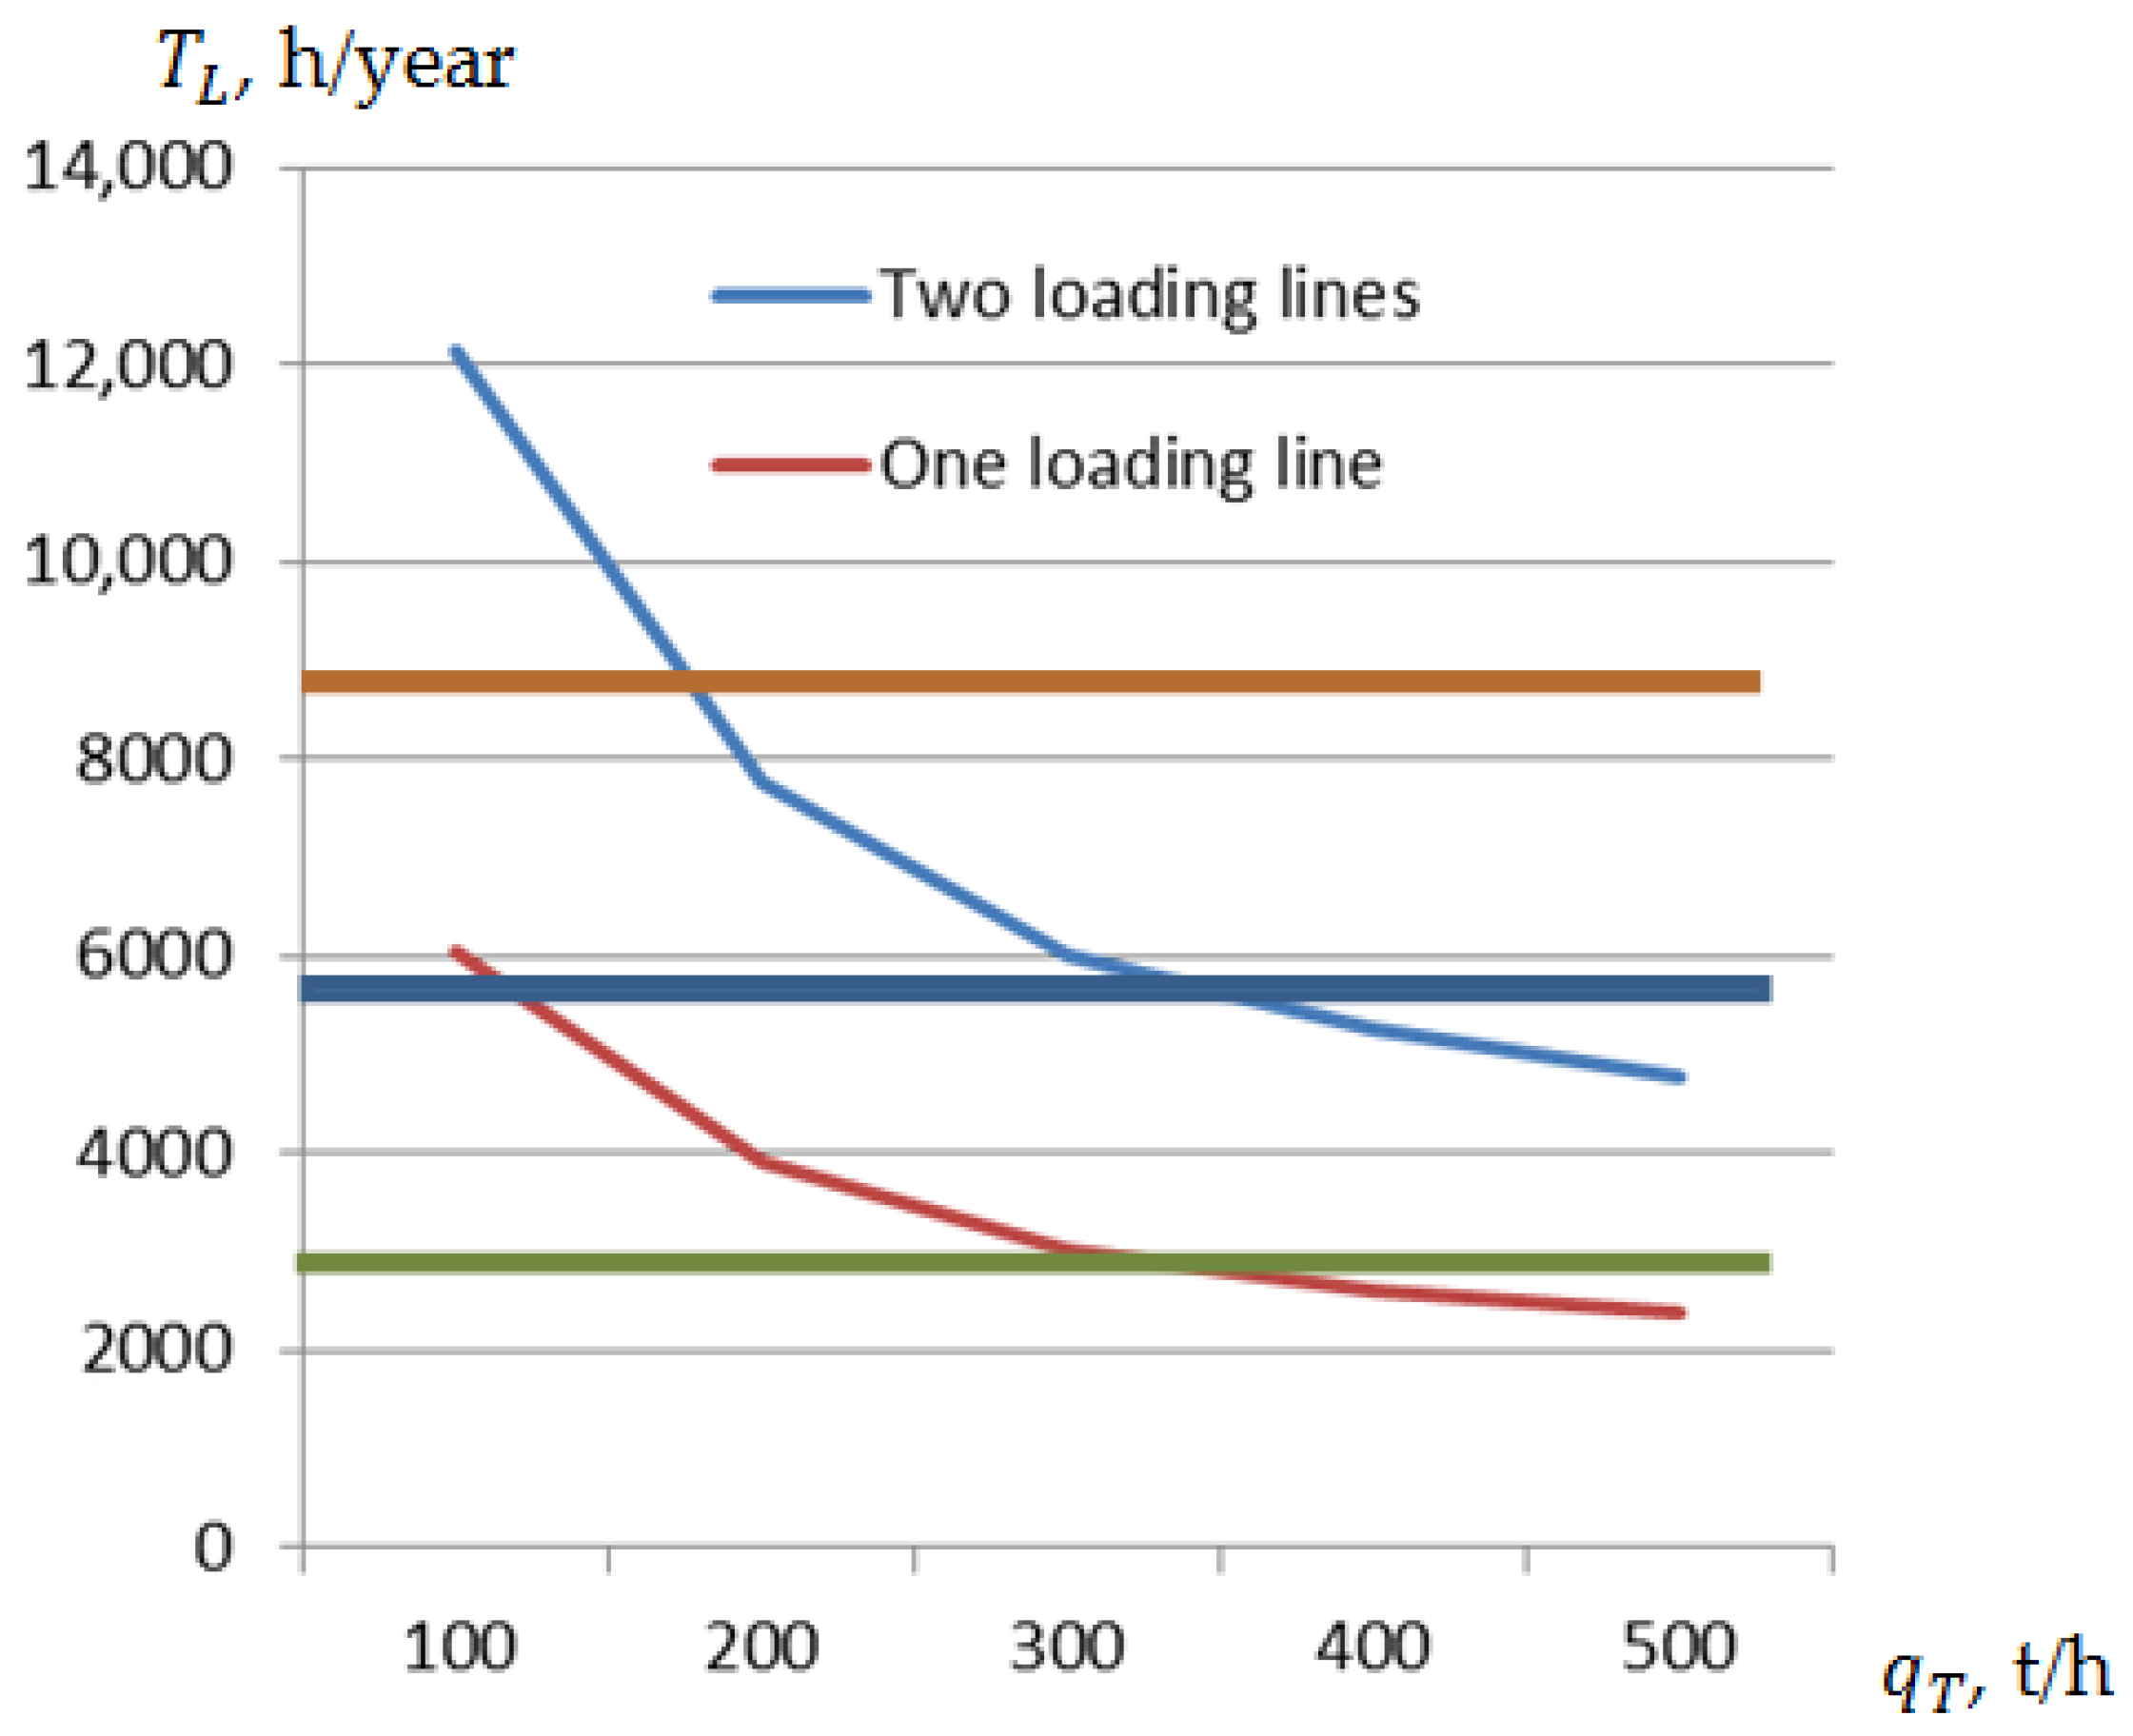
The number of ships at the terminal, considering the forecasted timber cargo flow ( Q C ) of about 650,000 t, the average ship capacity ( Q S ) of about 6000 t, and the intensity coefficient ( E S ), which at the current probability ( P T S ) of about 0.88 is about 1.14, will amount to about 124 ships per year. The average stay of such a ship in the port is about 40 h. Then the total time of the ships in the port should be about 4960 h. This means that with the forecasted timber cargo flow and loading through one berth and with a loading intensity of about 200 t/h, it will be difficult for the terminal to process the forecasted cargo volume.
To process the projected volume of timber cargo, it is necessary to increase either the loading intensity, using, for example, two loading lines, or increase the capacity of the loading equipment so that the loading equipment allows processing up to 350 t/h of timber cargo per day (16 working hours, i.e., two shifts), or to use three shifts, or to process two ships simultaneously, i.e., to increase the number of berths through which timber products can be loaded. Figure 10 presents the possible loading intensity and the possibilities of processing the projected volume of cargo using different methods and systems.
The results of the terminal warehouse capacity ( Q W ) and storage area ( S W ) depend on the storage time of the timber cargo at the terminal ( T W ), which is assumed to be from 5 days to 30 days, the terminal storage volume utilization factor ( k W ), which is assumed to be about 0.8, the permissible distributed load size of the storage space ( q W ), which is assumed to be from 5 to 10 t/m2, and the storage area utilization factor ( k S W ), which is assumed to be about 0.6, are presented in Figure 11.
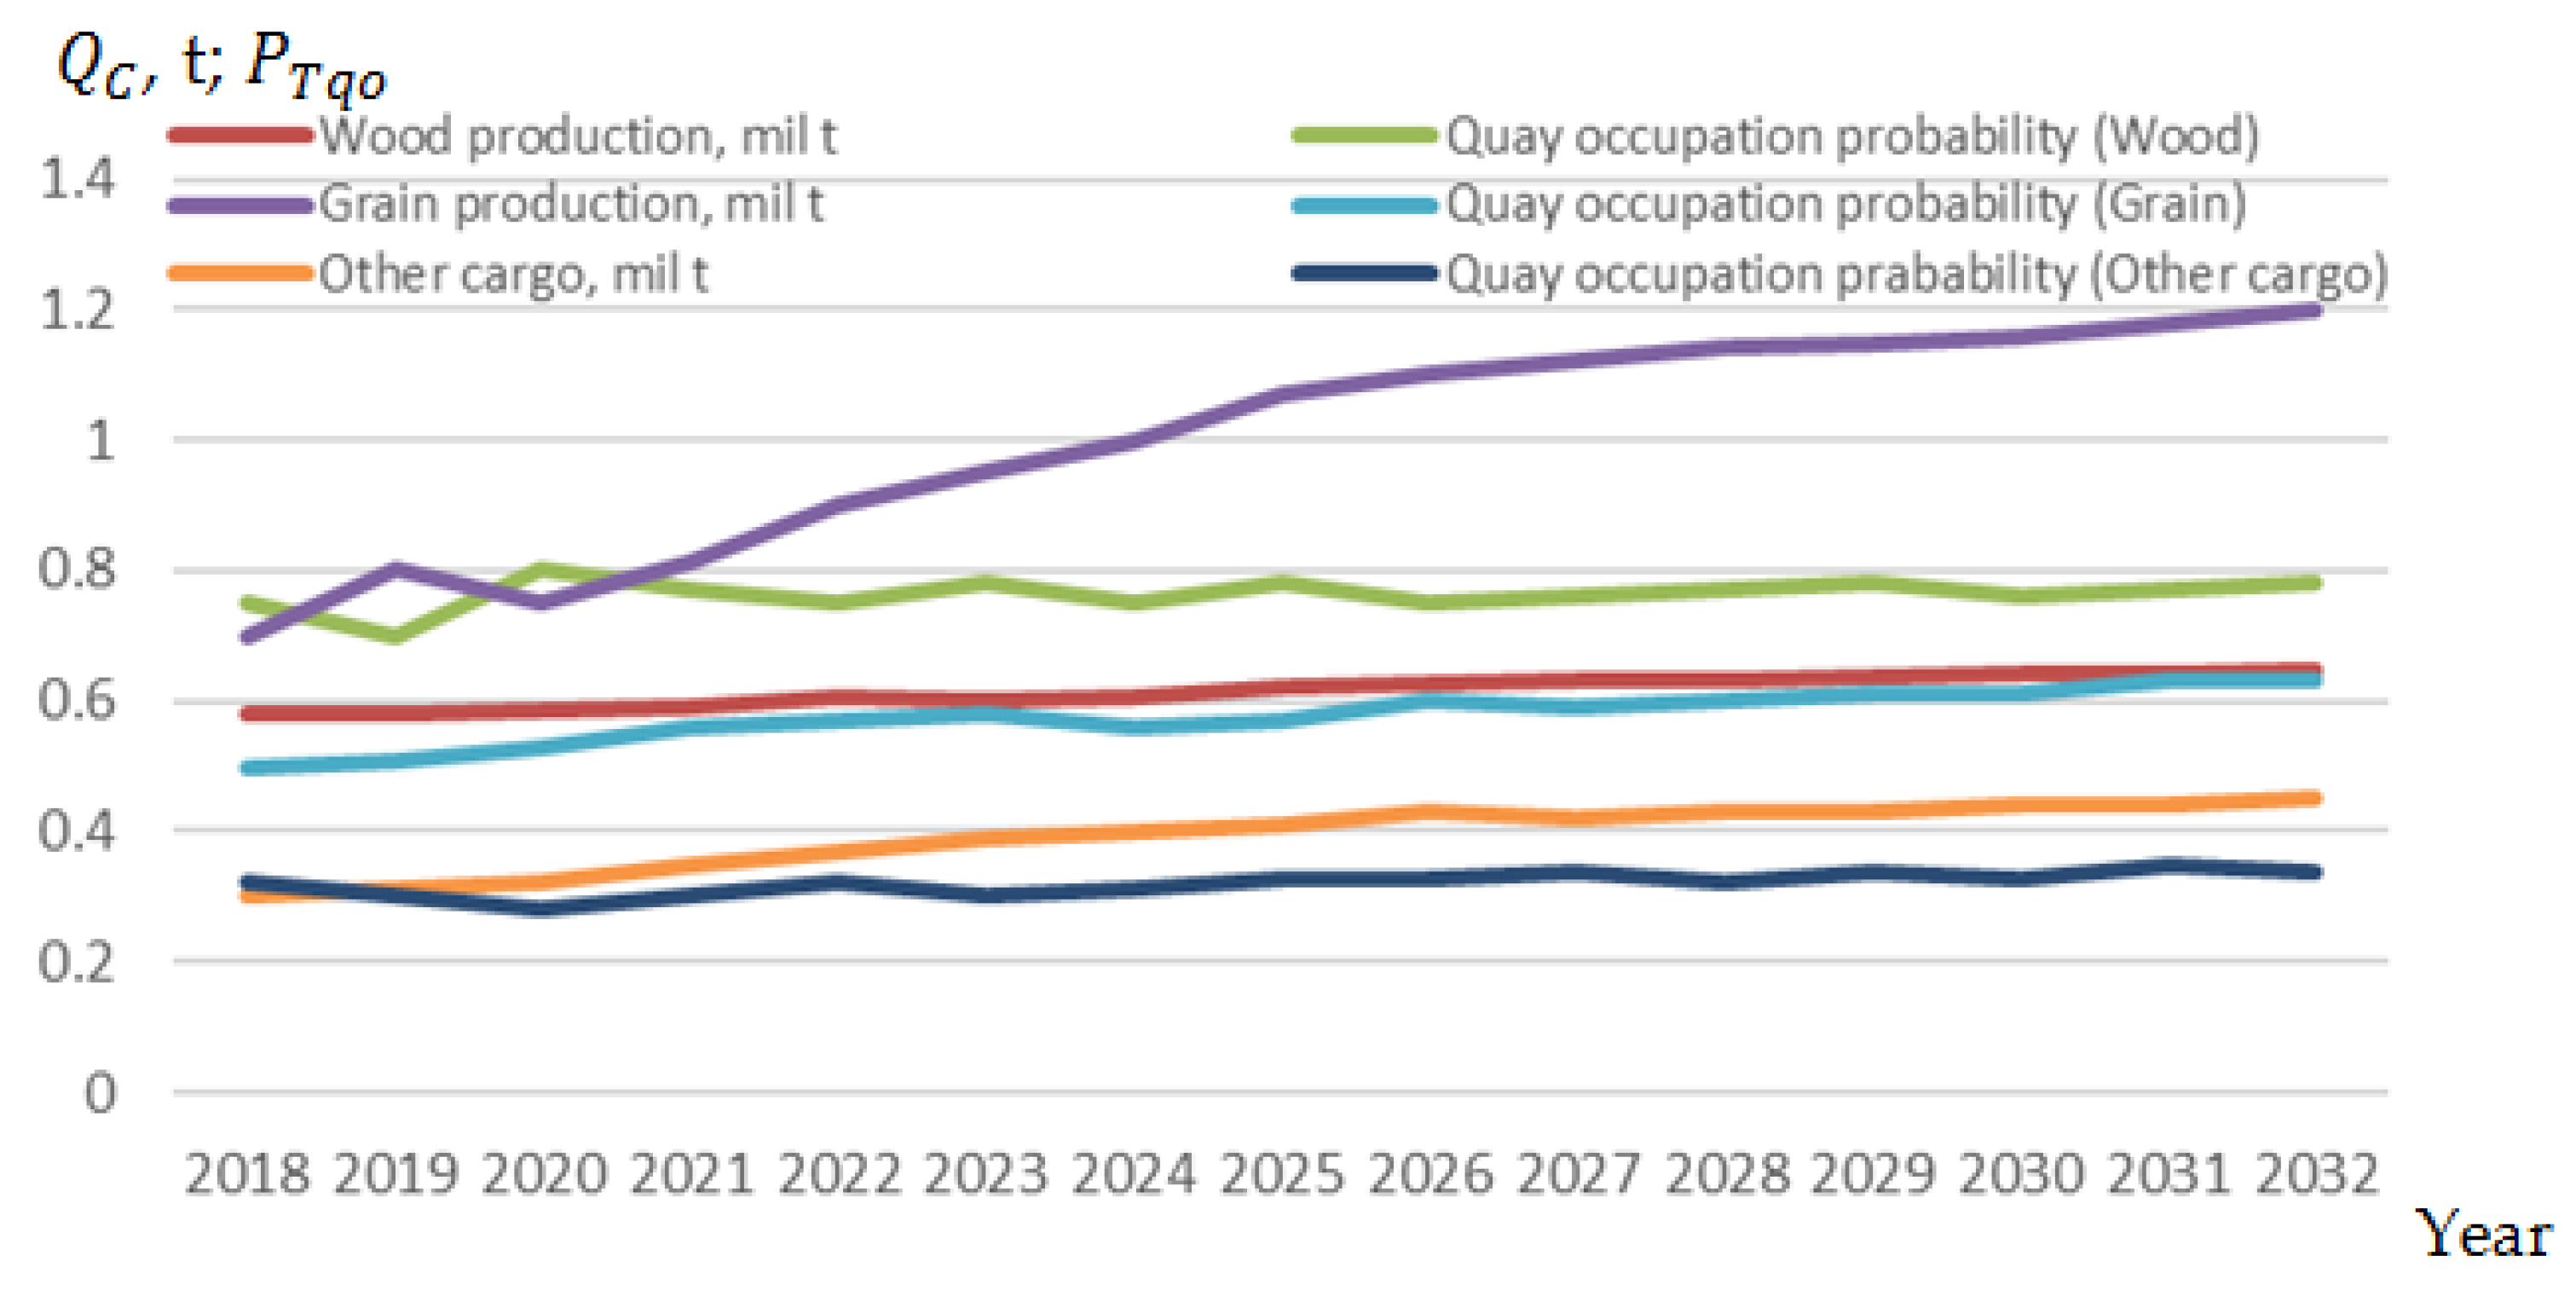
Using the multi-criteria forecasting method [35,36] it was found that after 7 years, the grain flow will be about 1,200,000, assuming an overall global economic growth of about 1.2% per year and a regional economic growth of about 2.3% per year, and also assuming that the terminal capacity should increase by about 20%, the competitor impact factor should be about 15% during the forecast period, and the impact of other factors should be about 5% during the forecast period. Assuming the average grain transport capacity of a ship is about 30,000 t, the processing time of one ship in the port is about 70 h, and the resulting intensity coefficient is about 1.12, the total number of these ships would be about 45, and their total time in the port would be about 3150 h.
The handling of other cargoes, using the multi-criteria forecasting method after 7 years, should amount to about 450,000 t, considering an overall world economic growth of about 1.2% per year and a regional economic growth of about 2.3% per year, along with the prediction that the terminal capacity should increase by about 40%, the competitor impact factor should amount to about 20% during the forecast period, and the impact of other factors should amount to about 15% during the forecast period. Assuming an average ship capacity of about 4000 t, and a calculated intensity coefficient of about 1.15, the terminal should process about 130 ships per year. If the resulting processing time of one ship at the terminal is about 36 h, then the total time of such ships in the port would be about 4680 h.
When evaluating the obtained cargo flow forecasting results, the probability of berth vacancy, assuming that grain will be loaded via one berth, and for loading timber and other cargo, assuming that it will be possible to use two berths and load a specific type of cargo (timber or other cargo) onto two ships at the same time, with one, two or three shifts and working 326 days a year, the probability of berth vacancy is as follows:
-
Using one shift and loading up to two ships at the berths for the same cargo flow—0.998;
-
Using two shifts and loading up to two ships at the berths for the same cargo flow—0.793;
-
Using three shifts and loading up to two ships at the berths for the same cargo flow—0.621.
The quantities of specific cargoes to be transshipped and forecast, and the probability of berth vacancy are presented in Figure 12.
The methodology presented in the article is focused on ships, i.e., ships entering ports and being moored at quays in ports; therefore, it can be applied to ships transporting various cargoes, including container ships. Analogous studies of other ports and terminals, adapting individual elements of the developed methodology [19,22,31,32], have shown that the developed methodology is applicable. In each specific case, the characteristics of specific ports and terminals and cargoes should be taken into account, and they must be adapted to a specific port or terminal.
The sustainability of a port from an environmental and social point of view is expressed through the possibilities of optimizing the time of ships’ berthing at the quays. This is directly related to the ability of specialists to accurately assess and organize the optimal presence of ships in the port. By optimizing the time of ships’ berthing in the port, the fuel consumption of ships in the port is minimized (if ships are not connected to shore power grids), and at the same time, the generation of minimal emissions from ships has a positive effect on minimizing the impact on the environment.
By accepting the obtained results of forecasting cargo flows and the number of ships, using the methodology presented in Section 3, it is possible to obtain the probability of berth occupancy or unoccupied berths depending on the number of loading lines simultaneously available to each ship, the number of shifts at the terminal, the intensity of loading equipment, and the number of ships loaded simultaneously, which are all very important in the creation and development of sustainable ports and port terminals.

5. Discussion

The developed methodology for assessing the occupancy of a quay port or terminal, as one of the most important elements of a sustainable port, allows for the assessment of the current and forecasted occupancy of quays and potential terminal occupancy, which allows for the search of various options for optimizing terminals and quays in order to achieve the implementation of a sustainable port [3,39]. The optimization of terminals and their quays is dependent on many factors, and further research may be useful in developing sustainable ports and implementing new port cargo processing technologies [40,41]. One of the main factors influencing the optimal use of quays and terminals themselves is the changes in the carrying capacity of ships. For many years, a trend of increasing the carrying capacity of ships has been observed, and ports, in pursuit of sustainability opportunities, are also making great efforts to accommodate as many large ships as possible; therefore, this direction of research on ports and their quays is important for further scientific research [42].
New cargo handling technologies shorten the time of ship loading operations, which is important for both the port terminal and the ship in developing sustainable port ideas. However, at the same time, the intensity of cargo delivery to the port and removal from the port must be increased; therefore, when developing port terminal technologies, it is necessary to combine them with the development of other transport modes in order to optimally use investments in transport systems development [16,43]. Integrated transport development research is promising, and further scientific research in this direction is also very important.
The research on the problems and “weak points” of the ports, supported by probabilistic assessments of specific factors and research on methods for solving specific port performance factors, is one of the most important challenges in the optimal use of port quays and can be one of the future research directions.
The unconditional implementation of international organizations, such as the International Maritime Organization (IMO), and its conventions in the development of sustainable ports, such as MARPOL-73 [44] and the UN 17 Sustainable Development Goals (SDGs) [45], is crucial to minimizing the impact on the environment and would be another research direction for the future.
Probabilistic methods for assessing port berth occupancy are very important because they can be used to study the strengths and weaknesses of new technologies and methods, thus avoiding potential errors and inefficient investments, which is very important in the creation and development of sustainable ports and terminals; therefore, scientific research is very important in optimizing the development of berths and terminals. Probabilistic studies of port berth occupancy are also very important because they can help to coordinate the aspects of cargo flow development and transportation through ports; therefore, it is expected that further development of probabilistic methods and their application in real conditions will be one of the promising research directions. In some countries, ports are being “squeezed” out of urban areas, such as Rotterdam (Netherlands), Zeebrugge (Belgium), Shanghai (China) and other ports, and the optimal use of quays and adjacent areas is becoming particularly important both in old port areas and in newly developing port areas; therefore, scientific research in this direction is important and promising.

6. Conclusions

Based on the theoretical and experimental studies conducted, the following conclusions can be drawn: the rapid development of ports and the pursuit of their sustainability in existing and new locations do not always assess the optimal number of quays and their use possibilities; therefore, the development of port infrastructure and superstructure must be based on prospective forecasted cargo and/or passengers. Probabilistic assessments of the use of berths and adjacent territories, both during planning and physical development, allow the optimization of the main parameters of berths and the efficiency of their use if the development possibilities are correctly assessed. In individual newly developed ports, without carrying out an assessment of the probabilistic capacity of terminals and berths and the necessary area occupancy, investments in the development of infrastructure and superstructure are often inappropriate, or the infrastructure and superstructure are not sufficiently developed, and it is necessary to re-implement development projects. The developed probabilistic methodology for ship mooring at quays (quay occupancy) allows for better planning of the use of quays and terminals, and at the same time, optimizes the use of adjacent quays and terminals and achieves port sustainability objectives.
The developed methodology can be applied to many ports and terminals; it is only necessary to adapt it to the situation of a specific port or terminal.
The use of the developed probabilistic quay occupancy methodology allows for the finding of more efficient ways to use the existing port quay capacities, and when planning new port quays, to exploit various efficient ways of using quays and adjacent territories, and at the same time to implement elements of a sustainable port, oriented toward SDGs.

Author Contributions

Conceptualization, V.P. (Vytautas Paulauskas); methodology, V.P. (Vytautas Paulauskas) and D.P.; software, V.P. (Vytautas Paulauskas) and V.P. (Vytas Paulauskas); validation, V.P. (Vytautas Paulauskas), D.P. and V.P. (Vytas Paulauskas); formal analysis, V.P. (Vytautas Paulauskas); investigation, V.P. (Vytautas Paulauskas); resources, V.P. (Vytautas Paulauskas) and D.P.; data curation, D.P. and V.P. (Vytas Paulauskas); writing—original draft preparation, V.P. (Vytautas Paulauskas) and D.P.; writing—review and editing, D.P. and V.P. (Vytas Paulauskas); visualization, D.P.; supervision, V.P. (Vytautas Paulauskas); project administration, V.P. (Vytautas Paulauskas); funding acquisition, V.P. (Vytautas Paulauskas). All authors have read and agreed to the published version of the manuscript.

Funding

This research received no external funding.

Institutional Review Board Statement

Not applicable.

Informed Consent Statement

Not applicable.

Data Availability Statement

Data are contained within the article.

Acknowledgments

This article is based on the research conducted by the Maritime Engineering Department of Klaipeda University.

Conflicts of Interest

The authors declare no conflicts of interest.

References

  1. Valentine, V.F.; Benamara, H.; Hoffmann, J. Maritime transport and international seaborne trade. Marit. Policy Manag. 2013, 40, 226–242. [Google Scholar] [CrossRef]
  2. Duru, O. The Origin and Consistency of the Ton–Mile Metric in the Shipping Economics. Logistics 2017, 1, 3. [Google Scholar] [CrossRef]
  3. Santos, T.A. Sustainable Port Operations: Pollution Prevention and Mitigation Strategies. Sustainability 2025, 17, 4798. [Google Scholar] [CrossRef]
  4. Review of Maritime Transport 2021. United Nations Conference on Trade and Development, New York. 2021. Available online: https://unctad.org/system/files/official-document/rmt2021_en_0.pdf (accessed on 25 August 2025).
  5. Liu, C.; Yu, Y.; Ye, W.; Xu, S.; Qu, B.; Yang, P. Energy management strategy and software design for shore power DC microgrid system. In Proceedings of the 2023 IEEE Transportation Electrification Conference and Expo, Asia-Pacific (ITEC Asia-Pacific), Chiang Mai, Thailand, 28 November–1 December 2023; pp. 1–7. [Google Scholar]
  6. Maksimavičius, R. Some Elements of the Ro-Ro Terminals. Transport 2004, 19, 75–81. [Google Scholar] [CrossRef]
  7. Potential of Container Terminal Operations for RoRo Terminals. Available online: https://www.researchgate.net/publication/383223973_Potential_of_Container_terminal_operations_for_RoRo_terminals (accessed on 25 August 2025).
  8. Notteboom, T. Roro shipping vs. trucking: Revisiting the impact of low-sulphurmarine fuel use on cost competitiveness of routing options in north Europe. WMU J. Marit. Aff. 2020, 19, 399–426. [Google Scholar] [CrossRef]
  9. Gülmez, Y.; Tapaninen, U.P. Predicting cargo handling and berthing times in bulk terminals: A neural network approach. Case Stud. Transp. Policy 2025, 19, 101351. [Google Scholar] [CrossRef]
  10. Barasa, L.; Malau, A.G.; Sumali, B. Effect of Berthing Time and Berth Output on Conventional Donation Utilization at PT Pelindo II Palembang Branch. Int. Rev. Manag. Mark. 2019, 9, 6–17. [Google Scholar] [CrossRef]
  11. UNCTAD. International Maritime Trade and Port Traffic; UNCTAD: Geneva, Switzerland, 2019; pp. 1–25. [CrossRef]
  12. Connor, E.O.; Evers, N.; Vega, A. Port performance from a policy perspective—A systematic review of the literature. J. Ocean Coast. Econ. 2019, 6, 3. [Google Scholar] [CrossRef]
  13. Munim, Z.H.; Saeed, N. Seaport competitiveness research: The past, present and future. Int. J. Shipp. Transp. Logist. 2019, 11, 533–557. [Google Scholar] [CrossRef]
  14. Weerasinghe, B.A.; Perera, H.N.; Bai, X. Optimizing container terminal operations: A systematic review of operations research applications. Marit. Econ. Logist. 2023, 26, 307–341. [Google Scholar] [CrossRef]
  15. Clark, X.; Dollar, D.; Micco, A. Port efficiency, maritime transport costs, and bilateral trade. J. Dev. Econ. 2004, 75, 417–450. [Google Scholar] [CrossRef]
  16. Munim, Z.H.; Schramm, H.-J. The impacts of port infrastructure and logistics performance on economic growth: The mediating role of seaborne trade. J. Shipp. Trade 2018, 3, 1–19. [Google Scholar] [CrossRef]
  17. Paulauskas, V. LNG Transportation and Storage; Klaipeda University Publish House: Klaipėda, Lithuania, 2017; 304p. (In Lithuanian) [Google Scholar]
  18. Olba, X.B.; Daamen, W.; Vellinga, T.; Hoogendoorn, S.P. Multi-criteria evaluation of ship traffic for port assessment: A case study of the Port of Rotterdam. Case Stud. Transp. Policy 2019, 7, 871–881. [Google Scholar] [CrossRef]
  19. Port of Shanghai. Available online: https://en.wikipedia.org/wiki/Port_of_Shanghai (accessed on 25 August 2025).
  20. Available online: https://www.marinetraffic.com/en/ais/home/centerx:-12.0/centery:24.9/zoom:4 (accessed on 25 August 2025).
  21. Port of Fujairah. Available online: https://fujairahport.ae/ (accessed on 25 August 2025).
  22. Port of Rotterdam Authority. Available online: https://www.portofrotterdam.com/en (accessed on 25 August 2025).
  23. Top 50 Ports in the World. Available online: https://www.worldshipping.org/top-50-ports (accessed on 25 August 2025).
  24. Tan, C.; He, J. Integrated proactive and reactive strategies for sustainable berth allocation and quay crane assignment under uncertainty. Ann. Oper. Res. 2025, 349, 879–910. [Google Scholar] [CrossRef]
  25. Song, Y.; Ji, B.; Yu, S.S. Multi-Port Berth Allocation and Time-Invariant Quay Crane Assignment Problem with Speed Optimization. IEEE Trans. Intell. Transp. Syst. 2025, 26, 128–142. [Google Scholar] [CrossRef]
  26. Zheng, H.; Wang, Z.; Liu, H. The Integrated Rescheduling Problem of Berth Allocation and Quay Crane Assignment with Uncertainty. Processes 2023, 11, 522. [Google Scholar] [CrossRef]
  27. Chu, L.; Zhang, J.; Chen, X.; Yu, Q. Optimization of Integrated Tugboat–Berth–Quay Crane Scheduling in Container Ports Considering Uncertainty in Vessel Arrival Times and Berthing Preferences. J. Mar. Sci. Eng. 2024, 12, 1541. [Google Scholar] [CrossRef]
  28. Li, S.; Song, L. Berth Allocation and Quay Crane Assignment Considering the Uncertain Maintenance Requirements. Appl. Sci. 2025, 15, 660. [Google Scholar] [CrossRef]
  29. Elmi, Z.; Singh, P.; Meriga, V.K.; Goniewicz, K.; Borowska-Stefańska, M.; Wiśniewski, S.; Dulebenets, M.A. Uncertainties in Liner Shipping and Ship Schedule Recovery: A State-of-the-Art Review. J. Mar. Sci. Eng. 2022, 10, 563. [Google Scholar] [CrossRef]
  30. Gürel, S.; Shadmand, A. A heterogeneous fleet liner ship scheduling problem with port time uncertainty. Cent. Eur. J. Oper. Res. 2019, 27, 1153–1175. [Google Scholar] [CrossRef]
  31. Port of Antwerp. Available online: https://www.portofantwerpbruges.com/en (accessed on 25 August 2025).
  32. Port of Yakohama. Available online: https://www.vesseltracker.com/en/Port/Yokohama/Dashboard.html (accessed on 25 August 2025).
  33. Bregni, S.; Jmoda, L. Improved Estimation of the Hurst Parameter of Long-Range Dependent Traffic Using the Modified Hadamard Variance. In Proceedings of the 2006 IEEE International Conference on Communications (ICC 2006), Istanbul, Turkey, 11–15 June 2006. [Google Scholar]
  34. Hanqing, J.; Shige, P. Optimal unbiased estimation for maximal distribution. Am. Inst. Math. Sci. 2021, 6, 189–198. [Google Scholar] [CrossRef]
  35. Jaynes, E.T. Probability Theory the Logic of Science; Cambridge University Press: New York, NY, USA, 2003; 758p. [Google Scholar]
  36. Paulauskas, V. Logistika; Klaipeda University Publish House: Klaipėda, Lithuania, 2007; 288p. (In Lithuanian) [Google Scholar]
  37. Alalawin, A.; Arabiyat, L.M.; Alalaween, W.; Qamar, A.; Mukattash, A. Forecasting vehicle’s spare parts price and demand. J. Qual. Maint. Eng. 2021, 27, 483–499. [Google Scholar] [CrossRef]
  38. Google Maps. Available online: https://www.google.com/maps/@55.7306584,21.1467253,3826m/data=!3m1!1e3?entry=ttu&g_ep=EgoyMDI1MDczMC4wIKXMDSoASAFQAw%3D%3D (accessed on 25 August 2025).
  39. Iris, C.; Pacino, D.; Røpke, S. Improved formulations and an Adaptive Large Neighborhood Search heuristic for the integrated berth allocation and quay crane assignment problem. Transp. Research. Part E Logist. Transp. Rev. 2017, 105, 123–147. [Google Scholar] [CrossRef]
  40. Cheimanoff, N.; Fontane, F.; Kitri, M.N.; Tchernev, N. Exact and heuristic methods for the integrated berth allocation and specific time-invariant quay crane assignment roblems. Comput. Oper. Res. 2022, 141, 105695. [Google Scholar] [CrossRef]
  41. Yu, J.; Tang, G.; Song, X. Collaboration of vessel speed optimization with berth allocation and quay crane assignment considering vessel service differentiation. Transport. Res. E Logist. Transport. Rev. 2022, 160, 102651. [Google Scholar] [CrossRef]
  42. Yin, D.; Niu, Y.; Yang, J.; Yu, S. Static and Discrete Berth Allocation for Large-Scale Marine-Loading Problem by Using Iterative Variable Grouping Genetic Algorithm. J. Mar. Sci. Eng. 2022, 10, 1294. [Google Scholar] [CrossRef]
  43. Guo, L.; Zheng, J.; Du, J.; Gao, Z.; Fagerholt, K. Integrated planning of berth allocation, quay crane assignment and yard assignment in multiple cooperative terminals. Transp. Res. Part E Logist. Transp. Rev. 2024, 183, 103456. [Google Scholar] [CrossRef]
  44. IMO International Convention for the Prevention of Pollution from Ships (MARPOL-73/78). Available online: https://www.imo.org/en/knowledgecentre/conferencesmeetings/pages/marpol.aspx (accessed on 25 August 2025).
  45. UN 17 Sustainable Development Goals (SDGs). Available online: https://sdgs.un.org/goals (accessed on 25 August 2025).
Figure 1. Ships waiting at anchorage at the port of Shanghai [20].
Sustainability 17 08973 g001
Figure 2. Vessels waiting at anchorage at the port of Fujairah (United Arab Emirates) [20].
Sustainability 17 08973 g002
Figure 3. Ships at anchor in the port of Rotterdam (The Netherlands) [20].
Sustainability 17 08973 g003
Figure 4. Ships at the quays of Malku Bay Terminal (Klaipeda Port) [20].
Sustainability 17 08973 g004
Figure 5. Antwerp Port Container Terminal [20].
Sustainability 17 08973 g005
Figure 6. Shanghai Port General Cargo Terminal [20].
Sustainability 17 08973 g006
Figure 7. Port Yokohama (Japan) container terminal (quay occupation is about 30%).
Sustainability 17 08973 g007
Figure 8. The steps of research methodology.
Sustainability 17 08973 g008
Figure 9. Multifunctional terminal in port of Klaipeda [20,38].
Sustainability 17 08973 g009
Figure 10. Time spent by ships in port when loading 660,000 t/year of timber cargo, depending on the number of available terminal loading lines, and using a different number of terminal shifts: green horizontal line—one shift; blue horizontal line—two shifts; orange horizontal line—three shifts.
Sustainability 17 08973 g010
Figure 11. Dependence of terminal storage capacity and storage area when processing 660,000 t of timber cargo on cargo storage time and storage area, and on permissible distributed load.
Sustainability 17 08973 g011
Figure 12. Cargo flows and berth occupancy statistics (until 2024), and cargo flows and berth occupancy probability forecasts.
Sustainability 17 08973 g012
Table 1. Statistics and forecast of timber cargo at the terminal (in thousands of tons).
YearCargo Flow, Thousand TonsForecast CoefficientFactor 1Factor‘s WeightFactor 2Factor‘s WeightFactor 3Factor‘s WeightFactor 4Factor‘s WeightFactor 5Factor‘s WeightMulticriteria CoefficientForecast Cargo Flow Optimistic   Cargo   Flow   ( + σ = 12)
1580
25800
35852.5
45903.3
56056.25
66004
76084.7
8 1.20.252.30.2510.1510.210.151.009611623
9 2.00.254.40.2510.1510.210.151.016615627
10 3.10.256.50.2510.1510.20.90.151.009618630
11 4.30.258.20.251.10.150.950.20.90.151.007621633
12 5.50.2510.10.251.20.150.900.20.90.151.034625637
13 6.70.2512.30.251.20.150.900.210.151.058629641
14 7.80.2514.50.251.20.150.850.210.151.056632644
15 9.00.2516.70.251.20.150.850.210.151.065636648
Disclaimer/Publisher’s Note: The statements, opinions and data contained in all publications are solely those of the individual author(s) and contributor(s) and not of MDPI and/or the editor(s). MDPI and/or the editor(s) disclaim responsibility for any injury to people or property resulting from any ideas, methods, instructions or products referred to in the content.