Article

Predictive Energy Storage Management with Redox Flow Batteries in Demand-Driven Microgrids

1
Faculty of Systems, Electronics and Industrial Engineering, Universidad Técnica de Ambato, Ambato 180206, Ecuador
2
Department of Electrical Engineering, University of Jaén, 23700 Linares, Spain
3
Department of Electrical Engineering, Electronics, and Telecommunications (DEET), Universidad de Cuenca, Cuenca 010101, Ecuador
*
Author to whom correspondence should be addressed.
Sustainability 2025, 17(19), 8915; https://doi.org/10.3390/su17198915
Submission received: 5 September 2025 / Revised: 24 September 2025 / Accepted: 29 September 2025 / Published: 8 October 2025

Abstract

Accurate demand forecasting contributes to improved energy efficiency and the development of short-term strategies. Predictive management of energy storage using redox flow batteries is presented as a robust solution for optimizing the operation of microgrids from the demand side. This study proposes an intelligent architecture that integrates demand forecasting models based on artificial neural networks and active management strategies based on the instantaneous production of renewable sources within the microgrid. The solution is supported by a real-time monitoring platform capable of analyzing data streams using continuous evaluation algorithms, enabling dynamic operational adjustments and active methods for predicting the storage system’s state of charge. The model’s effectiveness is validated using performance indicators such as RMSE, MAPE, and MSE, applied to experimental data obtained in a specialized microgrid laboratory. The results also demonstrate substantial improvements in energy planning and system operational efficiency, positioning this proposal as a viable strategy for distributed and sustainable environments in modern electricity systems.

1. Introduction

The integration of distributed renewable energy resources (DREs) into modern power systems has introduced new challenges in maintaining the supply–demand balance due to the intermittent nature of solar and wind power. In this context, energy storage systems (ESSs) have become a key element for mitigating power fluctuations and supporting local energy self-sufficiency within microgrids [1]. Among the available storage technologies, vanadium redox flow batteries (VRFBs) offer operational benefits such as long cycle life, scalability, and adjustable power-to-energy ratio configurations [2].
Demand forecasting is vital in supporting predictive energy management, particularly in systems where energy generation and consumption vary considerably. The combination of forecasting models with real-time control enables microgrid operators to anticipate energy imbalances and coordinate ESS operation in advance, reducing energy losses and limiting unnecessary charge-discharge cycles [3,4]. Advances in artificial intelligence and neural networks have contributed to improved forecasting accuracy, especially for short-term load and generation profiles [4,5,6].
This study presents a predictive energy storage management approach for demand-driven microgrids that integrates VRFB systems with a neural network-based demand forecasting module. The framework was developed and tested in a laboratory-scale microgrid, confirming its practical implementation and relevance for real-world applications.

1.1. Literature Review

Recent research has examined the integration of energy forecasting models with storage system operation as a strategy to enhance microgrid efficiency, responsiveness, and economic performance under uncertain conditions. Tushar et al. [7] proposed a decentralized demand-side management (DSM) method based on real-time coordination of electric vehicles (EVs), ESSs, and renewable generation. Their game-theoretic framework connects day-ahead demand forecasts with real-time consumption corrections, providing adaptive control actions to reduce penalty costs from forecast deviations. Similarly, Alvarado-Barrios et al. [8] developed a stochastic unit commitment model to evaluate the impact of load forecasting errors in hybrid microgrids. Their simulations indicated that prediction uncertainty can be addressed through the appropriate allocation of spinning reserves and storage resources. Sharrma et al. [9] designed a scheduling system for peak shaving that incorporates week-ahead forecasting of both PV generation and demand to operate a BESS connected to a primary distribution substation.
Control-oriented studies have focused on predictive strategies based on model predictive control (MPC). Lyu et al. [10] introduced a tube-based MPC approach that explicitly incorporates state-of-charge (SoC) constraints and forecast error bounds to ensure feasible battery operation in real time. Building on MPC schemes, Mary and Dessaint [11] implemented a two-stage neural network forecasting model within a structured MPC framework to manage BESSs in campus buildings, improving peak shaving and resilience against prediction inaccuracies. The application of LSTM neural networks for short-term prediction and optimization of HESS systems using machine learning-based algorithms has also been combined [12]. Other studies have explored the integration of learning-based forecasting in energy management systems. For instance, Kim et al. [13] developed a real-time prediction system that combines K-means clustering with long short-term memory (LSTM) networks. Deployed in a commercial building using vehicle-to-grid and second-life batteries, the system enabled over 21% demand reduction and supported dynamic load balancing. Demand-side load shedding strategies have also been studied [14]. This study proposes an integrated underfrequency load shedding strategy for isolated microgrids using multiclass factors.
Deep learning-based forecasting has also supported strategic market participation. Sadeghi et al. [15] presented a bidirectional LSTM model for internal load and generation forecasting in virtual power plants (VPPs), which informed bidding strategies in energy and frequency regulation markets. In a related study, Zhang et al. [3] proposed a hybrid GA-LSTM model to characterize demand response behaviors such as interruptible and transferable loads. Their framework yielded more accurate short-term load forecasts when accounting for price-responsive user behavior. Ruiz-Abellón et al. [4] extended forecasting to the probabilistic domain using quantile regression methods to assess uncertainty bands in demand response planning. Their results indicated measurable reductions in deviation from contracted energy under probabilistic control schemes.
Several studies have also addressed the structural optimization of storage systems alongside forecasting techniques. Apribowo et al. [2] optimized the allocation of VRFBs for renewable integration, reporting lower operational costs compared to lithium-ion alternatives. Similarly, Selvarasu et al. [1] examined BESS sizing to mitigate power fluctuations in PV farms, proposing a reserve strategy based on ramp-rate control. On the residential scale, Abedi and Kwon [16] integrated rolling-horizon optimization with recurrent neural network forecasting to manage BESS operation under time-varying demand and price signals. Promasa et al. [17] applied LSTM-based forecasting to determine optimal BESS sizing for EV-integrated households, showing that predictive methods can help reduce system costs while maintaining service availability.
Another favorable application of microgrids is energy management through residential microgrid cluster strategies (RM clusters) [18,19,20]. This allows for improved efficiency, resilience, and autonomy of distributed systems through advanced artificial intelligence and decentralized control techniques. The authors in [18] present an approach that represents a significant evolution in microgrid energy management, combining distributed artificial intelligence, data protection, and operational efficiency. These studies have demonstrated that the implementation of technologies such as Fuzzy Logic Controller, Multi-Agent System, Gradient Descent, and Deep Reinforcement Learning can complement energy management and optimize these systems in intelligent control and cooperative operation.
Sharifhosseini et al. [5] and Wang et al. [6] compiled detailed reviews of AI-based energy forecasting and control approaches, covering techniques from classical time series analysis to hybrid deep learning architectures, with applications ranging from anomaly detection to demand response management. Algburi et al. [21] discussed the role of AI across multiple layers of renewable energy integration, from predictive maintenance to adaptive microgrid control. In industrial contexts, Mughees et al. [22] developed an hour-ahead energy management system that combines reinforcement learning and deep forecasting for coordinating both electrical and thermal storage in multi-energy microgrids. Additional contributions, such as those by Filho et al. [23], Dong et al. [24], and Sanan et al. [25], addressed AI-supported optimization in areas including lithium BESS scheduling and hybrid renewable-powered desalination.
To synthesize the above findings and clarify the focus of this study, Table 1 provides a comparative review of selected works from the last decade that combine demand forecasting with energy storage systems in microgrid and distributed energy contexts. The table outlines each study’s objectives, methods, technologies, and limitations. This comparison helps establish the context for the present work, which combines short-term load forecasting and adaptive energy management based on real-time SoC control of VRFBs in an experimental university microgrid. Unlike many prior studies that rely exclusively on lithium-based systems or operate within simulated environments, this work presents a validated integration of forecasting, control, and real-time measurement in a functional laboratory-scale setting.

1.2. Research Problem

Many current implementations of demand forecasting and storage coordination are based on lithium-ion batteries or simulated datasets, often lacking experimental validation in operational microgrid environments that use alternative storage technologies. In addition, commonly applied forecasting models tend to focus on short prediction horizons or require large datasets without incorporating adaptive feedback from real-time demand deviations.
This work addresses these limitations by integrating VRFBs into a predictive energy management framework designed for a university-based microgrid. The proposed approach combines Wide Neural Networks (WNNs) with historical demand data to produce short-term forecasts, which inform the planning of the storage system’s energy exchange strategy.
During operation, forecasted demand is continuously compared with real-time measurements, allowing for dynamic adjustment of the battery’s SoC. This closed-loop mechanism improves consistency between forecasted and actual demand, keeping the storage system within operationally suitable limits for the upcoming energy cycle. The strategy enhances short-term planning while remaining consistent with the system’s physical constraints and existing control infrastructure.
This paper is organized as follows: Section 2 presents the summarized system architecture. Section 3 details the methodology and materials. Section 4 presents a microgrid case study. Section 5 analyzes the study results and provides a discussion. Finally, Section 6 concludes the study.

2. System Architecture

This schematic in Figure 1 represents a smart microgrid that integrates real-time energy metering, demand forecasting, renewable energy integration (PV), vanadium redox flow battery (VRFB) storage, an open IoT platform, and local and remote control of the microgrid. The sequential steps of the proposed methodology are summarized below.
Data Collection: 
Smart energy meters are strategically placed at specific points in the main distribution panels to collect real-time data. This ensures continuous demand monitoring based on the current energy landscape.
Microgrid Monitoring and Control: 
The use of MODBUS over TCP/IP platforms enables demand and microgrid monitoring through Application Programming Interfaces (APIS) and a local server. This allows for dynamic analysis of PV production and energy consumption demand, with access to management of the VRFB (Remote Power Storage Facility).
Remote Demand Monitoring: 
The proposed system uses ThingSpeak ©2025 and Python v3.10.0 servers to establish a Remote Monitoring Unit (RMU) in the cloud. This facilitates real-time remote communication with the microgrid.
Real-Time Demand Forecasting: 
After data collection, a training model is established based on demand profiles from previous days to predict the next day based on deep learning models. This allows for real-time monitoring of current energy consumption and predictions.
Automatic control algorithm: 
The study incorporates a storage system control model in predictive IoT environments. This improves the system’s predictive capacity and decision-making processes in optimizing the storage system’s state of charge for future demand events.

3. Methods and Materials

This study adopts a hybrid methodological approach that combines real-time data acquisition, predictive modeling, and automated control within a smart microgrid environment. The proposed framework leverages a suite of specialized software tools to enable seamless integration between measurement, forecasting, and energy management processes. Smart meters are deployed to capture high-resolution demand profiles, which are transmitted via ThingSpeak APIs to MATLAB ©2025 for structured storage and preprocessing. Concurrently, SCADA system variables such as PV, WT, and VRFB power are monitored through LabVIEW interfaces operating on a local server network. These data streams form the basis for training neural network models using MATLAB’s deep learning toolbox, enabling short-term demand forecasting with high accuracy. For real-time operation, Python scripts are employed to dynamically load and update demand datasets, facilitating continuous prediction and adaptive control. The integration of Modbus communication protocols within MATLAB allows direct interaction with the VRFB system, executing charge/discharge commands based on forecasted demand and system state of charge. The following Figure 2 details the workflow for this section. This multiplatform architecture ensures robust interoperability between data acquisition, predictive analytics, and control execution, positioning the methodology as a scalable and replicable solution for intelligent microgrid management.

3.1. Demand Forecast

The tools for implementing the demand forecasting model are based on the integration of smart meters, data recording and processing, and training and validating a predictive model based on neural networks. The necessary configurations are detailed below.

3.1.1. Smart Meter

Smart energy meters enable real-time monitoring of electricity consumption, as well as detailed analysis of energy efficiency. These devices also facilitate continuous data acquisition and structured storage in databases, enabling more accurate subsequent evaluations. As indicated in the previous section, these devices have been instrumental in building robust repositories with demand profiles at different measurement points. Consequently, a power demand monitoring system has been implemented, generating files with large volumes of daily data that have been systematically recorded.

3.1.2. Data Recording and Preprocessing

The dataset is generated using a program divided into functions that query the ThingSpeak API, which provides sensor data approximately every 30 s. The data are stored in CSV files updated daily to optimize processing times.
During the preprocessing stage, it was observed that the data recorded for Mondays, Tuesdays, Wednesdays, Thursdays, and Fridays presented a consistent pattern in the power demand profile and were similar to the normal work schedule, generating approximately 70 kWh per day. In contrast, the data for Saturdays and Sundays show a constant baseline consumption without hourly variation, with an average generation of 30 kWh. Based on this difference, the database used for model training considers data exclusively from weekdays, allowing for the selection of filtered input values and the exclusion of data matrices that could affect the neural network’s training parameters. Consequently, the system converts the readings to one-minute intervals, adjusts the time zone, and filters only weekdays, excluding weekends, to improve predictive accuracy. A dataframe is then consolidated with the energy demand for the selected days. The details of these recorded data will be analyzed later in Section 5.1.
The CSV file is generated, the data are read, and columns not required for the prediction are removed (the time column and the current day column). Then, linear interpolation techniques are applied to fill in missing values, and the matrix is transposed so that each row corresponds to a full day. In this way, the input and output variables are constructed: four consecutive days are taken as the input window, and the fifth day is assigned as the expected output, allowing the model to learn the relationship between past behavior and future demand values. Finally, the dataset is normalized to homogenize consumption values, preventing scale differences from affecting training. It is then split into 70% training data and 30% validation data, ensuring that the model generalizes adequately.

3.1.3. Architecture of the Prediction Neural Network Model

The predictive model is implemented as a feedforward neural network using the Keras library. It consists of two dense layers: one hidden layer with ReLU activation and one output layer with linear activation. The model is trained using the Huber loss function and the Adam optimizer. The hidden layer (ReLU activation) is described according to the following Equation (1):
H ( 1 ) = ReLU ( X · W ( 1 ) + b ( 1 ) )
where:
  • X R n × d be the input matrix with d features,
  • Y R n × m be the target output matrix with m output variables,
  • W ( 1 ) R d × 100 and b ( 1 ) R 100 be the weights and biases of the hidden layer,
  • W ( 2 ) R 100 × m and b ( 2 ) R m be the weights and biases of the output layer.
Then, the Output Layer with linear activation can be calculated as Equation (2):
Y ^ = H ( 1 ) · W ( 2 ) + b ( 2 )
Figure 3 presents the basic architecture of the defined neural network, which consists of a hidden layer with n = 100 neurons, the ReLU activation function, and an output layer that predicts the next day’s demand. It is trained using the Huber loss function, which combines the robustness of MAE and the sensitivity of MSE to outliers, along with the Adam optimizer. In addition, early stopping is implemented to stop training if no improvements are observed, avoiding overfitting.
Finally, the predictions P l d ˜ are represented with a 15% confidence interval, showing both actual measurements and projections with their variation bands. This facilitates the interpretation and practical use of the model for energy management.
Moreover, the loss function (Huber Loss) is defined by the following Equation (3):
L δ ( y , y ^ ) = 1 2 ( y y ^ ) 2 if | y     y ^ |   δ δ · ( | y y ^ | 1 2 δ ) if | y     y ^ |   > δ
where δ is the threshold parameter (default value: δ = 1.0 ).
The model is trained for 300 epochs with early stopping based on validation loss. The best weights are restored if no improvement is observed for 20 consecutive epochs. The batch size is set to the full training set size.

3.2. Photovoltaic Systems

The PV system is modeled using the single-diode equivalent circuit method, which includes a light-generated current source ( I L ), a diode, a series resistance ( R s ), and a shunt resistance ( R s h ) [27,28,29]. The output current I of the PV module is given by:
I = I L I 0 exp V + I R s n V T 1 V + I R s R s h
where I L is the light-generated current, I 0 is diode saturation current, V is the output voltage, R s and R s h are the series resistance and shunt, n is diode ideality factor and finally the thermal voltage V T , defined as:
V T = k T q × n I × N c e l l
where k is the Boltzmann constant ( 1.3806 × 10 23 J/K), T is the cell temperature, q is the electron charge ( 1.6022 × 10 19 C), n I is the diode ideality factor and N c e l l is the number of cells connected in series in a module.
The output power of the PV module P p v is calculated as:
P p v = V × I
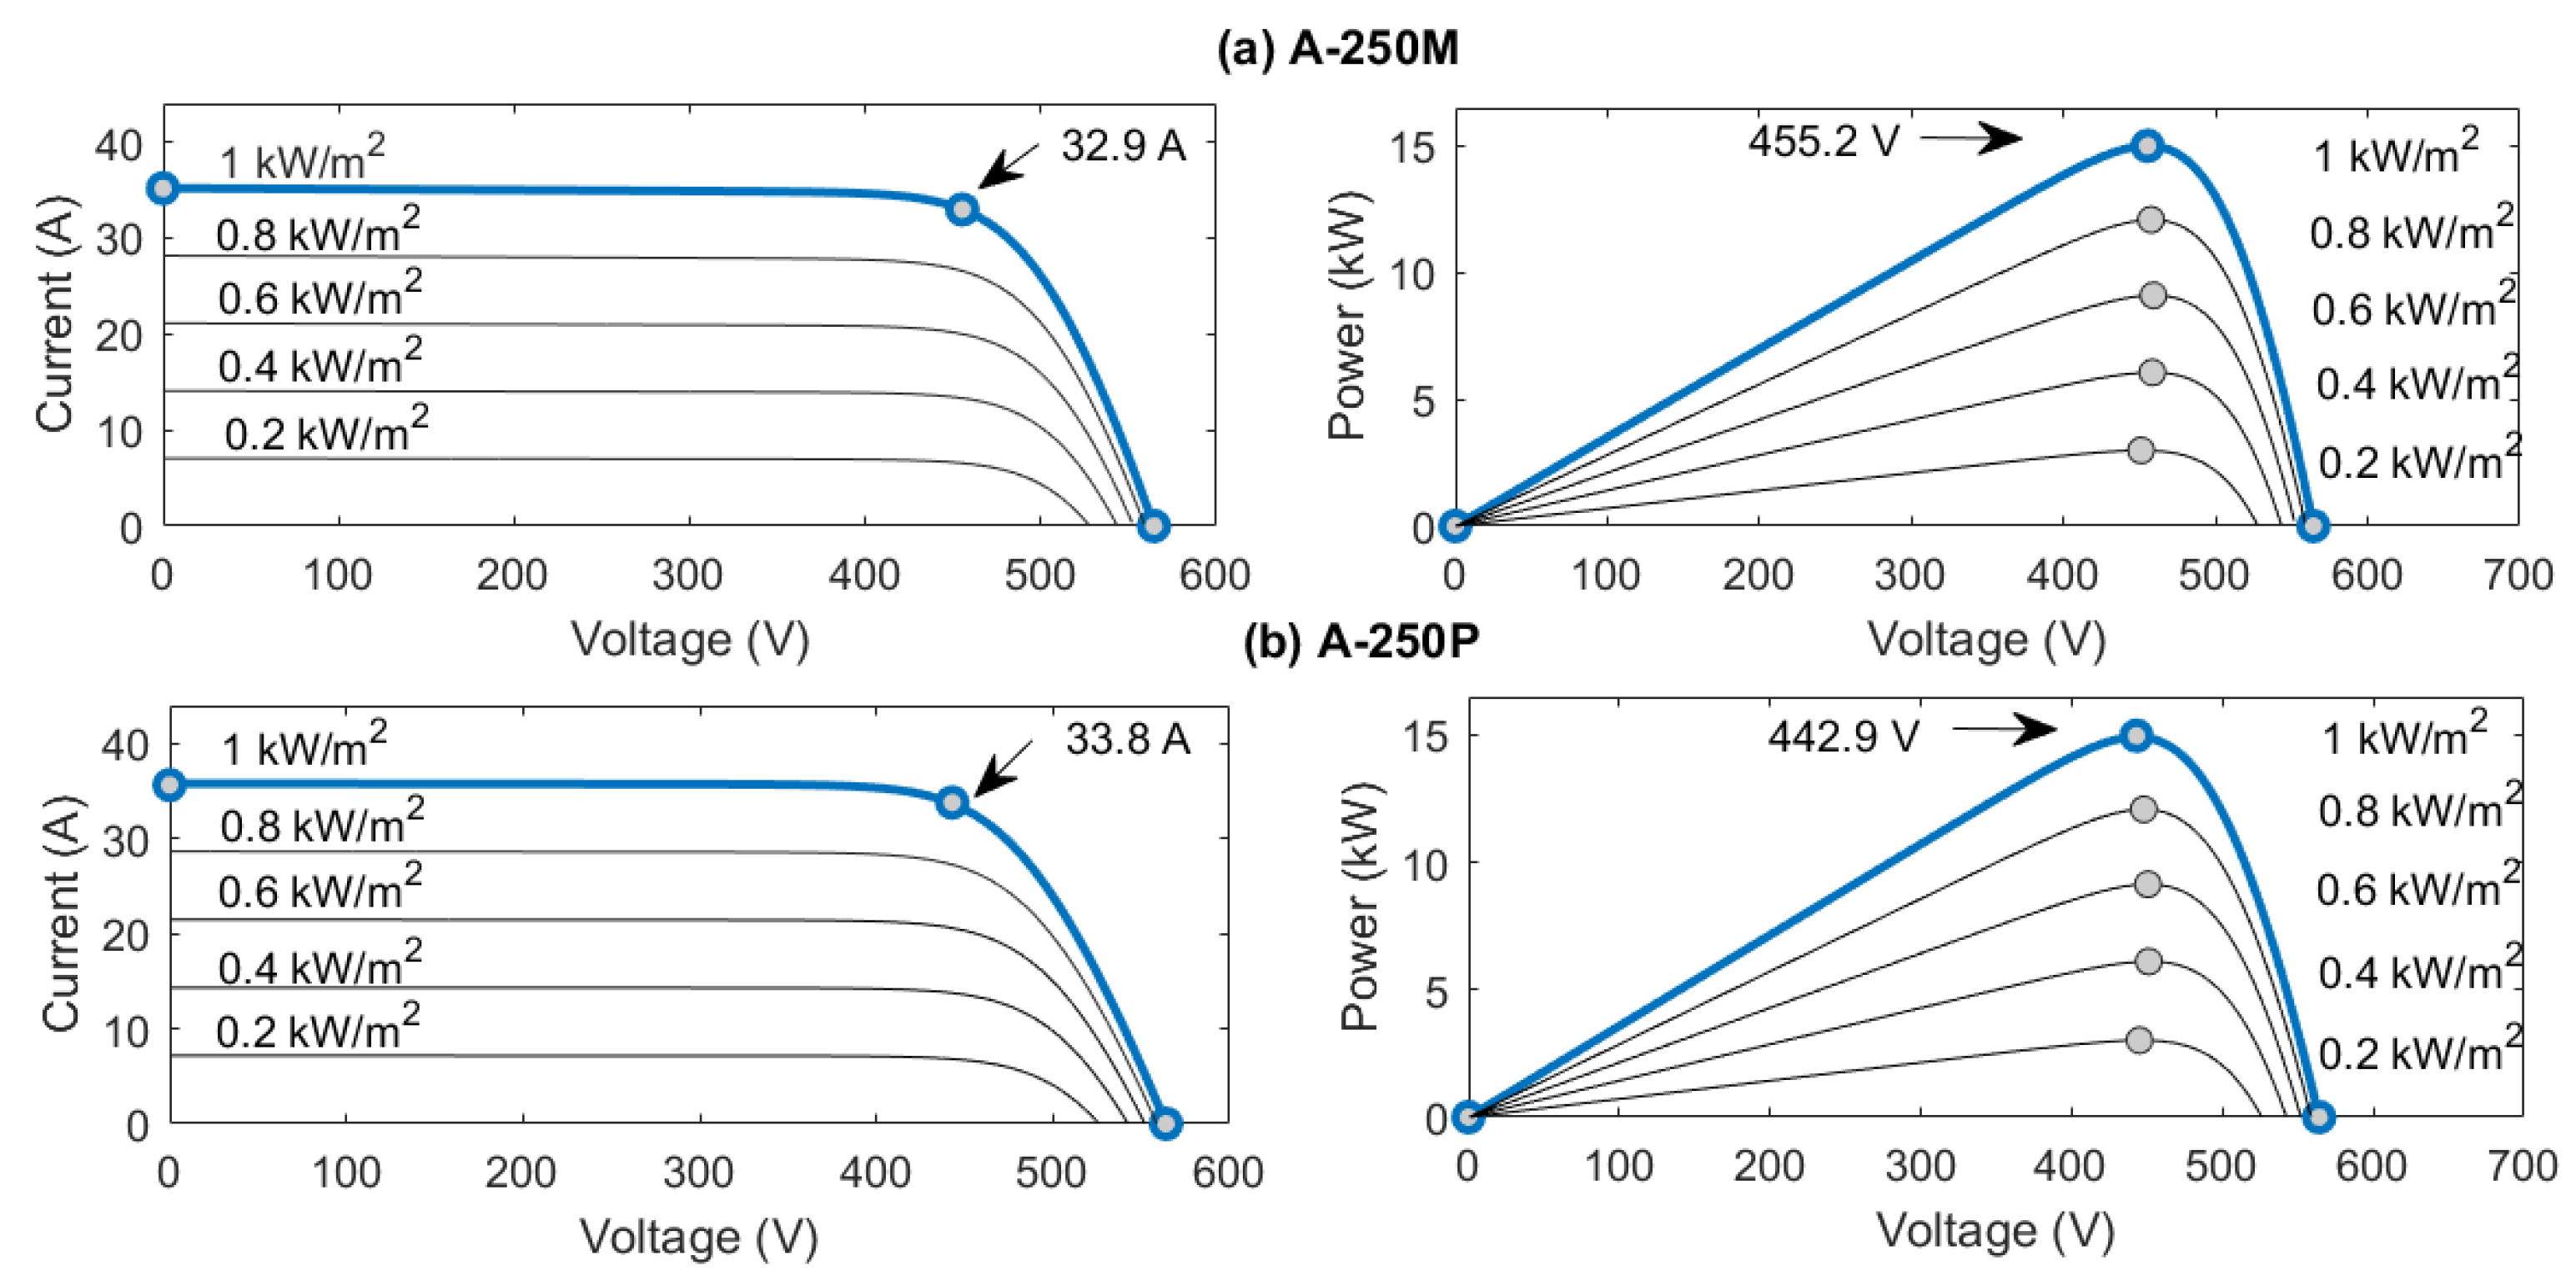
This study uses predefined photovoltaic modules from the National Renewable Energy Laboratory (NREL) system advisory model. This model simulates the I-V and P-V characteristics of a photovoltaic system under varying irradiance and temperature conditions. It is suitable for integration with MPPT algorithms and DC/DC converters in microgrid applications. Specifically, simulations were carried out using the Atersa A-250M model (Valencia, Spain), with a nominal power of 15 kWp, based on a 15 × 4 (series-parallel) configuration, and the A-250P model with the same characteristics [30,31]. Below in Figure 4 the PV power produced P = I V and the characteristic curves V-I are presented:
In Figure 4a, the current and voltage of the A-250M model can be observed under different solar irradiance conditions. A maximum current of 32.9 A and an operating voltage of around 455.2 V at its maximum irradiance are highlighted. Similarly, the A-250P model obtains a maximum current of 33.8A and an operating voltage of 442.9 V (See Figure 4b). Unlike the previous model, this one operates at a lower voltage range but with a higher current. Both systems operate at a nominal power of 15 kW.

3.3. Vanadium Redox Flow Battery

VRFBs operate by circulating liquid electrolytes containing different oxidation states of vanadium V 2 + and V 3 + on the negative side and V O 2 + and V O 2 + on the positive side, which react in electrochemical cells separated by an ion-conducting membrane (See Figure 5). During charging, an external source supplies energy that induces the oxidation of V O 2 + to V O 2 + and the reduction of V 3 + to V 2 + , storing chemical energy; while during discharge, the process is reversed, generating useful electrical current. The system includes pumps that drive electrolytes from external tanks to the cells, and an inverter that regulates the flow of power between the battery and the grid or load. This procedure efficiently manages multiple charge and discharge cycles with a response time in milliseconds, offering a constant power output without degradation. In addition to allowing a 100% depth of discharge (DoD) without affecting its lifespan, which allows for optimizing the overall efficiency of its storage capacity [32]. The state of charge S o C v r is determined by the relative concentration of active ions in each tank, according to Equation (7):
S o C v r = [ V O 2 + ] T [ V O 2 + ] T + [ V O 2 + ] T = [ V 2 + ] T [ V 2 + ] T + [ V 3 + ] T
The S o C v r is calculated by the voltage generated V v r through the operation of the positive and negative cathode ions, where their state exchange allows the battery to be charged or discharged [33,34].
The open circuit output power of the VRFB P o c v can be calculated using the following Equation (8):
P o c v = N c × V o c × I s
P o c v represents the charging power and the discharge power. N c is the number of cells per string, and V o c is the open circuit voltage [34,35]. Similarly, the string power P v r can be calculated as follows:
P v r = N c × V s × I s
where V s and I s is the voltage and current of the string. Consequently, the voltage efficiency of the VRFB string can be calculated by integrating the power over time during charging and discharging. The following equations define the voltage efficiency during charging and discharging, respectively:
η V c h a r g e = t 1 t 2 P o c v c h a r g e d t t 1 t 2 P v r c h a r g e d t
η V d i s c h a r g e = t 1 t 2 P v r d i s c h a r g e d t t 1 t 2 P o c v d i s c h a r g e d t
where η V c h a r g e is the voltage efficiency during charging, η V d i s c h a r g e is the voltage efficiency during discharging, t 1 and t 2 are the start and end time instants, respectively.

3.4. Automatic Control Algorithm

3.4.1. Predictive Analytics

The daily energy estimate based on the demand forecast can be calculated using the forecast reference power P r e f ˜ as the difference between the PV generation P p v and the demand forecast P l d ˜ according to the following Equation (12):
P r e f ˜ = P p v P l d ˜
Consequently, the charge and discharge power for the reference signal to the required VRFB storage system is calculated as follows:
P c v r ˜ = P r e f ˜ , If P r e f ˜ 0 P d v r ˜ = P r e f ˜ If P r e f ˜ < 0
where P c v r ˜ is the expected charging power and P d v r ˜ is the expected discharging power. Then the expected charge and discharge energy is calculated as the integral between two time instants t 1 and t 2 as indicated in the following Equation (14):
E c v r ˜ = t 1 t 2 P c v r ˜ d t E d v r ˜ = t 1 t 2 P d v r ˜ d t
Then the total energy expected E v r ˜ to be stored in the VRFB is determined as:
E v r ˜ = η c × E c v r ˜ 1 η d × E d v r ˜
where η c is VRFB charging efficiency and η d is VRFB discharging efficiency, respectively. Finally, the calculation of S o C v r ˜ the state of charge prediction (%) is established according to the following Equation (16):
S o C v r ˜ = S o C v r ˜ ( t 1 ) + E m a x E v r ˜ × 100 %
where S o C v r ˜ ( t 1 ) is the state of charge at the previous time instant, E m a x is the maximum storage capacity of VRFB (kWh), and E v r ˜ is the total energy expected.

3.4.2. Real-Time Processing

Based on the context of the previous section, the adjustment power is established to optimize the load state of the VRFBs and objectively achieve generation balance with demand forecasting. Where the adjustment factor in the correction of the reference power P a d j can be calculated as defined in the following Equation (17):
P a d j = 0.1 · P l d If S o C v r ˜ S o C v r ε Charging power adjustment P a d j = 0.1 · P l d If S o C v r ˜ < S o C v r + ε Discharging power adjustment
where the adjustment power is updated based on the next event of the state of charge prediction S o C v r ˜ , ε is the confidence interval coefficient within the real-time measured value.
The SoC calculation for VRFB is determined by the energy stored during charging E c v r and discharging E d v r . The reference power P r e f and is S o C v r calculated from Equations (18) and (21) as follows:
P r e f = P p v P l d + P a d j P c v r = P r e f , If P r e f 0 P d v r = P r e f If P r e f < 0
E c v r = t 1 t 2 P c v r d t P r e f 0 E d v r = t 1 t 2 P d v r d t P r e f < 0
E v r = η c × E c v r 1 η d × E d v r
where η c is VRFB charging efficiency and η d is VRFB discharging efficiency, respectively. To calculate the SoC (%) of the VRFB, it is determined as follows:
S o C v r = S o C v r ( t 1 ) + E m a x E v r × 100 %
The VRFB state of charge ( S o C v r ) restriction is limited in its maximum S o C m a x and minimum S o C m i n values allowed according to the following Equation (22):
P v r = P r e f S o C m i n S o C v r S o C m a x P v r = 0 S o C m a x < S o C v r < S o C m i n
When the reference power directed to the VRFB surpasses the upper limit or drops below the lower bound, its value is reset to zero, i.e., P v r = 0 .
Figure 6 summarizes the automatic control algorithm according to the explanation of the previous equations, where its objective is to maintain the SoC of a storage system (VRFB) within safe limits by integrating real-time data and energy forecasts. This approach combines forecasting with real-time corrections to ensure operational stability in distributed energy systems.

4. Case Study

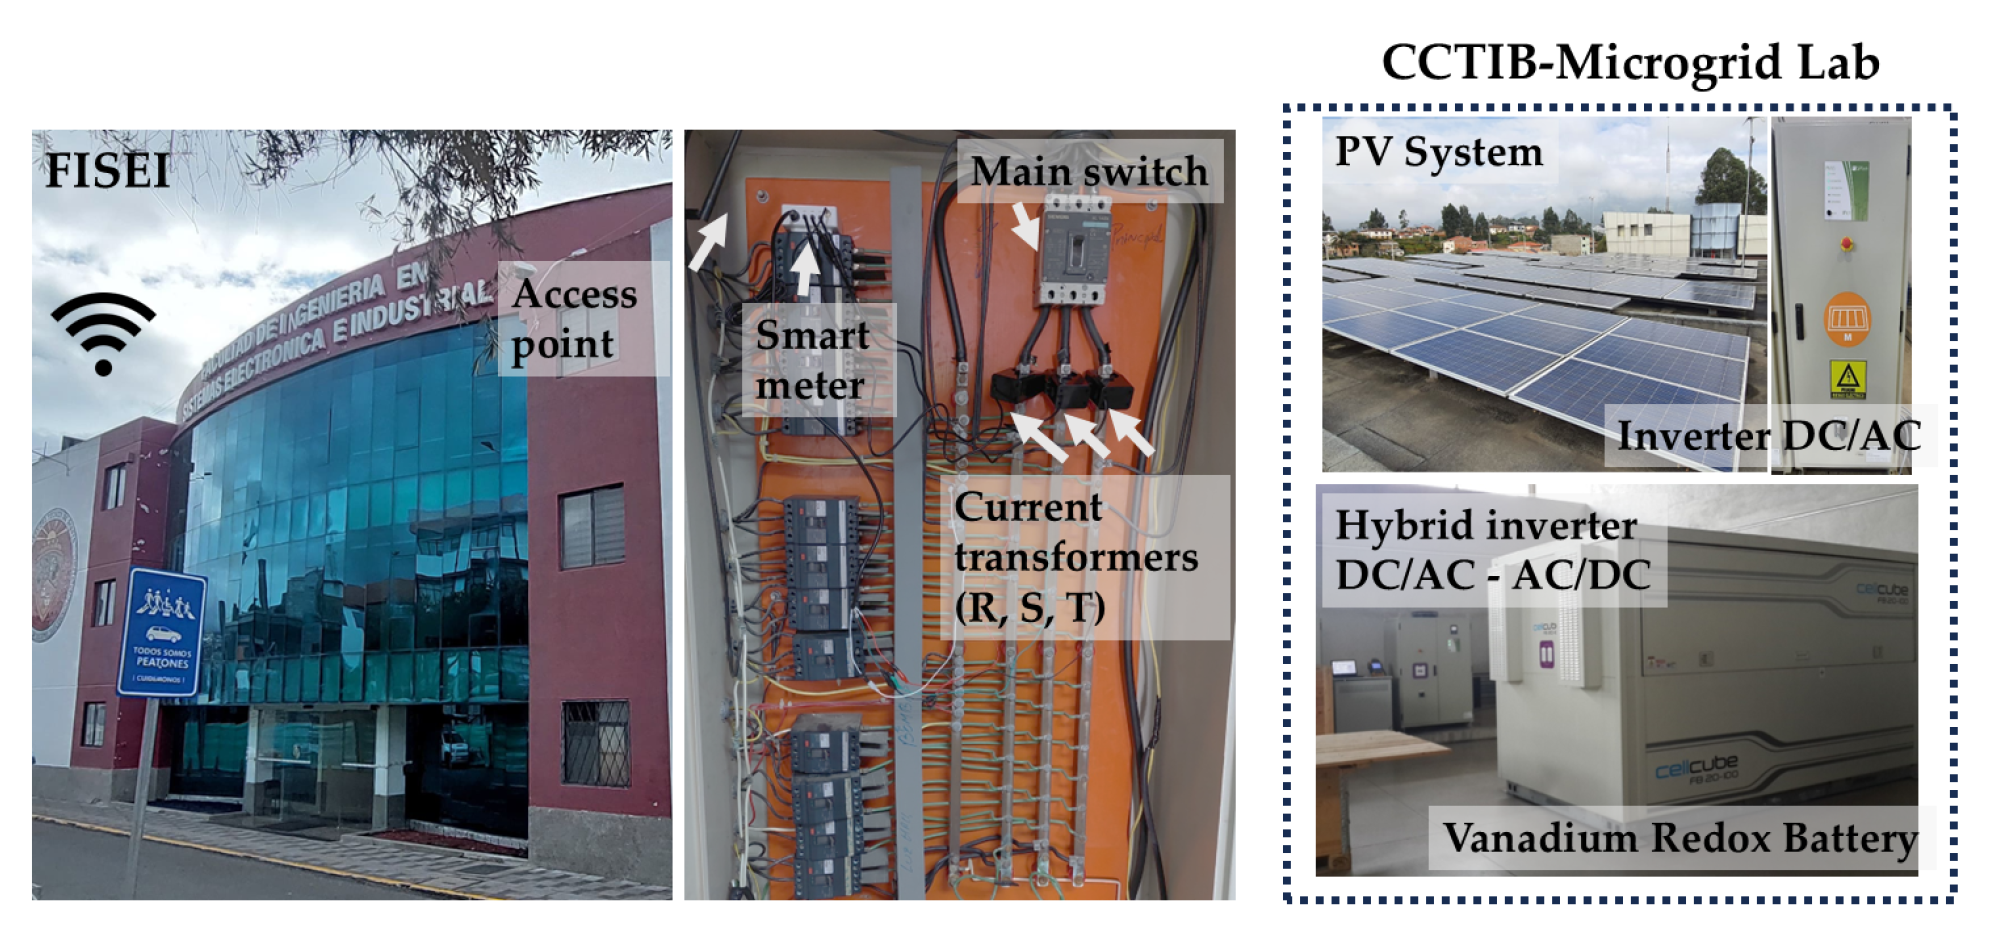
The data to carry out this study were used from the University of Cuenca’s Microgrid Laboratory and the experimentation of predictive data with smart meters from the Faculty of Systems, Electronics and Industrial Engineering of the Technical University of Ambato (See Figure 7) [31]. The photovoltaic systems consist of units of 15 kW. The VRFB storage system consists of 2 clusters on a 48 Vdc bus bar. This system is connected to the electrical grid via a bidirectional DC/AC converter with a storage capacity of up to 100 kWh and a reference power of up to 20 kW. The parameters of the microgrid components and equipment are detailed in Table 2 below.

5. Results and Discussion

5.1. Data Acquisition

The smart meter data-logging is presented in Figure 8a. A seven-day weekly record was obtained at a frequency of every minute. The horizontal axis represents time in minutes, and the vertical axis indicates power demand, which varies between 5 kW and 20 kW. This variable demonstrates a daily cyclical pattern, with consumption peaks during active hours and drops during the night. This behavior reflects the typical profile of an institutional facility, where energy use is closely linked to academic activity. Forecasting this temporal behavior allows for observing rapid fluctuations and detecting high-demand events that could influence energy planning and storage system management.
Furthermore, Figure 8b represents the power generated by the PV system, clearly showing its dependence on solar radiation. Generation begins between 6:00 a.m. and 6:00 p.m. and peaks around noon. The maximum power recorded exceeds 35 kW, indicating significant installed capacity to cover demand. This profile is essential for assessing the generation-demand balance and designing storage or load management strategies that take advantage of daytime surpluses. It also allows for identifying cloudy days or seasonal variations that could affect system efficiency. Unlike the previous graph, the generation also includes non-working days. Finally, the total energy generated and consumed per day is compared (Figure 8c), expressed in kilowatt-hours (kWh). Two bars are presented for each day of the week: one blue for generation and the other gray for consumption. It can be seen that on some days, generation is greater than consumption, suggesting the possibility of storing surpluses or exporting them to the grid. Conversely, on other days, consumption is greater than generation, implying the need to resort to storage systems. This visualization allows for a general assessment of the daily energy balance.

5.2. Evaluation of Predictive Models

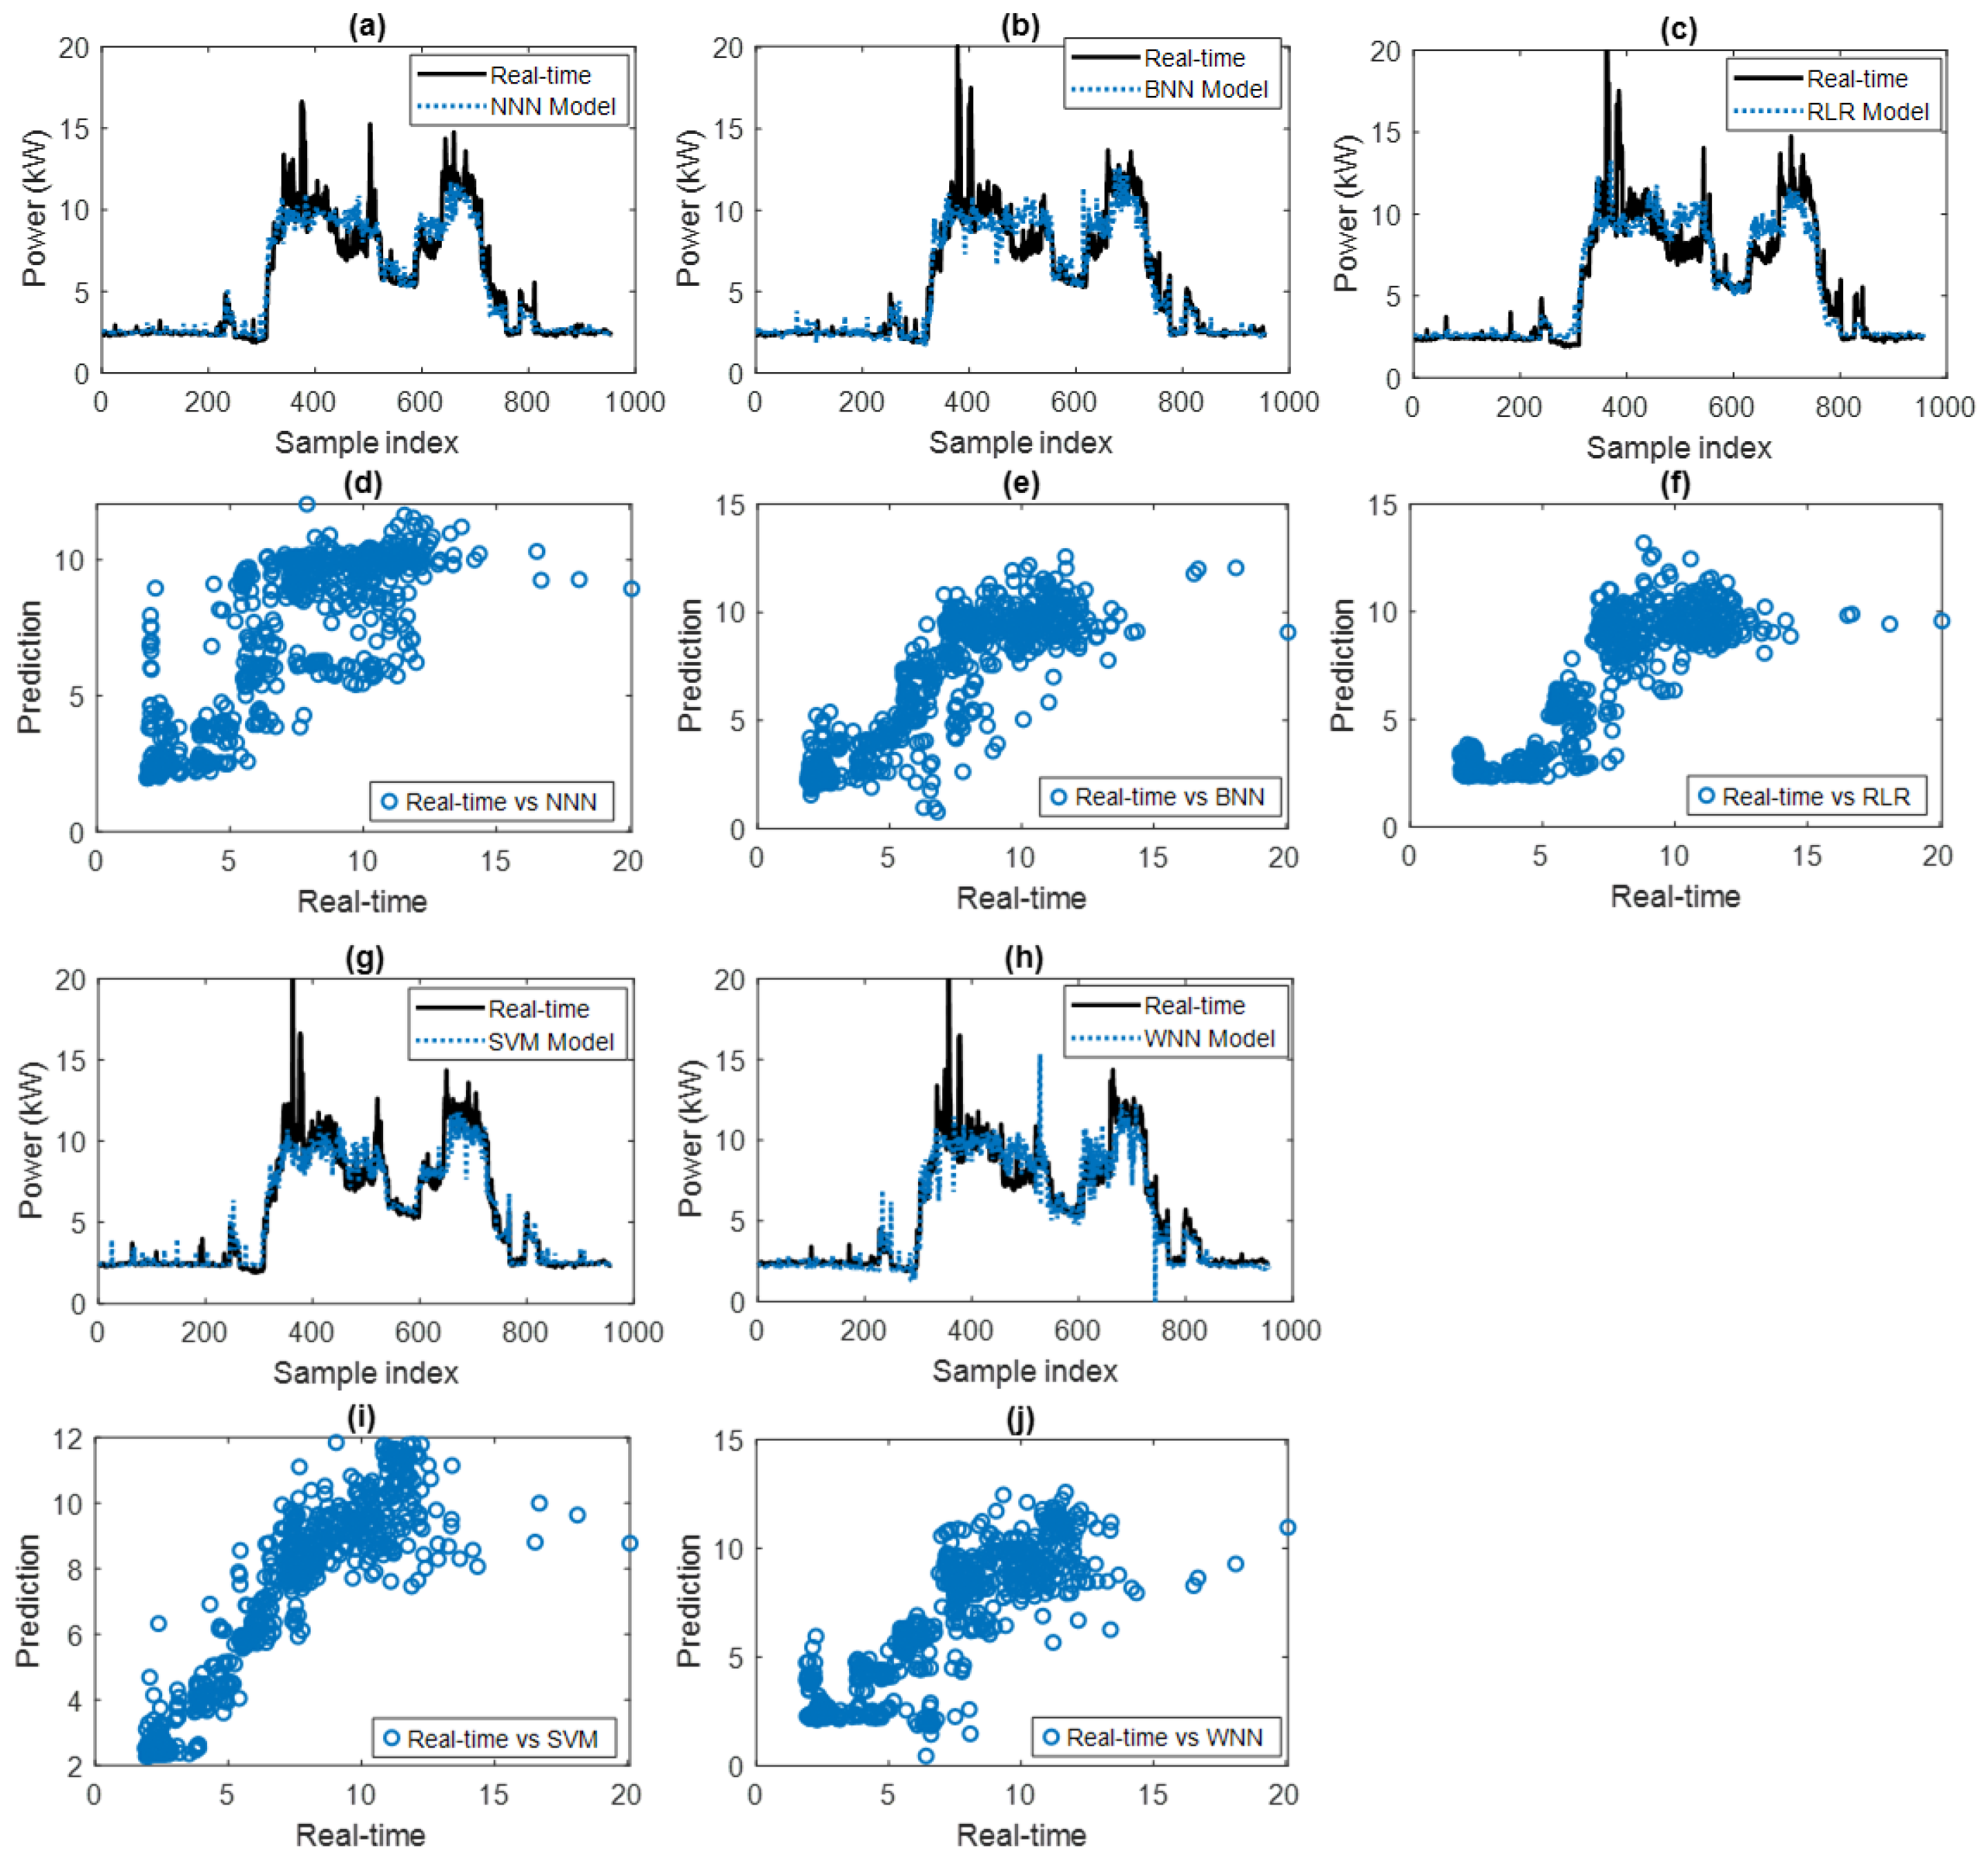
Demand prediction models were evaluated based on neural networks with supervised learning approaches such as Narrow Neural Network (NNN), Bilayered Neural Network (BNN), Robust Linear Regression (RLR), Support Vector Machine (SVM), and Wide Neural Network (WNN). Figure 9a–j show the evaluation results for training on four previous days and prediction on the fifth day. The results in the figure show a positive evaluation on the analyzed dataset: 70% for training and 30% for validation. This allows a visual observation of the degree of fit, peak tracking ability, and response to abrupt transitions. For this analysis, the same input data were considered for the different models in order to evaluate them under the same criteria. This temporal approach is especially relevant in energy systems, where daily patterns can present similarities but also stochastic variations. In addition, the relationship between real-time measurement and prediction is presented through the scatter chart of each of the models to reference their correspondence values. Consequently, the proximity of the points to the diagonal line indicates a high correspondence between prediction and actual values.

5.3. Results Evaluation Indices

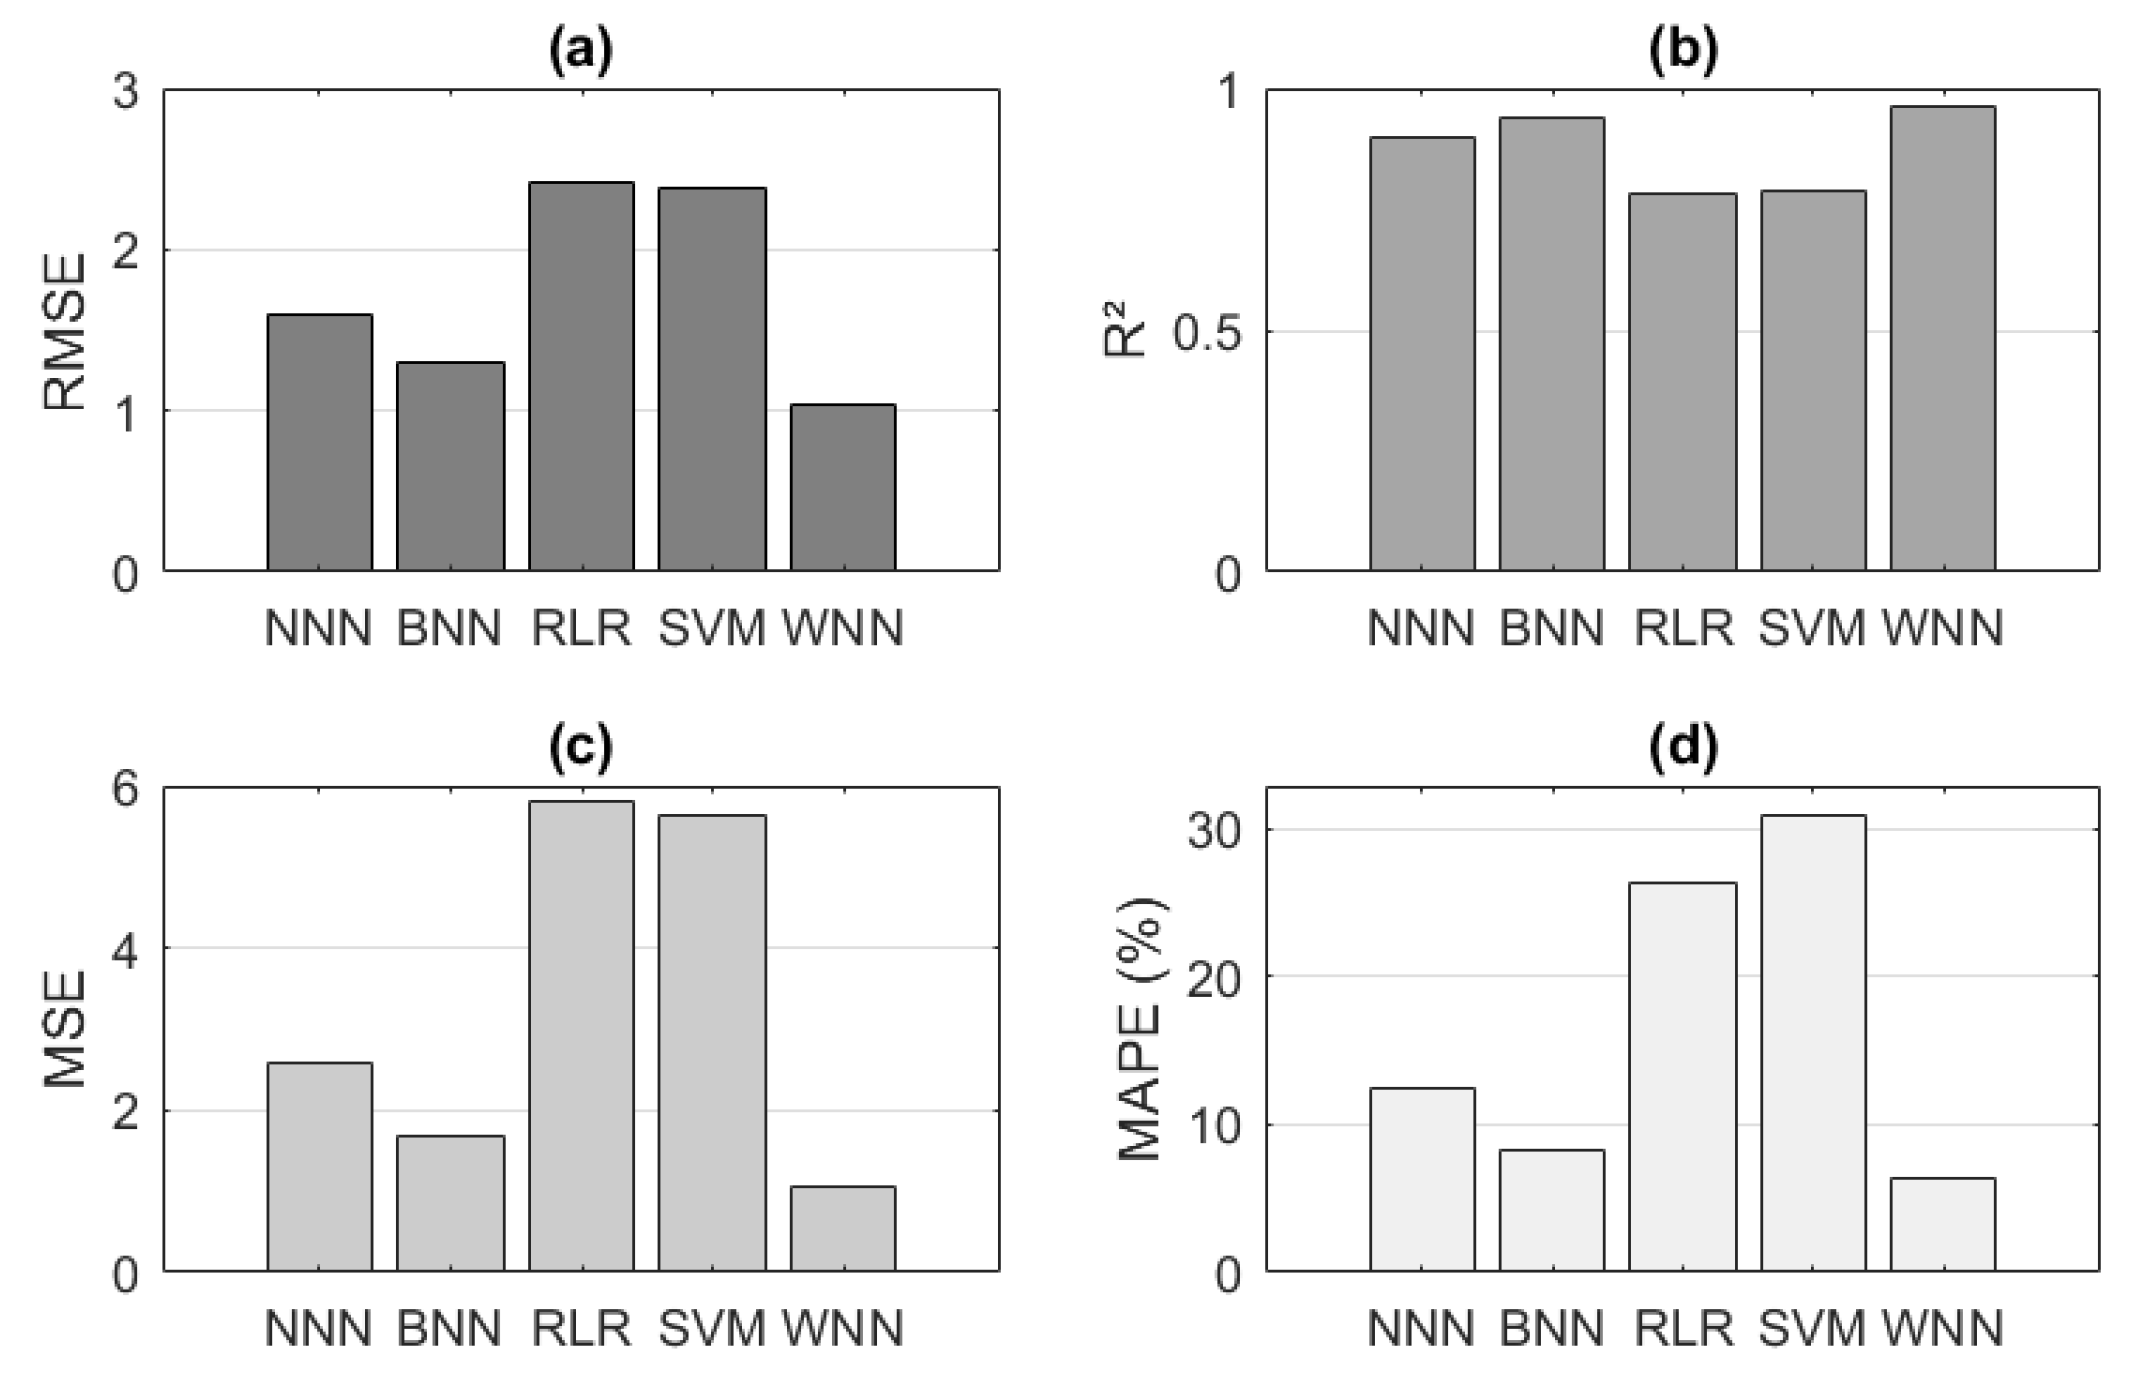
In this section, the results of the previous section are evaluated based on the Root Mean Squared Error (RMSE), R-squared ( R 2 ), Mean Squared Error (MSE), and Mean Absolute Percentage Error (MAPE) indices of the learning models and neural networks NNN, BNN, RLR, SVM, and WNN. These indicators allow quantifying the accuracy, fit, and efficiency of supervised learning models applied to energy demand time series. Table 3 details the definitions of each of these indices and the evaluation criteria for predictive demand models. These results are detailed in Figure 10a–d, where it can be observed that the WNN model is the one that best fits the expected results with values of RMSE = 1.0310, R 2 = 0.96, MSE = 1.0630, and MAPE (%) = 6.3. This model uses a wide network architecture (more neurons per layer) rather than a deep one, making it ideal for systems requiring real-time responses. Furthermore, the ReLU activation function improves training speed and generalization capabilities, facilitating the learning of nonlinear patterns in demand time series. This stands out notably compared to the other models. Similarly, the second model that represents good results in the validation phase is BNN with values of RMSE = 1.2979, R 2 = 0.94, MSE = 1.6844, and MAPE (%) = 8.3. Both systems use a feedforward architecture and a ReLU activation function, which demonstrates their solid base in the application of predictive demand models. On the other hand, the RLR and SVM models represent higher RMSE values of 2.4085 and 2.3742, respectively, which rule out their direct application as optimal methods in demand prediction for this study. The RLR model has demonstrated lower accuracy in time series with high demand variability and making it difficult to capture nonlinear relationships. This is also true of the SVM model, which requires specific parameter tuning. However, these models directly learn the relationship between input and output variables without modeling the joint distribution of the demand data. In addition, these models also have MAPE (%) values of 26.3 and 30.9, which demonstrates their low adaptability in environments with daily demand variability. Although these models use Supervised Regression with adaptive linearity, they have not demonstrated their effectiveness as adequate predictive models.
Based on the results obtained in the comparative evaluation of predictive models, the WNN is identified as the most suitable model for energy demand estimation. Its superior performance in the RMSE, R2, MSE, and MAPE accuracy indices demonstrates high adjustability, peak tracking, and response to abrupt transitions, positioning it as the optimal architecture for demand forecasting applications.
Finally, optimal energy management is analyzed, based on the prediction of the SoC of the VRFB-based storage system. This stage integrates demand estimation with real-time control algorithms, with the goal of maximizing operational efficiency, ensuring system stability, and maintaining the SoC within safe ranges, in accordance with the criteria defined in the automatic control architecture in Section 3.4.

5.4. Experimental Evaluation of VRFB

In this section, performance tests are performed on the FB 20-100 VRFB model (Gildemeister, Australia) with an output power of up to 20 kW and a robust storage capacity of 100 kWh. During this process, 5000 L of liquid vanadium circulate through a set of 12 cell modules, providing power to a 48 Vdc bus [36]. The results are presented in Table 4, which evaluates variable demand profiles from 5 kW to 20 kW for charging and discharging the batteries. The time required to cover the assigned power in each case has been analyzed. The DC during the charging processes reached values from 82.57 A to 297.89 A instantly, which demonstrates its robustness as energy storage; likewise, during the discharge phase, values from 104.63 A to 480.33 A were observed. On the other hand, the voltage levels in clusters A and B are recorded based on the 48 Vdc bar, which implies its operating range above 49.35 Vdc without affecting the performance in DC. In addition, energy values have been recorded for charging processes around 120 kWh and higher than 79.28 kWh for discharge processes, which ratifies its efficiency around 80%.
Additionally, Figure 11 presents the evaluation of the previously performed tests. The power values assigned as 5 kW, 10 kW, 15 kW, and 20 kW for charging and discharging the VRFBs are observed. The SoC remains within safe operating ranges (5–95%), indicating adequate storage management without overcharging or deep discharging. Furthermore, the SoC shows a consistent response with the power profiles, validating the synchronization between demand and storage capacity. Furthermore, the current values for each cluster can range above 200 A. This current distribution among the clusters suggests balanced module management, without localized overload. Similarly, the voltage values are shown as a function of the state of charge on the 48 Vdc of each cluster (See Figure 11b). The SoC estimation is performed using a voltage-based model, which relates the DC terminal voltage to the battery charge level. Each cluster in the system presents an experimentally obtained voltage-SoC characteristic curve, which allows the SoC to be inferred from the voltage measurement. The defined operating range is from 44 V to 62 V, corresponding to a SoC between 5% and 95%, which guarantees a safe operation preset for experimental evaluation. Each cluster exhibits slight variations in its voltage-to-SoC curve due to differences in internal resistance, effective capacitance, and thermal conditions. Therefore, the model includes specific adjustments for each unit, allowing for a more accurate and reliable estimate based on this practical estimation method. Due to its simplicity and low computational cost, this method is efficiently integrated into predictive control architectures, allowing dynamic adjustments in the energy management of microgrids with VRFB. Finally, in Figure 11c, the efficiency values are calculated based on the charge and discharge time at each assigned reference power step. Proving to be optimal for high-power charging processes and slow discharges at different values. Furthermore, in most cases, its efficiency is above 80%. These values confirm that the system is viable for medium-power applications, with competitive performance in real-world scenarios.

5.5. Energy Analysis

Reliable demand prediction underpins optimal energy dispatch strategies in smart grids, especially in distributed systems with integrated renewable sources and storage, such as those analyzed in this study. In this context, anticipating demand allows for optimal generation and storage dispatch scheduling, avoiding overloads or losses due to excess generation. Anticipating the load profile allows for dynamic adjustment of the energy storage system’s SoC to maximize its autonomy and efficiency.
Table 5 presents the calculated values for energy produced by PV generation and the energy requirement for demand. This study analyzes these values based on seven events corresponding to a week. It can be observed that during the first three days, an energy deficit is generated, which implies an energy cost from the grid. On the other hand, in the remaining days, energy production is higher, allowing 100% of demand to be covered. Consequently, in these scenarios, the prediction allows for active participation in the markets and an adjustment of surplus sales, improving the energy balance.
Based on these considerations, Figure 12 presents the energy management scenarios for the different days of the week, based on the demand forecast and the availability of PV generation. In this context, the model’s predictive capacity enables active participation in adjustment markets, as well as the sale of surpluses and dynamic demand response, generating additional economic value through the strategic use of the storage system when energy surpluses are detected. Energy distribution using VRFB is optimized based on the demand forecast, allowing for efficient weekly allocation under variable renewable generation conditions. Consequently, load response and distributed generation are effectively coordinated, ensuring stable and efficient system operation.
It should be noted that the system’s energy balance is conditioned by the nominal storage capacity, which in this study was set at 100 kWh. This limitation can restrict optimal operation in scenarios where photovoltaic generation produces surpluses greater than this capacity, preventing its full utilization. Energy production self-regulates based on the demand profile, allowing for efficient coverage of days with high consumption and low generation through the strategic use of the storage system. Similarly, during days of low consumption, surplus energy is stored until the capacity limit is reached, ensuring efficient and continuous energy management under variable generation conditions.
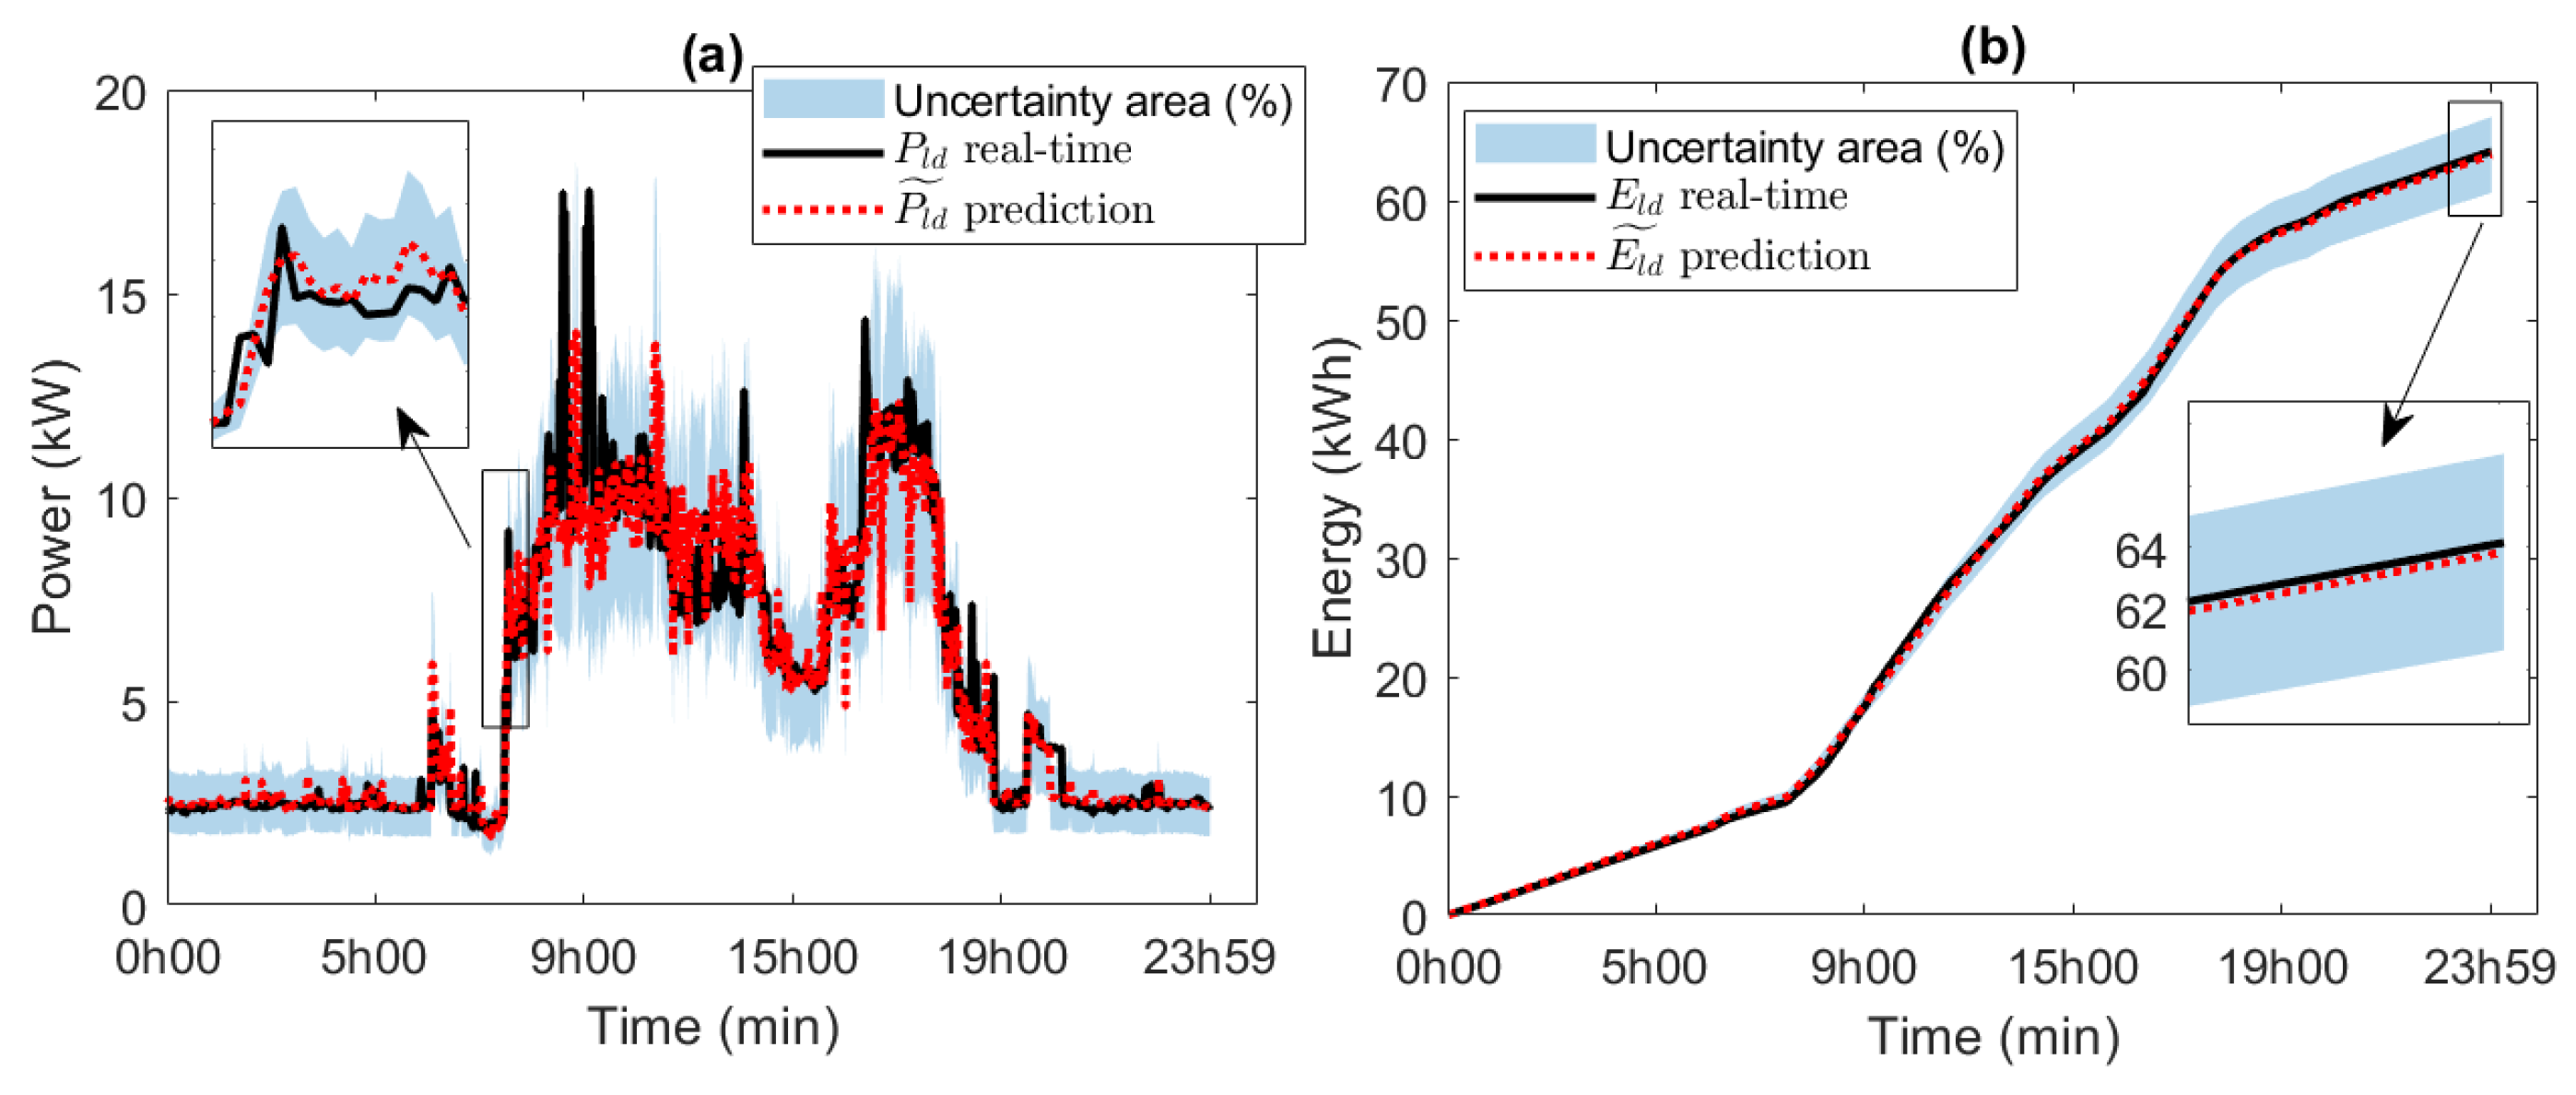
The evaluation of the power prediction P l d ˜ and energy prediction E l d ˜ results is presented in Figure 13a and Figure 13b, respectively. They detail the response of the WNN model after training with historical data and subsequent real-time validation. For analysis purposes, a 15% uncertainty margin was defined for instantaneous power, as well as a cumulative band for total energy. The results demonstrate high accuracy in estimating daily energy demand (64 kWh), with a consistent fit between predicted and observed values. The WNN model demonstrates optimal coupling capacity, ensuring robust and reliable real-time prediction, supporting energy planning and efficient operation of the storage system.
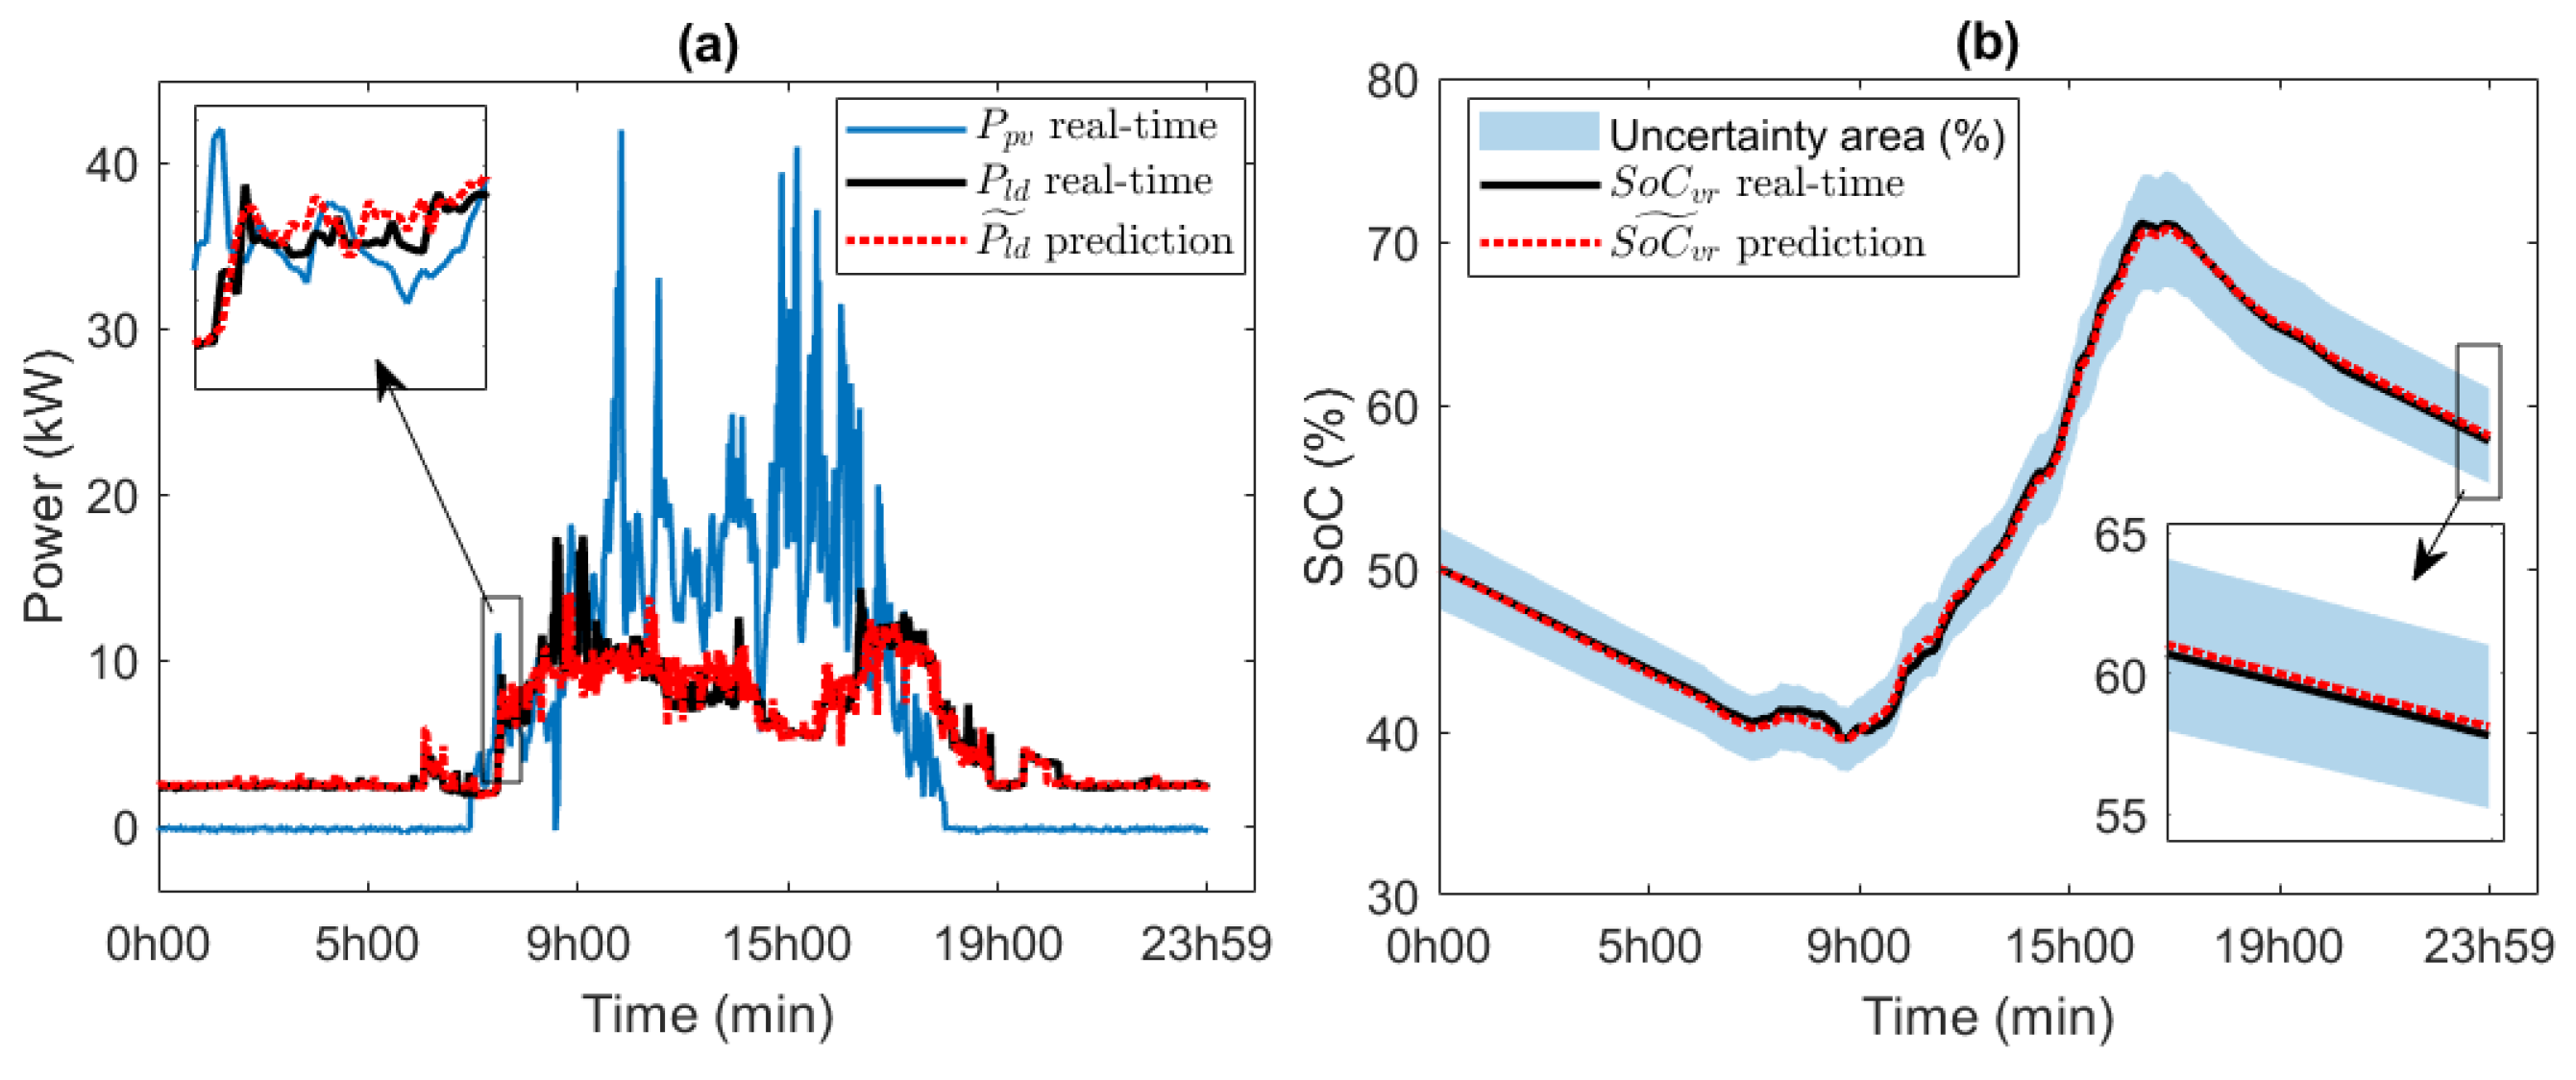
Figure 14a shows the validation of the predictive model in real-time operating environments, using a photovoltaic generation profile as a reference. In correlation with this dynamic, the SoC prediction is calculated throughout the day, as detailed in Figure 14b, considering the relationship between energy generation and demand. These results demonstrate that the model is highly accurate in estimating storage system behavior, which is essential for implementing coordinated energy dispatch. Furthermore, the incorporation of uncertainty bands in the SoC prediction provides transparency and reliability to the analysis, allowing the quantification of the acceptable margin of error in operational applications within the microgrid.

5.6. Sensitivity Analysis of System Power and Load

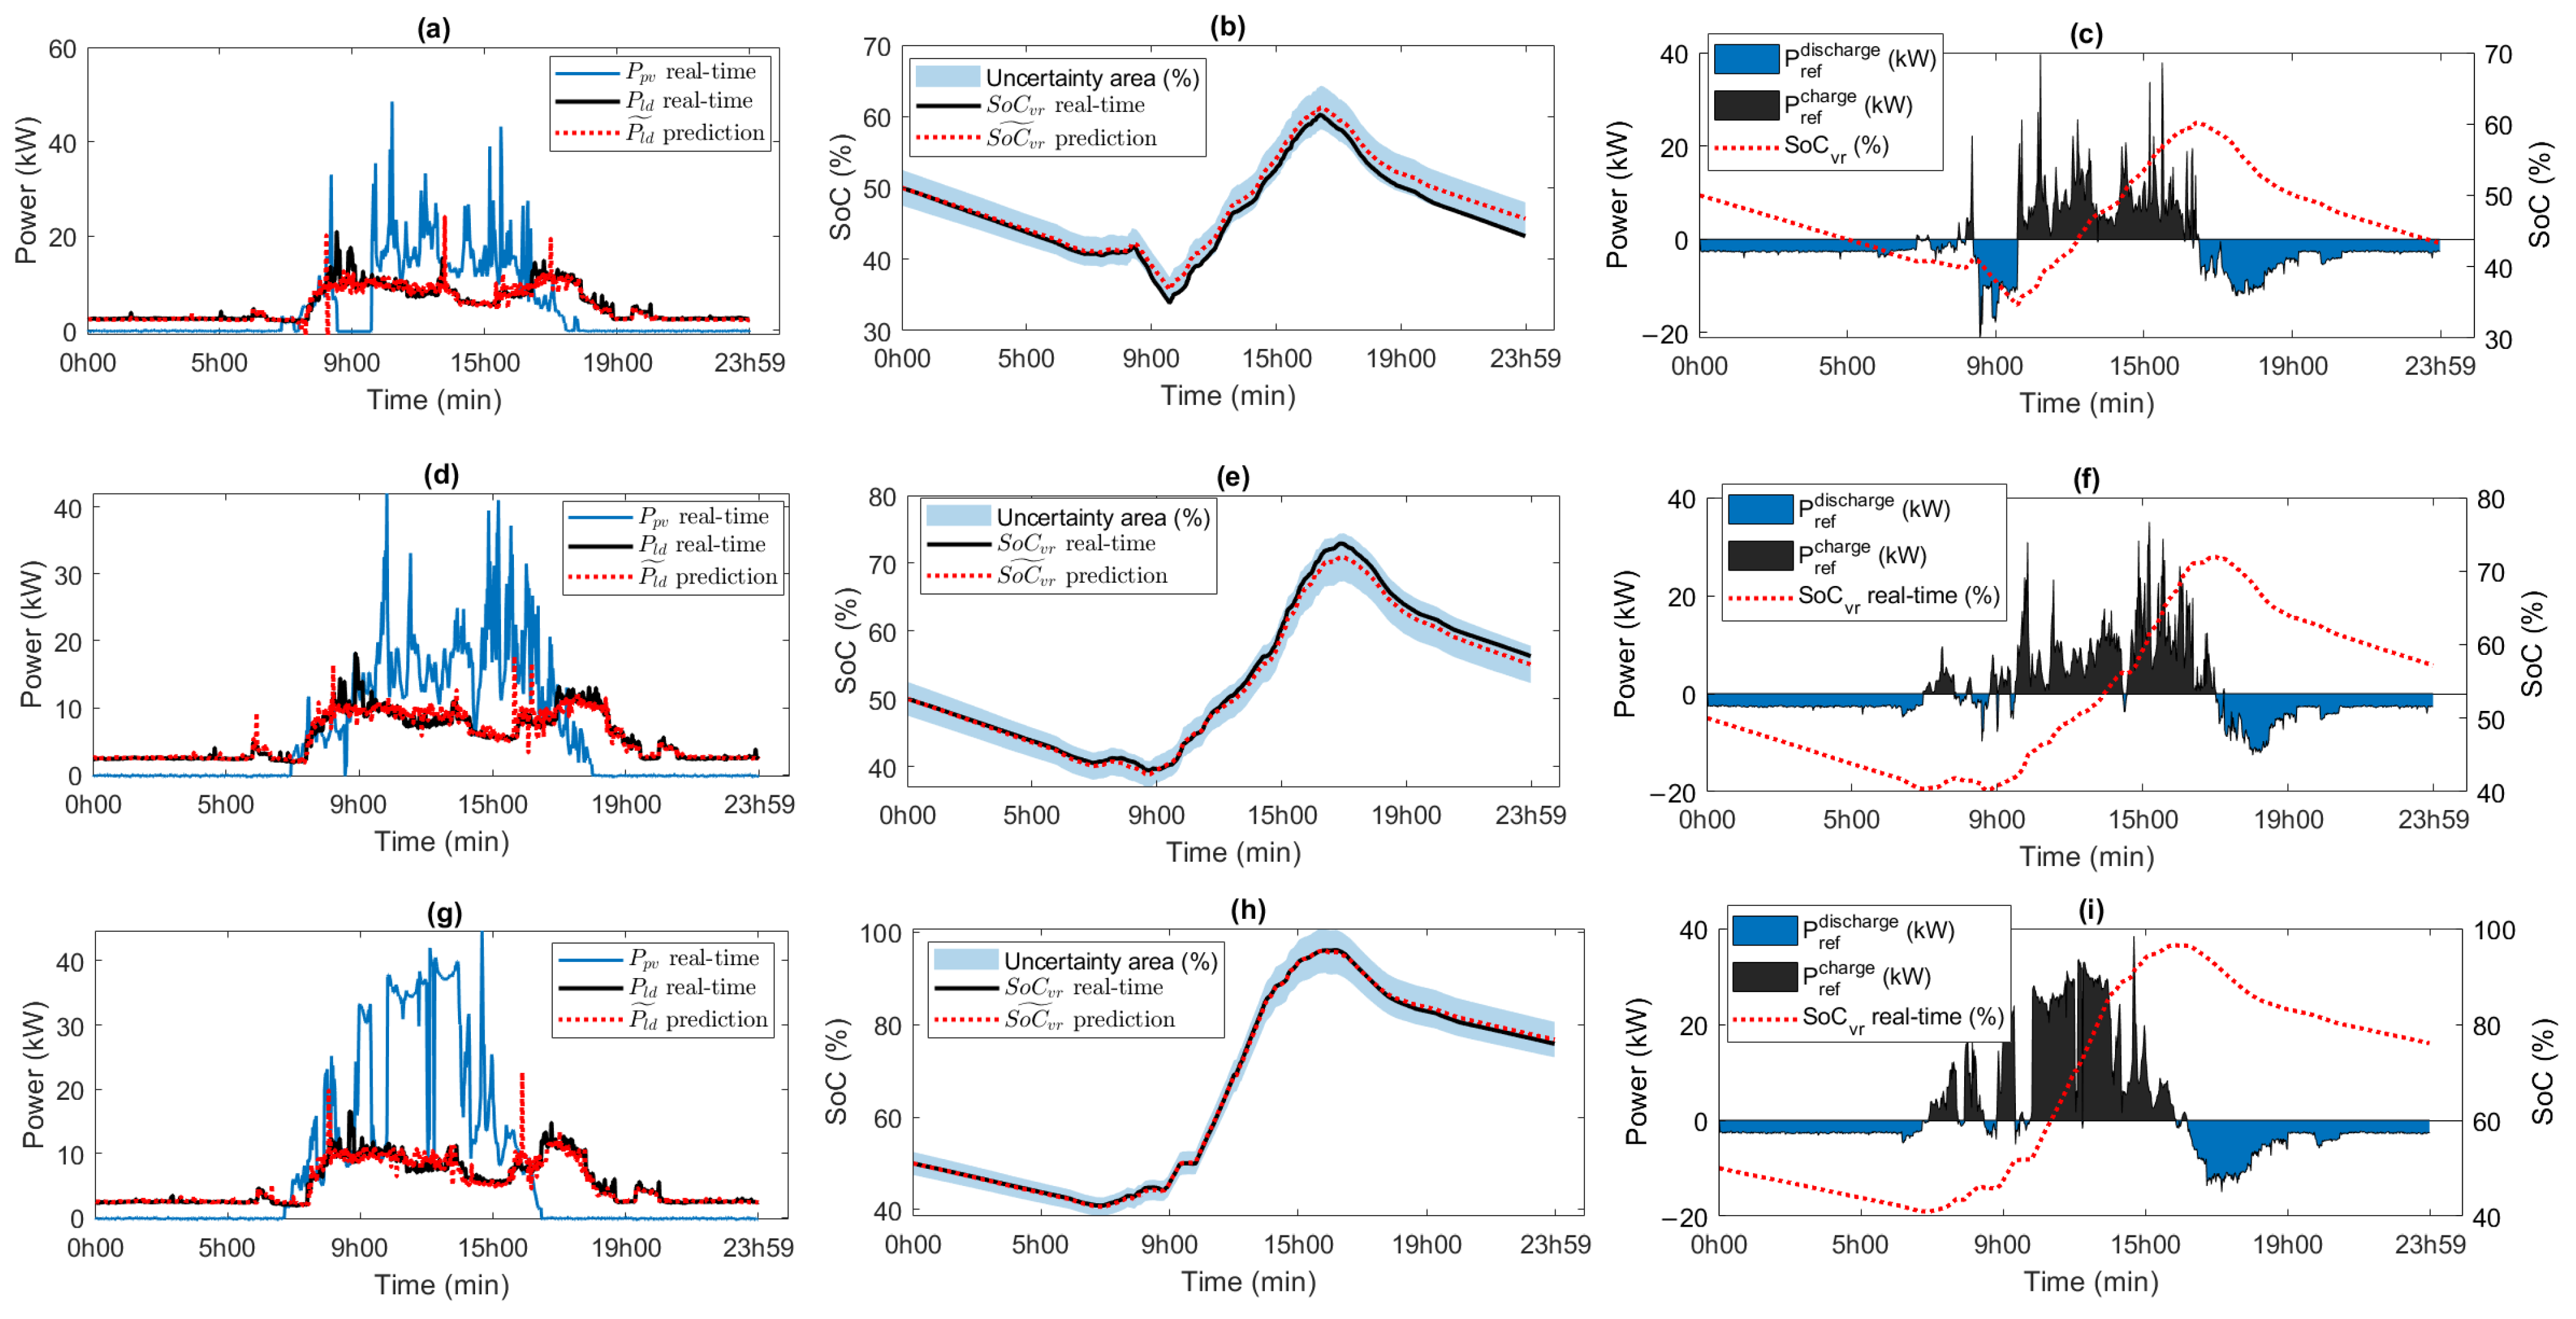
Finally, this study establishes a sensitivity analysis based on three representative photovoltaic generation scenarios: low, medium, and high energy production. Figure 15 illustrates these events, comparing the climatic conditions associated with each scenario and the response of the developed demand prediction model. Figure 15a illustrates a day with low photovoltaic (PV) generation, where energy production is insufficient to meet the recorded demand. Under these conditions, the VRFB state of charge ( S o C v r ), shown in Figure 15b for both prediction and real-time monitoring, remains within the defined operational limits, adjusting to approximately 50% relative to its initial value. Consequently, the reference power values assigned to the VRFB, as depicted in Figure 15c, enable energy dispatch during periods without PV generation.
Figure 15d illustrates a scenario of medium PV generation, where energy production partially meets the demand. In this case, the prediction model adjusts the SoC below the real-time observed value in Figure 15e, with an approximation close to 60% of the SoC. This deviation results in a 10% increase compared to the previously analyzed low-generation scenario. Furthermore, the reference power values for charging and discharging have been expanded, operating within a dynamic range from 40% to 70%, enabling greater flexibility in energy dispatch (See Figure 15f).
Under the same analytical framework, Figure 15g presents the scenario with the highest level of PV generation. As a result, the SoC expands its operational range, as shown in Figure 15h, maintaining excellent agreement between the predicted and real-time values. Although the final SoC approaches 80%, this condition enables early-stage adjustments, allowing for a more efficient operating range based on future demand events. Additionally, Figure 15i reveals that the reference charging power is significantly higher under these operating conditions, enabling energy storage within a range from 40% up to the predefined upper limit of 95%.
This comparison allows for the evaluation of system behavior under solar variability, simulating real-life operating conditions in the microgrid. High accuracy is also observed in the SoC estimation during the different events, validating the model’s ability to adapt to fluctuations in renewable generation. Furthermore, a predefined uncertainty band has been incorporated, allowing operational deviations to be anticipated within an acceptable range, thus strengthening system reliability in dynamic applications.
This prediction behavior optimally fits the demand profile with a real-time architecture, demonstrating the model’s robust adaptability under various generation conditions. This responsiveness helps ensure coordinated energy dispatch, optimizing the use of the VRFB storage system, and ensuring the operational balance of the microgrid.

6. Conclusions

Energy demand forecasting allows for the optimization of available energy resources and is essential for improving operational efficiency in microgrids on the demand side. This ability to anticipate energy demand allows for the design of sustainable dispatch strategies and promotes the integration of smart technologies into energy management. The most relevant points of this study are addressed below.
During the evaluation of different artificial neural networks, the Wide Neural Network model proved to be the most accurate and efficient in predicting real-time energy demand, achieving the best values in the evaluation indices (RMSE = 1.0310, R2 = 0.96, MSE = 1.0630, MAPE = 6.3%). Its feedforward architecture with ReLU activation function demonstrates a high capacity for adjustment and response to abrupt transitions in demand. Data preprocessing is a critical step in neural network training, as it ensures the proper adjustment of optimal values within the input data matrices. This process is essential to prevent errors during model parameter calibration and to enable efficient and accurate learning.
Experimental tests conducted on the FB 20-100 vanadium redox flow battery system demonstrate robust and efficient performance under variable demand profiles between 5 kW and 20 kW. The ability to maintain charge and discharge currents exceeding 200 A, along with an energy efficiency exceeding 80%, confirms its viability for medium-power applications. Consequently, these results position the VRFB system as a reliable solution for energy storage in smart microgrids, with competitive performance in real-world scenarios.
Validation of the predictive model in real-time operating environments in the microgrid, using different photovoltaic generation profiles as a reference, demonstrates high accuracy in estimating the storage system’s performance for the following day’s energy dispatch. The high accuracy demonstrated in estimating the performance of the storage system enables reliable anticipation of next-day energy dispatch. This predictive capability should be integrated into intelligent management platforms to optimize charge and discharge scheduling, reduce losses caused by generation-demand mismatches, and facilitate active participation in energy markets under dynamic response schemes.
The state of charge prediction, dynamically adjusted according to the relationship between generation and demand forecasts, enables the implementation of coordinated energy dispatch strategies with greater efficiency. It is recommended to update the forecast databases after generating the model. It is important to progressively gather feedback from previous days to improve the prediction model.
Future studies are expected to develop prediction models that integrate new renewable sources, along with alternative storage systems such as solid-state batteries, hydrogen, or supercapacitors. This expansion will complement the architecture of microgrids, improving their responsiveness to variations in generation and demand. The incorporation of these emerging technologies will diversify the energy profile and strengthen the system’s operational resilience, facilitating smart and sustainable management in distributed environments.

Author Contributions

D.B.: Visualization, Supervision, Software, Resources, Writing—Original Draft, Methodology, Project administration, Funding acquisition. P.A.-C.: Visualization, Supervision, Software, Resources, Writing—Original Draft, Writing—Review and Editing, Methodology. D.O.-C.: Methodology, Investigation, Funding acquisition, Formal analysis, Data curation, Conceptualization, Visualization. D.T.: Resources, Writing—Original Draft, Methodology, Investigation, Formal analysis, Data curation, Writing—Review and Editing, Validation. A.R.: Resources, Writing—Original Draft, Methodology, Investigation, Formal analysis, Data curation, Writing—Review and Editing, Validation, Project administration. All authors have read and agreed to the published version of the manuscript.

Funding

This research received no external funding.

Data Availability Statement

The original contributions presented in the study are included in the article, further inquiries can be directed to the corresponding author.

Acknowledgments

The authors thank the Dirección de Investigación y Desarrollo (DIDE) of the Universidad Técnica de Ambato for supporting this work through the research project PFISEI36, “Development of Computational Tools for the Management and Optimization of Smart Microgrids.” The authors thank the Faculty of Engineering, Universidad de Cuenca, Ecuador, for easing access to the microgrid laboratory’s facilities, allowing the use of its equipment, and authorizing its staff to provide the technical support necessary to carry out the experiments described in this article. The icons used in this document were developed by Freepik, monkik, Smashicons, and Pixel perfect, from www.flaticon.com (accessed on 18 June 2025).

Conflicts of Interest

The authors declare no conflicts of interest.

References

  1. Selvarasu, U.; Amirabadi, M.; Li, Y.; Crow, C.; Lehman, B. BESS Sizing for PV Power Smoothing. In Proceedings of the 2024 IEEE Energy Conversion Congress and Exposition (ECCE), Phoenix, AZ, USA, 20–24 October 2024; pp. 546–552. [Google Scholar] [CrossRef]
  2. Apribowo, C.H.B.; Sarjiya; Hadi, S.P.; Wijaya, F.D.; Setyonegoro, M.I.B. Optimal Allocation of Vanadium Redox Flow Battery Storage Systems With Integrated Variable Renewable Energy. In Proceedings of the 2023 15th International Conference on Information Technology and Electrical Engineering (ICITEE), Chiang Mai, Thailand, 26–27 October 2023; pp. 375–380. [Google Scholar] [CrossRef]
  3. Zhang, Q.; Gao, Y.; Mo, W.; Han, F.; Zhang, L. Load Forecasting Considering Demand Response Mechanism. In Proceedings of the 2023 Panda Forum on Power and Energy (PandaFPE), Chengdu, China, 27–30 April 2023; pp. 1172–1177. [Google Scholar] [CrossRef]
  4. Ruiz-Abellón, M.C.; Fernández-Jiménez, L.A.; Guillamón, A.; Gabaldón, A. Applications of Probabilistic Forecasting in Demand Response. Appl. Sci. 2024, 14, 9716. [Google Scholar] [CrossRef]
  5. Sharifhosseini, S.M.; Niknam, T.; Taabodi, M.H.; Aghajari, H.A.; Sheybani, E.; Javidi, G.; Pourbehzadi, M. Investigating Intelligent Forecasting and Optimization in Electrical Power Systems: A Comprehensive Review of Techniques and Applications. Energies 2024, 17, 5385. [Google Scholar] [CrossRef]
  6. Wang, X.; Wang, H.; Bhandari, B.; Cheng, L. AI-Empowered Methods for Smart Energy Consumption: A Review of Load Forecasting, Anomaly Detection and Demand Response. Int. J. Precis. Eng.-Manuf.-Green Technol. 2024, 11, 963–993. [Google Scholar] [CrossRef]
  7. Tushar, M.H.K.; Zeineddine, A.W.; Assi, C. Demand-Side Management by Regulating Charging and Discharging of the EV, ESS, and Utilizing Renewable Energy. IEEE Trans. Ind. Inform. 2018, 14, 117–126. [Google Scholar] [CrossRef]
  8. Alvarado-Barrios, L.; Rodríguez del Nozal, Á.; Boza Valerino, J.; García Vera, I.; Martínez-Ramos, J.L. Stochastic Unit Commitment in Microgrids: Influence of the Load Forecasting Error and the Availability of Energy Storage. Renew. Energy 2020, 146, 2060–2069. [Google Scholar] [CrossRef]
  9. Sharrma, S.; Prasad, A.; Pajany, M. A Scheduling System for an Energy Storage Device Using Photovoltaic and Demand Forecasting. In Proceedings of the 2021 2nd International Conference on Advances in Computing, Communication, Embedded and Secure Systems (ACCESS), Ernakulam, India, 2–4 September 2021; pp. 291–296. [Google Scholar] [CrossRef]
  10. Lyu, C.; Jia, Y.; Xu, Z. Tube-Based Model Predictive Control Approach for Real-Time Operation of Energy Storage System. In Proceedings of the 2020 International Conference on Smart Grids and Energy Systems (SGES), Perth, Australia, 23–26 November 2020; pp. 493–497. [Google Scholar] [CrossRef]
  11. Mary, N.; Dessaint, L.A. Robust Model Predictive Control of Battery Energy Storage with Neural Network Forecasting for Peak Shaving in University Campus. J. Build. Eng. 2025, 107, 112445. [Google Scholar] [CrossRef]
  12. Arévalo, P.; Benavides, D.; Aguado, J.A.; Jurado, F. Advanced wind/photovoltaic power smoothing using LSTM neural networks and machine learning. Soft Comput. 2025, 29, 5193–5211. [Google Scholar] [CrossRef]
  13. Kim, K.; Ko, D.; Jung, J.; Ryu, J.O.; Hur, K.J.; Kim, Y.J. Real-Time AI-Based Power Demand Forecasting for Peak Shaving and Consumption Reduction Using Vehicle-to-Grid and Reused Energy Storage Systems: A Case Study at a Business Center on Jeju Island. Appl. Sci. 2025, 15, 3050. [Google Scholar] [CrossRef]
  14. Wang, C.; Cheng, B.; He, X.; Xi, L.; Yang, N.; Zhao, Z.; Lai, C.S.; Lai, L.L. Integrated Underfrequency Load Shedding Strategy for Islanded Microgrids Integrating Multiclass Load-Related Factors. IEEE Trans. Smart Grid 2025, 1. [Google Scholar] [CrossRef]
  15. Sadeghi, S.; Jahangir, H.; Vatandoust, B.; Golkar, M.A.; Ahmadian, A.; Elkamel, A. Optimal Bidding Strategy of a Virtual Power Plant in Day-Ahead Energy and Frequency Regulation Markets: A Deep Learning-Based Approach. Int. J. Electr. Power Energy Syst. 2021, 127, 106646. [Google Scholar] [CrossRef]
  16. Abedi, S.; Kwon, S. Rolling-Horizon Optimization Integrated with Recurrent Neural Network-Driven Forecasting for Residential Battery Energy Storage Operations. Int. J. Electr. Power Energy Syst. 2023, 145, 108589. [Google Scholar] [CrossRef]
  17. Promasa, N.; Songkoh, E.; Phonkaphon, S.; Sirichunchuen, K.; Ketkaew, C.; Unahalekhaka, P. Optimization of Sizing of Battery Energy Storage System for Residential Households by Load Forecasting with Artificial Intelligence (AI): Case of EV Charging Installation. Energies 2025, 18, 1245. [Google Scholar] [CrossRef]
  18. Wang, C.; Wang, M.; Wang, A.; Zhang, X.; Zhang, J.; Ma, H.; Yang, N.; Zhao, Z.; Lai, C.S.; Lai, L.L. Multiagent deep reinforcement learning-based cooperative optimal operation with strong scalability for residential microgrid clusters. Energy 2025, 314, 134165. [Google Scholar] [CrossRef]
  19. Morsali, R.; Thirunavukkarasu, G.S.; Seyedmahmoudian, M.; Stojcevski, A.; Kowalczyk, R. A relaxed constrained decentralised demand side management system of a community-based residential microgrid with realistic appliance models. Appl. Energy 2020, 277, 115626. [Google Scholar] [CrossRef]
  20. Venkata Pavan Kumar, Y.; Naga Venkata Bramareswara Rao, S.; Kannan, R. Islanding Detection in Grid-Connected Urban Community Multi-Microgrid Clusters Using Decision-Tree-Based Fuzzy Logic Controller for Improved Transient Response. Urban Sci. 2023, 7, 72. [Google Scholar] [CrossRef]
  21. Algburi, S.; Abed Al Kareem, S.S.; Sapaev, I.B.; Mukhitdinov, O.; Hassan, Q.; Khalaf, D.H.; Jabbar, F.I. The Role of Artificial Intelligence in Accelerating Renewable Energy Adoption for Global Energy Transformation. Unconv. Resour. 2025, 8, 100229. [Google Scholar] [CrossRef]
  22. Mughees, N.; Mughees, A.; Mughees, A.; Ejsmont, K. Optimizing Electrical and Thermal Energy Storage Systems for Hour-Ahead Integrated Demand Response in Industries. Energy Rep. 2025, 13, 4441–4458. [Google Scholar] [CrossRef]
  23. Filho, E.M.L.; Silveira, A.B.; Ferreira, A.M.; Marques, J.A.L.; Batista, J.G.; Guimarães, G.D.F.; De Alexandria, A.R.; Rodrigues, J.J.P.C. Optimization of Energy Storage Systems with Renewable Energy Generation and Consumption Data. In Proceedings of the 2024 IEEE 7th Student Conference on Electric Machines and Systems (SCEMS), Macao, China, 6–8 November 2024; pp. 1–9. [Google Scholar] [CrossRef]
  24. Dong, J.; Zang, T.; Li, X.; Bao, P. Research on Energy Management and Scheduling Algorithm of Lithium Battery Energy Storage System Based on Artificial Intelligence. In Proceedings of the 2025 International Conference on Electrical Drives, Power Electronics & Engineering (EDPEE), Athens, Greece, 26–28 March 2025; pp. 1079–1084. [Google Scholar] [CrossRef]
  25. Sanan, O.; Sperling, J.; Greene, D.; Greer, R. Forecasting Weather and Energy Demand for Optimization of Renewable Energy and Energy Storage Systems for Water Desalination. In Proceedings of the 2024 IEEE Conference on Technologies for Sustainability (SusTech), Portland, OR, USA, 14–17 April 2024; pp. 175–182. [Google Scholar] [CrossRef]
  26. Wang, C.; Liu, Y.; Zhang, Y.; Xi, L.; Yang, N.; Zhao, Z.; Lai, C.S.; Lai, L.L. Strategy for optimizing the bidirectional time-of-use electricity price in multi-microgrids coupled with multilevel games. Energy 2025, 323, 135731. [Google Scholar] [CrossRef]
  27. Nguyen-Duc, T.; Nguyen-Duc, H.; Le-Viet, T.; Takano, H. Single-Diode Models of PV Modules: A Comparison of Conventional Approaches and Proposal of a Novel Model. Energies 2020, 13, 1296. [Google Scholar] [CrossRef]
  28. Abdulrazzaq, A.K.; Bognár, G.; Plesz, B. Enhanced single-diode model parameter extraction method for photovoltaic cells and modules based on integrating genetic algorithm, particle swarm optimization, and comparative objective functions. J. Comput. Electron. 2025, 24, 44. [Google Scholar] [CrossRef]
  29. Hao, X.; Liu, P.; Deng, Y.; Meng, X. A MIC-LSTM based parameter extraction method for single-diode PV model. Front. Energy Res. 2024, 11, 1349887. [Google Scholar] [CrossRef]
  30. Criollo, A.; Minchala-Avila, L.I.; Benavides, D.; Ochoa-Correa, D.; Tostado-Véliz, M.; Meteab, W.K.; Jurado, F. Green Hydrogen Production—Fidelity in Simulation Models for Technical–Economic Analysis. Appl. Sci. 2024, 14, 10720. [Google Scholar] [CrossRef]
  31. Espinoza, J.L.; González, L.G.; Sempértegui, R. Micro grid laboratory as a tool for research on non-conventional energy sources in Ecuador. In Proceedings of the 2017 IEEE International Autumn Meeting on Power, Electronics and Computing (ROPEC), Ixtapa, Mexico, 8–10 November 2017; pp. 1–7. [Google Scholar] [CrossRef]
  32. CellCube Energy Storage GmbH. Products–CellCube. 2025. Available online: https://www.cellcube.com/products/ (accessed on 22 August 2025).
  33. Gu, F.C.; Chen, H.C. Modelling and control of vanadium redox flow battery for smoothing wind power fluctuation. IET Renew. Power Gener. 2021, 15, 3552–3563. [Google Scholar] [CrossRef]
  34. Benavides, D.; Villa-Ávila, E.; Criollo, A.; Aguado, J.A. 17—Optimal energy management of energy storage and electric vehicles in power systems. In Towards Future Smart Power Systems with High Penetration of Renewables; Tostado-Véliz, M., Rezaee Jordehi, A., Mansouri, S.A., Ramos Galán, A., Melguizo, F.J., Eds.; Academic Press: New York, NY, USA, 2025; pp. 413–434. [Google Scholar] [CrossRef]
  35. Turker, B.; Arroyo Klein, S.; Hammer, E.M.; Lenz, B.; Komsiyska, L. Modeling a vanadium redox flow battery system for large scale applications. Energy Convers. Manag. 2013, 66, 26–32. [Google Scholar] [CrossRef]
  36. Benavides, D.; Arévalo, P.; Villa-Ávila, E.; Aguado, J.A.; Jurado, F. Predictive power fluctuation mitigation in grid-connected PV systems with rapid response to EV charging stations. J. Energy Storage 2024, 86, 111230. [Google Scholar] [CrossRef]
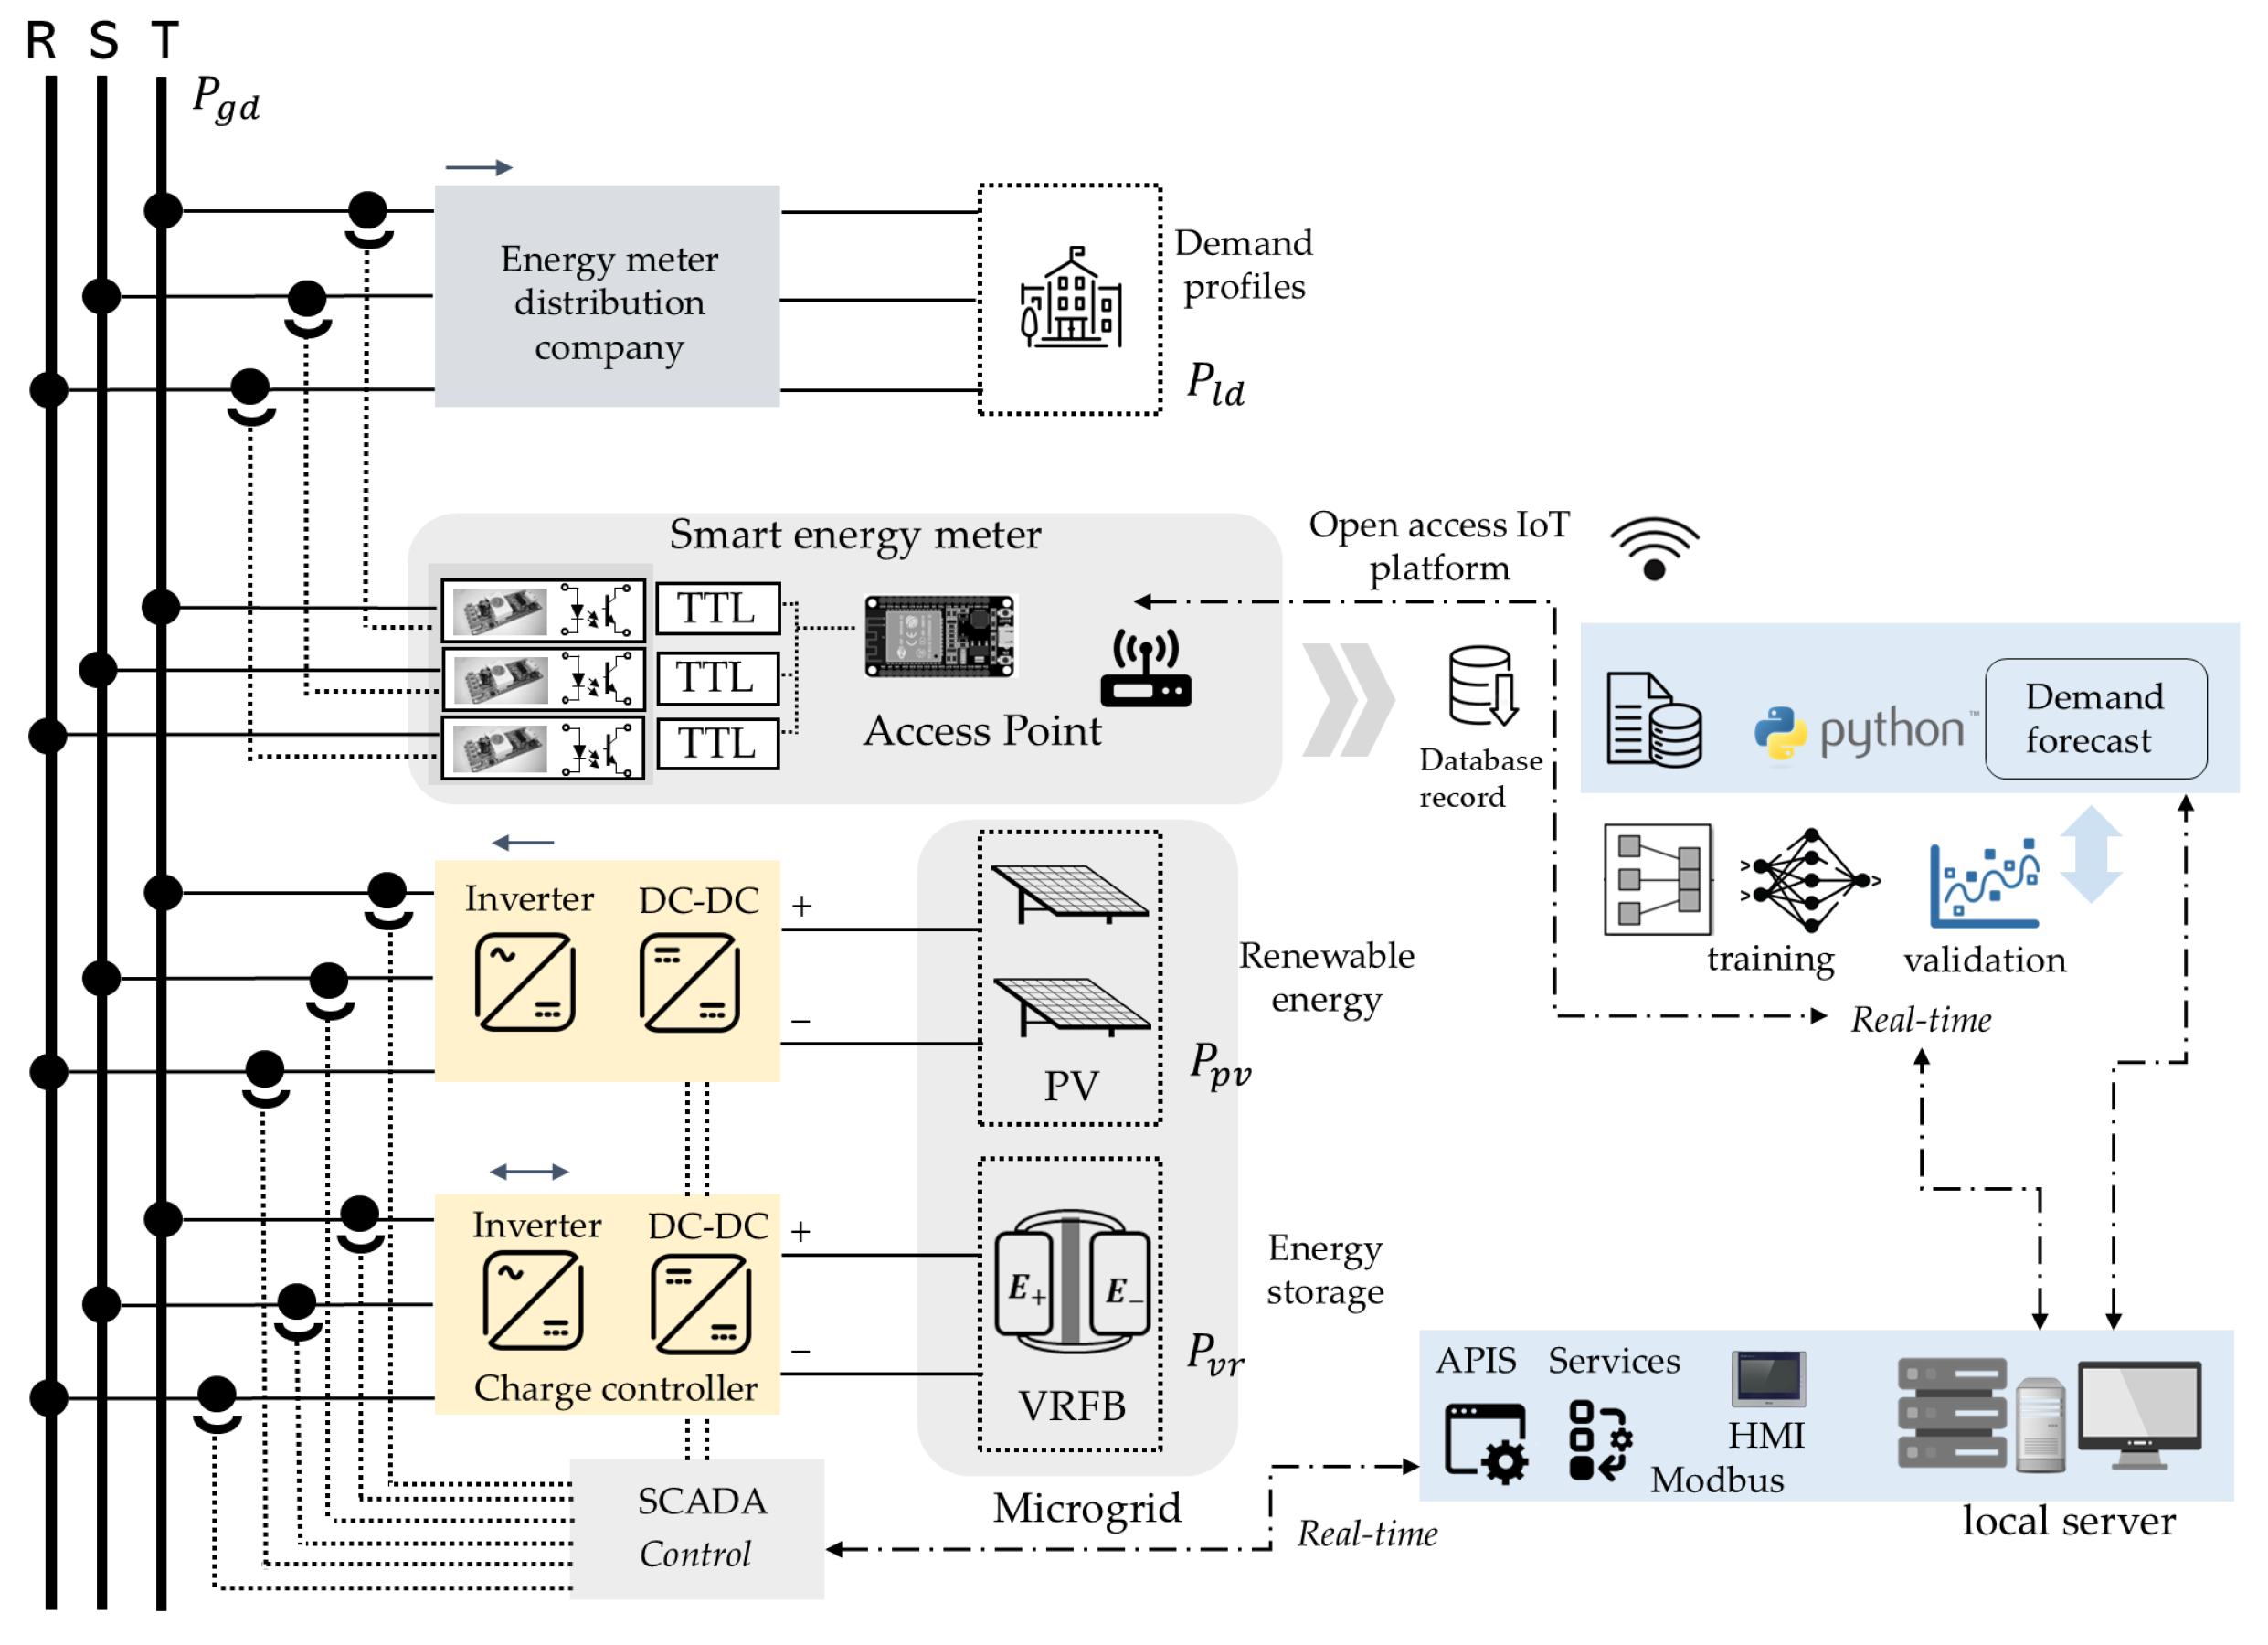
Figure 1. Schematic diagram for energy management in a microgrid based on demand forecasting.
Sustainability 17 08915 g001
Figure 2. Block Diagram of the Software-Integrated Microgrid Architecture.
Sustainability 17 08915 g002
Figure 3. Neural network architecture.
Sustainability 17 08915 g003
Figure 4. PV power and I-V characteristics: (a) Model A-250M and (b) Model A-250P.
Sustainability 17 08915 g004
Figure 5. Operating principle of the vanadium redox flow battery.
Sustainability 17 08915 g005
Figure 6. Automatic control algorithm.
Sustainability 17 08915 g006
Figure 7. Case study: demand measurement point and microgrid laboratory equipment.
Sustainability 17 08915 g007
Figure 8. Case study evaluation: (a) Demand profile (b) PV generation, (c) Total energy.
Sustainability 17 08915 g008
Figure 9. Evaluation of demand prediction models: (a) NNN Model, (b) BNN Model, (c) RLR Model, (d) Scatter chart NNN, (e) Scatter chart BNN, (f) Scatter chart RLR, (g) SVM Model, (h) WNN Model, (i) Scatter chart SVM and (j) Scatter chart WNN.
Sustainability 17 08915 g009
Figure 10. Evaluation of indices in predictive model: (a) RMSE, (b) R-squared, (c) MSE and (d) MAPE.
Sustainability 17 08915 g010
Figure 11. Experimental of the VRFB under various power settings: (a) reference power and state of charge, (b) Current and voltage measurement in charging and discharging processes, and (c) Performance evaluation.
Sustainability 17 08915 g011
Figure 12. Coordinated power dispatch with essential storage system support.
Sustainability 17 08915 g012
Figure 13. Predictive model validation: (a) prediction of power demand and (b) energy prediction.
Sustainability 17 08915 g013
Figure 14. Validation of predictive models: (a) prediction of power demand in real-time environments and PV generation, and (b) prediction of the state of charge.
Sustainability 17 08915 g014
Figure 15. Sensitivity analysis of system power and load: (a) Low PV generation, (b) SoC under low-generation conditions, (c) Reference power under low-generation conditions, (d) Medium PV generation, (e) SoC under medium generation conditions, (f) Reference power under medium generation conditions, (g) High PV generation, (h) SoC under high generation conditions and (i) Reference power under high generation conditions.
Sustainability 17 08915 g015
Table 1. Comparative review of related literature and positioning of this work.
ReferenceScope/ObjectiveMethods/ModelsTechnology FocusKey ContributionsIdentified Limitations
Tushar et al. (2018) [7]Decentralized DSM for EVs and ESSGame theory, mixed strategiesEVs, ESS, DSMAdaptive load control, day-ahead correctionNo experimental platform, limited to simulations
Wang et al. (2025) [26]Coordination between multiple microgridsMultilevel game theoryPV, WT, ESS, Usersbidirectional time-of-use electricity priceSimulated environments
Alvarado-Barrios et al. (2020) [8]Stochastic unit commitment in microgridsARMA + stochastic optimizationWT, PV, BESSDispatch under forecast uncertaintyNo real-time feedback, 24 h horizon only
Sharrma et al. (2021) [9]Peak shaving using PV + BESSWeek-ahead time seriesPV, BESSCoordinated forecast and storage schedulingNo online updates or adaptive models
Lyu et al. (2020) [10]Battery operation under uncertaintyTube-based MPCLi-ion BESSForecast-bounded SoC controlNo forecasting module, simulated validation only
Kim et al. (2025) [13]AI-based load prediction and peak shavingMC-LSTM + clusteringV2G, reused ESSReal-world deployment, 21% reductionFocused on commercial buildings, no SoC tracking
Sadeghi et al. (2021) [15]VPP bidding with forecastingBidirectional LSTMVPP, RES, EVsParticipation in regulation marketsEconomic optimization only, not microgrid-based
Zhang et al. (2023) [3]DR-aware forecastingGA-LSTM hybridInterruptible loads, DR, ESSImproved accuracy via DR signalsNo storage dynamics modeled
Ruiz-Abellón et al. (2024) [4]Probabilistic DR coverage planningQuantile regression methodsDR programsUncertainty range quantificationCity-scale data, not microgrid-specific
Apribowo et al. (2023) [2]Optimal VRFB allocation on gridGAMS optimization (IEEE 39-bus)Grid-scale VRFBCost-efficient VRFB placementNo forecasting integration
Selvarasu et al. (2024) [1]Sizing BESS for PV smoothingEmpirical sizing approachPV, BESSRamp-rate control strategyNo forecast-based operation
Abedi & Kwon (2023) [16]BESS operation in residential contextRNN + rolling-horizon optimizationPV, BESSAdaptive BESS schedulingNo experimental validation
Mary & Dessaint (2025) [11]Peak shaving with MPC + NN forecastNN + robust MPCInstitutional BESSForecast-aware peak managementGeneric load scenarios only
Sharifhosseini et al. (2024) [5]Review of AI in power systemsLiterature surveyGeneral AI methodsComprehensive taxonomyNo implementation case
Wang et al. (2024) [6]AI in smart energy systemsReview of ML/DL modelsForecasting, DR, anomaly detectionPractical guidance and model comparisonNo validation or deployment
This workForecast-based VRFB operation in microgridWNN + adaptive SoC controlSmart meters, VRFB, PVReal lab validation, forecasting + control integrationLimited storage capacity, university-scale
Table 2. Parameters of PV power generation and VRFB energy storage systems.
PV System
Model:ATERSA A-250M/ATERSA A-250P
Peak nominal power:15 kW (×2)
Number of modules:60 units (×2)
Max. DC Voltage:553 V D C (A-250M)/563 V D C (A-250P)
Max. AC Voltage:230 V A C (60 Hz)
MPPT:Perturb and observe (P&O)
DC/AC Inverter:GPTech Two Level
VRFB System
Model:Gildemeister/CellCube FB 20
Nominal charge output/input20 kW
Capacity of the energy storage system100 kWh
Battery and system voltage:48 V D C (x2)
Output voltage:230 V A C (60 Hz)
Charge/discharge cycle DC:up to 80%
Charge and discharge cycles:practically unlimited cycling
Depth of Discharge (DoD):100%
Number of cells:12 cells per string
Number of clusters:2 units (A and B)
Table 3. Evaluation metrics applied to predictive demand models.
MetricDescriptionEquationModel Evaluation
RMSERoot Mean Squared Error. Measures the standard deviation of prediction errors. Penalizes large deviations more heavily. RMSE = 1 n i = 1 n ( y i y ^ i ) 2 If the RMSE is low, it ensures that predictions do not deviate drastically from actual demand.
R2Coefficient of determination. Indicates how well the model fits the actual data. Values close to 1 imply a better fit. R 2 = 1 i = 1 n ( y i y ^ i ) 2 i = 1 n ( y i y ¯ ) 2 An R2 close to 1 indicates that the model captures daily demand variability well.
MSEMean Squared Error. Evaluates the average of squared prediction errors. Sensitive to outliers. MSE = 1 n i = 1 n ( y i y ^ i ) 2 A low MSE indicates stability in demand predictions and will improve their efficiency.
MAPEMean Absolute Percentage Error. Measures relative error in percentage. Useful for comparing models across different scales. MAPE = 100 n i = 1 n y i y ^ i y i A low MAPE facilitates model integration in environments with daily demand variability.
Table 4. Evaluation of VRFB for charging and discharging for different reference power levels.
Reference PowerChargeDischarge
5 kW 10 kW 15 kW 20 kW 5 kW 10 kW 15 kW 20 kW
Autonomy Time (h)27127.57157.555
Avg. DC Current (A)82.57165.08241.38297.89104.63216.4344.79480.33
Avg. DC Voltage (V)57.7458.2558.7259.43553.7151.70549.3555.115
Active Power (kW)4.769.6117.6518.185.611.161721.62
Energy (kWh)128.61115.71118122.0183.5685.583.5779.28
Table 5. Energy dispatch analysis of generation and demand.
EventParameter E pv , E ld E charge , E discharge Δ E t = E pv E ld
(kWh) (kWh) (kWh)
1Generation115.5240.53−51.96
MonDemand167.4993.57Energy usage
2Generation145.3444.32−44.42
TueDemand189.7689.74Energy usage
3Generation162.1983.65−7.00
WedDemand169.2091.70Energy usage
4Generation219.79127.6742.01
ThurDemand177.7886.71Energy production
5Generation178.7599.8729.46
FriDemand149.2971.66Energy production
6Generation118.8995.4363.04
SatDemand55.8433.36Energy production
7Generation232.64208.85178.03
SunDemand54.6031.86Energy production
Disclaimer/Publisher’s Note: The statements, opinions and data contained in all publications are solely those of the individual author(s) and contributor(s) and not of MDPI and/or the editor(s). MDPI and/or the editor(s) disclaim responsibility for any injury to people or property resulting from any ideas, methods, instructions or products referred to in the content.