1. Introduction
In recent decades, accelerated urbanization, rising global temperatures, and unsustainable planning have intensified urban heat islands (UHIs), worsening thermal discomfort in cities worldwide [
1,
2]. In tropical regions, where exposure to outdoor spaces is common, heat stress has been identified as a major challenge for public health, energy use, and urban sustainability [
3,
4].
High temperatures are related to different conditions that deteriorate human health due to heat stress [
5]: cardiovascular diseases presented maximum mortality in months with peaks of high temperatures [
6].
The body’s thermoregulatory mechanisms have a limit. People with chronic diseases are more susceptible to symptoms such as cramps, dehydration, sunstroke, and heat stroke. These conditions may manifest as cardiac arrhythmias, pulmonary edema, liver failure, nervous system disorders, hyperventilation, seizures, and even death if exposure to high temperatures is prolonged [
7]. Being in discomfort, whether indoors or outdoors, negatively impacts environmental ergonomics and therefore the efficiency of the work carried out. For example, in office work, things as simple as the appearance of sweating or the feeling of cold decreases this efficiency [
8]. Health conditions due to an increase in body temperatures between 37 °C and 40 °C are known as heat exhaustion and are manifested through vomiting, weakness, confusion, fatigue, headache, and visual disturbance, among others [
9]. Applying a set of passive and environmentally friendly bioclimatic techniques that complement each other would help to narrow the distance between the conditions of a place, which are affected by increases in environmental temperatures, and comfortable conditions. Thermal comfort, however, is not only physiological but also cultural and perceptual, making outdoor environments particularly sensitive to climate change and urban form [
2]. Climate change further compounds these challenges, as its impacts extend beyond individual health to affect the environment, infrastructure, and overall urban resilience. In Panama, for example, recent analyses highlight that urban populations are increasingly exposed not only to heat stress but also to climate-related hazards such as floods, landslides, and extreme winds, which aggravate the vulnerability of already stressed environments [
10]. These conditions emphasize that outdoor thermal comfort must be understood within a broader framework that considers both human perception and the ecological and infrastructural systems shaping urban life. Consequently, bioclimatic strategies become essential tools, as they offer integrative solutions capable of alleviating human discomfort while simultaneously reducing environmental pressures and supporting sustainable urban planning.
To counteract these impacts, bioclimatic strategies such as vegetation, water features, reflective materials, and evaporative cooling systems have been increasingly tested [
11]. Previous studies in arid and temperate cities have shown significant temperature reductions through such interventions. For instance, in Suzhou, China, integrated vegetation and water bodies reduced air temperature by up to 4.2 °C [
12], while in Tehran, Iran, specific vegetation types lowered PET by 2.7 °C [
13]. Similarly, research in Darwin, Australia demonstrated that combining shading, sprinklers, and cool surfaces reduced surface temperatures by as much as 15 °C [
14].
Yet humid tropical climates remain underexplored. High humidity limits the efficiency of evaporative cooling, raising doubts about the applicability of strategies developed for dry regions [
15]. Still, innovative adaptations exist in Singapore: dry mist systems improved subjective comfort despite minimal reductions in air temperature [
16]. In Latin America, few studies integrate empirical and simulation approaches. Notable exceptions include passive roof cooling in Venezuela [
17] and localized analyses in Panama’s Casco Antiguo and main roadways [
18,
19].
In Panama, climate adaptation has been recognized as a national priority (PENCYT 2019–2024) [
20], yet no studies have rigorously assessed the combined effect of multiple bioclimatic strategies under tropical conditions. Previous work at the Víctor Levi Sasso (VLS) University Campus demonstrated that arborized areas were 4–8 °C cooler than surrounding paved zones [
21], but lacked field validation or evaluation of combined techniques. Given the country’s persistently high relative humidity (>75%) [
22], the performance of strategies such as dry mist and sprinklers remains uncertain.
Therefore, this study addressed the following research gap: the absence of experimental–numerical evaluations of synergistic bioclimatic strategies in humid tropical urban environments. The central hypothesis was that the synergistic application of arborization, dry mist systems, water bodies, and sprinklers improves outdoor thermal comfort more than isolated interventions, even under high humidity. Accordingly, the research question guiding this work was: To what extent can combined bioclimatic strategies enhance outdoor thermal comfort in humid tropical climates compared to individual strategies?
To test this, a hybrid methodology was applied combining ENVI-met simulations, in situ measurements, and thermal comfort surveys. This approach not only quantified physical variables—air temperature, mean radiant temperature, and surface temperature, but also incorporated pedestrian perceptions through PET and ASHRAE scales. The findings are expected to inform scalable design guidelines for universities and other tropical urban contexts, contributing to sustainable and climate-resilient urban planning.
2. Materials and Methods
The methodology consisted first of searching in the literature for generalized bioclimatic strategies applicable to any place and climatic condition. Then, a review was conducted to determine which bioclimatic techniques could be implemented in our climate (humid tropical). After determining the appropriate techniques, dynamic simulations were performed using ENVI-met v5.6.1, which provided results on the effectiveness of the proposed strategies. A simulation period of four hours (11:00–15:00) was selected to capture the most thermally critical part of the day, when solar radiation and ambient temperatures peak in tropical climates. Previous research has shown that this timeframe is the most representative for assessing outdoor thermal discomfort and testing cooling interventions in similar latitudes [
1,
23]. Extending simulations beyond this period would have increased computational cost without providing additional insight into peak thermal stress conditions. The variables measured were air temperature, surface temperature, air relative humidity, and wind speed.
To verify the data of the simulation results, tools such as surveys and on-site measurements were used. The surveys allowed us to understand pedestrians perceived thermal sensation and identify the area’s most frequently visited at different times of the day. The in situ measurements served to validate the resulting environmental variable values obtained through the simulations. Measurement points were selected in areas identified as “critical” through field observations characterized by high pedestrian exposure, limited shade, and direct solar incidence. This approach ensured representativeness by focusing on locations where users experience the most thermal stress, which aligns with best practices in outdoor thermal comfort studies [
24,
25].
2.1. Description of the Case Study
The case study, the university campus, is located at the following geographical coordinates: 9°1′22.8″ N, 79°31′51.6″ W [
26]. Using only these coordinates, the software replicated the climatic conditions of the area, an area of approximately 269,667.27 m
2 (26.97 ha). It covered the busiest areas both on foot and by car.
Figure 1 presents a view of the Victor Levi Sasso (VLS) campus extracted from Google Earth and identifies the main buildings.
Panama has an intertropical climate marked by a rainy season from May to November, peaking in October and November with up to 191 mm of precipitation and a dry season from December to April, except on the Caribbean slope, where rainfall is almost continuous. The proximity of the Atlantic and Pacific oceans generates a strong marine influence, sustaining high humidity, while ocean–atmosphere interactions and currents shape heat and moisture conditions [
19]. In Panama City, located at sea level, average maximum temperatures reach 32 °C in the dry season and 30 °C in the rainy season, with relative humidity ranging between 50% and 70% [
26]. However, the country’s geography produces marked microclimatic variation: highland areas such as Boquete, Cerro Punta, and El Valle experience much cooler temperatures (15–24 °C) due to elevation (600–1800 m), persistent mist, and dense vegetation, contrasting sharply with the hotter and more humid lowland zones [
27].
2.2. Campus Characteristics
The Víctor Levi Sasso Campus, the main headquarters of the Technological University of Panama (UTP), covers approximately 26.9 hectares in Panama City [
28]. Beyond its role as an academic and administrative hub, the campus presents spatial and environmental features relevant to experimental design. The site integrates a mix of built infrastructure and open areas, including sports courts, pedestrian corridors, and extensive green spaces with tree coverage that provide shade and influence local microclimatic conditions. These vegetated zones contrast with exposed paved surfaces such as brick roads, concrete pavements, and open plazas, creating heterogeneous surface properties that were critical to the thermal comfort analysis.
The campus layout also supports constant pedestrian activity, particularly during the first semester of the academic year (March–July), when the experiments were conducted under summer climatic conditions. This period coincides with high solar loads and reduced rainfall, intensifying thermal stress and making it suitable for evaluating bioclimatic strategies.
Table 1,
Table 2 and
Table 3 detail the physical and thermal properties of the main surface materials represented in the campus model [
29].
2.3. Model and Simulation
ENVI-met software is commonly used in climate simulations to analyze thermal comfort and the urban heat island effect. One of its key strengths is the ability to simulate the climatic characteristics of a region by simply entering its geographical coordinates, which allows for specific modeling based on local climate conditions.
The modeling of this research consisted of recreating the area of study, the Víctor Levi Sasso Campus, in a macro way. Google Earth was used to create the model that used the ENVI-met software.
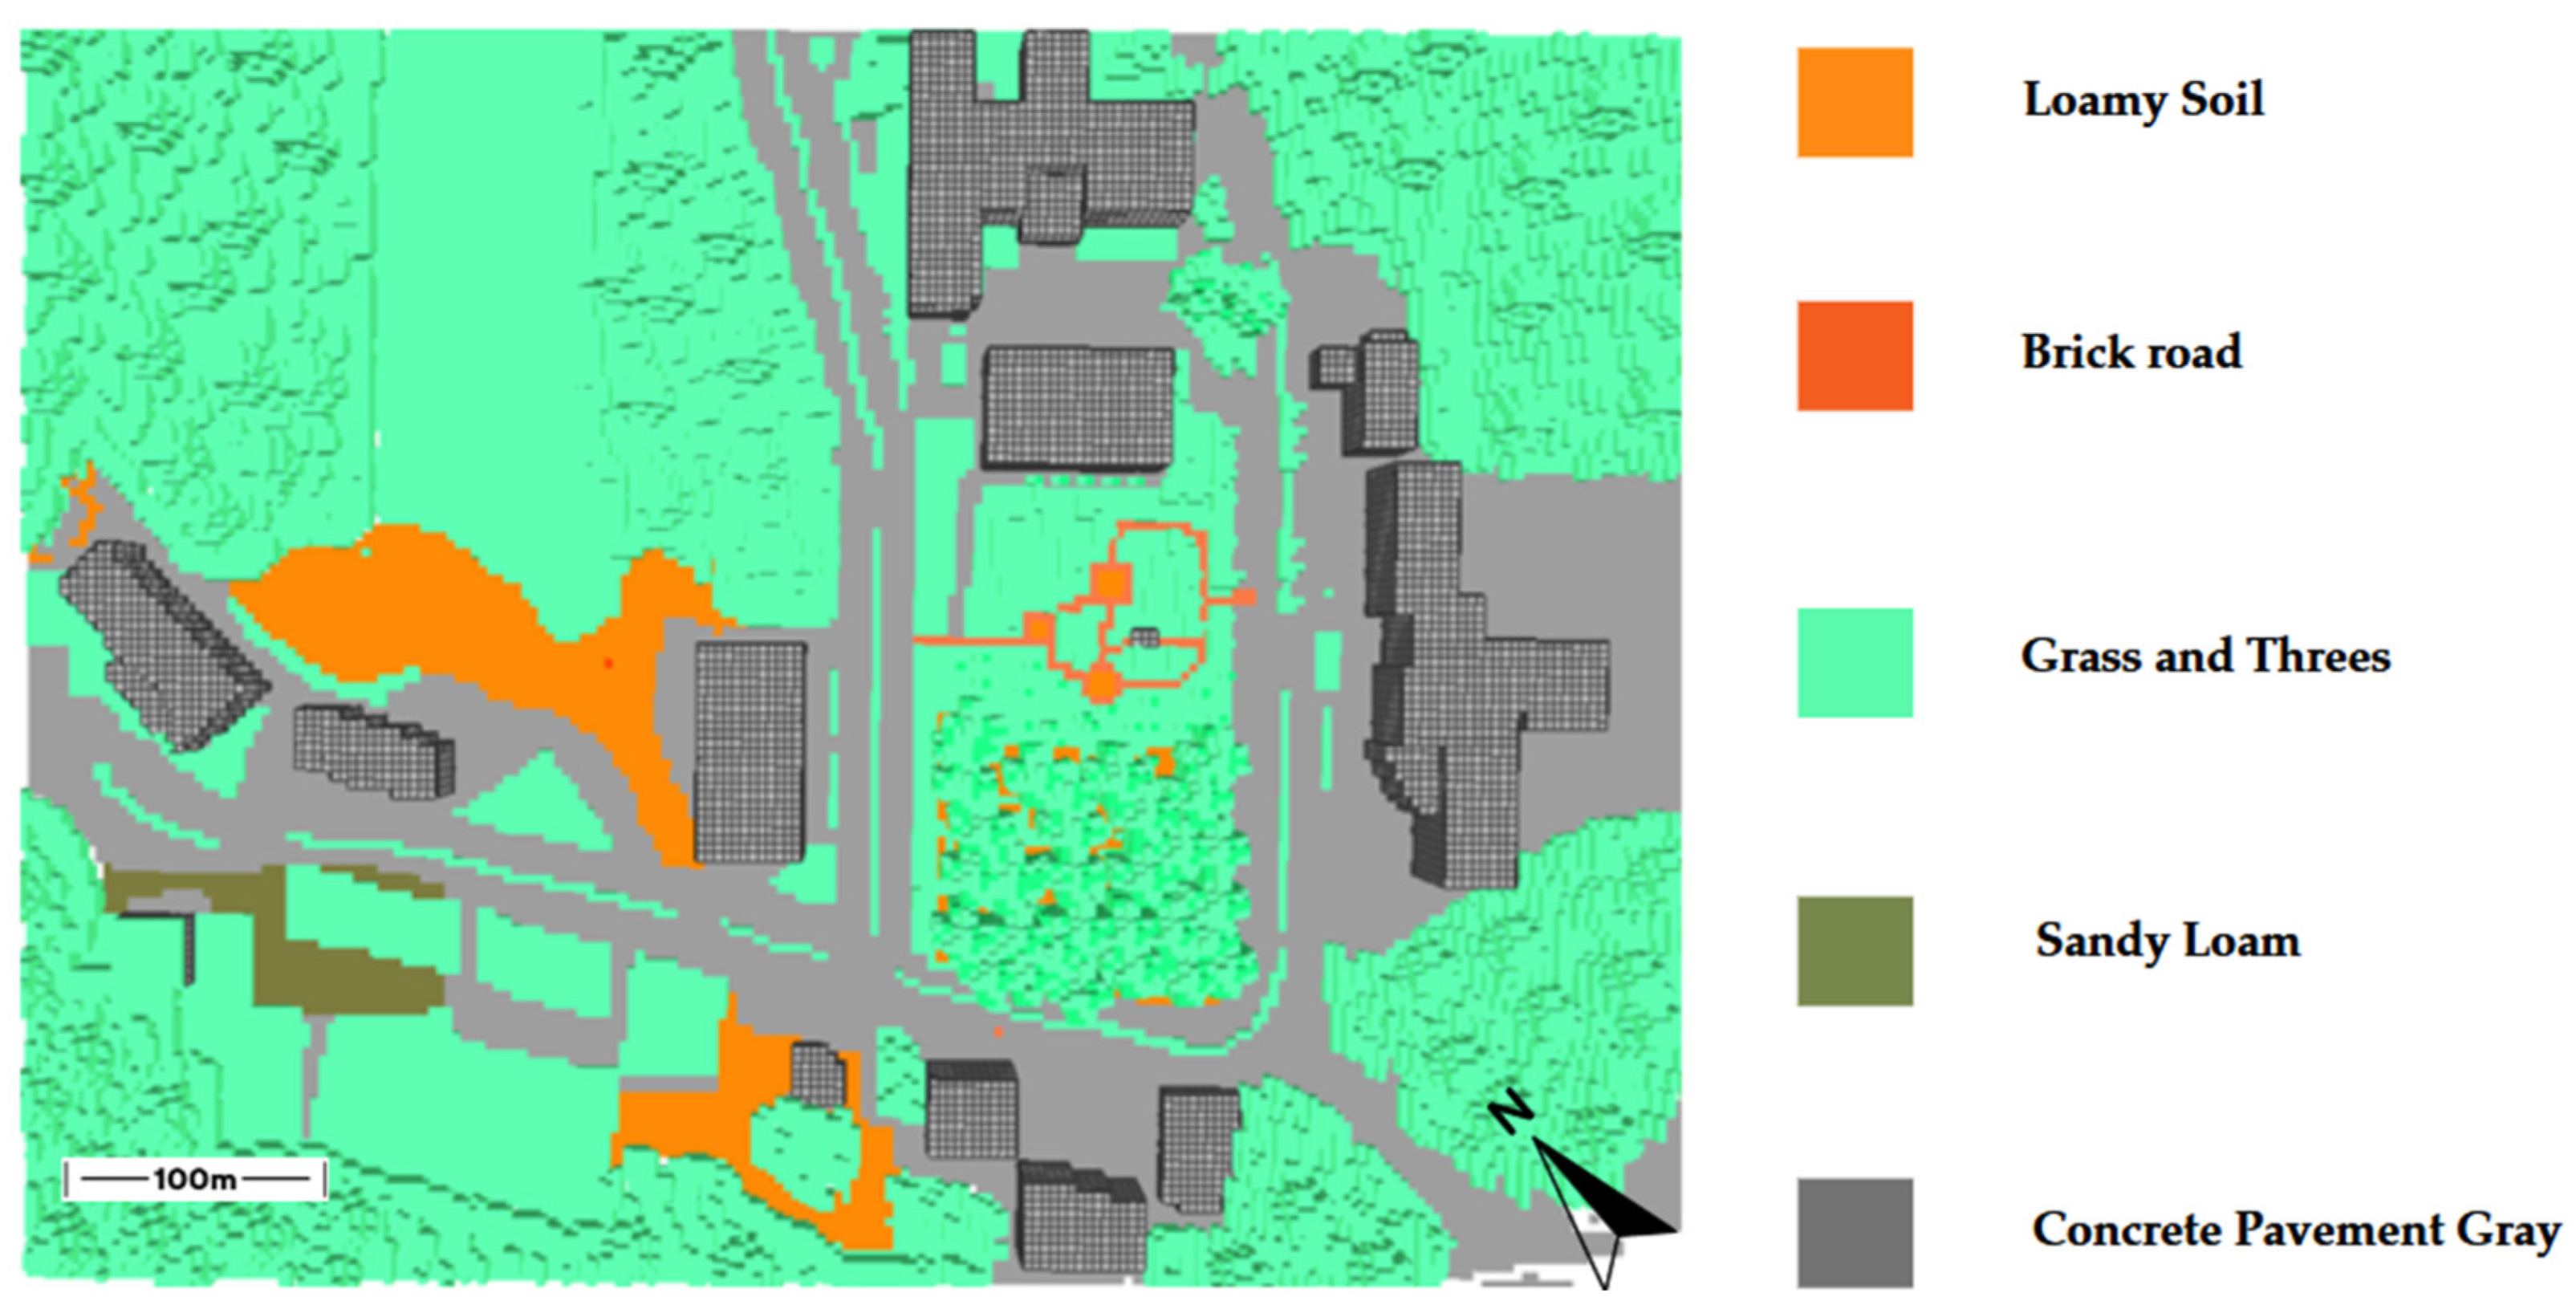
Figure 2 shows a representation of the Víctor Levi Sasso Campus after being recreated in ENVI-met.
Figure 2 shows the spatial distribution of land cover types. The legend indicates the main surface categories used in the model: loamy soil, brick road, grass and trees, sandy loam, and concrete pavement. These classifications were integrated into the ENVI-met simulation to represent the thermal and surface heterogeneity of the study area. The specific physical and thermal properties of each material are detailed in
Table 1,
Table 2 and
Table 3, which complement the information presented in this figure.
Table 1,
Table 2 and
Table 3 present the materials and specifications of the buildings, green areas, trees and streets in detail. The simulations show us the critical temperature points and regions and at what time they occur. They also show us other data such as wind speed, wind direction, potential air temperature (not to be confused with the actual air temperature), average radiant temperature, specific humidity and concentration of
in the air.
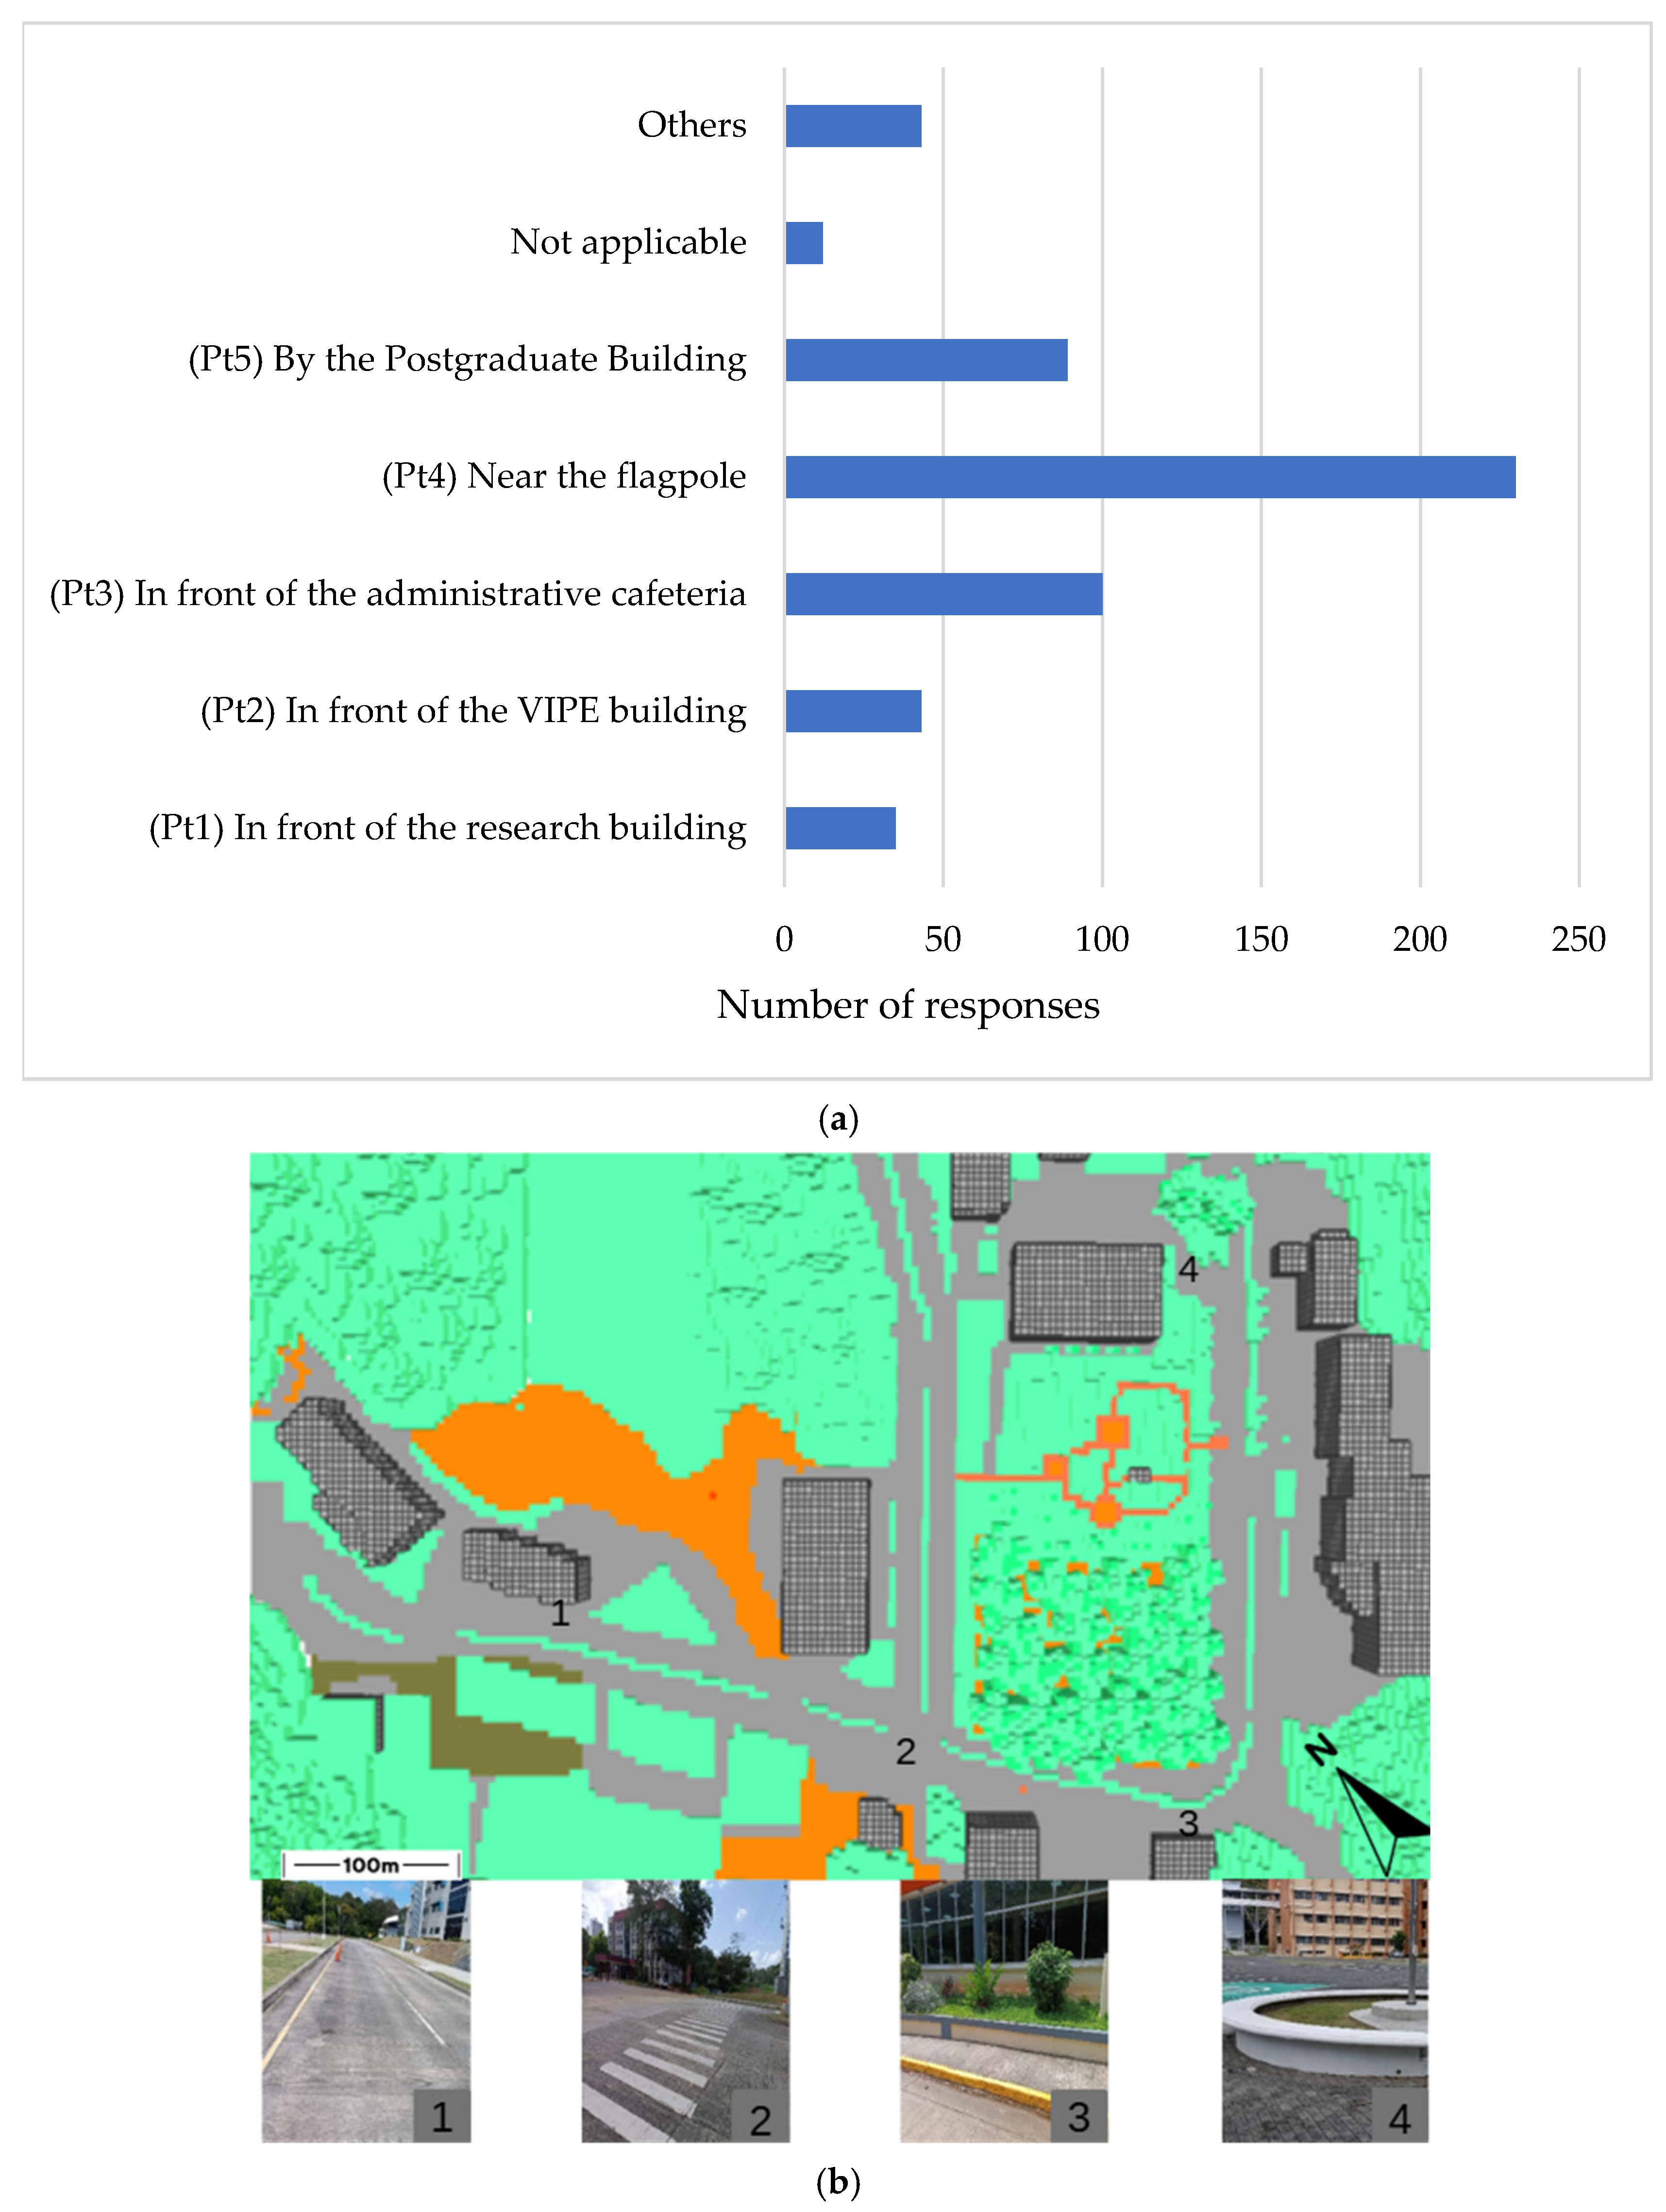
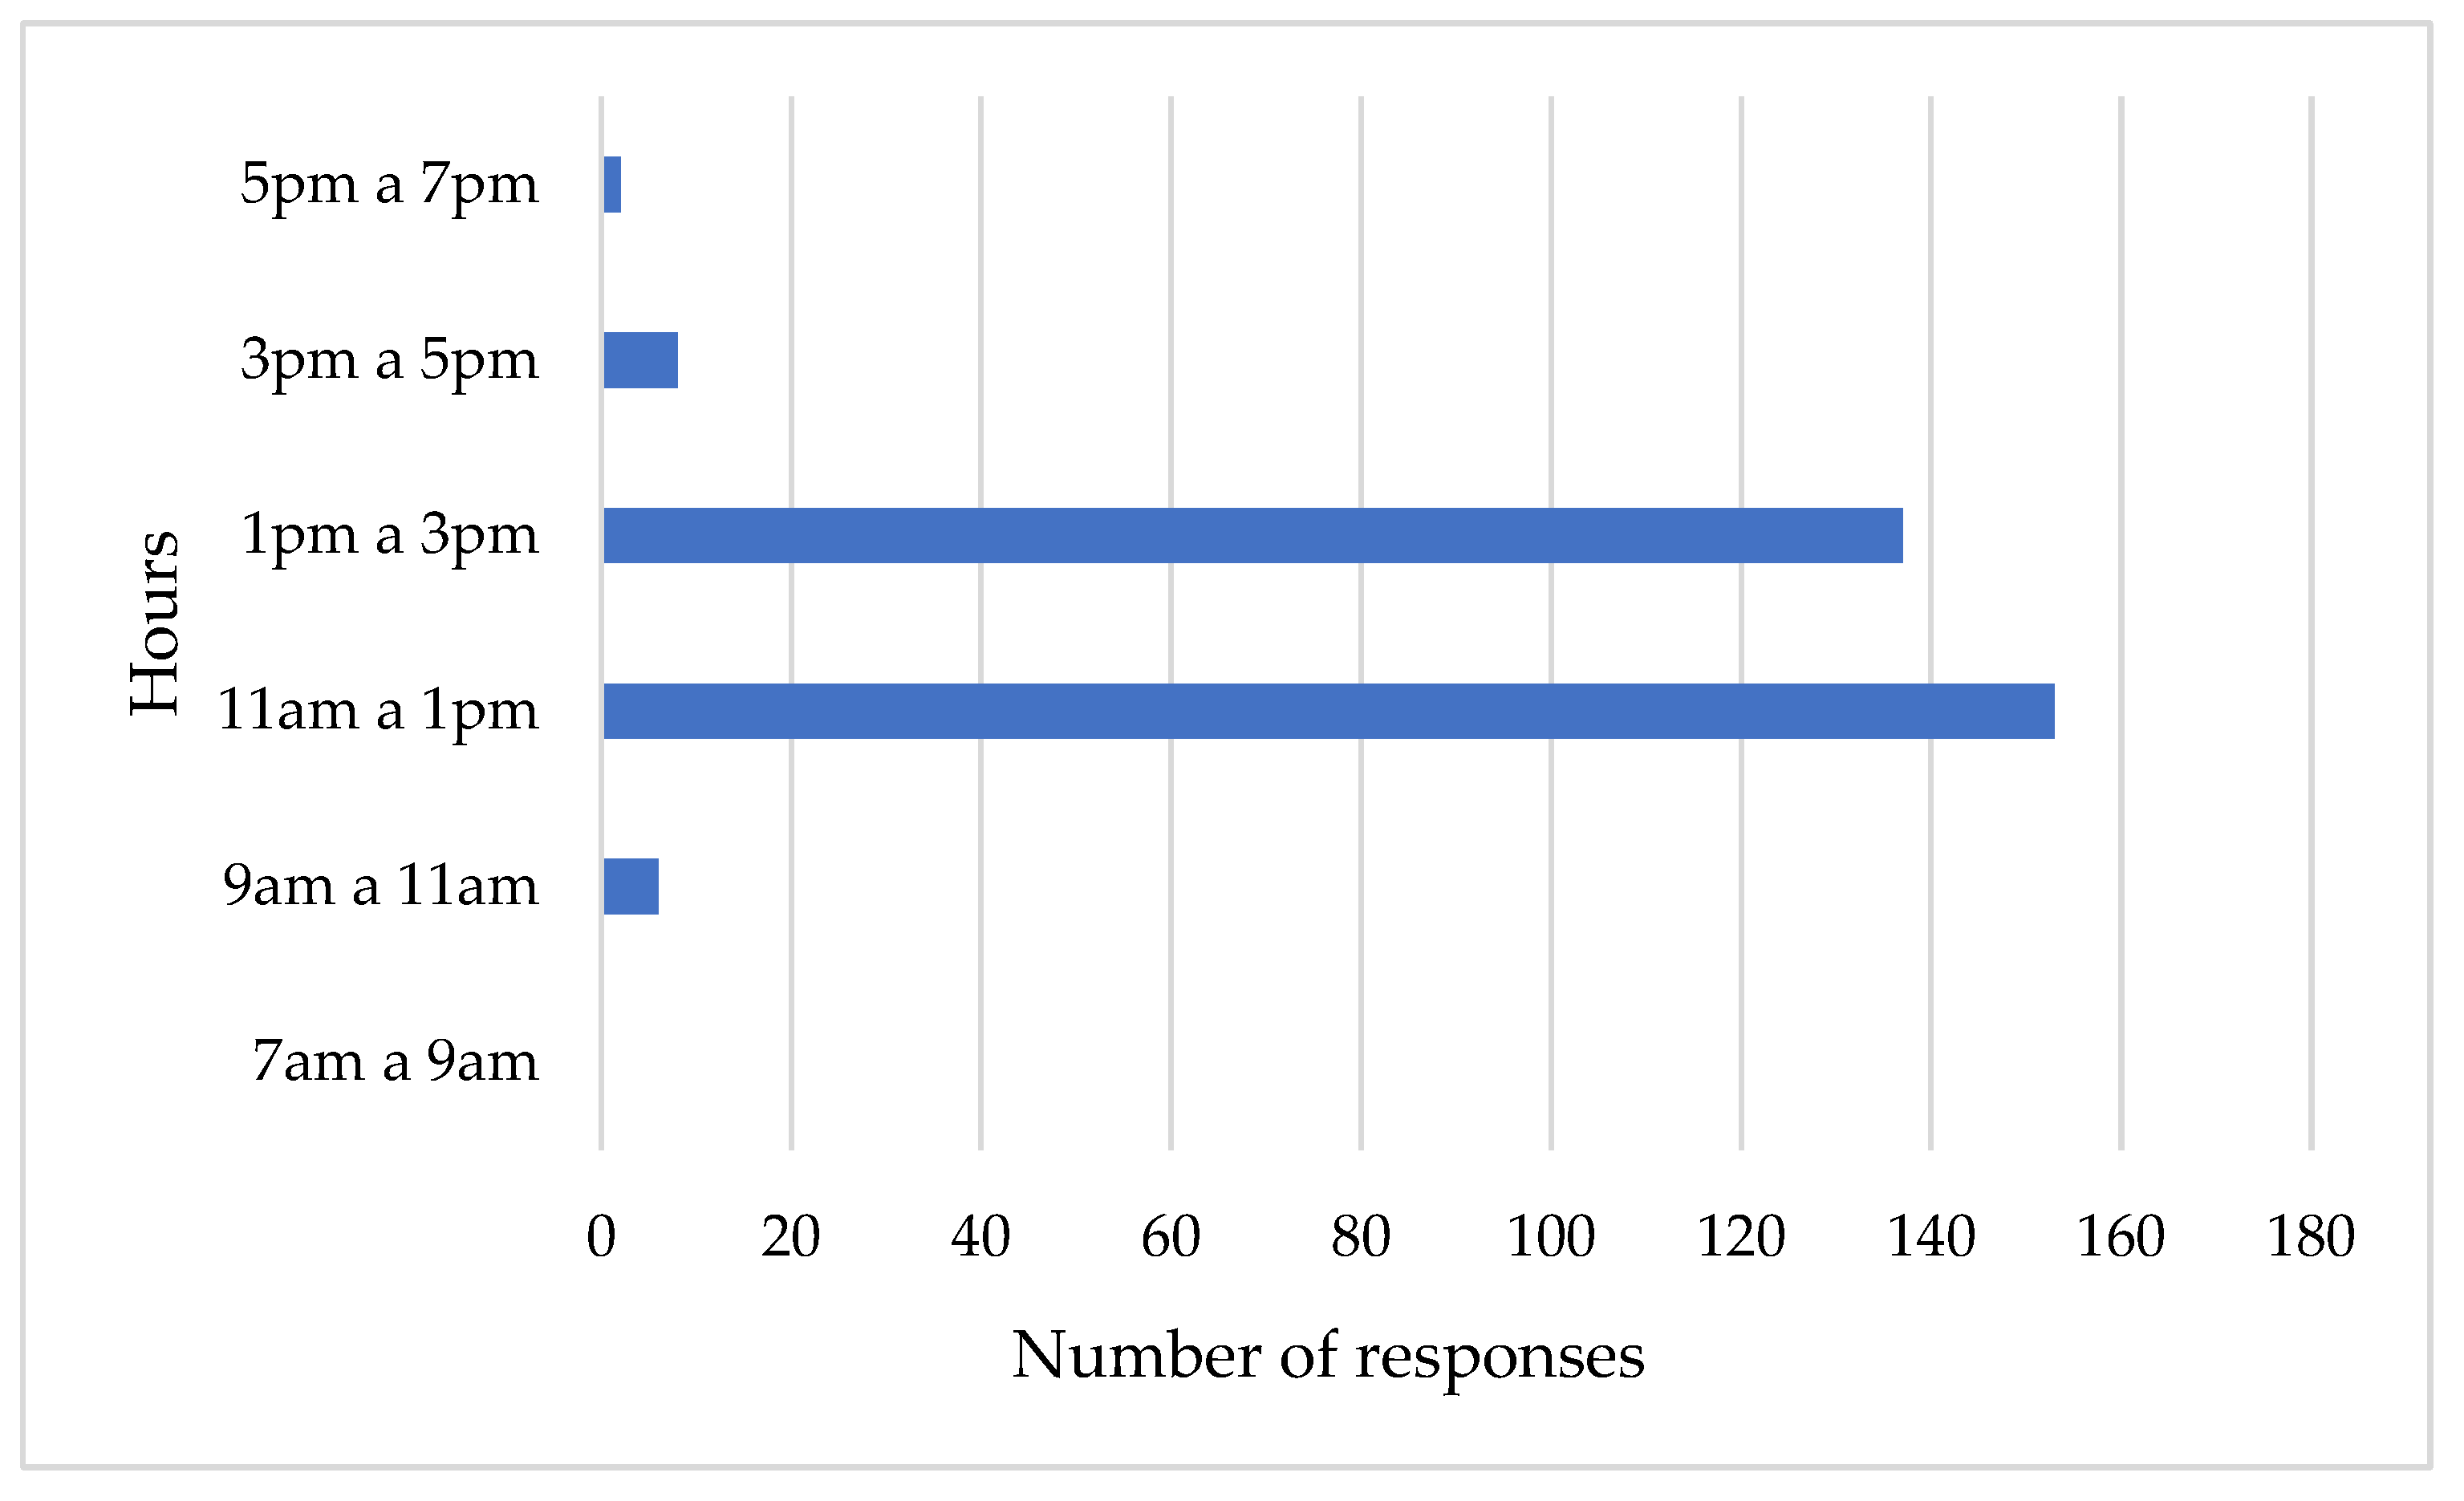
Initially, simulations were configured to cover full day cycles ranging (10:00 a.m. to 7:00 p.m.). Depending on the complexity and number of variables involved, some simulations required up to a week to complete, significantly extending computation times and often generating redundant data during periods of low thermal variability. To optimize the simulation process, survey results were analyzed to identify the hours perceived as most thermally critical by campus users. The majority of respondents identified the time intervals between 11:00 a.m. and 1:00 p.m. and between 1:00 p.m. and 3:00 p.m. as the most problematic in terms of thermal discomfort. Based on this feedback, the simulation schedule was refined to focus exclusively on these peak heat hours. This adjustment reduced the simulation runtime to less than a day (approximately four to five hours per case), without compromising the quality or relevance of the results. Concentrating on these periods of greatest perceived discomfort allowed for a more efficient use of computational resources while maintaining alignment with respondent’s thermal experience.
2.4. Critical Points
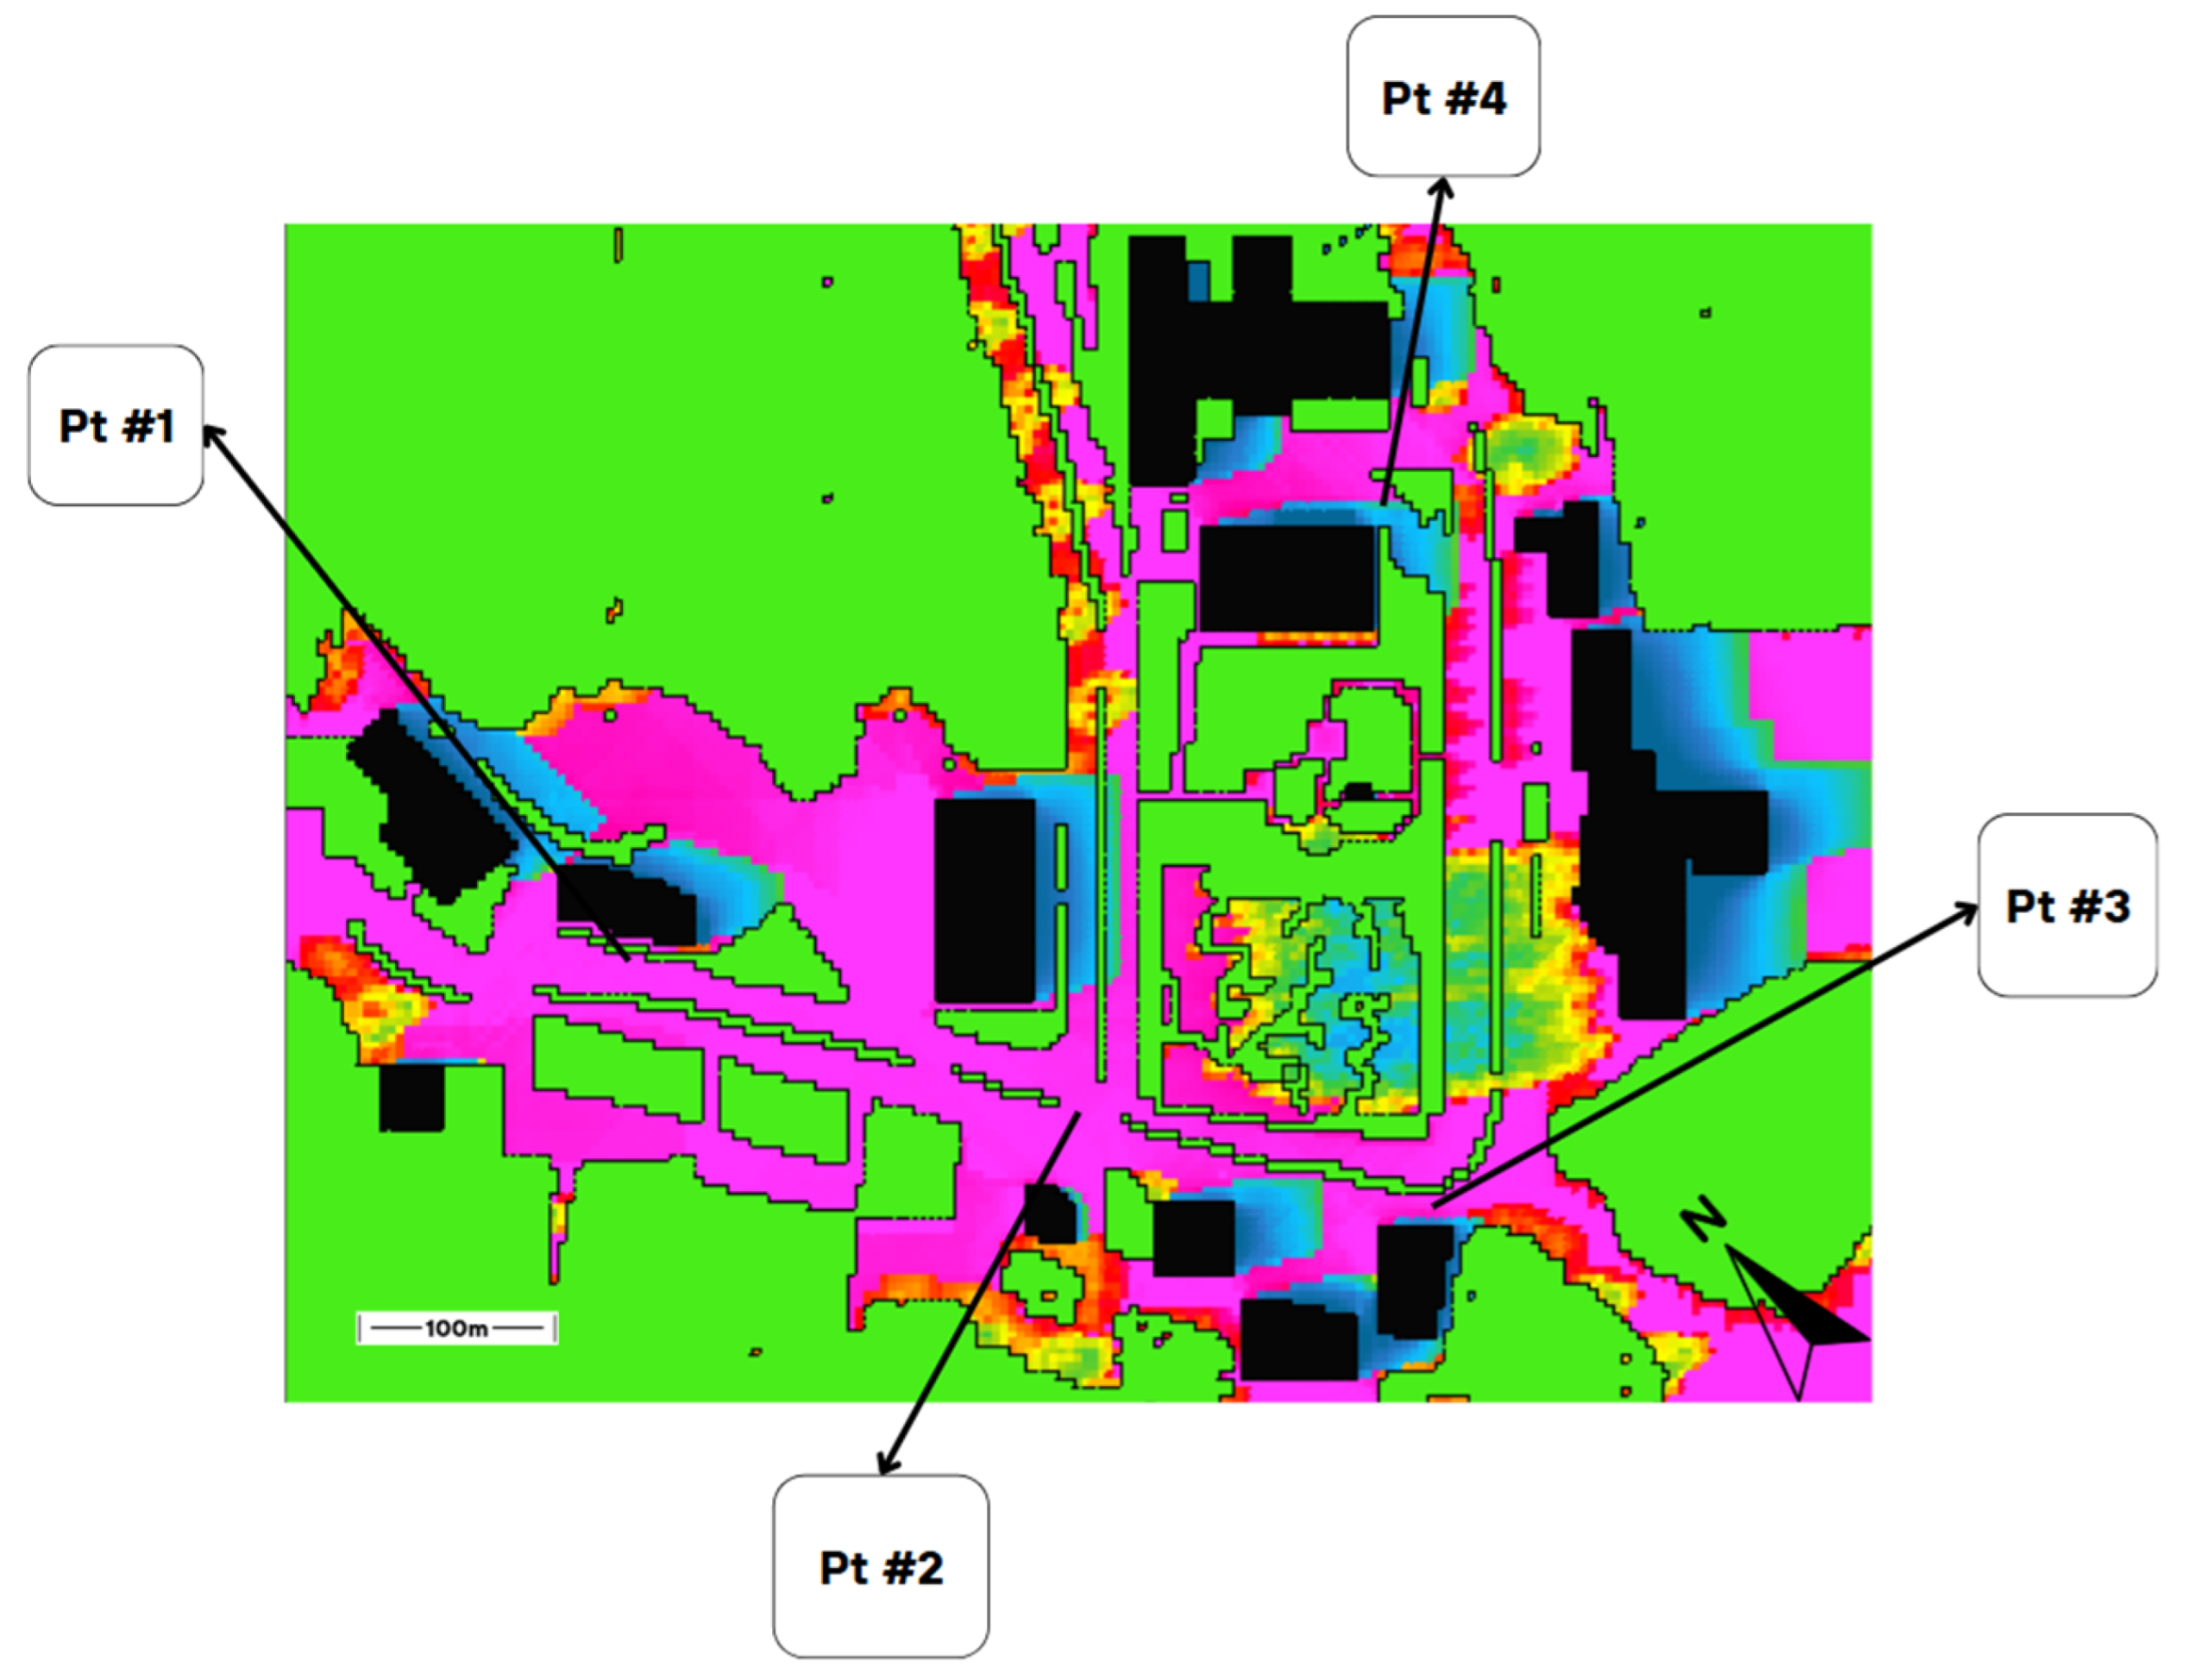
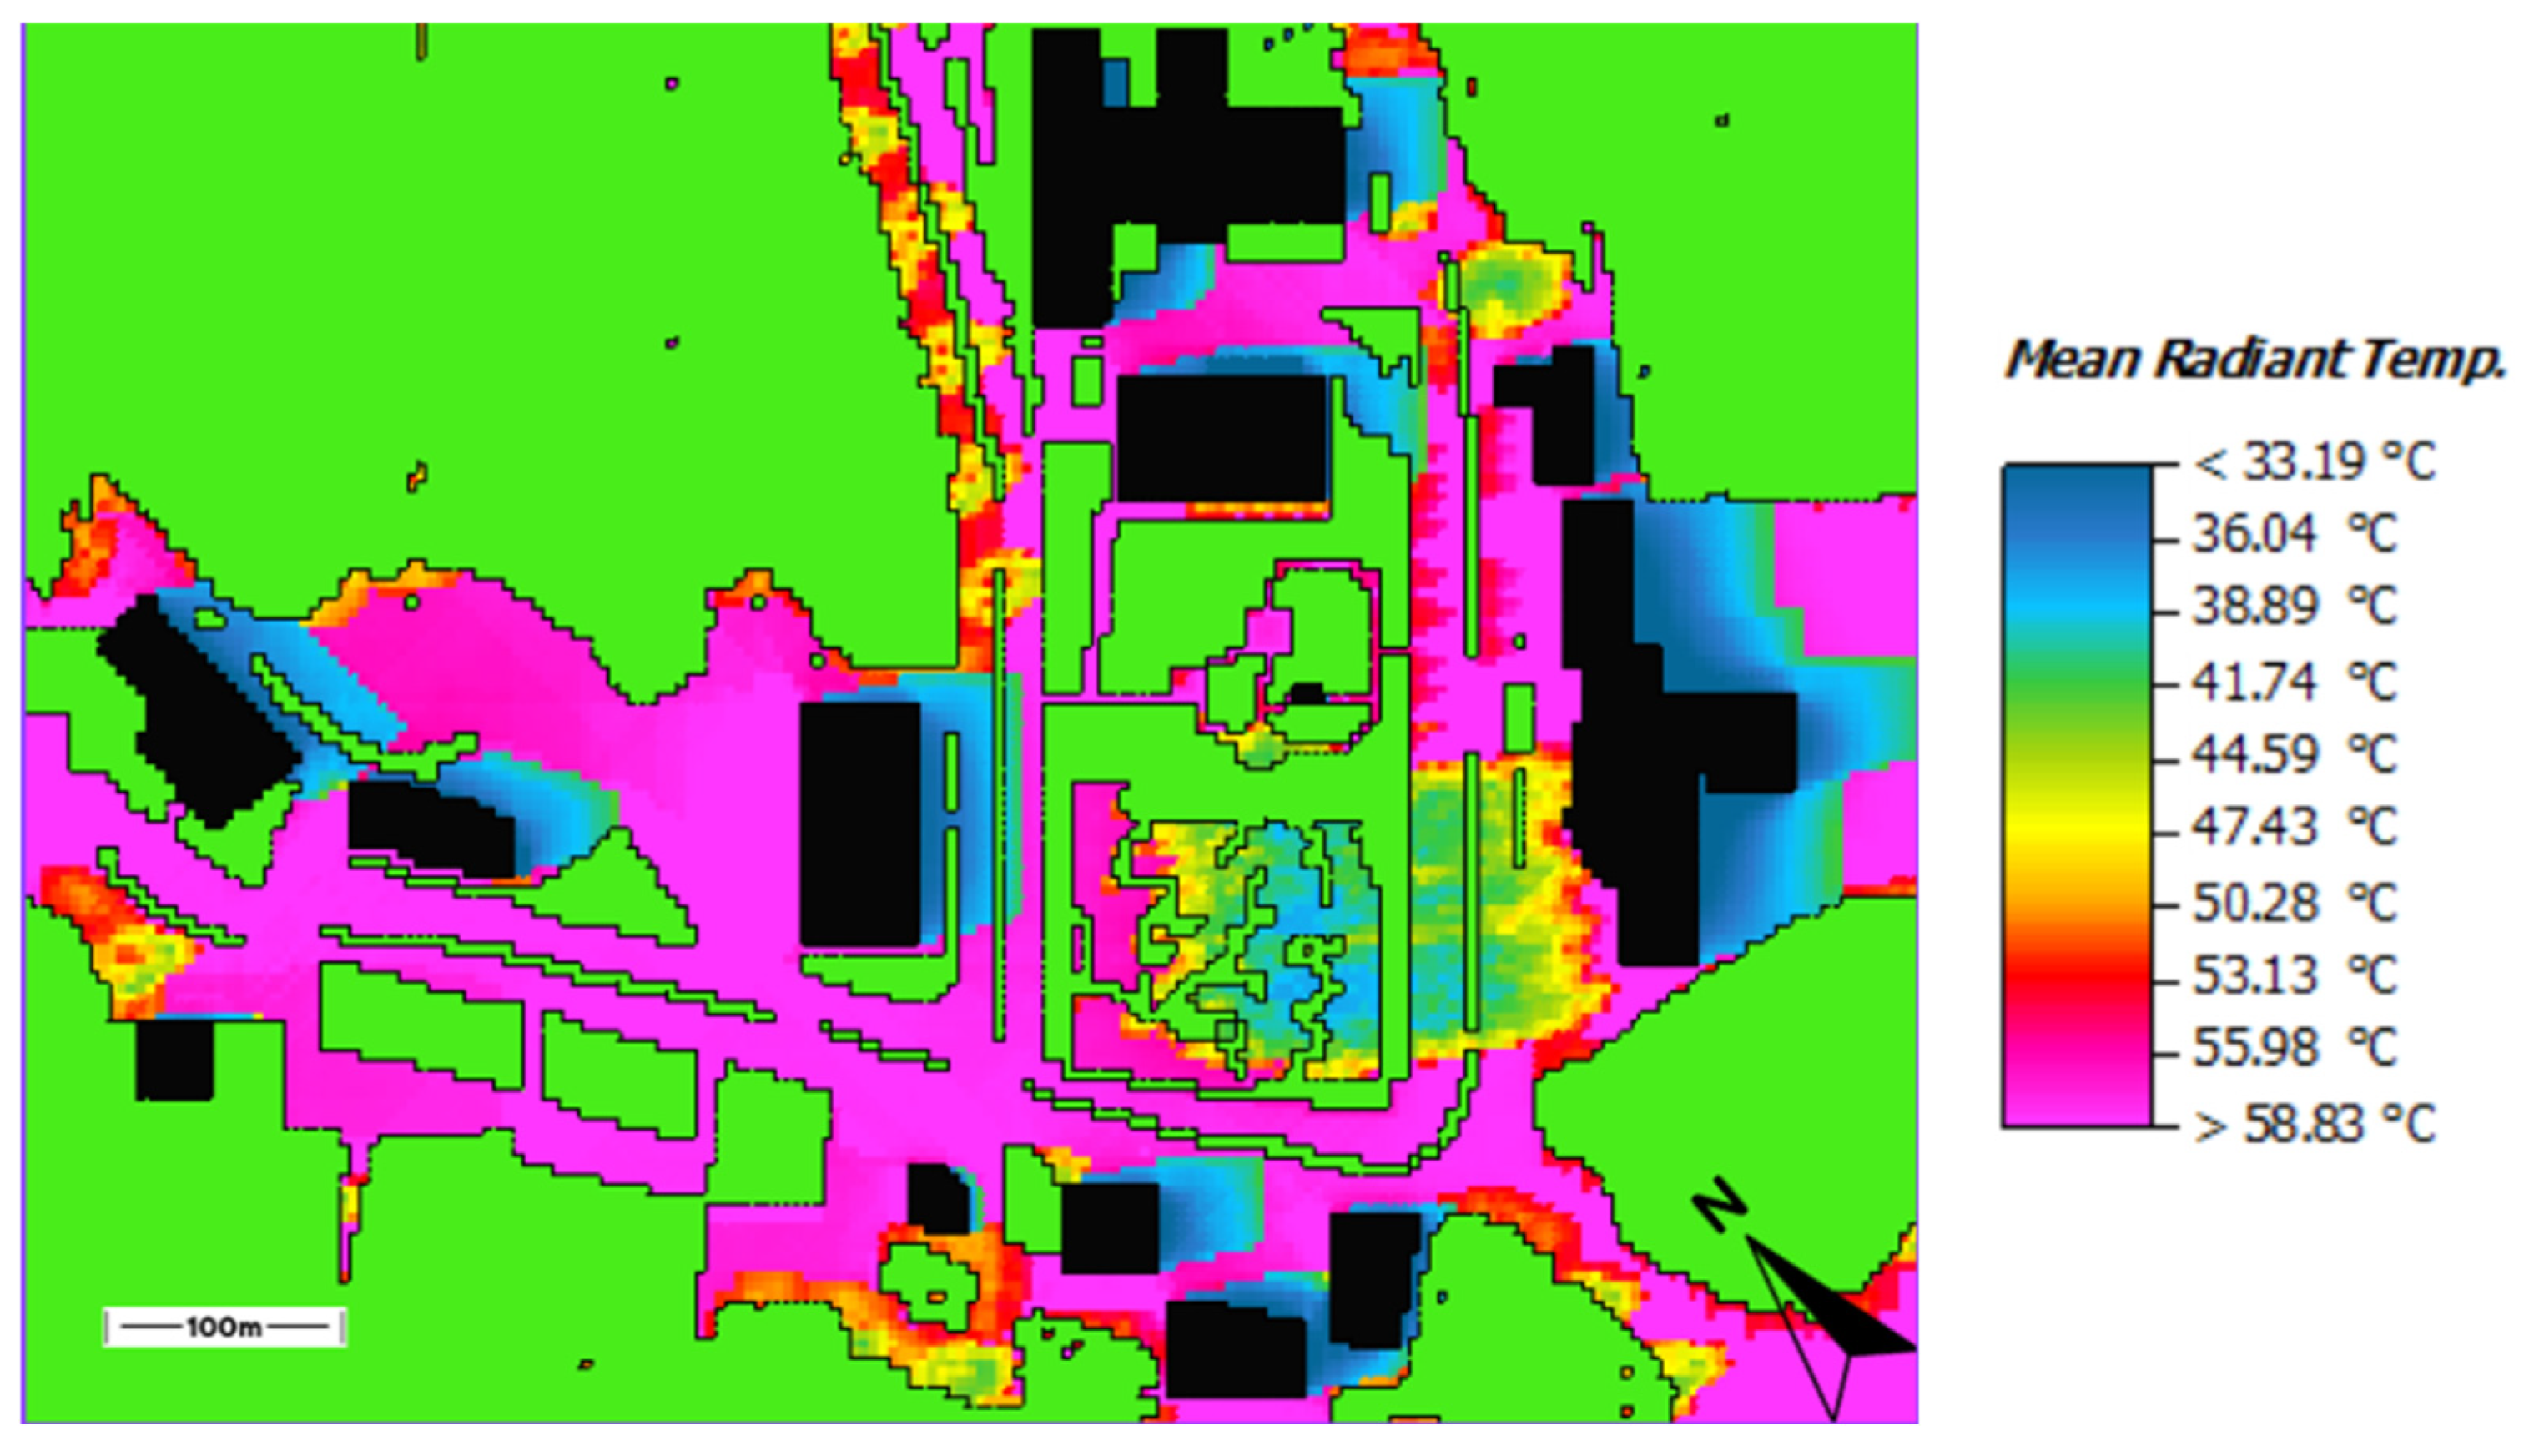
To identify critical temperature points, high-traffic areas or areas with little vegetation were selected, suitable for applying bioclimatic strategies. Preliminary simulations were performed on ENVI-met to check if temperatures exceeded ASHRAE-55’s comfort ranges or showed an out-of-comfort PET.
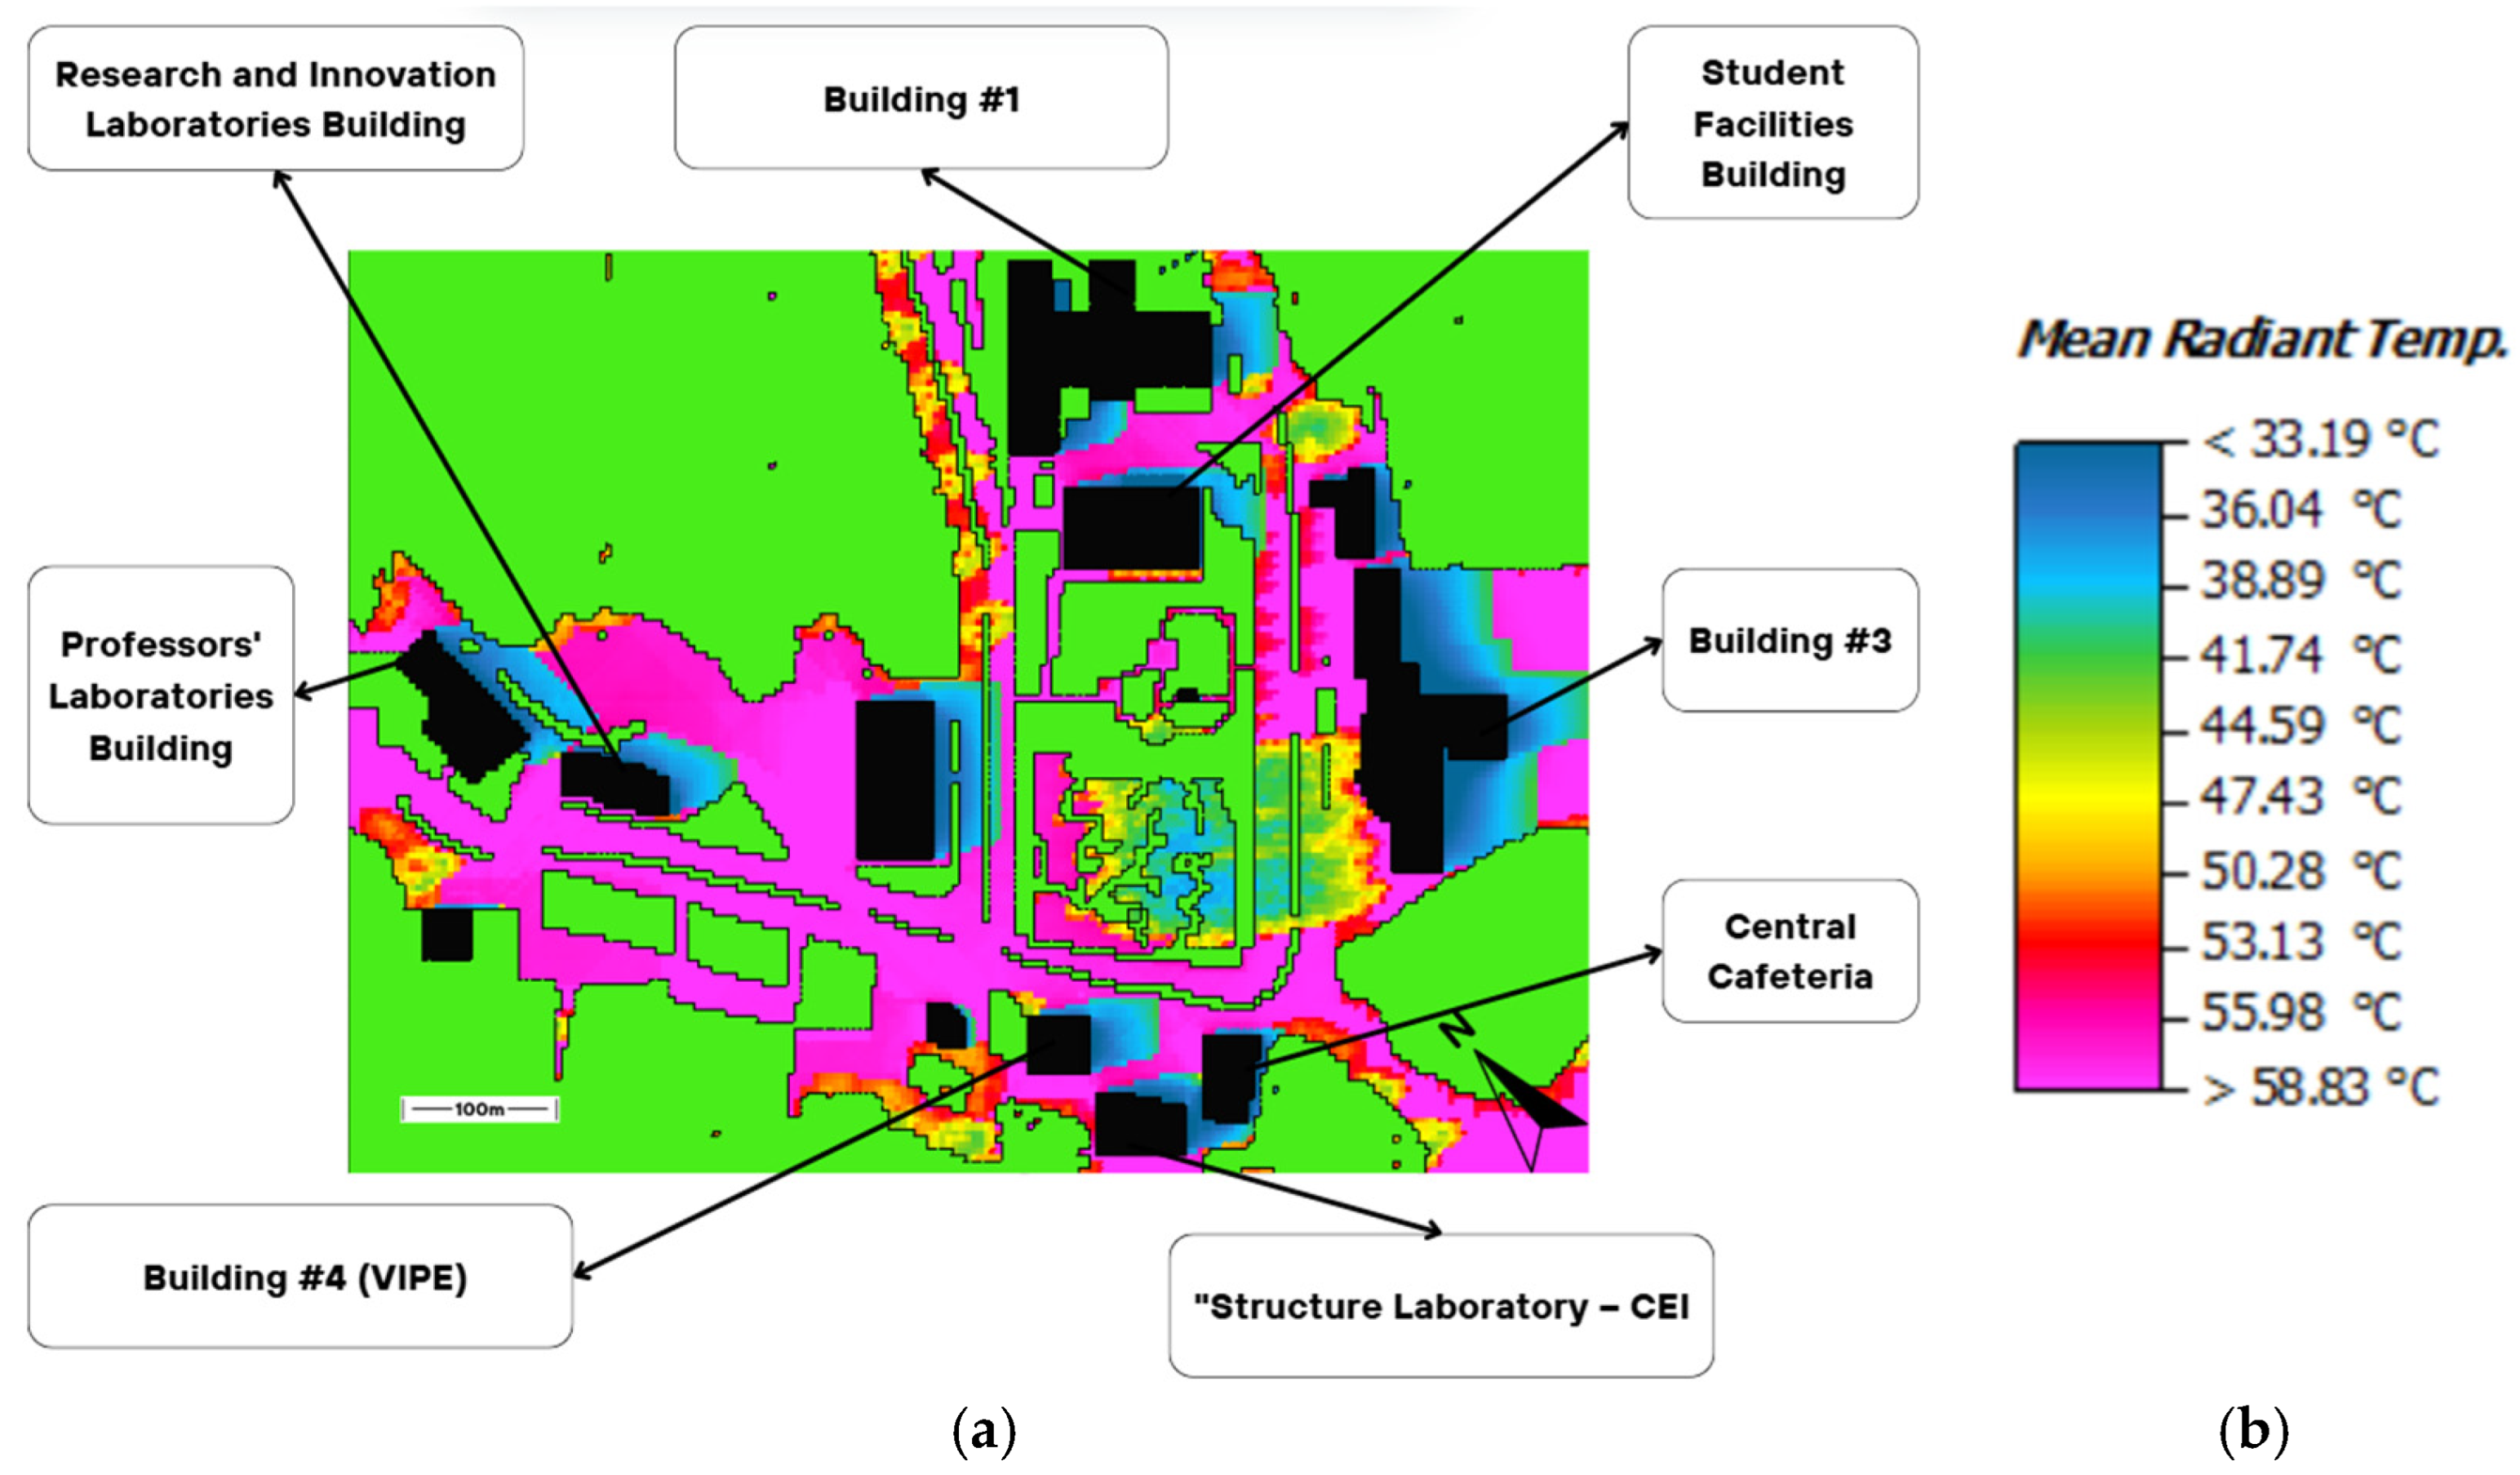
Figure 3a shows the results at 12:00 p.m. and a temperature range between 25.05 °C and 55 °C. Based on this, four critical points were chosen to further explore by making in situ measurements, shown in
Figure 4.
2.5. Validation
ENVI-met software is able to simulate the characteristics of a region’s climate just by entering its geographical coordinates. To validate the simulation results, in situ measurements were carried out in the study area using different instruments to record key variables between 11:45 a.m. and 12:15 p.m., coinciding with the radiant temperature peak observed in the simulations. During this period, the following variables were continuously measured over several days: air temperature, humidity, wind speed, and surface temperatures of concrete and albedo materials (in both sun and shade).
Figure 4 shows the points where these measurements were made.
The instrumentation we used consisted of a thermal imaging camera to measure the apparent surface temperature of materials, a unidirectional propeller anemometer to measure wind speed, and an air quality meter with which we measured relative humidity and air temperature.
Table 4 presents the characteristics of these instruments.
The thermal imaging camera was set to an emission of 0.95, indicating that it assumes objects emit 95% and reflect 5% of thermal radiation. Its reading stabilizes quickly, so it does not require much time [
31]. The unidirectional digital anemometer was used to measure wind speed, calculating the average in five-minute intervals due to wind variability. PCE-Ibérica’s Model 7755 CO
2 meter measures temperature, humidity, dew point, and wet bulb, using infrared NDIR technology to ensure stable and reliable readings, with a countdown to stabilize the measurement [
32].
2.5.1. Measurement Point 1
Measurement point 1 was located in front of the Research and Innovation Laboratories building. This point lacks any type of vegetation or any bioclimatic technique to mitigate high temperatures.
Figure 5a shows an image of this measurement point taken with the HT-18 thermal imaging camera and
Figure 5b shows an image of this same site, but taken with a digital camera, for comparison and orientation.
The first measurement point is the most critical point of temperatures, presenting surface temperatures of up to 59.4 °C. This point does not present any temperature mitigators, directly receiving the solar incidence and the reflected heat from the surrounding buildings.
2.5.2. Measurement Point 2
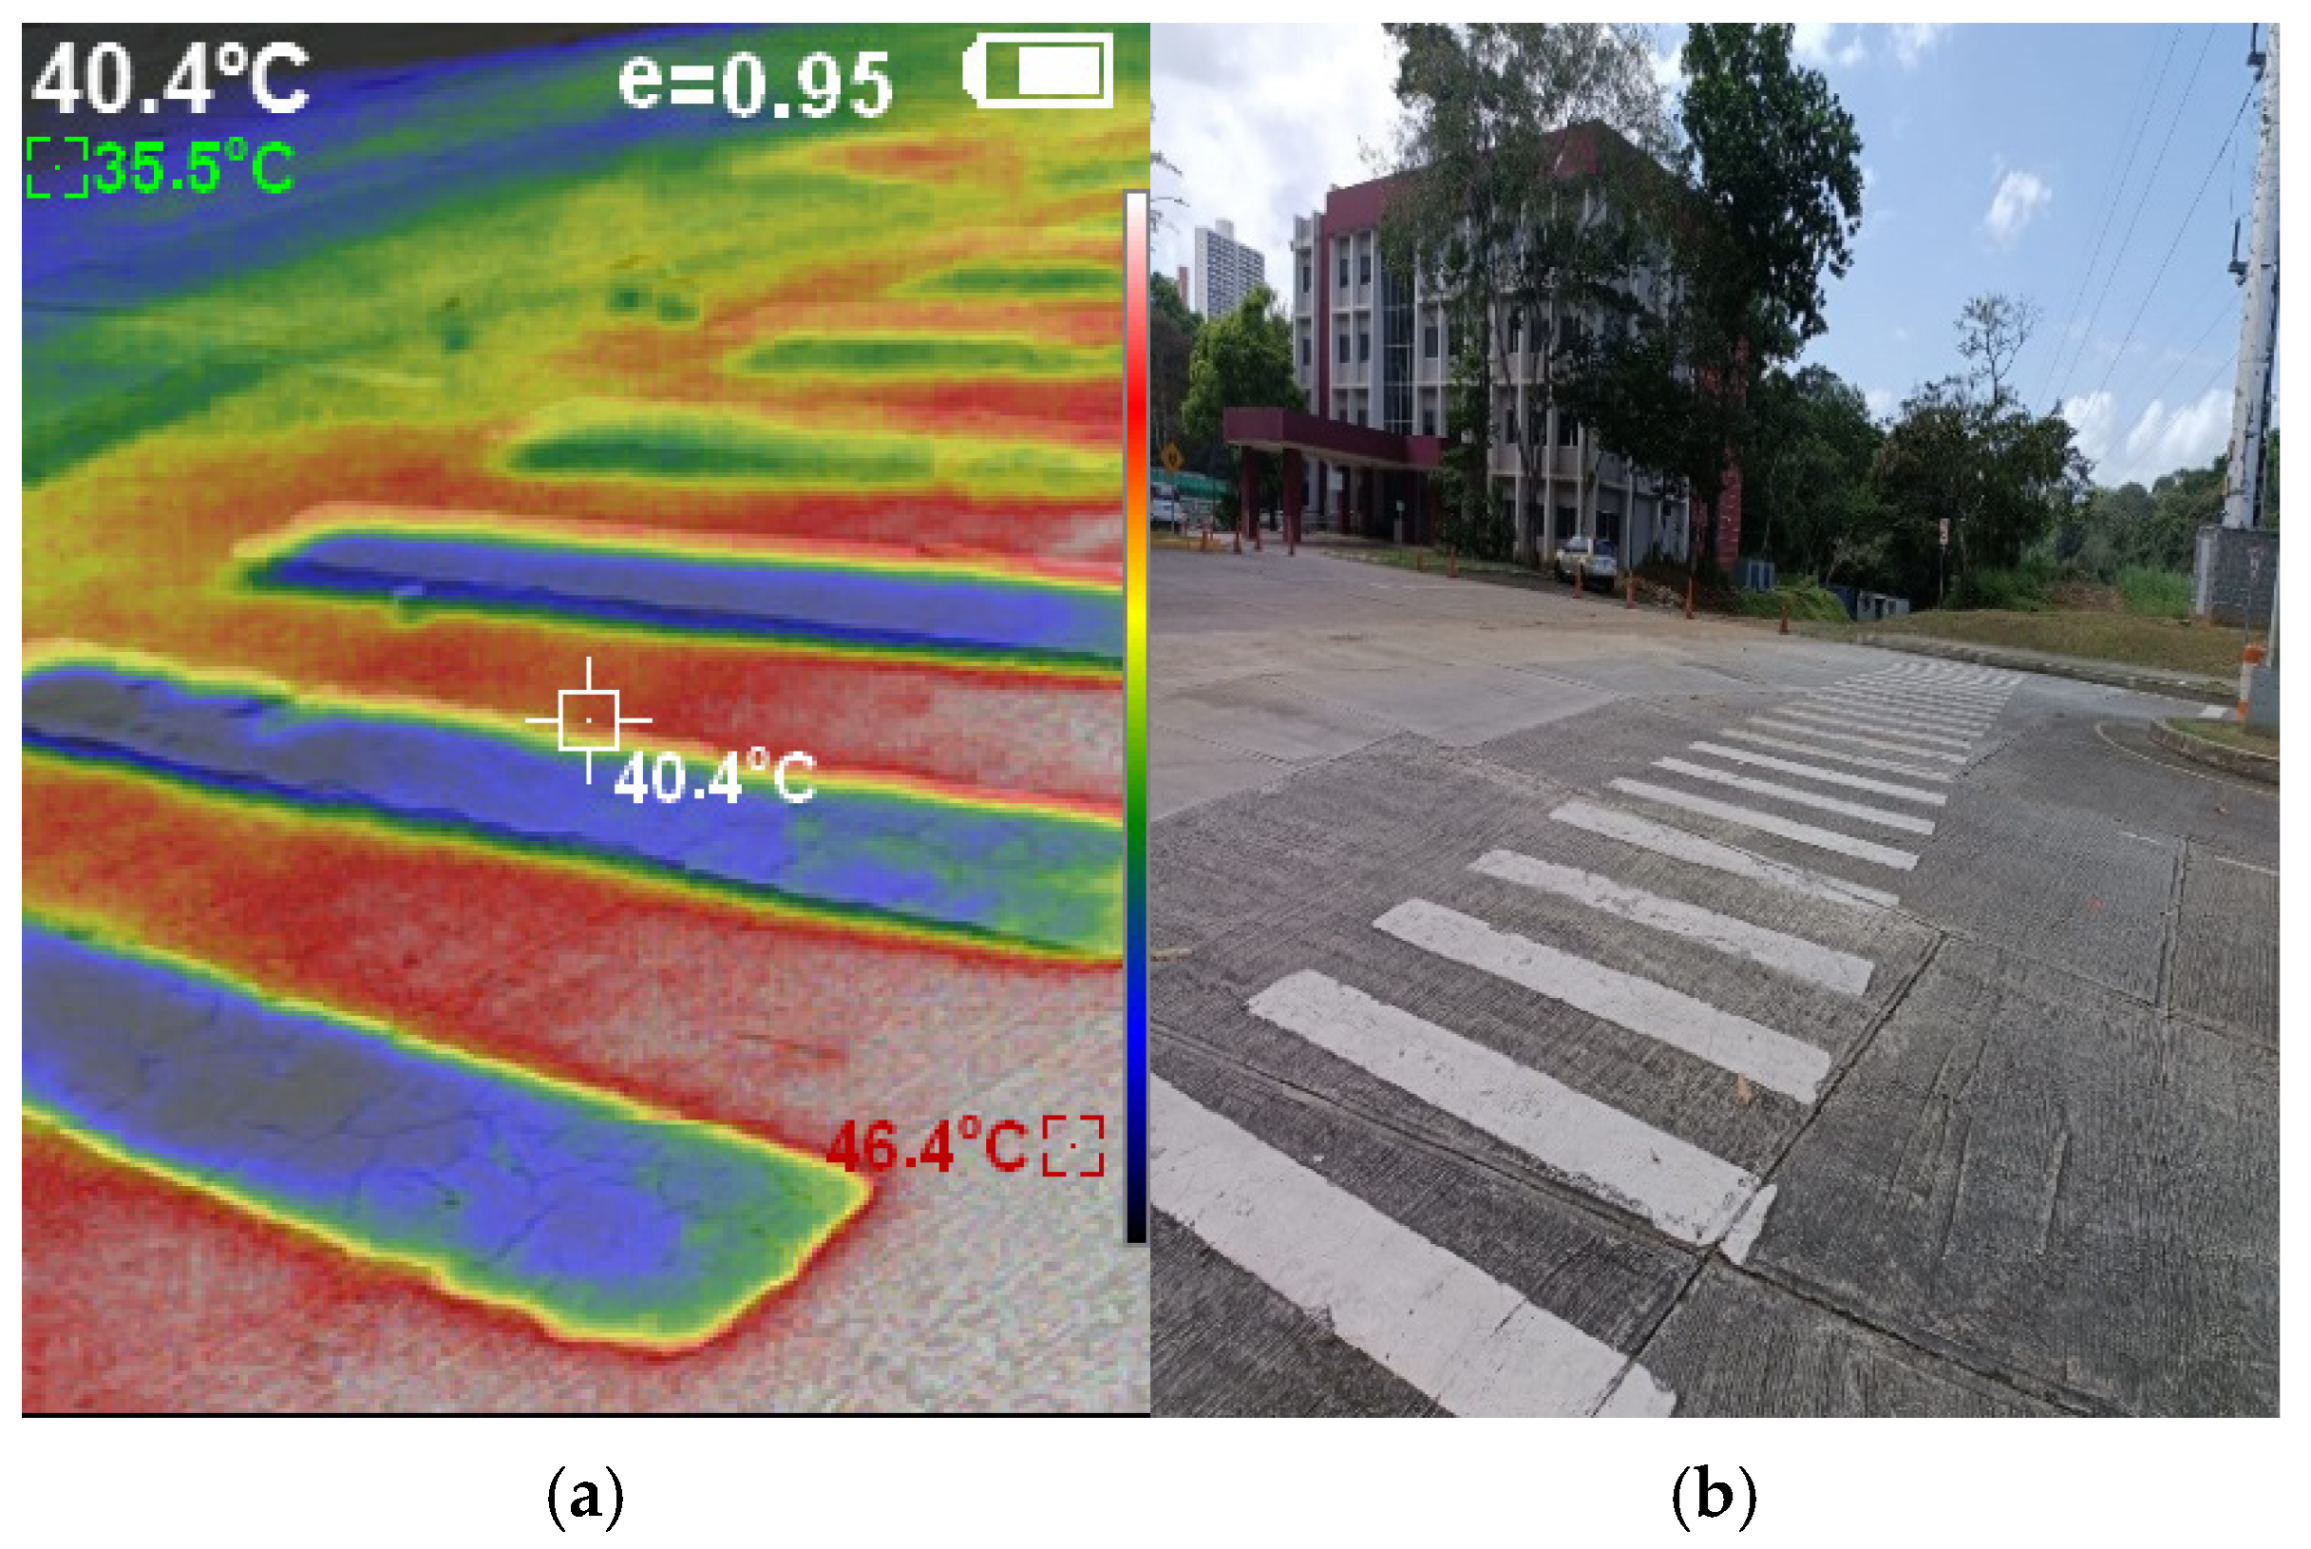
Measurement point 2 was located next to the intersection of the Vice-Rectory for Research, Postgraduate and Extension (VIPE) building and classroom building 4, a point that does not have any means to mitigate high temperatures.
Figure 6a shows an image of this measurement point taken with the thermal imaging camera, and
Figure 6b shows an image of this same site with a digital camera for comparison and orientation.
This point, similar to the first, does not present any temperature mitigation either, except that the surrounding buildings are further away and have the presence of a mass of trees at a lower level than the first one.
2.5.3. Measurement Point 3
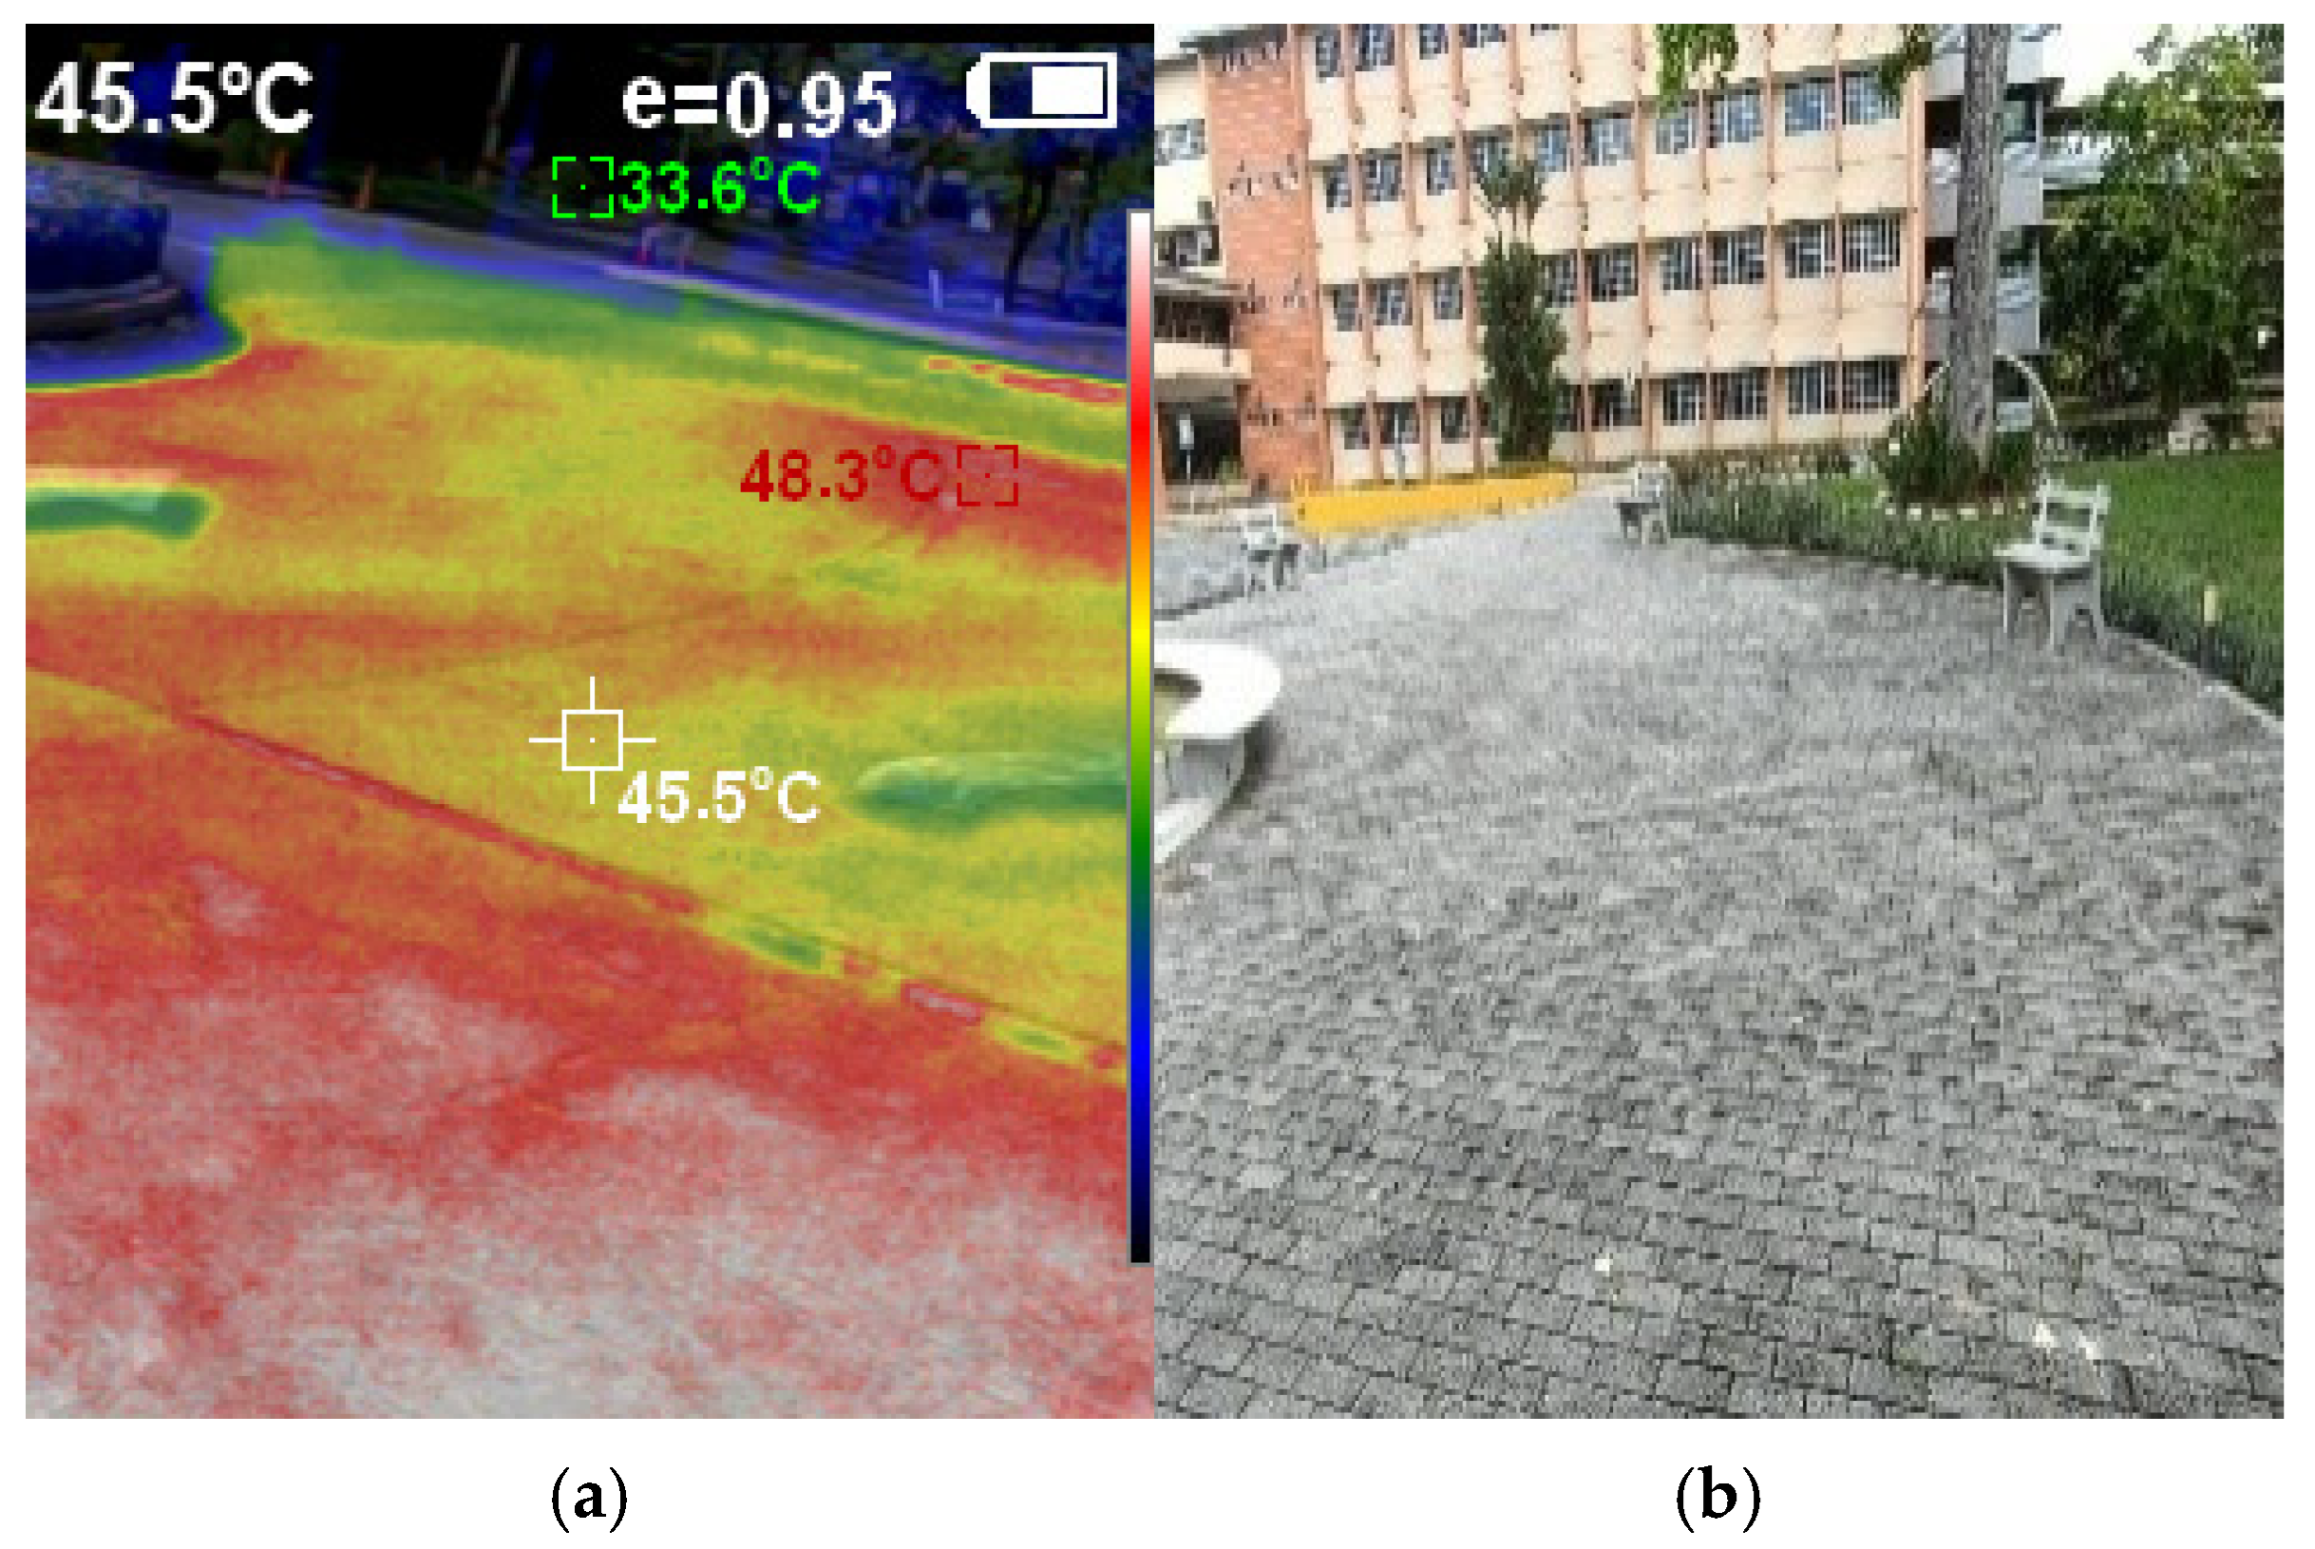
Measurement point 3 was located in front of the central cafeteria. It has some vegetation, but the conditions are still uncomfortable at certain times of the day.
Figure 7a shows an image of this measurement point taken with the thermal imaging camera and
Figure 7b shows the images of this same site, but taken with a digital photographic camera for comparison and orientation.
Even though a section of vegetation was not shaded, the difference with the shaded part is not relevant. On the other hand, concrete areas have temperatures 10 °C higher.
2.5.4. Measurement Point 4
Measurement point 4 was located next to the new flagpole area, where a paved path has been made for people to walk through.
Figure 8a shows the image of this measurement point taken with a thermal imaging camera and
Figure 8b shows the image of this same site, but taken with a digital camera for comparison and orientation.
This area is more exposed to high temperatures because it does not present any shade element in the transit area. Surface temperatures of 48 °C lie completely outside comfortable temperatures. The variable after the MRT is the variable that most affects the thermal sensation and therefore the PET.
The measurements carried out served to validate the simulations of the base scenario, modeled in ENVI-met. ENVI-met software is capable of recreating the weather conditions of a particular day that it is set to. Based on this, simulations were performed to match the in situ measurements taken on the same days.
Figure 9 presents the results corresponding to simulation day 9.
Figure 9 shows the simulation for day 9, the day with the most critical temperatures, as found in the in situ measurements and replicated in this simulation. During the campaign, a total of ten days of field measurements were conducted, from which day 9 was selected because it presented the highest air temperatures and PET values. This approach, often referred to as a critical day or worst-case scenario selection, allows the evaluation of bioclimatic strategies under peak stress conditions. By simulating the most demanding scenario, the potential benefits of the interventions can be quantified more robustly, ensuring that if improvements are achieved under the worst conditions, their effectiveness will also extend to milder periods. The figures above are presented in sequence to illustrate the evolution of the study area from its selection and spatial delimitation, through the identification of key locations, to its final representation in the simulation model.
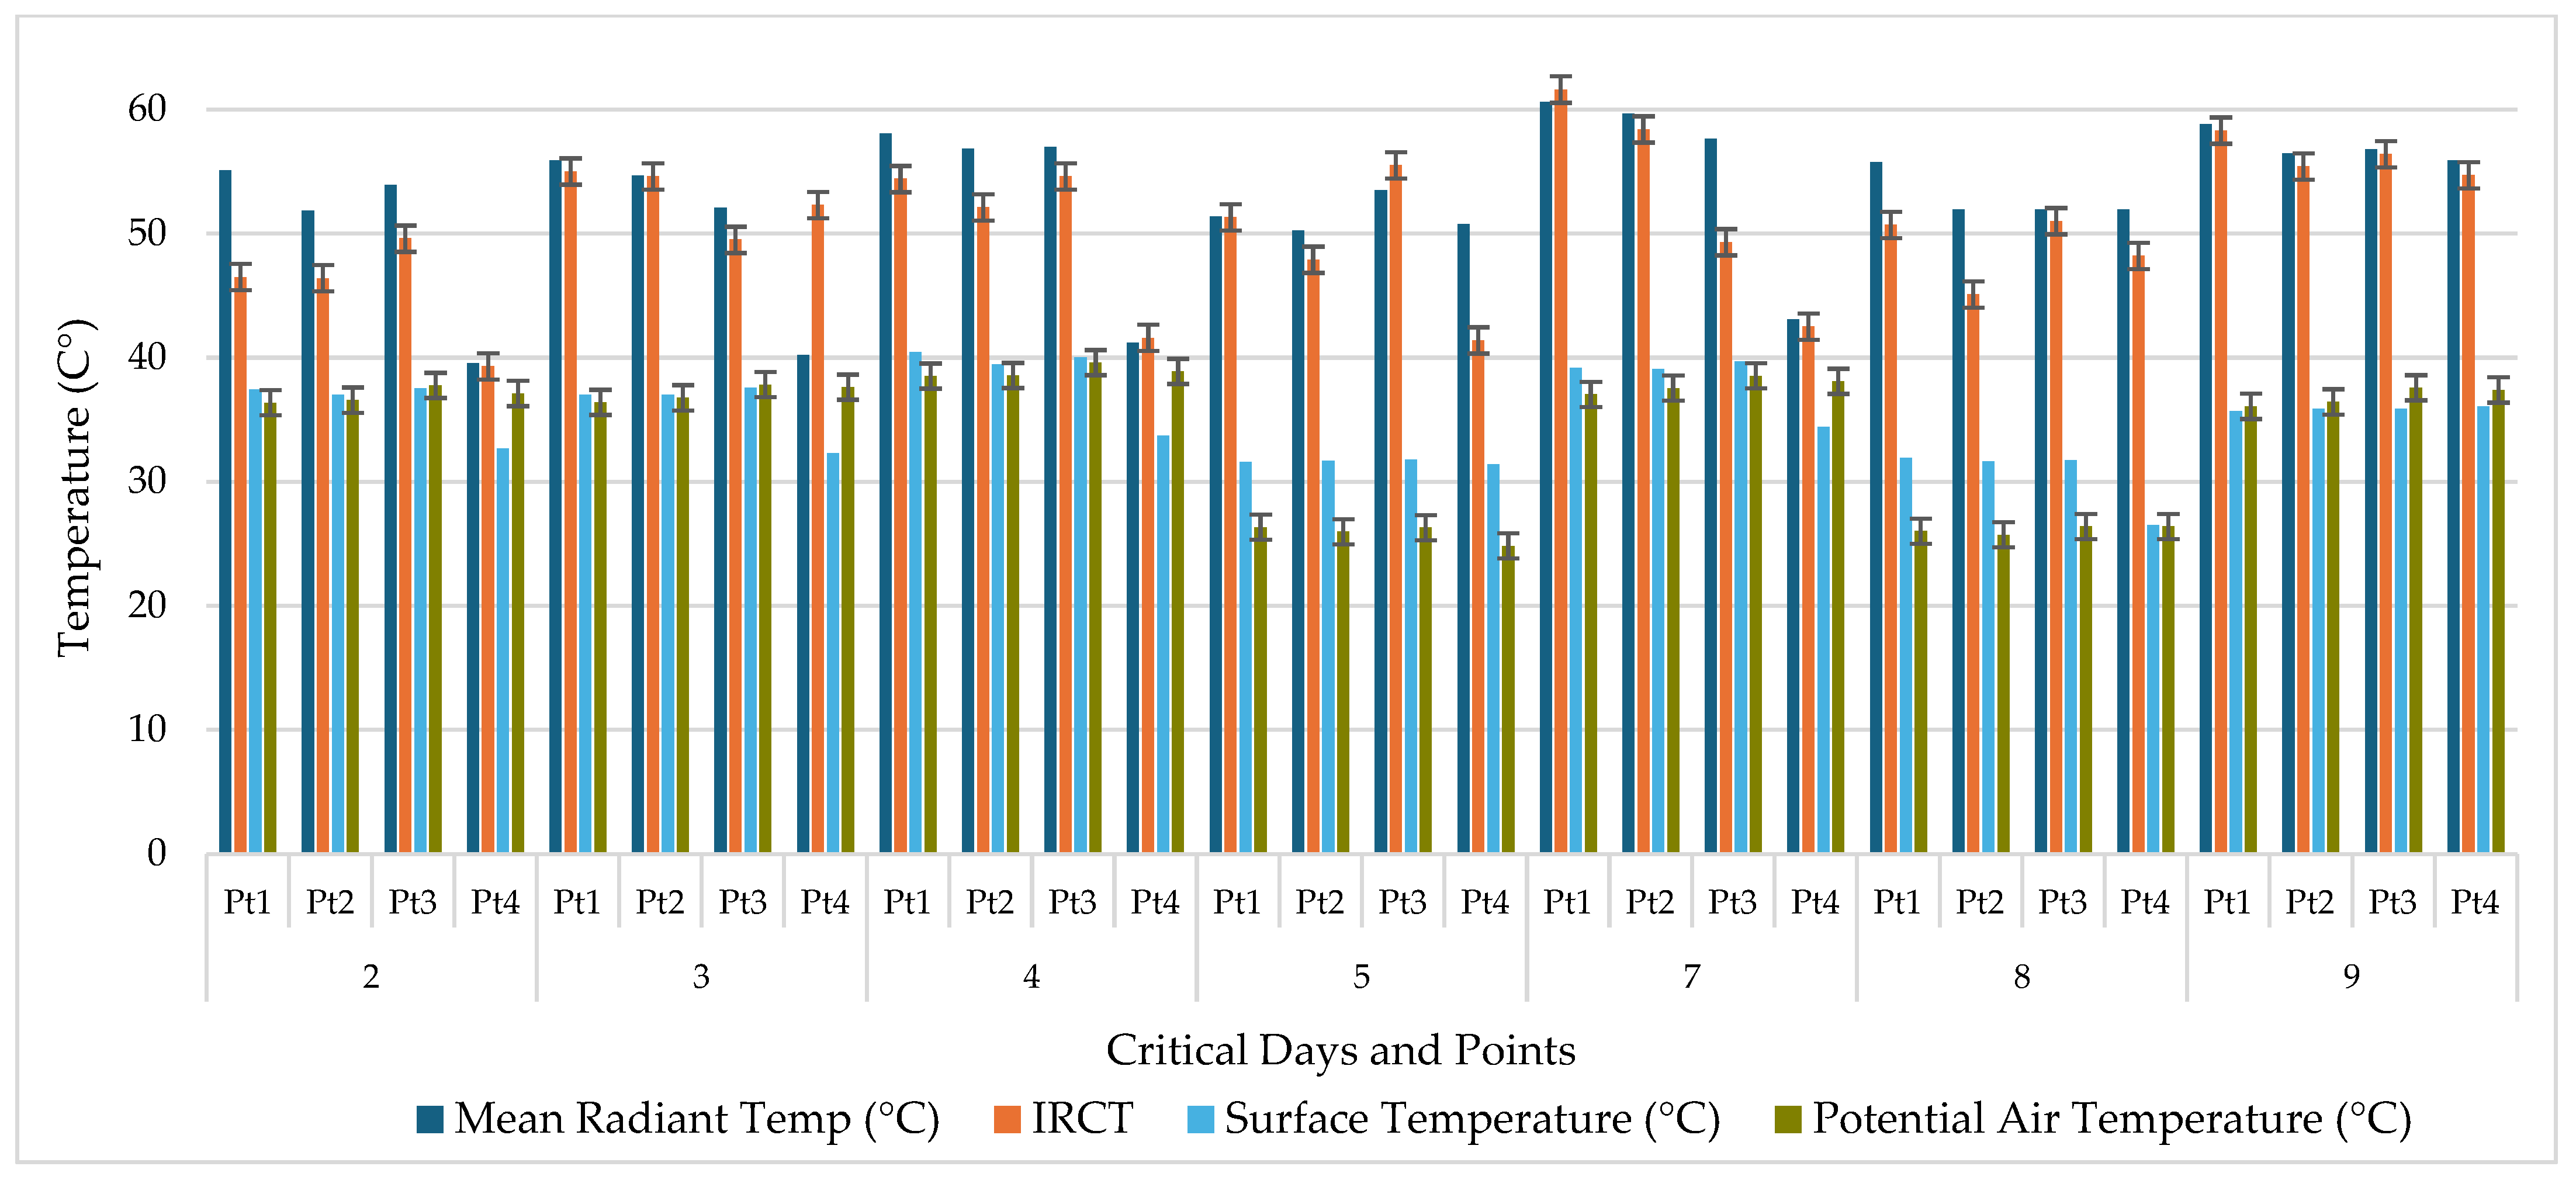
Figure 10 shows temperatures from different days of in situ measurements at the four critical measurement points, and in these results, we can see the similarity between the temperatures of the simulations carried out in ENVI-met. The blue, sky-blue, and dark green columns represent simulations and the orange columns correspond to the in situ measurements.
In this figure, we can observe how the ENVI-met simulation results align closely with the in situ measurements. The simulated mean radiant temperature (MRT) values were also contrasted with IRCT readings obtained using a thermographic camera. Although these two parameters differ in their physical basis, MRT being a volumetric average and IRCT representing surface level radiation, they are conceptually linked and useful for validation. The average differences between MRT and IRCT values across the four reference points for each day were as follows: day 2 (4.64 °C), day 3 (−2.14 °C), day 4 (2.59 °C), day 5 (2.41 °C), day 7 (2.30 °C), day 8 (3.13 °C), and day 9 (0.76 °C). The MRT results remained within an acceptable range, supporting the reliability of the simulation as a tool for evaluating outdoor thermal comfort in the study area. These minor discrepancies fell within the range reported in previous studies, which found variations between simulated and measured temperatures ranging from 1.2 °C to 2.6 °C [
13]. Such differences are often attributed to the influence of local surface materials, vegetation density, surface emissivity, cloud cover, and localized shading, which may not be captured with absolute precision in the simulation environment. Despite this, the results confirm the reliability of the ENVI-met model in reproducing real microclimatic conditions within acceptable error margins, particularly under the conditions of a tropical urban context. The error bars shown in each column correspond to the standard error of the mean. These provide a statistical estimate of the reliability of each measurement by reflecting the dispersion of repeated data points. Smaller bars indicate higher consistency and precision in the observed values. These differences confirm the expected distinction between measured and simulated data: while field measurements capture the dynamic complexity of the environment, simulations offer a more stable representation. The combined use of both approaches, supported by statistical error analysis, strengthens the validity of the thermal comfort evaluation.
2.6. Surveys
The surveys were key to contrasting the ENVI-met simulations, allowing the thermal sensation perceived by pedestrians to be compared with the simulated results and in situ measurements. Their structure was informed by several bibliographic sources that contributed methodological and conceptual frameworks for evaluating outdoor thermal comfort in urban environments. The guidelines provided by ASHRAE [
33] served as the foundation for defining thermal comfort thresholds and scales, while the approach to subjective evaluation in humid tropical conditions was inspired by studies on dry mist systems and pedestrian comfort in warm climates [
16]. Similarly, Ulpiani et al. [
34] and Zhang et al. [
35] applied field surveys to assess thermal perception in public spaces affected by evaporative cooling techniques, contributing to the design of specific perception-related questions. A practical reference was taken into account for structuring the survey format and evaluating user experience during temporary interventions in outdoor spaces [
36]. Based on these sources, the final instrument consisted of 25 questions related to thermal sensation, comfort, wind chill, and other influential variables. The surveys were applied between January and July 2024, focusing on the hottest months of the year, though extended to July due to administrative delays. This methodology enabled a comprehensive assessment of thermal perception during the dry season.
The survey was reviewed by the bioethics committee of the Technological University of Panama [
37], which determined that the protocol with identification number P-CIBio-016-2024 titled “Study of the synergistic effect of bioclimatic strategies to improve the microclimate: numerical–experimental approach at the university campus scale” qualifies as exemption.
These responses were then pretreated and entered into IBM SPSS software version 23 to determine the correlations that these variables had with the comfort and thermal sensation of pedestrians on campus. To calculate the population needed to attain statistical significance, we used the following Equation (1) [
38]:
where
is the sample size.
It is the level of confidence,
is the proportion of the population with desired characteristics,
is the proportion of the population without desired characteristics,
is the level of error tolerated, and
it is the size of the population. The General Directorate of University Planning Department of Statistics and Indicators of the Technological University of Panama indicated that 17,287 students were enrolled in the first semester at the Panama campus. Based on a 5% margin of error (
), the calculated sample size was
.
In this survey, people expressed their feelings about the environment in this time period. This allowed us to make a statistical analysis on the correlations between the variables that affect comfort and thermal sensation and their similarity to the comfort indices obtained in the simulations. The content of the survey mainly comprised the following.
This first step included the informed consent form, as required by the bioethics committee. It contained information such as the participant’s university affiliation, age, gender, and physical build.
This section collected information related to participants’ exposure time on campus, including their average duration of stay, time range during the day, presence during the months relevant to the analysis, and the specific campus areas most frequently visited.
Here, the person expressed what type of clothing they usually wear and what level of sweating they feel.
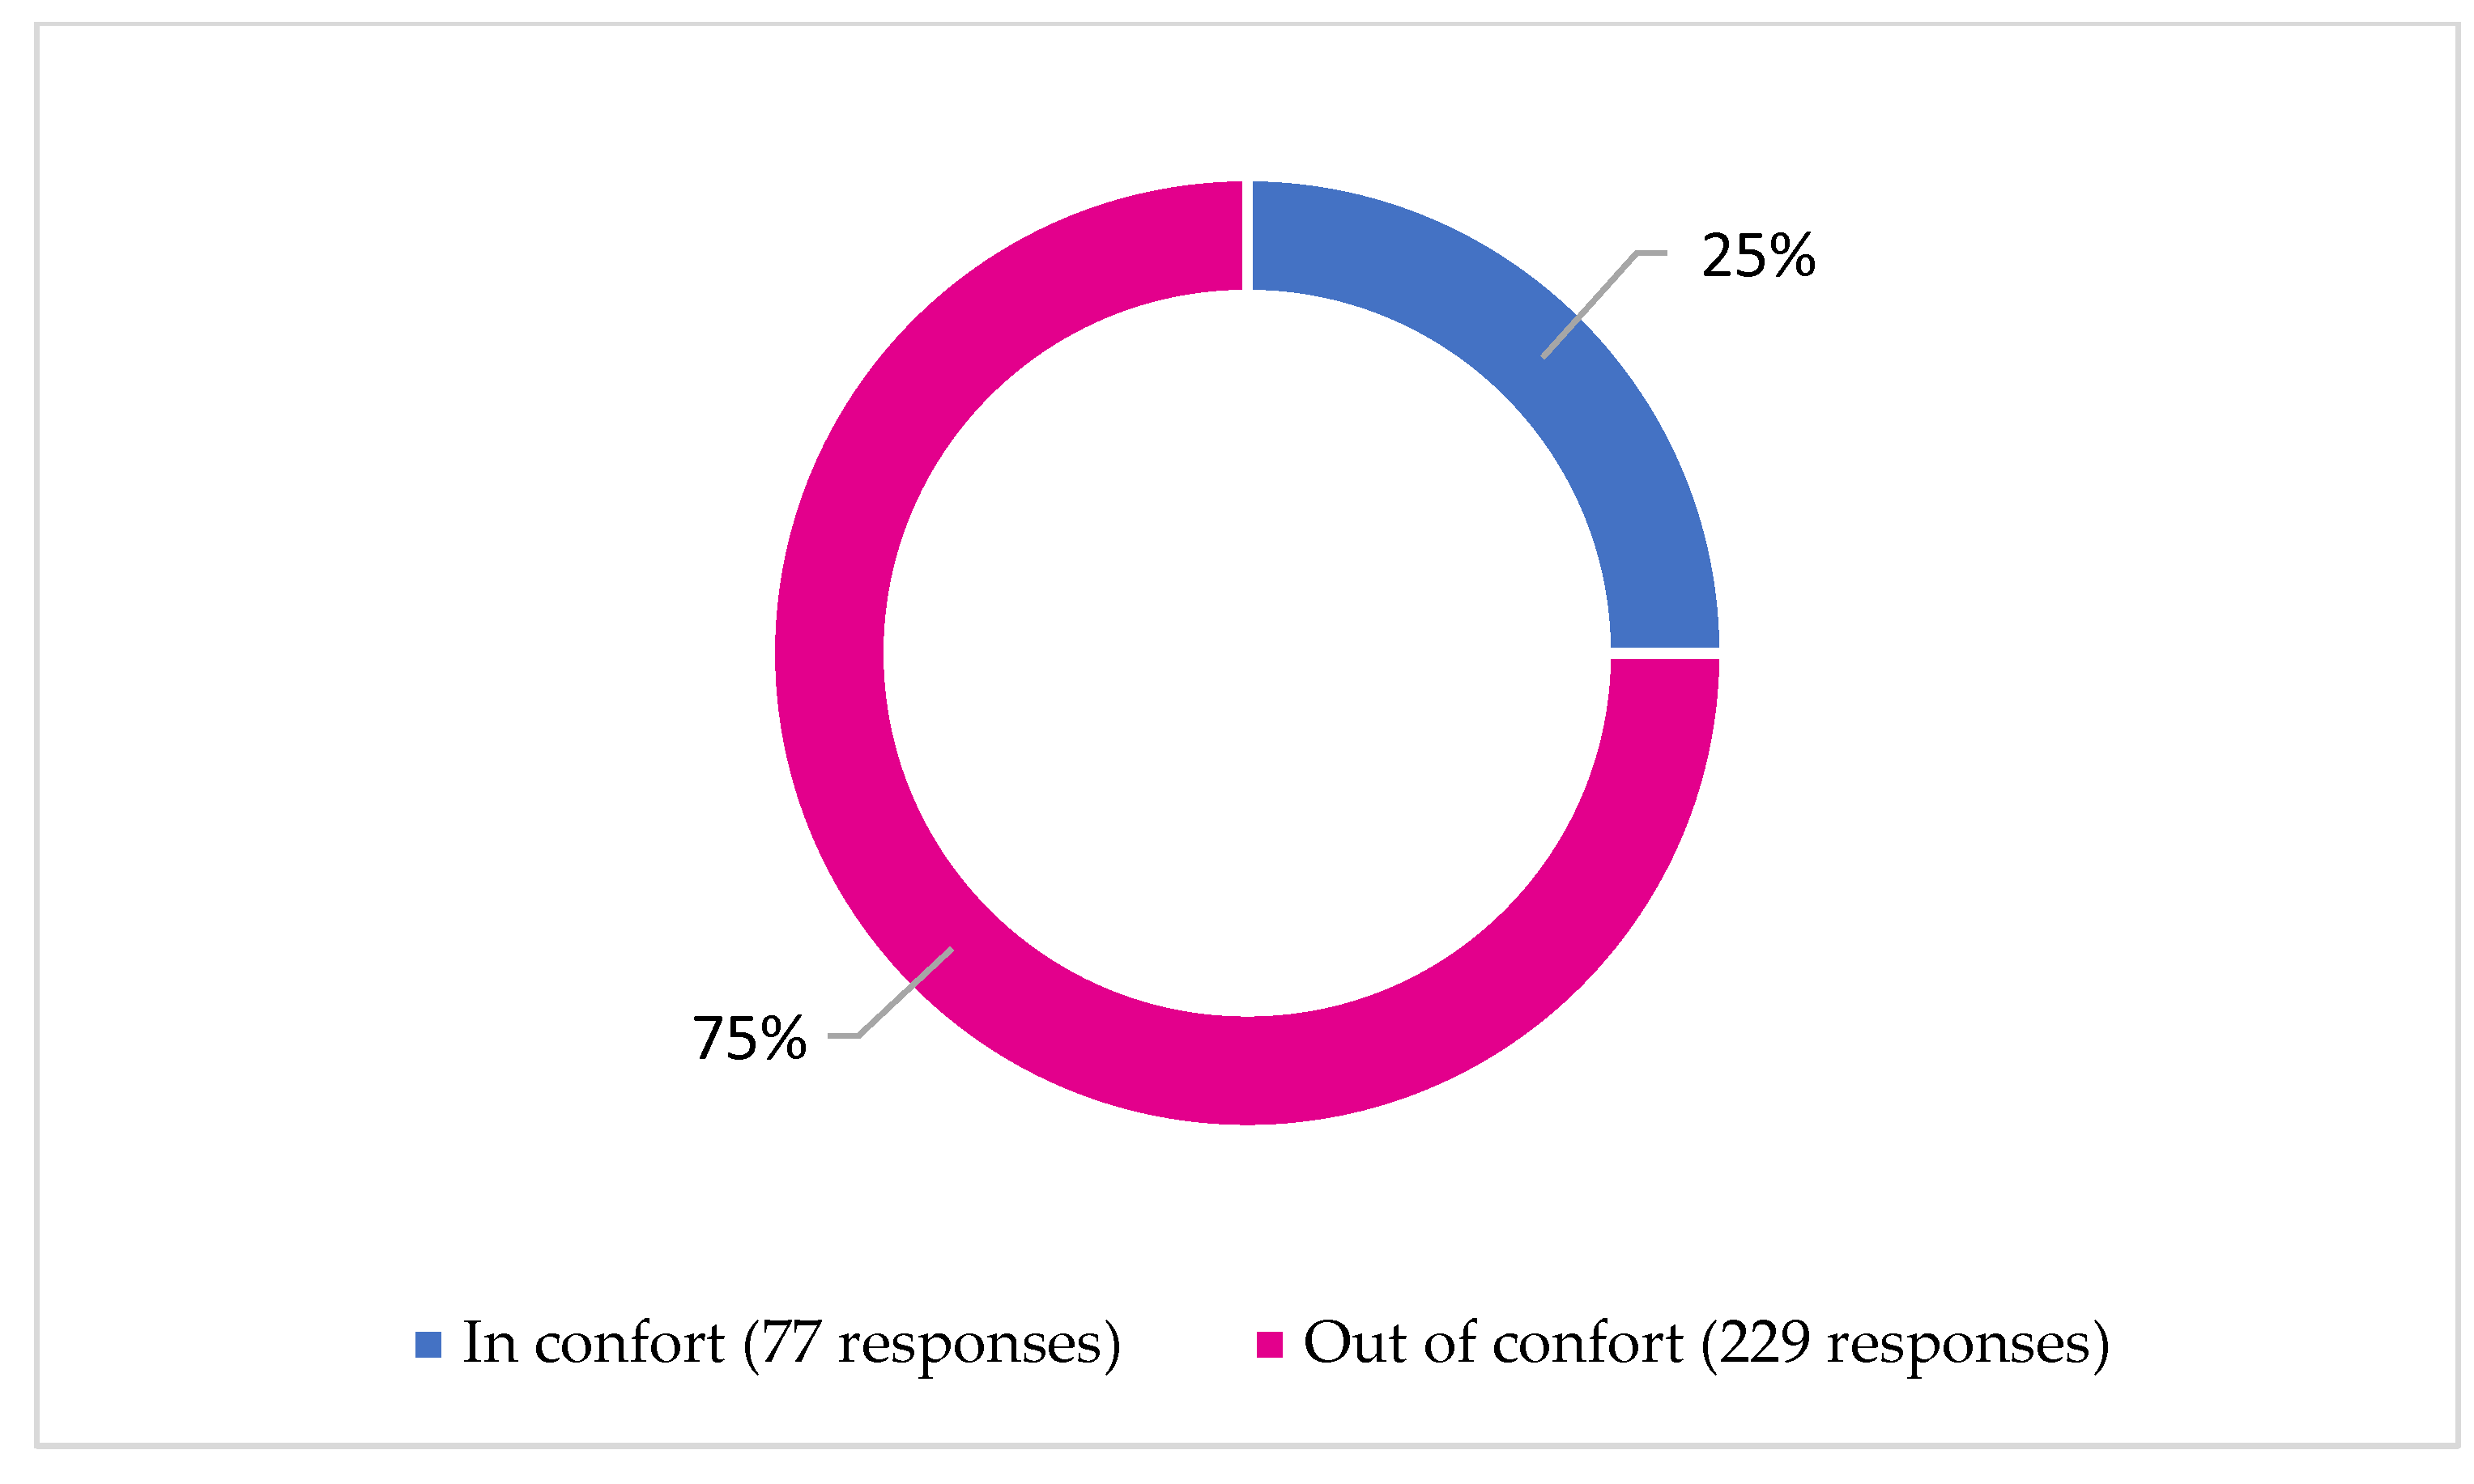
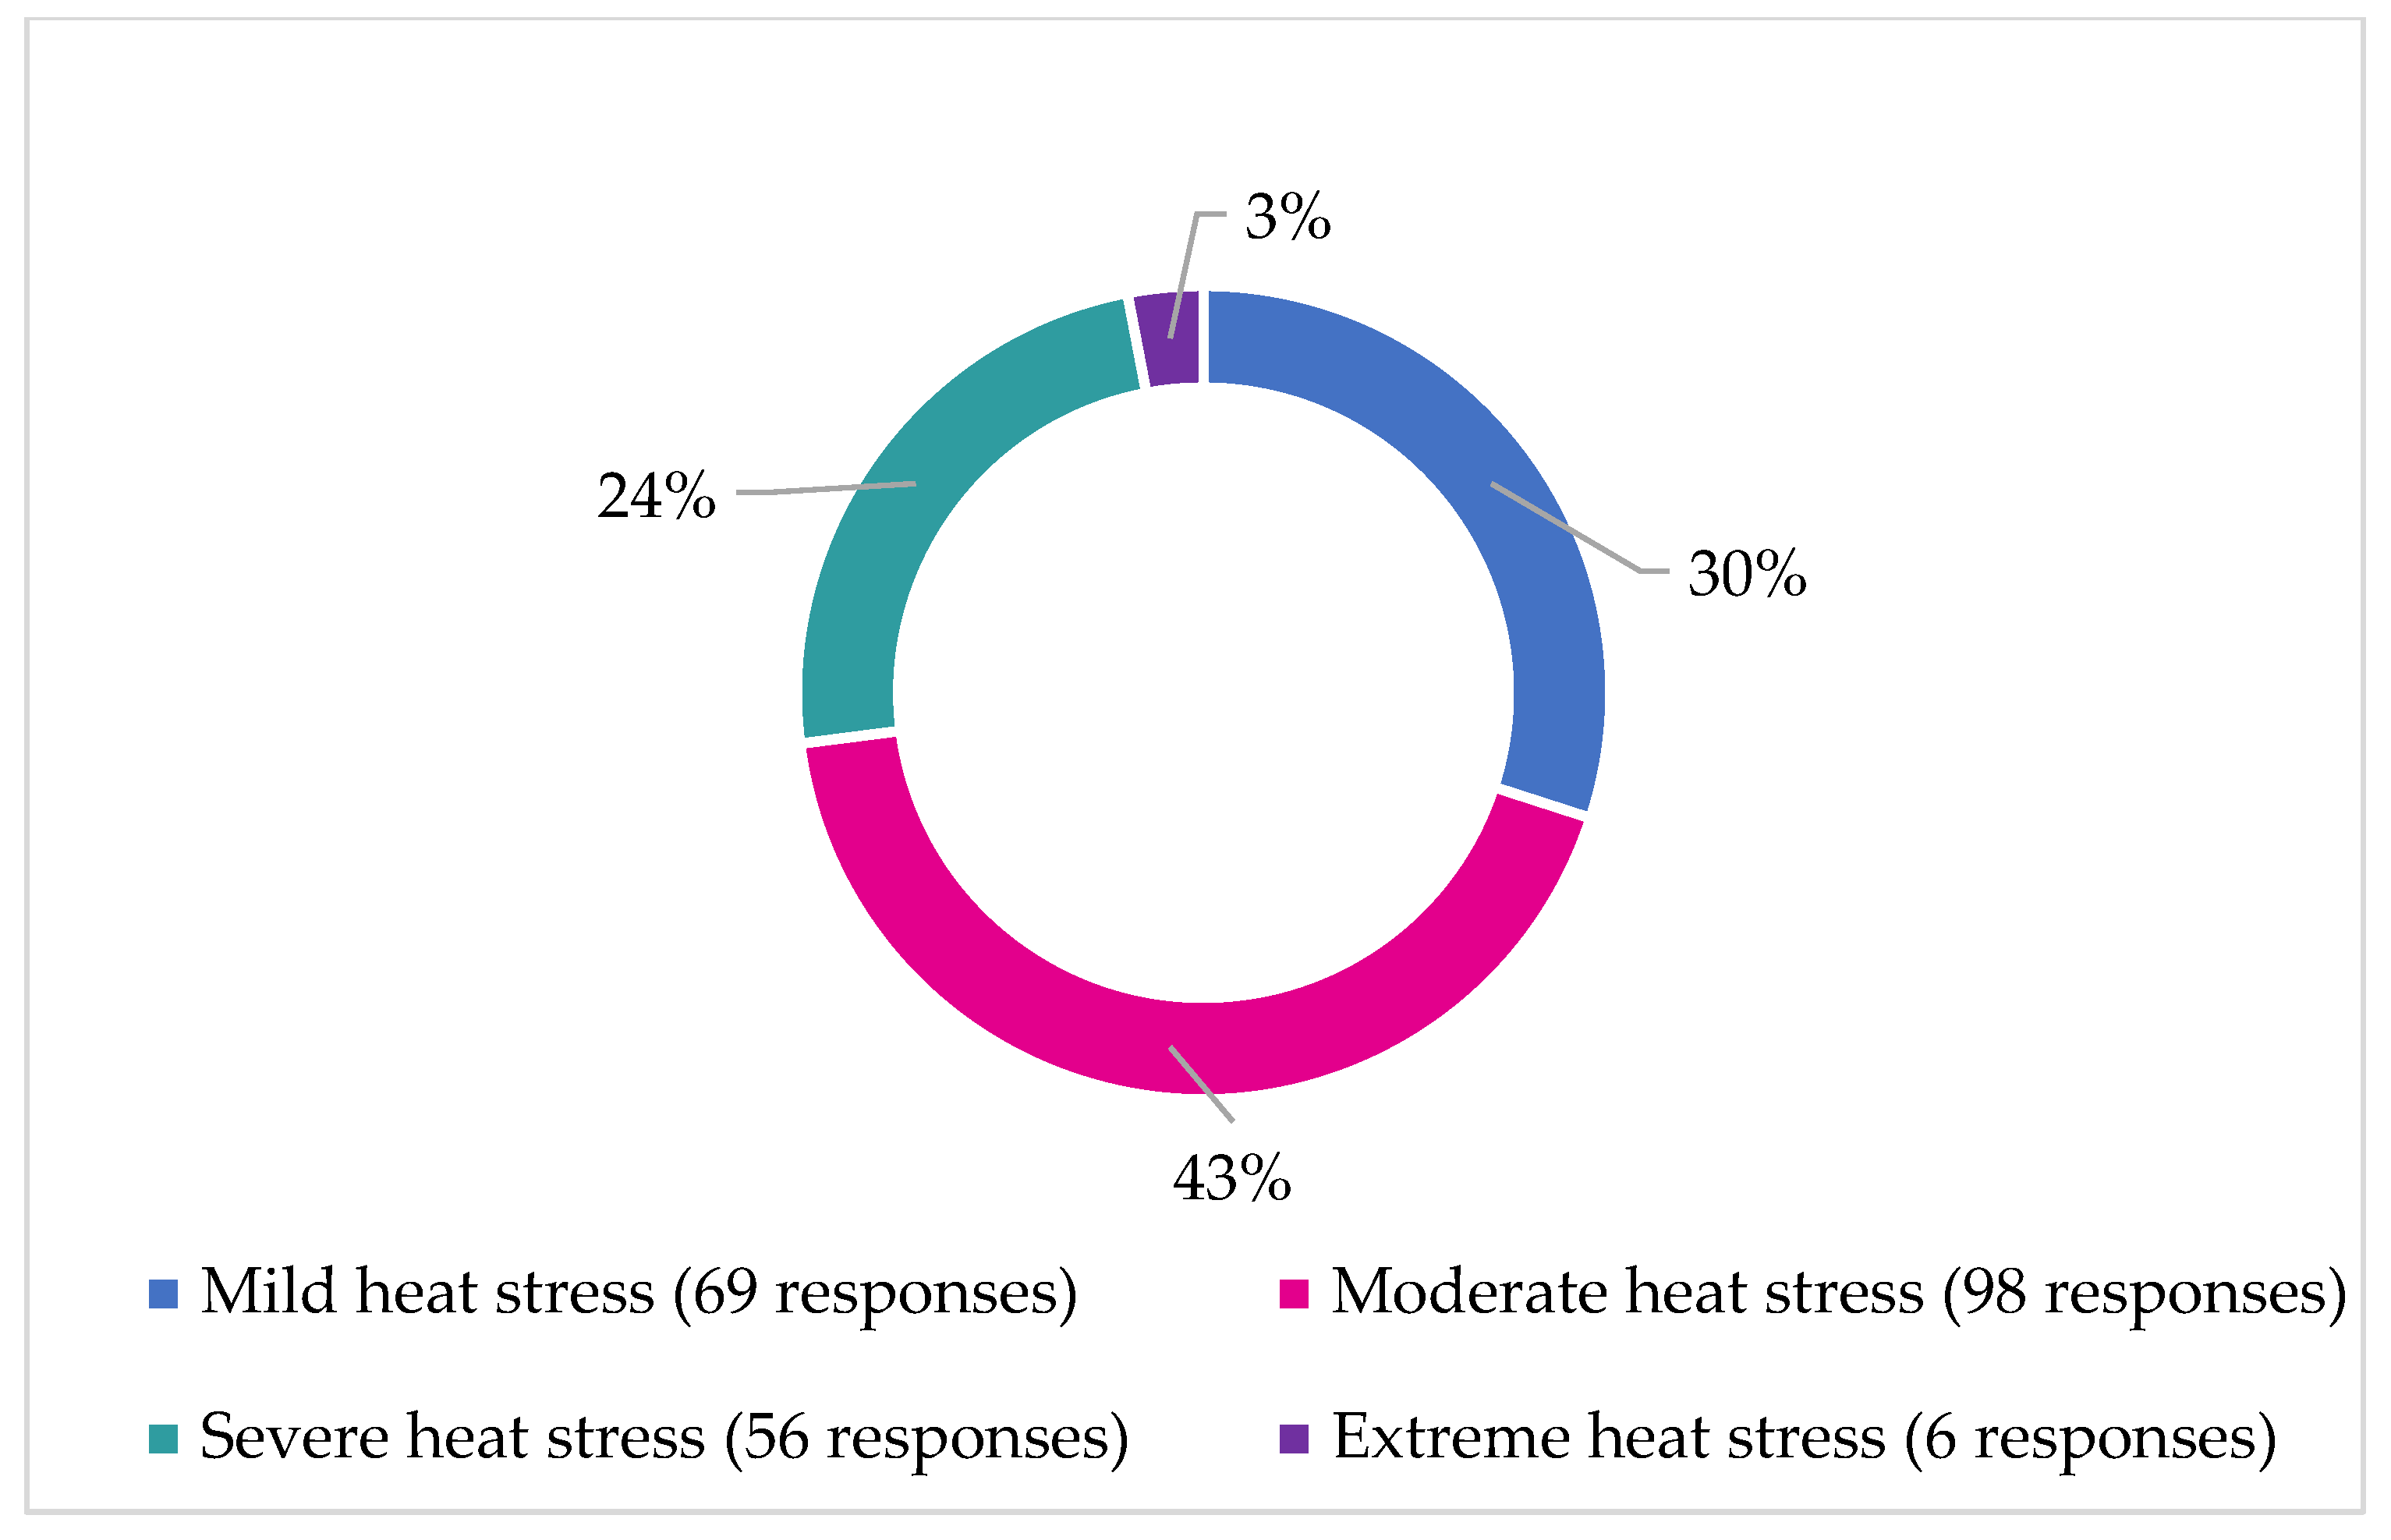
Survey participants directly evaluated whether they felt within or outside their comfort zone. They selected their thermal sensation according to the PET-based scale provided by ENVI-met, which includes the categories light heat stress, moderate heat stress, strong heat stress, and extreme heat stress. Additionally, respondents could indicate their comfort level based on personal perception, allowing the identification of variations associated with different climatic conditions.
2.7. Bioclimatic Techniques
This section presents the bioclimatic techniques selected for evaluation in the study area through simulation. The choice of strategies was based on their relevance to humid tropical climates according to the literature. Techniques were prioritized according to their ability to modify air temperature, surface conditions, and radiant heat exposure in outdoor spaces. Each technique was modeled individually and comparatively in order to quantify its isolated impact and to assess its effectiveness relative to available space and climatic context. Later, comparisons of the techniques were made.
2.7.1. Bodies of Water
One of the bioclimatic techniques applied is evaporative cooling through bodies of water, with the hypothesis that they help reduce air temperature via heat transfer and evaporation. The effectiveness of this strategy depends on climatic factors and the water-to-land ratio: the larger the surface area of the water body, the greater the absorption of solar radiation and the stronger the cooling effect. Its efficiency was evaluated by varying the size of the water body in the simulation according to the available space and analyzing its impact on air temperature and mean radiant temperature.
Although the experimentation was not conducted in a humid tropical climate, the initial weather conditions on the selected study day (31 July) in Beijing, China, presented environmental variables similar to those measured on campus. Specifically, the air temperature was 30 °C, the relative humidity was 72%, and the wind speed was set at 1.8 m/s. This wind speed is slightly lower than the typical values observed on campus, which supports the applicability of the results.
Due to the notable temperature reductions observed in the simulation, up to 5 °C in areas adjacent to the water bodies, this technique demonstrates strong potential for mitigating outdoor heat stress on campus. These findings are consistent with previous studies that reported significant thermal improvements through urban water bodies, both in experimental contexts and simulation-based analyses.
To quantify the relationship between water body size and its thermal effectiveness, Equation (2) defines the water body area proportion, which refers to the ratio of the water surface area to the total area of the zone where it is located [
39]:
where
is the proportion of the water body,
is the total simulation area, and
is the total area of the water bodies.
In this case, the relationship was assessed in proportion to the total area of the simulation model, which had a mesh of 29,651 grids, where 400 grids were used to model the water bodies, (
Figure 11). This is equivalent to 1.35% of the total area.
Figure 11 shows both the preexisting and proposed water bodies. The volume of each water body varies depending on the measurement point: point 1 has a volume of 80 m
3; point 2, 216 m
3; point 3, 96 m
3; and point 4, 112 m
3 distributed between two water bodies. The additional water bodies were included to observe their behavior in different areas, but they were not the primary focus of this study. Each body of water varied depending on the area available.
2.7.2. Dry Mist
Another technique that was applied was dry mist. It consists of ultrasmall water droplets that evaporate quickly, leaving no feeling of moisture on the skin and without increasing the humidity of the air or the wet mist [
16]. To include this bioclimatic technique in the model, the diameter of the water particles must be configured.
For this model, a droplet diameter of 20 µm was considered, with atomization occurring at a height of two meters above the ground [
16]. Previous studies have analyzed the optimal droplet size for misting systems and the appropriate installation height of the atomizers in outdoor environments. Some have demonstrated improvements in thermal comfort in waiting areas through controlled misting [
35]. while others analyzed particle size distribution and cooling efficiency under various conditions [
40]. Large scale applications have also been reported, confirming the effectiveness of mist systems in dense public environments [
41]. Additionally, research has shown that both nozzle height and density significantly influence perceived thermal comfort, especially in pedestrian zones [
42].
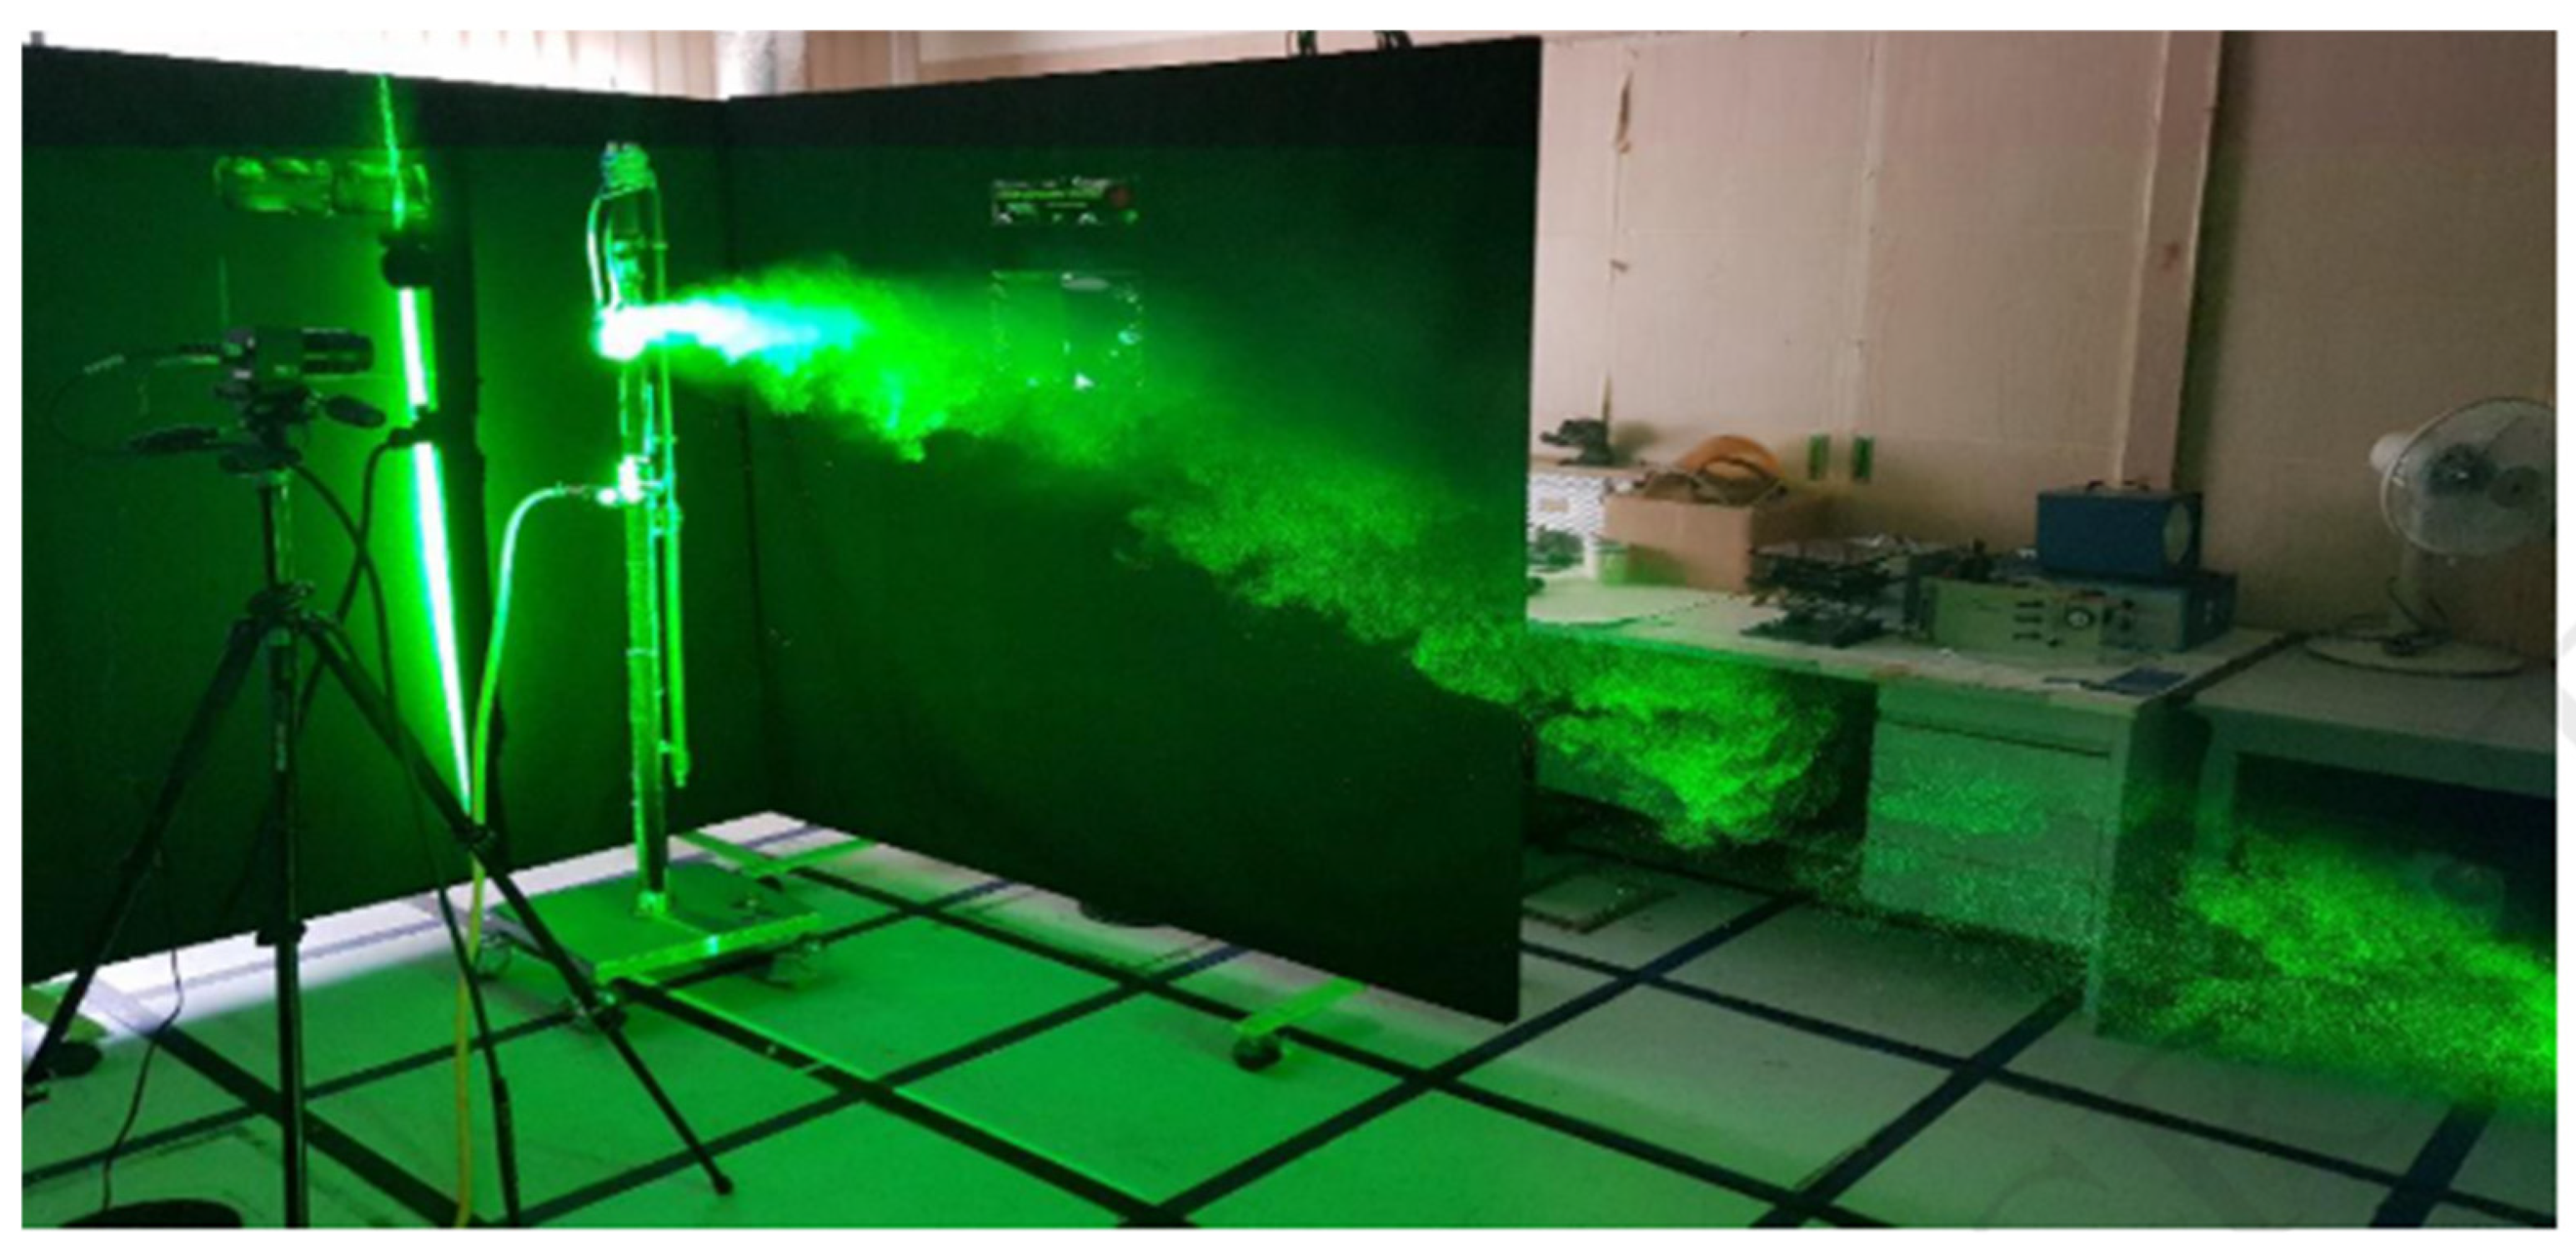
Figure 12 shows the effect that we wanted to recreate in Envi-met. A similar size to these droplets was simulated.
Figure 12 shows the dry mist device positioned at pedestrian level and operating under controlled laboratory conditions. It served as a reference for the application of evaporative cooling strategies, highlighting the visual and spatial characteristics of the setup used to capture particle movement and droplet size.
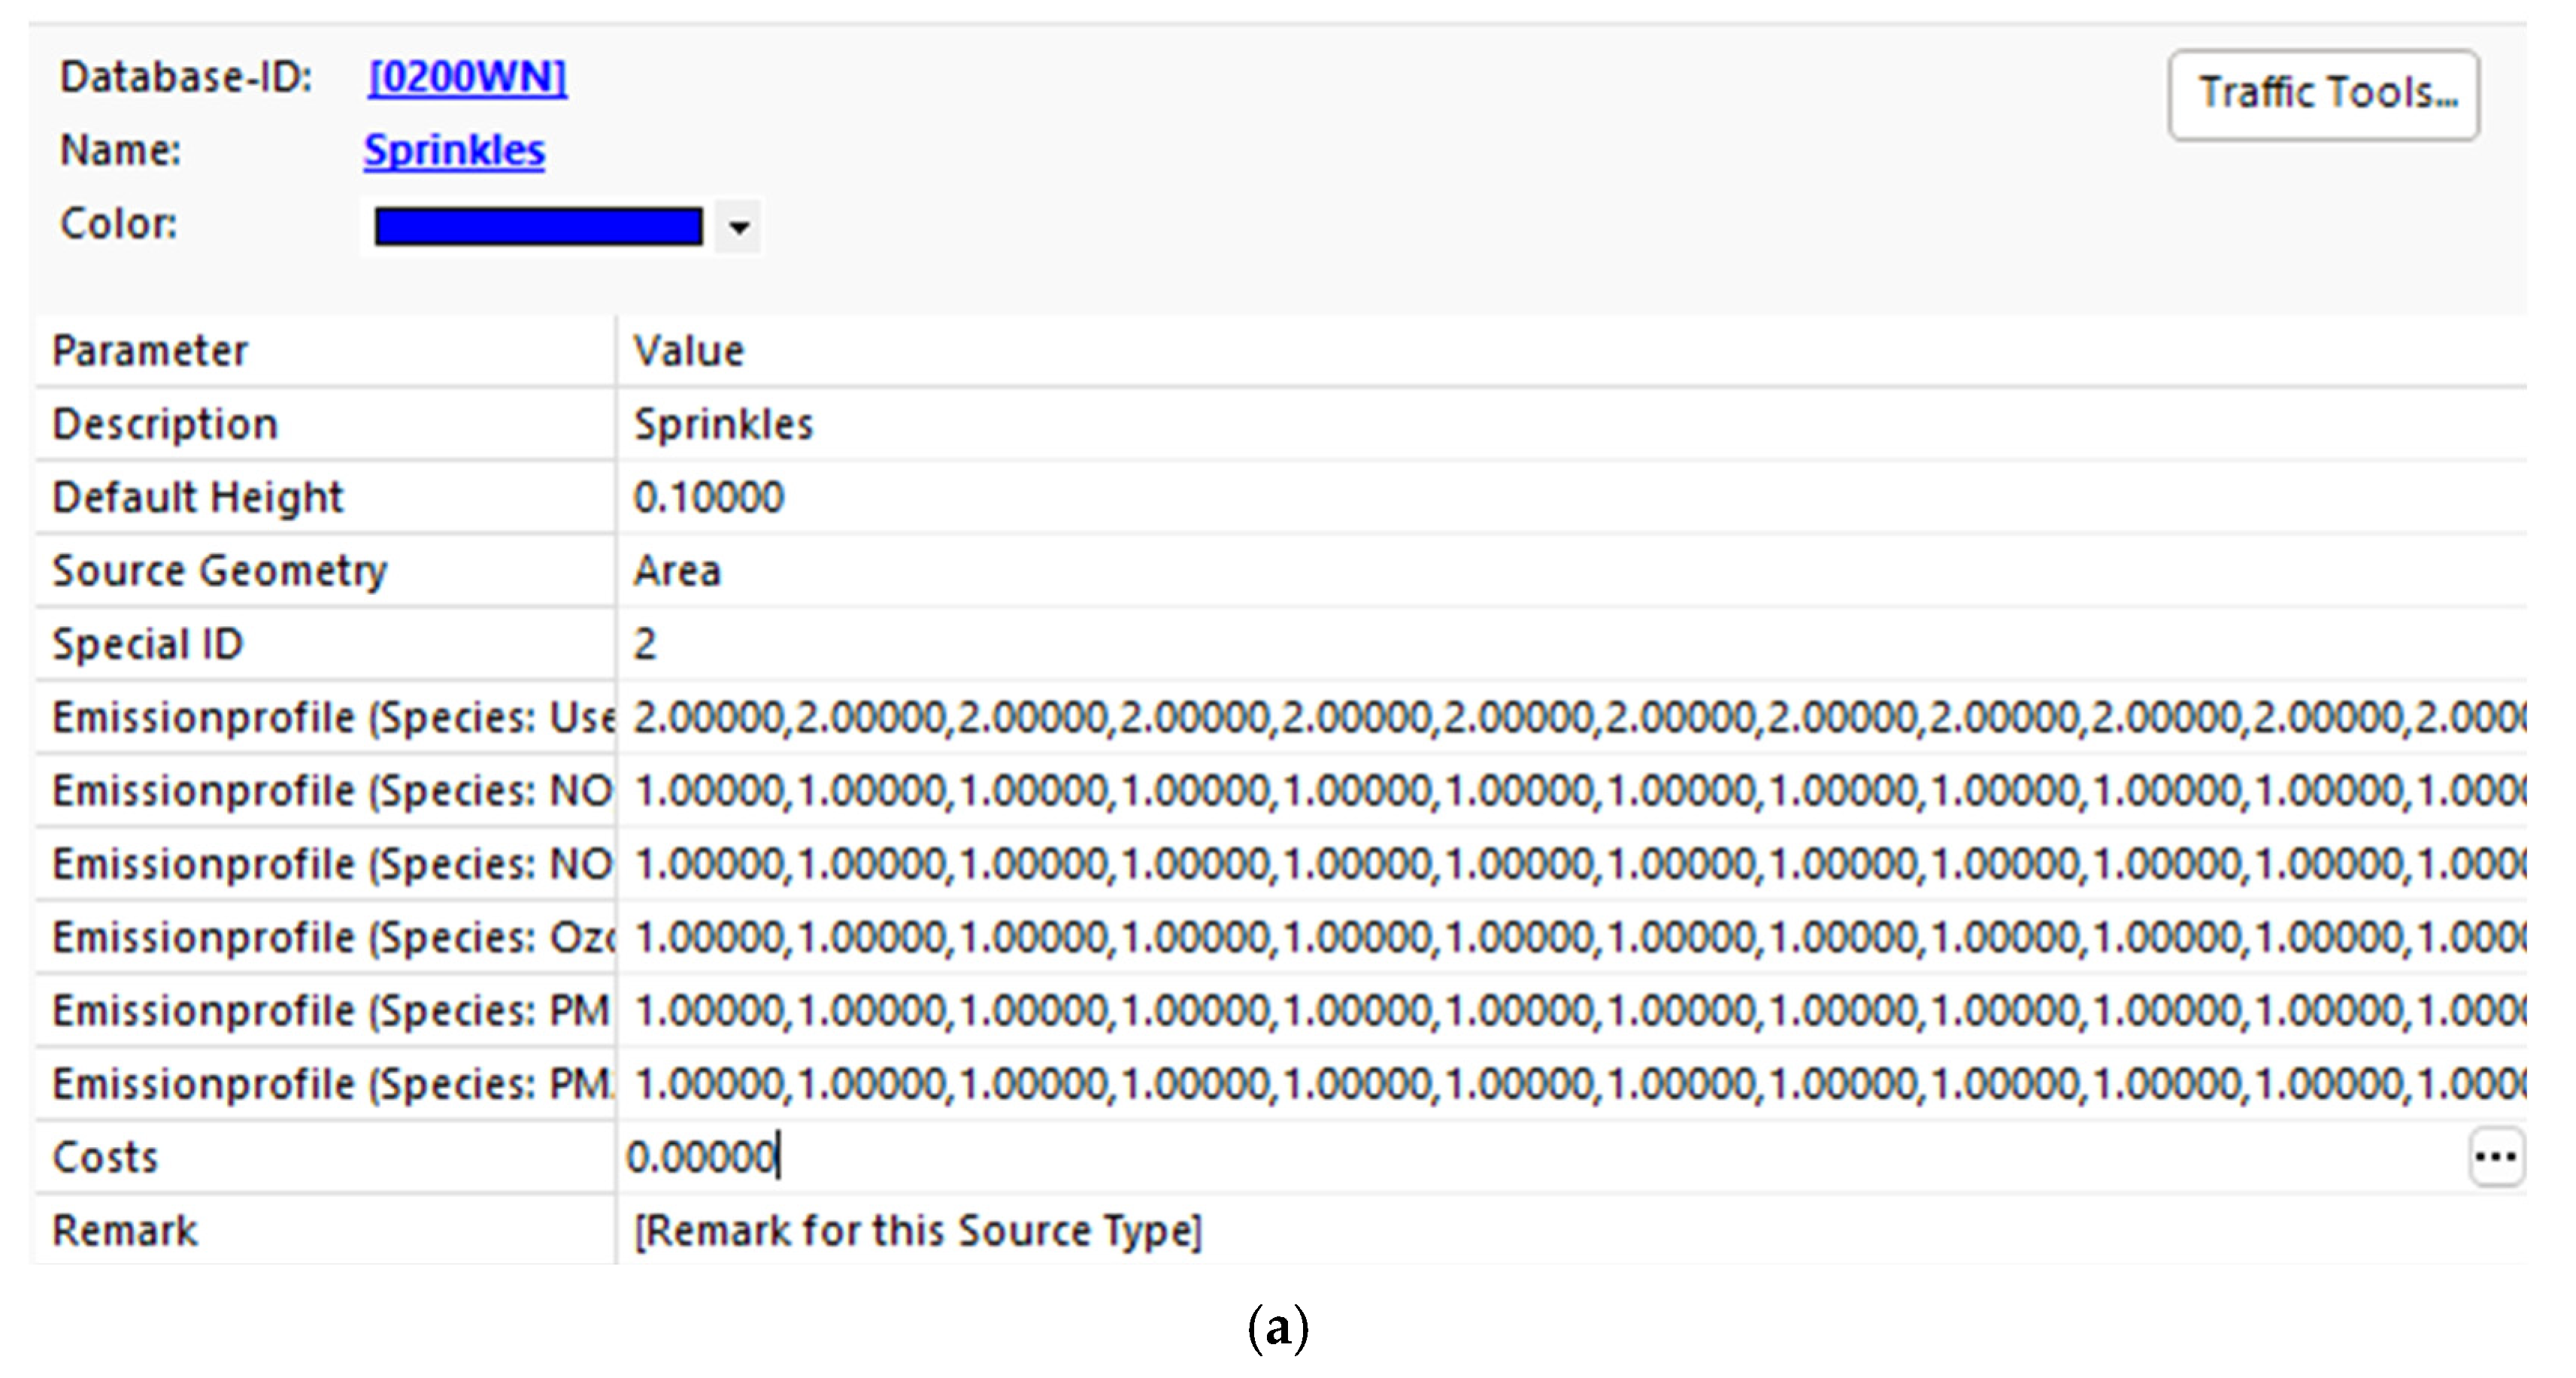
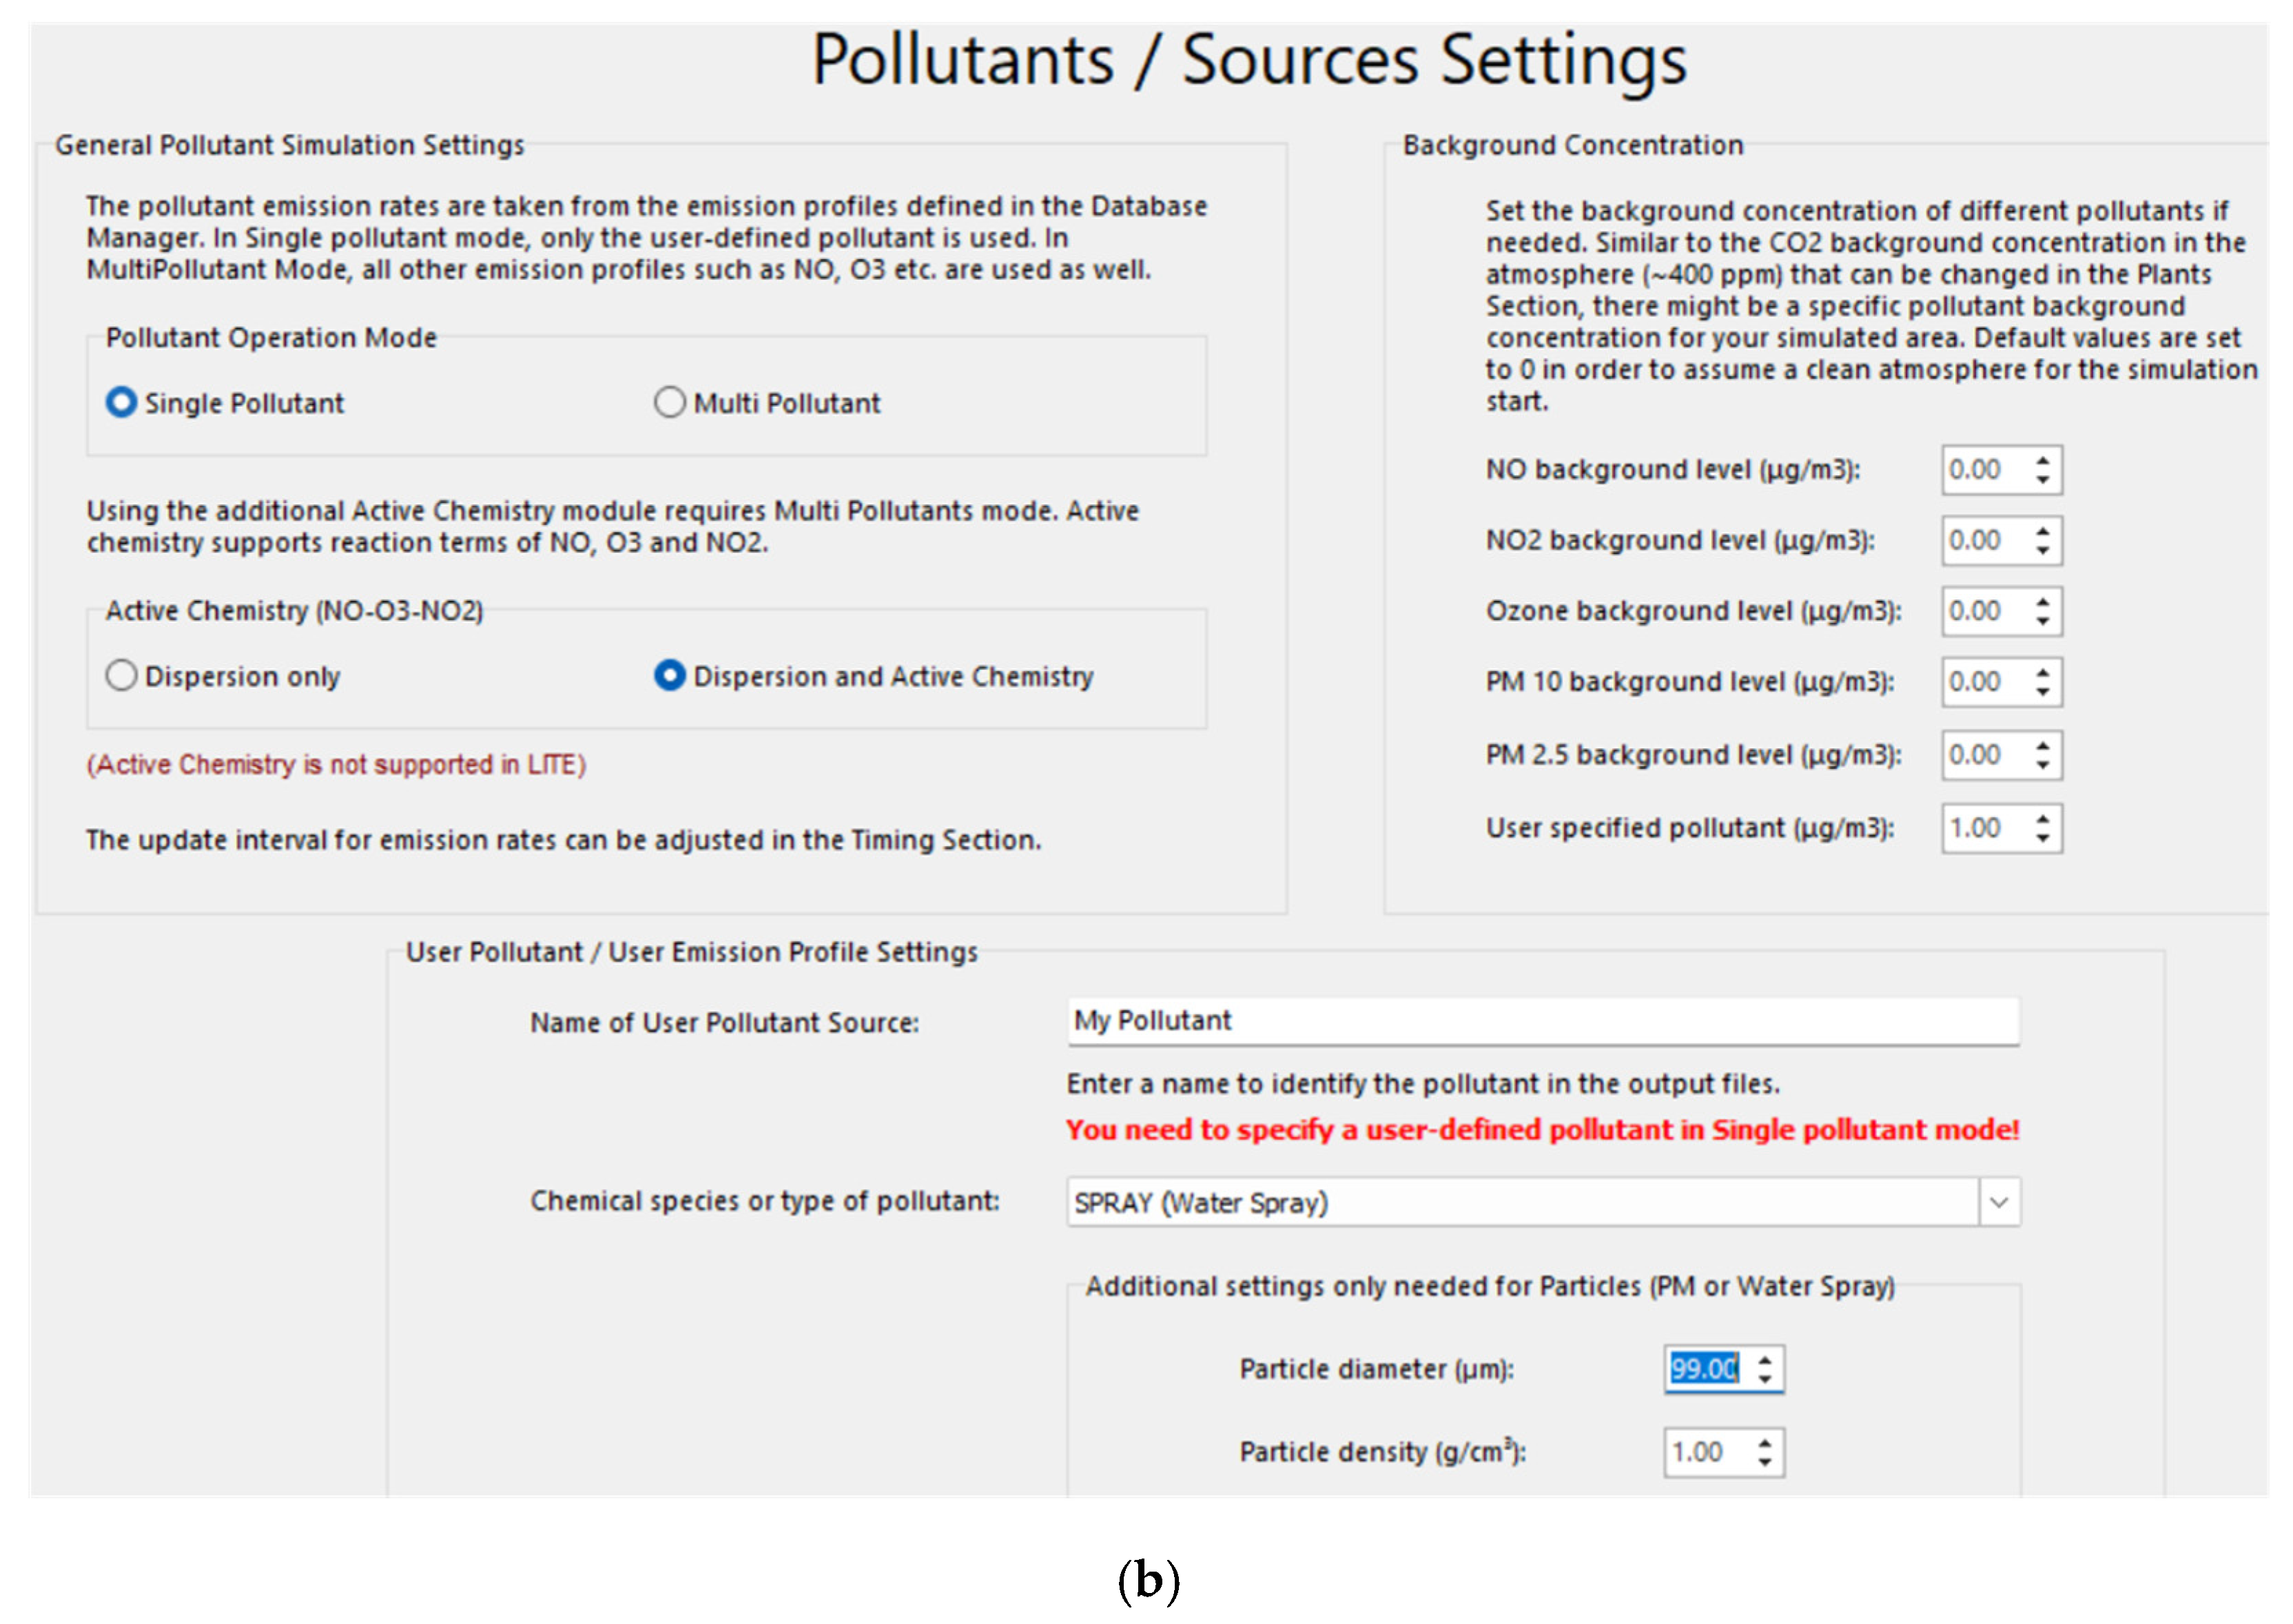
Figure A1a shows the ENVi-met configuration of the nozzle. In
Appendix A,
Figure A1b shows the pollutant configuration, where water was used to simulate the effect of dry mist.
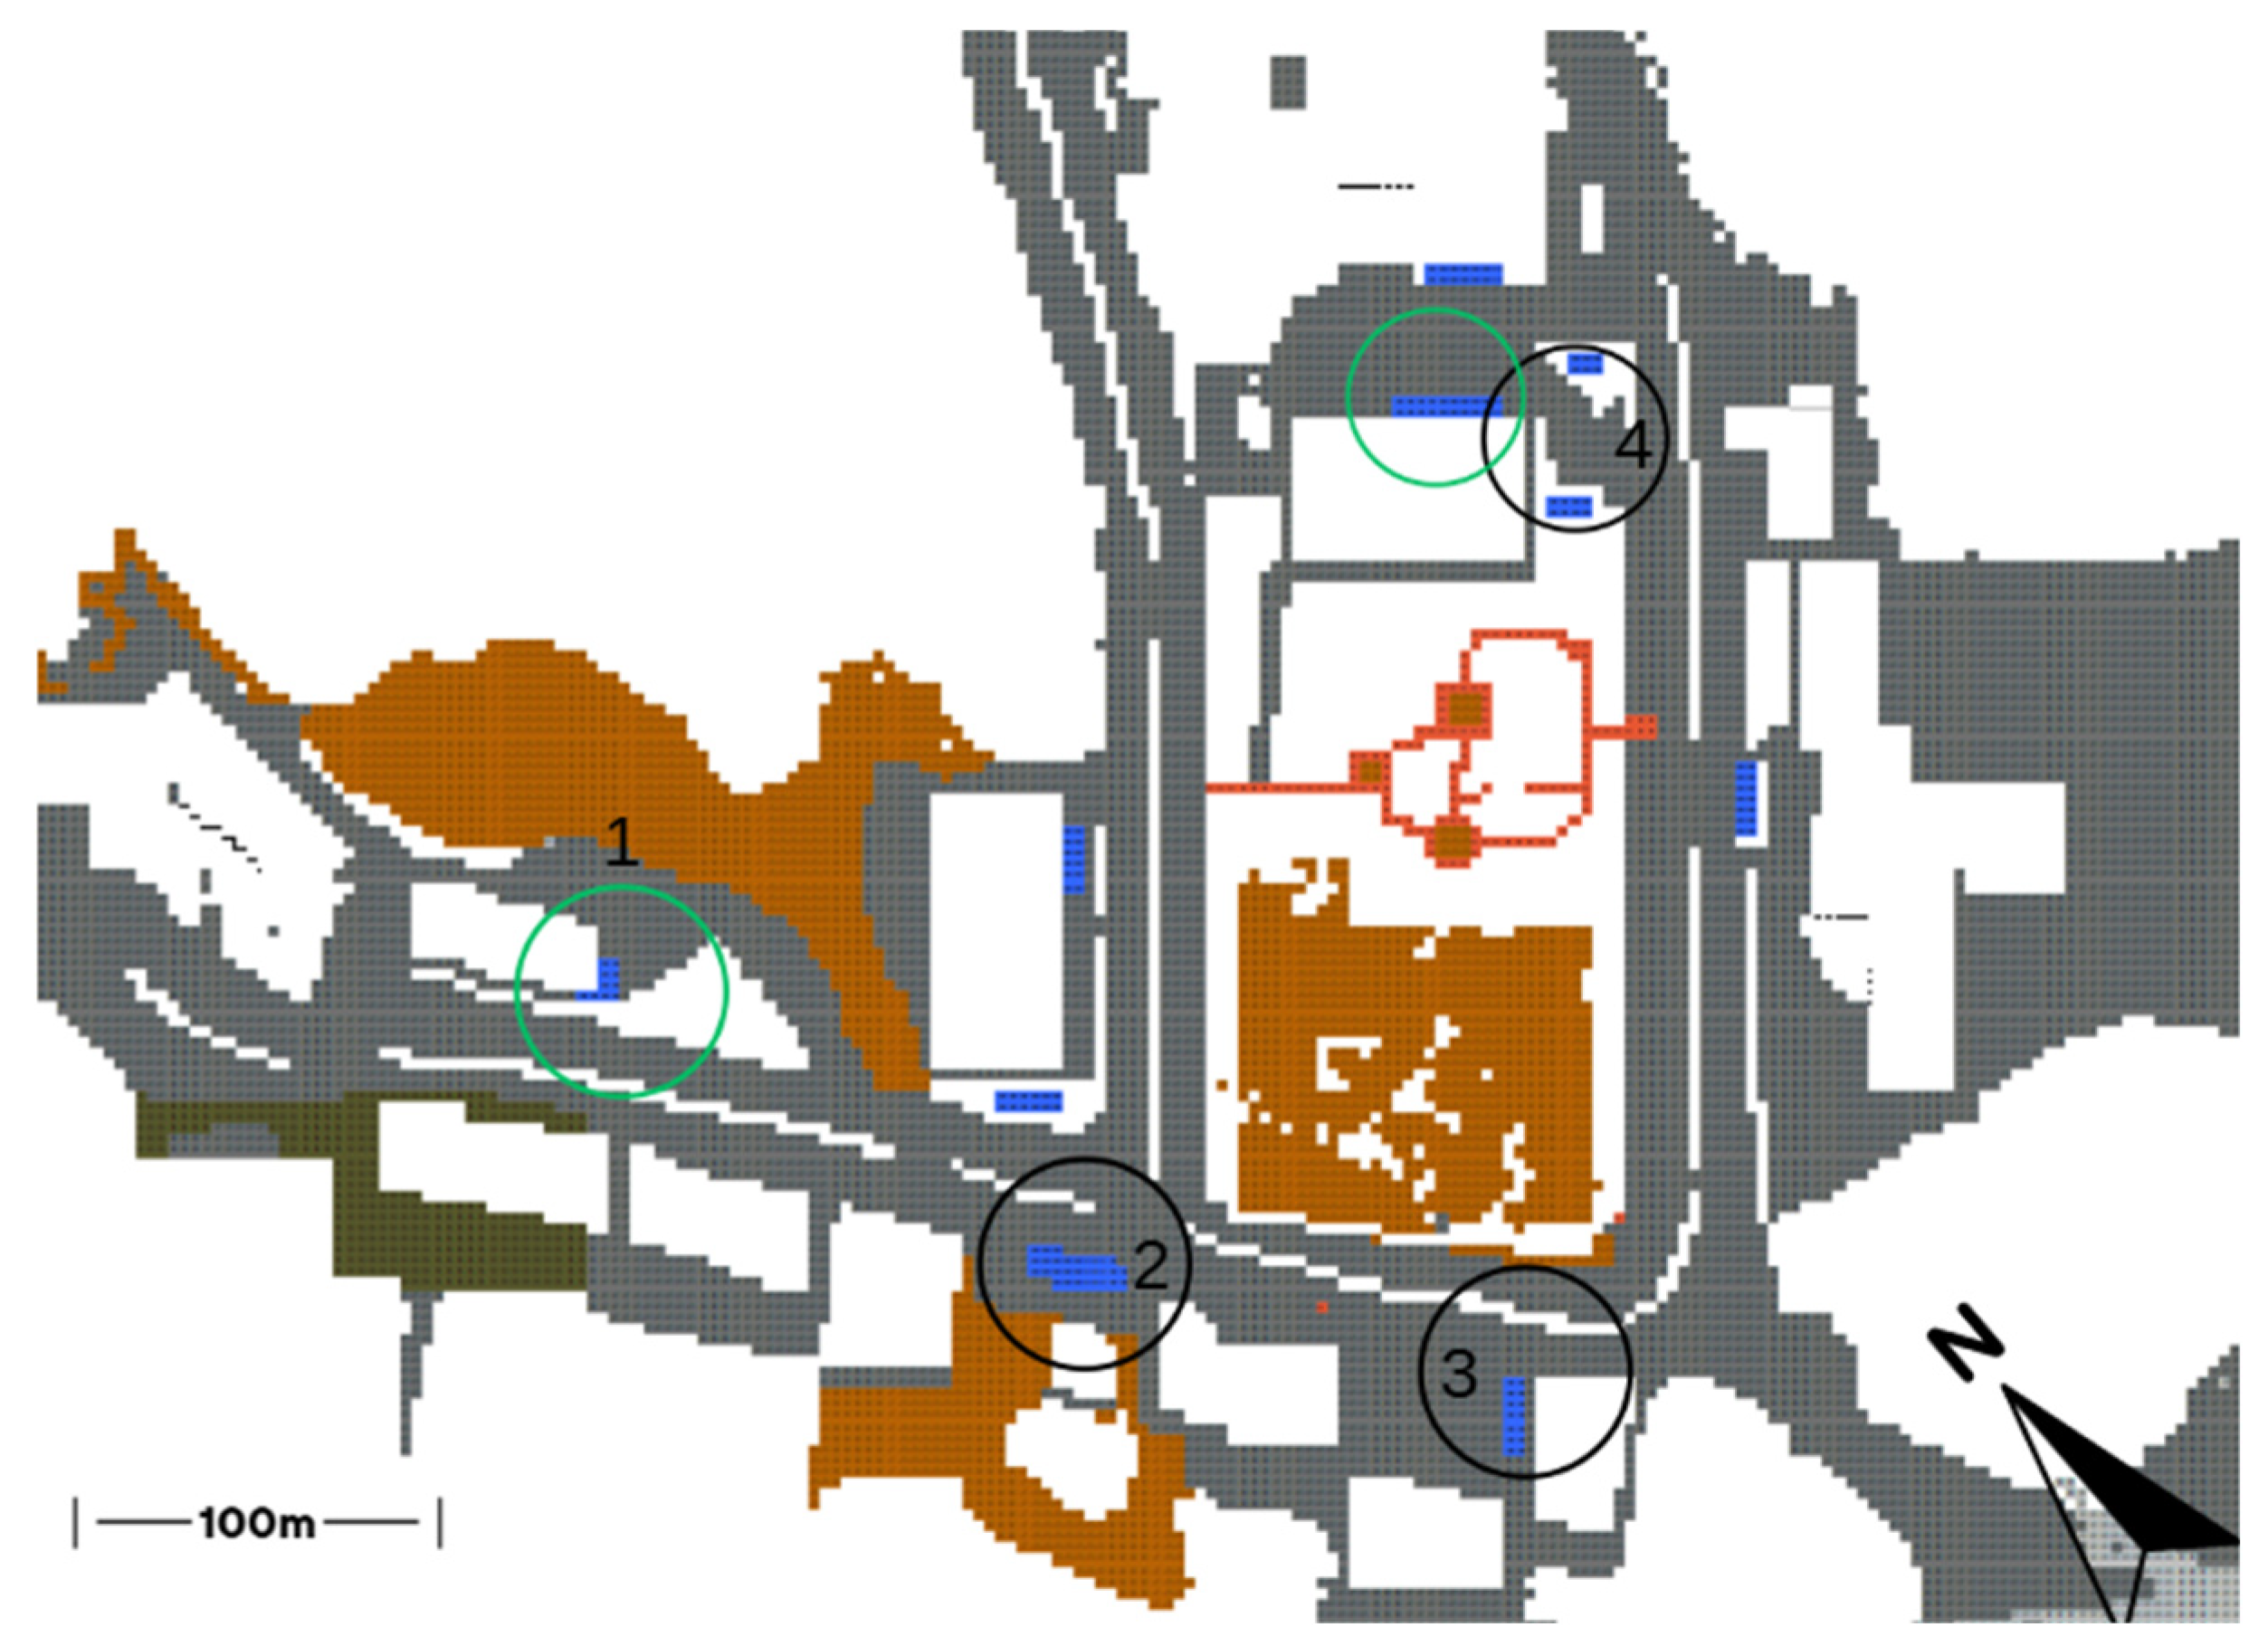
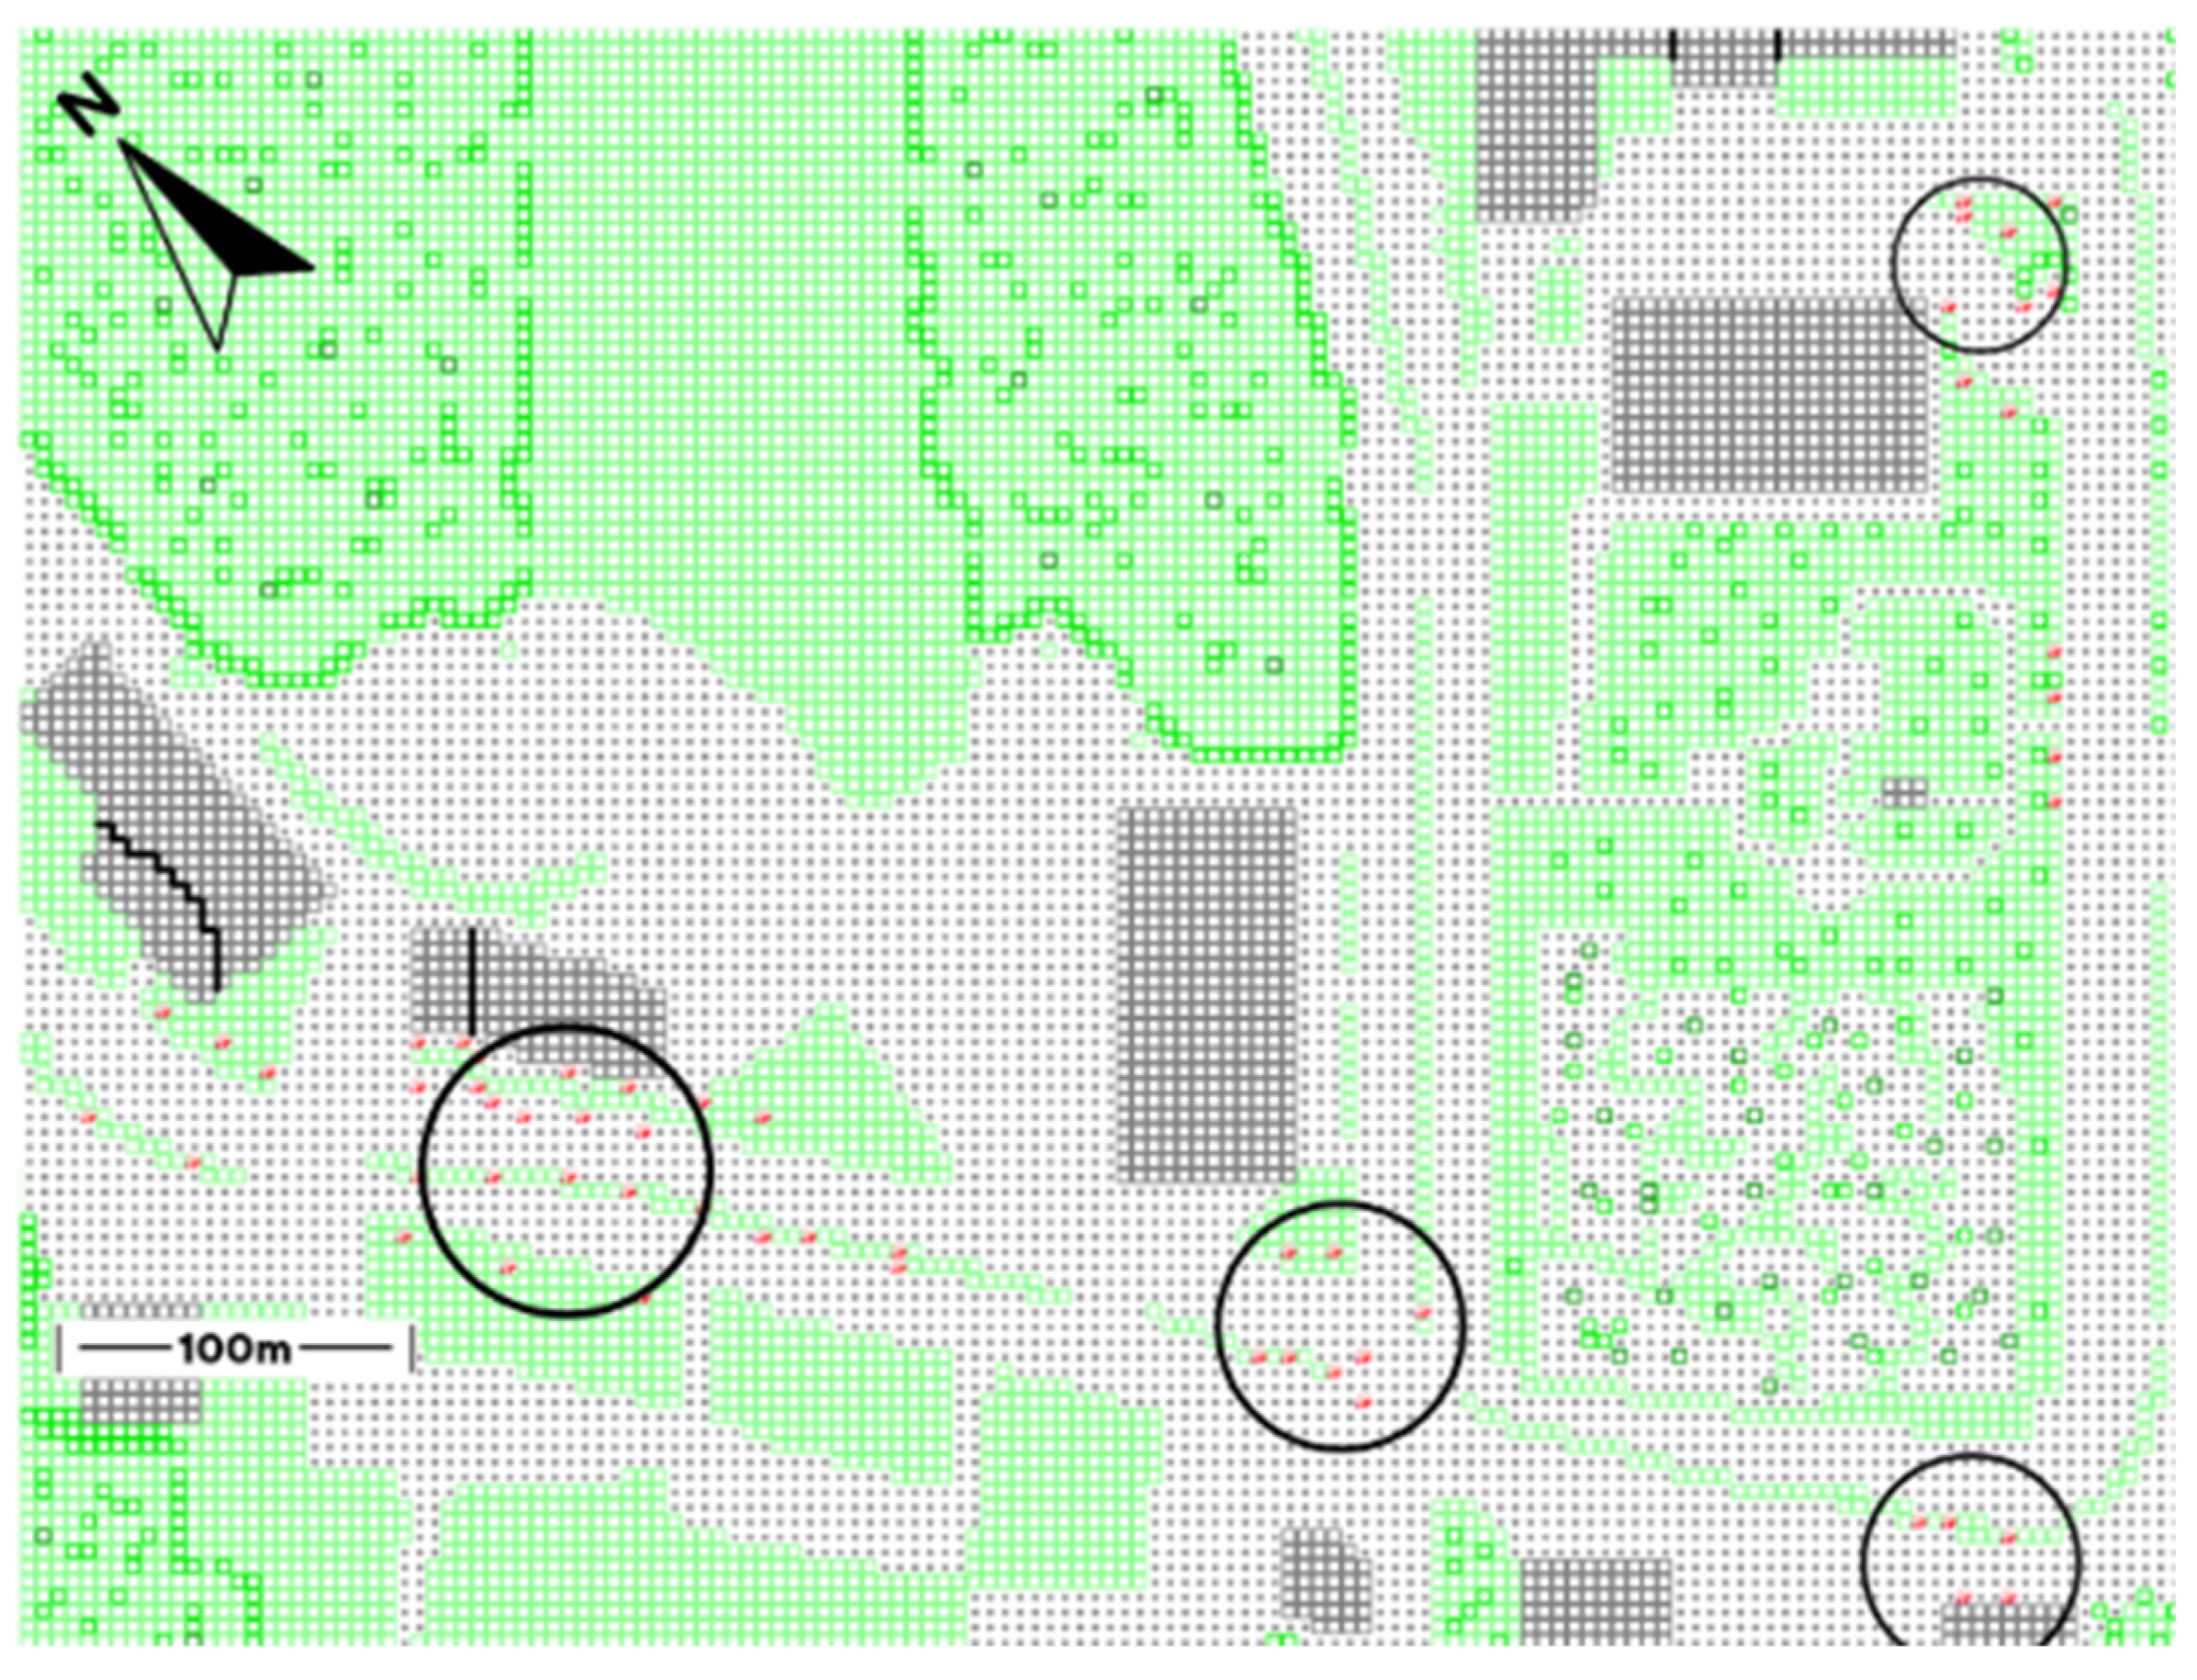
Figure 13 presents the proposed locations (red points within black circles) where dry mist devices could be installed to improve outdoor thermal comfort.
The dry mist devices were positioned so that the spray nozzles could directly affect pedestrians along circulation paths. They were installed in areas of high foot traffic to evaluate their performance; however, for the purposes of this research, only the devices located within the black-circled zones were analyzed in greater detail.
2.7.3. Water Sprinklers
Sprinklers are a bioclimatic technique that also utilizes evaporative cooling to lower surface temperatures. Several studies have demonstrated their effectiveness in reducing thermal loads by directly spraying water onto materials or surfaces [
43,
44,
45]. In this case, we used the sprinklers for various purposes. For example, one investigation evaluated how water temperature influences spray cooling performance under high surface heat conditions [
43]. Another study provided a comprehensive overview of spray cooling theories and applications relevant to urban environments [
44]. Experimental research has also demonstrated significant cooling effects when applying automatic water spraying on metallic roofs in a tropical setting [
45].
In the present study, sprinklers were applied with three main purposes. The first was to lower the surface temperature of exposed materials through direct spraying. The second was to maintain vegetation and prevent thermal stress in green areas, allowing for continuous evapotranspiration [
46,
47]. Prior technical notes and agronomic research highlight the importance of moisture management in sustaining plant health under high temperatures [
46], while other studies indicate that humidity levels directly influence plant physiological responses in arid conditions [
47].
The third and final purpose was to reduce the surrounding air temperature via evaporative cooling. However, this was not the primary objective of the system. Given its configuration based on ground-level direct spraying, the system was optimized mainly for surface cooling and plant maintenance rather than large-scale ambient air cooling.
In
Figure 14, the sprinklers are shown inside black circles, indicating their locations.
In
Appendix A,
Figure A2a displays the ENVI-met configuration of the sprinkler, including its flow rate and operating hours.
Figure A2b presents the configuration of the pollutant. In this case, water was used to simulate the effect of the sprinkler.
2.7.4. Arborization
Tree planting is a passive and environmentally friendly technique that involves the strategic placement of trees to improve outdoor thermal comfort. This strategy contributes to surface cooling by blocking direct solar radiation and promotes a decrease in air temperature through evapotranspiration. Multiple studies have demonstrated the effectiveness of urban tree coverage in reducing land surface temperatures and moderating urban microclimates [
48,
49,
50,
51,
52]. For instance, numerical simulations and empirical analyses have shown that well-distributed tree canopies can significantly reduce solar heat gain in built environments [
48]. Furthermore, research conducted in tropical and neotropical urban areas has highlighted the role of vegetation in enhancing thermal comfort by providing shading and contributing to moisture exchange with the atmosphere [
49,
50]. Other investigations have examined the relationship between evapotranspiration rates, plant types, and surface albedo, confirming that vegetation density and structure can directly influence ambient cooling performance [
50,
51]. These effects are particularly evident in studies analyzing land cover variation and its influence on intra-urban heat island patterns [
52].
In
Appendix A,
Table A1 presents the characteristics of the chosen tree, as well as the comparison of the scenario before and after tree planting.
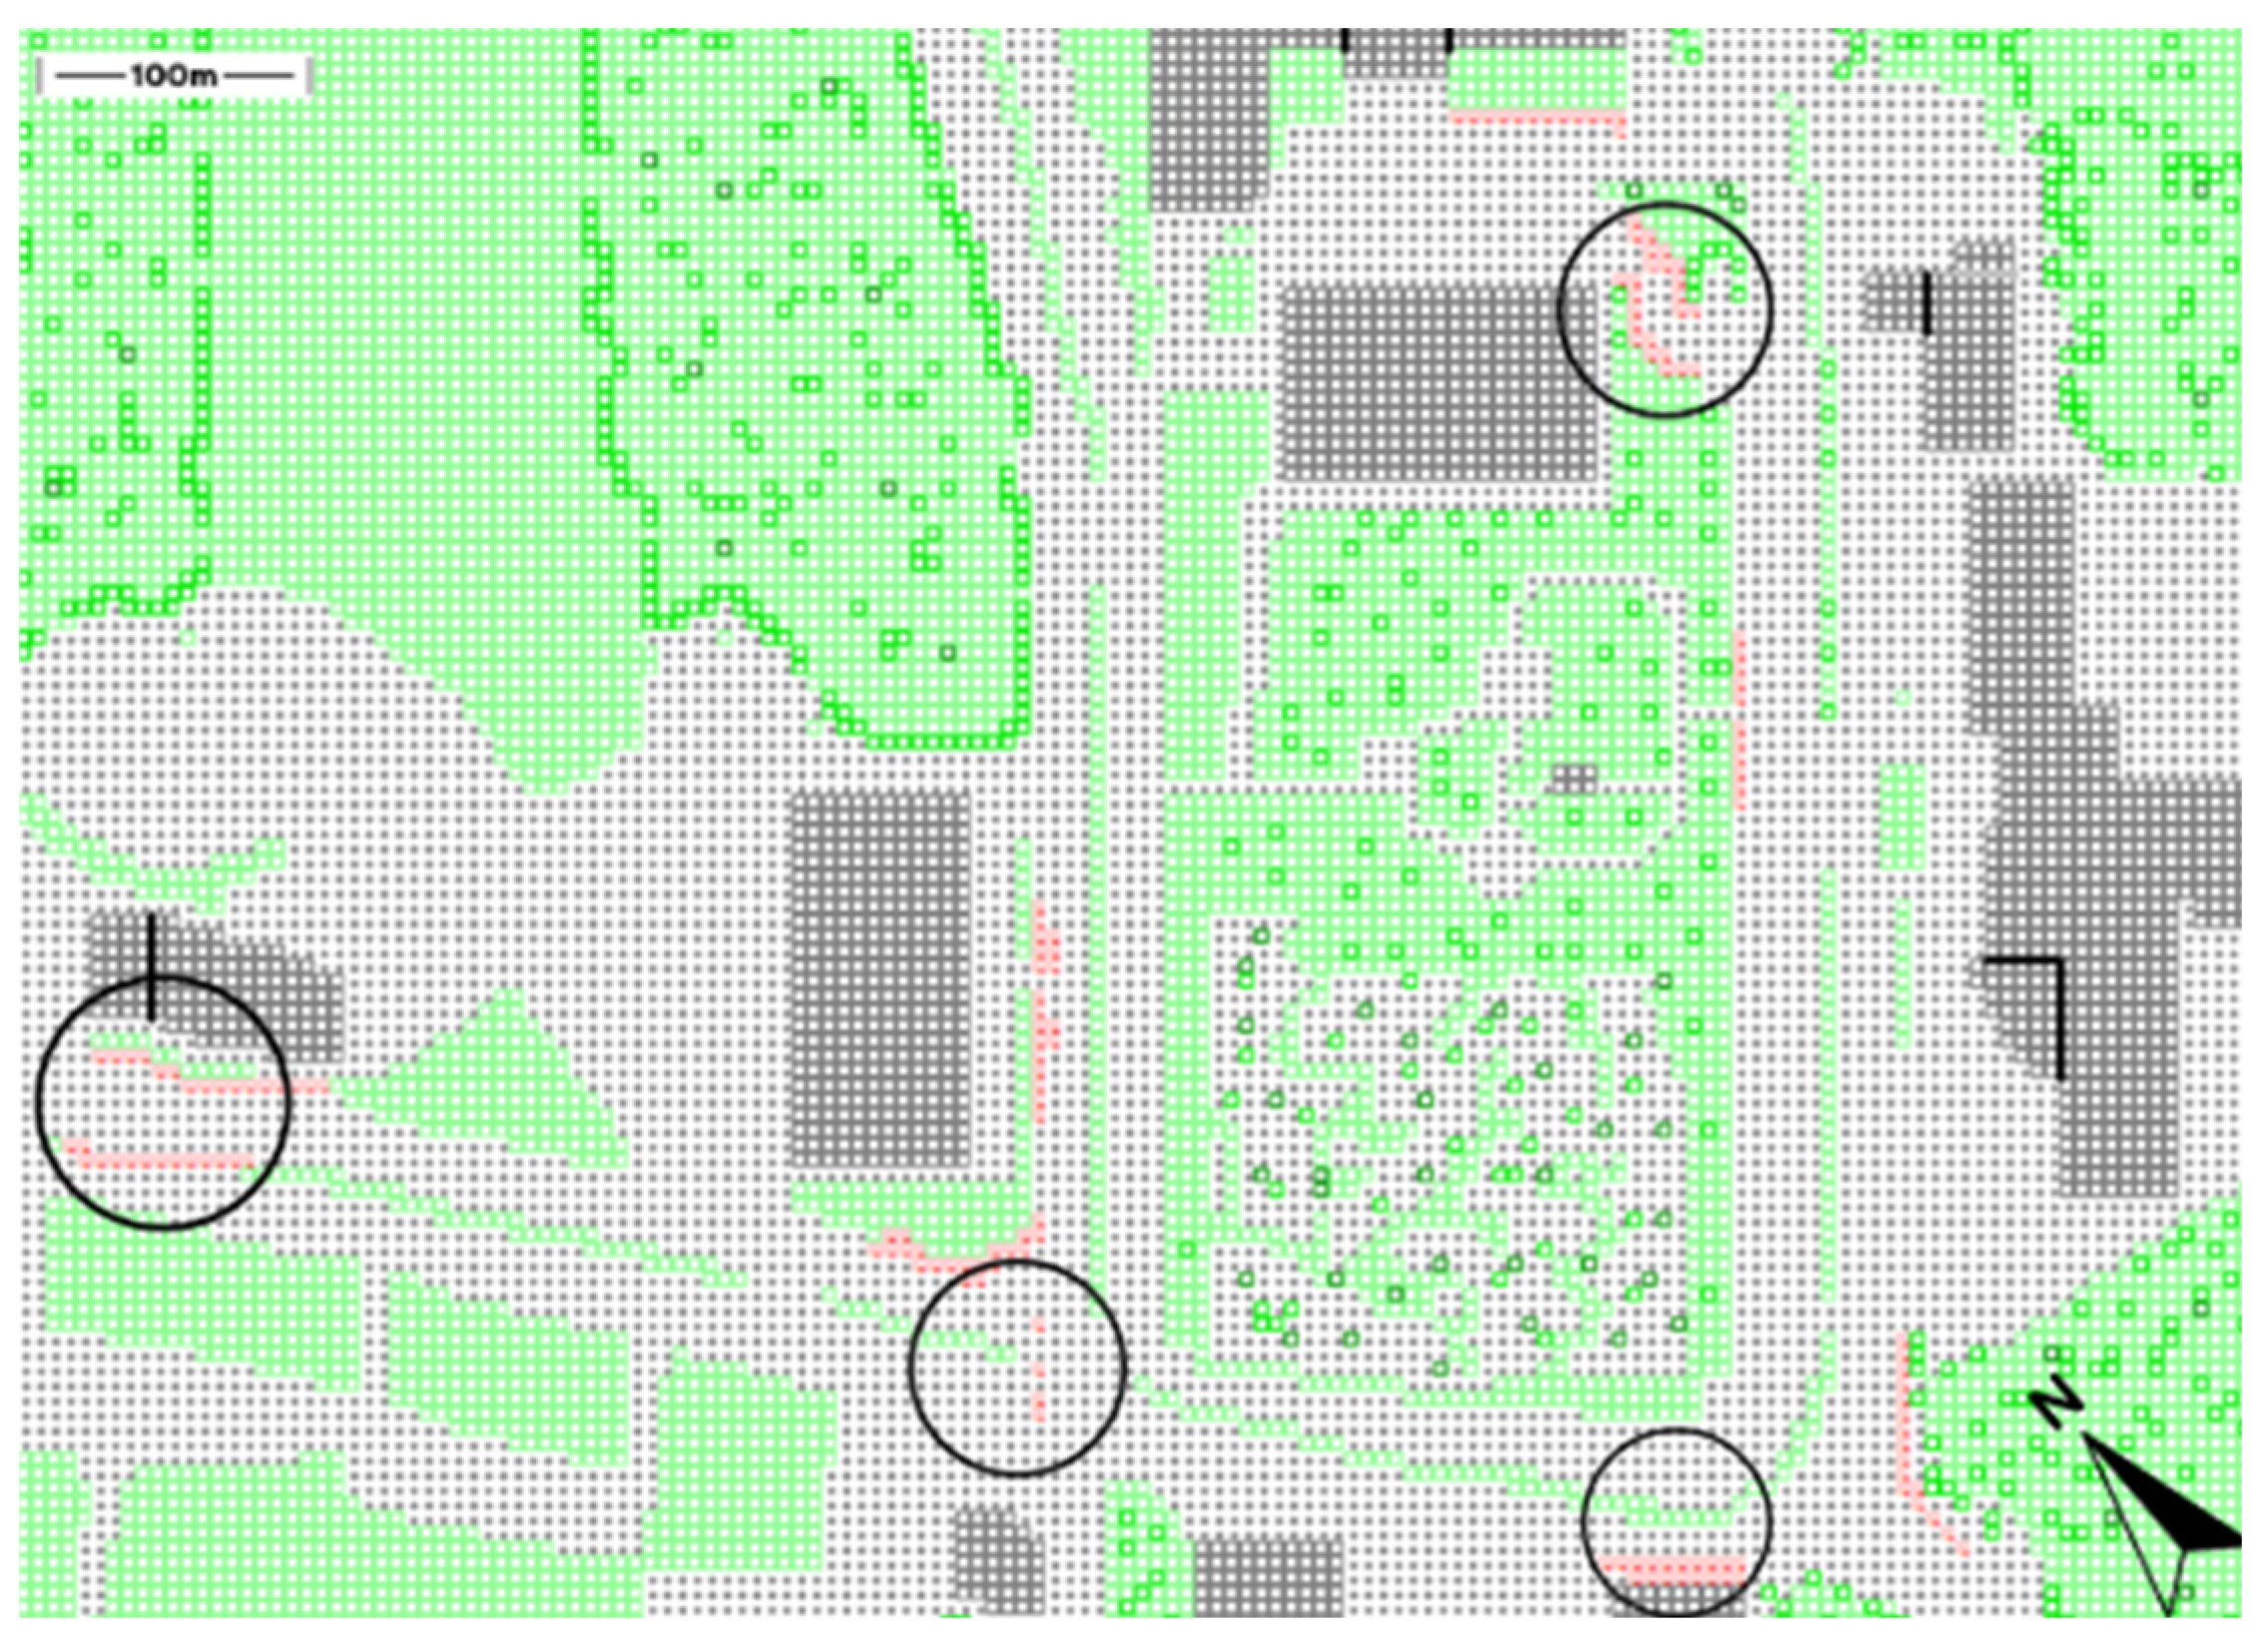
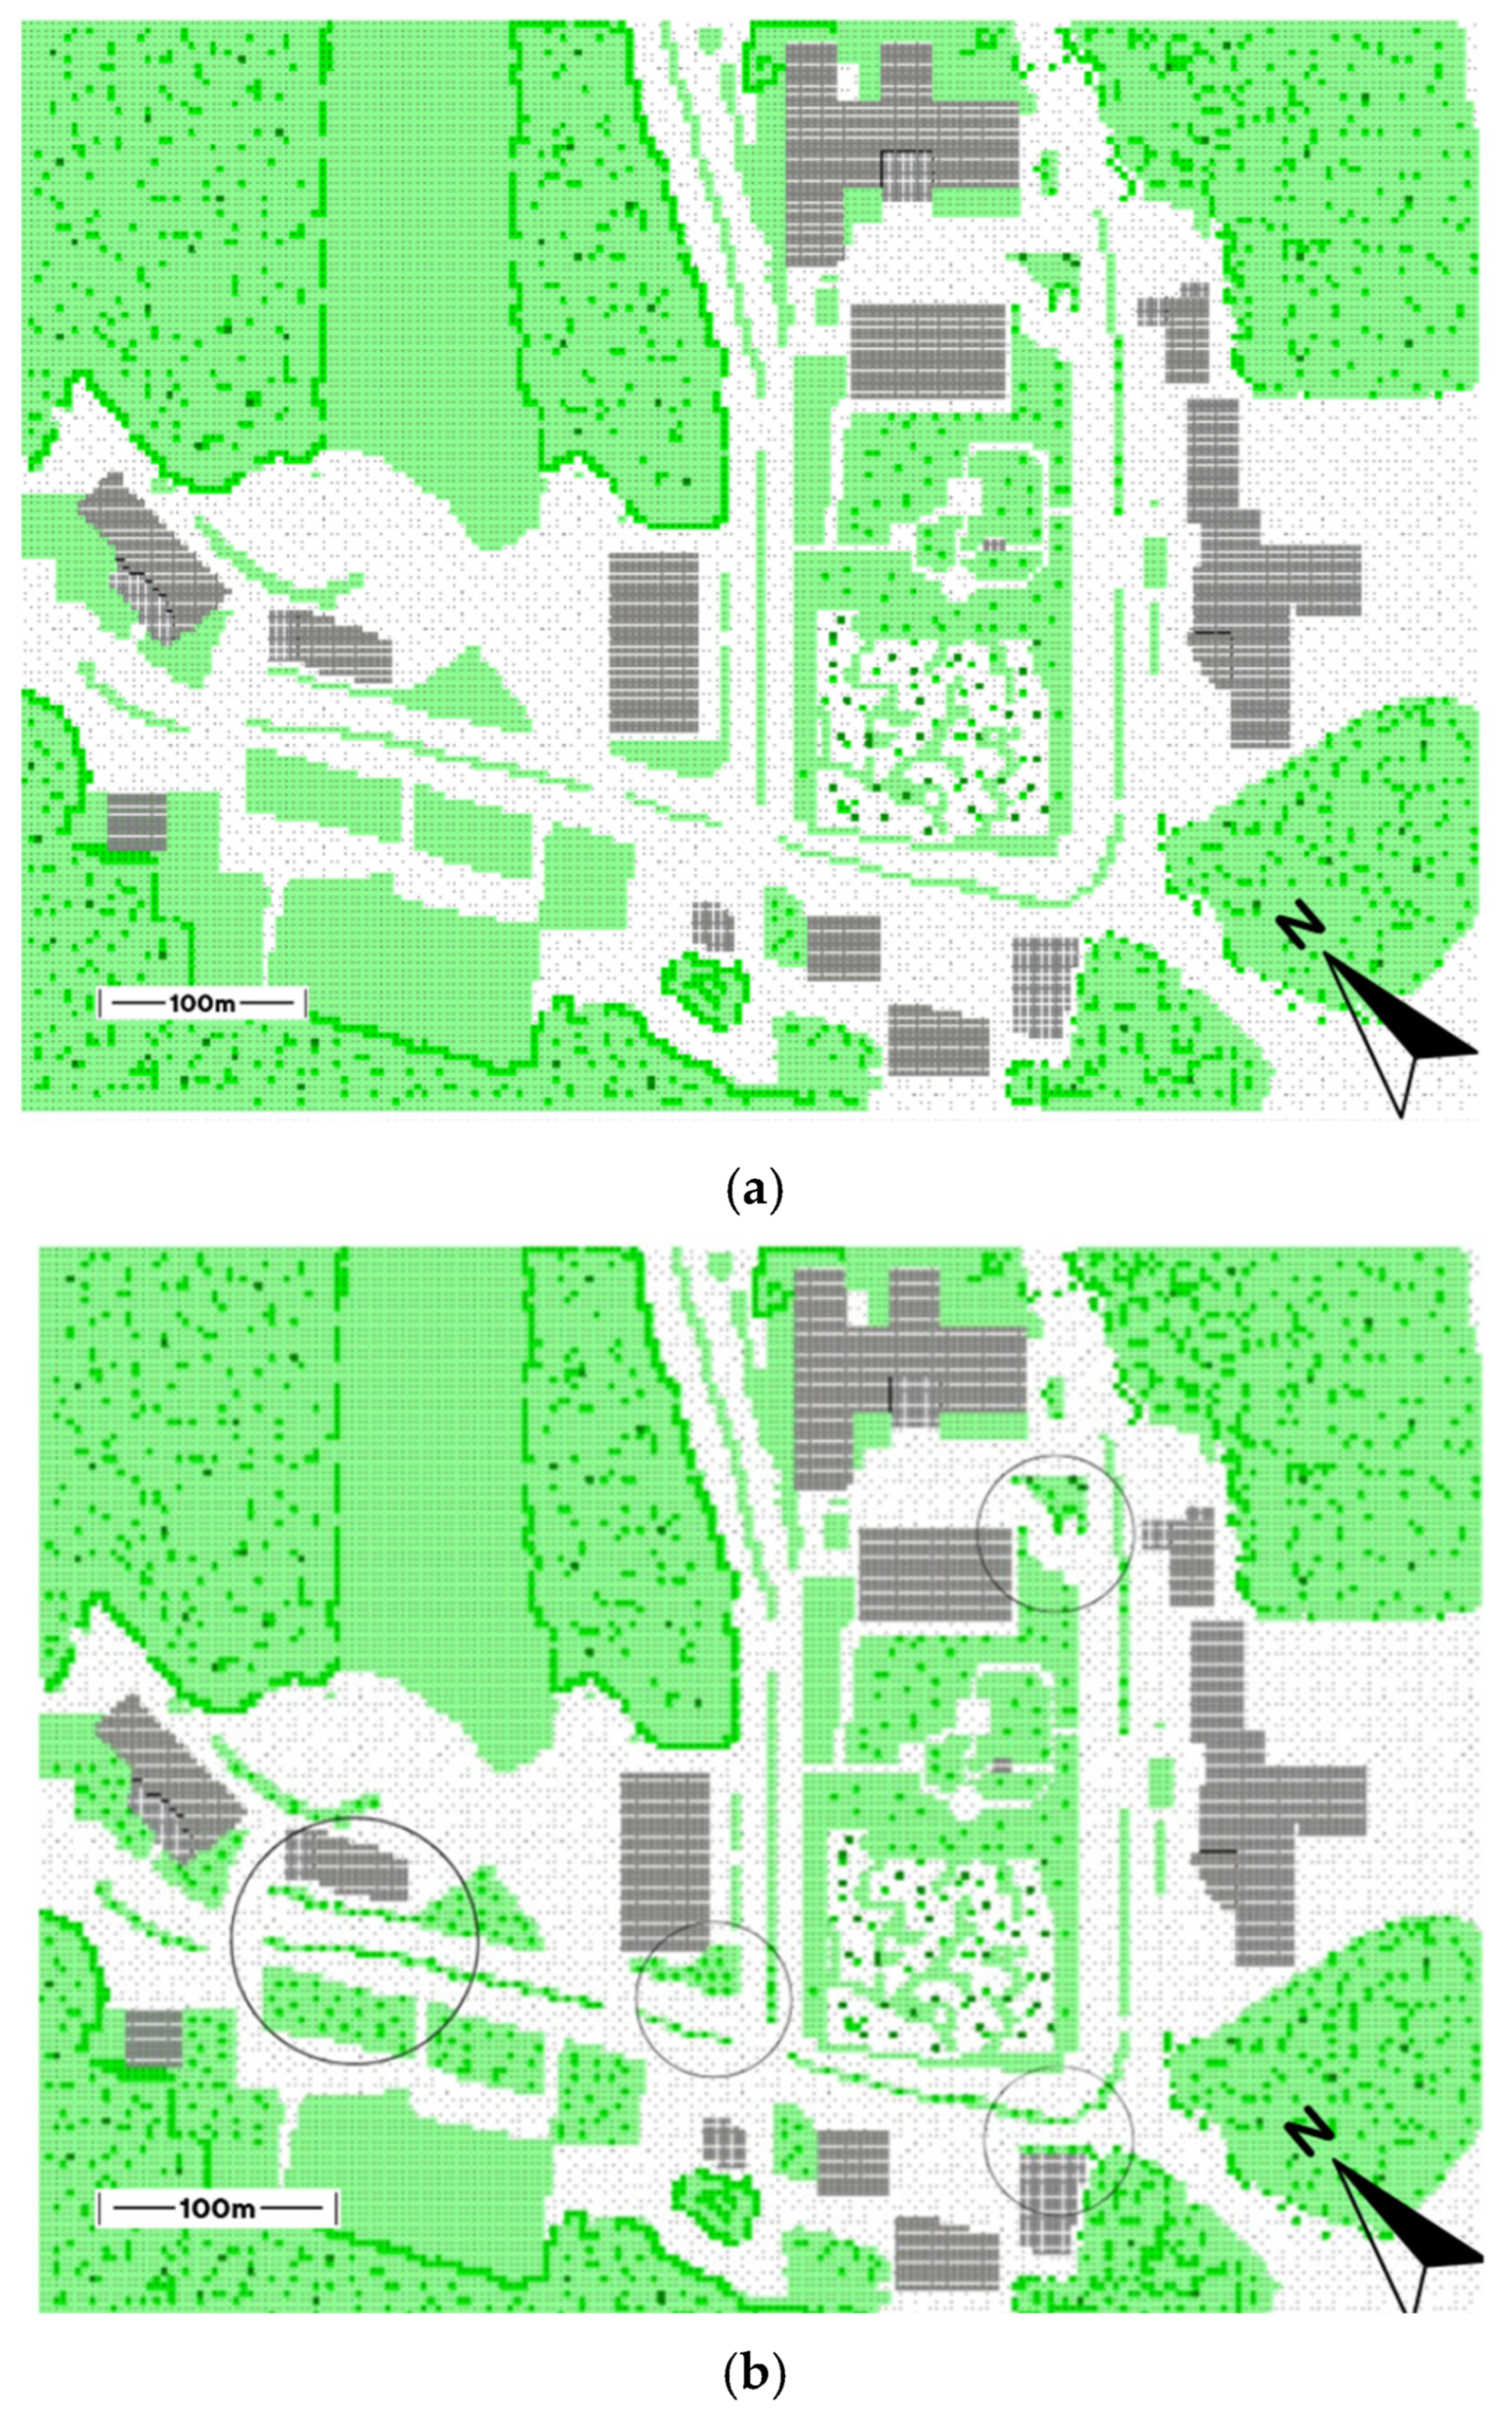
Figure 15 shows the scenario without trees (a) and the scenario with trees (b). These are inside the black circles, represented by green dots, which are distinguished by a stronger color of the grass.
Although the VLS Campus is characterized by extensive vegetation coverage, several internal areas remain without shading elements such as trees, awnings, or lightweight roofing. These unshaded zones register higher thermal sensations because both pedestrians and surfaces are directly exposed to solar radiation. As illustrated in
Figure 15, potential locations for additional tree planting (indicated by black circles) are proposed to mitigate heat stress and enhance outdoor thermal comfort.
In this study, the concept of “synergistic effect” was operationalized as the condition in which the combined application of two or more bioclimatic strategies produces greater improvements in outdoor thermal comfort than the maximum improvements obtained by each strategy in isolation. To evaluate this, ENVI-met simulations were conducted for both isolated and combined interventions, and the results were compared against the baseline scenario. A synergistic effect was considered present when combined interventions achieved a higher reduction in physiological equivalent temperature (PET), mean radiant temperature (MRT), or surface temperature than the best-performing single strategy. Previous research in Suzhou, China, demonstrated that integrated blue–green strategies (vegetation and water bodies) produced more pronounced cooling effects compared to individual interventions [
12]. Similarly, a study in Changsha, China, showed that the simultaneous application of water and vegetation extended the cooling distance to surrounding urban areas, reinforcing the synergistic benefits of combined bioclimatic strategies [
53].
4. Discussion
This study set out to explore whether bioclimatic techniques, individually or in combination, could significantly improve outdoor thermal comfort conditions in a tropical urban microclimate. The research began with the recognition that areas with preserved or restored ecological integrity tend to exhibit better thermal conditions than those affected by urban degradation. By simulating and validating both physical and perceptual thermal indicators, the study evaluated a range of bioclimatic strategies under real and modeled conditions.
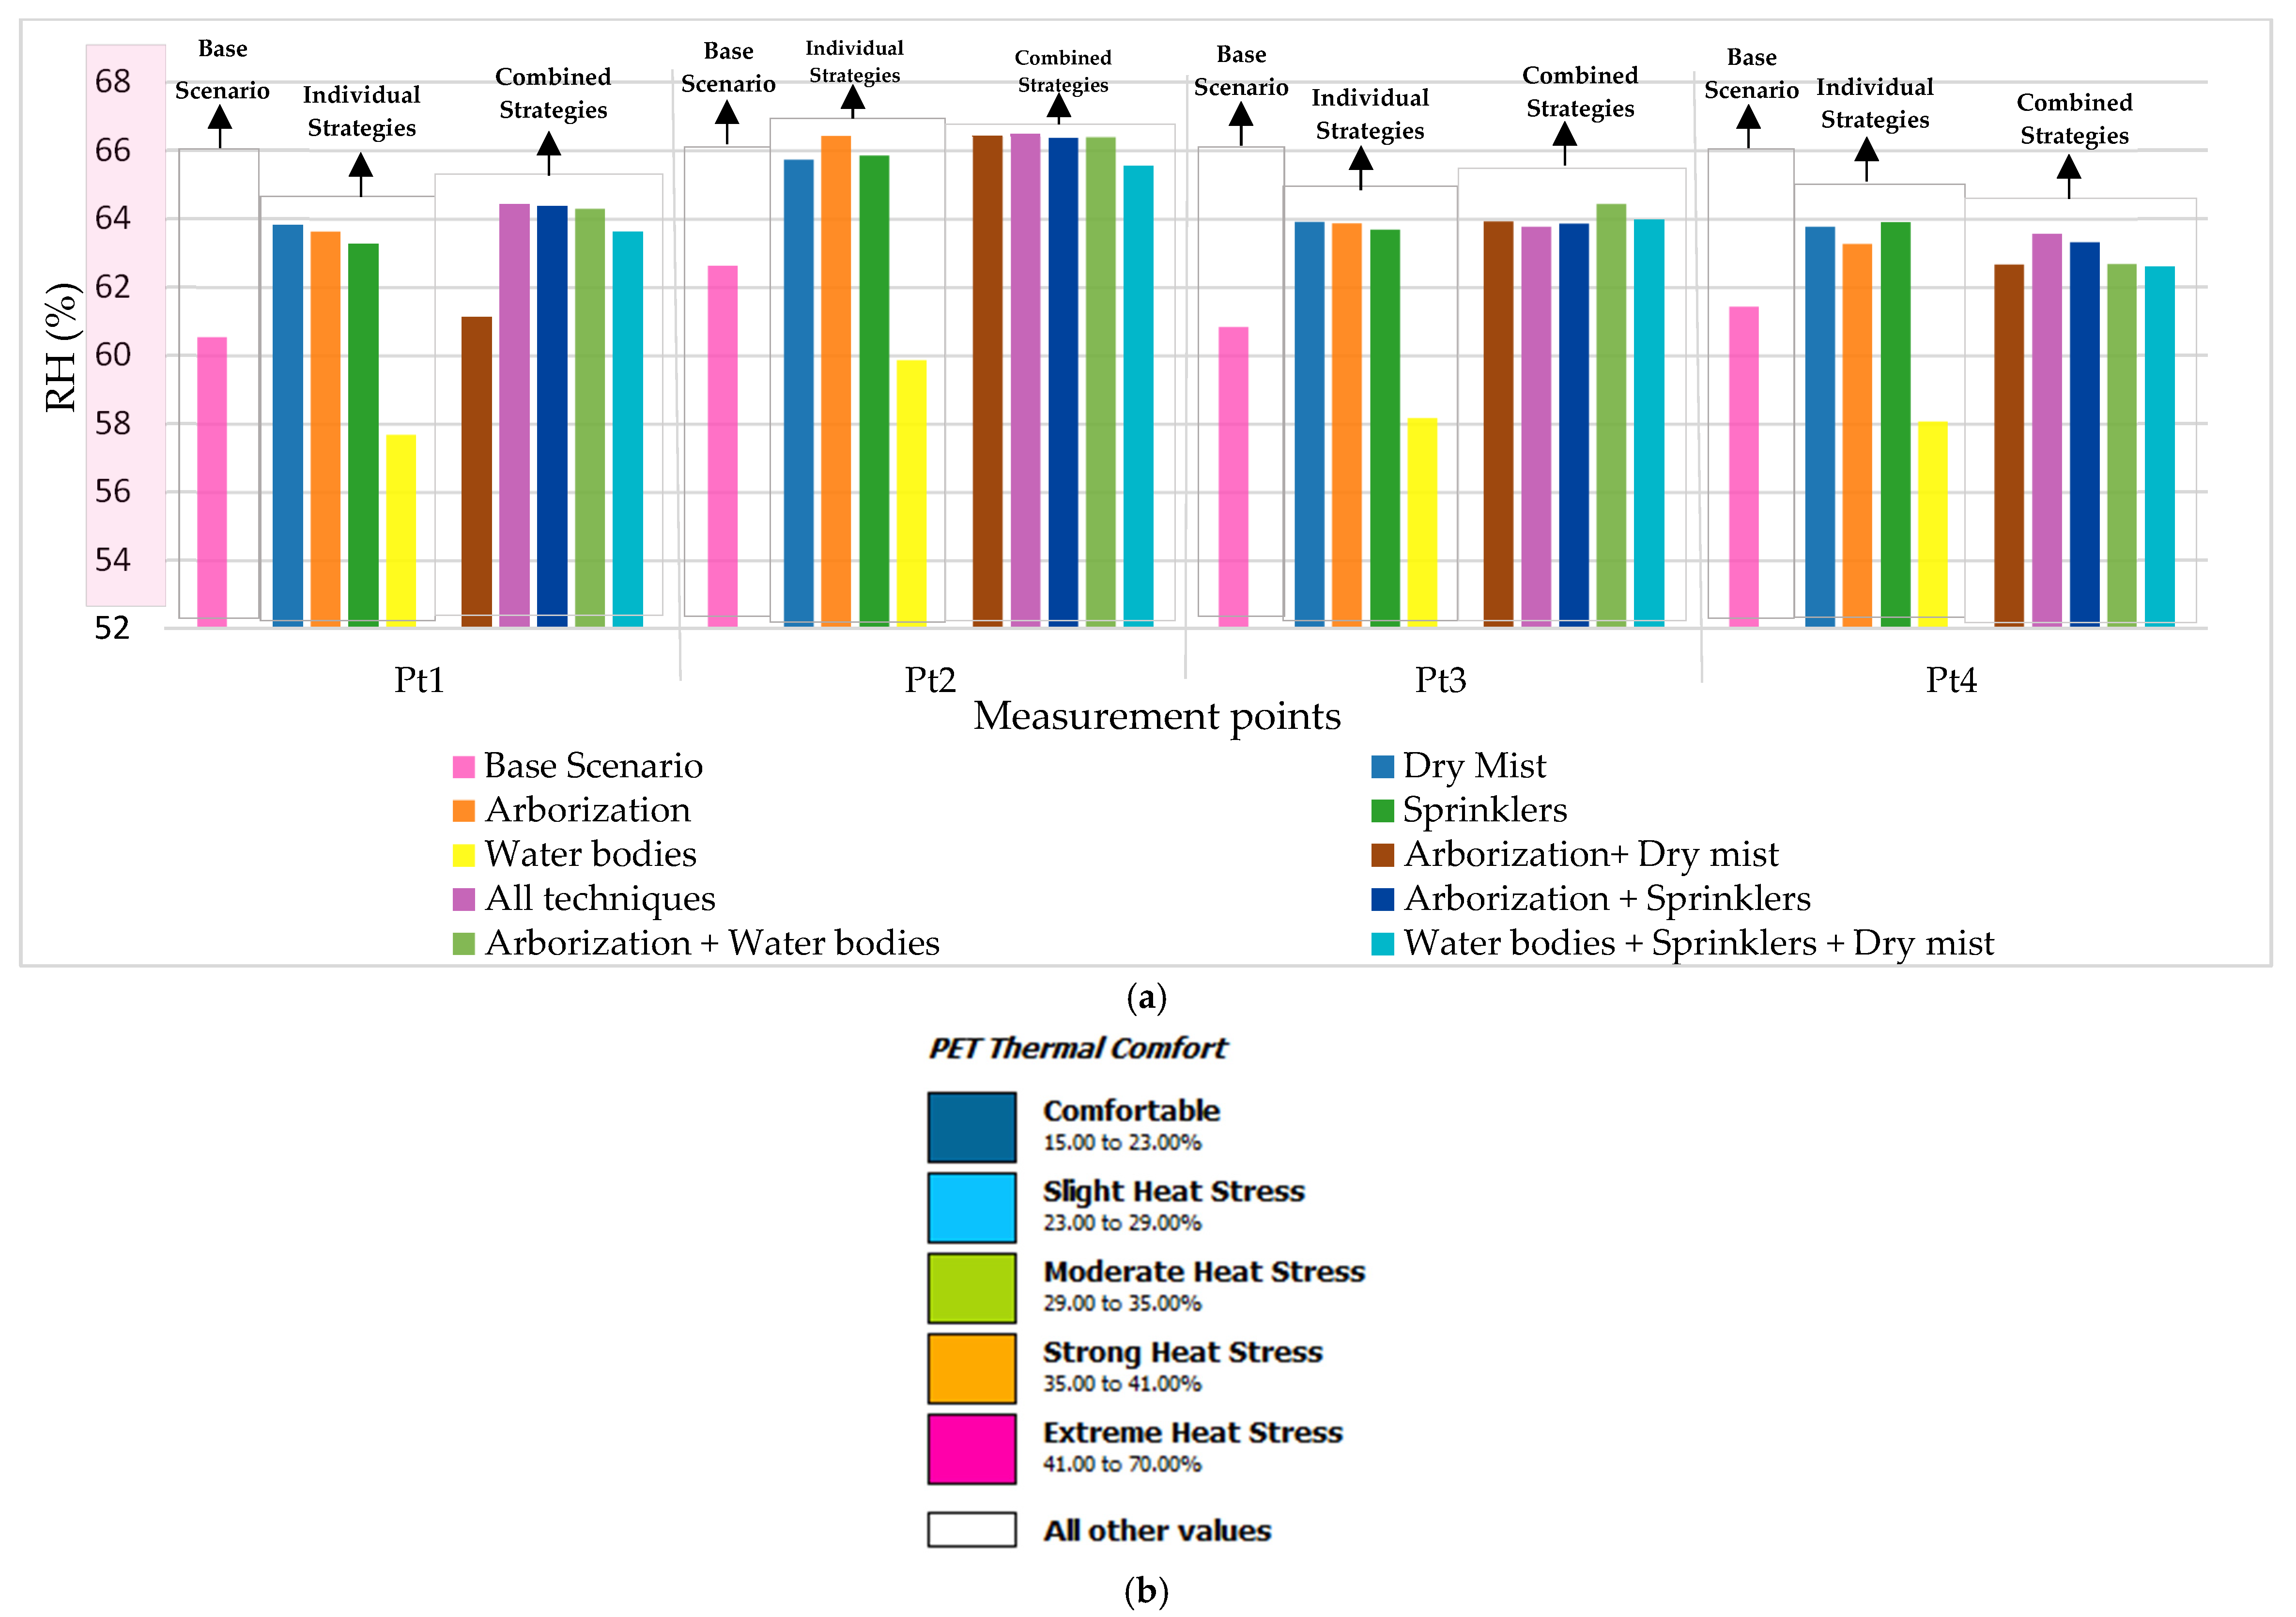
The results confirmed that each technique had a measurable effect on thermal comfort variables such as mean radiant temperature, surface temperature, and PET (physiological equivalent temperature). The use of evaporative cooling methods, such as dry mist and water sprinklers, increased local humidity, but did not exceed outdoor comfort thresholds, aligning with the findings of Haeussermann et al. [
15] and Zheng et al. [
16] in Singapore, where dry mist systems improved subjective comfort even under humid conditions. However, unlike Singapore, where such systems are supported by advanced maintenance protocols and recycled water networks, the feasibility of their adoption in Panama is constrained by higher operational costs and water demand, raising questions about long-term sustainability.
The effectiveness of arborization observed in this study, particularly in reducing surface and air temperature by several degrees, corroborates Karimi et al. [
13] in Tehran and Chen Austin et al. [
55] in Panama, who both reported 2–8 °C differences between vegetated and non-vegetated areas. Nonetheless, compared to Tehran’s drier climate, the cooling intensity in Panama was more moderate, likely due to high baseline humidity that reduces evaporative potential. This highlights how arborization results, while broadly consistent, are context dependent. Likewise, combinations of greenery and water bodies produced synergistic effects, reinforcing the “blue–green cooling” effect documented by Zhou et al. [
12] in Suzhou, China, and Qiu et al. [
53] in Changsha, where simultaneous vegetation and water strategies extended cooling distances up to 370 m. In Panama, however, this synergistic effect was more spatially constrained, suggesting that lessons from temperate or monsoonal regions cannot be transferred without adaptation.
Notably, this study also revealed that even under high humidity levels typical of Panama (RH > 75%), the application of these strategies did not saturate ambient air conditions. These findings support the outcomes from González-Cruz [
17] in Maracaibo, where passive evaporative systems successfully reduced structure temperatures by 2–3 °C without elevating indoor humidity, and from Haddad et al. [
14] in Darwin, where integrated bioclimatic strategies achieved temperature reductions of 11–15 °C at peak hours. Yet Darwin’s semitropical context with different rainfall regimes enabled larger reductions than those achieved in Panama, highlighting the role of water availability and climatic variability in determining performance.
Moreover, when comparing all scenarios against the base case, every bioclimatic intervention showed improvement in both objective indicators and subjective survey results. Although the majority of participants initially reported thermal discomfort, their responses under simulated intervention scenarios shifted closer to the ASHRAE- and Bedford-defined comfort ranges. This aligns with Ruiz et al. [
56], who showed that perceptual comfort assessments often capture thermal dissatisfaction not reflected in traditional indices like PPD. Still, compared with Ruiz’s findings in drier urban settings, participants in Panama expressed higher sensitivity to humidity increases, confirming that comfort trade-offs differ across tropical contexts
In this context, the current research demonstrates that tropical urban environments often considered challenging for outdoor comfort due to high humidity and solar load can benefit significantly from well-designed bioclimatic strategies. It validates, through both simulation and perception-based methods, that strategic combinations can outperform isolated interventions and that user experience must be incorporated into thermal comfort assessments for holistic planning.
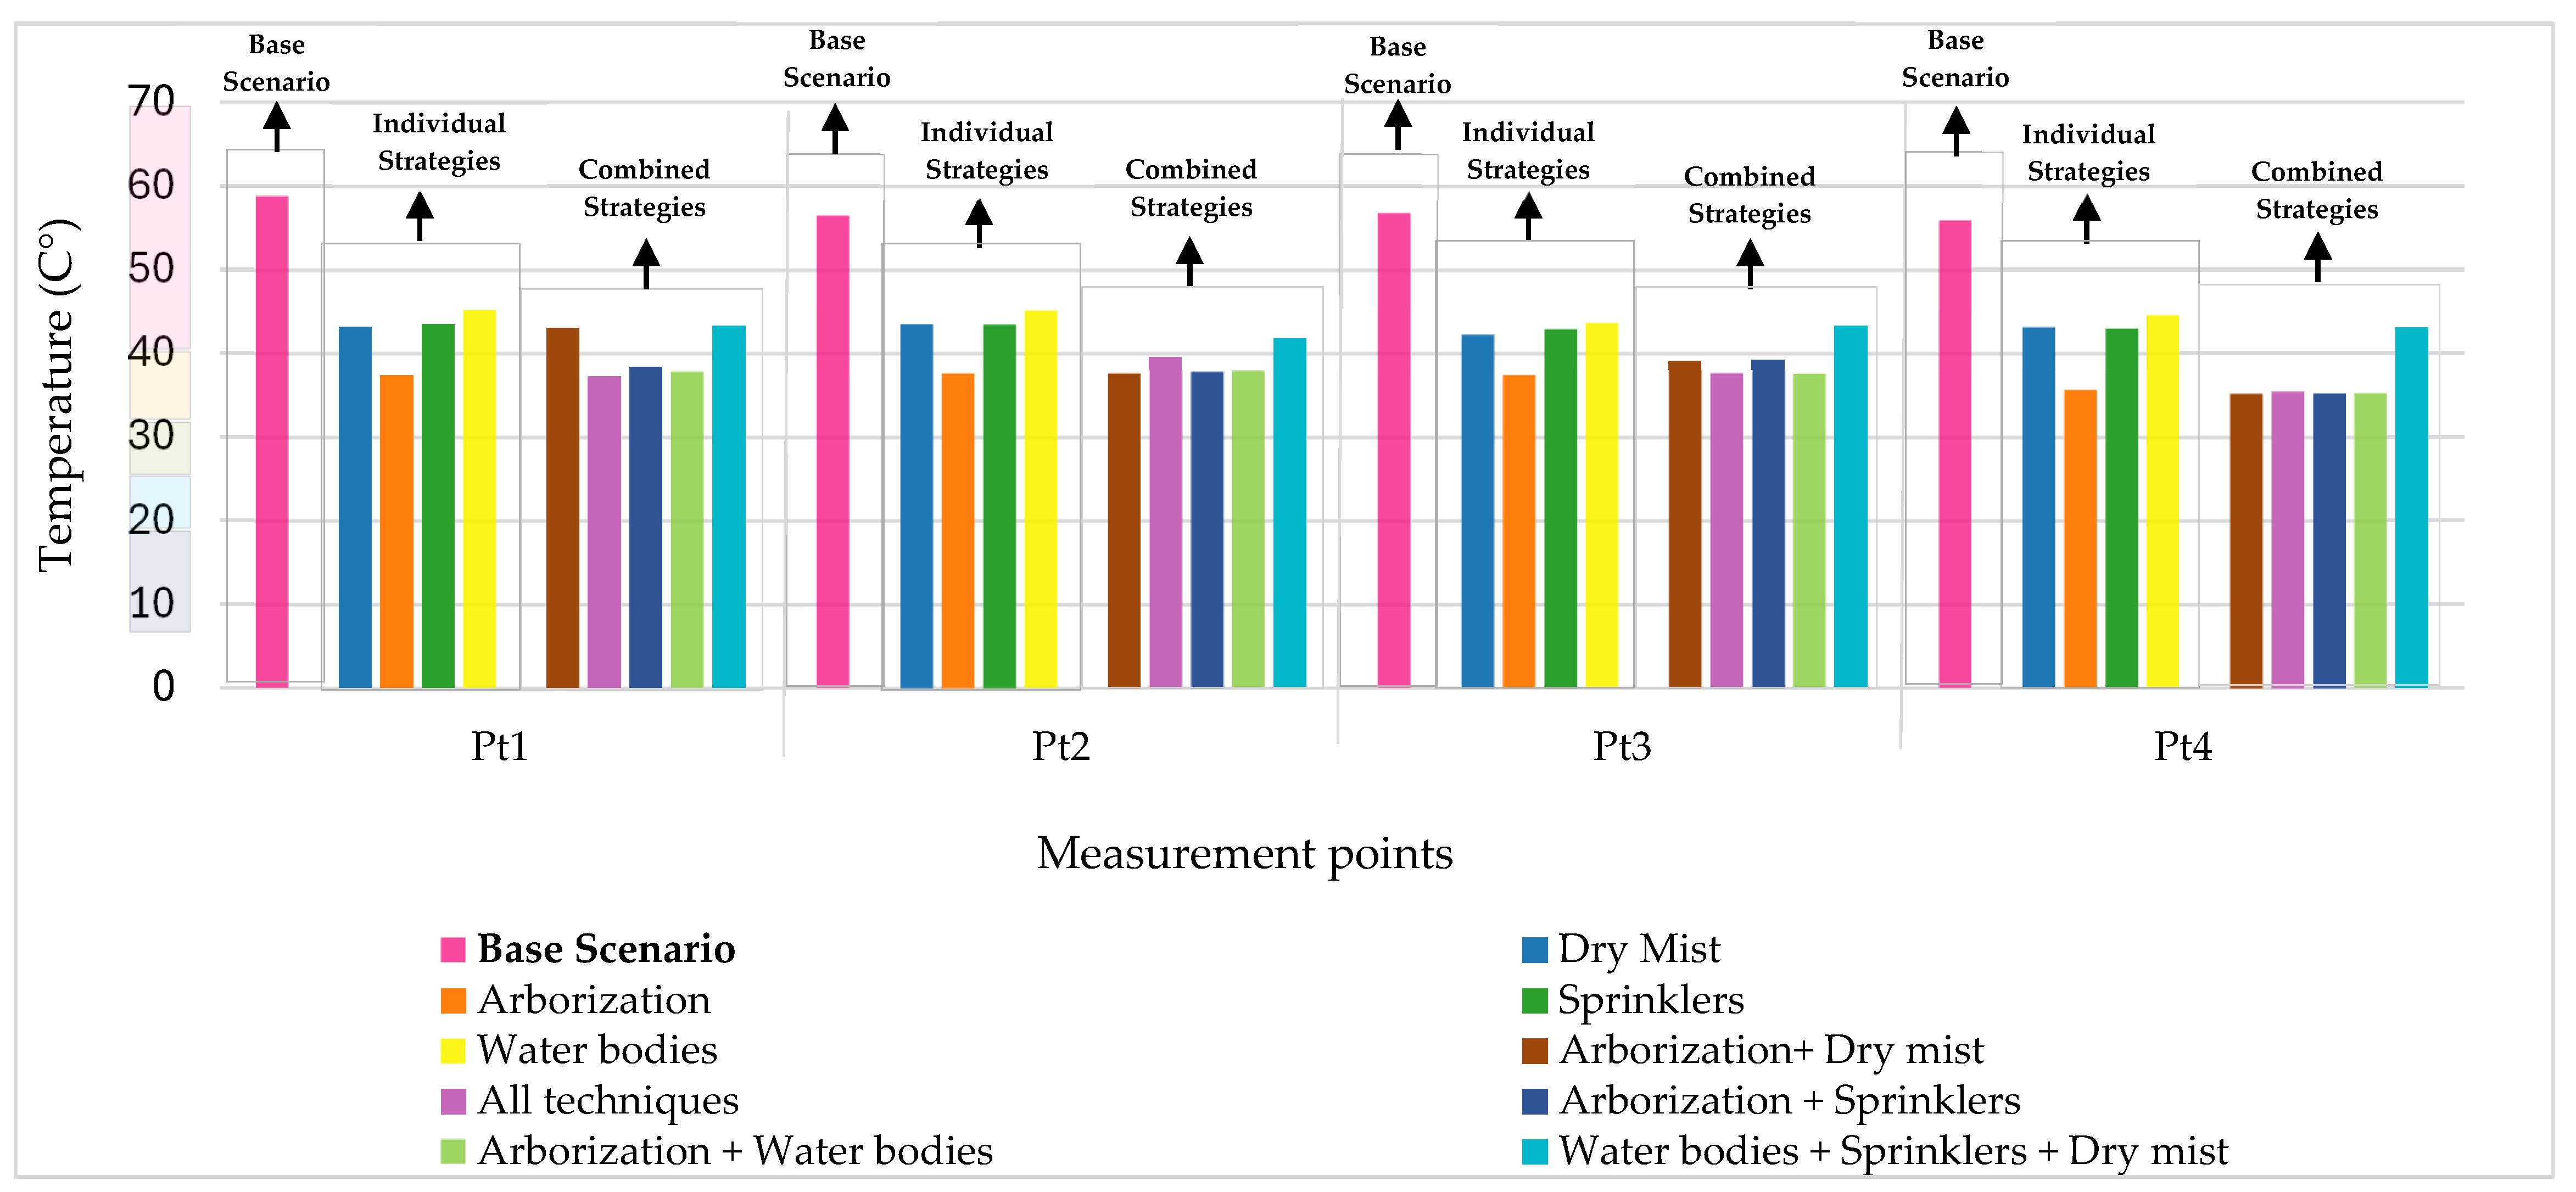
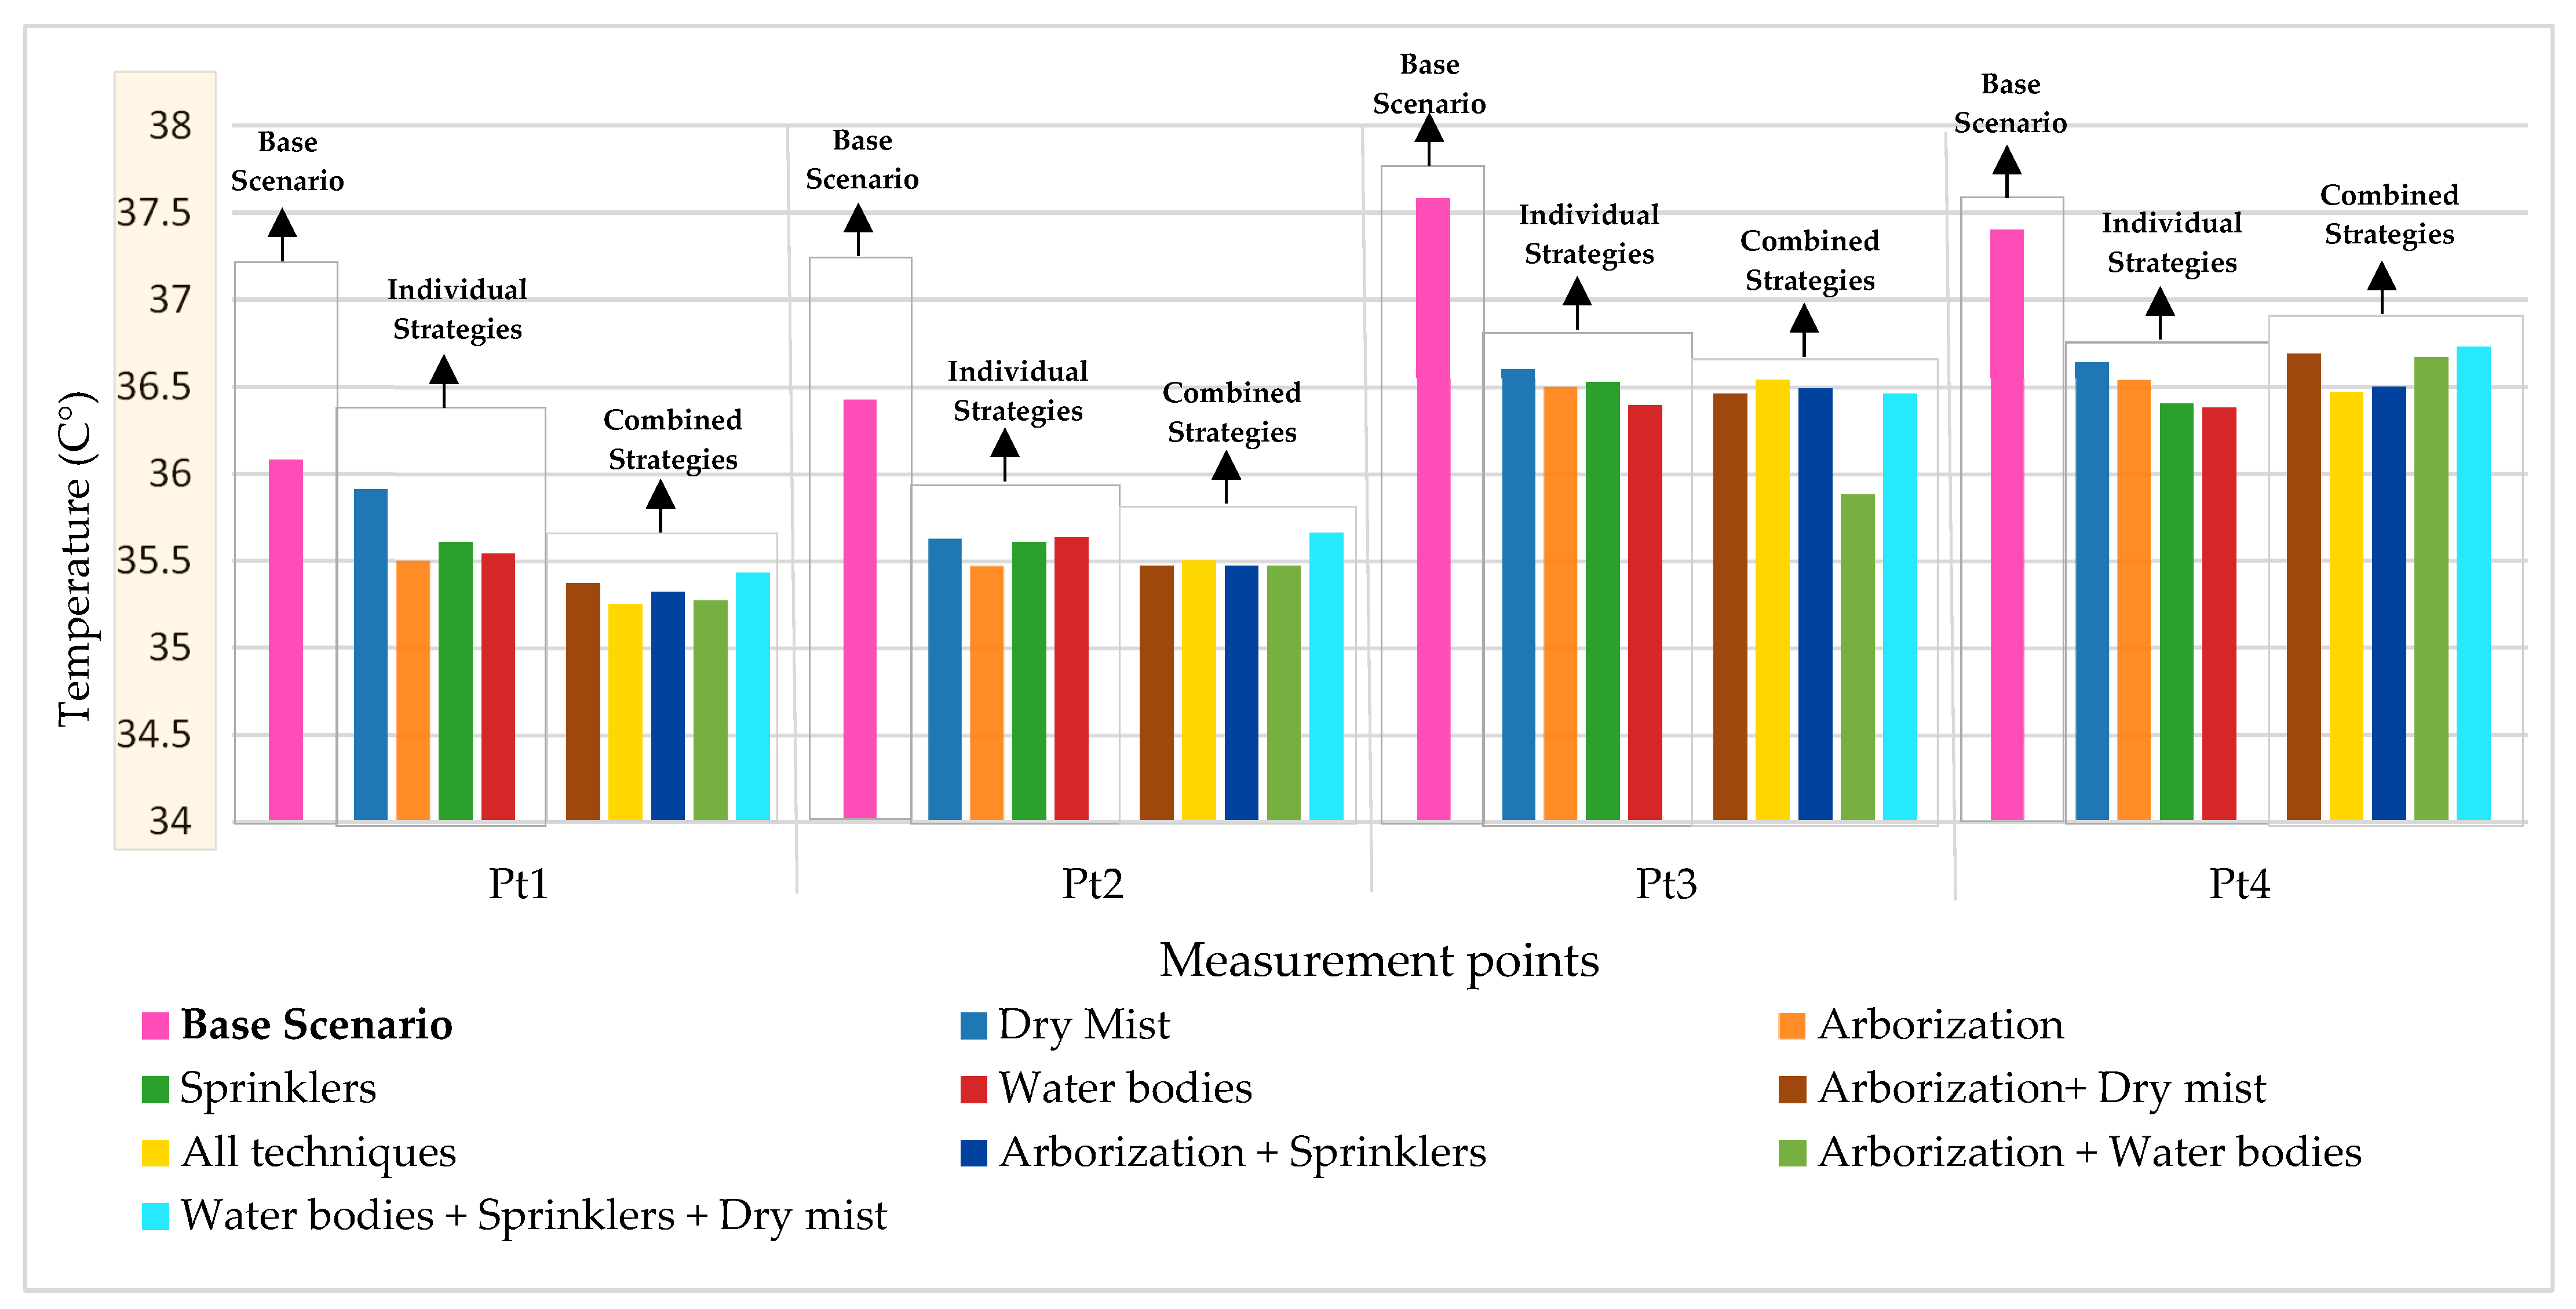
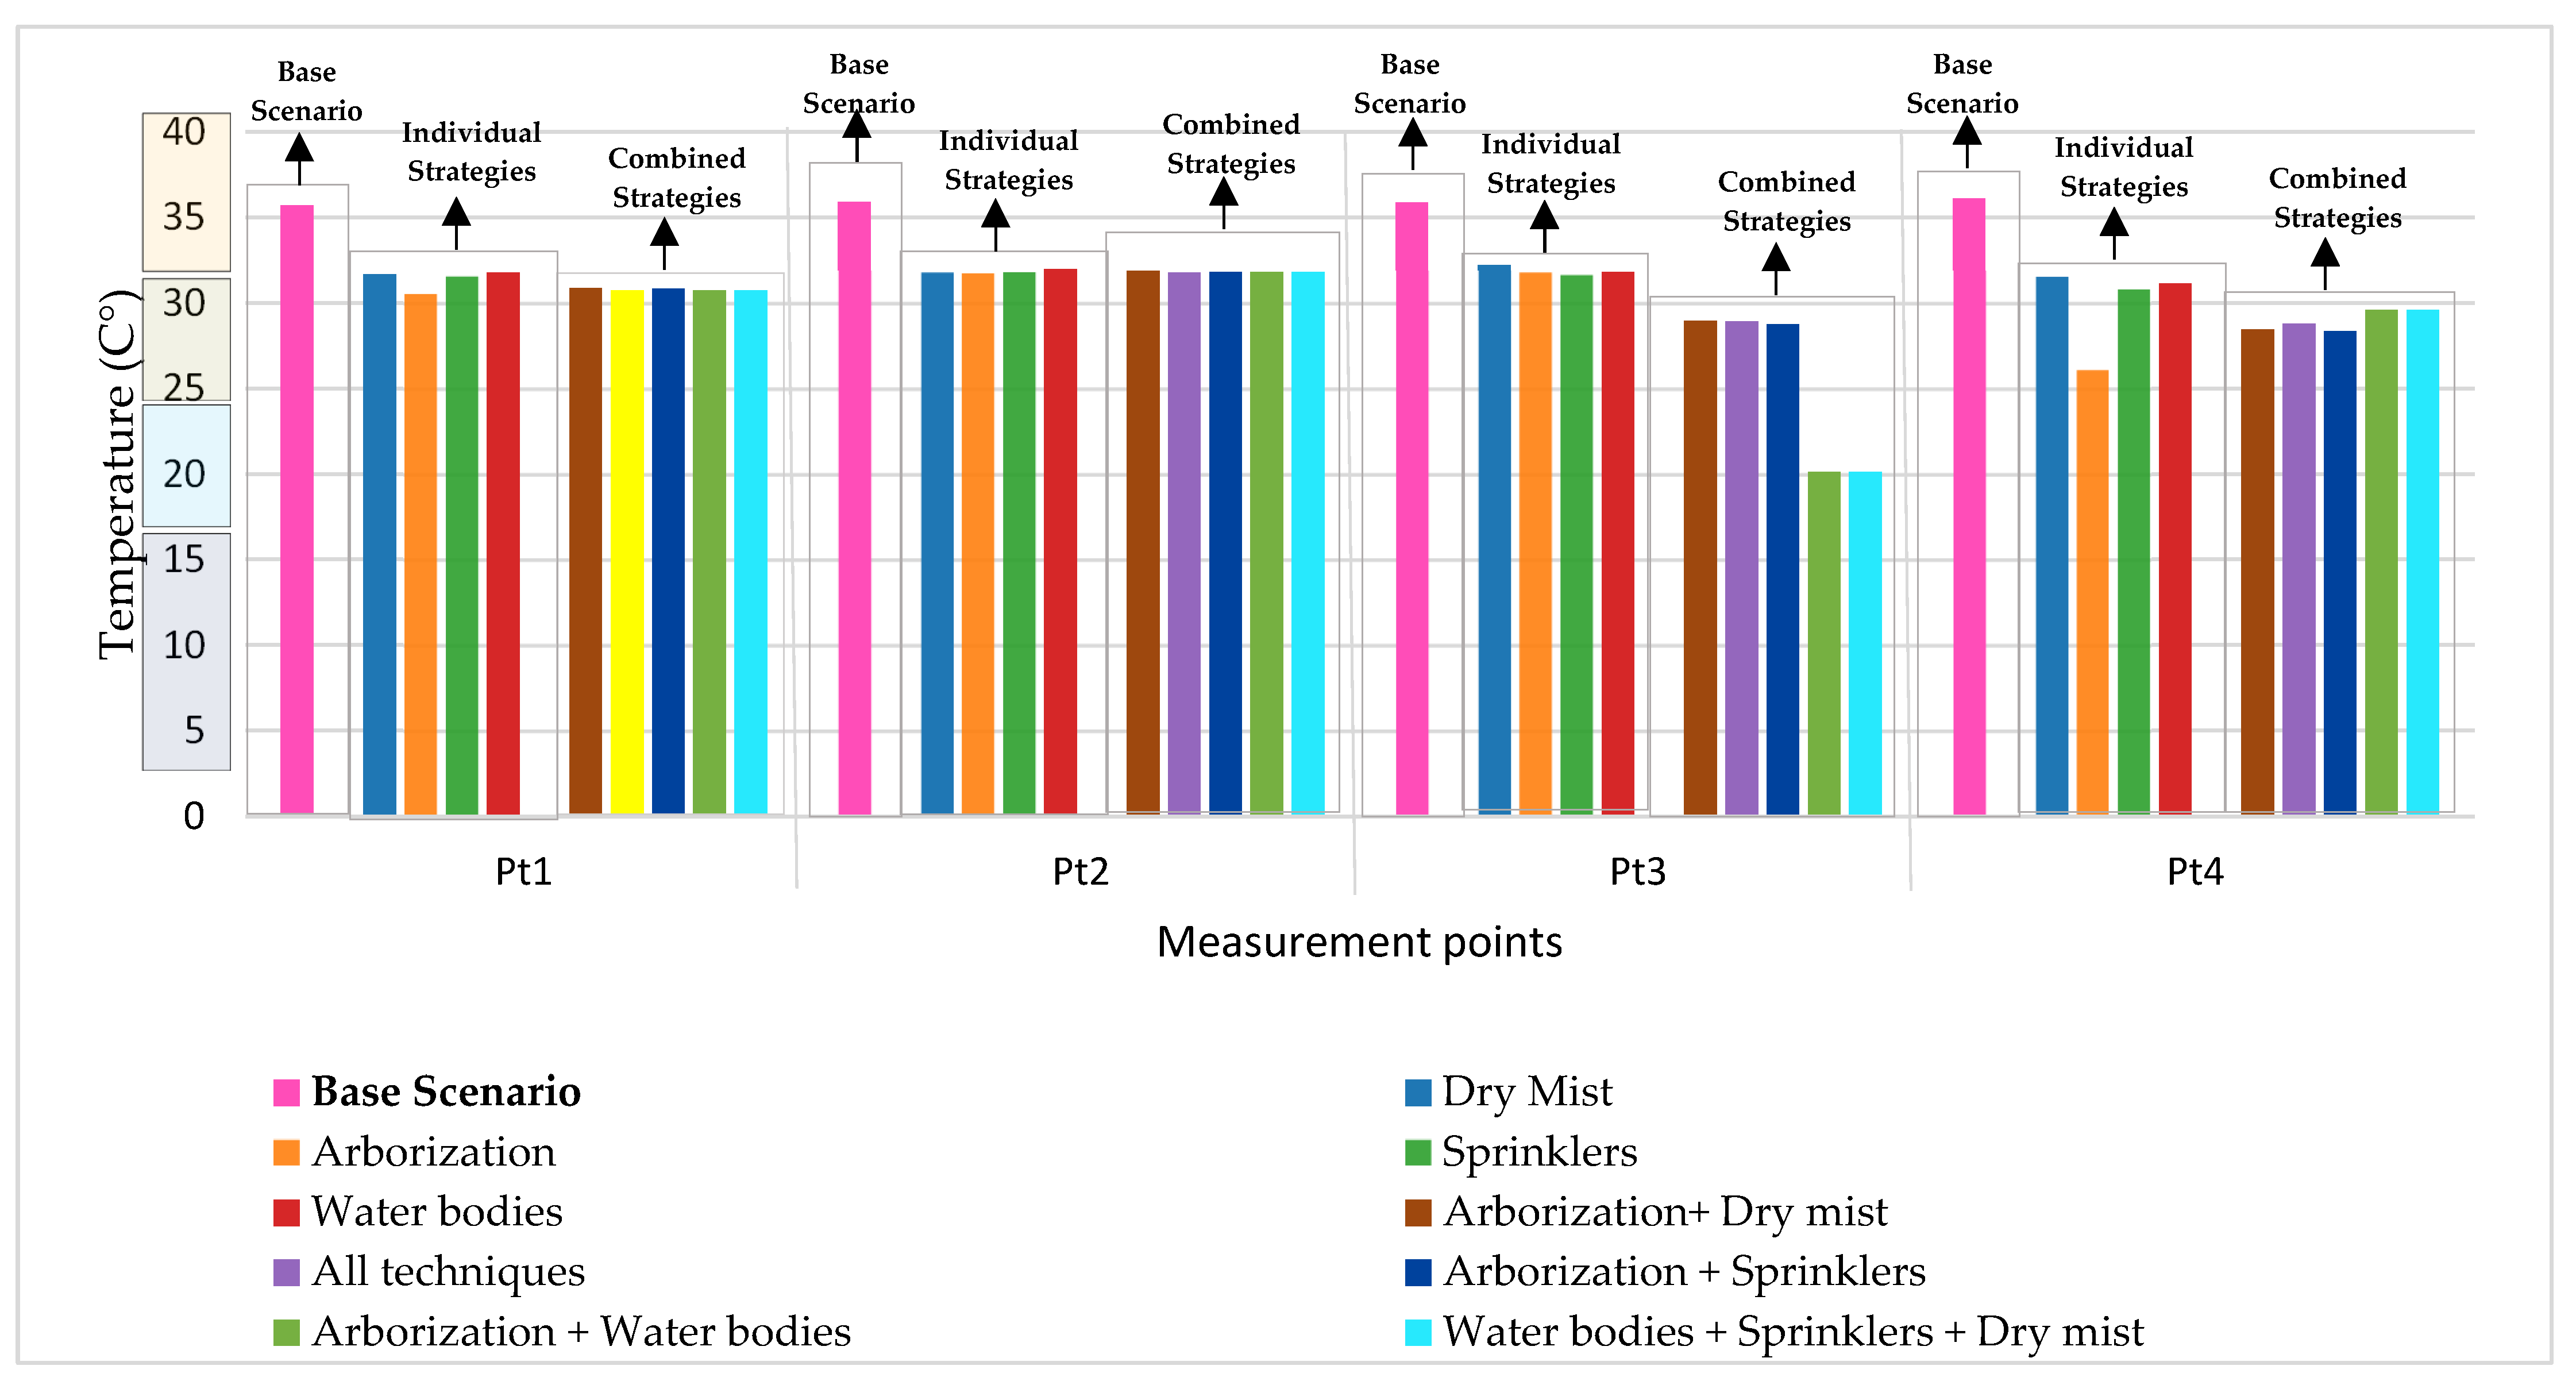
Among the tested alternatives, it was observed that not necessarily the combination of all bioclimatic strategies yielded the best performance. Rather, specific combinations such as arborization with water bodies or dry mist with shading produced more consistent improvements in thermal comfort variables. These combinations demonstrated synergistic effects without overloading the microclimatic conditions, avoiding issues such as excess humidity or reduced airflow. For instance, the pairing of arborization and water sprinklers provided significant reductions in surface and radiant temperatures while maintaining acceptable humidity levels, optimizing the perceived comfort reported in surveys.
Interestingly, the scenario that applied all bioclimatic techniques simultaneously did not yield the greatest improvements in thermal comfort. Although measurable cooling effects were observed, the excessive overlap of strategies, such as combining water bodies, mist systems, heavy arborization, and sprinklers, produced diminishing returns and in some cases undesirable side effects. The accumulation of humidity from both vegetation and water-based interventions risked creating muggy conditions, while spatial and visual saturation reduced airflow and openness, undermining pedestrian comfort. These findings suggest that bioclimatic design should avoid a “more is better” approach and instead prioritize context-sensitive combinations that achieve synergy without overloading the microclimatic balance.
This research contributes meaningfully to the existing literature by addressing a critical gap: the evaluation of bioclimatic strategies in combination, rather than isolation, under the specific climatic conditions of tropical, humid environments. Most previous studies focused on singular techniques or extrapolate data from temperate regions, reducing their applicability to urban tropical contexts. This study introduces an integrative framework that not only tests multiple strategies but also validates them through both physical and perceptual means.
The novelty of this research lies precisely in its emphasis on testing combinations of greenery, water, and evaporative systems and in tailoring these combinations to Panama’s unique climate. Additionally, the incorporation of field validation alongside numerical simulations allows for a more grounded and transferable approach. Future studies can expand this dataset and methodology to new urban zones, enabling local governments and urban planners to make evidence-based decisions in designing thermally resilient public spaces.
Overall, the findings of this study provide strong support for the central hypothesis that synergistic combinations of bioclimatic strategies deliver greater improvements in thermal comfort than isolated interventions. While not all combinations proved equally effective, specific pairings such as arborization with water bodies or dry mist with shading consistently outperformed single strategies by producing complementary effects on surface temperature, radiant load, and perceptual comfort. However, the results also demonstrate that excessive layering of all techniques may lead to diminishing returns, highlighting that synergy in bioclimatic design is achieved through selective and context-sensitive integration rather than maximal application. These outcomes reinforce the notion that well-chosen hybrid strategies can optimize outdoor comfort in humid tropical environments like Panama, thereby validating the hypothesis while also refining its scope.
In summary, while previous research in arid and temperate regions has consistently shown the effectiveness of isolated or combined bioclimatic techniques, evidence from humid tropical contexts has remained limited. The present study expands this body of knowledge by demonstrating that even under the persistently high relative humidity levels in Panama, synergistic strategies such as arborization, dry mist systems, sprinklers, and water bodies can still achieve significant improvements in both physical indicators and subjective thermal comfort. This finding highlights the adaptability of these techniques beyond dry climates, offering a valuable contribution to the scarce literature on outdoor thermal comfort in tropical Latin American cities.
Study Limitations
This study did not fully address the potential consequences associated with the implementation of bioclimatic strategies. For instance, evaporative techniques such as misting and sprinklers, while effective in reducing air and surface temperatures, demand significant amounts of water and regular maintenance, raising concerns about feasibility in tropical regions where water availability and operational costs may be limiting factors. Similarly, arborization, although beneficial for shading and cooling, can generate challenges related to tree pruning, root interference with infrastructure, and long-term maintenance of urban green systems. These variables, outside the scope of the present analysis, should be examined in future research to provide a more comprehensive evaluation of the environmental, economic, and logistical implications of bioclimatic interventions.
5. Conclusions
This research began with an initial question that led to the formulation of a hypothesis. The central concern was understanding why differences exist between areas that remain untouched or preserved by humans and those suffering from environmental degradation. A methodological framework was developed to collect a series of data points in order to assess the condition of these spaces and guide appropriate corrective measures. After simulating, measuring, and verifying the thermal sensation of users through surveys, a set of bioclimatic techniques, both individual and combined, were applied via simulation. The goal was to evaluate the degree of improvement in thermal comfort and to determine the circumstances under which each technique can be most effectively implemented.
After applying the selected bioclimatic strategies, the following conclusions were drawn:
- (i)
All bioclimatic strategies, whether applied individually or in combination, resulted in improvements in outdoor thermal comfort when compared to the baseline scenario.
- (ii)
These strategies positively influenced the environmental variables that affect external comfort.
- (iii)
Although humidity levels tend to increase due to techniques that rely on evaporative cooling, at no point do they reach saturation or fall outside acceptable comfort thresholds.
- (iv)
The most common subjective response among participants was a feeling of thermal discomfort, reinforcing the applicability of the proposed strategies during months with similar climatic conditions.
- (v)
The combination of bioclimatic strategies must be context-sensitive: not all combinations lead to better results, and in some cases, excessive overlap can lead to suboptimal microclimatic conditions due to increased humidity or reduced airflow.
- (vi)
The integration of physical simulations, field measurements, and perceptual surveys proved essential for validating the effectiveness of the interventions, reinforcing the value of using mixed methods in urban microclimate studies.
- (vii)
The results provide empirical evidence applicable to tropical urban environments, contributing new insights to the limited body of literature on the synergistic effect of combined bioclimatic strategies in high-humidity climates like Panama.
Quantitatively, the results confirmed the effectiveness of the synergistic strategies. Compared to the baseline scenario, the combined interventions reduced air temperature by up to 2.5 °C, mean radiant temperature by nearly 8 °C, and surface temperature by more than 12 °C in critical campus zones. Most importantly, the PET index decreased by an average of 4 °C, with peak reductions exceeding 5 °C, shifting thermal perception from very hot conditions at baseline to warm or slightly warm in the improved scenarios. This transition reflects not only a measurable cooling effect but also a perceptible improvement in pedestrian comfort. From the survey side, the proportion of respondents reporting neutral or comfortable sensations increased from less than 20% at baseline to nearly 50% under the combined scenario. Together, these findings provide robust evidence that bioclimatic strategies, when applied synergistically, substantially enhance outdoor thermal comfort even in humid tropical environment, where high relative humidity often limits the efficiency of individual techniques.


