Abstract
High-rise building facades offer an alternative site for installing photovoltaic panels, which are traditionally placed on rooftops. The unique spatial configuration of high-rise buildings, characterized by a small footprint area relative to their height, supports the application of vertical facades for this purpose. Photovoltaic panels installed in these areas not only generate electricity but also enhance the aesthetic dimension of the urban landscape. The proposed methodology uses the EnergyPlus software to simulate the electricity generation of photovoltaic panels mounted on the walls of high-rise buildings in the city of Kragujevac, Serbia. A technical, economic, and environmental analysis was conducted for two scenarios: (1) photovoltaic panels installed on two facade areas with the highest solar potential, and (2) photovoltaic panels installed on all four available facade areas. In Scenario 1, the annual reduction in electricity consumption, annual cost savings in electricity consumption, and investment payback period range from 13 to 38%, 11 to 31%, and 8.4 to 10.6 years, respectively. In Scenario 2, these values range from 23 to 58%, 18 to 47%, and 10.9 to 12.9 years, respectively. The results indicate that southeast and southwest facades consistently achieve higher levels of electricity generation, underscoring the importance of prioritizing high-performing orientations rather than maximizing overall surface coverage. The methodology is particularly efficient for analyzing the solar potential of numerous buildings with comparable shapes, which is a characteristic commonly found in Eastern European architecture from the late 20th century. The study demonstrates the applicability of the proposed methodology as a practical and adaptable tool for assessing early-stage solar potential and providing decision support in urban energy planning. The approach addresses the identified methodological gap by offering a low-cost, flexible framework for assessing solar potential across diverse urban contexts and building typologies, while significantly simplifying the modeling process.
1. Introduction
The building sector contributes to over 30% of the overall global final energy consumption, with residential buildings contributing 74% and non-residential buildings contributing 26% [1]. Currently, 50% of the global population lives in cities, with projections indicating that urban residents will make up 80% of the world’s total population by 2100 [2]. Within urban environments, the average annual electricity consumption per person is estimated to be approximately 3.1 MWh [3]. Moreover, since the residential sector represents one of the most significant contributors to both global energy use and associated emissions, innovative technologies such as building-integrated photovoltaic systems (BIPV) are gaining worldwide traction due to their capacity to provide on-site green electricity while achieving a favorable payback period [4]. The escalating global population and persistent rural-to-urban migration have led to a substantial increase in urban electricity demand. Historically, this demand has been predominantly met through the utilization of fossil fuels, leading to heightened concerns regarding environmental degradation. There is a clear imperative to shift towards an electricity generation framework devoid of environmental pollution, grounded in sustainable sources. Solar photovoltaic (PV) panels, using renewable solar energy without emitting greenhouse gases during operation, present a solution for addressing the energy demands of urban surroundings. Urban landscapes offer extensive building areas that are well-suited for the deployment of such systems. However, the deployment of PV is constrained by limited space, as rooftops are often the only available surfaces. To overcome this limitation, it is crucial to integrate PV into alternative elements of the built environment. Building facades represent an underutilized resource with strong potential to expand renewable energy generation in dense urban settings.
1.1. Justification of Building Facades as Locations for the Installation of PV Systems
Roofs are the primary sites selected for PV system deployment, while vertical facades are frequently disregarded. Vertical facades exhibit limitations, such as reduced solar radiation reception, particularly evident during the summer months, due to deficient inclination angles. Additionally, they are more affected by the impacts of the dense urban environment.
Nonetheless, rooftop areas frequently fall short in supplying sufficient renewable energy to fulfill the building’s requirements, as they are progressively utilized for green space purposes. Given the diverse architectural and energy demands of buildings, relevant portions of rooftop surfaces are designated for other functional systems. Considering that the area of vertical facades in forthcoming urban landscapes is projected to surpass the area of rooftops, it underscores a pivotal portion of the building surface for evaluating a city’s solar PV capacity [3].
The solar panels mounted on each vertical building facade exhibit varying maximum energy output throughout the day, resulting in a more evenly distributed energy production over time. East–west oriented facades can have a significant role in meeting heightened electricity demands during morning and afternoon hours when the sun is positioned at a lower angle in the sky. Vertical PV facades exhibit comparatively higher energy output during winter months as opposed to summer months, considering the sun’s positioning. Additionally, the incorporation of PV panels on vertical facades can enhance the energy efficiency of the building envelope.
Chen and Long [5] proposed a methodological framework combining solar radiation modeling, weather-adjusted panel performance, and a real-time electricity market revenue model to determine the optimal orientation for BIPV. By optimizing tilt angles for both rooftops and all facade orientations, the study enables a direct comparison of installation strategies. Results indicate that, although rooftop systems remain the primary option, PV panels on south-, east-, and west-facing facades can substantially improve overall energy output and economic performance. Notably, facade-integrated systems demonstrated a generation potential of five to fifteen times higher than rooftop installations.
High-rise buildings have a specific place in the research of vertical facades as locations for PV systems for two main reasons. The first reason is the large surface area of vertical facades that increases the potential for utilizing renewable solar energy. The second reason is that due to their height in the urban environment, high-rise building facades are more directly exposed to solar radiation compared to the facades of other buildings. PV systems installed on the facades have been investigated for commercial and residential high-rise buildings [6,7,8,9,10].
In their study, Chen et al. [6] investigated the influence of archetypes and confounding variables on a design optimization method for high-rise office buildings incorporating PV facades. They analyzed various archetypes by adjusting floor plan dimensions and configurations, while also considering diverse urban settings and internal heat gain levels as significant factors beyond designers’ influence. The research highlighted the critical importance of window geometry, thermal properties, and optical characteristics in the reference PV envelope design. The study observed that building plan shape had minimal influence on the weighting of different design parameters, whereas the shape coefficient displayed a nearly linear correlation with HVAC demand.
In their investigation, Hoseinzadeh et al. engineered a high-rise office building integrated with PV panels for electricity generation [7]. They assessed the feasibility of implementing these systems using Honeybee plugins within the Rhinoceros software. The PV panel system provided 51.3% of lighting electricity in February, achieving peak electricity production during this period. The performance of the PV system was validated by comparing it with experimental data from a PV station in Mashhad, Iran. The system’s electricity output totaled 354734.7 kWh/year, leading to an annual reduction of 87 tons of CO2 emissions attributed to greenhouse gases.
Vahdatikhaki et al. introduced a BIM-based generative design method aimed at optimizing the configuration of PV modules on building exteriors [8]. This method enables designers to account for the interaction among various factors, including building surface types, types of PV modules, module efficiencies, and the financial aspects of the PV system. They conducted a case study on a high-rise building in Montreal, Canada, generating multiple optimization design scenarios for both rooftop and facade surfaces. The study revealed that incorporating an extended study period in a higher number of deployed PV modules enhanced project profitability.
Xiang and Matusiak devised an architectural approach to facilitate the integrative design of Façade-Integrated Photovoltaics (FIPV) for residential high-rise buildings [9]. They proposed balcony prototypes and position arrangements specifically for high-rise structures, using Trondheim city in Norway as a case study. Through a series of simulations, analyses of daylight and solar radiation were conducted, complemented by theoretical calculations. The findings highlighted that side balcony arrangements exhibited superior performance in terms of interior daylighting and solar energy-producing aspects. The projected annual energy generated by FIPV, combined with roof-integrated PV, was determined to potentially cover up to 60% of household energy consumption in an 11-story high-rise.
Kosoric et al. developed a model for incorporating PV systems into existing high-rise residential buildings in Singapore [10]. The model was structured into seven phases, summarizing the role of each phase and enabling optimization at a detailed level. They conducted a systematic analysis of each phase, considering the problem-solving methods and procedures utilized. The authors advocated for the Vikor method, which is a multi-criteria decision-making technique, to evaluate design variants, select the optimal PV integration design, and conduct sensitivity analyses of the chosen design.
Recent studies have also extended the analysis of facade-integrated solar technologies to regions outside Europe. For example, Ghaleb et al. [11] investigated facade PV applications in Saudi Arabia’s hot and arid climate, showing that after accounting for architectural and structural constraints, only about 31% of facade surfaces remain suitable for PV integration, with significant variation across building typologies. Similarly, Sohani et al. [12] reviewed the performance and challenges of building-integrated PV in hot climates more broadly, and identified key issues, including reduced efficiency due to elevated module temperatures, facade design limitations, and the need for improved policy frameworks to support adoption. Together, these studies provide valuable insights from the Global South and underline that facade-based PV assessments must incorporate both climatic and architectural constraints to achieve realistic and transferable outcomes.
In the case study conducted in João Pessoa, Brazil, Gomes et al. [13] investigated the performance of a BIPV system installed on a vertical facade (monocrystalline silicon PV window) in a tropical coastal climate. They used both simulations via PVsyst and empirical measurements across different months to compare energy generation across orientations (east, west, north, south). The results indicate that east- and west-facing facades deliver significantly higher output relative to north and south orientations, due to more balanced solar irradiance during the day. Moreover, performance ratios differ significantly across orientations, emphasizing the decisive role of orientation in system efficiency. The findings highlight that, despite the abundance of solar resources in tropical urban settings, the effectiveness of facade-integrated PV systems ultimately depends on careful consideration of both orientation and design.
1.2. Solar Potential of Building Facades
Assessing the solar energy potential of building surfaces in urban environments is crucial before considering investments in PV systems. However, estimating this potential for existing buildings comes with several challenges [14]:
- -
- The non-optimal inclination and the shadings from the neighborhood buildings,
- -
- The shadings from trees,
- -
- The presence of architectural elements.
Advancements in computational power and modeling techniques have enabled solar potential in urban environments to be assessed on a macro scale using tools capable of manipulating large amounts of georeferenced data. Commonly applied techniques involve detailed 3D models, such as Light Detection and Ranging (LiDAR) [15,16,17] and Geographic Information Systems (GIS) [18,19,20].
Martinez-Rubio et al. presented a method for assessing the impact of solar irradiance and visualizing its effects on different areas of buildings within urban environments [15]. Their approach integrated LiDAR data with 5 min of horizontal irradiance data. The established algorithm generated maps illustrating solar radiation captured by urban building envelopes, enabling estimation of PV power generation based on geographic location and the influence of shading from adjacent buildings. Findings highlighted substantial evidence of shading effects caused by both the building itself and adjacent structures. Although shading plays a critical role in determining irradiation gradients, the orientation of facades emerged as the most pivotal parameter in maximizing irradiation levels.
Brito et al. explored the potential of utilizing facades to increase PV capacity within urban settings [16]. Their research was focused on two representative case studies located in Lisbon, Portugal, employing a digital surface model created from LiDAR measurements and local meteorological data for a typical year. The findings were combined with the estimated local electricity demand based on population distribution. Their annual evaluation revealed that the combined potential of roof and facade PV systems could surpass local non-baseload demand, potentially meeting 50–75% of the total electricity demand. Economically, their analysis demonstrated that payback times below 10 years are attainable with PV on roofs alone, whereas a 50/50 mix of roof and facade installations would result in payback times of 15 years, suggesting the economic advantage of rooftop installations compared to a mixed approach.
Polo et al. introduced an extensive methodology for modeling PV generation on building facades at an hourly resolution using accessible data and methodologies [17]. They utilized hourly data obtained from satellite-derived solar irradiance with high-resolution digital models generated from LiDAR data to estimate PV generation employing the Sandia model. This approach was applied to simulate the PV generation of five small arrays installed on the western, southern, and eastern facades of a building located in Madrid. The simulated PV output for the western and southern arrays demonstrated favorable agreement with monitored experimental data, exhibiting root mean squared errors of 8% and 12% for the monthly power estimated for the western and southern facades, respectively. However, the eastern facade posed greater challenges due to the variability of shadows cast by nearby large deciduous trees throughout the year, resulting in increased uncertainty in estimating shading influence.
Saretta et al. [18] introduced an innovative integrated 3D GIS-based strategy designed for the assessment of multi-family residential buildings. Their method incorporates data to evaluate the retrofit potential of building envelopes and enhances the accuracy of evaluating the potential of BIPV facades beyond conventional LoD2 benchmarks. The approach integrates GIS-based tools for analyzing BIPV facade potential, envelope energy retrofit potential, and urban energy balance. The implementation of this methodology demonstrated that improving the accuracy of urban data significantly impacts the BIPV retrofit potential of facades.
Liu et al. [19] introduced a methodology for the construction of rural 3D building models using publicly available satellite images and vector maps. This method enables precise evaluations of solar PV potential on rural rooftops and facades. The findings highlighted that rural rooftops facing south and north, along with facades facing south and west, exhibit the highest PV potential grades. North-facing rooftops with a slope of 30 degrees account for 32.7% of the total rooftop solar PV potential, emphasizing their importance in future evaluations. The proposed method is considered cost-effective and reliable for accurately assessing both micro- and macro-scale rural solar PV potential.
An et al. investigated the feasibility of integrating PV into buildings to meet residential electricity demands in Shenzhen [20]. They utilized GIS data, typical local meteorological data, and electricity demand to evaluate and analyze solar potential across various urban morphology characteristics in Shenzhen. The study highlighted the impact of urban morphology on the amount of solar radiation received by individual buildings. Using Rhinoceros, along with its Grasshopper and Ladybug plug-ins, the researchers assessed the solar potential of different areas. The study demonstrated that combining rooftops with high-performance facades could result in a promising payback period for the investment.
A possible problem with the mentioned techniques can be the absence of 3D digital data of buildings and their surroundings. Collecting and recording 3D data is a complex and expensive process. Consequently, LiDAR and GIS data are typically owned by municipal services and specialized companies and are not accessible in their original form. Even when accessible, processing this data requires specialized and costly software, which is often very complicated to use. These factors present significant obstacles to utilizing 3D data necessary for conducting solar and other energy performance analyses of buildings, particularly for individual researchers, small research groups, urban planners, and designers.
1.3. Research Framework
Rooftop PV systems have been extensively studied and widely implemented; however, the application of vertical facades remains underexplored, despite their considerable surface area and potential for electricity generation. This is especially relevant in dense urban environments, where rooftops are often occupied by HVAC or designed as green roofs, leaving little available space for solar panels. Previous studies have demonstrated the technical feasibility of facade-integrated PV; however, most have been constrained by the reliance on complex and costly three-dimensional (3D) datasets, such as LiDAR and GIS, which limit their replicability in regions where such data are inaccessible. The present research addresses the potential of vertical facades in high-rise buildings as viable locations for installing (PV) systems, with a specific focus on the case of Kragujevac, Serbia.
Serbia is an upper-middle-income, transition economy still converging toward EU income levels and reforming institutions after its socialist period. The country’s growth has been moderate and the economy remains vulnerable to external shocks and fluctuations, while the policy agenda remains closely tied to EU accession [21]. Progress in scaling up sustainable energy investment has been slow, as reflected in the country’s energy structure. In 2022, the primary fuel mix consisted of 65.7% of solid fossil fuels, 8.4% of oil and petroleum products, 7% of hydro power, 3% of natural gas, and only 15% of other renewables [22]. This distribution highlights Serbia’s heavy reliance on coal and its limited deployment of variable renewable sources such as wind and solar. Assessments by international institutions also point to an “ambition gap” in renewable energy targets, noting that faster mobilization of both public and private investment is needed to support the green transition. The European Green Deal [23] and the Renovation Wave for Europe [24] establish ambitious goals directly relevant to the integration of renewable energy, including solar, in the building sector. The Renovation Wave strategy sets the objective of renovating 35 million buildings by 2030 and doubling the annual energy renovation rate within the same period, with a strong emphasis on the deployment of renewable technologies in both existing and new buildings. In parallel, the European Green Deal calls for zero-emission standards for public buildings and highlights the need to increase the share of renewables in building energy consumption, particularly through on-site generation such as PV systems.
In recent years, Serbia has introduced several support schemes to stimulate the uptake of small-scale solar PV systems. However, most of these mechanisms are designed around feeding excess electricity back into the grid. In 2021, the government launched a rebate program covering up to 50% of rooftop PV installation costs, combined with a net metering framework that requires surplus electricity to be delivered to the national utility (EPS) [25]. Similarly, in 2023, EnerCEE notes that Serbia has long applied feed-in tariff schemes under which “privileged producers” are obliged to sell all generated electricity to the grid under guaranteed purchase agreements [26]. More recently, the regulatory framework for “prosumers” has been established [27]: households and small consumers can self-consume the electricity they generate. At the same time, any excess must be exported to the grid under a net billing or net metering arrangement, with specific capacity limits (e.g., up to 10.8 kW for households). Taken together, these instruments illustrate that while Serbia has introduced financial incentives for solar adoption, the regulatory framework remains strongly grid-oriented, requiring system owners to return surplus production rather than enabling fully autonomous off-grid operation.
This contextual background highlights a pressing methodological gap: while European strategies set ambitious targets for renewable integration, countries in economic transition such as Serbia require assessment approaches that are both technically robust and financially affordable, particularly in contexts where access to advanced datasets and technical resources is limited. This need motivates the development of a practical framework and guides the research questions of this study.
This study aims (1) to investigate how the solar potential varies across different facade orientations on high-rise buildings within dense urban areas, (2) to compare the technical, economic, and environmental performance of partial versus total facade area PV installations, and (3) to assess whether a simplified, low-cost simulation approach can provide reliable results that support decision-making in contexts with limited access to detailed geospatial datasets.
To address these questions, the study employs a mixed-methods approach that combines spatial analysis, simulation-based energy modeling, and economic and environmental evaluation. The proposed methodology for conducting solar analysis utilizes free software EnergyPlus, the free version of the SketchUp software (with a SketchUp Free subscription), and the free web service Google Maps. This approach enables the assessment of the solar potential of building facades without the need for complex LiDAR or GIS-based 3D datasets.
This study applies a detailed solar potential assessment to a representative sample of twenty-one high-rise buildings. The buildings are categorized by envelope typology, enabling a structured comparison of electricity generation from PV systems installed on their vertical facades. Based on simulation data, technical, economic, and environmental analyses were performed for two scenarios: (1) PV systems installed on the two facade areas with the highest solar potential, and (2) PV systems installed on all four available facade areas. The analysis assumes that the generated electricity is used for water heating, lighting, electrical appliances, cooking, space cooling, and other uses. For each high-rise building, it quantifies the annual reduction in grid electricity demand, the related cost savings, and the payback period. In this way, the study highlights how facade-integrated PV systems contribute both to economic viability and to the broader goal of expanding renewable energy use.
This study adds value by addressing the methodological and policy gap in applying facade-integrated PV within the specific economic and regulatory context of Serbia, offering insights relevant for other transitioning Eastern European countries.
The manuscript is structured as follows: Section 2 outlines the materials and methods, detailing the contextual analysis, building modeling procedures, simulation setup, and the approach to economic and environmental assessment. Section 3 presents the simulation results for solar potential, electricity generation, and the associated technical, financial, and environmental indicators. Section 4 discusses the findings concerning previous research, highlighting the implications for urban energy planning and the potential scalability of the proposed methodology. In addition, the discussion explicitly outlines the limitations of the study to ensure a transparent interpretation of the results and to indicate directions for further work. The manuscript concludes with final remarks and outlines directions for future research, building on the findings of this study and guiding further development of the proposed framework.
2. Materials and Methods
The methodological framework adopted in this study follows a mixed-methods approach, combining qualitative and quantitative techniques alongside sustainability assessment tools:
- (1)
- Contextual analysis and site selection, involving spatial assessment and on-site collection of architectural and morphological data relevant to the study area;
- (2)
- Simulation-based modeling, drawing on empirical data—including material characteristics, site-specific climatic conditions, and contextual features of the urban environment—to assess the building’s energy performance;
- (3)
- Economic and environmental assessment aimed at quantifying the financial viability and ecological impact of the proposed interventions.
This methodological approach captures both spatial and climatic characteristics of the case study, enabling a precise and context-aware assessment of building performance. Detailed descriptions of each methodological step are provided in the following sections.
2.1. Research Context and Case Study Area
The research includes an assessment of solar potential by simulating the electricity generated from PV panels installed on the vertical facades of high-rise buildings in the city of Kragujevac, Serbia. In this study, a high-rise building is defined as a freestanding structure with ten or more floors, located on a separate plot and not adjacent to neighboring buildings on any side [21]. There are not many high-rise buildings in Serbia; they are buildings representative of the construction period from the second half of the 1960s until the end of the 1980s. In Serbia, multi-family housing built during the second half of the 20th century was realized mainly through state-led mass housing programs. These initiatives relied on industrialized and prefabricated construction systems to rapidly and cost-effectively expand the housing stock. Prefabrication was expressed in the use of standardized modules and elements, such as facade panels, wall components, and floor slabs. These building typologies shared uniform facade structures and repetitive elements. This enabled faster construction, reduced labor and material costs, and introduced a high degree of uniformity in apartment layouts and building blocks. The design principles were guided by functionality, rational planning, and the fulfillment of minimum comfort standards of the time, with straightforward forms and efficient communal spaces, but with limited attention to energy performance or integration of renewable technologies.
The period from 1946 to 1960 marked the beginning of high-rise building construction, accounting for only 1% of the total buildings constructed during that time. From 1961 to 1970, high-rise buildings accounted for 5% of new constructions, and from 1971 to 1980, they represented 11% of new constructions. However, between 1981 and 1990, there was a decline, with high-rise buildings accounting for only 3% of new constructions. From 1991 to 2012, no high-rise buildings were constructed [21]. This shift was influenced by changes in urban development policies, restrictions on the maximum allowable height of new buildings, and economic conditions. The trend persisted until the end of the period, when, driven by market forces, opportunities for planning and constructing high-rise buildings reemerged—particularly in Belgrade, the capital of Serbia.
Following the socialist period, housing policy shifted, and direct state construction diminished [22]. Standards for comfort and energy efficiency did not automatically align with contemporary requirements, while policies for maintenance, facade renewal, and energy retrofitting remained fragmented. This legacy defines much of today’s housing stock in Serbia and highlights both the challenges and opportunities for integrating new energy systems, such as facade-mounted PV, into existing buildings.
This study focuses on twenty-one high-rise buildings located in the center of Kragujevac, Serbia (44.0128° N, 20.9110° E) with an elevation of around 200 m above sea level. Since multiple high-rise buildings with identical envelopes were often constructed in specific locations during the same periods, the analyzed buildings were categorized into six groups (clusters).
The grouping of buildings was based on a typological classification developed in line with the principles of prefabricated modular construction that shaped Serbian mass housing. The classification considered footprint area, number of floors, and the configuration of the building envelope. Within each group, facades are uniform, while the differences between groups correspond to distinct housing types. In addition to morphological criteria, buildings with the same characteristics were also clustered by location, as they were commonly arranged in open block structures (Figure 1).
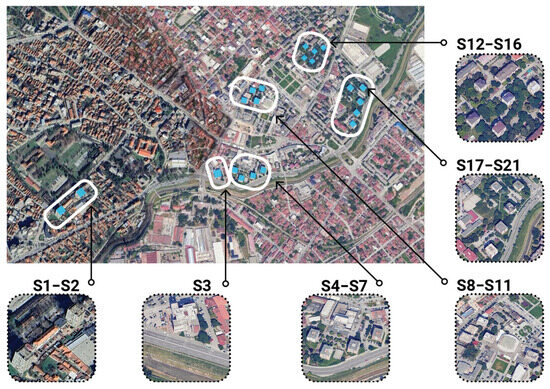
Figure 1.
Grouped high-rise buildings in the center of the city of Kragujevac.
Table 1 summarizes the group labels, number of high-rise buildings in each group, construction period, footprint area, and number of floors. Figure 2 illustrates the building groups along with representative samples of typical high-rise envelopes, highlighting their spatial arrangement on the site and the orientation of individual facades.

Table 1.
Basic characteristics of high-rise building groups.
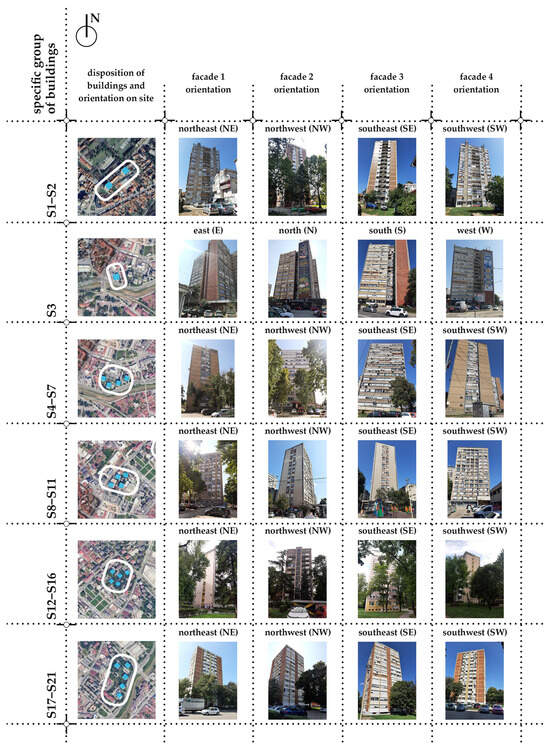
Figure 2.
Typological groups of high-rise building clusters with representative facade orientations (NE, NW, SE, SW) used for the simulation analysis.
This clustering approach provides a consistent framework for analyzing the solar potential of high-rise building envelopes across representative typologies.
2.2. Data-Driven Simulation for Building Energy Assessment
Data-driven simulation for evaluating the energy performance of high-rise buildings involves creating 3D digital models based on site-specific architectural and morphological data. These models are then used in simulations that incorporate localized climatic conditions and technical specifications of PV systems to estimate solar energy potential accurately.
2.2.1. Modeling of High-Rise Buildings and Their Surroundings
The SketchUp software (with the Legacy OpenStudio plug-in) was used as a graphical editor for preparing input simulation files for the EnergyPlus software, as well as for modeling high-rise buildings and their surroundings.
The data required for modeling the buildings and their environment were obtained through two methods: (1) the use of available digital data, including 3D models and building footprint polygons for both high-rise and surrounding structures, and (2) on-site data collection, which involved documenting window arrangements on building envelopes and recording the location and height of nearby trees.
High-rise buildings were modeled with a focus on their external envelopes, particularly the facade surfaces suitable for PV panel installation. The spatial placement of each building was achieved by accurately positioning it on a map imported from the Google Maps web service. On the same map, surrounding buildings and trees were also modeled as objects capable of casting shadows on the high-rise building models (Figure 2 and Figure 3).
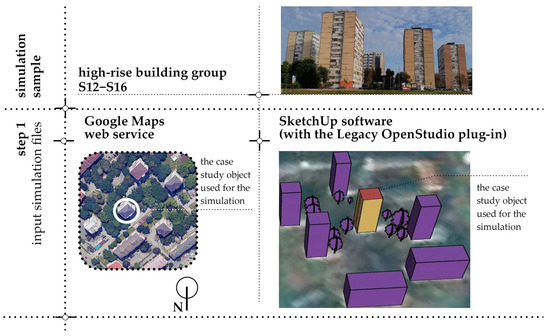
Figure 3.
First step of the simulation workflow: integration of Google Maps data with SketchUp (Legacy OpenStudio plug-in) for georeferenced modeling of high-rise buildings and their surroundings.
2.2.2. Simulation of Electricity Generated from PV Systems Installed on Vertical Facades of High-Rise Buildings
Simulations of electricity generation from PV panels were conducted using the EnergyPlus software (version 8.7.0) [23]. EnergyPlus is widely utilized across various research domains and is continuously being developed, with each new version offering enhanced functionality and performance.
In the modeled high-rise buildings, two opposing facades are fully covered with windows, while the remaining two facades feature two surfaces separated by a vertical column of windows (Figure 4).
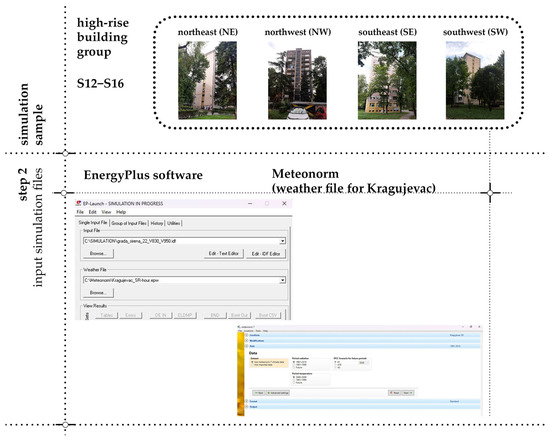
Figure 4.
Initial step of the simulation process in EnergyPlus, showing the setup of input files for modeled high-rise building facades.
This means that PV panels can be installed on four facade surfaces of each high-rise building, with each pair of surfaces facing opposite directions.
An exception is high-rise building group S3, where all four PV-installable surfaces are oriented toward different directions (Figure 5).
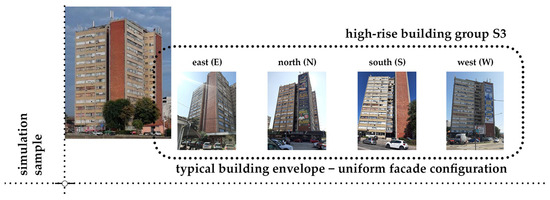
Figure 5.
High-rise building group S3 with a uniform facade configuration, where all four PV-installable surfaces are oriented toward different directions.
Since the panels are mounted directly on the exterior walls of the high-rise buildings, all panels have a tilt angle of 90°. Given that the walls are more limited than the roofs in terms of the direct angle of sunlight, it was assumed that the panels would be installed in a way that minimizes the investment and simplifies the installation. The number of panels was selected to maximize facade coverage while allowing sufficient space for system installation and maintenance.
Simulations for the entire year were conducted using a weather file for Kragujevac created in the Meteonorm software (version 7.1.3). This file was interpolated from data at three meteorological stations located 38 km (two stations) and 40 km away. Temperature data cover the period of 2000–2009, while radiation parameters were chosen from the period of 1991–2010. These data were selected as an option in the Meteonorm because they represent the most recent temperature and radiation data available in the program’s database (Figure 6). In all simulations, the PV panel model was the Kyocera KD325GX-LFB [24], whose specifications are listed in Table 2.
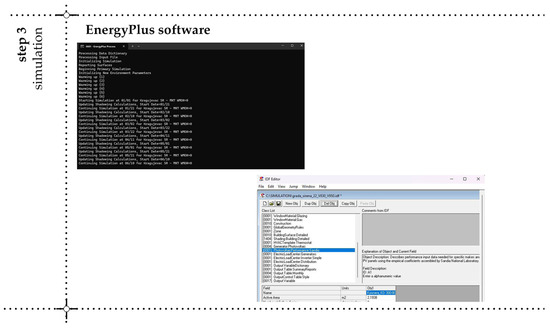
Figure 6.
Setup of the simulation process in the EnergyPlus software, including meteorological input data generated by Meteonorm.

Table 2.
Technical data for the Kyocera K325GX-LFB PV panel [24].
The “Sandia” model was employed as a predictive tool to forecast the electricity generation of PV panels. In the EnergyPlus software, the “Photovoltaic Performance: Sandia” object defines the operational characteristics of a specific module type (Figure 6). This model is based on research conducted at Sandia National Laboratories in Albuquerque, United States. Its implementation relies on a substantial number of empirical coefficients, which were obtained through extensive measurements and data reduction processes [25].
2.3. Economic and Environmental Analysis
For all calculations, the mid-value of the euro exchange rate of the National Bank of Serbia (NBS) was taken, on the date 10 February 2025, where 1 EUR = 117.0479 RSD [26].
The annual cost of the consumed electricity (water heating, lighting and electrical appliances, cooking, space cooling, and other uses) CE, based on electricity bills, is as follows:
where is the annual consumed electricity; is the price of a kWh of consumed electricity; is the annual billing demand fee; is the annual cost of a public supplier; is the annual privileged electricity producers’ incentive fee; is the annual renewable energy sources fee; and is a potential 5% discount. A decision on the regulated price of electricity for guaranteed supply [20] defines the cost of a kWh of electrical energy.
To calculate , values of = 0.062225 EUR/kWh, = (38.326 × number of apartments in high-rise building) EUR, = (15 × number of apartments in high-rise building) EUR, = (0.006833 × ) EUR and = (0.000128 × ) EUR, were used [27].
was calculated from [27] as follows:
The annual consumed electricity was calculated by using data of the total energy consumption per m2 in the residential sector of Serbia, which is 172 kWh/m2 [28], and the final energy consumption in the residential sector in Europe for end-uses, where water heating, lighting and electrical appliances, cooking, space cooling, and other uses represent 35.6% of the used energy [28]. By multiplying these two values, the value for annual consumed electricity per m2 in high-rise buildings was obtained as = 61.232 kWh/m2.
The heated area of the high-rise building was adopted using a value calculated as 75% of the gross area of the high-rise building [29].
The annual consumed electricity was calculated as follows:
Excise tax and value-added tax for electrical energy in Serbia are 7.5% and 20%, respectively.
Total investment in PV system is given as follows:
where is a percentage addition to to mount the PV panels and the inverter, is an investment in PV panels, and is an investment in an inverter. It is assumed that the cost of PV panels and inverter mounting is 20% of the total investment in the PV system; thus,
Investment in PV panels can be obtained from [30], where
where is the PV panels area; is nominal power output per unit area of the PV module; and is the average price of a PV module per unit of its power. As the cost of PV modules is given in dollars, the calculation was performed using the NBS exchange rate list, on 26 February 2025, where 1 USD = 0.95 EUR [30].
For calculating the investment in PV panels, = 0.432 EUR/W was used [26]. The value for = 148.1313 W/m2 was calculated from the technical data for the PV panel (Table S2). The values for (Tables S1–S6) were calculated by multiplying the PV panel area acquired from the technical data (Table S2) by the number of panels for which the simulations were performed.
Investment in an inverter is [31], where
where is the average price of an inverter per unit of power. As the cost of the inverter is given in dollars, the calculation was performed using the NBS exchange rate list, on 26 February 2025, where 1 USD = 0.95 EUR [30]. For calculating the investment in an inverter, = 0.123 EUR/W was used [32].
Reduced annual cost of the consumed electricity is, based on Equation (1):
where is the annual electricity generated from PV panels. To calculate , modified values of = (0.006833 × ) €, = (0.000128 × ) EUR and = 0.05 EUR were used.
Investment return is as follows:
About 70% of electricity in Serbia is produced in thermal power plants, while about 30% is obtained from hydro power plants [33]. The combustion of fossil fuels in power plants releases greenhouse gases, raising serious environmental concerns. Solar energy is one of the most economical and feasible sources to transition to clean and green energy and to reduce the harmful gases released by using fossil fuels.
The potential for CO2 emissions reduction represents a significant environmental indicator, demonstrating the advantages of implementing PV solar projects. The emissions analysis evaluates the gross annual CO2 emissions reduction, expressed in units of kgCO2/year.
The gross annual CO2 emissions reduction, , represents the potential amount of emissions reduction for a single year and can be determined using the following formula:
where is the CO2 emissions factor in the units of kgCO2/kWh and is the annual electricity generated from PV panels. For the calculation of CO2 emissions from electricity production in Serbia, the emissions factor was adopted as kgCO2/kWh [34].
3. Results
The results obtained from the simulation of annual electricity generation from PV systems installed on the vertical facades of twenty-one high-rise buildings in the city of Kragujevac are presented in Figure 7. The diagram presents the measured values of electricity generation potential for all facade surfaces, aggregated by building groups and differentiated according to facade orientation. This comparison highlights the variability in solar performance depending on orientation and the building’s envelope typology. Detailed simulation results are provided as a tabular presentation of the data in the Supplementary Material (Tables S1–S6). The tables display the orientation of the facades, the areas of the PV panels, and the simulated annual electricity generation for the four facades of each high-rise building where PV panels can be installed.
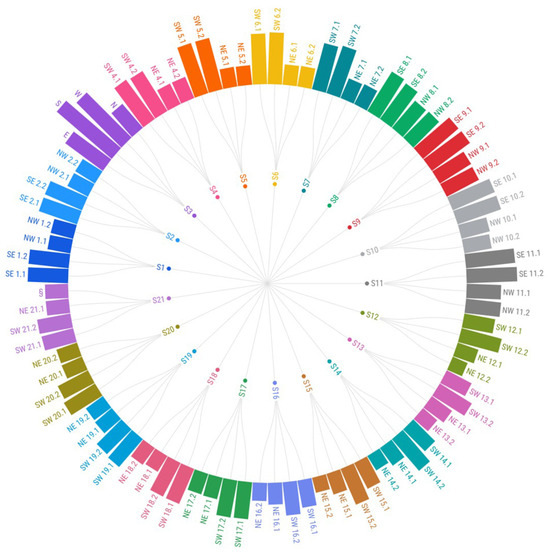
Figure 7.
Hierarchical diagram of facade electricity generation potential across building groups and orientations.
The highest solar potential within the high-rise building group S1–S2 is observed on the four southeast-oriented facades of both buildings, with annual electricity generation of 22,282.7 kWh. The total solar potential for this group of high-rise buildings is 140,358.9 kWh per year.
The highest solar potential on high-rise building S3 is observed on the south-facing facade, with an annual electricity generation of 39,962.22 kWh. The total solar potential of this building is 118,161.94 kWh per year. Within the high-rise building group S4–S7, the most significant solar potential is observed on one of the southwest-oriented facades of building S5, generating 29,207.72 kWh annually. The total solar potential for this group of buildings is 315,487.8 kWh per year.
In the high-rise building group S8–S11, the highest solar potential is observed on one of the southeast-oriented facades of building S11, generating 27,899.44 kWh per year. The total solar potential for this group of buildings is 357,532.5 kWh per year. In the high-rise building group S12–S16, the most significant solar potential is observed on one of the southwest-oriented facades of building S14, with an annual electricity generation of 22,959.01 kWh. The total solar potential of this group amounts to 296,876.4 kWh per year. For the high-rise building group S17–S21, the highest solar potential is recorded on one of the southwest-oriented facades of building S18, generating 20,989.88 kWh annually. The total solar potential for this group of buildings is 317,576.1 kWh per year. The total simulated annual electricity generation from the PV system for each high-rise building is presented in Figure 8.
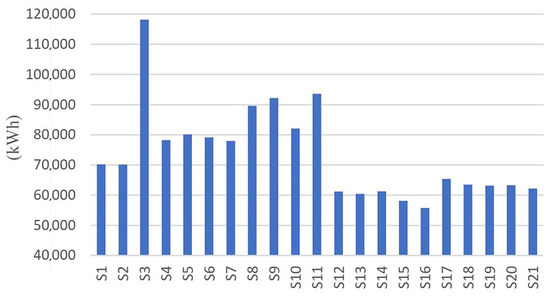
Figure 8.
The total simulated annual electricity generated from the PV system for each high-rise building.
The total solar potential of all observed facades of high-rise buildings in the city of Kragujevac amounts to 1,545,994 kWh per year, based on a total PV panel area of 15,690.16 m2.
The results show that, on the same high-rise building, facades oriented toward the southeast and southwest generate significantly more electricity compared to those facing the opposite directions. However, this electricity generation ratio varies both among different groups of high-rise buildings and within the same group. These variations are primarily due to the orientation of each building and the shading effects caused by surrounding built structures and vegetation. Among the surrounding spatial features, high-rise buildings within the same group have the most substantial impact on electricity generation due to their height.
A technical, economic, and environmental analysis was conducted for two scenarios:
- (1)
- PV panels installed on two facade areas with the highest solar potential (located on the same external wall for all high-rise buildings, except for building S3),
- (2)
- PV panels installed on all four available facade areas.
For each high-rise building, the simulated annual electricity generation per m2 is shown in Figure 9. Additionally, the annual reductions in electricity consumption (Figure 10), CO2 emissions (Figure 11), and electricity costs (Figure 12), as well as the investment payback period (Figure 13), were calculated.
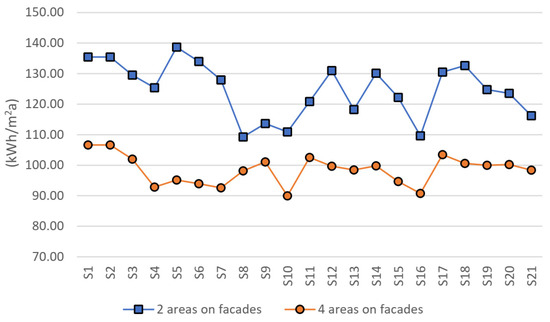
Figure 9.
Comparative overview of simulated annual electricity (kWh/m2a) generated from PV system in two scenarios.
The annual electricity generated per m2 of PV panels depends on facade orientation and shading from surrounding structures, resulting in variations within the same building group. In Scenario 1, the highest simulated annual electricity generation per m2 occurs on high-rise building S5, with 138.67 kWh/m2, while the lowest is on high-rise building S8, with 109.28 kWh/m2. In Scenario 2, building S1 exhibits the highest value at 106.64 kWh/m2, whereas building S10 has the lowest, at 89.95 kWh/m2.
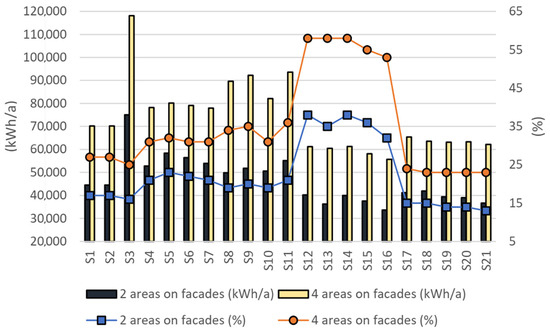
Figure 10.
Comparative overview of annual electricity consumption reduction in two scenarios: kWh/a and percentage reduction.
The annual reduction in electricity consumption, expressed as a percentage, depends on the ratio between the annual electric energy generated and the estimated annual electricity consumption of the building. In Scenario 1, the highest percentage reduction in annual electricity consumption is observed in high-rise buildings S12 and S14, with a 38% decrease, while the lowest reduction is observed in building S21, at 13%. In Scenario 2, buildings S12, S13, and S14 exhibit the greatest reductions at 58%, whereas buildings S18, S19, S20, and S21 show the lowest reductions, at 23%.
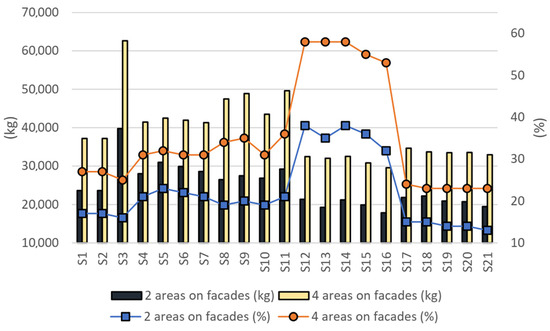
Figure 11.
Comparative overview of annual CO2 reduction in two scenarios: kg and percentage reduction.
The environmental impact of PV systems is primarily manifested in the reduction of CO2 emissions per kWh of electricity generated.
In Scenario 1, the highest annual CO2 emissions reduction, expressed as a percentage, is observed in high-rise buildings S12 and S14, each with a 38% reduction, while the lowest CO2 emissions reduction is observed in building S21, with a 13% reduction. In kilograms of emitted CO2, emissions reductions ranged from 119.225 kg to 56.234 kg. In Scenario 2, the highest reductions are observed in buildings S12, S13, and S14, each achieving a 58% decrease, while the lowest reductions occur in buildings S18, S19, S20, and S21, at 23%. In this scenario, the reduction in CO2 emissions ranges from 75.699 kg to 33.977 kg.
Although the panels are mainly constructed from glass and aluminum, materials that are relatively easy to reuse, the recycling process requires mechanical, thermal, or electrical energy to separate the components of the modules [35]. At present, Serbia lacks dedicated recycling facilities, technologies, and established procedures or regulations for recycling PV panels.
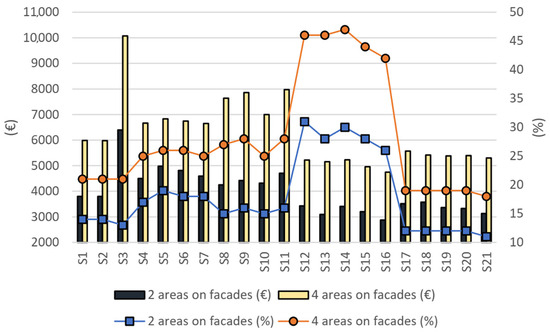
Figure 12.
Comparative overview of annual electricity cost savings in two scenarios: annual electricity cost savings and percentage savings.
Annual consumed electricity cost savings are not directly proportional to the annual reduction in electricity consumption due to fixed components of the electricity bill that are independent of actual consumption. Consequently, the percentage of cost savings in annual electricity consumption is lower than the percentage reduction in annual electricity consumption.
In Scenario 1, the highest percentage of cost savings in annual electricity consumption is observed in high-rise building S12, with a 31% decrease, while the lowest percentage of cost savings is observed in building S21, at 11%. In Scenario 2, the most significant percentage of cost savings in annual electricity consumption is achieved by building S14, with a 47% decrease, whereas the lowest percentage of cost savings is again observed in building S21, at 18%.
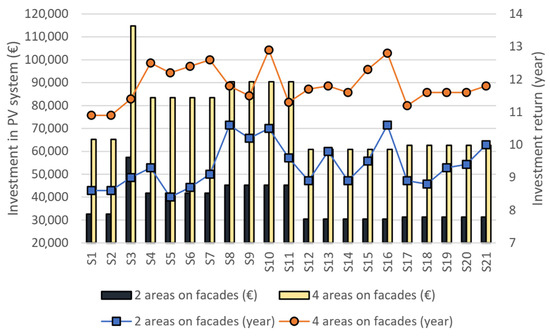
Figure 13.
Comparative overview of investment (EUR) and investment return (years) in two scenarios.
The investment payback period is determined by the ratio between the total investment cost and the difference between the initial cost of annual consumed electricity and the reduced cost of annual consumed electricity, resulting from PV system installation.
In Scenario 1, the most economically favorable variant is high-rise building S5, with a total investment of 41,735 EUR and a payback period of 8.4 years. The least profitable variants are high-rise buildings S8 and S16, with total investments of 45,213 EUR and 30,431 EUR, respectively, and a payback period of 10.6 years. In Scenario 2, the most economically profitable variants are high-rise buildings S1 and S2, each requiring a total investment of 65,212 EUR and achieving a payback period of 10.9 years. The least profitable variant is high-rise building S10, with a total investment of 90,426 EUR and a payback period of 12.9 years.
4. Discussion
This paper presents a methodological framework for evaluating the solar potential of vertical facades on high-rise buildings. The approach is comprehensive, incorporating 3D modeling of both the buildings and their surrounding environment. It is particularly effective in analyzing large building stocks with identical or similar envelopes, as it significantly reduces the complexity of the modeling process. This building typology is characteristic of many high-rise residential developments constructed as part of mass housing programs across Eastern Europe, including Serbia, during the second half of the 20th century.
For the twenty-one high-rise buildings located in the center of Kragujevac, the solar potential of vertical facades was assessed through simulations of PV energy generation using the EnergyPlus software. The simulations accounted for shading effects caused by surrounding buildings, trees, and especially nearby high-rise buildings. The total solar potential of all observed facades is 1,545,994 kWh/year, based on a combined solar panel area of 15,690.16 m2. Among the 84 facades analyzed, 12 facades exhibit a solar potential exceeding 130 kWh/year per square meter of PV panels, identifying them as the most energy-efficient locations on high-rise buildings for PV system installation.
A technical, economic, and environmental analysis was conducted for two scenarios: (1) PV panels installed on the two facade areas with the highest solar potential, and (2) PV panels installed on all four available facade areas.
Scenario 1, which limits PV installation to two facade areas with the highest solar potential, demonstrates methodological strength through its focus on optimization. This scenario leverages site-specific orientation and shading conditions to maximize electricity generation per unit of the PV surface. This approach, based on selective placement, has proven to be technically effective, with relatively high energy performance and favorable electricity production-to-investment ratios. From a financial standpoint, this scenario achieves the shortest payback periods, between 8.4 and 10.6 years, as a result of reduced upfront costs and strategic system placement.
By extending the PV system to all four facades, Scenario 2 represents the full potential of vertical integration. Greater panel coverage leads to higher overall electricity generation, but also to decreased performance per unit area due to orientation and shading constraints. Financially, the scenario demands significantly higher capital investment, with payback periods extending up to 12.9 years. Although cost savings are proportionally higher, they do not scale linearly with the investment, revealing an essential limitation in the economic scalability of the approach.
These findings are consistent with earlier studies emphasizing the need to prioritize high-performing orientations rather than maximizing coverage. For example, Gomes et al. [13] in Brazil demonstrated that east–west orientations outperform north–south orientations due to more balanced daily irradiance. At the same time, our results similarly identify southeast and southwest facades as consistently more productive. Similarly, Brito et al. [16] showed that mixed façade–roof systems in Lisbon achieved longer payback times than rooftop-only systems, which is a pattern mirrored in our results, where Scenario 2 increases investment costs disproportionately to the gains.
Comparisons with Middle Eastern and North African studies [12] underline the contextual adaptability of facade PV. While efficiency losses in hot and arid climates were emphasized there, our results in a continental climate indicate that orientation and shading dominate performance variability, confirming the argument that regional climate must be a decisive factor in applicability. Furthermore, Chen and Long [5] showed that facade-integrated PV can outperform rooftops under specific configurations, which reinforces the broader conclusion that vertical integration should not be treated as secondary to roof-based systems but as a complementary and, in some cases, superior option.
Environmentally, while the absolute reduction in CO2 emissions is lower in Scenario 1, the emissions avoided per square meter of PV area are comparatively higher, reinforcing the technical validity of prioritizing high-performing surfaces.
The results indicate that, within the same high-rise building, southeast- and southwest-facing facades produce notably more electricity than those facing the opposite directions. However, the share of electricity generation differs both between clusters of high-rise buildings and within the same cluster. These differences are mainly due to the building’s orientation and shading from the nearby built environment and vegetation. Among the surrounding spatial features, high-rise buildings in the same cluster have the most decisive influence on electricity generation, mainly because of their height.
From a financial perspective, Scenario 1 is more profitable than Scenario 2. Although Scenario 2 results in a 20% greater annual reduction in electricity consumption and a 16% greater electricity cost savings compared to Scenario 1, it requires twice the investment. The analysis indicates that identifying the most suitable locations for PV installation on the vertical facades of high-rise buildings is a complex process. Depending on the evaluation criteria, different facades emerge as optimal, suggesting that the selection should align with the specific priorities of the project. However, all technical, economic, and environmental analyses should be considered when making the final decision. Installing PV systems on a single external wall of a high-rise building may raise concerns related to aesthetics and compliance with urban planning regulations. Nevertheless, a balance between urban design considerations and the financial viability of such investments should be pursued through dialog among urban planning authorities, building residents, and investors.
From a methodological perspective, this study relies on accessible tools (EnergyPlus, SketchUp, Google Maps), aligning with Saretta et al. [18] who highlighted the potential of GIS-based methods for expanding facade PV analysis, but without requiring expensive LiDAR datasets. This simplified framework proves especially relevant for contexts such as Serbia, where high-resolution geospatial data and advanced software are not systematically available. By doing so, the study addresses the methodological gap identified in the Introduction, offering a low-cost yet transferable approach that can support decision-making in other post-socialist Eastern European countries with comparable building typologies.
Limitations of the Study
An important limitation of this study concerns the treatment of PV module efficiency. In practice, PV modules experience a gradual decline in performance, commonly estimated at approximately 0.5% per year. For this research, which aimed to demonstrate a simplified and affordable methodological framework for early-stage assessment, a constant efficiency value was assumed. This simplification reduces model complexity and ensures broader applicability in contexts where access to detailed longitudinal performance data is limited. While it may lead to a slight overestimation of long-term outputs, the relatively short investment payback periods observed (8–13 years) suggest that this assumption does not substantially alter the overall validity of the technical, economic, and environmental conclusions.
Further limitations also arise from the scope of the analysis. Lifecycle (LCA) impacts, including embodied carbon and recycling challenges, were acknowledged but not quantified. The economic evaluation was limited to payback periods, without incorporating more advanced indicators such as net present value (NPV) or internal rate of return (IRR). In addition, the analysis assumed constant electricity prices and did not account for future policy incentives, such as subsidies or feed-in tariffs, which may significantly influence investment attractiveness. The environmental assessment was limited to CO2 savings, without addressing broader sustainability indicators such as land use or resource depletion. Finally, although seasonal variability and dynamic shading were acknowledged, they were not explicitly modeled. This simplification may reduce long-term precision, but it enabled a transparent and cost-effective framework that remains replicable in data-constrained contexts.
Another limitation of this study relates to the end-of-life (EoL) management of PV panels. In Serbia, there are currently no dedicated recycling facilities or established regulatory procedures for PV module disposal. As a result, panels reaching the end of their service life would most likely be treated within the general stream of electronic or construction waste, without targeted recovery of materials such as glass, aluminum, and silicon. This regulatory and infrastructural gap introduces uncertainty into the long-term environmental assessment, since the benefits of PV deployment may be partly offset if large volumes of modules cannot be effectively recycled. This limitation also has clear policy implications: developing EoL management strategies, establishing dedicated recycling capacity, and embedding circular economy principles into building regulations and incentive schemes will be crucial to ensure that facade-integrated PV systems contribute to sustainability across their entire lifecycle.
These simplifications reflect the study’s overarching aim: to establish a low-cost, replicable methodology suitable for contexts with limited data and resources, such as Serbia, and transferable to other Eastern European countries undergoing post-socialist transformation. While they narrow the scope of the findings, they do not undermine the central conclusion that facade-integrated PV systems can make a meaningful contribution to advancing renewable energy adoption in dense urban environments.
5. Conclusion Remarks
The study confirms the applicability of the proposed methodology for early-stage assessment and decision support in urban energy planning. Its pragmatic and adaptable nature enables analysis across diverse building typologies.
The proposed methodology offers a foundation for further development and improvement. The required level of detail in the building models depends on the specific focus of the analysis—in this case, the external walls. Enhancing existing building models can support more comprehensive assessments of overall energy performance. Integrating additional data into the 3D models would allow for broader simulations, including the evaluation of energy efficiency measures and the integration of various renewable energy sources.
The findings indicate that the current regulatory framework does not provide operational mechanisms for anticipating the economic implications of design choices, particularly in relation to building costs and maintenance. This includes undefined principles for building conservation and retrofit, as well as insufficient integration of circular economy concepts. Consequently, the existing housing framework in Serbia has yet to develop targeted measures for PV systems. In this context, studies such as the present one can serve as pilot investigations, demonstrating the potential capacities for implementing PV on vertical surfaces. Facades, in particular, can contribute meaningfully to improving building energy efficiency.
Contributions and Future Research Directions
This study contributes to the growing body of research on facade-integrated PV by developing and testing a simplified, low-cost methodological framework tailored for early-stage assessments in data- and resource-constrained contexts. The proposed approach combines open-source simulation tools and freely available digital resources to evaluate the technical, economic, and environmental potential of vertical PV systems on high-rise buildings. By applying the methodology to a representative case study in Serbia, the research demonstrates both the feasibility of facade-based solar integration in a transitional economy and the transferability of the approach to other Eastern European countries undergoing post-socialist transformation.
Future research could extend this work in several directions. First, incorporating more advanced economic indicators such as NPV and IRR, along with sensitivity analyses for electricity price volatility and policy incentives, would strengthen the investment dimension of the framework. Second, adding LCA components, including embodied carbon, material resource use, and EoL management, would enrich the environmental dimension. Third, dynamic shading and seasonal variability could be modeled to improve the accuracy of long-term performance estimates. Finally, further case studies in different geographical, climatic, and regulatory contexts would validate the framework’s broader applicability and provide evidence for integrating facade-integrated PV systems into urban planning, building codes, and incentive schemes.
Supplementary Materials
The following supporting information can be downloaded at: https://www.mdpi.com/article/10.3390/su17198844/s1, Table S1: Simulated annual generated electricity for high-rise building group S1–S2; Table S2. Simulated annual generated electricity for high-rise building S3; Table S3: Simulated annual generated electricity for high-rise building group S4–S7; Table S4: Simulated annual generated electricity for high-rise building group S8–S11; Table S5: Simulated annual generated electricity for high-rise building group S12–S16; Table S6: Simulated annual generated electricity for high-rise building group S17–S21.
Author Contributions
Conceptualization, A.S. and I.R.; methodology, A.S.; software, A.S.; validation, I.R., D.R., and M.H.-N.; formal analysis, A.S.; investigation, A.S.; resources, A.S.; data curation, A.S. and I.R.; writing—original draft preparation, A.S.; writing—review and editing, I.R., D.R., M.H.-N. and C.E.C.; visualization, A.S. and I.R.; supervision, D.R., M.H.-N. and C.E.C.; funding acquisition, D.R., M.H.-N. and C.E.C. All authors have read and agreed to the published version of the manuscript.
Funding
This research was funded by the Ministry of Science, Technological Development and Innovation of the Republic of Serbia, grant number 200090.
Institutional Review Board Statement
Not applicable.
Informed Consent Statement
Not applicable.
Data Availability Statement
The data that support the findings of this study are available from the corresponding authors upon reasonable request.
Conflicts of Interest
The authors declare no conflicts of interest. The funders had no role in the design of the study; in the collection, analyses, or interpretation of data; in the writing of the manuscript; or in the decision to publish the results.
Abbreviations
The following abbreviations are used in this manuscript:
| AHS | Heated area of the high-rise building |
| BIM | Building Information Modeling |
| BIPV | Building-Integrated Photovoltaics |
| CE | Annual cost of the consumed electricity |
| CER | Reduced annual cost of the consumed electricity |
| CBD | Annual billing demand fee |
| CI | Average price of inverter per the unit of power |
| CP | Average price of PV module per unit of its power |
| CPO | PV panels and inverter mounting cost relative to IN |
| CPP | Annual privileged electricity producers’ incentive fee |
| CPS | Annual cost of public supplier |
| CRE | Annual renewable energy sources fee |
| D | Potential 5% discount |
| CO2 emissions factor | |
| EG | Annual generated electricity from PV panels |
| EoL | The end-of-life |
| FIPV | Façade-Integrated Photovoltaics |
| FP | PV panels area |
| GIS | Geographic Information Systems |
| HE | The price of a kWh of consumed electricity |
| HVAC | Heating, ventilation, and air-conditioning |
| IE | Annual consumed electricity |
| IES | Value for annual consumed electricity per m2 in high-rise buildings |
| II | Investment in inverter |
| IN | Total investment in PV system |
| IP | Investment in PV panels |
| IRR | Internal Rate of Return |
| LiDA | Light Detection and Ranging |
| LoD2 | Level of Detail 2 |
| NPV | Net Present Value |
| PI | Investment return |
| PV | Photovoltaic |
| Reduced CO2 emission |
References
- Stefanović, A.; Gordić, D. Modeling methodology of the heating energy consumption and the potential reductions due to thermal improvements of staggered block buildings. Energy Build. 2016, 125, 244–253. [Google Scholar] [CrossRef]
- Alves, T.; Machado, L.; de Souza, R.G.; de Wilde, P. Assessing the energy saving potential of an existing high-rise office building stock. Energy Build. 2018, 173, 547–561. [Google Scholar] [CrossRef]
- Freitas, S.; Brito, M.C. Solar façades for future cities. Renew. Energy Focus 2019, 31, 73–79. [Google Scholar] [CrossRef]
- Ordenes, M.; Marinoski, D.L.; Braun, P.; Rüther, R. The impact of building-integrated photovoltaics on the energy demand of multi-family dwellings in Brazil. Energy Build. 2007, 39, 629–642. [Google Scholar] [CrossRef]
- Chen, X.; Long, H. Optimal Placement of Distributed Solar PV Adapting to Electricity Real-Time Market Operation. Sustainability 2025, 17, 6879. [Google Scholar] [CrossRef]
- Chen, X.; Yang, H.; Peng, J. Energy optimization of high-rise commercial buildings integrated with photovoltaic facades in urban context. Energy 2019, 172, 1–17. [Google Scholar] [CrossRef]
- Hoseinzadeh, P.; Assadi, M.K.; Heidari, S.; Khalatbari, M.; Saidur, R.; Nejad, K.H.; Sangin, H. Energy performance of building integrated photovoltaic high-rise building: Case study, Tehran, Iran. Energy Build. 2021, 235, 110707. [Google Scholar] [CrossRef]
- Vahdatikhaki, F.; Salimzadeh, N.; Hammad, A. Optimization of PV modules layout on high-rise building skins using a BIM-based generative design approach. Energy Build. 2022, 258, 111787. [Google Scholar] [CrossRef]
- Xiang, C.; Matusiak, B.S. Façade Integrated Photovoltaics design for high-rise buildings with balconies, balancing daylight, aesthetic and energy productivity performance. J. Build. Eng. 2022, 57, 104950. [Google Scholar] [CrossRef]
- Kosorić, V.; Lau, S.-K.; Tablada, A.; Lau, S.S.-Y. General model of Photovoltaic (PV) integration into existing public high-rise residential buildings in Singapore—Challenges and benefits. Renew. Sustain. Energy Rev. 2018, 91, 70–89. [Google Scholar] [CrossRef]
- Ghaleb, B.; Khan, M.I.; Asif, M. Application of PV on Commercial Building Facades: An Investigation into the Impact of Architectural and Structural Features. Sustainability 2024, 16, 9095. [Google Scholar] [CrossRef]
- Sohani, A.; Cornaro, C.; Shahverdian, M.H.; Pierro, M.; Moser, D.; Nižetić, S.; Karimi, N.; Li, L.K.; Doranehgard, M.H. Building integrated photovoltaic/thermal technologies in Middle Eastern and North African countries: Current trends and future perspectives. Renew. Sustain. Energy Rev. 2023, 182, 113370. [Google Scholar] [CrossRef]
- Gomes, M.M.d.M.; Cavalcante, R.D.L.d.S.; Junior, O.H.A.; Del Pero, C.; de Lima, J.A.; Lago, T.G.S.D. The Effect of Facade Orientation on the Electrical Performance of a BIPV System: A Case Study in João Pessoa, Brazil. Energies 2025, 18, 829. [Google Scholar] [CrossRef]
- Saretta, E.; Bonomo, P.; Frontini, F. A calculation method for the BIPV potential of Swiss façades at LOD2.5 in urban areas: A case from Ticino region. Sol. Energy 2020, 195, 150–165. [Google Scholar] [CrossRef]
- Martínez-Rubio, A.; Sanz-Adan, F.; Santamaría-Peña, J.; Martínez, A. Evaluating solar irradiance over facades in high building cities, based on LiDAR technology. Appl. Energy 2016, 183, 133–147. [Google Scholar] [CrossRef]
- Brito, M.C.; Freitas, S.; Guimarães, S.; Catita, C.; Redweik, P. The importance of facades for the solar PV potential of a Mediterranean city using LiDAR data. Renew. Energy 2017, 111, 85–94. [Google Scholar] [CrossRef]
- Polo, J.; Martín-Chivelet, N.; Alonso-Abella, M.; Alonso-García, C. Photovoltaic generation on vertical façades in urban context from open satellite-derived solar resource data. Sol. Energy 2021, 224, 1396–1405. [Google Scholar] [CrossRef]
- Saretta, E.; Caputo, P.; Frontini, F. An integrated 3D GIS-based method for estimating the urban potential of BIPV retrofit of façades. Sustain. Cities Soc. 2020, 62, 102410. [Google Scholar] [CrossRef]
- Liu, J.; Wu, Q.; Lin, Z.; Shi, H.; Wen, S.; Wu, Q.; Zhang, J.; Peng, C. A novel approach for assessing rooftop-and-facade solar photovoltaic potential in rural areas using three-dimensional (3D) building models constructed with GIS. Energy 2023, 282, 128920. [Google Scholar] [CrossRef]
- An, Y.; Chen, T.; Shi, L.; Heng, C.K.; Fan, J. Solar energy potential using GIS-based urban residential environmental data: A case study of Shenzhen, China. Sustain. Cities Soc. 2023, 93, 104547. [Google Scholar] [CrossRef]
- Jovanovic Popovic, M.; Ignjatović, D.; Radivojević, A.; Rajčić, A.; Đukanović, L.; Ćuković Ignjatović, N.; Nedić, M. Atlas of Multifamily Housing in Serbia; University of Belgrade—Faculty of Architecture: Belgrade, Serbia, 2013. [Google Scholar]
- Milovanović, A.; Nikezić, A.; Ristić Trajković, J. Introducing Matrix for the Reprogramming of Mass Housing Neighbourhoods (MHN) Based on EU Design Taxonomy: The Observatory Case of Serbia. Buildings 2023, 13, 723. [Google Scholar] [CrossRef]
- EnergyPlus, U.S. Department of Energy. EnergyPlus: Energy Simulation Software Version 8.7.0. Available online: https://energyplus.net/licensing (accessed on 19 January 2024).
- EcoDirect. Kyocera KD325GX-LFB 325 W Solar Panel. Available online: https://www.ecodirect.com/Kyocera-KD325GX-LFB-330-Watt-40-3-Volt-p/kyocera-kd325gx-lfb.htm?srsltid=AfmBOopTG2LxLkCdo8SUYN16vT0xHqu4OYIecy_NAHtnVFDZ7KyGc8Q5 (accessed on 26 September 2025).
- U.S. Department of Energy. EnergyPlus Documentation: Input Output Reference. Golden: National Renewable Energy Laboratory. Available online: https://energyplus.net/ (accessed on 15 September 2025).
- National Bank of Serbia. NBS Exchange Rate List No. 36 2025. Available online: https://webappcenter.nbs.rs/ExchangeRateWebApp/ExchangeRate/IndexByNumber?isSearchExecuted=true&ExchangeRateListNumber=36&Year=2025&ExchangeRateListTypeID=3& (accessed on 26 February 2025).
- Elektroprivreda Srbije J.P. Decision on the Regulated Price of Electricity for Guaranteed Supply; Belgrade, Serbia: Official Gazette of RS: 24/2023. Available online: https://online.slglasnik.org/sr/propisi/registar-2024 (accessed on 19 January 2024). (In Serbian).
- Entranze. Total Unit Consumption per m2 in Residential. Entranze N.D. Available online: https://entranze.enerdata.net/total-unit-consumption-per-m2-in-residential-at-normal-climate.html (accessed on 19 January 2024).
- Ignjatović, D.; Jovanović Popović, M.; Kavran, J. Application of sunspaces in fostering energy efficiency and economical viability of residential buildings in Serbia. Energy Build. 2015, 98, 3–9. [Google Scholar] [CrossRef]
- National Bank of Serbia. Exchange Rate List. Available online: https://www.kursna-lista.com/konvertor-valuta (accessed on 26 February 2025).
- Stefanović, A.; Bojić, M.; Gordić, D. Achieving net zero energy cost house from old thermally non-insulated house using photovoltaic panels. Energy Build. 2014, 76, 57–63. [Google Scholar] [CrossRef]
- PVinsights. Weekly Retailer Price. Available online: http://pvinsights.com/RetailerPrice.php (accessed on 19 January 2024).
- Elektroprivreda Srbije. Proizvodnja Elektricne Energije N.D. Available online: https://www.eps.rs/lat/Poslovanje-EE/Stranice/Proizvodnja-elen.aspx (accessed on 19 January 2024).
- Rule Book on Energy Efficiency in Buildings; Belgrade, Serbia: Official Gazette of RS: 61/2011. Available online: https://online.slglasnik.org/sr/propisi/061-2011 (accessed on 19 January 2024). (In Serbian).
- Bošnjaković, M.; Santa, R.; Crnac, Z.; Bošnjaković, T. Environmental Impact of PV Power Systems. Sustainability 2023, 15, 11888. [Google Scholar] [CrossRef]
Disclaimer/Publisher’s Note: The statements, opinions and data contained in all publications are solely those of the individual author(s) and contributor(s) and not of MDPI and/or the editor(s). MDPI and/or the editor(s) disclaim responsibility for any injury to people or property resulting from any ideas, methods, instructions or products referred to in the content. |
© 2025 by the authors. Licensee MDPI, Basel, Switzerland. This article is an open access article distributed under the terms and conditions of the Creative Commons Attribution (CC BY) license (https://creativecommons.org/licenses/by/4.0/).