Article

Ecological Interactions and Climate-Driven Dynamics of Pine Wilt Disease: Implications for Sustainable Forest Management

1
Division of Environmental and Forest Science, Gyeongsang National University, Jinju 52725, Republic of Korea
2
Institute of Agriculture and Life Science, Gyeongsang National University, Jinju 52828, Republic of Korea
*
Author to whom correspondence should be addressed.
Sustainability 2025, 17(19), 8796; https://doi.org/10.3390/su17198796
Submission received: 20 August 2025 / Revised: 26 September 2025 / Accepted: 28 September 2025 / Published: 30 September 2025
(This article belongs to the Section Sustainable Forestry)

Abstract

This study investigated the distribution of pine wood nematodes (PWNs, Bursaphelenchus xylophilus) and their co-occurrence with B. mucronatus in recently dead pine trees across coastal and inland regions while monitoring the seasonal emergence patterns of Monochamus alternatus from 2021 to 2023. Nematodes were extracted from felled trees and beetle bodies using the Baermann funnel method. Aggregation pheromone traps were used to monitor vector activity and to assess temperature-dependent emergence. The results showed a negative correlation between PWN and B. mucronatus density (r = −0.73, p < 0.01), which prompted tests on interspecific interactions. M. alternatus emergence was positively associated with average temperature (r = 0.74–0.78), supporting the temperature-informed surveillance timing in this dataset. These findings highlight the role of climate-driven dynamics in shaping vector behavior and nematode population structures. This study supports the development of sustainable temperature-responsive management strategies for controlling pine wilt disease. These strategies provide a foundation for climate-resilient forest health and long-term ecosystem sustainability.

1. Introduction

Pine trees (genus Pinus) have profound cultural and historical significance in Korea and represent the largest proportion of the nation’s coniferous forests. Beyond their symbolic value, they provide essential ecosystem services, including air purification, carbon sequestration, recreational opportunities, and watershed regulation as “green dams” [1]. These functions sustain biodiversity, mitigate climate change, and support the livelihoods of forest-dependent communities. Therefore, preserving pine forests is a matter of cultural heritage and a key component of sustainable forest management and national climate resilience strategies. However, anthropogenic climate change and its associated impacts, such as the rising frequency and intensity of large-scale wildfires, and the rapid spread of pine wilt disease (PWD), increasingly threaten pine forests and broader conifer ecosystems at regional to continental scales. Recent studies have demonstrated that human-driven warming has significantly increased wildfire activity across forest ecosystems [2], with global assessments confirming that climate change is intensifying fire danger and altering disturbance regimes [3,4]. Such shifts lengthen fire seasons, compound biotic stressors, and create novel risks for conifer-dominated landscapes, thereby amplifying the vulnerability of pine forests to abiotic and biotic threats.
PWD is caused by the pine wood nematode (PWN; Bursaphelenchus xylophilus), which enters the vascular system of pine trees, proliferates rapidly, and ultimately causes tree death [5,6,7,8]. Although pine species are native to North America (their presumed origin), the nematode is generally less harmful to native PWN-resistant hosts [9,10,11]. Since its introduction in South Korea, China, Japan, Portugal, and Spain, PWD has become a global forest epidemic [5,12,13,14,15,16,17]. Given the widespread nature of this disease, strategies for managing PWD may offer valuable insights into the control of similar forest diseases in other regions. Specifically, understanding the mechanisms and management approaches for PWD can enhance our comprehension of forest disease dynamics at a global scale, contributing to broader ecosystem conservation efforts [5,9].
Considering that PWNs cannot move on their own, they rely on insect vectors for their dispersal. The nematode enters the body of its vector during the larval stage and spreads when vector beetles feed on healthy pine branches or lay eggs beneath the bark, creating entry points for infection [5,18]. In South Korea, the primary vectors of PWN are the Japanese pine sawyer Monochamus alternatus Hope and the northern pine sawyer M. saltuarius Gebler, which predominantly infest Japanese red pine (Pinus densiflora), Japanese black pine (Pinus thunbergii), and Korean pine (Pinus koraiensis) [14,17,19]. Therefore, the occurrence and spread of PWD are linked to the ecological dynamics of nematodes and their associated vectors.
The distribution of PWD is strongly influenced by climatic and environmental factors, including temperature, precipitation, topography, slope, and elevation of pine habitats [20,21]. Among these, temperature plays a crucial role in PWD outbreaks and expansion, as it significantly affects the growth, development, and distribution of both PWN and its insect vectors [20,22,23]. Studies in North America and Japan have shown that PWD typically occurs in regions where the average annual temperature exceeds 20 °C [24]. In South Korea, the northern and southern distribution limits of M. alternatus correspond to annual mean temperatures of approximately 10 °C and 13.2 °C, respectively [25].
To mitigate PWD damage, it is essential to monitor and control the populations of the vector beetles M. alternatus and M. saltuarius [26]. Field surveys, including the monitoring of oviposition sites and the deployment of aggregation pheromone traps, are widely used to track vector activity and population dynamics. These methods are critical for determining the optimal timing of insecticide application and removal of infected trees. According to recent remote sensing–based studies, February through August is the most suitable period for controlling PWD, as it coincides with the major outbreak and transmission phases of the disease [27].
To date, little research has been conducted in Korea on the timing of PWN and vector distributions in relation to abnormally high-temperature events and rising average temperatures caused by global warming. To minimize PWD damage to pine trees, it is essential to analyze the factors influencing its occurrence and spread, identify optimal prevention and control periods and high-risk regions, and implement coordinated measures to prevent further outbreaks and expansion of the disease.
Therefore, this study aimed to address key knowledge gaps regarding the interactions between B. xylophilus, B. mucronatus, and their vector M. alternatus under varying climatic conditions. By integrating field-based ecological data with climate-responsive analyses, we aim to develop ecologically informed strategies that reduce reliance on chemical treatments and enhance pine forest resilience. This study contributes to the goals of sustainability science by supporting adaptive forest health management that aligns with long-term biodiversity conservation and climate resilience. Specifically, our approach provides a climate-adaptive framework for optimizing control timing using temperature and decay stage indicators, thereby minimizing chemical pesticide use and directly contributing to SDG 15 (Life on Land) and SDG 13 (Climate Action) through biodiversity protection and strengthened ecosystem resilience. This study explored the following three key questions:
  • H1: Does PWN occur at different vertical positions within the tree (upper canopy, middle canopy, lower trunk) across different sites and years?
  • H2: Is B. mucronatus density associated with the vertical position and year relative to PWN?
  • H3: Does M. alternatus emergence increase with an increase in the daily mean temperature during the flight season?
The hypotheses were tested using pre-specified analyses, and all associations were interpreted non-causally, considering the observational design. Wood moisture or the quantitative decay stage was not measured in this study; therefore, any references to the variables are treated as hypotheses for future work.

2. Materials and Methods

2.1. Selection of Survey Sites

Survey sites were selected in areas that experienced moderate-to-severe PWD damage annually. The coastal sites were located in forested regions dominated by black pine (Pinus thunbergii) in Geoje-si (Jangseungpo-dong and Irun-myeon) and Sacheon-si (Seopo-myeon). Inland sites were established in forested areas with recurring PWD in Jinju-si (Jangjae-dong and Hachon-dong) (Table 1, Figure 1). The survey was conducted between 2021 and 2023.

2.2. Selection of Tree Species for Investigation at Each Site

Three survey plots, each measuring 20 × 20 m, were established in areas with severe PWD outbreaks. Five dead black pine trees, ranging from 20 to 40 years in age, were randomly selected from each plot for sampling purposes. The survey sites were located at elevations between 50 and 200 m. Tree heights ranged from 8 to 14 m, and diameter at breast height (DBH) varied between 20 and 34 cm.

2.3. Distribution of PWN and B. mucronatus in Felled Trees

Among the trees felled for PWD control, only dead trees were selected for sampling. Following the PWD Control Guidelines [28], wood samples were collected from three sections of each tree to assess the PWN density in the felled trees: the upper canopy (stem and branches at the tree crown), middle canopy (stem in the middle portion of the crown), and lower trunk (stem at breast height). Sampling was conducted from February to March each year from 2021 to 2023 during felling operations for PWD control. The collected samples were processed in the laboratory using the Baermann funnel method [28].
Wood samples were finely chopped (<5 mm), and 20 mL extract was obtained from the solution collected at the bottom after 24 h. Subsequently, 10 μL of each extract was placed on a glass slide and observed under a stereomicroscope (Olympus SZ61, Tokyo, Japan) at ×10 to ×20 magnification. Three replicates were performed for each wood sample to quantify the number of PWN and B. mucronatus. Wood sampling and processing were conducted according to the PWD Control Guidelines issued by the Korea Forest Service [28], including felling windows, sectioning protocol (upper canopy, middle canopy, and lower trunk), and contamination-minimizing handling procedures. Nematodes were extracted using the Baermann funnel method [29], a standard quantitative recovery technique for plant-parasitic and saprolytic nematodes. The operational parameters (fragment size < 5 mm, extraction duration ~24 h, and aliquot volumes) were kept constant across samples to ensure comparability. To reduce counting variance, each wood sample was processed in triplicate, and the counts were averaged before analysis. The protocol conforms to the classical descriptions of Baermann extraction [29], with minor operational updates for woody matrices (e.g., fragmenting dense tissues to enhance passive migration).

2.4. Monitoring the Emergence of M. Alternatus Using Aggregation Pheromone Traps

Surveys were conducted using aggregation pheromone traps to investigate the emergence period of Monochamus alternatus, the primary vector of the PWN. Survey sites were established in three cities heavily affected by PWD: Geoje, Sacheon and Jinju. At each site, a 20 × 20 m plot was established in areas containing dead pine trees, and trees with M. alternatus emergence holes were selected as sample trees.
Three multiple funnel traps (model: KN; manufacturer: KN, Iksan, Korea) were installed within 3 m of dead or weakened trees, spaced 4 m apart, and mounted at approximately 1.5 m above ground level to optimize capture efficiency. Each trap was baited with a commercially available pheromone lure (KOFPI formulation) containing 2-(undecyloxy)ethanol, α-pinene, ethanol (EtOH), and proprietary attractant components. The lure was provided in a polyethylene sachet cartridge (approximately 5 cm × 7 cm), with a total solution volume of 1 mL and a release rate of approximately 2 g/day for α-pinene and 300 mg/day for ethanol at 20 °C.
Sampling was conducted biweekly from early May to late June in 2021–2023, corresponding to the expected emergence of M. alternatus. For each sampling date (eight biweekly events per study year), daily mean temperature data [30] for each site were obtained from the Korea Meteorological Administration and analyzed in relation to the number of beetles collected (Table 2).
Vector emergence monitoring was performed using commercial aggregation pheromone traps deployed at standardized heights and spacings within infested stands, following domestic operational norms for Monochamus surveillance (lure composition per KOFPI specification) [28]. Trap operation schedules were aligned with regional phenology and safety constraints delineated in the official guidance. In addition, lure replacement followed the manufacturer’s release rates to minimize between-trap heterogeneity. Daily mean temperatures contemporaneous with each collection were obtained from the Korea Meteorological Administration open database for the nearest stations to ensure site-level meteorological representativeness for analysis.

2.5. Investigation of PWN Presence in M. alternatus

To investigate the presence of PWNs within their vector insects, beetles collected from pheromone traps were brought to the laboratory for further examination. After determining the sex of each beetle, the surfaces were rinsed with distilled water before dissection. Nematodes within the beetles were isolated using the Baermann funnel method [29]. This procedure was performed in triplicate, and the number of PWNs was quantified.

2.6. Data Analysis

All survey results were analyzed using one-way analysis of variance (ANOVA), followed by Duncan’s multiple range test for post hoc comparisons. In addition, Pearson’s correlation analysis was conducted to examine the relationships between the survey results and the average temperatures across years, months, and days at each survey site [28]. Before the correlation analysis, the data were tested for normality using the Shapiro–Wilk test and for homogeneity of variances using Levene’s test. Log or square-root transformations were employed when necessary. Statistical significance was set at 5% (α = 0.05), and all analyses were performed using SAS Ver. 9.1 (SAS Institute, Cary, NC, USA) [7].

3. Results

3.1. PWN Density in Felled Black Pine Trees

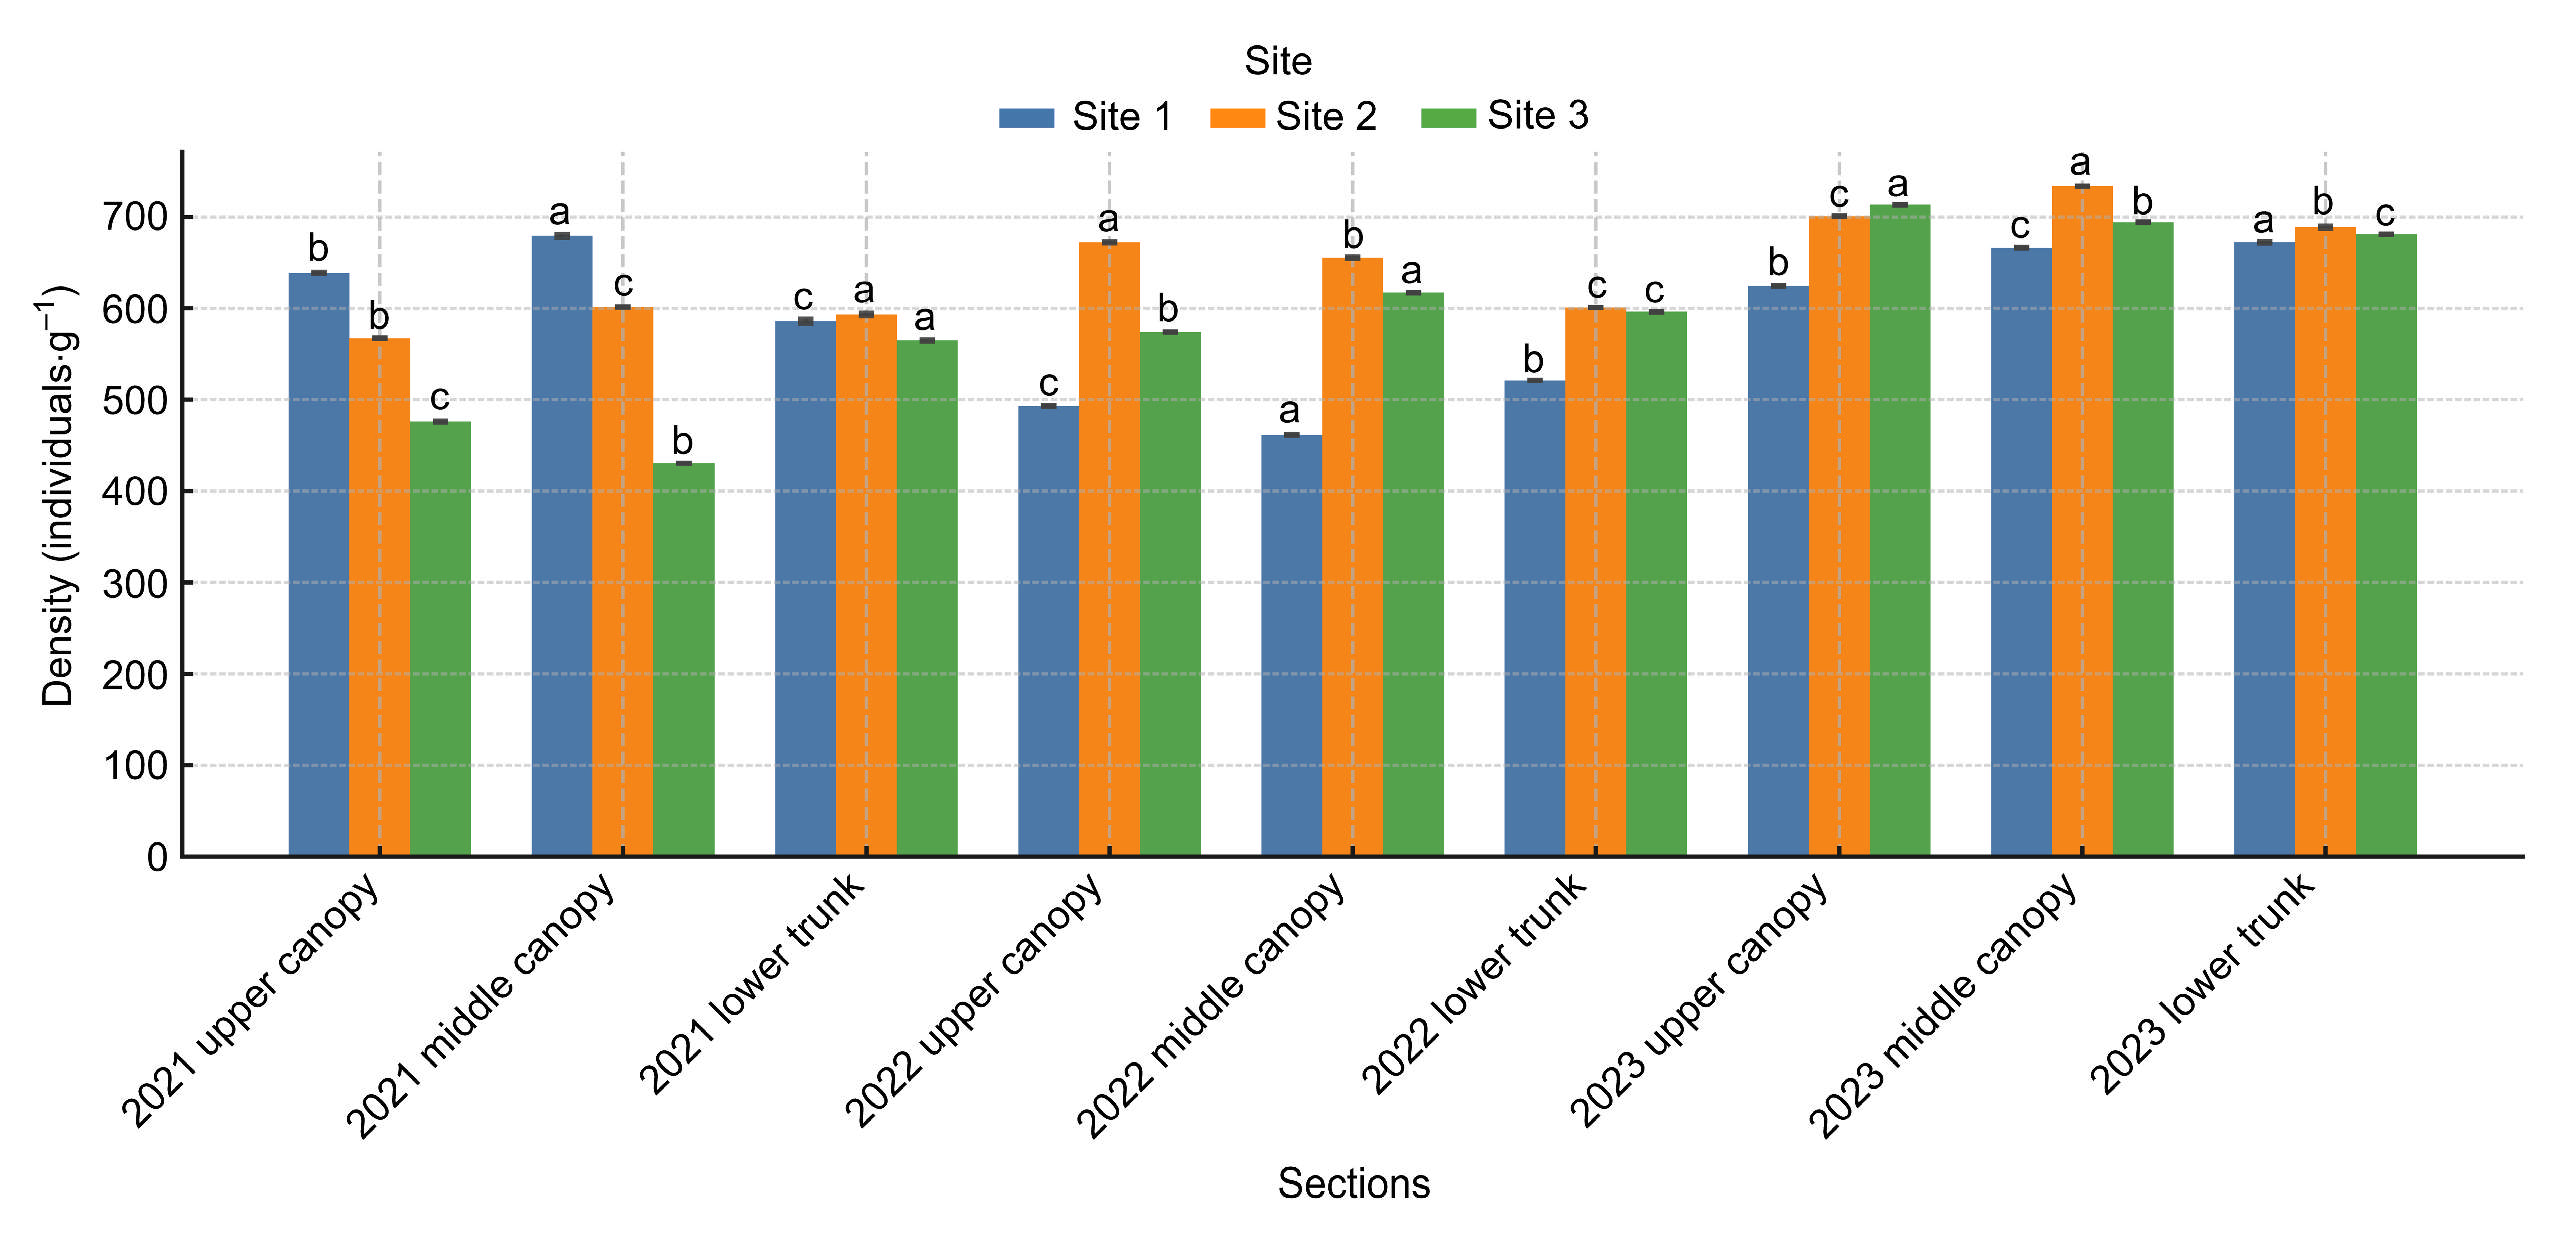
As summarized in Table 3 and illustrated in Figure 2, PWN densities (individuals ·g−1) differed significantly among the vertical positions within the tree (upper canopy, middle canopy, lower trunk) across all sites and years (p < 0.001). The middle canopy exhibited the highest densities at Sites 1 and 2, whereas Site 3 consistently peaked in the lower trunk region. In contrast, the upper canopy usually had the lowest values. Detailed means ± SD, F-statistics, and Duncan groupings are presented in Table 3.

3.2. Distribution of B. mucronatus in Felled Trees

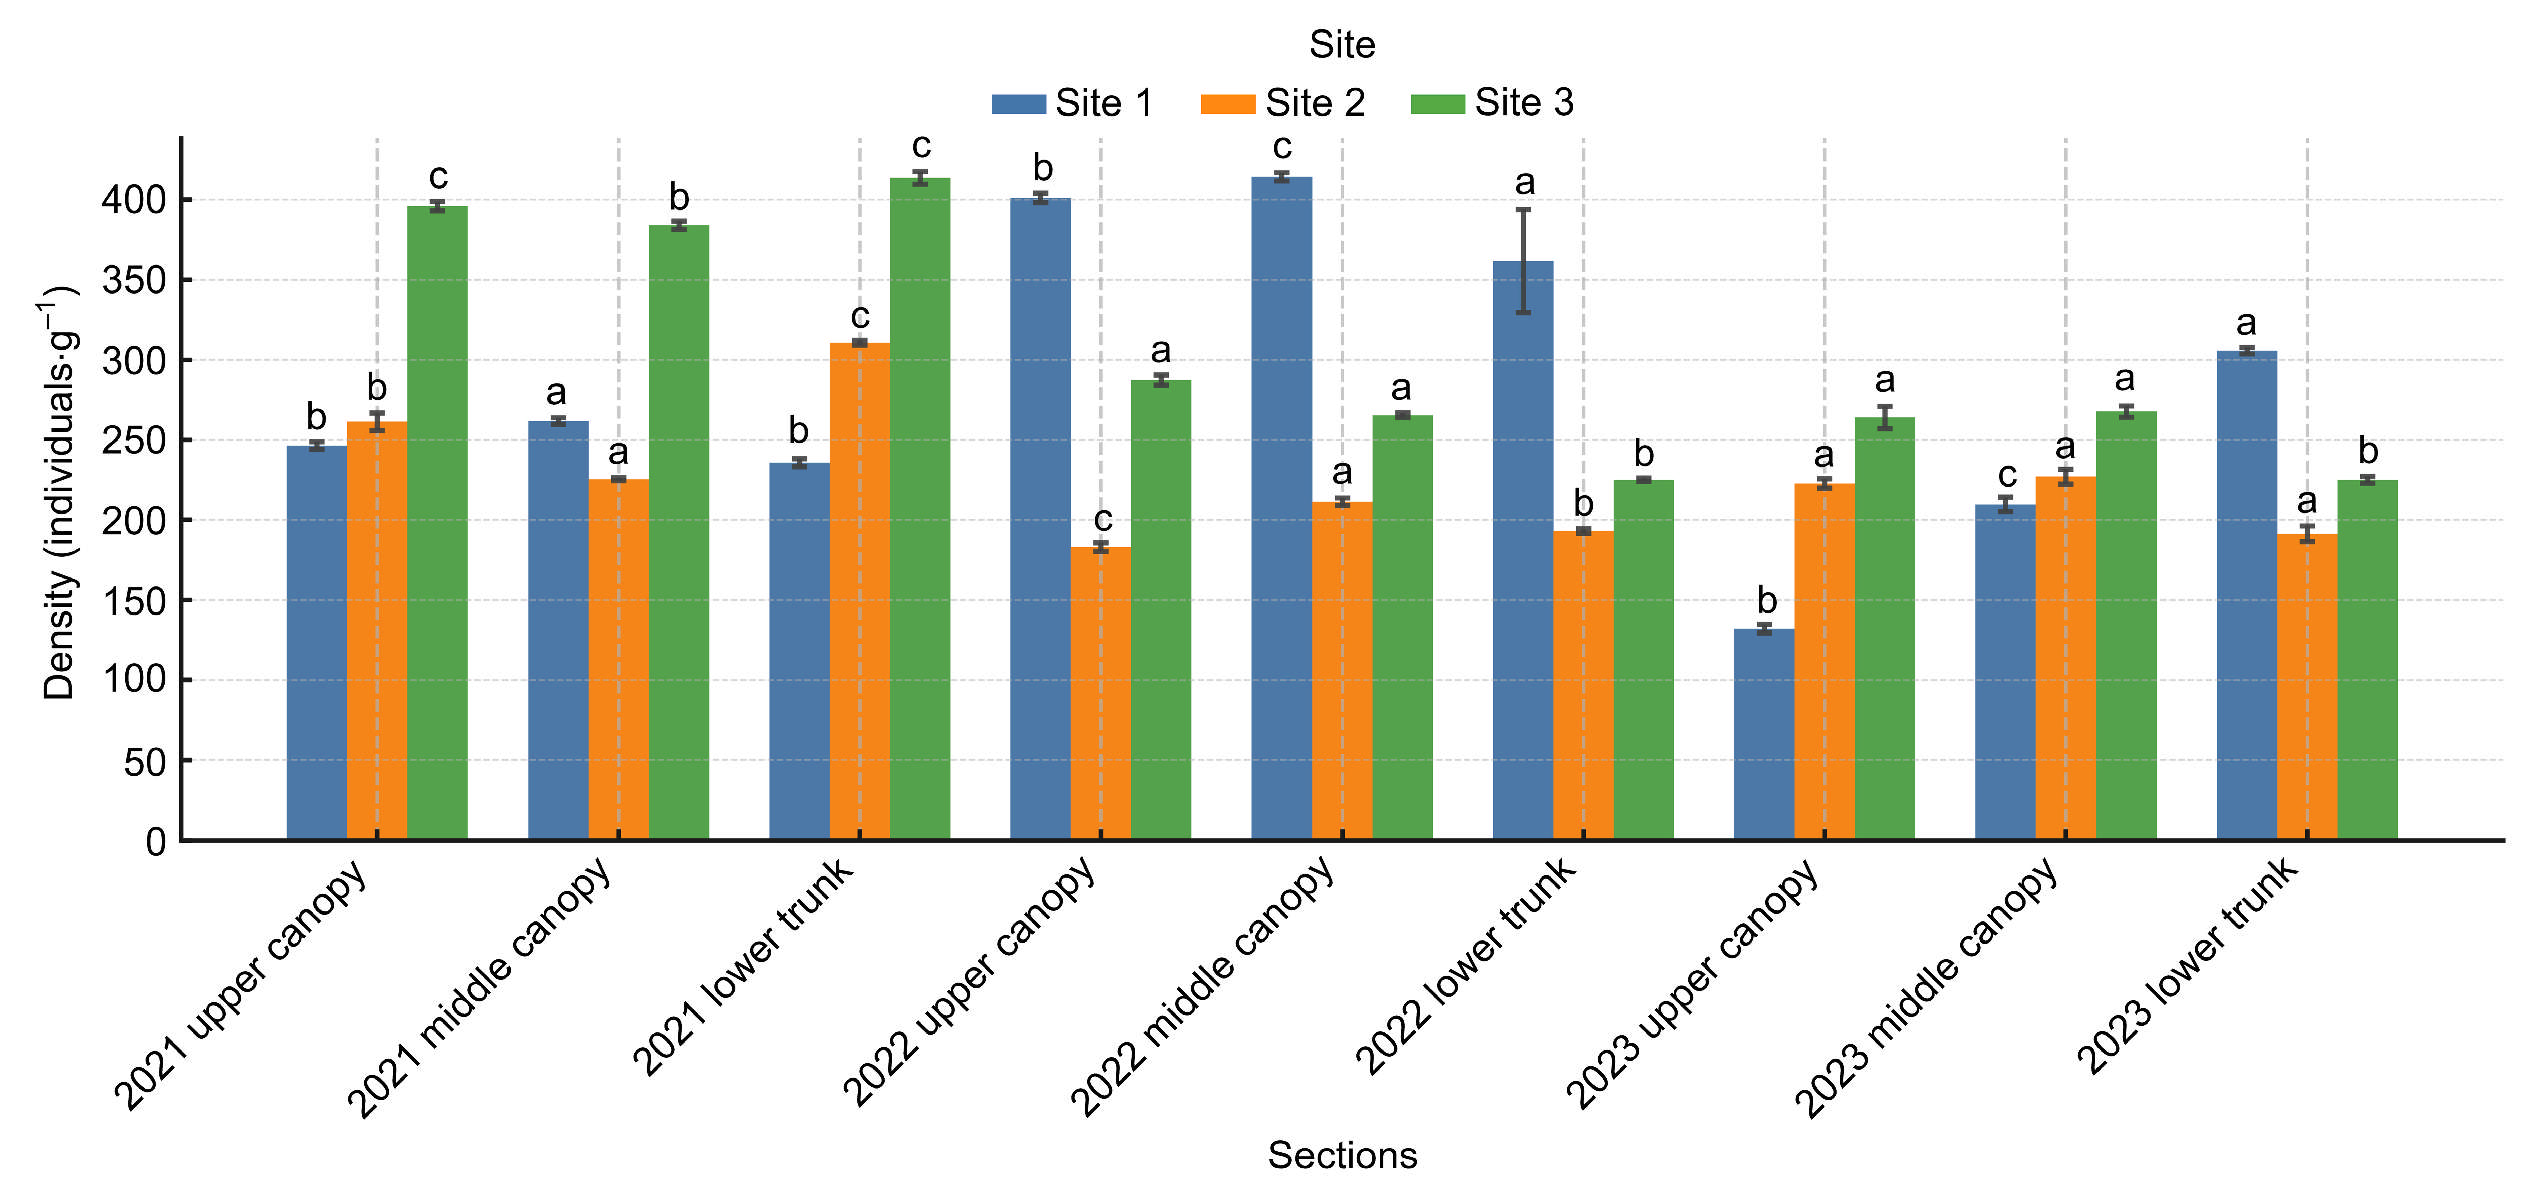
As summarized in Table 4 and illustrated in Figure 3, B. mucronatus density (individuals·g−1) varied significantly among vertical positions within the tree across survey sites and years. In 2021, the highest densities of the species were observed in the middle canopy, lower trunk, and lower trunk at Sites 1, 2, and 3, respectively. In 2022, the density was highest in the middle canopy at Sites 1 and 2, whereas Site 3 had relatively similar values across sections without significant differences (p = 0.132). In 2023, the lower trunk exhibited the highest value at Site 1, whereas the upper canopy exhibited the highest value at Sites 2 and 3. The detailed mean values, standard deviations, and ANOVA results are listed in Table 4.

3.3. Comparison of PWN and B. mucronatus Densities in Felled Trees

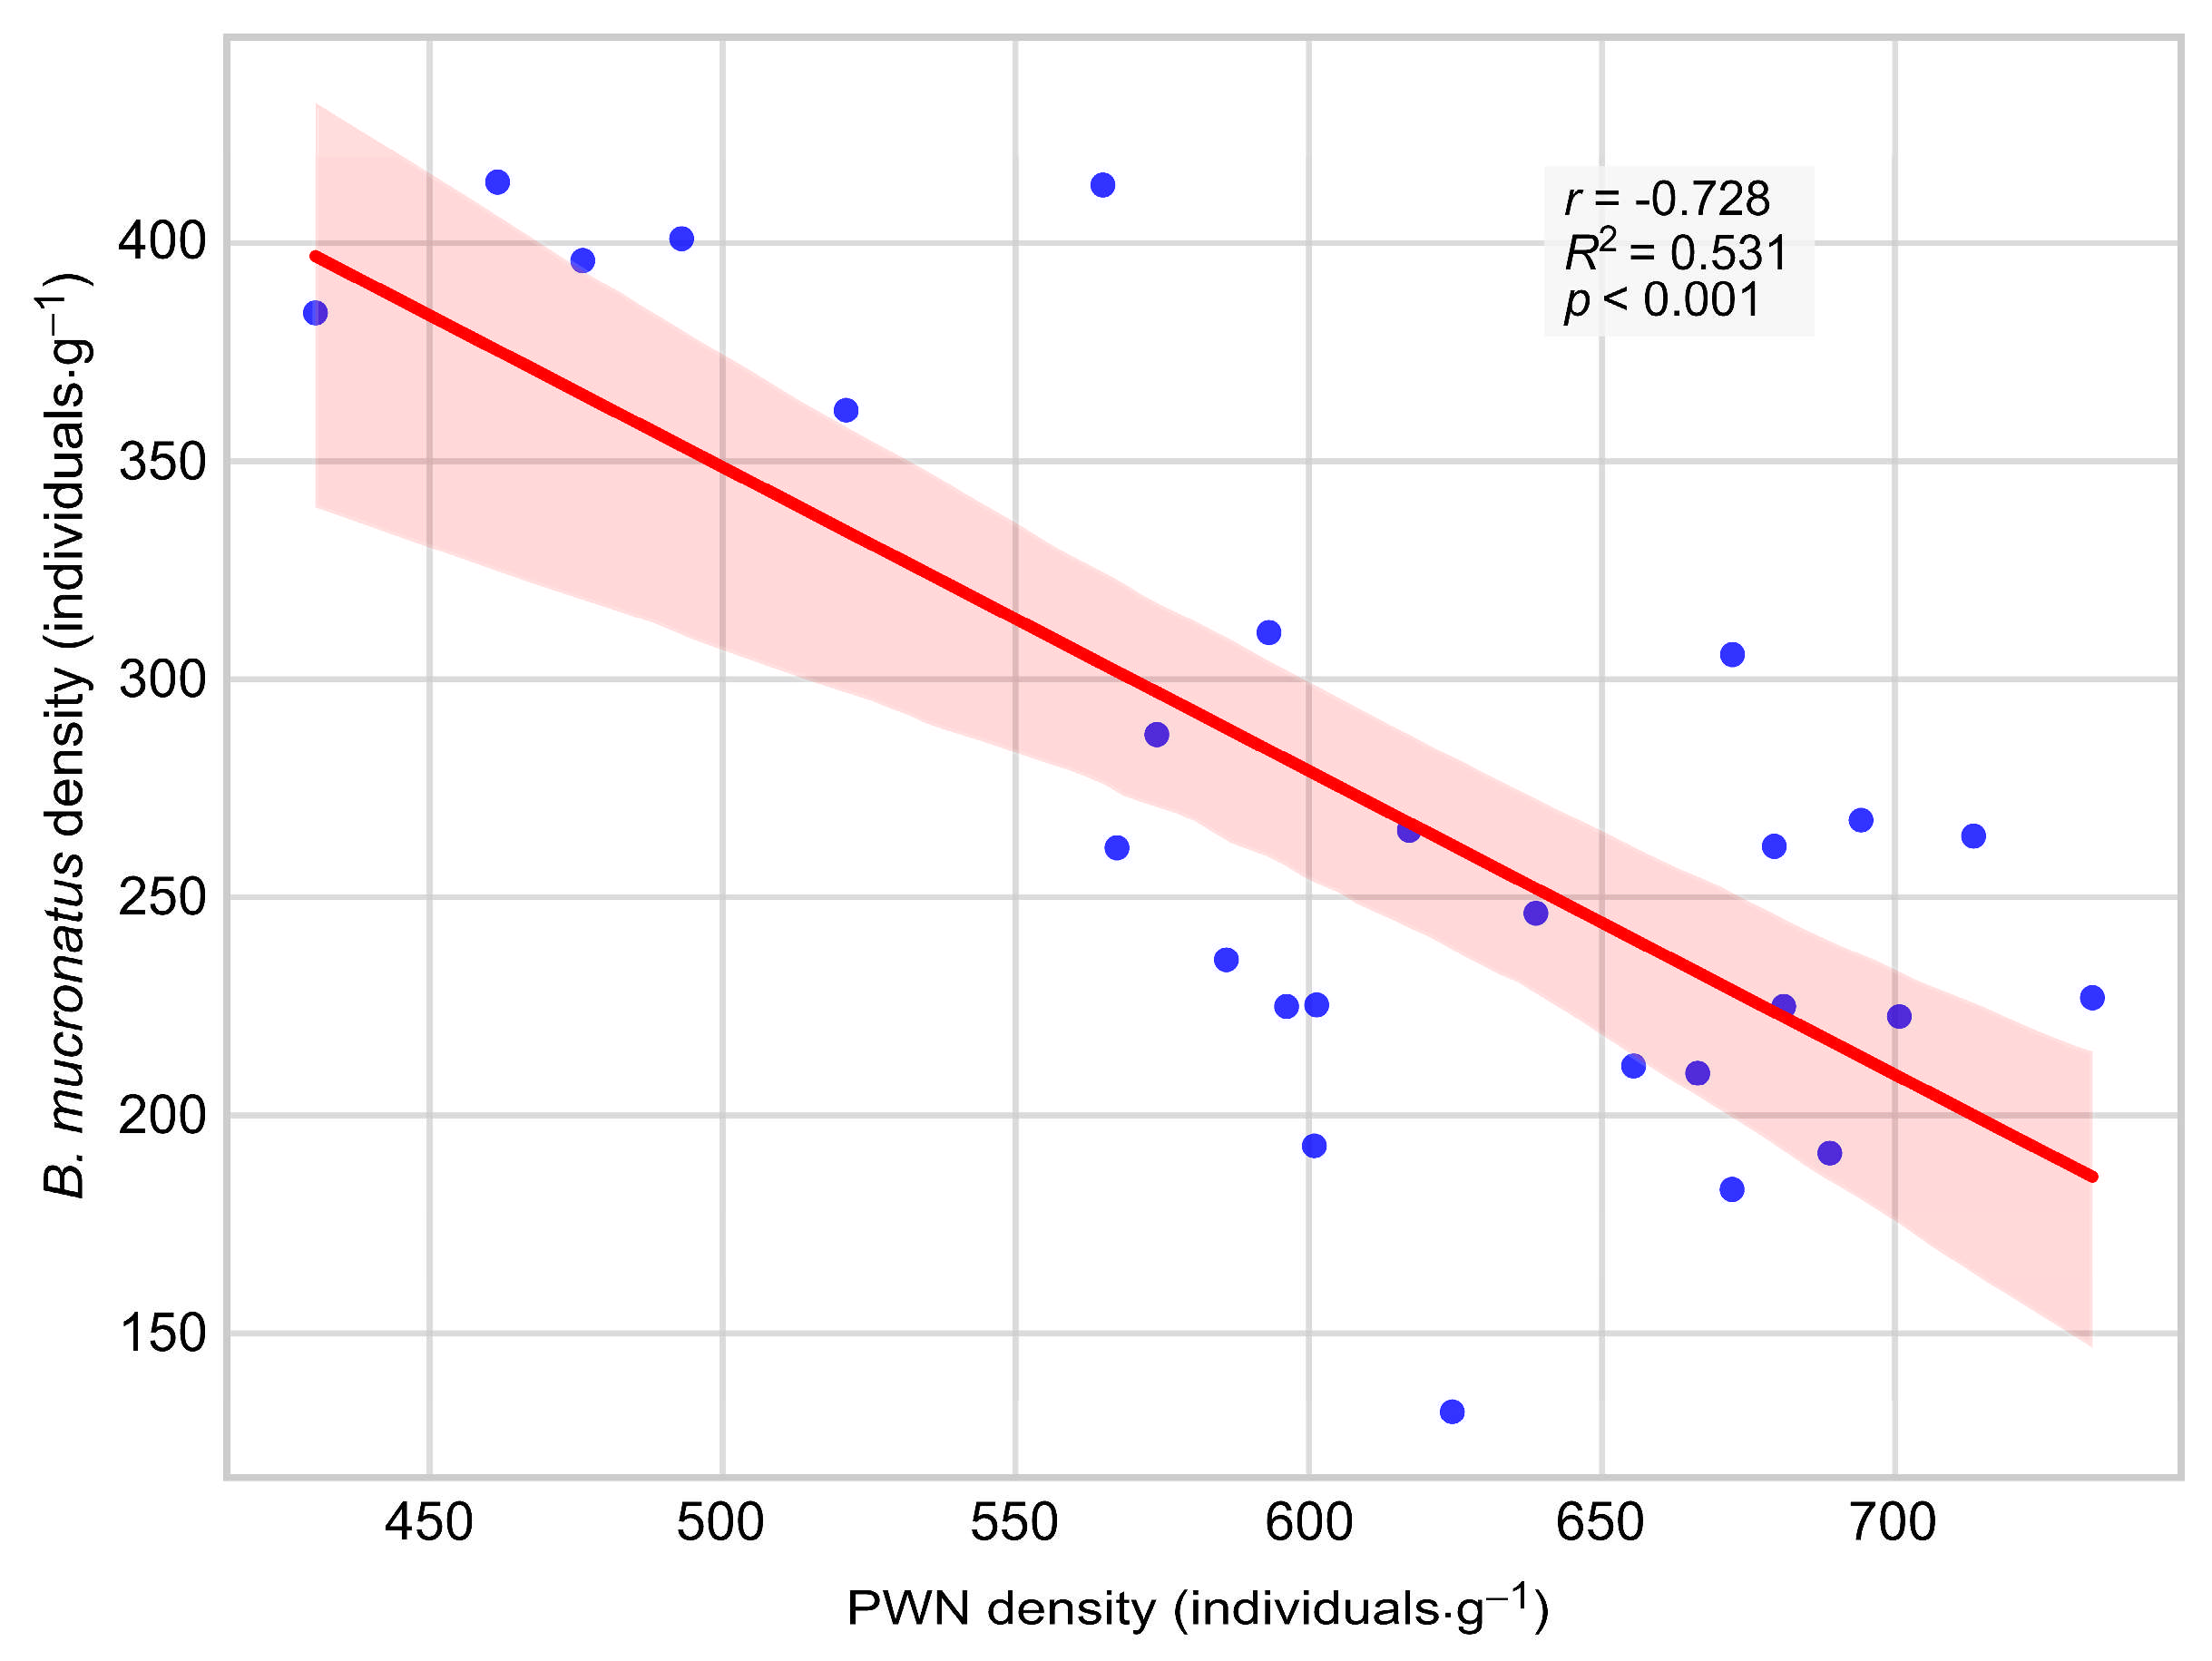
A comparative analysis of PWN and B. mucronatus densities in felled trees during the entire survey period revealed a strong negative correlation (r = −0.728, n = 27, p < 0.001), indicating that B. mucronatus density decreased with an increase in the distribution of PWN (Figure 4). To further quantify this relationship, ordinary least squares (OLS) regression was performed, yielding a significant negative slope (β = −0.696, p < 0.001), with the model explaining 53% of the variance in B. mucronatus density (R2 = 0.531).

3.4. Density of M. alternatus, the PWN Vector

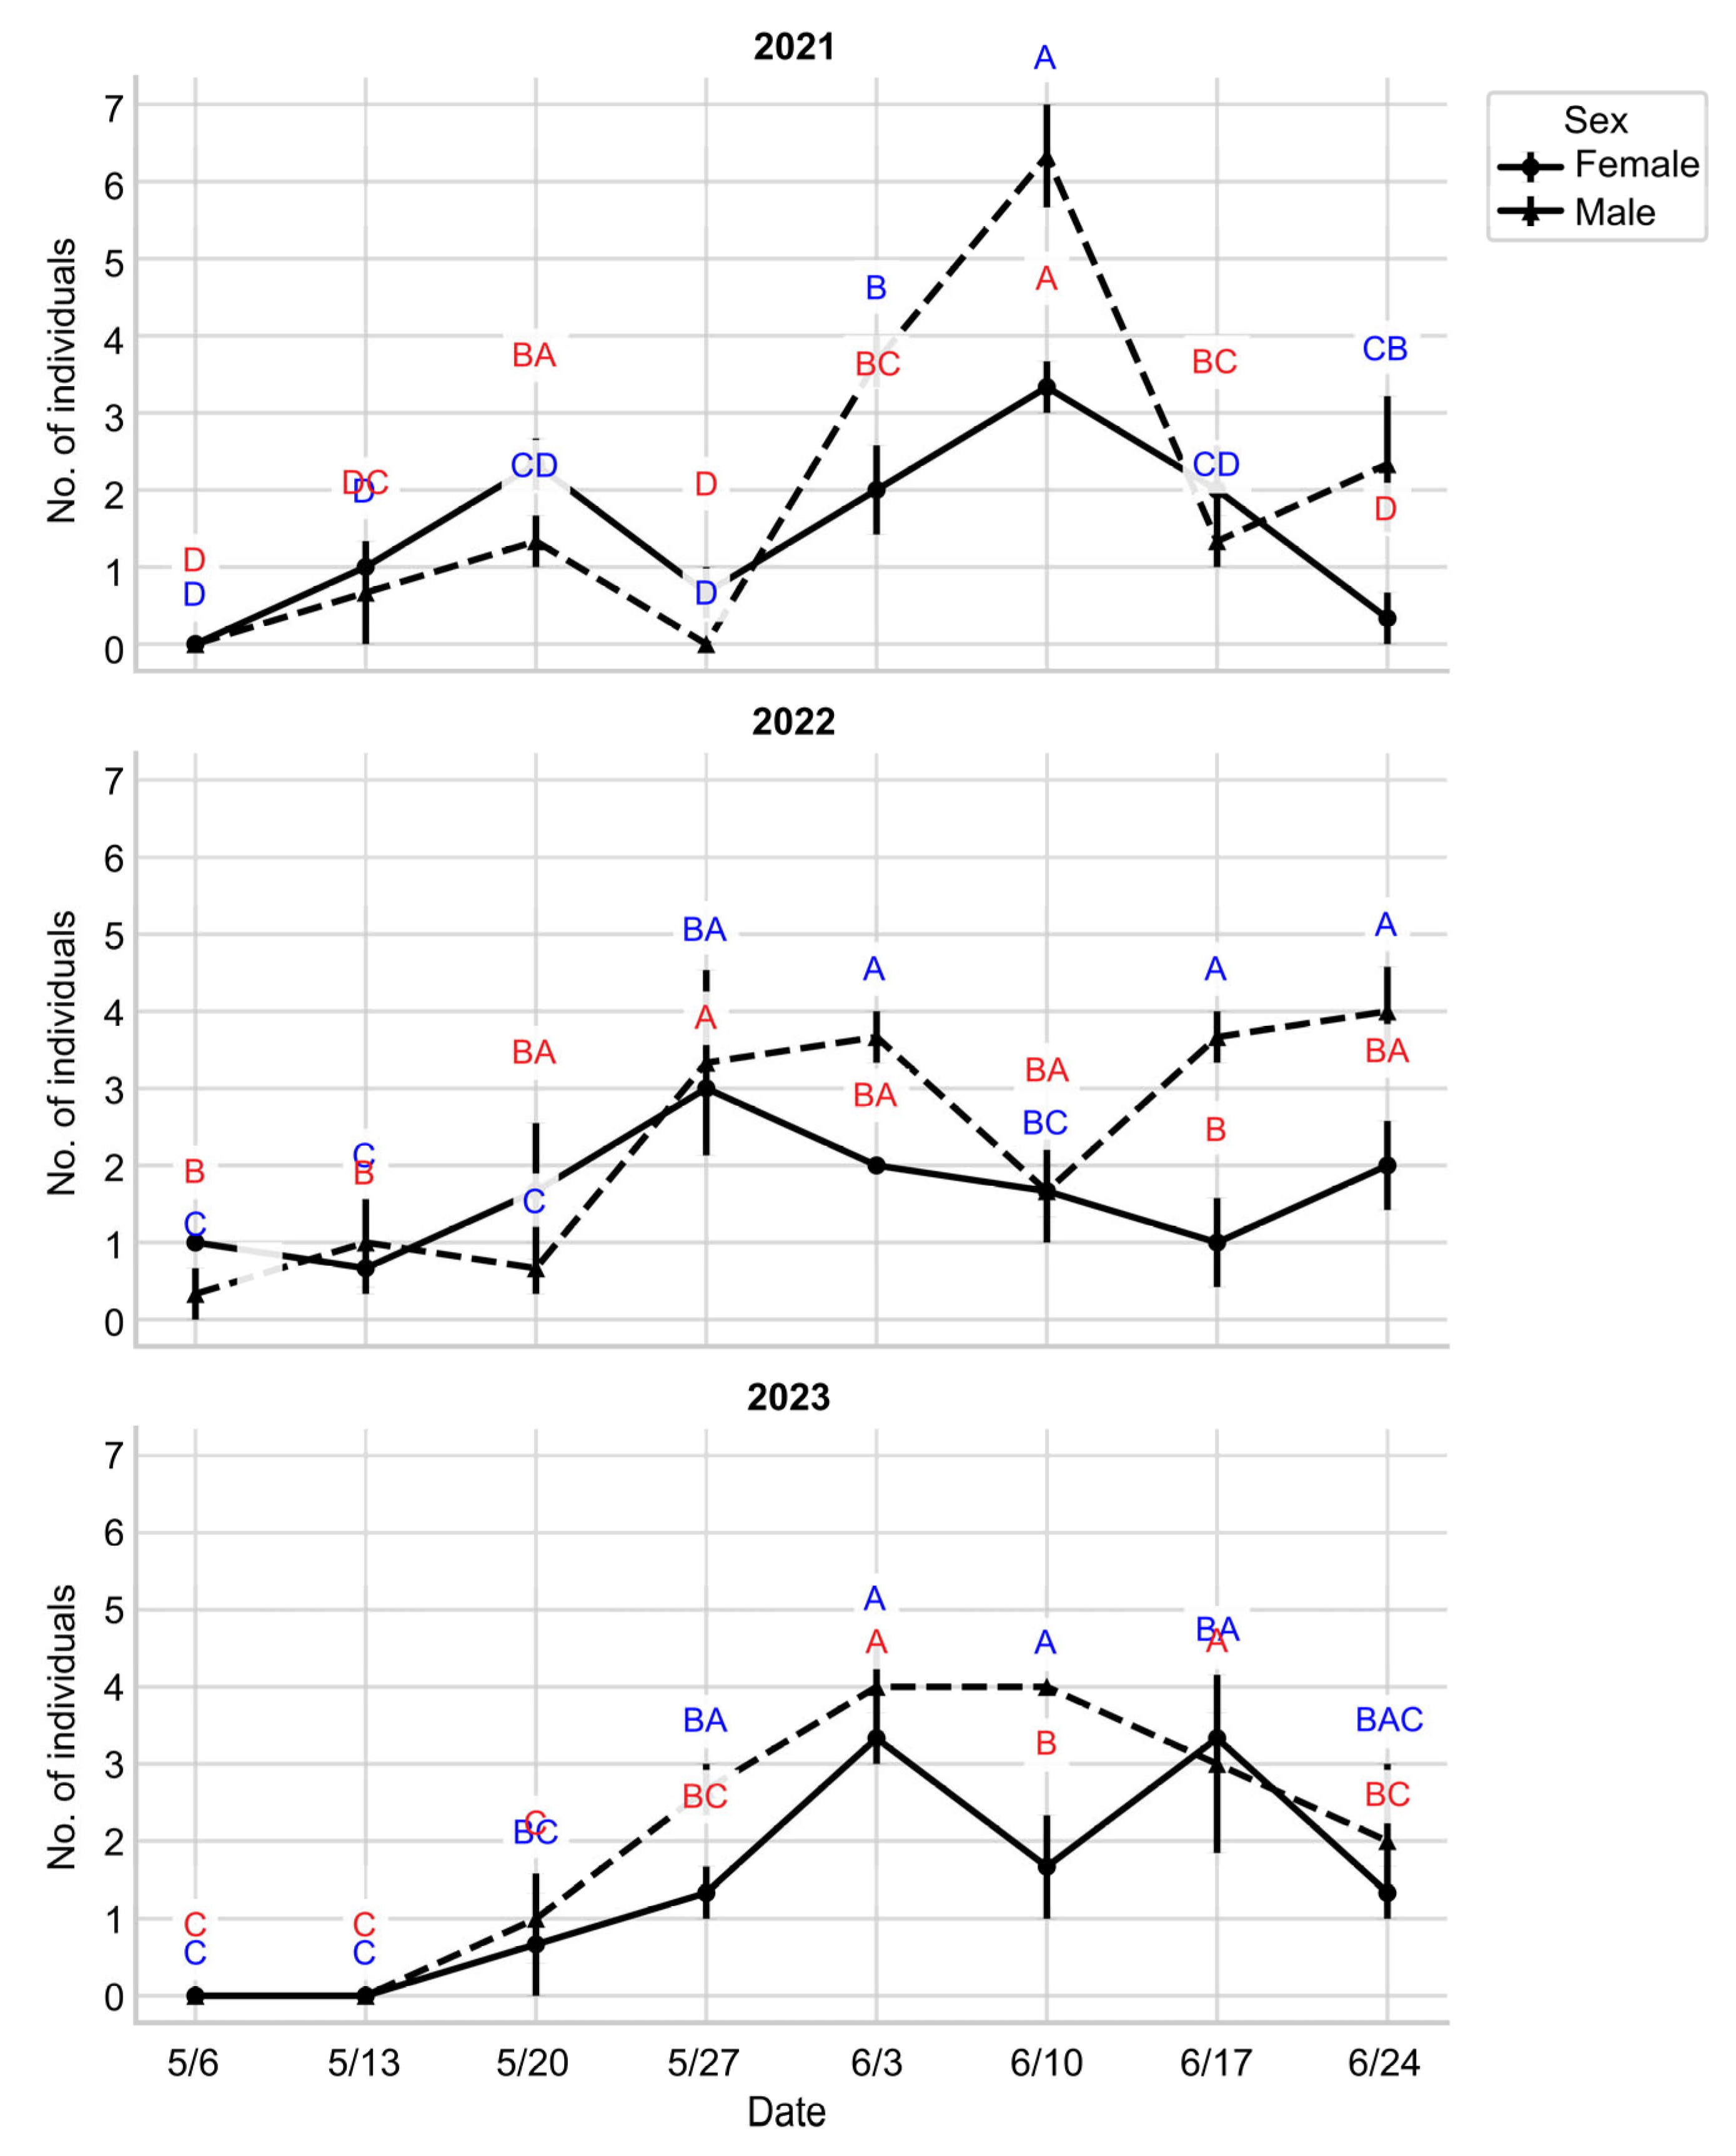
To investigate the distribution and density of M. alternatus, the primary vector of PWN, pheromone trap surveys were conducted at each site during the emergence period in May and June of 2021–2023. A total of 35, 39, and 35 females were collected across the three survey sites in 2021, 2022, and 2023, respectively, whereas 47, 55, and 50 males were captured in the same years (Figure 5).
In 2021, the first collection date was May 13 at all three sites. On that date, one female was captured at Site 1, one female and two males at Site 2, and one female at Site 3. The peak collection occurred on June 10, when the highest number of individuals were recorded across all sites. Specifically, three females and seven males were captured at Site 1, four females and seven males at Site 2, and three females and five males at Site 3 (F(7,16) = 19.87, p < 0.0001 for females; F(7,16) = 19.87, p < 0.0001 for males).
In 2022, the first collection date was May 6 at all sites. On that day, one female was collected from Site 1, one female and one male from Site 2, and one female from Site 3. The peak collection date was May 27 for Sites 1 and 2, with three females and five males at Site 1 and three females and four males at Site 2. At Site 3, the highest numbers were recorded on June 3 and June 17, with two females and four males collected on both dates (F(7,16) = 6.99, p = 0.0006 for females; F(7,16) = 6.76, p = 0.0008 for males).
In 2023, the first collection date was May 20 at all three sites. On that date, one male was collected at Site 1, two females at Site 2, and two males at Site 3. Peak collection dates varied by site: June 17 for Site 1 (four females and five males), June 3 for Site 2 (four females and five males), and June 10 for Site 3 (three females and four males) (F(7,16) = 9.36, p < 0.0001 for females; F(7,16) = 2.21, p = 0.089 for males). Across all survey sites, males were captured more frequently than females (Figure 5).

3.5. Density of PWN Hosted by M. alternatus

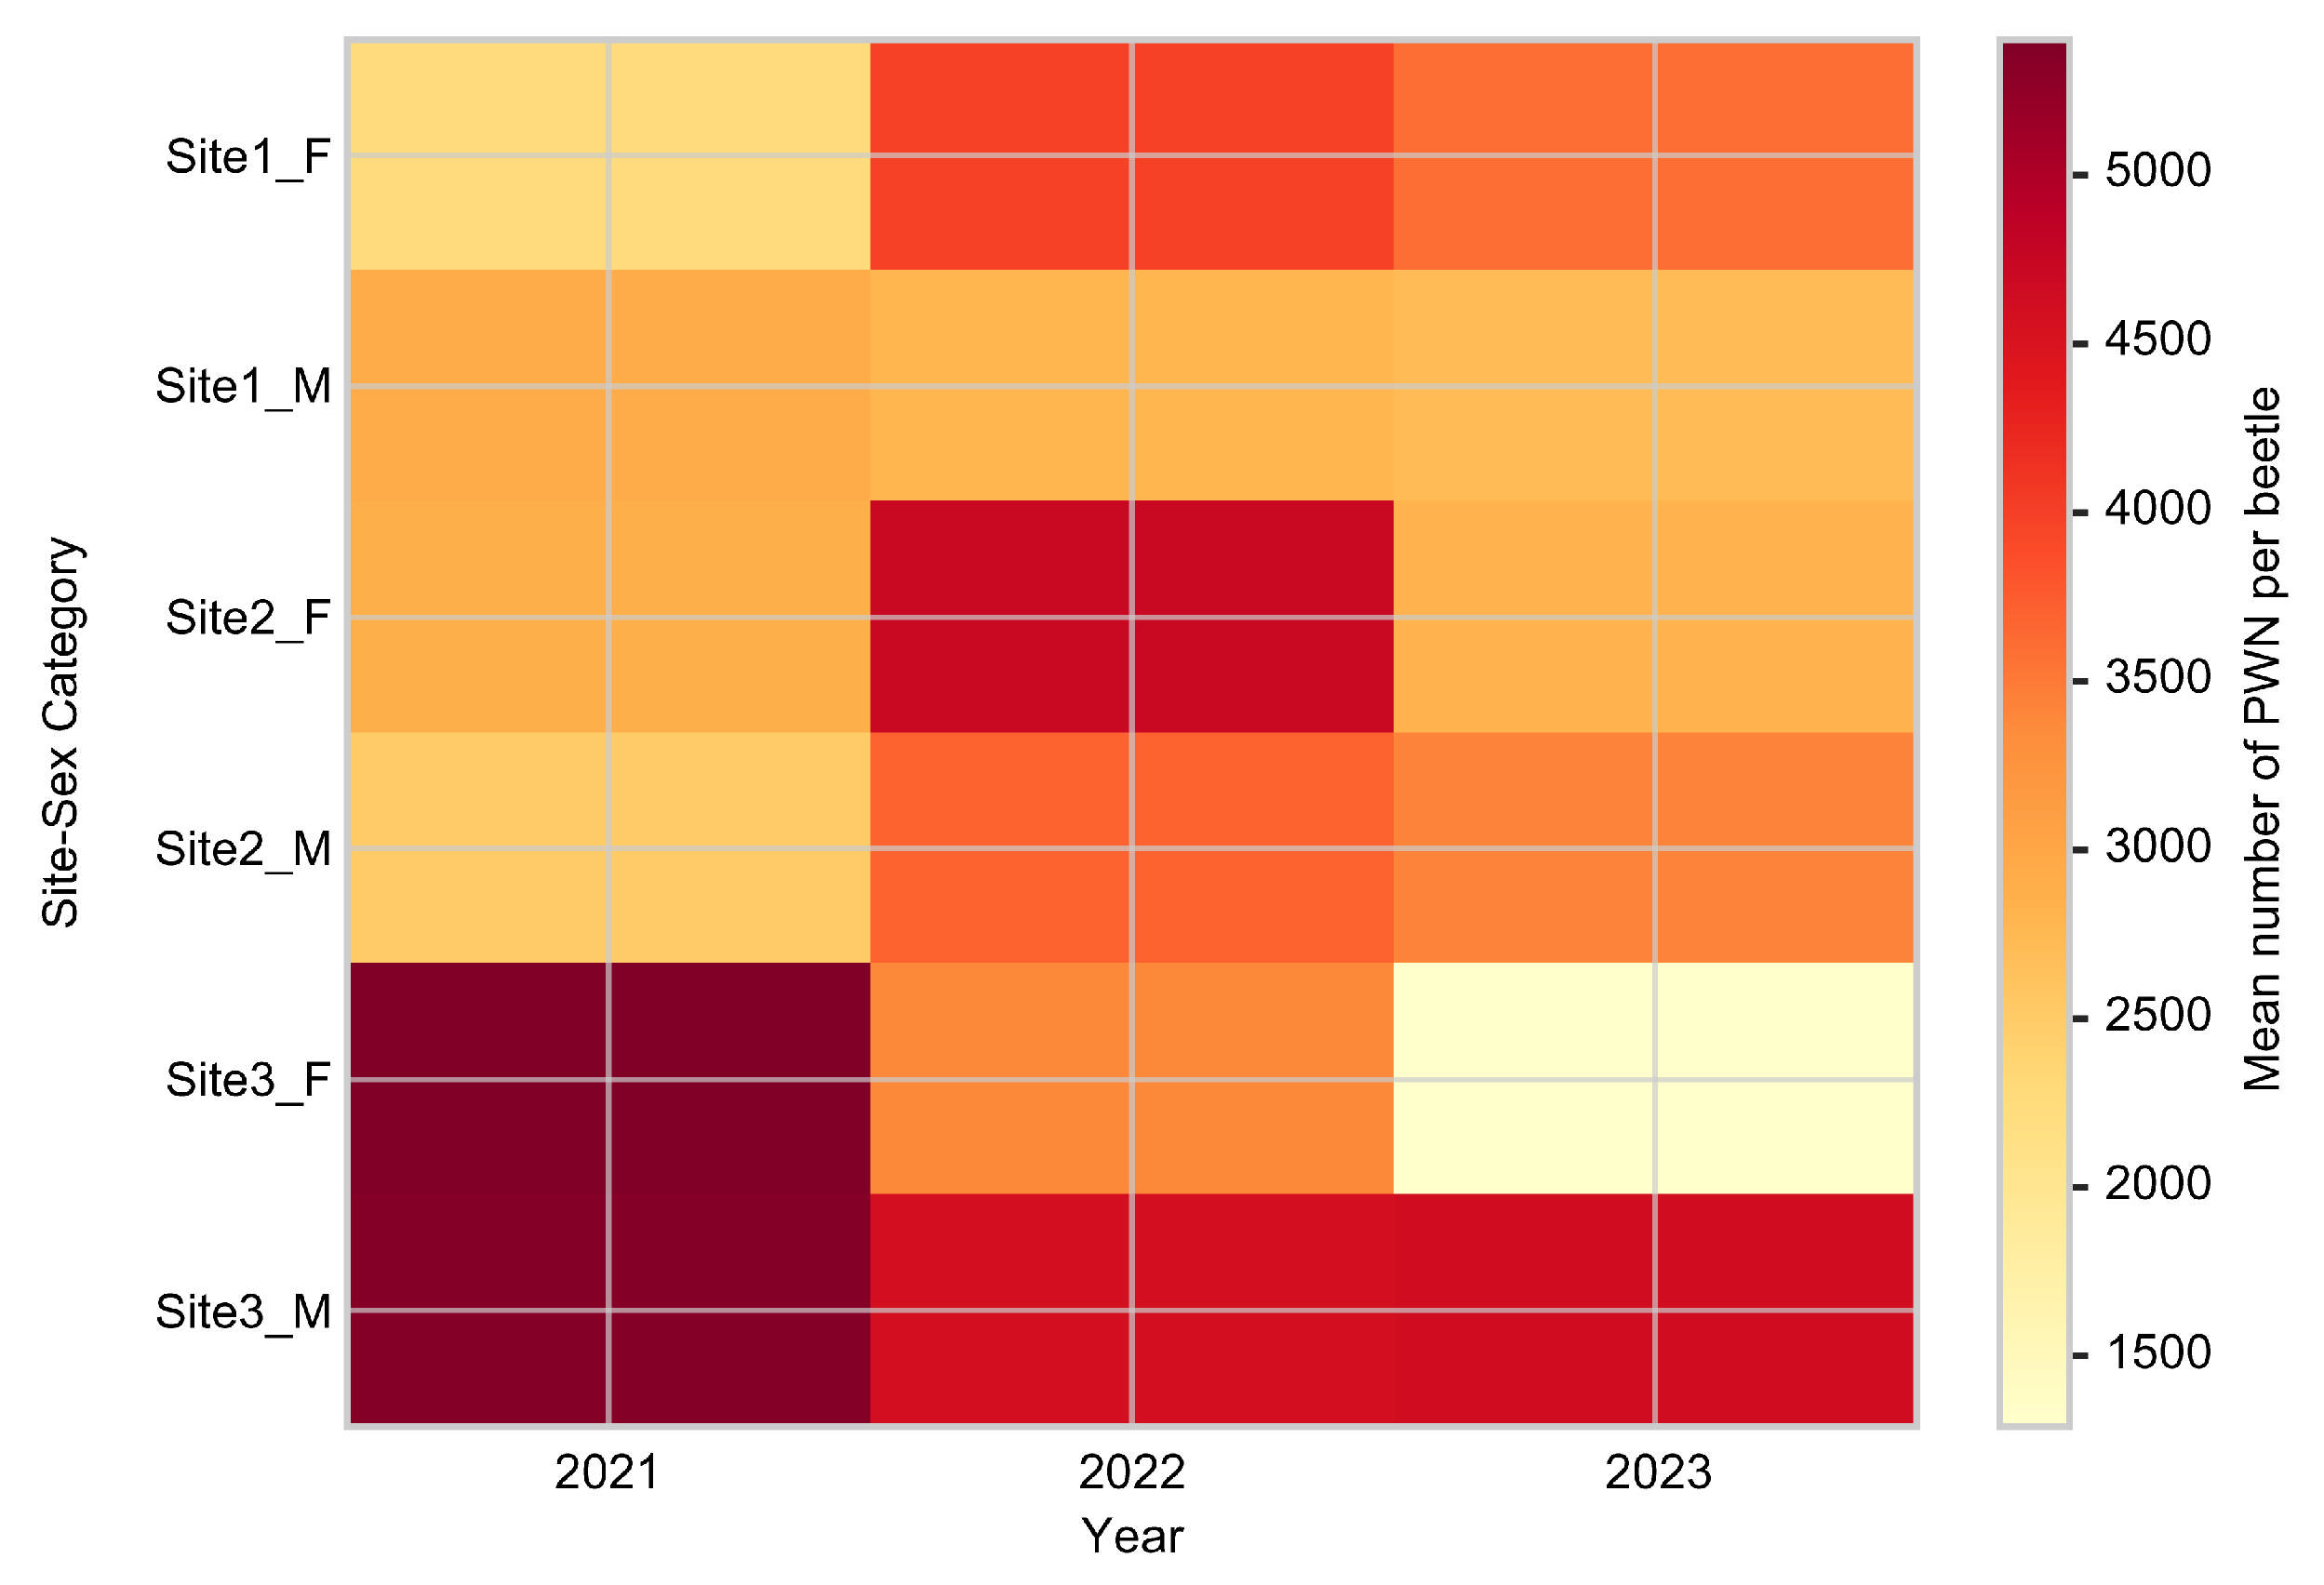
To investigate the PWN density hosted by M. alternatus, beetles were examined by sex and collection date across three sites from 2021 to 2023. On average, approximately half of the collected beetles harbored PWN, with an overall infection rate of 54–57%. Female and male beetles generally exhibited comparable nematode loads, although notably higher values were observed in females at Site 3 in 2021. Annual variation was evident, with higher loads in 2021–2022, followed by a general decline in 2023 (Table 5, Figure 6). The differences were significant according to the DMRT (p < 0.05). The detailed numerical values, including ranges, standard deviations, and Duncan’s multiple range test groupings, are provided in Supplementary Tables S1–S3.

3.6. Comparison of Temperature-Dependent Vector Distribution Across the Survey Sites

Considering that the daily average temperatures varied among the survey sites, both correlation and regression analyses were conducted to examine the relationship between temperature fluctuations and the density of M. alternatus, the primary PWN vector. Analyses were performed separately for each survey site and study year to account for spatial and temporal variations.
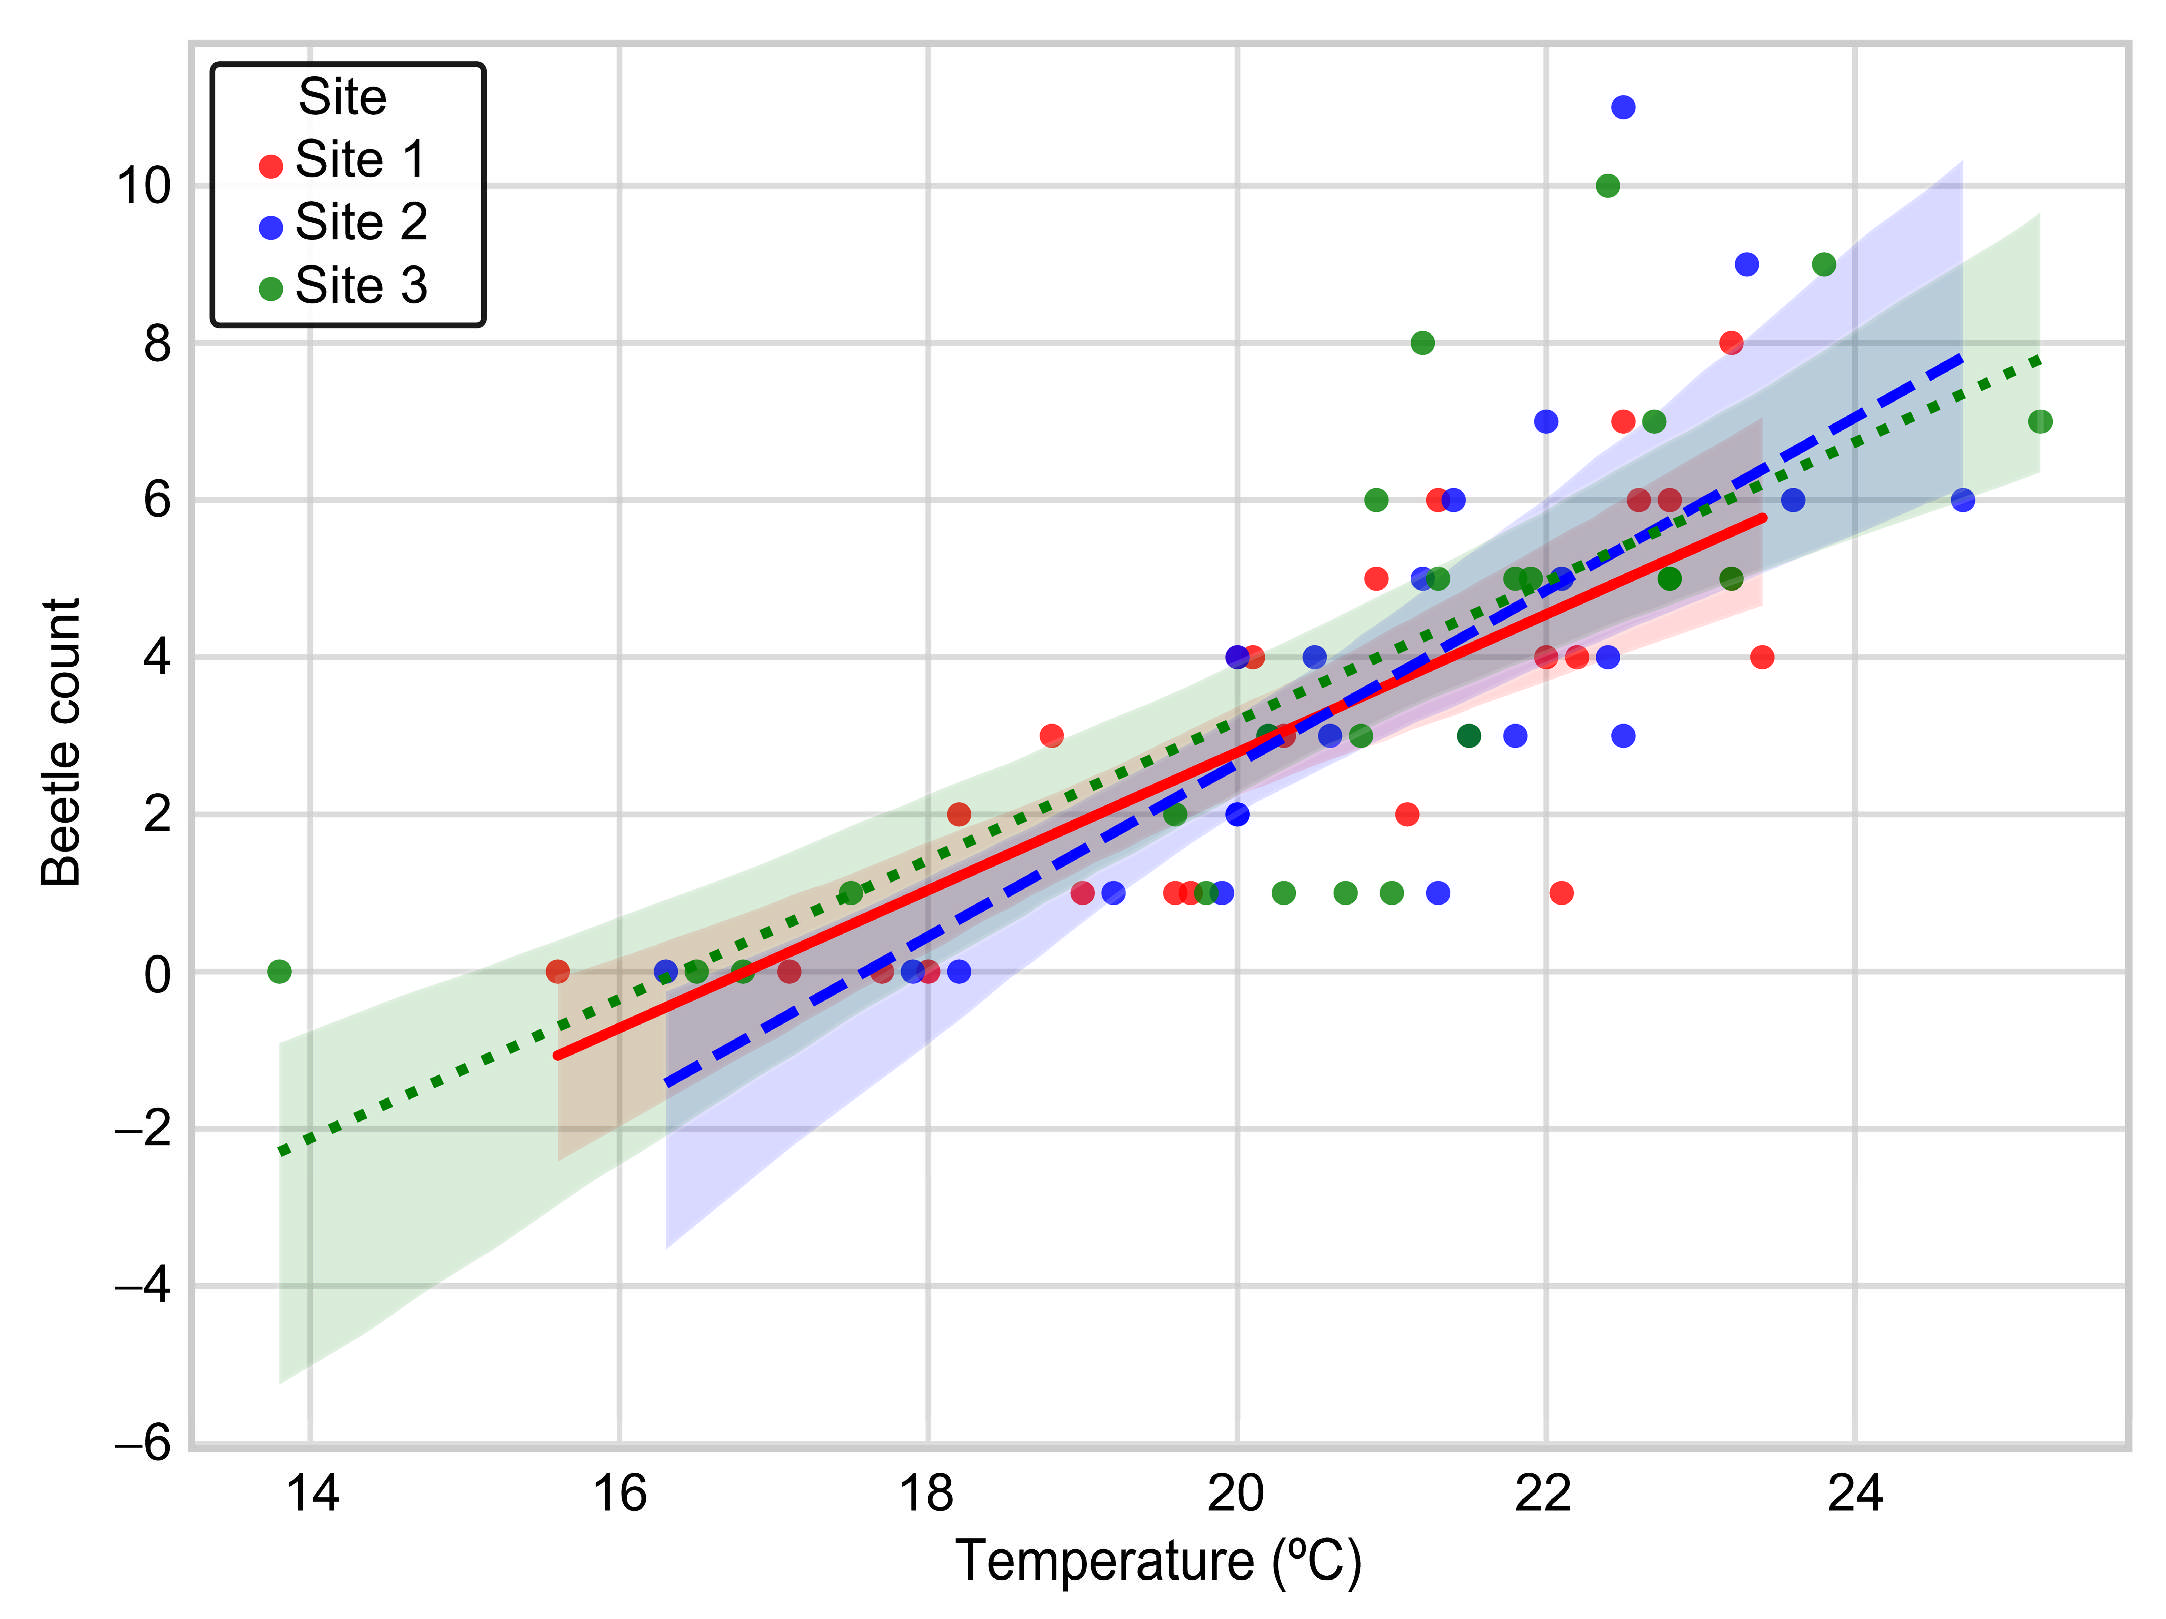
Across the survey sites, significant positive correlations were observed: Site 1 (r = 0.786, p < 0.01), Site 2 (r = 0.744, p < 0.01), and Site 3 (r = 0.755, p < 0.01) (Figure 7). Regression analysis further indicated that the daily mean temperature was positively associated with vector density. The regression slopes (β) showed that a 1 °C increase in temperature corresponded to an increase of approximately 0.88 beetles at Site 1 (R2 = 0.62, p < 0.001), 1.10 beetles at Site 2 (R2 = 0.55, p < 0.001), and 0.89 beetles at Site 3 (R2 = 0.57, p < 0.001).
A year-on-year comparison also revealed strong positive associations between temperature and the density of beetles. The Pearson correlation coefficients were significant for 2021 (r = 0.717, p < 0.01), 2022 (r = 0.751, p < 0.01), and 2023 (r = 0.829, p < 0.01) (Figure 8). Regression slopes further quantified the effects, showing that a 1 °C increase corresponded to an average rise of 1.08 beetles in 2021 (R2 = 0.51, p < 0.001), 0.97 beetles in 2022 (R2 = 0.56, p < 0.001), and 0.90 beetles in 2023 (R2 = 0.69, p < 0.001). The predictive power was the strongest in 2023, as reflected by the highest R2 value. The results suggest that although temperature consistently influenced beetle emergence, the magnitude of the effect varied slightly among sites, with Site 2 showing the steepest slope. Although temperature explained substantial variation in M. alternatus emergence, the findings remain associational and may reflect unmeasured co-varying factors (e.g., as humidity, precipitation, and phenology). Therefore, we interpreted temperature as a useful predictor of management timing rather than a proven causal driver in the current dataset.

4. Discussion

At a conceptual level, our findings are consistent with the core ideas in community ecology: density dependence and niche differentiation can generate negative cross-species associations when taxa share limiting resources or microhabitats. However, coexistence theory also emphasizes that similar patterns can arise from environmental filtering; thus, correlations alone are insufficient to infer biotic interactions. Under the competitive exclusion principle, demonstrating competition requires evidence that negative co-occurrence persists after conditioning on environmental covariates or results from manipulative experiments rather than from a shared environment or sampling structure [31,32,33,34].

4.1. PWN Density Across Vertical Positions

Variation across vertical positions likely reflects within-tree microenvironmental differences (e.g., exposure and tissue condition) that were not measured directly in this study. Previous research has suggested that wood moisture content and decay progression may influence PWN survival and proliferation [35,36,37]. For example, Mamiya [35] reported that recently dead trees, which retain higher moisture levels, provide favorable conditions for nematode proliferation, whereas long-dead trees with desiccated tissues become increasingly unfavorable for PWN survival. Similarly, Mamiya [35] emphasized the role of moisture dynamics and fungal colonization in decomposing wood on nematode density. In addition, Lee et al. [37] highlighted the influence of moisture dynamics and fungal colonization in decomposing wood on nematode population density, with recently dead trees exhibiting higher levels of infestation.
Although our results are consistent with these prior findings, we did not quantitatively measure wood moisture or decay stage. Thus, we interpret such mechanisms as hypotheses for future research, rather than conclusions from the present data. From a management perspective, these insights suggest that recently dead trees are potential reservoirs for PWN transmission during early decomposition. Therefore, their selective removal could be a strategy for suppressing PWN populations, reducing reliance on chemical treatments, and aligning with ecologically informed, decay-stage–sensitive, and temporally targeted control measures.

4.2. Distribution Patterns of B. mucronatus

This study elucidates the spatiotemporal distribution patterns of B. mucronatus within felled pine trees, demonstrating substantial variation in nematode density across different tree sections, sites, and years. The findings broadly follow the ecological framework proposed by Polomski and Rigling [38], who emphasized the pivotal role of microhabitat heterogeneity in shaping nematode populations, with key influences from light availability, moisture, temperature, and nutrient availability, even within a single host tree.
Our results further extend this perspective by showing that habitat conditions are both temporally and spatially dynamic, likely reflecting broader environmental fluctuations (e.g., precipitation regimes, canopy structure, and localized wood decay). Such variability provides a plausible explanation for the observed inconsistencies in B. mucronatus distribution, suggesting that habitat suitability is governed by a complex interplay of ecological processes at multiple scales. However, wood moisture content and decay stage were not quantified in this study; therefore, any references to these variables should be treated as hypotheses for future research rather than conclusions supported by our data.
In addition, Zhou et al. [39] demonstrated that B. mucronatus, traditionally regarded as less virulent than PWN, can induce substantial pine mortality under field conditions, even in the absence of severe abiotic stressors, such as drought or elevated temperatures. These finding challenges earlier assumptions regarding its ecological impact and highlights the need to consider a broader range of biotic and microenvironmental factors when assessing nematode-driven tree mortality. Our study aligns with this view, emphasizing that the observed negative correlations should not be over-interpreted as direct evidence of competition without controlling for shared environmental effects.
Collectively, these insights contribute to a more nuanced understanding of B. mucronatus ecology. By integrating fine-scale environmental variability into management considerations, forest health interventions can be tailored to specific ecological contexts. This approach aligns with the existing literature and advances it by embedding the temporal and spatial dynamics of host–nematode–environment interactions into practical, ecologically informed control frameworks. Incorporating such interactions into forest surveillance may enhance the precision of disease monitoring and the ecological basis of control measures.

4.3. Co-Occurrence of PWN and B. mucronatus

The strong negative association between PWN and B. mucronatus indicates co-occurrence trade-offs but does not, by itself, demonstrate interspecific competition. In observational datasets, inverse relationships can arise because both species respond in opposite ways to unmeasured environmental heterogeneity (e.g., vertical position, wood condition, moisture, and decay stage) or to the sampling structure. Accordingly, we interpret this pattern as an association pending analyses that control for environmental covariates or experimental tests. Suitable approaches include partial correlations that condition on measured covariates and joint species distribution models (JSDMs) that partition environment-driven covariation from residual species associations [40,41].
Temporal niche partitioning is a plausible hypothesis. PWN usually achieves relatively high densities in newly infected, moisture-rich tissues, whereas B. mucronatus, a saprotrophic species, persists in the later stages of decomposition when conditions are less favorable for PWN. Consistent with this idea, Park et al. [42] reported that nematodes isolated from recently killed or symptomatic trees exhibited higher virulence than those collected 2–3 years post-mortem; however, differences in virulence do not establish within-tree competitive displacement and should be viewed as supportive context rather than as proof [42,43].
From a management perspective, clarifying when and where each species usually occurs can improve section-specific sampling and the timing of sanitation felling. Proposals to leverage B. mucronatus as an indirect suppressor of PWN remain speculative; any application would require evidence that the negative association persists after accounting for environmental covariates and that the manipulation of B. mucronatus does not introduce unintended risks.
We regard the inverse association between PWN and B. mucronatus as a robust pattern that motivates hypothesis-driven tests of interaction rather than as evidence of competitive exclusion. Future work should pair targeted microhabitat measurements (e.g., moisture, quantitative decay stage) with multi-species models and, where feasible, manipulative experiments to adjudicate competition, environmental sorting, and successional replacement, thereby strengthening inference and management relevance.

4.4. Infestation of Vectors by PWN

The timing of M. alternatus emergence varied with the average temperature, consistent with previous findings that warming trends can advance vector emergence [42,44,45]. Regional differences in the first collection dates, such as the delayed emergence at coastal Site 1 compared with inland Site 3, are likely associated with local climatic influences (e.g., cooler spring sea temperatures, frequent fog) rather than being directly caused by any single factor.
Males were captured more frequently than females at all sites. Previous studies using pheromone traps, however, reported nearly equal male-to-female ratios in M. alternatus [46,47], whereas studies on M. saltuarius, another PWN vector, have shown either no sex-based differences [48] or female predominance [49]. These discrepancies suggest that trap captures may be influenced by both environmental context and lure composition, rather than reflecting intrinsic population sex ratios. Our study used a commercially available pheromone trap, whereas earlier research used different pheromone blends or tested under artificial rearing conditions. Such methodological variations could contribute to inconsistent results, underscoring the need for standardized, ecologically validated protocols for pheromone-based monitoring.
The observed variability in emergence timing further highlights the importance of environmental factors, particularly temperature, humidity, and precipitation, in determining vector activity. Although temperature exhibited the strongest association in our dataset, other climatic drivers, such as precipitation and drought stress, have also been linked to nematode survival and PWD spread under different conditions [40,50,51]. Dry conditions can accelerate PWD progression in susceptible pine species [31]. Nevertheless, because humidity or precipitation were not measured directly, these factors should be regarded as plausible mechanisms for future testing rather than conclusions from our current data.
Collectively, the findings indicate annual fluctuations in vector density and consistent sex-based differences in trap captures, which may arise from a combination of lure composition and local environmental variation. By integrating multiple climatic drivers into predictive models and validating monitoring methods under field conditions, future studies can improve the reliability of vector surveillance and contribute to ecologically robust pest management strategies.

4.5. Seasonal Emergence Dynamics of M. alternatus

The average proportion of M. alternatus individuals harboring PWN across all sites was 57%, which was higher than that reported in a previous nationwide pheromone trap survey [46]. This discrepancy is likely associated with differences in sampling methods: the previous study included randomly selected pine forests, whereas the present work focused on PWD-affected stands. Earlier research reported maximum loads of up to 298,000 nematodes per beetle [16], whereas the maximum observed here was 11,260. This difference may stem from pheromone trapping; beetles are not captured immediately after emergence but rather after dispersal and feeding, during which nematode loss can occur. Nematode loads peak within 2–3 weeks of emergence before declining [52,53,54]. Pheromone traps should be regarded primarily as monitoring tools, rather than direct control measures.
These findings highlight the importance of capturing timing in interpreting trap data and designing PWD management strategies. Differences in nematode densities across sites and years indicate that environmental conditions and local ecological factors may influence nematode–vector relationships. Substantial variation in nematode loads according to beetle, site, and year underscores the roles of the timing of capture, vector age, and environmental variables. Thus, interventions targeting newly emerged beetles may be more effective in reducing transmission.
Beyond confirming regional variation and timing effects, our results suggest that transmission efficiency declines rapidly after emergence, reinforcing the need to target vectors early in their adult stages. Moreover, the fact that nematode loads here did not exceed 11,260, well below previously reported maxima, suggests that vector infectivity under field conditions may be environmentally constrained. These dynamics underscore the importance of integrating the temporal window of nematode–vector interactions into sustainable management protocols. These approaches can reduce unnecessary chemical applications and enhance control precision. In addition, future research should examine whether competitive displacement by B. mucronatus in the later stages of wood decay influences the probability of PWN acquisition by newly emerged beetles. Such insights can inform ecologically based suppression strategies and improve the long-term sustainability of PWD management.

4.6. Climatic Influences on M. alternatus Emergence

The results indicate that temperature is consistently associated with M. alternatus emergence, although the magnitude of the association varied slightly among sites, with Site 2 showing the steepest slope. Although temperature explained substantial variation in emergence, the relationships remained associational and may reflect the influence of unmeasured co-varying factors, such as humidity, precipitation, or phenology [55,56]. Therefore, we interpret temperature as a useful predictor of management timing rather than a proven causal driver.
Year-on-year analyses also revealed strong positive associations between temperature and beetle density. The Pearson correlation coefficients were significant for 2021 (r = 0.717, p < 0.01), 2022 (r = 0.751, p < 0.01), and 2023 (r = 0.829, p < 0.01) (Figure 7). Regression slopes quantified the effects, showing that a 1 °C increase corresponded to an average rise of 1.08 beetles in 2021 (R2 = 0.51, p < 0.001), 0.97 beetles in 2022 (R2 = 0.56, p < 0.001), and 0.90 beetles in 2023 (R2 = 0.69, p < 0.001). The predictive power was the strongest in 2023, as reflected by the highest R2 value, suggesting that beetle emergence was most closely aligned with temperature in that year. In parallel, recent global-to-regional projections using species distribution models and hybrid frameworks indicate poleward and altitudinal shifts in PWD risk and Monochamus habitat suitability under future warming, reinforcing the need to consider multiple climatic drivers beyond temperature [45,57,58,59].
Collectively, these results underscore the importance of considering both spatial and temporal variations in climate–vector relationships. Correlation analyses confirmed the general association, whereas regression analyses provided quantitative effect sizes, revealing site- and year-specific heterogeneity. From a management perspective, the findings support the development of climate-informed adaptive strategies that anticipate vector emergence based on temperature trends while recognizing the need to incorporate additional climatic drivers into predictive models for greater ecological robustness.
To move from pattern to process, future work should (i) collect key microhabitat covariates with standardized protocols; (ii) analyze abundance using GLMMs/GAMMs with appropriate error structures (e.g., negative binomial/zero-inflated for overdispersed counts) and site × year random effects, reporting effect sizes with uncertainty and residual diagnostics; (iii) use partial correlations/graphical models to condition on measured environment; (iv) fit JSDMs (e.g., HMSC) to partition environment-driven covariation from residual species associations and to test for putative interactions; (v) conduct sensitivity analyses and cross-validation to assess robustness; and, where feasible, (vi) implement field or mesocosm experiments that manipulate resource availability or co-occurrence. These steps will strengthen causal interpretation, yield management-relevant effect sizes, and reduce the risk of over-interpreting co-occurrence signals.

5. Conclusions

This study synthesizes multi-year, multi-site field observations of PWD components, including PWN, B. mucronatus, and the vector M. alternatus, to clarify patterns relevant to the surveillance and management of PWD in the Republic of Korea. Our results show that (i) PWN densities differed among vertical positions within the tree across sites and years; (ii) B. mucronatus also varied by vertical position and year, and we observed a negative association with PWN; and (iii) M. alternatus emergence was positively associated with daily mean temperature, with site- and year-specific effect sizes. The findings provide associational evidence that can inform monitoring design and timing rather than establish causal mechanisms.
Significance and limitations. The study design was observational, and some potentially critical microhabitat variables, particularly wood moisture and quantitative decay stage, were not measured. Consequently, any discussion involving these factors should be regarded as hypotheses for future testing and not conclusions from our data. Similarly, the inverse relationship between PWN and B. mucronatus does not, by itself, demonstrate competition; targeted analyses that condition the environment and experimental work are required to adjudicate among competition, environmental sorting, and successional replacement.
Management implications: Within the aforementioned limits, the results of this study support temperature-informed scheduling of surveillance and sanitation (e.g., trap deployment, inspection, and felling) and section-specific sampling that reflects vertical heterogeneity within trees. Pheromone trap observations and beetle load data further indicate that capture timing matters: traps are most reliable as monitoring tools, and interventions targeting newly emerged vectors are likely to be more effective than later actions. Such insights could facilitate the minimization of unnecessary chemical inputs while enhancing precise control.
Future directions. To move from pattern to process, we recommend collecting key microhabitat covariates with standardized protocols and applying modern analytical frameworks (e.g., GLMMs/GAMMs, partial correlations, and JSDMs) alongside field or mesocosm experiments, where feasible. Incorporating additional climatic drivers beyond temperature (e.g., humidity and precipitation) would enable more robust climate-adaptive forecasting of vector activity and pathogen risk.
By integrating climate-sensitive information with ecological monitoring, this study supports progress toward sustainable forest health management aligned with broader goals (e.g., biodiversity conservation, ecosystem resilience, and climate-aware pest management; SDG 15 and SDG 13). Implementing these data and modeling extensions would enhance inference and enable more targeted, lower-chemical interventions for long-term PWD mitigation.

Supplementary Materials

The following supporting information can be downloaded at: https://www.mdpi.com/article/10.3390/su17198796/s1, Table S1: Detailed numerical values of pine wood nematodes hosted by Monochamus alternatus in 2021; Table S2: Detailed numerical values of pine wood nematodes hosted by Monochamus alternatus in 2022; Table S3: Detailed numerical values of pine wood nematodes hosted by Monochamus alternatus in 2023.

Author Contributions

Conceptualization, C.K.L., H.K. and M.-L.H.; data curation, M.-L.H.; formal analysis, C.K.L., H.K. and M.-L.H.; investigation, C.K.L. and M.-L.H.; methodology, C.K.L. and H.K.; project administration, C.K.L.; resources, C.K.L. and M.-L.H.; software, M.-L.H.; supervision, C.K.L.; validation, M.-L.H.; visualization, M.-L.H.; writing—original draft, M.-L.H.; writing—review and editing, C.K.L. and H.K. All authors have read and agreed to the published version of the manuscript.

Funding

This research received no external funding.

Institutional Review Board Statement

Not applicable.

Informed Consent Statement

Not applicable.

Data Availability Statement

The raw data supporting the conclusions of this study will be made available by the authors upon request.

Conflicts of Interest

The authors declare no conflicts of interest.

Abbreviations

The following abbreviations are used in this manuscript:
DBHdiameter at breast height
DMRTDuncan’s multiple range test
UAVunmanned aerial vehicle
KMAKorea Meteorological Administration
EtOHethanol
PWDpine wilt disease
PWNpine wood nematode

References

  1. Korea Forest Service. Statistical Yearbook of Forestry, No. 53; Korea Forest Service: Seoul, Republic of Korea, 2023; p. 36. [Google Scholar]
  2. Abatzoglou, J.T.; Williams, A.P. Impact of anthropogenic climate change on wildfire across western US forests. Proc. Natl. Acad. Sci. USA 2016, 113, 11770–11775. [Google Scholar] [CrossRef] [PubMed]
  3. IPCC. Climate Change 2021: The Physical Science Basis. Contribution of Working Group I to the Sixth Assessment Report of the Intergovernmental Panel on Climate Change; Masson-Delmotte, V., Zhai, P., Pirani, A., Connors, S.L., Péan, C., Berger, S., Caud, N., Chen, Y., Goldfarb, L., Gomis, M.I., et al., Eds.; Cambridge University Press: Cambridge, UK, 2021. [Google Scholar] [CrossRef]
  4. Jolly, W.M.; Cochrane, M.A.; Freeborn, P.H.; Holden, Z.A.; Brown, T.J.; Williamson, G.J.; Bowman, D.M.J.S. Climate-induced variations in global wildfire danger from 1979 to 2013. Nat. Commun. 2015, 6, 7537. [Google Scholar] [CrossRef] [PubMed]
  5. Kobayashi, F.; Yamane, A.; Ikeda, T. The Japanese pine sawyer beetle as the vector of pine wilt disease. Annu. Rev. Entomol. 1984, 29, 115–135. [Google Scholar] [CrossRef]
  6. Myers, R.F. Pathogenesis in pine wilt caused by pinewood nematode, Bursaphelenchus xylophilus. J. Nematol. 1988, 20, 236–244. Available online: https://www.ncbi.nlm.nih.gov/pmc/articles/PMC2618809/ (accessed on 27 September 2025).
  7. SAS Institute Inc. SAS/STAT Statistical Software, Version 9.1; SAS Publishing: Cary, NC, USA, 2003.
  8. Mamiya, Y. Pathology of the pine wilt disease caused by Bursaphelenchus xylophilus. Annu. Rev. Phytopathol. 1983, 21, 201–220. [Google Scholar] [CrossRef]
  9. Dwinell, L.D.; Nickle, W.R. An Overview of the Pine Wood Nematode Ban in North America; Gen. Tech. Rep. SE-55; U.S. Department of Agriculture, Forest Service, Southeastern Forest Experiment Station: Asheville, NC, USA, 1989; 13p. Available online: https://www.srs.fs.usda.gov/pubs/gtr/uncaptured/gtr_se055.pdf (accessed on 27 September 2025).
  10. Knowles, K.; Beaubien, Y.; Wingfield, M.J.; French, D.W. The pinewood nematode is new in Canada. Can. J. Plant Pathol. 1983, 5, 40–41. [Google Scholar]
  11. Sutherland, J.R.; Ring, F.M.; Seed, J.E. Canadian conifers as hosts of the pinewood nematode (Bursaphelenchus xylophilus): Results of seedling inoculations. Scand. J. For. Res. 1991, 6, 209–216. [Google Scholar] [CrossRef]
  12. Abelleira, A.; Picoaga, A.; Mansilla, J.P.; Aguin, O. Detection of Bursaphelenchus xylophilus, causal agent of pine wilt disease, on Pinus pinaster in northwestern Spain. Plant Dis. 2011, 95, 776. [Google Scholar] [CrossRef]
  13. Cheng, H.R.; Lin, M.; Li, W.; Fang, Z. The occurrence of a pine wilting disease caused by a nematode found in Nanjing. For. Pest Dis. 1983, 4, 1–5. [Google Scholar]
  14. Enda, N. The status of pine wilt disease caused by Bursaphelenchus xylophilus (Steiner & Buhrer) Nickle and its control in Korea. J. Korean Soc. For. Sci. 1989, 78, 248–253. (In Korean) [Google Scholar]
  15. Mota, M.M.; Braasch, H.; Bravo, M.A.; Penas, P.C.; Burgermeister, W.; Metge, K.; Sousa, E. First report of Bursaphelenchus xylophilus in Portugal and in Europe. Nematology 1999, 1, 727–734. [Google Scholar] [CrossRef]
  16. Xu, Q.; Zhang, X.; Li, J.; Ren, J.; Ren, L.; Luo, Y. Pine wilt disease in Northeast and Northwest China: A comprehensive risk review. Forests 2023, 14, 174. [Google Scholar] [CrossRef]
  17. Yi, C.K.; Byun, B.H.; Park, J.D.; Yang, S.I.; Chang, K.H. First finding of the pine wood nematode, Bursaphelenchus xylophilus (Steiner & Buhrer) Nickle, and its insect vector in Korea. Res. Rep. For. Res. Inst. Seoul 1989, 38, 141–149. (In Korean) [Google Scholar]
  18. Mamiya, Y.; Enda, N. Transmission of Bursaphelenchus lignicolus (Nematoda: Aphelenchoididae) by Monochamus alternatus (Coleoptera: Cerambycidae). Nematologica 1972, 18, 159–162. [Google Scholar] [CrossRef]
  19. Kishi, Y. Pine Wood Nematode and the Japanese Pine Sawyer; Thomas Company Ltd.: Tokyo, Japan, 1995; p. 302. [Google Scholar]
  20. Futai, K. Pine wilt in Japan: From first incidence to the present. In Pine Wilt Disease; Zhao, B.G., Futai, K., Sutherland, J.R., Takeuchi, Y., Eds.; Springer: Tokyo, Japan, 2008; pp. 5–12. [Google Scholar]
  21. Park, Y.S.; Chung, Y.J.; Moon, Y.S. Hazard ratings of pine forests to a pine wilt disease at two spatial scales (individual trees and stands) using self-organizing map and random forest. Ecol. Inform. 2013, 13, 40–46. [Google Scholar] [CrossRef]
  22. Hirata, A.; Nakamura, K.; Nakao, K.; Kominami, Y.; Tanaka, N.; Ohashi, H.; Takano, K.T.; Takeuchi, W.; Matsui, T. Potential distribution of pine wilt disease under future climate change scenarios. PLoS ONE 2017, 12, e0182837. [Google Scholar] [CrossRef]
  23. Lu, Q.; Wang, W.; Liang, J.; Yan, D.; Jia, X.; Zhang, X. Potential suitability assessment of Bursaphelenchus xylophilus in China. For. Res. Chin. Acad. For. 2005, 18, 460–464. [Google Scholar]
  24. Rutherford, T.A.; Webster, J.M. Distribution of pine wilt disease with respect to temperature in North America, Japan, and Europe. Can. J. For. Res. 1987, 17, 1050–1059. [Google Scholar] [CrossRef]
  25. Kwon, T.S.; Lim, J.H.; Sim, S.J.; Kwon, Y.D.; Son, S.K.; Lee, K.Y.; Kim, Y.T.; Park, J.W.; Shin, C.H.; Ryu, S.B.; et al. Distribution patterns of Monochamus alternatus and M. saltuarius (Coleoptera: Cerambycidae) in Korea. J. Korean For. Soc. 2006, 95, 543–550. (In Korean) [Google Scholar]
  26. Jung, J.K.; Hong, E.J.; Kim, T.G.; Jeong, J.C. Ground beetle (Coleoptera: Carabidae) assemblage structure in Taeanhaean National Park: A comparison between coastal dune and windbreak forest. Korean J. Environ. Ecol. 2018, 32, 147–153. (In Korean) [Google Scholar] [CrossRef]
  27. Lee, J.Y.; Kim, Y.J.; Han, S.Y.; Park, C.G.; Choi, W.S. Detection of the infection stage of pine wilt disease and spread distance using UAV and remote sensing. Remote Sens. 2024, 16, 364. [Google Scholar] [CrossRef]
  28. Korea Forest Service. Pine Wilt Disease Control Guide; Korea Forest Service: Seoul, Republic of Korea, 2016; p. 20. [Google Scholar]
  29. Baermann, G. Eine einfache Methode zur Auffindung von Ancylostomum (Nematoden) Larven in Erdproben. Geneeskd Tijdschr Ned. Indië 1917, 57, 131–137. [Google Scholar]
  30. Korea Meteorological Administration. Climate Statistics Analysis. 2023. Available online: https://data.kma.go.kr/climate/RankState/selectRankStatisticsDivisionList.do?pgmNo=179 (accessed on 26 March 2024).
  31. Estorninho, M.; Lino-Neto, T.; Barbosa, P.; Fonseca, L. Differential impact of the pinewood nematode on Pinus pinaster under drought conditions. Front. Plant Sci. 2022, 13, 841707. [Google Scholar] [CrossRef] [PubMed]
  32. Chesson, P. Mechanisms of maintenance of species diversity. Annu. Rev. Ecol. Syst. 2000, 31, 343–366. [Google Scholar] [CrossRef]
  33. Gause, G.F. The Struggle for Existence; Williams & Wilkins: Baltimore, MD, USA, 1934. [Google Scholar]
  34. Warton, D.I.; Blanchet, F.G.; O’Hara, R.B.; Ovaskainen, O.; Taskinen, S.; Walker, S.C.; Hui, F.K.C. Joint modelling in community ecology. Trends Ecol. Evol. 2015, 30, 766–779. [Google Scholar] [CrossRef] [PubMed]
  35. Mamiya, Y. History of pine wilt disease in Japan. J. Nematol. 1988, 20, 219–226. [Google Scholar]
  36. Lee, M.Y.; Lee, C.H.; Ha, M.L.; Kim, H. The dynamics of pine wilt nematode (B. xylophilus) in pine wilt disease-infected trees in Gyeongsangnam-do, Sacheon City. J. Korean Island 2023, 35, 213–227. (In Korean) [Google Scholar] [CrossRef]
  37. Polomski, J.; Rigling, D. Effect of watering regime on disease development in Pinus sylvestris seedlings inoculated with Bursaphelenchus vallesianus and B. mucronatus. Plant Dis. 2010, 94, 1055–1061. [Google Scholar] [CrossRef]
  38. Zhou, L.F.; Chen, F.M.; Wang, J.C.; Pan, H.Y.; Ye, J.R. Virulence of Bursaphelenchus mucronatus to pine seedlings and trees under field conditions. For. Pathol. 2016, 46, 563–570. [Google Scholar] [CrossRef]
  39. Park, S.C.; Moon, Y.S.; Kim, D.S. Low-pathogenic pinewood nematode found in dead trees and resistance of pines induced by its pre-inoculation. Korean J. Appl. Entomol. 2014, 53, 141–147. (In Korean) [Google Scholar] [CrossRef]
  40. Dormann, C.F.; Bobrowski, M.; Dehling, D.M.; Harris, D.J.; Hartig, F.; Lischke, H.; Moretti, M.; Pagel, J.; Pinkert, S.; Schleuning, M.; et al. Biotic interactions in species distribution modelling: Ten questions to guide interpretation and avoid false conclusions. Glob. Ecol. Biogeogr. 2018, 27, 1004–1022. [Google Scholar] [CrossRef]
  41. Gao, R.; Liu, L.; Fan, S.; Zheng, W.; Liu, R.; Zhang, Z.; Huang, R.; Zhao, L.; Shi, J. Occurrence and potential diffusion of pine wilt disease mediated by insect vectors in China under climate change. Pest Manag. Sci. 2024, 80, 6068–6081. [Google Scholar] [CrossRef] [PubMed]
  42. Kim, D.S.; Lee, S.M.; Chung, Y.J.; Choi, K.S.; Moon, Y.S.; Park, C.G. Emergence ecology of Japanese pine sawyer, Monochamus alternatus (Coleoptera: Cerambycidae), a vector of pinewood nematode, Bursaphelenchus xylophilus. Korean J. Appl. Entomol. 2003, 42, 307–313. (In Korean) [Google Scholar]
  43. Lee, S.M.; Jung, Y.H.; Seo, S.T.; Kim, D.S.; Lee, D.W. Comparison of nematicidal effect and residual amount by injection time and number of holes using emamectin benzoate via tree injection against pine wood nematode, B. xylophilus. Korean J. Pestic. Sci. 2021, 25, 371–378. (In Korean) [Google Scholar]
  44. Lee, H.; Kim, J.; Park, S.; Choi, W.; Kang, J. Temperature-dependent oviposition models for Monochamus saltuarius (Coleoptera: Cerambycidae). Insects 2024, 15, 597. [Google Scholar] [CrossRef]
  45. Jung, C.S.; Kwon, H.J.; Kim, H.; Kim, J.H.; Nam, Y.W.; Kim, D.S. A Model for Predicting Spring Emergence of Monochamus saltuarius (Coleoptera: Cerambycidae) from Korean white pine, Pinus koraiensis. J. Econ. Entomol. 2015, 108, 1830–1838. [Google Scholar] [CrossRef]
  46. Pajares, J.A.; Alvarez, G.; Ibeas, F.; Gallego, D.; Hall, D.R.; Farman, D.I. Identification and field activity of a male-produced aggregation pheromone in the pine sawyer beetle, Monochamus galloprovincialis. J. Chem. Ecol. 2010, 36, 570–583. [Google Scholar] [CrossRef]
  47. Kim, J.; Lee, S.M.; Jung, Y.H.; Kwon, Y.D.; Kim, D.S.; Lee, D.W.; Park, C.G. Field evaluation on the synergistic attractiveness of 2-(1-undecyloxy)-1-ethanol and ipsenol to Monochamus saltuarius. Entomol. Res. 2016, 46, 31–35. [Google Scholar] [CrossRef]
  48. Lee, H.R.; Lee, S.C.; Lee, D.H.; Choi, W.S.; Jung, C.S.; Jeon, J.H.; Kim, J.E.; Park, I.K. Identification of the aggregation-sex pheromone produced by male Monochamus saltuarius, a major insect vector of the pine wood nematode. J. Chem. Ecol. 2017, 43, 670–678. [Google Scholar] [CrossRef]
  49. National Institute of Forest Science. A study on the establishment of a comprehensive management system for prevention of the spread of pine nematode damage. Natl. Inst. For. Sci. Res. Rep. 2023, 23, 14–22. (In Korean) [Google Scholar]
  50. Xiao, Y.; Li, S.; Zhang, X.; Chen, F.; Xu, J.; Zhao, L. Predicting the global potential distribution of Bursaphelenchus xylophilus under climate change scenarios using MaxEnt. BMC Ecol. Evol. 2024, 24, 48. [Google Scholar] [CrossRef]
  51. Gao, R.; Liu, L.; Fan, S.; Zhang, Z.; Zhao, L.; Shi, J. Relationship between pine wilt disease outbreaks and climatic factors in China. Forests 2019, 10, 816. [Google Scholar] [CrossRef]
  52. Kim, D.S.; Lee, S.M.; Huh, H.S.; Park, N.C.; Park, C.G. Escape of pine wood nematode, Bursaphelenchus xylophilus, through feeding and oviposition behavior of Monochamus alternatus and M. saltuarius adults. Korean J. Appl. Entomol. 2009, 48, 527–533. (In Korean) [Google Scholar] [CrossRef]
  53. Enda, N. Removing dauer larvae of Bursaphelenchus lignicolus from the body of Monochamus alternatus. Trans. Annu. Meet. Kanto Branch Jpn. For. Soc. 1972, 24, 32. (In Japanese) [Google Scholar]
  54. Hosoda, R.; Kobayashi, K. Drop-off procedures of the pine wood nematode from the pine sawyer (II). Trans. Annu. Meet. Kanto Branch Jpn. For. Soc. 1978, 29, 131–133. (In Japanese) [Google Scholar]
  55. Zou, Y.; Li, X.; Wang, Z.; Chen, J.; Xu, H.; Zhang, Y. Climate change may make pine wilt disease more prevalent by incorporating biotic interactions into risk projections. J. Appl. Ecol. 2024, 61, e14801. [Google Scholar] [CrossRef]
  56. Aierken, N.; Wang, Y.; Zhang, H.; Sun, J. Assessing global pine wilt disease risk based on ensemble modelling of climate and occurrences. Ecol. Indic. 2024, 164, 112089. [Google Scholar] [CrossRef]
  57. Barker, B.; Coop, L. Japanese Pine Sawyer Beetle (Monochamus alternatus) Phenology/Degree-Day and Climate Suitability Model White Paper, Version 1.0; Oregon IPM Center, Oregon State University: Corvallis, OR, USA, 2020.
  58. Gao, R.; Zhang, Z.; Zhao, L.; Shi, J. The Potentially Suitable Geographical Area for Monochamus alternatus under Current and Future Climates. Insects 2023, 14, 182. [Google Scholar] [CrossRef]
  59. Chen, L.; Lu, W.; Lamont, B.B.; Liu, Y.; Wei, P.; Xue, W.; Xiong, Z.; Tang, L.; Wang, Y.; Wang, P.; et al. Modeling the Distribution of Pine Wilt Disease in China under Climate Change. Ecol. Evol. 2024, 14, e70277. [Google Scholar] [CrossRef]
Figure 1. Survey areas. Site 1 (Geoje investigation area)—PWD damage level: “Severe”; Site 2 (Sacheon investigation area)—PWD damage level: “Severe”; Site 3 (Jinju investigation area)—PWD damage level: “Moderate.” Red dots indicate the positions of 20 × 20 m sampling plots established for pine wilt disease surveys. Source: Authors’ own work using base map data from the National Geographic Information Institute (NGII), Korea, and © OpenStreetMap contributors.
Sustainability 17 08796 g001
Figure 2. Pine wilt nematode (PWN) density (individuals·g−1) in felled trees at the three survey sites. The data indicate variations in nematode distribution by tree section and year, suggesting section-specific infection dynamics that may influence early detection and control strategies. Means sharing the same letter within each year and section are not significantly different (Duncan’s multiple range test, DMRT, p < 0.05). Source: Authors’ own work.
Sustainability 17 08796 g002
Figure 3. Bursaphelenchus mucronatus density (individuals·g−1) in felled trees at the three survey sites. The data indicate variations in nematode distribution by tree section and year, suggesting microhabitat-specific dynamics that may influence long-term persistence and secondary colonization patterns in decomposing pine trees. Means sharing the same letter within each year and section are not significantly different (Duncan’s multiple range test, p < 0.05). Source: Authors’ own work.
Sustainability 17 08796 g003
Figure 4. Regression analysis of pine wilt nematode and Bursaphelenchus mucronatus density in felled pine trees (n = 27). Scatter points represent observed data, and the solid line indicates the fitted ordinary least squares (OLS) regression with a 95% confidence interval. A significant negative relationship was detected (r = −0.728, R2 = 0.531, p < 0.001), indicating a negative association between the two species. The association does not establish competition; it motivates analyses that control for environmental covariates (e.g., partial correlations and JSDMs).
Sustainability 17 08796 g004
Figure 5. Emergence dates and densities (individuals trap−1) of male and female M. alternatus at three survey sites. The data highlight variations in emergence timing and sex ratios, which have implications for trap effectiveness and optimal control periods. Means sharing the same letter within each site, year, and sex are not significantly different (Duncan’s multiple range test, p < 0.05). Source: Authors’ own work.
Sustainability 17 08796 g005
Figure 6. Heatmap of the mean number of pine wood nematodes hosted by Monochamus alternatus across sites (Site 1–3) and sex (female and male) from 2021 to 2023. Darker colors indicate higher nematode load. The numerical values, standard deviations, and Duncan’s grouping are provided in Supplementary Tables S1–S3. Source: Authors’ own work.
Sustainability 17 08796 g006
Figure 7. Site-specific regression between daily mean temperature and Monochamus alternatus beetle count. Scatter points represent the observed data (Site 1 = red, Site 2 = blue, Site 3 = green). The regression lines are distinguished by line styles (solid = Site 1, dashed = Site 2, dotted = Site 3). The shaded areas indicate the 95% confidence intervals. Source: Authors’ own work.
Sustainability 17 08796 g007
Figure 8. Year-specific regression between daily mean temperature and Monochamus alternatus beetle count. The scatter points represent the observed data (2021 = red, 2022 = blue, 2023 = green). The regression lines are shown with distinct line styles (solid = 2021, dashed = 2022, dotted = 2023). The shaded areas indicate the 95% confidence intervals. Source: Authors’ own work.
Sustainability 17 08796 g008
Table 1. Geographical coordinates and pine wilt disease (PWD) damage levels at the survey sites.
SiteAreaLocation (GPS)PWD Damage Level
Site 1Geoje-si,
Jangseungpo-dong,
Irun-myeon
35°24′50.00″ N
129°13′02.00″ E
35°22′53.00″ N
129°11′56.00″ E
Severe
Site 2Sacheon-si,
Seopo-myeon
35°39′34.00″ N
128°34′51.00″ E
Severe
Site 3Jinju-si,
Jangjae-dong,
Hachon-dong
35°20′36.00″ N
128°10′00.00″ E
35°22′38.00″ N
128°07′47.00″ E
Moderate
PWD, pine wilt disease.
Table 2. Daily average temperature (°C) recorded at each survey site on collection dates (2021–2023).
AreaYearMonth/Day
5/65/135/195/276/26/106/176/24
Site 1202118.019.720.117.721.323.220.021.1
202219.018.819.622.220.920.322.623.2
202315.617.118.222.022.822.523.422.1
Site 2202117.920.620.019.221.222.521.521.3
202220.019.920.522.021.420.222.524.7
202316.318.220.021.823.322.123.622.4
Site 3202113.821.020.817.520.922.421.521.8
202219.820.719.621.221.320.222.825.2
202316.516.820.321.922.722.823.823.2
Source: Korea Meteorological Administration open database [30].
Table 3. Summary of pine wilt nematode densities (individuals·g−1, mean ± SD) in felled pine trees across canopy sections at three survey sites (2021–2023).
YearSiteSectionMean ± SDF(df)p-Value
2021Site 1Upper canopy585.9 ± 1.0F(2,6) = 8282.0p < 0.001
Middle canopy679.4 ± 0.2
Lower trunk638.7 ± 1.1
2021Site 2Upper canopy567.3 ± 2.9F(2,6) = 325.7p < 0.001
Middle canopy601.3 ± 0.5
Lower trunk593.2 ± 0.0
2021Site 3Upper canopy430.5 ± 2.5F(2,6) = 1807.1p < 0.001
Middle canopy476.1 ± 3.9
Lower trunk564.9 ± 1.3
2022Site 1Upper canopy461.6 ± 1.4F(2,6) = 2204.3p < 0.001
Middle canopy493.0 ± 1.2
Lower trunk521.1 ± 0.5
2022Site 2Upper canopy574.1 ± 0.6F(2,6) = 1589.2p < 0.001
Middle canopy617.1 ± 1.3
Lower trunk596.2 ± 0.7
2022Site 3Upper canopy600.9 ± 0.6F(2,6) = 11,859.2p < 0.001
Middle canopy655.4 ± 0.4
Lower trunk672.2 ± 0.7
2023Site 1Upper canopy624.5 ± 1.7F(2,6) = 771.4p < 0.001
Middle canopy666.3 ± 2.2
Lower trunk672.3 ± 0.5
2023Site 2Upper canopy688.9 ± 0.6F(2,6) = 5050.7p < 0.001
Middle canopy733.7 ± 0.5
Lower trunk700.7 ± 0.6
2023Site 3Upper canopy681.0 ± 0.5F(2,6) = 1531.4p < 0.001
Middle canopy694.2 ± 0.7
Lower trunk713.4 ± 0.9
Section-level comparisons within each site and year were tested using a one-way analysis of variance. Different letters from Duncan’s multiple range test indicate significant differences (p < 0.05), as illustrated in Figure 2. Source: Authors’ own work.
Table 4. Summary of Bursaphelenchus mucronatus densities (individuals·g−1, mean ± SD) in felled pine trees across canopy sections at three survey sites (2021–2023).
YearSiteSectionMean ± SDF(df)p-Value
2021Site 1Upper canopy246.3 ± 4.2F(2,6) = 11.65p = 0.009
Middle canopy261.7 ± 9.5
Lower trunk235.7 ± 5.0
2021Site 2Upper canopy261.3 ± 3.5F(2,6) = 471.9p < 0.001
Middle canopy310.7 ± 4.5
Lower trunk225.3 ± 1.5
2021Site 3Upper canopy384.0 ± 2.7F(2,6) = 27.1p = 0.001
Middle canopy396.0 ± 4.4
Lower trunk413.3 ± 6.8
2022Site 1Upper canopy401.0 ± 5.0F(2,6) = 87.5p < 0.001
Middle canopy414.0 ± 4.6
Lower trunk361.7 ± 5.0
2022Site 2Upper canopy193.0 ± 2.7F(2,6) = 43.9p < 0.001
Middle canopy211.3 ± 4.0
Lower trunk183.0 ± 4.4
2022Site 3Upper canopy287.3 ± 2.5F(2,6) = 2.89p = 0.132
Middle canopy265.3 ± 55.7
Lower trunk225.0 ± 1.7
2023Site 1Upper canopy132.0 ± 4.6F(2,6) = 357.2p < 0.001
Middle canopy209.7 ± 5.0
Lower trunk305.7 ± 12.0
2023Site 2Upper canopy227.0 ± 7.9F(2,6) = 21.4p = 0.002
Middle canopy222.7 ± 7.8
Lower trunk191.3 ± 6.0
2023Site 3Upper canopy267.7 ± 8.5F(2,6) = 51.2p < 0.001
Middle canopy264.0 ± 3.6
Lower trunk225.0 ± 3.6
Section-level comparisons within each site and year were tested using a one-way Analysis of Variance. Different letters indicate significant differences (p < 0.05), based on Duncan’s multiple range test, as shown in Figure 3. Source: Authors’ own work.
Table 5. Mean number of pine wilt nematodes hosted by female (♀) and male (♂) Monochamus alternatus at three study sites from 2021 to 2023. Values represent the site–sex averages.
YearSite 1 ♀Site 1 ♂Site 2 ♀Site 2 ♂Site 3 ♀Site 3 ♂Infection Rate (%)
20212083.63041.92902.92741.65804.44014.457
20223504.42754.34629.73422.83589.74100.055
20232646.12576.62949.42797.61226.34554.354
Detailed statistics (range, SD, Duncan’s grouping, and n) are provided in Supplementary Tables S1–S3.
Disclaimer/Publisher’s Note: The statements, opinions and data contained in all publications are solely those of the individual author(s) and contributor(s) and not of MDPI and/or the editor(s). MDPI and/or the editor(s) disclaim responsibility for any injury to people or property resulting from any ideas, methods, instructions or products referred to in the content.