Abstract
This paper presents a performance evaluation of a 140 kW solar array installed on the rooftop of the Mountain Line Transit Authority (MLTA) building in Morgantown, West Virginia (WV), USA, covering the period from 2013 to 2024. The grid-connected photovoltaic (PV) system consists of 572 polycrystalline PV modules, each rated at 245 watts. The study examines key performance parameters, including annual electricity production, average daily and annual capacity utilization hours (CUH), current array efficiency, and performance degradation. Monthly ambient temperature and global tilted irradiance (GTI) data were obtained from the NASA POWER website. During the assessment, observations were made regarding the tilt angles of the panels and corrosion of metal parts. From 2013 to 2024, the total electricity production was 1588 MWh, with an average annual output of 132 MWh. Over this 12-year period, the CO2 emissions reduction attributed to the solar array is estimated at 1,413,497 kg, or approximately 117,791 kg/year, compared to emissions from coal-fired power plants in WV. The average daily CUH was found to be 2.93 h, while the current PV array efficiency in April 2024 was 10.70%, with a maximum efficiency of 14.30% observed at 2:00 PM. Additionally, an analysis of annual average performance degradation indicated a 2.28% decline from 2013 to 2016, followed by a much lower degradation of 0.17% from 2017 to 2023, as electricity production data were unavailable for most summer months of 2024.
1. Introduction
West Virginia (WV), a mountainous state in the southern United States, was the nation’s fifth-largest energy producer in 2023. It was also a top exporter of electricity, generating 52,286,784 MWh and exporting nearly two-fifths of this to neighboring states [1,2]. In terms of carbon emissions, the WV power generation industry produces 0.873 kg of carbon dioxide (CO2) for every kilowatt hour (kWh) of electricity generated, the highest CO2 emissions rate per kWh in the USA [2,3]. The average CO2 emissions factor for the USA is 0.389 kg/kWh. Table 1 shows the CO2 generation (kg/kWh) for different states.

Table 1.
CO2 generation (kg/kWh) for different states in USA in 2023 [3].
WV’s electrical generation has long been dominated by coal; this share is expected to decline as more coal-fired power plants are being retired. Before 2013, natural gas was rarely used for power generation; however, as local reserves were tapped and distribution infrastructure was brought online across sections of the state, its portion of the state energy portfolio has slowly expanded. The 2023–2027 WV economic outlook forecasts that upward price pressures stemming from the 2022 invasion of Ukraine and incentives from H.R.5376, commonly known as the Inflation Reduction Act, will prompt an expansion of natural gas production in the state by 5% per year, on average [4]. As shown in Figure 1, it is evident that WV remains highly dependent on locally produced coal for power generation (85%) in 2024, with negligible dependency on solar and other renewable energy resources. In contrast, states, such as California and Texas, are transitioning away from traditional sources, with renewable sources, like solar, accounting for 32.21% and 7.82% of their respective power generation capacities.
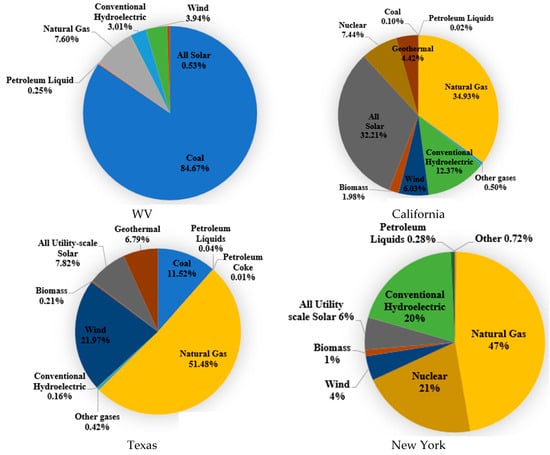
Figure 1.
Annual net generation from all sectors in four states in 2024 [5].
The generation capacity of PV panels installed on rooftops has been extensively studied across many states in the USA. For instance, a national level study by Sigrin and Mooney [6] found that rooftop solar could theoretically meet a significant proportion of demand for the entire USA grid. A study in Georgia found that rooftop solar generation capacity is rapidly expanding; however, despite the pace of installation, there remains a 92% disparity between the achievable and technical potential for rooftop solar [7]. A simulation of rooftop PV systems in both small and medium/large buildings in 128 cities across every state in the USA by Gagnon et al. showed that 23% of small buildings are suitable for PV installation, while 26% of their total rooftop area is viable for development [8]. Regardless of the sheer quantity of viable small buildings that are suitable, these provide a substantial generating potential of 1118 GW of installed capacity. This 1118 GW translates to an estimated 1432 TWh of annual energy generation, 39% of total national electricity sales. A study using the multi-level estimation methodology to model the rooftop PV potential of commercial and residential buildings in California, Arizona, and New Jersey, the three top states for solar PV generation, showed that the states could supply 35%, 43%, and 61% of state electricity demand with solar PV, respectively. It was found that, compared to the current generating capacity, the states could increase their PV capacity by 20 times, 30 times and 40 times, respectively, as reported by Kurdgelashvili et al. [9]. A study of roof-top PV solar systems in Brownsville, Texas by Mangiante et al., using LiDAR and local records, found that while roof-top systems could supply roughly 11% of the local utility’s energy demands, the average internal rate of return (IRR) stood at a mere 2.9%, a payback period of beyond 15 years [10].
A study conducted in Texas [11] evaluated the performance of a rooftop grid-tied 3360 kW PV system. In regions abundant in solar energy, such as Texas, it is economically feasible to utilize solar power to diminish dependence on fossil fuel-based electricity generation. This approach addresses both the energy needs and environmental concerns associated with burgeoning urban development. Emissions from coal-fired power plants specifically—the most carbon-intensive fossil fuel power source—have been studied extensively in the USA [12,13,14]. Studies on these topics have concluded that many of the regions supplied by these coal plants could achieve substantial reductions in greenhouse gas (GHG) emissions through the installation of local PV arrays to generate a portion of their power needs. In the eastern USA, Abel et al. showed that by replacing 17% of current fossil fuel-generating capacity with solar PV systems, emissions of nitrogen oxide (NOx), sulfur oxide (SOx), and fine particulate matter (PM2.5) emissions could be reduced by 20%, 15% and 4.7%, respectively [15].
WV generates a large quantity of electricity from high GHG-emitting sources, making it an excellent candidate for adopting renewable energy to reduce GHG emissions. Unfortunately, the WV geography is generally not well suited for modern renewable technologies [1,8,16]. Rooftop PV systems present a practical solution in the state, as a solar panel system capable of providing 75% or more of a household’s energy needs can be installed on the roof of an average home [17]. It must be noted, however, that the low cost of coal-generated power and low solar irradiance across much of the state makes even these rooftop solar arrays economically unattractive. Solar energy in WV presents a clear and often-seen dichotomy for developers and governments in many northern states—substantial emissions reductions for every kWh generated, but at a distinctly noncompetitive price point that requires subsidies to reasonably challenge the entrenched fossil fuel-generating capacity [2,8,18].
Prior subsidies, and, most recently, the clean energy investment tax credit provisions within the Inflation Reduction Act have facilitated substantial development of clean energy generation capacity in the USA, which otherwise would not have occurred. Recently, the Fort Martin Power Station, in Maidsville, WV, installed roughly 50,000 solar panels spread across an 80-acre site that can produce up to 18.9 megawatts (MW) of solar power, contributing significantly to renewable energy generation in the area. This site is the first solar project out of five planned by Mon Power and its affiliate, Potomac Edison [19]. The Toyota Motors Manufacturing Plant in Buffalo, WV, hosts a 6-acre solar panel installation capable of producing 2.6 megawatts of power. This output is sufficient to supply electricity to over 400 homes. Additionally, the solar panels help to reduce the plant’s CO2 emissions by approximately 4 million pounds annually [20]. Yeager Airport in Charleston, WV, installed over 1800 solar modules on top of one of its parking garages. These panels not only power the parking facility but also reduce the overall electricity costs for the airport [21]. The solar project at Wesleyan College in Buckhannon, WV features about 1328 bi-facial PV panels, covering about 13% of the campus’s annual power needs. This system generates sufficient renewable energy to power over 63 homes and prevents the emission of 727 tons of CO2 annually [22]. Tecnocap, a global metal packaging manufacturer in WV, decided to install solar panels as part of a roof renovation on their 220,000 square foot facility. The 1709 solar panels installed now supply about one-third of the building’s energy needs and are projected to save the company around USD 150,000 annually, with the exact savings to be determined in the coming years [23]. However, there is a lack of research on the performance evaluation of rooftop solar panel systems installed in WV, making this article a valuable resource for exploring the potential of solar energy in the region.
2. 140 kW Solar Panel System Installed in Morgantown, WV
The grid-connected rooftop solar PV system discussed in this paper was installed and became operational on 12 June 2012 at the Mountain Line Transit Authority (MLTA) building in Morgantown, WV. The project was funded by a USD 1.1 million grant from the Federal Transit Administration (FTA) through its Fiscal Year 2010 Discretionary Sustainability Funding Opportunity program [24].
The 140 kW PV solar system is designed to partially supply the energy requirements of the MLTA building. A Satcon PowerGate Plus PVS-135 inverter (NF Solar (Woking, Surrey, UK)) converts the DC energy produced by the solar array into 480 V three-phase AC power. The system comprises 572 solar panels, each with a capacity of 245 W, arranged in 44 series strings, with 13 panels per string. Nine combiner boxes provide overcurrent protection for the modules and strings. A performance monitoring tool, Satcon PV View Plus (SatCon Technology Corporation (Boston, MA, USA)), continuously records the inverter’s performance in real time. This data logger transmits minute-by-minute performance data online to the monitoring software. The daily electricity output can be determined by integrating voltage and current measurements [25].
Table 2, Table 3 and Table 4 present the specifications of the location, PV solar module, and inverter of this 140 kW panel array. Figure 2 shows the rooftop grid-connected PV solar panel system located in MLTA, Morgantown, WV, USA.

Table 2.
Location and installation parameters of the solar array.

Table 3.
Data sheet of solar PV module.

Table 4.
Data sheet of solar inverter.
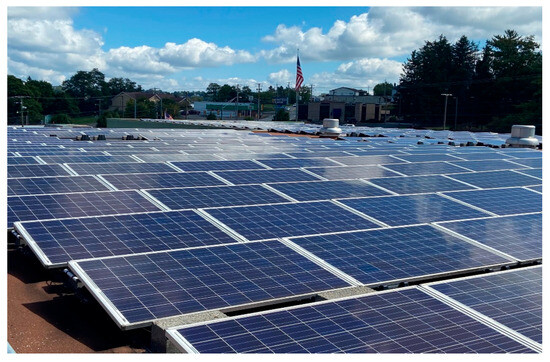
Figure 2.
140 kW rooftop grid-connected solar array in MLTA.
3. Solar Array Performance Assessment for 2013–2024
3.1. Electricity Produced in 2013–2024
Due to the roof reinstallation, solar electricity generation was suspended from early May to mid-September 2024. Consequently, Figure 3 reports monthly electricity production data for the most recent uninterrupted year, 2023. As is typical for solar arrays, electricity generation during the summer months (mid-June to mid-September) in 2023 was significantly higher than in the winter months. In 2023, the highest monthly electricity generation of 19.9 MWh was observed in May while the lowest monthly electricity generation of 3.6 MWh was observed in January.
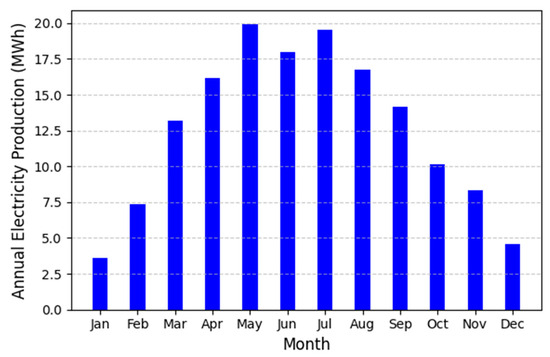
Figure 3.
Monthly electricity produced in 2023.
Figure 4 shows the annual electricity output from 2013 to 2024, assessed from January to December. The solar power plant, installed in June 2012, generated 69.93 MWh in 2012 (not included in the figure). Between 2013 and 2024, the array produced a total of 1587.66 MWh of electricity. The highest annual generation, 154.54 MWh, was recorded in 2013, while the lowest output, 67.83 MWh, occurred in 2024. Figure 4 highlights that power production in 2018 and 2019 was significantly lower compared to other years. This discrepancy is attributed to missing electricity production data during several weeks in these two years. In 2018, data were unavailable for 5 days in January, 12 days in May, and consecutively from 16 July to 9 September, including the entire month of August. Similarly, in 2019, data were missing for 21 days in May and continuously from 1 July to 16 August, including the entire month of July. For 2018 and 2019, most of the missing data were from the summer months, which significantly contributes to the lower power production observed during these years compared to others. The likely causes for this data unavailability include scheduled maintenance, roof reconstruction, and repair to the failed inverter during these periods.
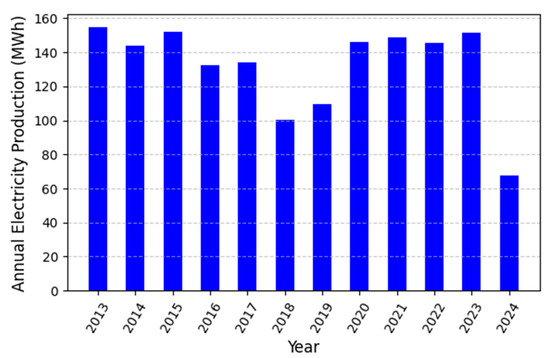
Figure 4.
Annual electricity produced from 2013 to 2024.
3.2. Global Tilted Irradiance and Ambient Temperature
Solar irradiance data at this location for 2013–2024 were not measured. In this research, the global tilted irradiance (GTI) for this solar plant was calculated from the NASA POWER website [26]. The NASA POWER tool uses satellite data to deliver long-term insights into solar irradiance, temperature, wind, and humidity, which can be downloaded for analysis. It supports research, planning, and energy project development, as well as assessing renewable energy potential. These satellite and model-based data provide reliable meteorological resources, particularly in areas lacking real-time ground measurements [27,28]. Due to the extensive dataset representing 12 years (2013–2024) of ambient temperature for the plant location, the statistical interquartile range method was applied to analyze and compare the monthly average ambient temperatures. For a more effective analysis of variations in monthly ambient temperature, the dataset was divided into two periods: Figure 5a represents data from 2013 to 2018, while Figure 5b covers 2019 to 2024. The analysis reveals that the ambient temperature exhibits greater variation during the winter months compared to the summer months. The highest ambient temperatures, ranging from 25 to 30 °C, are observed in the summer months of July and August. Conversely, the lowest temperatures, between −10 and −20 °C, occur during the winter months of December to February.
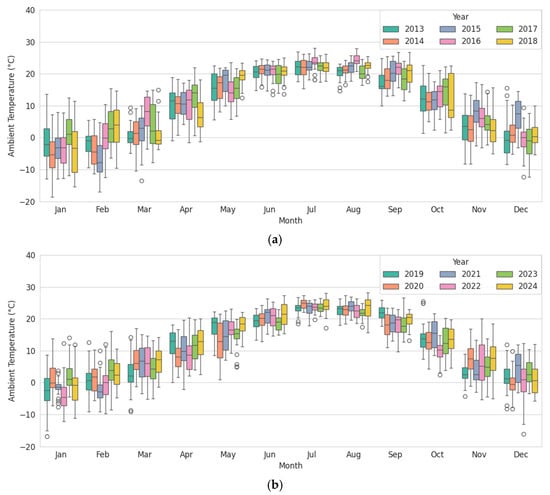
Figure 5.
Variation of monthly ambient temperatures of 140 kW solar PV system: (a) year 2013 to 2018; and (b) year 2019 to 2024 (Source: NASA POWER [27]).
For the solar panel location (39.65° N, −79.98° W), certain parameters (global horizontal irradiance (GHI), direct normal irradiance (DNI), diffuse horizontal irradiance (DHI), and solar zenith angle (SZA) were obtained for calculating the GTI for the 12° tilt angle solar power plant from the NASA POWER website. Figure 6a,b shows the monthly electricity generation for 12 years, i.e., 2013 to 2024, with varying GTI. The split into 2013–2018 and 2019–2024 was made because Figure 6a represents the initial stable operation years, while Figure 6b reflects system aging and increased climatic variability. It demonstrates that solar irradiance is changing throughout the year, which is mainly responsible for fluctuations in power production in a month for different years. Lower solar irradiance results in reduced electricity generation, while higher solar irradiance leads to increased electricity production. However, due to the unavailability of electricity generation data for certain months, some periods with high irradiance show lower recorded electricity generation. The maximum average GTI obtained in June and July was 6.4–5.9 kWh/m2/day and the minimum average GTI, obtained in December and January, was 1.5–2 kWh/m2/day. From Figure 5a,b, it can be seen that the maximum ambient temperature for the plant location is obtained in July, which is 25–30 °C. Solar cell temperature is strongly influenced by solar irradiance and ambient air temperature, which directly impacts cell performance. As ambient temperature increases, solar cell efficiency declines, while a decrease in ambient temperature enhances efficiency [29]. Although solar irradiance is higher in July due to the higher ambient temperature, the efficiency of the solar panel system decreases at higher temperatures. For example, from Figure 6a,b, it can be seen that while the monthly solar irradiance in June and July 2014 was significantly higher than in May 2014, the electricity generated in June 2014 was similar to that of May. This is likely due to the reduced efficiency of solar panels caused by the higher ambient temperatures in June.
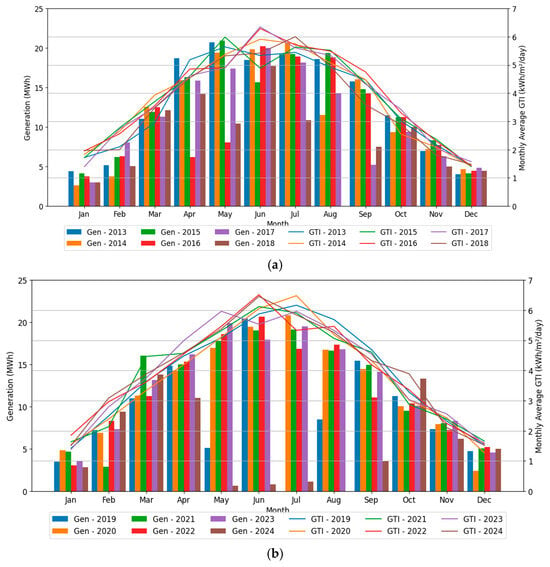
Figure 6.
Variation in monthly electricity generation (MWh) and GTI (kWh/m2 /day) of 140 kW solar PV plant at climatic conditions: (a) year 2013 to 2018; and (b) year 2019 to 2024.
3.3. Average Daily and Yearly Capacity Utilization Hours
CUH represents the effective usage of a solar panel system, often expressed as the number of hours in which the system operates at its maximum (rated) capacity to generate the same amount of energy it produces over a given period. It serves as a key performance indicator for solar panels in a particular location. CUH is influenced by several factors, including solar radiation availability, panel efficiency, shading, and deviations in the panel’s installation tilt angle from the optimal setting. Figure 7 displays the monthly daily CUH for the years 2013–2024, calculated using Equation (1):
where is the total energy production in a month in kilowatt-hours (kWh); is the number of days in a month; and is the rated power of the solar panel system in kilowatts (kW).

Figure 7.
Average daily CUH for each month for 2013–2024.
Some electricity production data from 2018, 2019 and 2024 are missing, meaning that the CUH data for these years do not accurately reflect the potential output. To address this, the data for these three years were revised by estimating the missing production using the average values for the same days from previous years. From Figure 7, it can be seen that the maximum and minimum average daily CUH were observed in June (4.62 h) and January (1.05 h), respectively. The average daily CUH throughout the lifespan of the solar panel system was 2.93 h.
Figure 8 illustrates the average annual CUH from 2013 to 2024. The yearly CUH was determined by summing the monthly CUH values for each year. The gaps in electricity production data for 2018, 2019, and 2024 were addressed by revising the dataset, with the missing values estimated using daily average production figures from earlier years. The maximum annual CUH, 1114 h, was achieved in 2015, while the minimum, 1002 h, was recorded in 2018. Throughout the system operational period, the average yearly CUH amounted to 1077 h.

Figure 8.
Average yearly CUH in 2013–2024.
3.4. Greenhouse Gas Mitigated
The integration of renewable energy sources, such as solar power plants, into energy portfolios helps to reduce GHG emissions. In contrast, coal power plants release significant amounts of GHGs and pollutants, including CO2, NOx, and SOx. On average, in 2023, the WV grid emits 0.873 kg of CO2, 4.99 × 10⁻⁴ kg of NOx, and 6.80 × 10⁻⁴ kg of SOx per kWh generated [2]. As the power production data for the entire year 2024 were unavailable, Table 5 outlines the estimated reduction in CO2, NOx, and SOx emissions in 2023 due to the 140 kW PV system. In total, the array mitigated 132,461 kg of CO2, 76 kg of NOx, and 103 kg of SOx in 2023.

Table 5.
Greenhouse gases reduced in 2023 [2].
Figure 9 illustrates the CO2 emissions mitigated by the PV solar panel system for electricity generation between 2013 and 2024. Different year-specific emission factors were applied to calculate the CO2 mitigation for the period 2013–2024. The highest CO2 reduction occurred in 2013, with 140,009 kg mitigated, while the lowest reduction was recorded in 2024, with 59,216 kg. Over the entire period from 2013 to 2024, the total CO2 emissions reduced amounted to 1,413,497 kg. The unavailability of electricity generation data for certain days in 2018, 2019 and 2024 explains the lower CO2 emissions recorded in these years compared to other years.
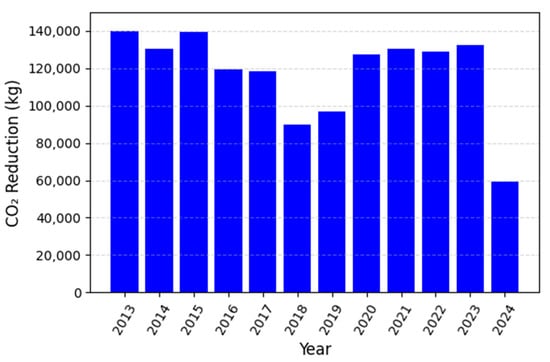
Figure 9.
Annual CO2 reduction from the atmosphere in 2013–2024 [2].
3.5. Tilt Angle
The tilt angle of solar panels is carefully chosen to maximize sunlight exposure and electricity production throughout the year. The system was originally designed with a tilt angle of 12°. However, as shown in Table 6, the average actual tilt angle measured is 9.78°. This deviation has an impact on the total solar power output. During the assessment, the team identified several different tilt angles at which the solar PV panels are currently installed, contributing to the variation in performance. The performance of the panel can be further improved if the tilt angle of the solar panel can be modified toward the optimal one.

Table 6.
Tilt angles at PV arrays that are currently installed.
3.6. Corrosion of Metal Component
After more than 13 years of exposure to the elements, the electrical boxes, bolts, and structure of the solar array experienced considerable corrosion. Such corrosion poses a safety risk, as further deterioration could expose the wiring to ambient air and moisture. The concrete blocks, which were used to provide the required tilt angle for the solar panels, primarily serve as ballast to secure the plastic support frames. However, cracking and breakage of these blocks also present safety concerns for the PV system. To withstand local environmental and air conditioning, rugged components suited to the specific geographic location are essential. The concrete blocks used to secure the panels in place have deteriorated due to prolonged exposure, raising safety concerns. As some of these blocks have failed over the past decade, the solar panels have shifted from their original positions, likely impacting the system’s power output. During the visit, 355 of the 466 concrete blocks anchoring the solar array were found to be in a severely degraded condition. Additionally, the roof’s insulation layer has visibly deteriorated and will soon require replacement. This roof damage has affected the tilt angles of the entire solar array, reducing its generation capacity. Figure 10a–f illustrates the corrosion of the boxes, bolts, concrete blocks, and the current condition of the roof.
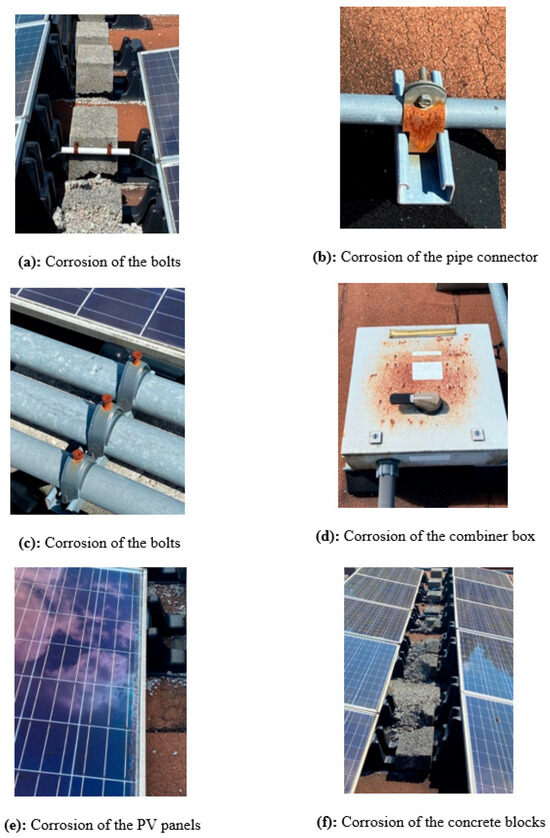
Figure 10.
Corrosion and degradation of bolt, pipe connector, PV panels, combiner box, and concrete blocks.
3.7. Solar Irradiance and Efficiency of the Solar Panel
Solar irradiance measurements were conducted on 20 April 2024, from 8:00 AM to 7:00 PM, with data recorded every 15 min on the MLTA rooftop. The readings were obtained and recorded using a Seaward Solar Survey 200 R irradiance meter, with the solar panel positioned at a 9.8° tilt angle and facing southeast, matching the rooftop PV solar system orientation. Figure 11 presents the variations in solar irradiance (W/m2), temperature (°F), PV system power output (kW), and efficiency (%) throughout the measurement period. Since the day was clear and sunny, irradiance levels remained high, exceeding 800 W/m2 between 10:30 AM and 4:30 PM. The maximum irradiance of 1010 W/m2 was recorded at 1:00 PM, while the lowest reading of 320 W/m2 occurred at 7:00 PM. The irradiance pattern followed a smooth curve without significant fluctuations. The PV system power output mirrored this trend, as increased irradiance resulted in higher power generation. The absence of cloud cover ensured that the solar irradiance remained consistently strong throughout the day.
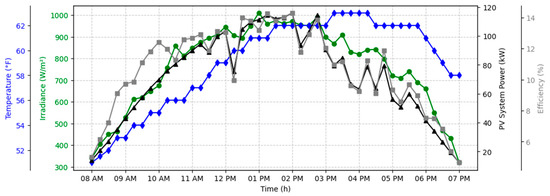
Figure 11.
Hourly variations in PV system efficiency on 20 April 2024.
PV system efficiency is defined as the cumulative efficiency of the entire system, including both the PV array and the inverter. PV system efficiency () is calculated using the following Equation (2):
where Pout is the electrical power output of the solar array, in watts (W); G is the solar irradiance, in watts per square meter (W/m2); and A is the area of the solar array, in square meters (m2), 835 m2 in total.
As illustrated in Figure 11, higher efficiency levels were recorded during the afternoon hours, particularly between 12:30 PM and 2:00 PM. The peak efficiency of 14.30% occurred at 2:00 PM, while the average efficiency for the entire measurement period (8:00 AM to 7:00 PM) was 10.70%. Lower efficiency values were observed in the morning and evening hours, as the solar panels received less irradiance during those times. Temperature readings were recorded using a temperature sensor, and ranged from 51 °F to 63 °F. Additionally, PV system power output (kW) data were collected every 15 min through the data logging system.
Figure 12 indicates the instantaneous power generation data for 15 min intervals obtained from the power monitoring software for 20 April 2024. At 2:00 PM, peak power was obtained at 115.94 kW. A brief drop in power production was observed from noon to 3 PM, which was likely due to clouds and curtailment.

Figure 12.
Instantaneous power generation data on 20 April 2024.
3.8. Solar Panel Performance Degradation
Solar panel performance degradation was analyzed using daily productivity data, considering the efficiency and solar energy received. The study assumes that each month has at least one fully sunny day for maximum electricity generation. Since daily solar energy varies, production differences were corrected using a standard reference such as average extraterrestrial irradiance. To ensure accuracy, daily power output was normalized based on the monthly average extraterrestrial irradiance received [30]. This is defined as correction factor corrected electricity production Ei,corrected, which is calculated using the following equation:
where is the actual electricity produced on ith day of a month, kWh; , is the average daily extraterrestrial irradiance in a month, and ; is the extraterrestrial irradiation on the ith day, .
Equation (3) was used to calculate the maximum corrected daily electricity production for each month; Figure 12 illustrates the monthly values for the year 2023. Solar electricity generation was suspended from early May to mid-September 2024 due to roof reinstallation. Therefore, Figure 13 presents data from 2023, the most recent uninterrupted year.

Figure 13.
The maximum corrected daily production for each month in 2023.
The average of the maximum corrected daily production for each month was 651 kWh in 2023, which was used to represent the performance of the panel in converting solar energy to electricity. Such a parameter largely eliminates the impact of weather on solar panel performance. Figure 14 illustrates the average of the maximum corrected daily production for each month between 2013 and 2023. In cases where data were missing, such as August 2018, the average production from other years was used to estimate the value for that month. The analysis revealed a sharp decline in solar panel performance from 2013 to 2016, as indicated by a drop in the average maximum corrected daily production from 706 kWh in 2013 to 659 kWh in 2016, reflecting an average annual degradation rate of 2.28%. However, from 2016 to 2023, the decline slowed significantly, with an annual degradation rate of just 0.17%. The average maximum corrected daily production between 2017 and 2023 was 658.8 kWh, closely aligning with the 659 kWh recorded in 2016 [30]. Since electricity production data for most days between May and September 2024 are unavailable, the performance degradation for 2024 could not be estimated.
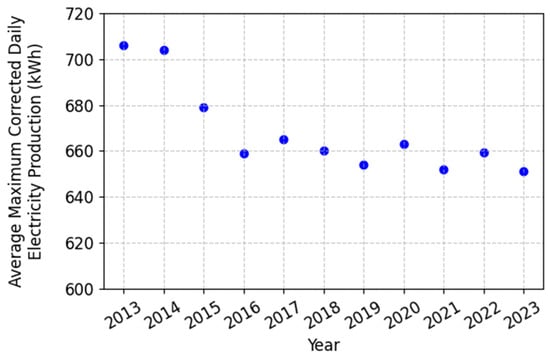
Figure 14.
The yearly solar panel performance degradation in 2013–2023 [30].
4. Economic Analysis: Internal Rate of Return (IRR)
To assess the financial viability of the MLTA rooftop photovoltaic (PV) system, an internal rate of return (IRR) analysis was conducted using a discounted cash flow (DCF) approach over a 25-year horizon. Table 7 indicates the relevant financial and operational parameters of the PV power plant.

Table 7.
Financial and operational parameters for the PV power plant.
Table 8 indicates several assumptions made for calculating the internal rate of return (IRR) for this system.

Table 8.
Assumptions for internal rate of return (IRR) calculation.
The IRR is the discount rate that sets the Net Present Value (NPV) of all cash flows to zero, as defined by the following equation:
where,
- r = internal rate of return (IRR)
- Initial net outflow:
- Annual Cash Flow: For each year t = 1 to 25, CFt = Revenuet − O and Mt
In year 13, an additional deduction for inverter replacement is included:
- Operation and Maintenance (O and M): First-year O and M cost is USD 15/kW-yr (USD 2101.5/yr for 140.1 kW), escalating at 2% per year (go):
- Energy production: First-year production (E1) is 154,540 kWh, with an annual performance degradation (ge) of 0.5%:
- Electricity price: Initial price (p1) is USD 0.077/kWh, escalating at 2% per year (gp):
- Revenue: Annual revenue from electricity savings is calculated as:
- Inverter Replacement: A one-time cost of USD 0.15/WDC (USD 21,015 for 140.1 kW) in year 13.
- Downtime: External (non-system) downtime is zero, thus no adjustments were made for downtime-related losses.
- Analysis Horizon: 25 years
Using a numerical root-finding method to solve NPV(r) = 0, the IRR for the PV system was calculated to be 7.98%, indicating the project’s financial viability.
5. Future Recommendations
The assessment found significant degradation to the insulation layer of the roof, which is causing a leakage problem for the facility. However, it should be noted that the insulation layer degradation was not caused by the solar array, as sections of the roof not covered by solar panels were similarly degraded. The solar array can be temporarily removed for the roof insulation layer to be repaired and re-installed after the completion of the roof repair. This necessary maintenance will be an excellent opportunity to fix some of the issues found in this study.
The tilt angle of the current solar panel array was measured at 8.10–11.40°, as shown in Table 6. Figure 15 shows the impact of the tilt angle on solar energy productivity in kWh in Morgantown, simulated using PVWatts web calculator (Version 8.5.2) [31]. As shown below, the optimal panel tilt angle in Morgantown is approximately 25°.

Figure 15.
Impact of tilt angle on annular electricity productivity in kWh estimated using PVWatts web calculator (Version 8.5.2) [28].
Table 9 compares the simulated solar panel production of this PV solar system using the current 9.78° and optimal tilt angle of 25° (using PVWatts web calculator (Version 8.5.2) [32]). By using the optimal tilt angle of 25°, it would be possible to generate the same amount of electricity with fewer installed solar panels. The modification of the tilt angle from 9.78° to 25° will increase the annual electricity production from 154,747 kWh to 159,645 kWh, an improvement of 3.16%. Increasing the tilt angle from the current 9.78° to the optimal tilt angle can increase the electricity produced by 4898 kWh each year, mitigating 4276 kg of CO2/year. The necessary repair of the roof insulation layer provides an excellent opportunity to modify the array as the panels must be removed and re-installed after the replacement of the roof insulation layer.

Table 9.
Simulated solar panel production using the current 9.78° and optimal tilt angle of 25° [31].
Moreover, optimization of the azimuth angle could lead to improved energy output. The current azimuth angle obtained for the system is 210° (south-west), whereas it should be 180° (true south), based on PVWatts web calculator (Version 8.5.2). Since the building entrance is at 120° (east–southeast), the panels were installed in the 210° direction. The main reasons for this choice are roof orientation, shading, structural, and cost factors, with minimal energy loss compared to due south. Simulations show that at mid-latitudes, azimuth deviations have only a minor impact on annual yield, especially at low tilt; most of the loss results from the tilt being far from optimum rather than from azimuth tweaks [32]. Additionally, studies show that for fixed-tilt PV systems, being 20–30° off from due south often results in ~2–5% lower annual energy yield compared to the optimal (due south) azimuth [33]. Thus, it is highly recommended that the tilt angle should be optimized near 25°, as this significantly increases the power generation, even though the azimuth remains the same, considering the roof orientation and cost factors. Observations for the deviation in the tilt angle and azimuth angle from the optimal value indicate that the tilt and azimuth angles were selected to maximize the number of panels while minimizing shadowing, even if that compromised optimal energy production. Although the current CUH is below the WV average of 4.3 sun-hours/day, the present tilt angle (9.78°) likely contributes significantly to this reduction.
In addition, the lack of scheduled cleaning has been identified as a major factor affecting PV system performance. Even in clean environments, dust gradually accumulates and adheres to the panels, which normal rainfall cannot fully remove. Dust creates a barrier, blocking the sunlight, which can reduce efficiency by 30–40%, which can reduce the power production by up to 86%. To address this, cost-effective cleaning methods, such as manual cleaning, a water-spray nozzle system, truck-mounted cleaning or electrodynamic screens, should be evaluated [34]. Implementing a periodic cleaning routine is strongly recommended to sustain optimal performance.
6. Conclusions
This paper presents a performance evaluation of a 140 kW rooftop solar panel system installed at the MLTA in Morgantown, WV, USA, covering the period from 2013 to 2024. The assessment encompasses electricity generation, solar irradiance, tilt angle, CUH (both daily and annual), PV system efficiency, and the reductions in GHG over the past decade. The key findings of the study are summarized as follows:
- The highest average GTI, ranging from 6.4 to 5.9 kWh/m2/day, was observed in June and July, while the lowest average GTI, between 1.5 and 2 kWh/m2/day, occurred in December and January. The maximum ambient temperature at the plant location was recorded in July, ranging from 25 to 30 °C;
- From 2013 to 2024, the 140 kW PV system in WV generated a total of 1588 MWh of electricity, mitigating 1,413,497 kg of CO2. The highest annual electricity generation was recorded in 2013 at 154.54 MWh, while 2024 had the lowest production, of 67.83 MWh. In 2023, the system offset approximately 132,461 kg of CO2, 76 kg of NOx, and 103 kg of SOx;
- On 20 April 2024, from 8 AM. to 7 PM, the average daily AC power efficiency was found to be 10.70%. The maximum efficiency recorded was 14.30%, observed at the solar irradiance of 967 W/m2 at 2:00 pm, which is comparable to the rated panel efficiency of 14.60%, as stated by the manufacturer;
- The highest average daily CUH was observed in June at 4.62 h, while the lowest was in January at 1.05 h. The average daily and annual CUH of the 140 kW system from 2013 to 2023 were 2.93 h and 1077 h, respectively;
- The use of corrosion-resistant and environmentally durable materials is recommended for solar panel installations, to prevent structural degradation. Concrete blocks are not a viable long-term solution for maintaining the tilt angle and alternative mounting options should be explored;
- From 2013 to 2016, the average yearly degradation of this solar panel system was 2.28%. In comparison, the average yearly degradation of this system from 2017 to 2023 was comparatively mild (0.17%);
- After analyzing electricity generation at different tilt angles, it is recommended to reinstall the solar system at the optimum tilt angle of 25°, as this will improve power production, increase CUH, and enhance efficiency.
However, for future PV installations in Morgantown, WV, and adjacent areas, we strongly recommend an optimal tilt of 25° and a south-facing azimuth of 180°. Our analysis indicates that adhering to these angles will significantly improve electricity production, efficiency, and CUH. The current PV system underperforms in part because its installation angles are not optimal; future projects should explicitly account for this during design. Finally, this manuscript is intended as a baseline, lessons-learned study rather than a blanket statement on statewide rooftop PV potential.
Author Contributions
Conceptualization, R.S. and H.L.; methodology, R.S. and H.L.; software, R.S.; validation, R.S. and J.J.R.; formal analysis, R.S. and S.Q.; investigation, R.S., H.L., B.G. and D.J.; resources, R.S.; data curation, R.S.; writing—original draft preparation, R.S., J.J.R. and H.L.; writing—review and editing, H.L., B.G. and S.Q.; visualization, R.S.; supervision, H.L. and B.G. All authors have read and agreed to the published version of the manuscript.
Funding
This research received no external funding.
Institutional Review Board Statement
Not applicable.
Informed Consent Statement
Not applicable.
Data Availability Statement
The original contributions presented in this study are included in the article. Further inquiries can be directed to the corresponding author.
Acknowledgments
The authors would like to thank the Mountain Line Transit Authority (MLTA) of Morgantown, WV, for permission and cooperation in this study.
Conflicts of Interest
The authors declare no conflicts of interest.
References
- U.S. Energy Information Administration (EIA). Independent Statistics and Analysis. Available online: https://www.eia.gov/state/analysis.php?sid=WV (accessed on 6 July 2025).
- U.S. Energy Information Administration (EIA). West Virginia Electricity Profile 2023. Available online: https://www.eia.gov/electricity/state/westvirginia/ (accessed on 6 July 2025).
- U.S. Energy Information Administration (EIA). United States Electricity Profile 2023. Available online: https://www.eia.gov/electricity/state/unitedstates/ (accessed on 6 July 2025).
- John Chambers College of Business and Economics, West Virginia University. West Virginia Economic Outlook 2023–2027. Available online: https://business.wvu.edu/research-outreach/bureau-of-business-and-economic-research/economic-outlook-conferences-and-reports/economic-outlook-reports/west-virginia-economic-outlook-2023-2027 (accessed on 16 July 2025).
- Electricity Data Browser—Net Generation for All Sectors. Available online: https://www.eia.gov/electricity/data/browser/#/topic/0?agg=2,0,1&fuel=vtvv&geo=g&sec=g&freq=A&start=2001&end=2023&ctype=linechart<ype=pin&rtype=s&pin=&rse=0&maptype=0 (accessed on 21 May 2024).
- Sigrin, B.O.; Mooney, M.E. Rooftop Solar Technical Potential for Low-to-Moderate Income Households in the United States; National Renewable Energy Laboratory: Golden, CO, USA, 2018. [Google Scholar] [CrossRef]
- Brown, M.A.; Hubbs, J.; Gu, V.X.; Cha, M.-K. Rooftop solar for all: Closing the gap between the technically possible and the achievable. Energy Res. Soc. Sci. 2021, 80, 102203. [Google Scholar] [CrossRef]
- Gagnon, P.; Margolis, R.; Melius, J.; Phillips, C.; Elmore, R. Rooftop Solar Photovoltaic Technical Potential in the United States. A Detailed Assessment; National Renewable Energy Laboratory: Golden, CO, USA, 2016. [Google Scholar] [CrossRef]
- Kurdgelashvili, L.; Li, J.; Shih, C.-H.; Attia, B. Estimating technical potential for rooftop photovoltaics in California, Arizona and New Jersey. Renew. Energy 2016, 95, 286–302. [Google Scholar] [CrossRef]
- Mangiante, M.J.; Whung, P.-Y.; Zhou, L.; Porter, R.; Cepada, A.; Campirano, E.; Licon, D.; Lawrence, R.; Torres, M. Economic and technical assessment of rooftop solar photovoltaic potential in Brownsville, Texas, U.S.A. Comput. Environ. Urban Syst. 2020, 80, 101450. [Google Scholar] [CrossRef] [PubMed]
- Al-Aboosi, F.Y.; Al-Aboosi, A.F. Preliminary Evaluation of a Rooftop Grid-Connected Photovoltaic System Installation under the Climatic Conditions of Texas (USA). Energies 2021, 14, 586. [Google Scholar] [CrossRef]
- Akpan, P.; Fuls, W. Cycling of coal fired power plants: A generic CO2 emissions factor model for predicting CO2 emissions. Energy 2021, 214, 119026. [Google Scholar] [CrossRef]
- Steinmann, Z.J.N.; Hauck, M.; Karuppiah, R.; Laurenzi, I.J.; Huijbregts, M.A.J. A methodology for separating uncertainty and variability in the life cycle greenhouse gas emissions of coal-fueled power generation in the USA. Int. J. Life Cycle Assess. 2014, 19, 1146–1155. [Google Scholar] [CrossRef]
- Malla, S. CO2 emissions from electricity generation in seven Asia-Pacific and North American countries: A decomposition analysis. Energy Policy 2009, 37, 1–9. [Google Scholar] [CrossRef]
- Abel, D.; Holloway, T.; Harkey, M.; Rrushaj, A.; Brinkman, G.; Duran, P.; Janssen, M.; Denholm, P. Potential air quality benefits from increased solar photovoltaic electricity generation in the Eastern United States. Atmos. Environ. 2018, 175, 65–74. [Google Scholar] [CrossRef]
- WINDExchange: Wind Energy in West Virginia. Available online: https://windexchange.energy.gov/states/wv#maps (accessed on 13 February 2024).
- Wang, D. Benchmarking the Performance of Solar Installers and Rooftop Photovoltaic Installations in California. Sustainability 2017, 9, 1403. [Google Scholar] [CrossRef]
- Solar Energy Local. Solar Energy & Solar Power in Morgantown, WV. Available online: https://www.solarenergylocal.com/states/west-virginia/morgantown/ (accessed on 13 February 2024).
- West Virginia Enters New Energy Era with Completion of Solar Site. Available online: https://investors.firstenergycorp.com/investor-materials/news-releases/news-details/2024/West-Virginia-Enters-New-Energy-Era-with-Completion-of-Solar-Site/default.aspx (accessed on 6 July 2025).
- Toyota USA Newsroom. Solar Power Continues to Bloom at Toyota West Virginia. Available online: https://pressroom.toyota.com/solar-power-continues-to-bloom-at-toyota-west-virginia/ (accessed on 12 April 2024).
- Yeager Going Solar: Airport Installing Final 1,800 Panels to Generate Power. Available online: https://wchstv.com/news/local/yeager-going-solar-airport-installing-final-1800-panels-to-generate-power (accessed on 12 April 2024).
- West Virginia Wesleyan College. West Virginia Wesleyan College Dedicates New Solar Array. Available online: https://www.wvwc.edu/news/west-virginia-wesleyan-college-dedicates-new-solar-array/ (accessed on 12 April 2024).
- Sustainable Packaging Investing in Solar Energy—Metal Packaging. Available online: https://www.tecnocapclosures.com/corporate-social-responsibility/sustainable-packaging-tecnocap-solar-energy/ (accessed on 12 April 2024).
- Solar Power Plant. Available online: https://www.busride.org/solar-power-plant (accessed on 13 February 2024).
- MTV Solar Team. MCUMTA 140.14 kW Photovoltaic System Manual; Mountainline Transit Authority: Westover, WV, USA, 2012. [Google Scholar]
- NASA Prediction of Worldwide Energy Resources (POWER). Data Access View (DAV). 2019. Available online: https://power.larc.nasa.gov/data-access-viewer/ (accessed on 18 November 2019).
- Sinha, S.; Chandel, S.S. Prospects of solar photovoltaic–micro-wind based hybrid power systems in western Himalayan state of Himachal Pradesh in India. Energy Convers. Manag. 2015, 105, 1340–1351. [Google Scholar] [CrossRef]
- Belsky, A.; Glukhanich, D.; Sutikno, T.; Jopri, M.H. Estimation of hourly solar irradiation on tilted surfaces. Bull. Electr. Eng. Informatics 2023, 12, 3202–3214. [Google Scholar] [CrossRef]
- Singh, P.; Ravindra, N. Temperature dependence of solar cell performance—An analysis. Sol. Energy Mater. Sol. Cells 2012, 101, 36–45. [Google Scholar] [CrossRef]
- Subnom, R. An Approach Characterizing the Performance Degradation of a 140 kW Solar Panel in WV. In Proceedings of the 53rd American Solar Energy Society National Solar Conference 2024 (SOLAR 2024), Washington, DC, USA, 20–23 May 2024; pp. 49–60. [Google Scholar] [CrossRef]
- PVWatts Calculator. Available online: https://pvwatts.nrel.gov/ (accessed on 13 February 2024).
- Barbón, A.; Bayón-Cueli, C.; Bayón, L.; Rodríguez-Suanzes, C. Analysis of the tilt and azimuth angles of photovoltaic systems in non-ideal positions for urban applications. Appl. Energy 2022, 305, 117802. [Google Scholar] [CrossRef]
- Dhimish, M.; Silvestre, S. Estimating the impact of azimuth-angle variations on photovoltaic annual energy production. Clean Energy 2019, 3, 47–58. [Google Scholar] [CrossRef]
- Najmi, N.; Rachid, A. A Review on Solar Panel Cleaning Systems and Techniques. Energies 2023, 16, 7960. [Google Scholar] [CrossRef]
Disclaimer/Publisher’s Note: The statements, opinions and data contained in all publications are solely those of the individual author(s) and contributor(s) and not of MDPI and/or the editor(s). MDPI and/or the editor(s) disclaim responsibility for any injury to people or property resulting from any ideas, methods, instructions or products referred to in the content. |
© 2025 by the authors. Licensee MDPI, Basel, Switzerland. This article is an open access article distributed under the terms and conditions of the Creative Commons Attribution (CC BY) license (https://creativecommons.org/licenses/by/4.0/).