Article

Vertical Vibration Analysis in Metro-Adjacent Buildings: Influence of Structural Height, Span Length, and Plan Position on Maximum Levels

by
Jiashuo Wang
1,
Yi Su
1,* and
Hengyuan Zhang
2
1
School of Civil Engineering, Nanjing Forestry University, Nanjing 210037, China
2
School of Civil Engineering, Southeast University, Nanjing 210096, China
*
Author to whom correspondence should be addressed.
Sustainability 2025, 17(19), 8764; https://doi.org/10.3390/su17198764
Submission received: 27 August 2025 / Revised: 15 September 2025 / Accepted: 22 September 2025 / Published: 30 September 2025

Abstract

Selecting optimal measurement points to capture maximum vertical vibration levels induced by metro systems on adjacent buildings is a crucial yet often overlooked task. In this study, an on-site vibration test and simulation analysis of a building near the Nanjing metro line were conducted. A vibration wave screening method based on machine learning algorithms was introduced, with decision trees used to filter anomalous data and supervised learning models to identify data damaged by environmental vibration and to obtain representative vibration inputs. Subsequently, vertical vibration analysis was used to examine the influence of structural components, span lengths, and vertical height on vibration propagation and to quickly determine peak vibration locations. The results showed a positive correlation between span length and maximum vibration levels. Slabs are more sensitive to vibration than columns, with higher levels at the center of slabs than at the edges. Additionally, the vibration amplitude increases and then decreases as the vertical height increases. These findings were confirmed by on-site vibration tests and offer insights for sustainable vibration management in metro-adjacent buildings, supporting resilient infrastructure development. The study also provides guidance for selecting vibration measurement points, enhancing human discomfort assessments to reduce health risks and promote socially sustainable communities.

1. Introduction

The vibrations induced by the metro are transmitted to the foundations through the ground, resulting in noise pollution that has become a significant social concern [1,2,3]. The criteria for evaluating vibration comfort, especially the selection of measurement points, vary significantly across different countries [4,5]. Nevertheless, the position of measurement points has resulted in social conflict, with complainants frequently asserting that the inaccurate position of measurement points fails to reflect the maximum vertical vibration levels. This issue is closely related to the broader agenda of sustainable urban development. Metro systems represent a cornerstone of low-carbon and energy-efficient urban transportation. However, if vibration-induced discomfort is not properly addressed, it may reduce public acceptance of metro projects, generate social conflicts, and even lead to costly retrofitting of buildings.
International Organisation for Standardisation (ISO) regulations state that vibration levels in residential buildings should be kept at or below the specified limits of 80 dB during the day and 77 dB at night [6]. Japanese regulations require that daytime vibrations must not exceed 65 dB in residential areas and 70 dB in mixed-use zones (combining residential, commercial, and industrial purposes) [7]. The Transport Co-operative Research Programme (TCRP) has established a maximum permissible vibration level of 72 dB for residential areas [8]. Similar regulations setting vibration limits for various types of buildings along metro lines have been implemented in other countries. Unfortunately, stakeholders concerned with vibration comfort often disagree on the selection of measurement points. Zou et al. [9] conducted on-site measurements in a 14-story building located along the Shenzhen metro. Their findings revealed that the vibration level on the fourth floor was the highest, while the level on the tenth floor was the lowest, with a difference of approximately 10 dB between the two. In a study by Liao et al. [8], vertical vibrations in an 11-story over-track building were measured. The results showed that the vibration levels in the living rooms on the 3rd and 7th floors were 73.24 dB and 78.93 dB, respectively, both higher than those in the bedrooms on the same floors, which measured 67.85 dB and 73.99 dB. Zhang [10] conducted measurements in a building along the Beijing metro line and observed that vibration acceleration time-history responses varied across different measurement points at the same height. The maximum frequency-weighted vibration level in the bedroom corner was 69.1 dB, while in the center of the bedroom, it was 72.1 dB, and in the center of the living room, it was 72.7 dB. These findings demonstrate that vertical vibration levels can vary significantly both between different vertical heights and among different locations on the same floor.
Structural components and span lengths can have a significant impact on vertical vibration levels. Xia [11] conducted vibration measurements on a six-story brick-concrete building adjacent to the Beijing–Guangzhou railway. The results revealed that vibration intensity was considerably higher at the center of the slab compared to the corners. Additionally, lateral vibrations were notably stronger in the direction of weaker structural stiffness. Cao [12] carried out a vibration study in a seven-story residential building adjacent to a metro line, finding that infill walls increased the local stiffness of the floor slab, thereby reducing vibrations. In a study by Qian [13], vibrations were measured in two adjacent brick-concrete buildings in Shanghai. The results indicated that several structural factors, such as slab properties, room size, and boundary conditions, significantly influenced vibration intensity. Chen [14] performed vibration tests at a large metro depot in Southwest China, revealing that vibrations were greater at mid-span than at the corners. Therefore, understanding how structural characteristics and span lengths affect vibration response is crucial for developing a unified and scientific method for the selection of the measurement point.
In summary, limited research has been conducted on the patterns of maximum vertical vibration levels in relation to the planar position and vertical height of measurement points. Furthermore, although on-site vibration testing is considered the most reliable method for assessing vibration comfort [15], the accuracy of the vibration data is often affected by complex environmental factors, including external vibrations, structural cracks, and construction defects [4]. With the development of artificial intelligence, machine learning is gradually being applied in a variety of fields. Liu et al. [16] constructed a series of passenger flow prediction models with different input features by using the Random Forest approach with multilevel applications in input feature combinations, and further discussed and implemented typical coding strategies for input features. YAO [17] investigated the feasibility of artificial intelligence algorithms such as support vector machines (SVMs) for predicting the feasibility of vibrations in buildings induced by surface rail traffic and optimized the prediction model. Wang [18] developed the CX-GRU model and proposed a real-time prediction method for the data. Rajalakshmi [19] proposed the ARIMA-MLP model and the ARIMA-RNN model for the prediction of traffic flow. AlKhereibi et al. [20] proposed a machine learning-based prediction method to quantify the impact of the built environment around the station on the prediction of metro traffic flow as features to be input into the prediction model. Based on the above research, this paper proposes a machine learning-based method to estimate the maximum vertical vibration level. A decision tree algorithm was applied to eliminate outlier data. Supervised learning is employed to identify and address distortions in vibration data affected by environmental influences. Furthermore, the post-processed vibration data were utilized to examine the influence of structural spans, vertical heights, and structural components on the maximum vertical vibration levels caused by the metro.

2. Methodology

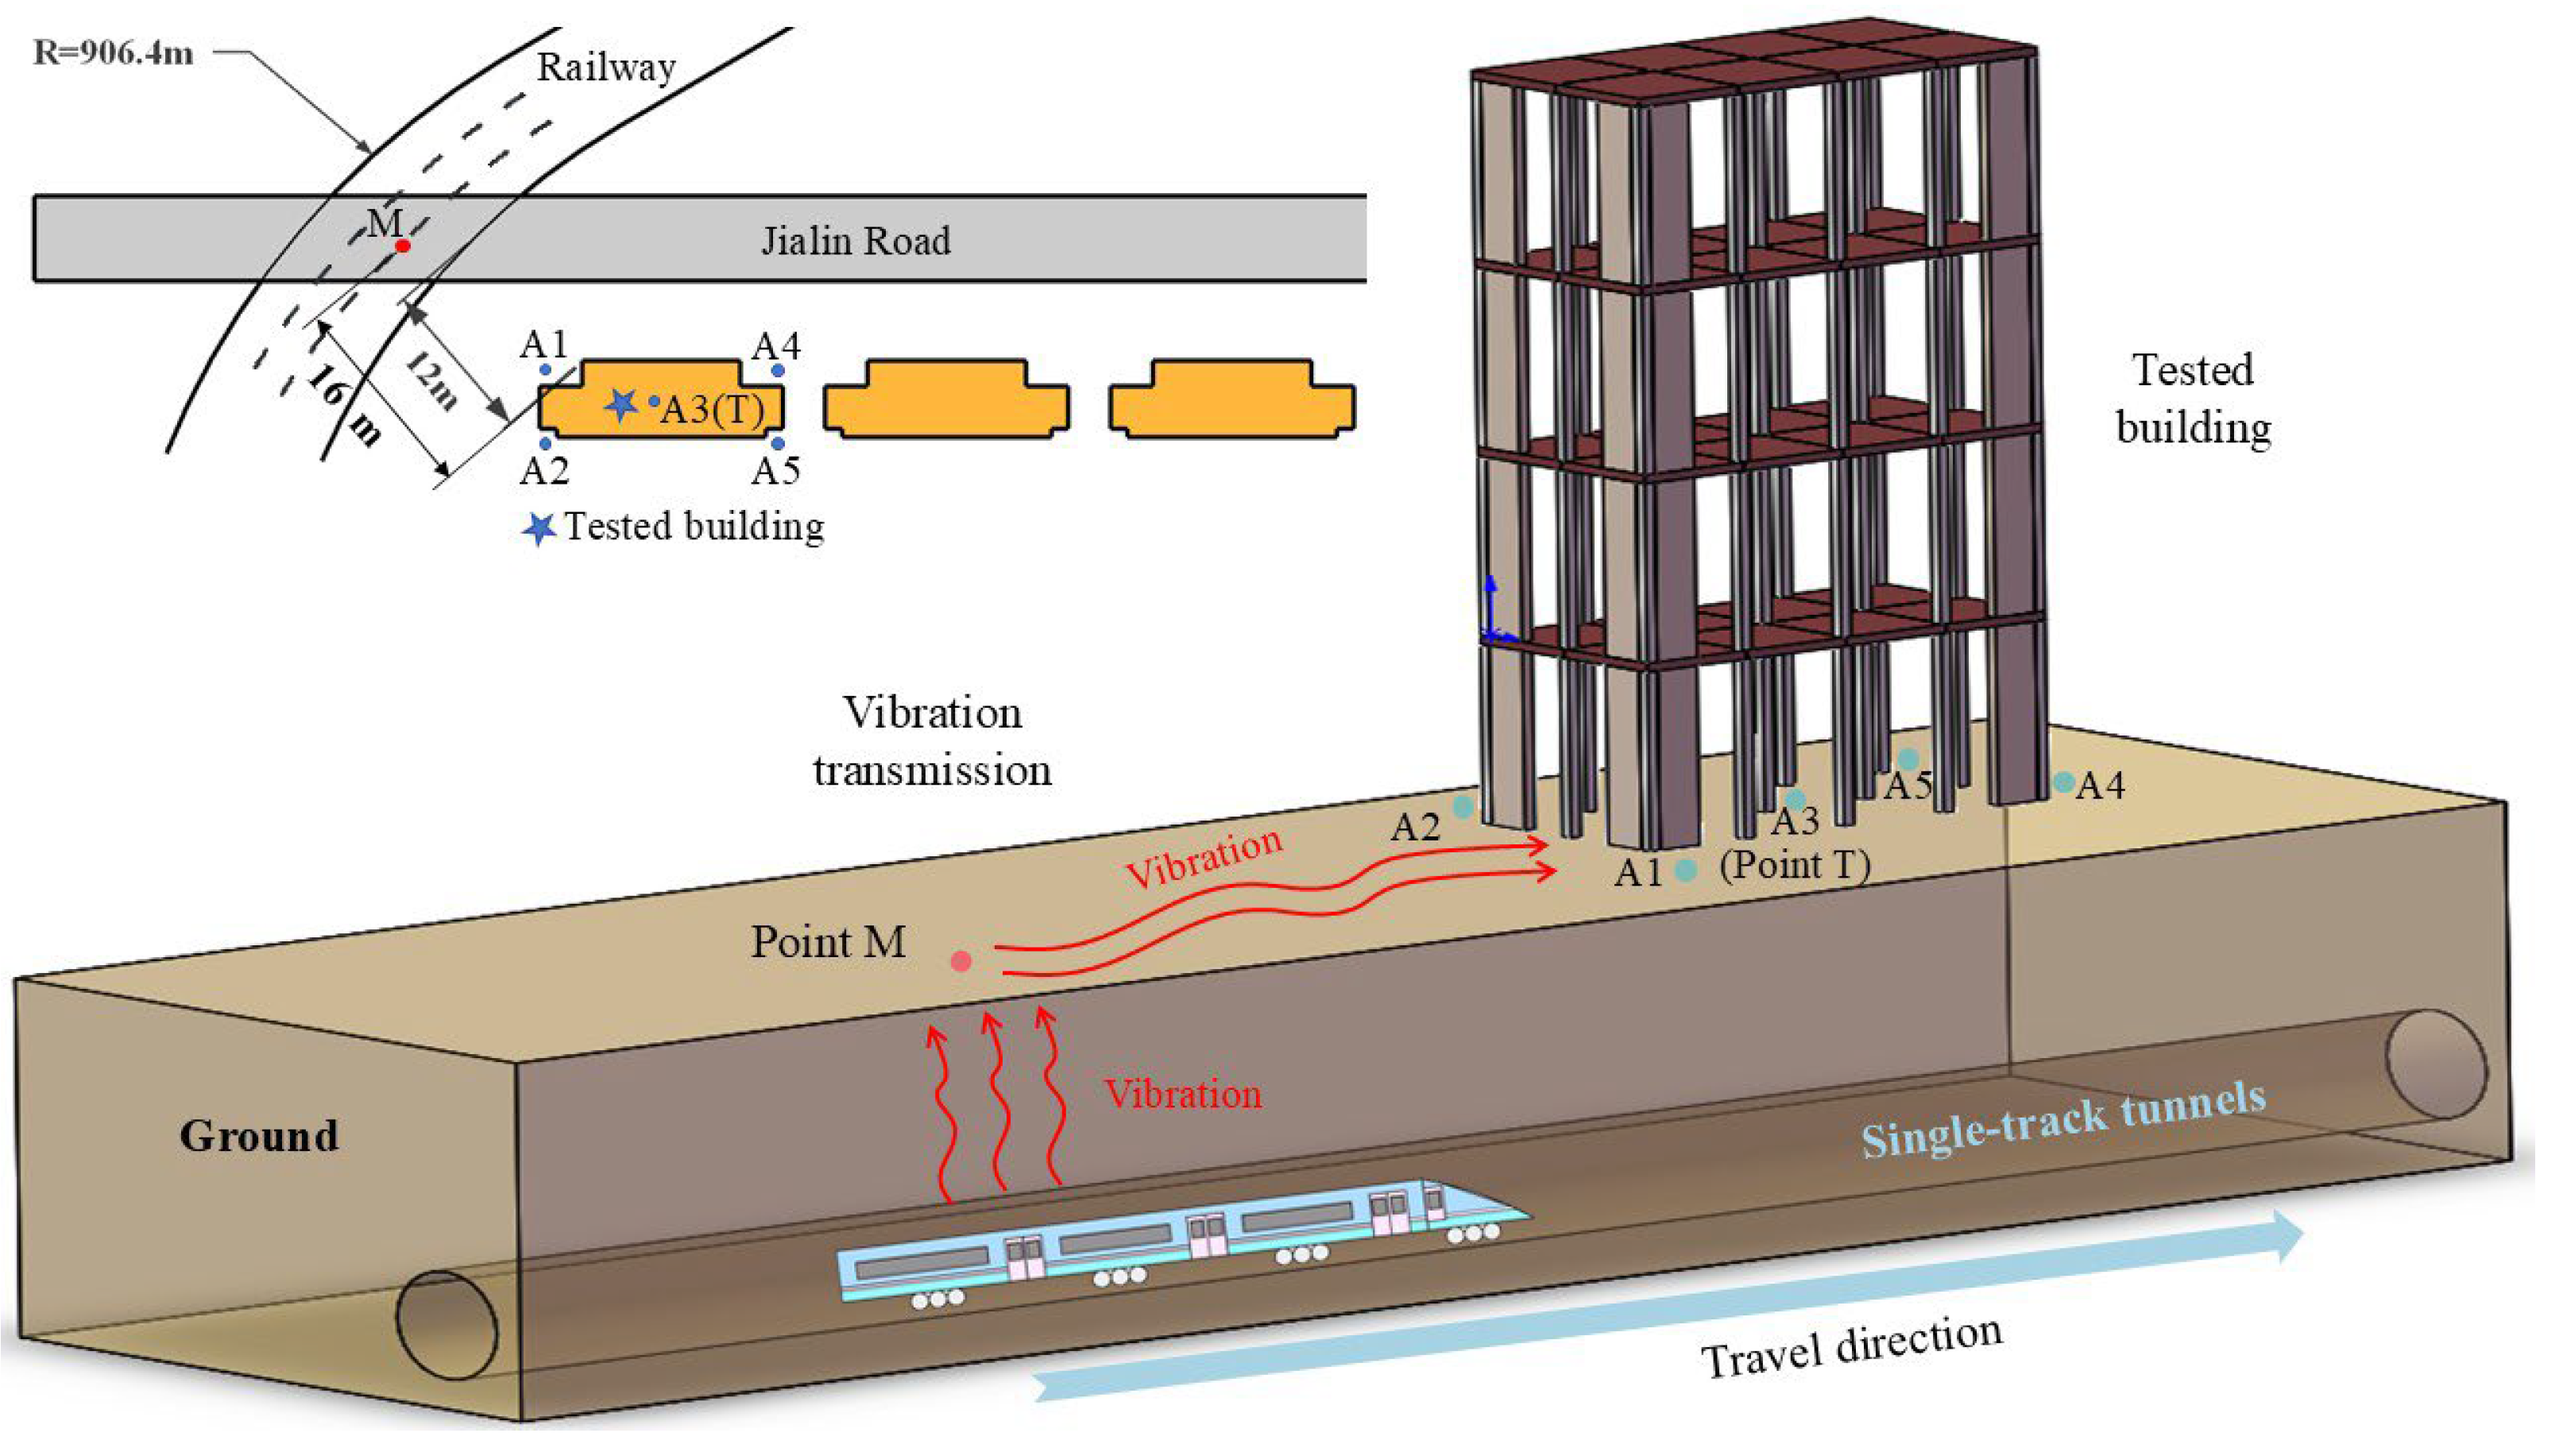
On-site vibration data are influenced by various environmental factors, such as vibrations induced by nearby traffic, which may compromise the accuracy and reliability of the measurements. The testing site is located in a newly developed urban area with low vehicle and pedestrian traffic. To further reduce the impact of surrounding traffic, vehicle access to the area is restricted. The collected vibration data are shown in Figure 1a. Measurement Point M was positioned above the underground tracks, while Measurement Point T was located at the geometric center of the building’s ground floor. Given the large size of the building, vibrations on the ground floor exhibit spatial variability, rendering data from a single measurement point insufficient to represent the overall vibration input. To address this issue, five measurement points (A1 to A5) were positioned on the ground floor. The centroid of Points A1 to A5 is Measurement Point T, as shown in Figure 2. The vibration data at Measurement Point T is determined as the arithmetic average of the vibration data collected from Points A1 to A5. The vibration wave screening method, which is based on a machine learning algorithm, comprises two primary steps. The first step involves filtering out data with significant anomalies by analyzing the characteristic features of the vibration data. The second step eliminates abnormal vibration data resulting from anomalies in the propagation path between Measurement Point M and Measurement Point T.
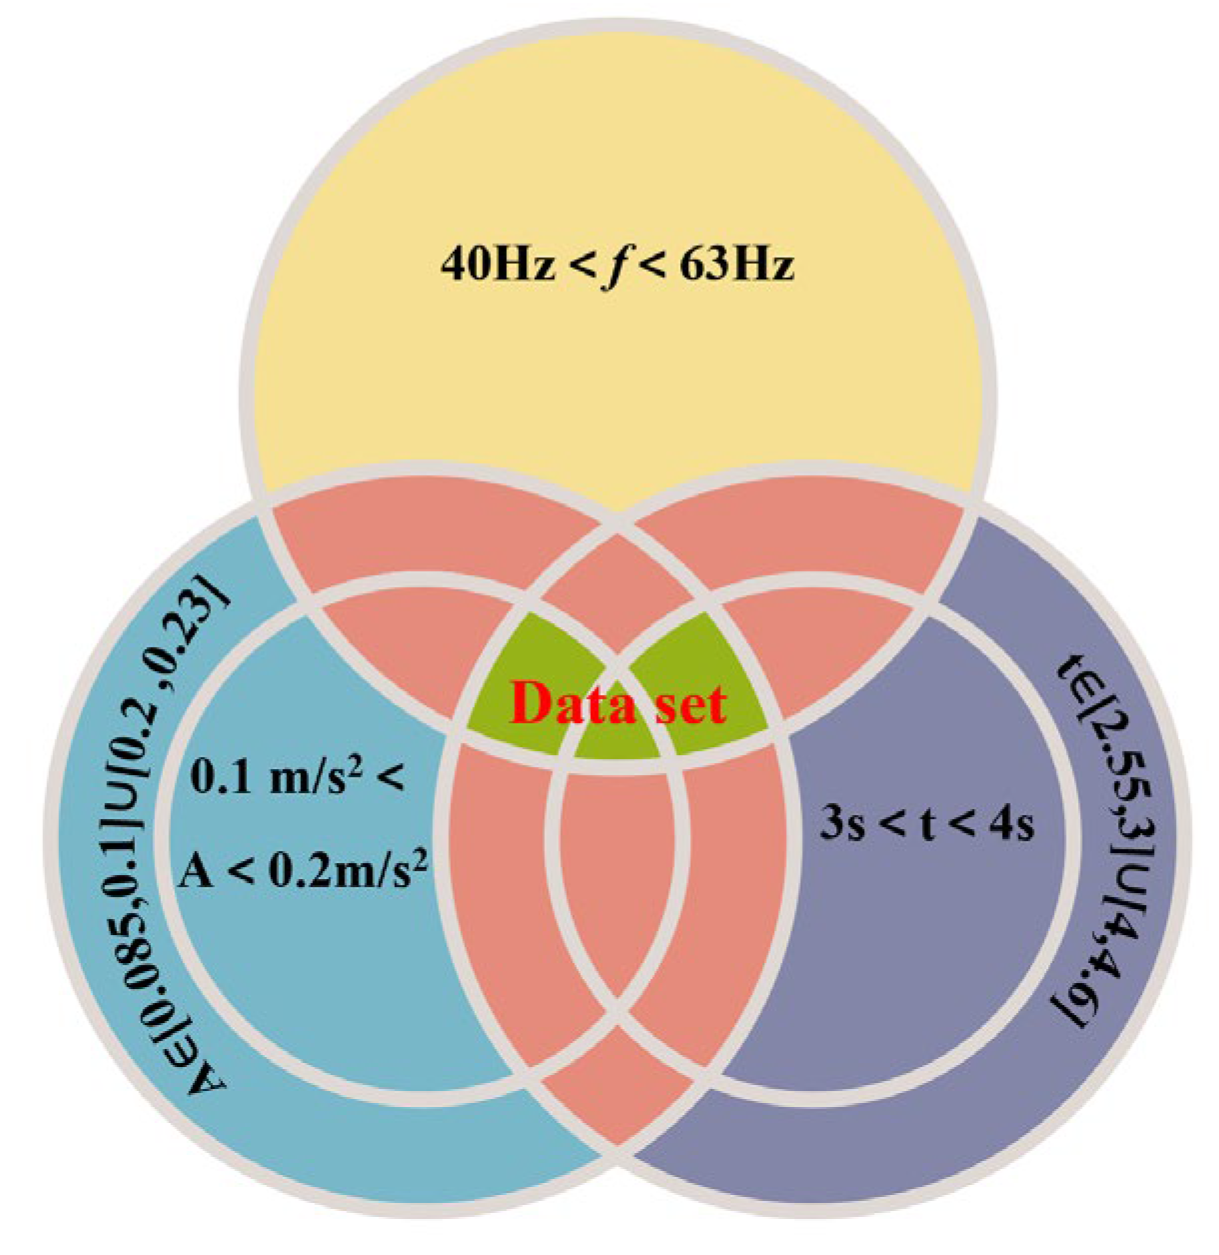
A machine learning-based decision tree model was employed to directly filter the vibration data. A decision tree model was adopted for anomaly detection due to its simplicity, interpretability, and low computational cost, which are advantageous given the relatively limited dataset size in this study. While more sophisticated algorithms such as support vector machines (SVMs), random forests, or neural networks may offer improved classification performance, the decision tree approach ensures transparent decision boundaries and facilitates integration with the subsequent vibration analysis. Firstly, key characteristics were extracted from field-measured vibration data, including frequency (f), amplitude (A), and effective vibration duration (t) (Figure 1b). Secondly, anomalous data were identified and excluded based on these key characteristics through a decision tree-based filtering process. The extracted key characteristics include the average values of frequency (f) corresponding to the maximum acceleration vibration levels, average amplitude ( A ¯ ), and average duration ( t ¯ ). The effective frequency range is 40–63 Hz, with any data outside this range classified as “Out”. The effective amplitude and duration ranges are 0.1–0.2 m/s2 and 3–4 s, respectively. Threshold selection was grounded in three evidence sources: 1. Statistical analysis: 89% of valid metro-induced vibrations in 560 field records (Section 2) fell within 40–63 Hz, while 92% of environmental noise (e.g., road traffic) occurred at <35 Hz. 2. Physical basis: Metro wheel–rail interactions dominantly excite 50–80 Hz modes, but soil attenuation shifts building input to 40–63 Hz. 3. Amplitude/duration: 0.1 m/s2 aligns with [21] perceptual threshold, while 3–4 s matches 95% of train pass durations in Nanjing Line 4 (avg. car length 22 m @ 60 km/h). Data falling outside these ranges are classified as “Approach” if the absolute difference between the data value and the boundary value, divided by the boundary value, is less than 15%. Otherwise, the data is classified as “Out”. During the filtering process, data are marked as “Bad” and excluded if any single criterion is classified as “Out” or if two or more criteria are classified as “Approach”. The remaining data are marked as “Good” and retained to form the final dataset (Figure 1c). The method effectively removes data with evident anomalies caused by external disturbances, ensuring the provision of representative subsurface vibration data.
The propagation path between Measurement Point M and Measurement Point T is influenced by various time-varying parameters, leading to the occurrence of anomalies. To identify the data affected by environmental factors, a supervised learning model is employed in this study. A total of 560 sets of vibration data from measurement points A1 to A5 and measurement point M were collected. 60 sets of data among these were selected to construct a dataset for the determination of vibration parameters in the propagation path by inversion, while the remaining 500 datasets were used as a training set to identify and remove anomalous data. As depicted in Figure 2, the vibration propagation process from measurement point M to measurement point T is simplified using a single-degree-of-freedom system model (Figure 1d). It should be noted that the propagation path from measurement point M to T was simplified into a single-degree-of-freedom (SDOF) system for parameter inversion. This simplification was adopted to enable efficient identification of equivalent stiffness and damping values and to facilitate the integration of machine learning for anomaly detection. However, the actual foundation-structure system exhibits multi-degree-of-freedom (MDOF) behavior with complex modal interactions. Consequently, the SDOF assumption may neglect higher-order vibration modes and localized responses, introducing potential discrepancies between the simplified model and the real structural behavior. Therefore, the SDOF-based results should be regarded as approximate representations rather than exact characterizations of the system. From the 60 selected vibration datasets, the data from measurement point M served as input, while the data from measurement point T served as output. Structural parameter identification and inversion are then employed to derive the stiffness (k) and damping (c) corresponding to each dataset. Subsequently, the arithmetic average of all stiffness and damping values is calculated to determine the average stiffness ( k ¯ ) and average damping ( c ¯ ) for the hypothetical single-degree-of-freedom system (Figure 1e).
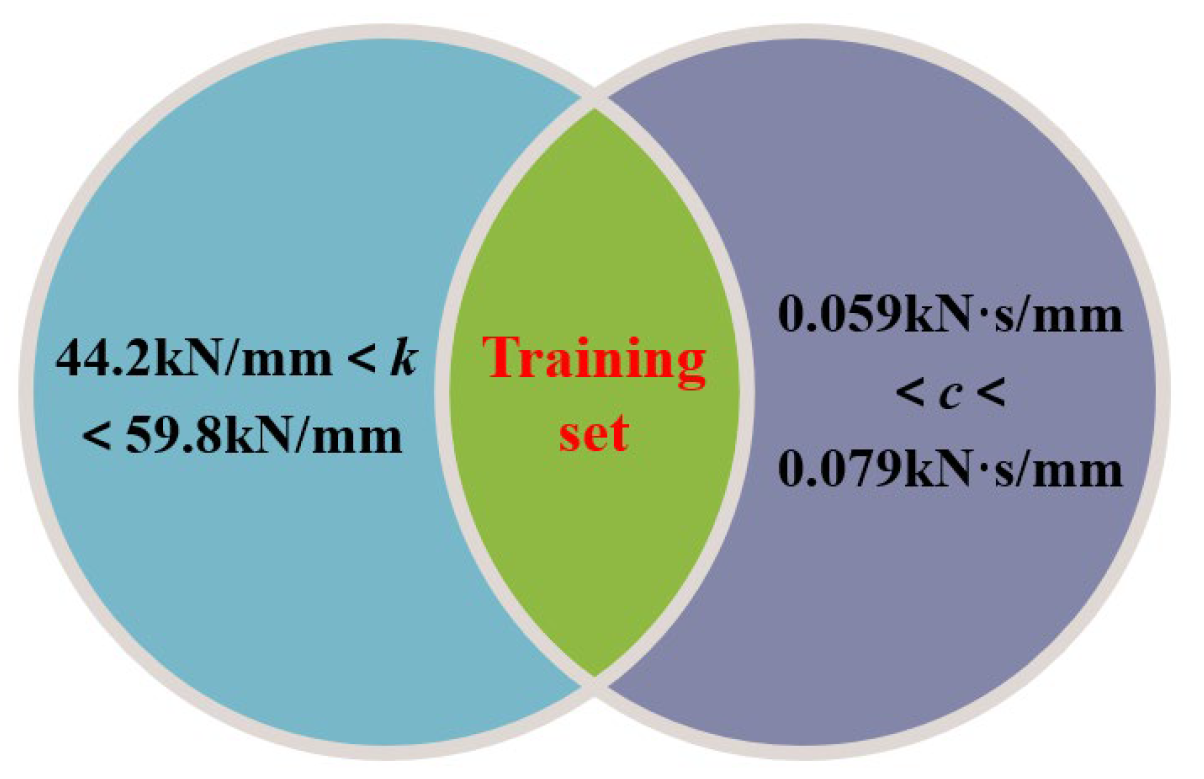
The remaining 500 vibration records were analyzed to identify and filter out data associated with abnormal vibration transmission. Structural parameter inversion was then applied to determine the kj and cj values for each data pair. Data were retained if the stiffness kj fell within the range of [44.2, 59.8], and the damping cj fell within the range of [0.059, 0.079]. Data falling outside these ranges were eliminated (Figure 1f). The filtered vibration data were then averaged using a weighted approach to obtain the input data required for the finite element model (Figure 1g). A finite element simulation was subsequently conducted to investigate the effects of factors such as span, vertical height, and structural components on the maximum vertical vibration levels (Figure 1h). Finally, validation was conducted through on-site vibration tests (Figure 1i).
On-site vibration testing is inevitably influenced by external environmental vibrations, which can compromise the accuracy of the data. In contrast, numerical analysis is not subject to such disturbances. It can offer more accurate results and provide valuable insights. Moreover, whereas on-site vibration tests typically require extensive measurements on each floor, finite element simulations provide a more efficient alternative, allowing for the easy acquisition of vibration data from any floor or location within the building. To quickly identify the regions of highest vibration acceleration, the vibration propagation along the building’s height was investigated, with a particular focus on the floors where vibration amplification is most pronounced. Special attention is given to the differences between regions adjacent to structural elements, such as shear walls and columns, and those further away. Additionally, a detailed analysis is performed to examine the variations in vibration levels between the centers of long-span and short-span members, including beams and slabs.

3. Field Measurement of Metro-Induced Vibration

3.1. Geological Conditions

The on-site measurements were conducted in Nanjing, China, a city covering an area of 6587.02 square kilometers and with a population of approximately 9.49 million. The metro system serves as a vital mode of public transportation within the city. The test site was situated on the southern side of Jialing Road, between Jinma Road Station and Huitong Road Station on Metro Line 4.
An 18-story residential building located near Metro Line 4 was tested, with the shortest distance from the building to the track being 12 m. The tunnels of Metro Line 4 feature a circular cross-sectional shape (C-shape) and are constructed with a single-layer lining structure using the continuous seam method. It consists of two parallel single-track tunnels, with depths ranging from 6.8 to 22.8 m. The building to be tested is a shear wall-frame structural system, consisting of 18 above-ground floors and 2 underground floors. The total height of the building is 60.1 m, of which the first floor has a height of 4 m and the other floors have a height of 3.3 m. The soil layers in the study region exhibit a uniform distribution and the depth of tunnel is only 17.9 m. Geological soil layer parameters are shown in Table 1. The soil layers of the foundation under the tunnel are highly and moderately weathered quartz diorite porphyry, which is characterized by high shear wave velocities and vibration sensitivity. The distribution and engineering properties of the geotechnical layers are presented in Table 2.

3.2. Instrumentations and Signal Processing

The instrumentation used included acceleration sensors and signal acquisition device. The signal acquisition device utilized was the AZ308 Signal Acquisition Device (Nanjing, China, An Zheng Software Engineering Co., Ltd.), as shown in Figure 3a, which has a sampling frequency of 512 Hz and an analysis frequency of 200 Hz. The acceleration sensor used was a 941B electromagnetic low-frequency vibration sensor (Beijing, China, Tengsheng Qiaokang Technology Co., Ltd.), shown in Figure 3b, which was affixed to the measurement point with adhesive. The sensor has a resolution of 5 × 10⁻⁶ m/s2, a sensitivity of 0.3 V/m/s2, and a maximum acceleration range of 20 m/s2. The performance of the instruments meets the requirement of [22]. All instruments are certified prior to their use.
Metro-induced vibrations are time-varying in nature. Therefore, the vibration signals were processed in accordance with the guidelines established by the U.S. Federal Transit Administration (FTA). The Fast Fourier Transform (FFT) was subsequently applied to analyze the frequency domain of the metro vibration signals. The time-domain vibration acceleration data were processed using one-third octave band analysis in Matlab 2020b to obtain the effective vibration acceleration. Subsequently, the vibration acceleration level was calculated according to Equation (1) [23].
L a = 20 lg ( a r m s a )

3.3. Measuring Points

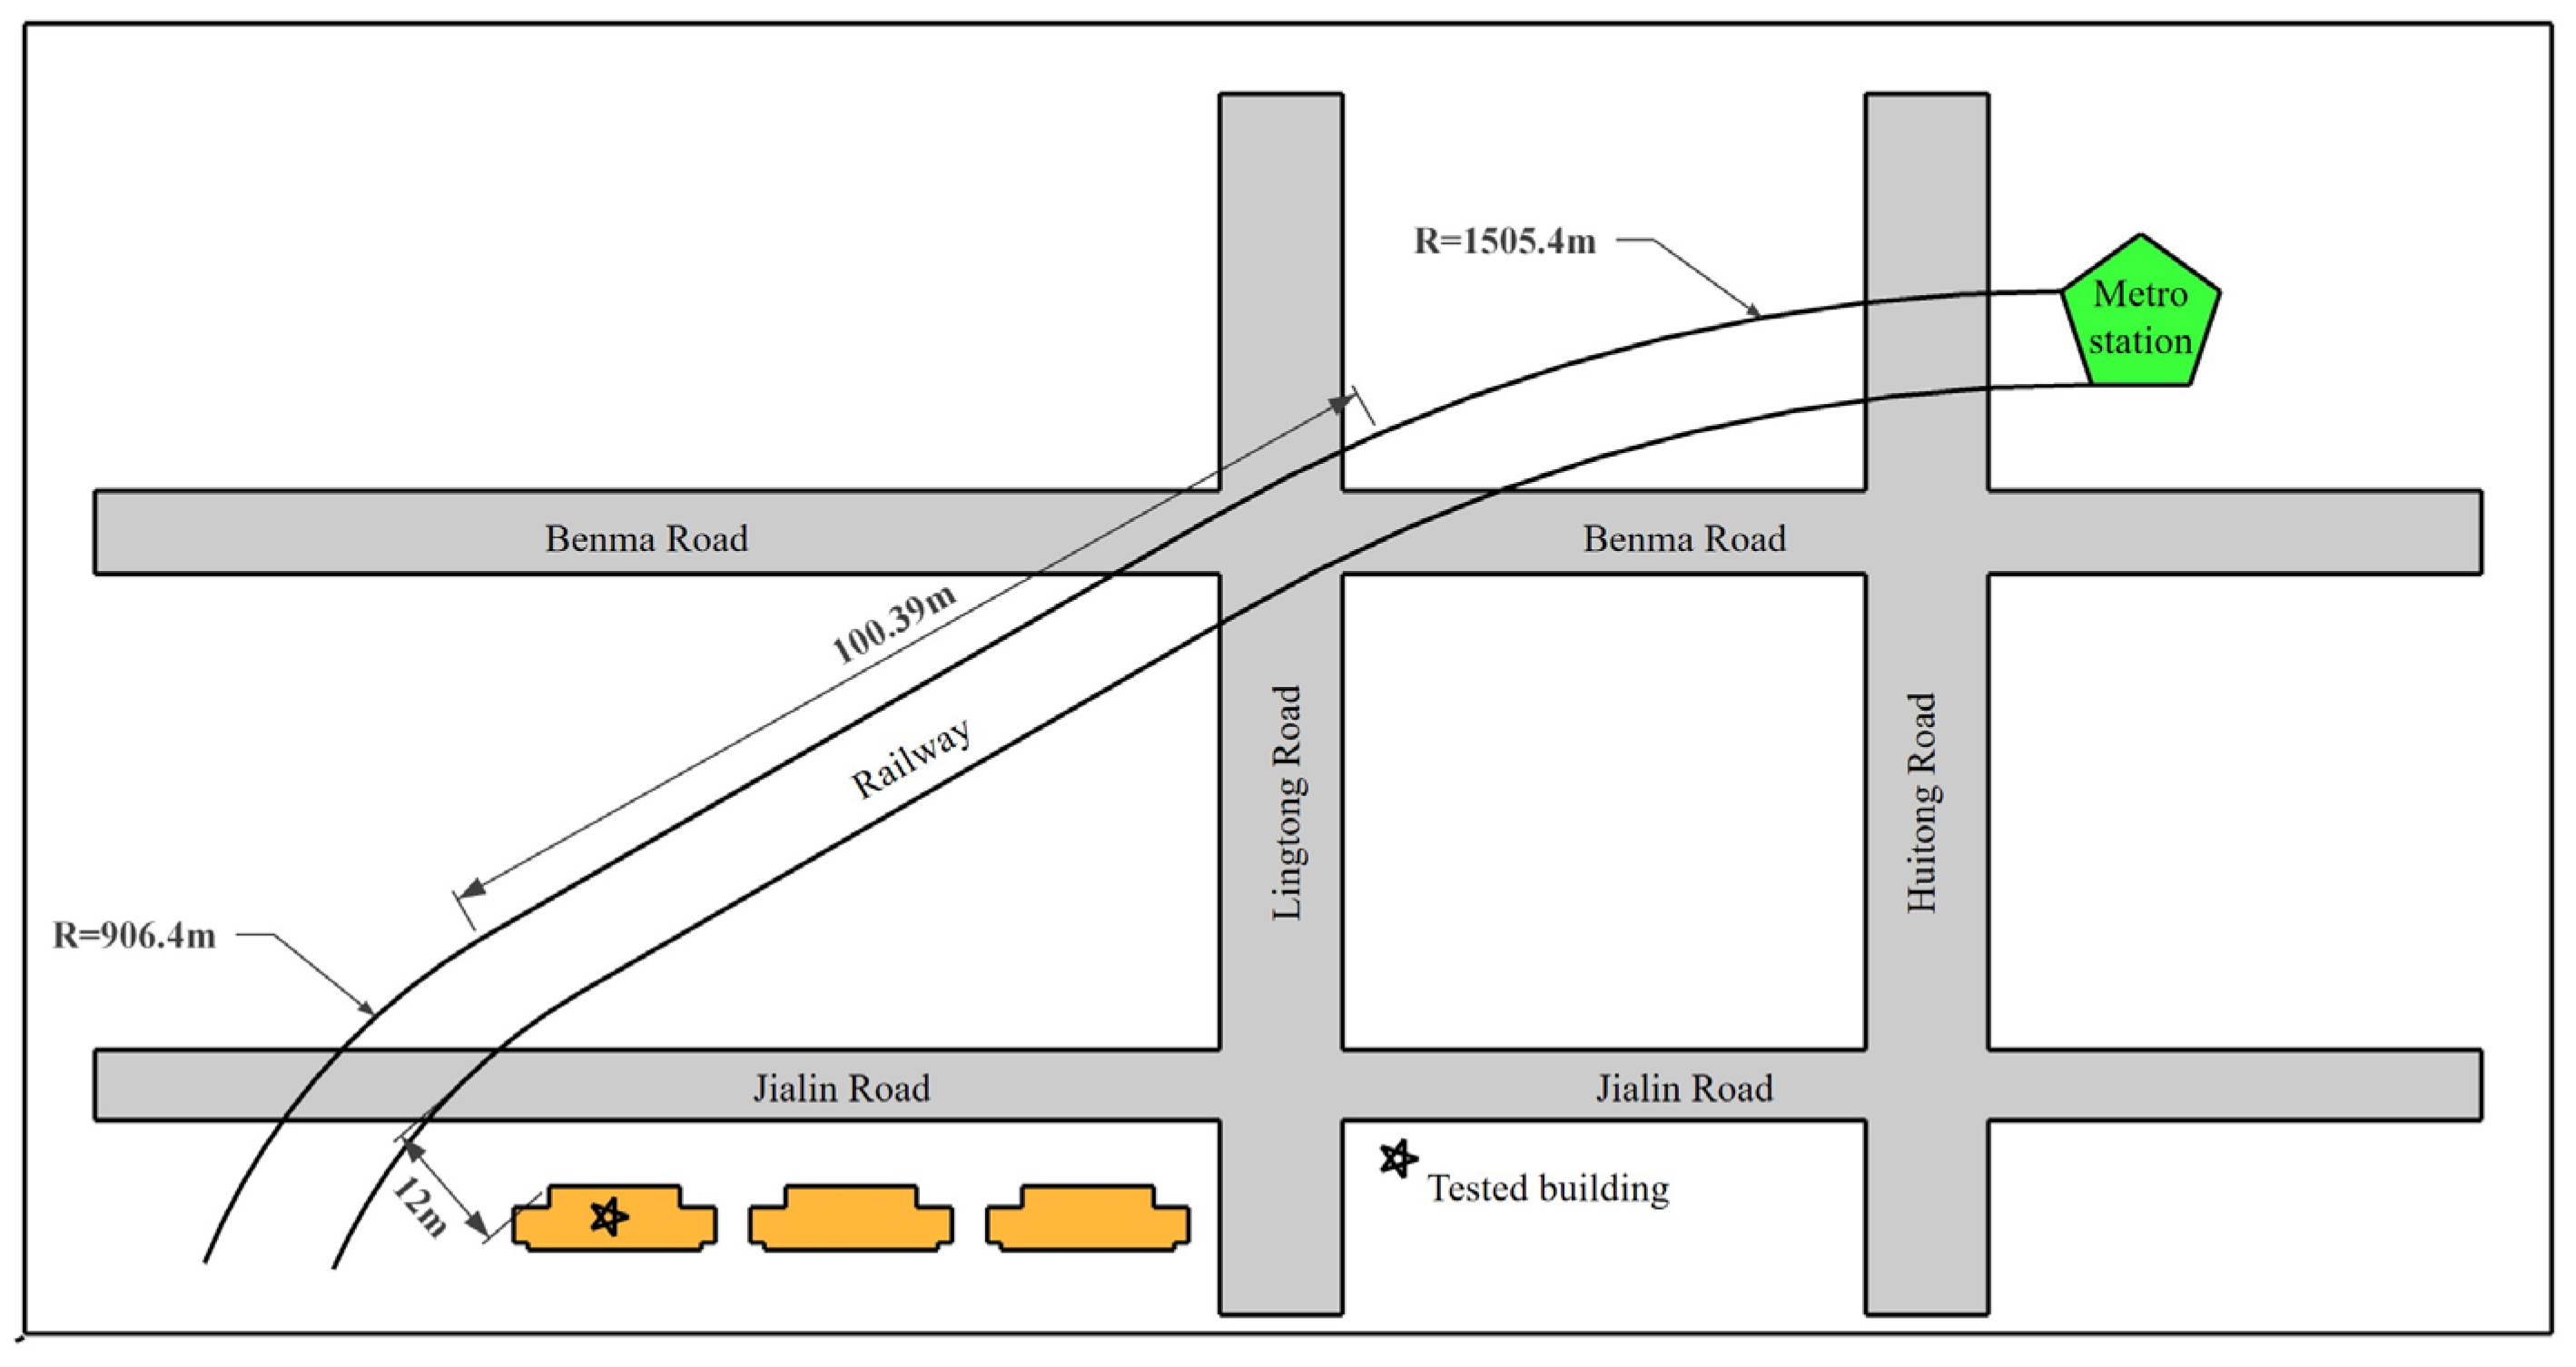
The ground plan near the metro line is depicted in Figure 4, while the layout of the measurement points is shown in Figure 2. To ensure that the data accurately captures the primary characteristics of metro-induced vibrations, the data collection duration at each measurement point was set to 5 min. From this 5 min record, a 15 s segment corresponding to the most intense vibrations was extracted. A minimum of 20 consecutive sets of vibration data were collected during the testing period. To account for variations in passenger flow, measurements were conducted during three distinct time periods: the morning peak (7:00 a.m. to 9:00 a.m.), the midday peak (11:00 a.m. to 1:00 p.m.), and the evening peak (5:00 p.m. to 7:00 p.m.).
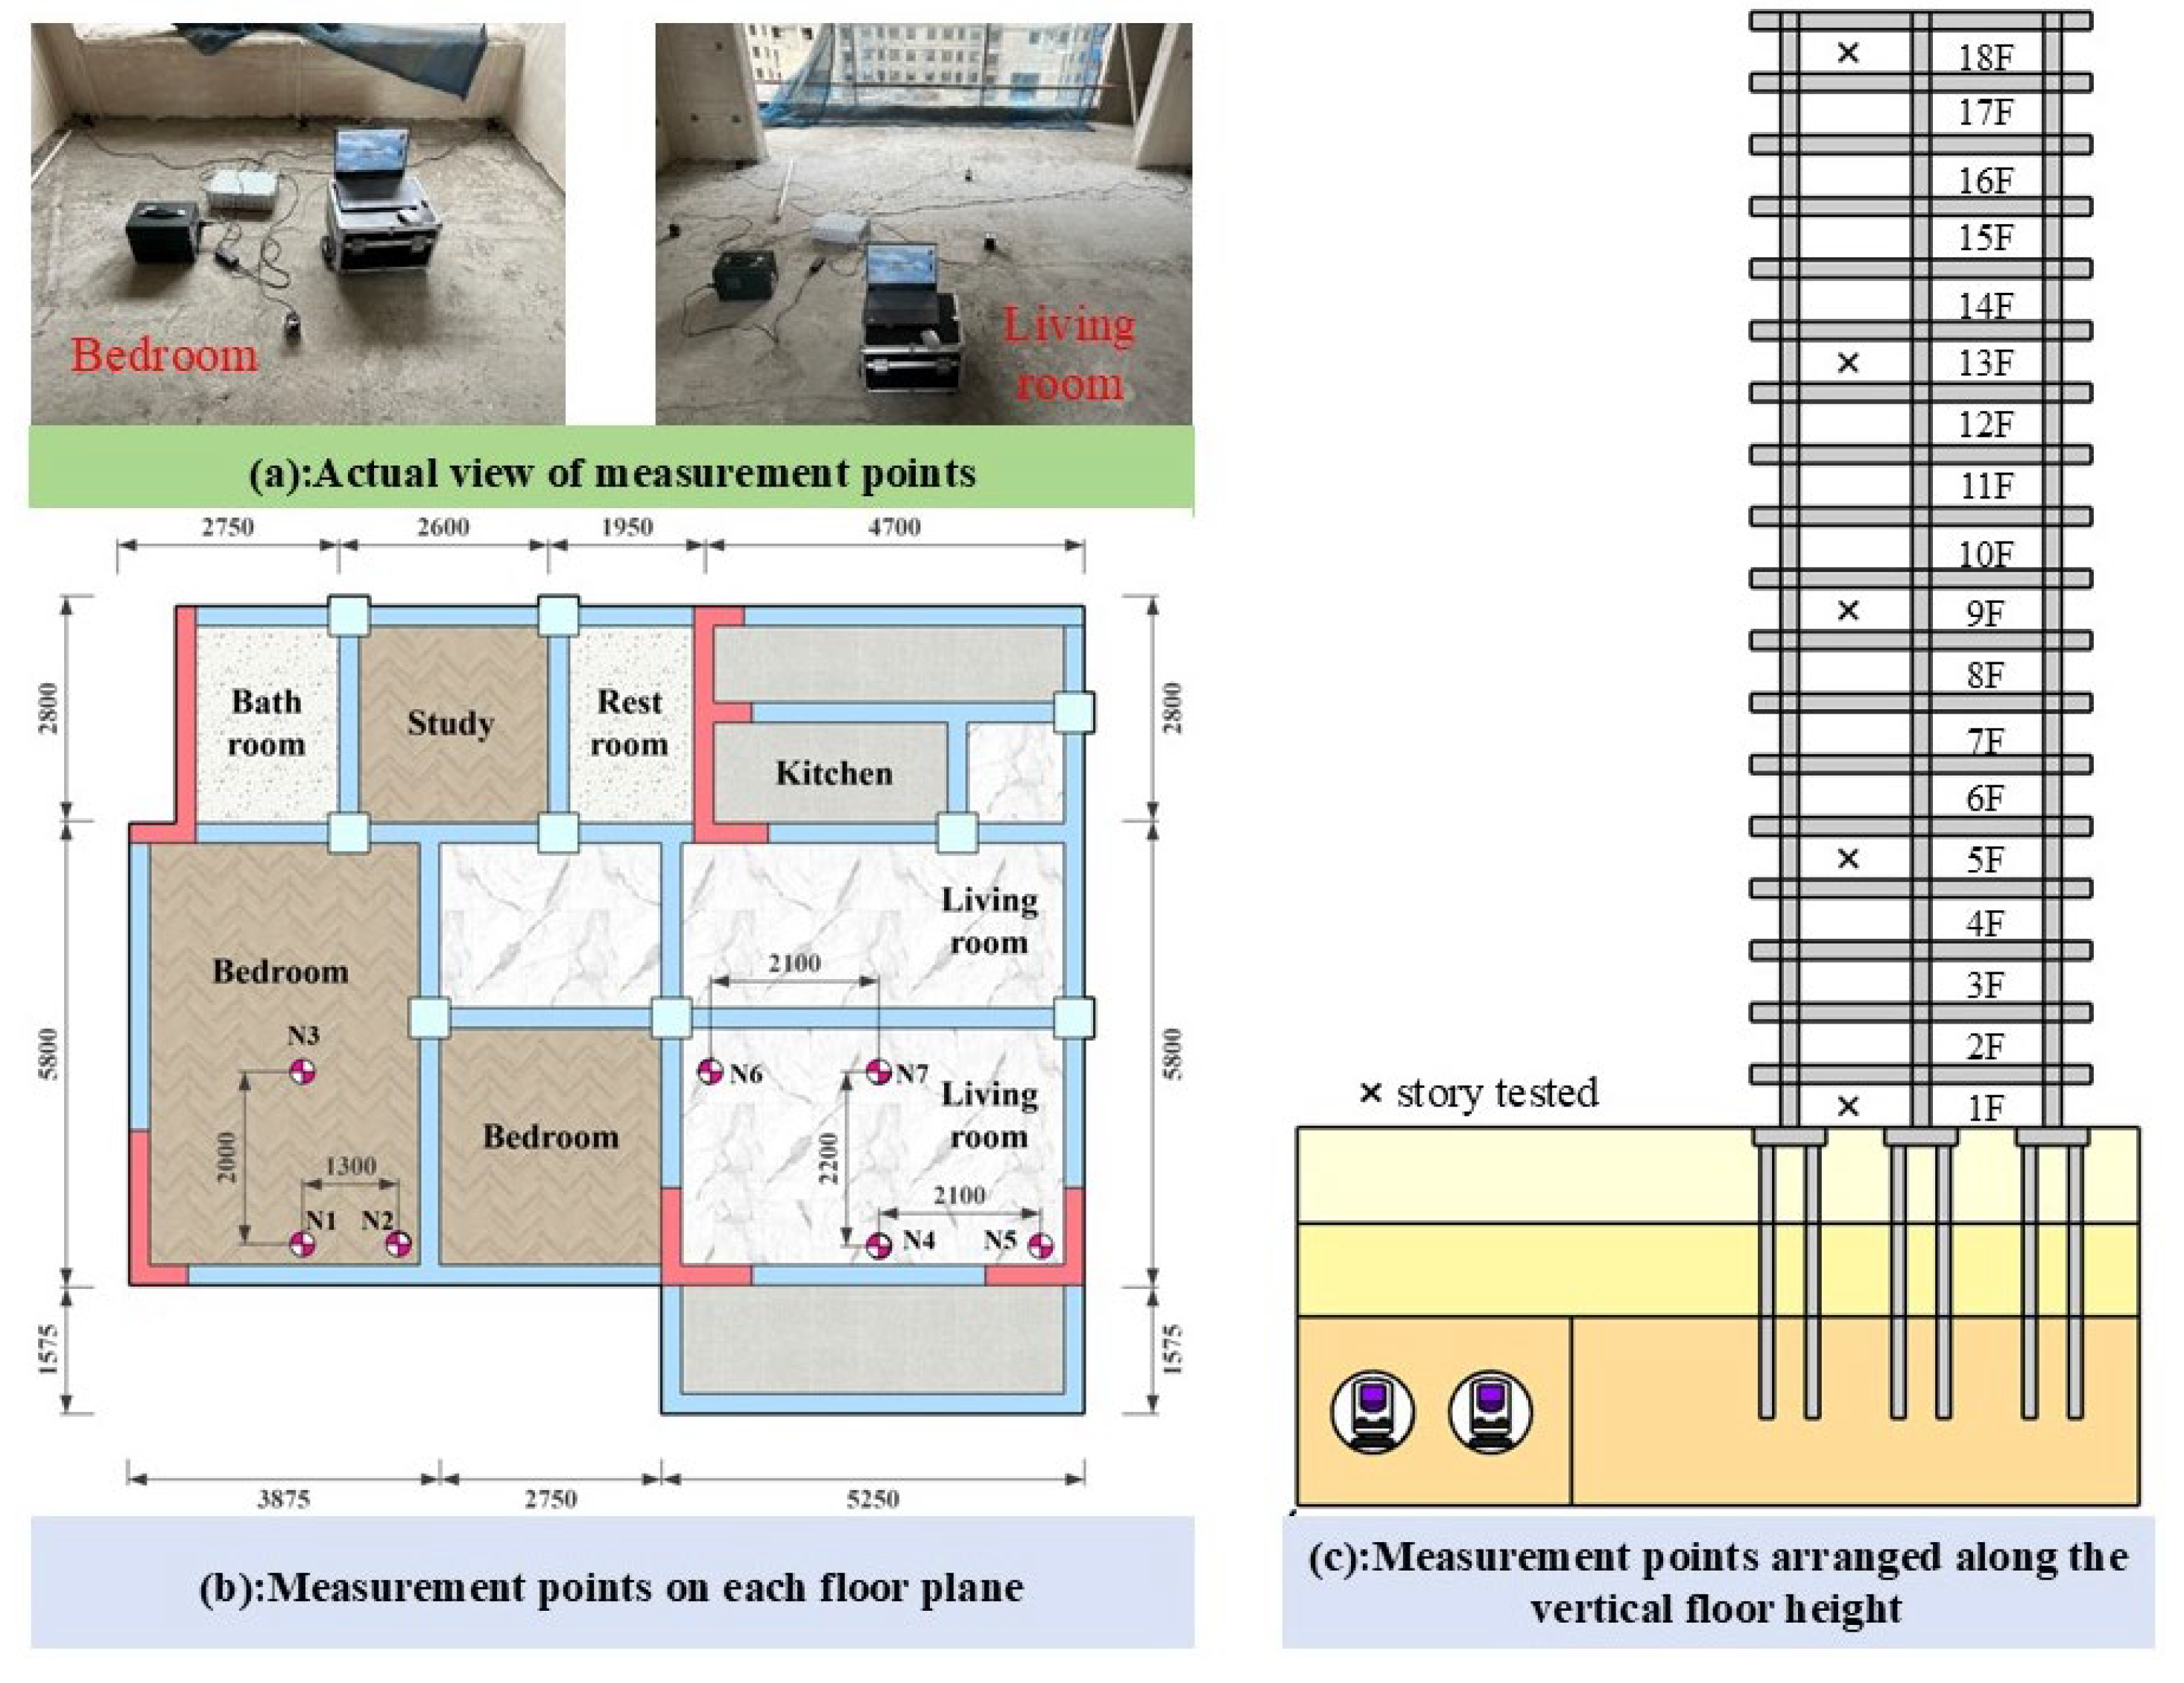
A photograph of the measurement points is shown in Figure 5a. As illustrated in Figure 5c, measurements were conducted on the 1st, 5th, 9th, 13th, and 18th floors. The measurement points were strategically located at key structural positions on each floor, including the corners of shear walls, areas near columns, the mid-span of beams, and the center of slabs, as shown in Figure 5b. To assess the effect of beam span on metro vibration transmission, measurement points N1 and N4 were selected. Similarly, to evaluate the influence of slab span points N3 and N7 were placed at the centers of slabs with different spans. Measurement point N6 was positioned near a column, while points N2 and N5 were located at the corners of shear walls. This arrangement was designed to analyze the influence of different structural components on vibration transmission.

3.4. Characteristics of Vibrations Obtained by Machine Learning

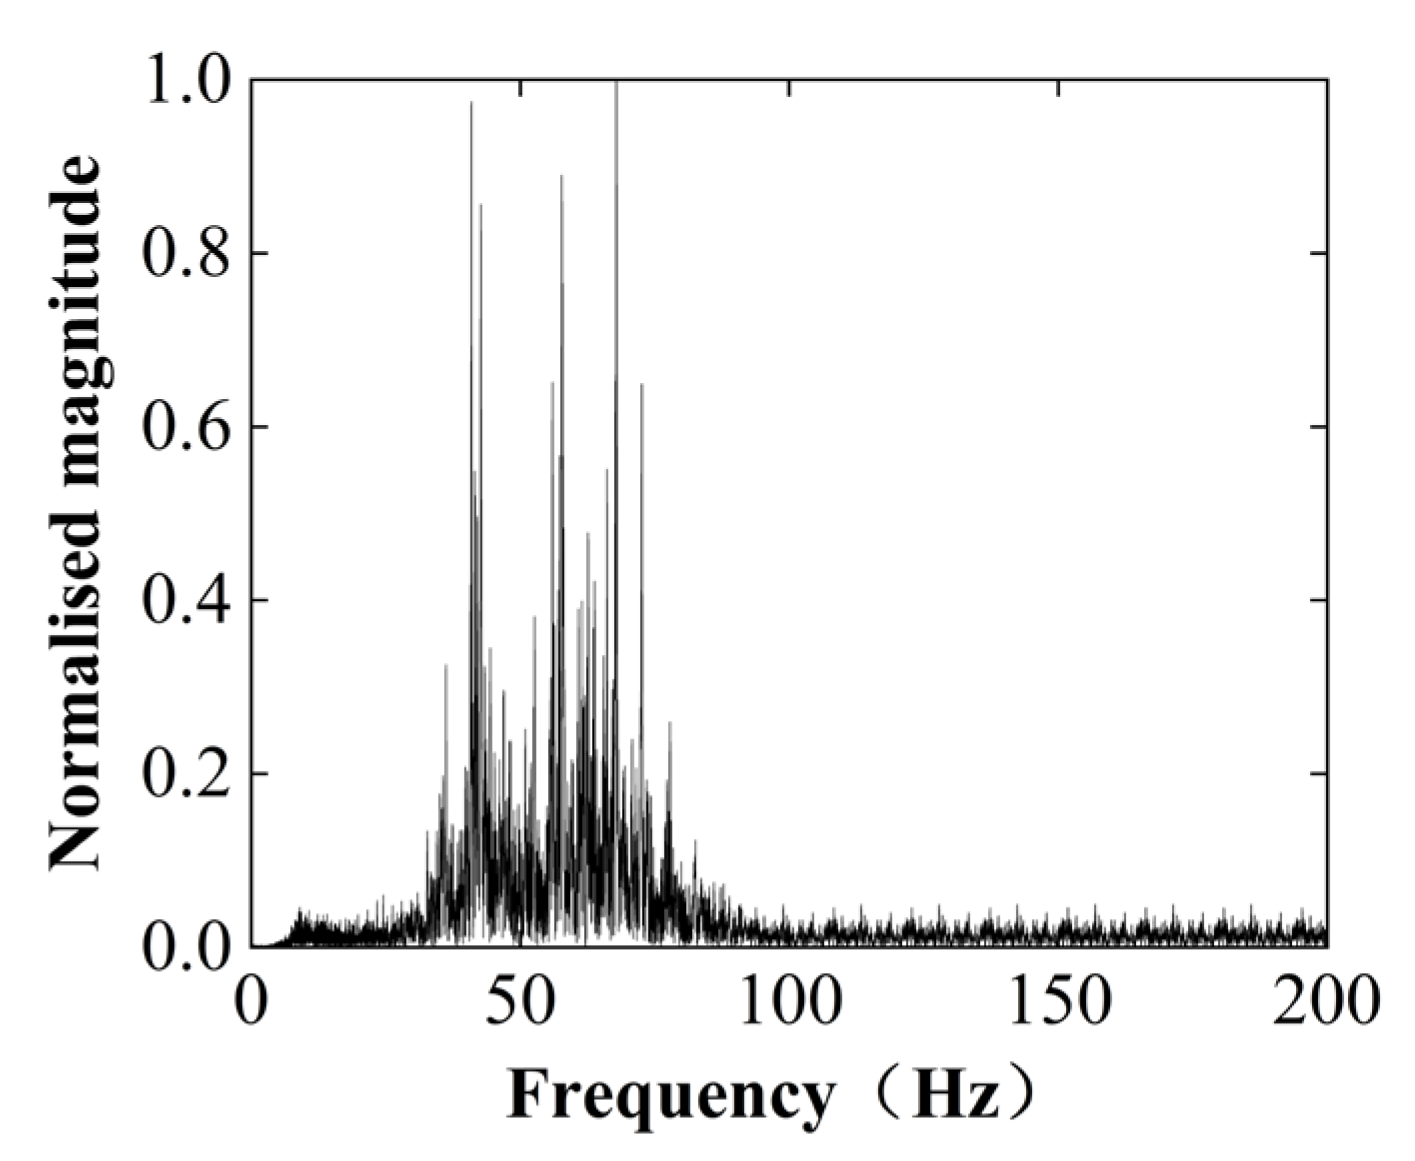
The criteria for selecting the dataset and training set are illustrated in Figure 6 and Figure 7. The stiffness and damping values of the equivalent single-degree-of-freedom system used in the training set are provided in Table 3. The average stiffness ( k ¯ ) and damping ( c ¯ ) values were 52 kN/mm and 0.069 kN·s/mm, respectively. The vibration data obtained through machine learning were processed using a weighted average derived from the training set. The resulting vibration acceleration curve is presented in Figure 8, while the corresponding acceleration spectrum is shown in Figure 9. The duration of the vibration, as obtained by machine learning, is 3.67 s. The peak acceleration is 0.177 m/s2, occurring at a peak frequency of 68 Hz. The energy distribution is relatively concentrated, with the majority of the energy occurring between 34 Hz and 78 Hz.

4. Maximum Vertical Vibration Levels

4.1. Finite Element Modeling

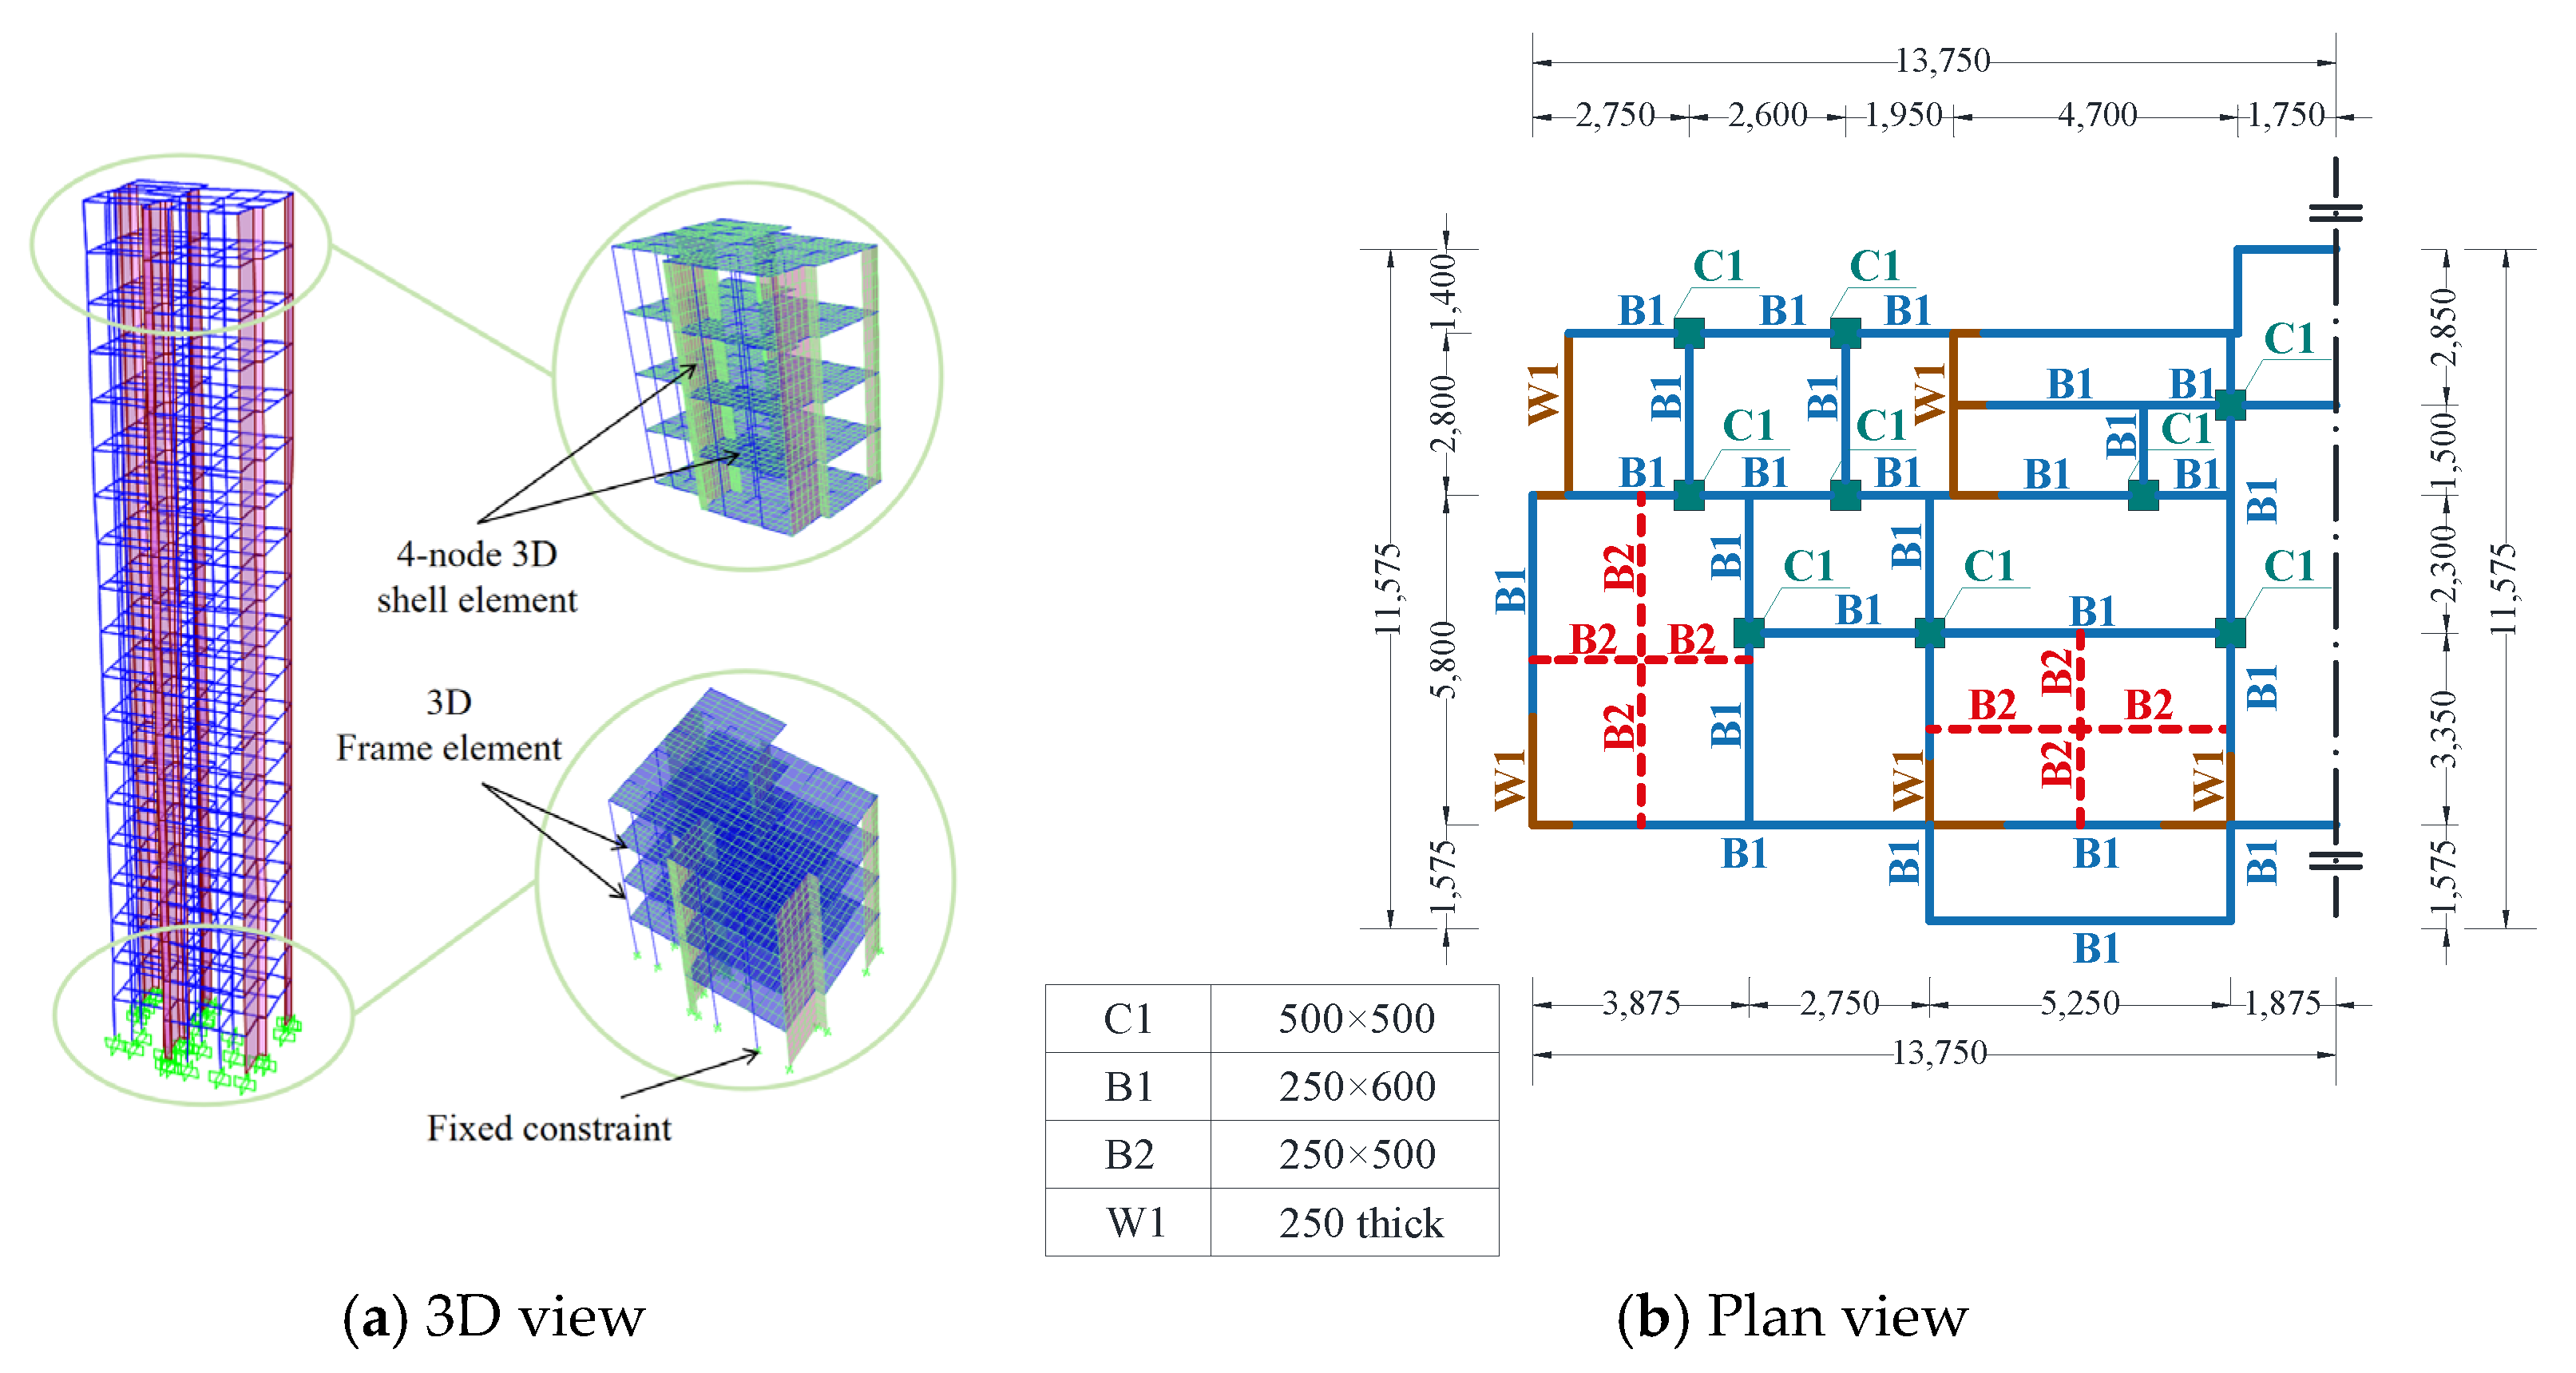
SAP2000 (Beijing Construction Information Solution Engineering Consulting, Beijing, China) was selected to conduct the finite element analysis. The ground floor, assumed to be fixed, was designated as the model boundary, as shown in Figure 10. Beams and columns were modeled using elastic 3D frame elements, while shear walls and floor slabs were modeled using elastic 3D shell elements. All beams and columns have rectangular cross-sections, with dimensions provided in Figure 10b. The structural components are assumed to be rigidly connected. The concrete strength is 30 MPa, and the slab thickness is 100 mm.
The model mesh size was uniformly set to 0.5 m. The dead load was 3.5 kN/m2, and the live load was 2 kN/m2. Rayleigh damping was applied to account for vibration energy dissipation, which can be expressed as follows:
C = α M + β K
In the equation, the coefficient α represents the mass-proportional constant, while β denotes the stiffness-proportional constant. The values of α and β are as follows:
α = 2 ω i ω j ξ ω i + ω j   β = 2 ξ ω i + ω j
The building exhibits a low intrinsic vertical vibration frequency, whereas the excitation frequency from the train is relatively high. Consequently, the building’s first-order vertical vibration frequency is represented by ωᵢ, while the peak frequency of the measured vibration data is denoted as ωⱼ.
Since the vibrations induced by the metro primarily occur in the vertical direction, the Ritz vector method was utilized to compute the vertical vibration modes. The first four vertical modes, as detailed in Table 4, were selected for further analysis.
For the dynamic analysis, the excitation was introduced in the form of vibration acceleration time histories obtained from the machine learning, processed dataset described in Section 3.4. These records, representing the vertical ground vibrations at the foundation level, were applied as the input to the finite element model. A detailed discussion of the excitation spectrum and the method of application is provided later in Section 4.3.

4.2. Validation of the Model

To validate the model, field measurement data from measurement points N2 and N6 on the first, ninth, and eighteenth floors were compared with the simulation results. The vibration acceleration time-history curves and their corresponding spectral graphs are presented in Figure 11. The simulation results for measurement points N2 and N6 show a high degree of consistency with the actual measurements. However, the measured values are slightly higher than the simulated ones, likely due to a minor amplification effect induced by external environmental factors. As shown in Table 5, the relative error between the simulated and measured values is less than 3%, indicating that the finite element analysis model is both accurate and suitable for further studies on the vibration comfort of buildings located near metro lines.

4.3. Evaluation of Vibration Input

As introduced in Section 4.1, the vibration excitation for the finite element model was based on machine learning, processed ground vibration acceleration records. In this section, the details of the input method and the comparison of alternative excitation representations are further elaborated.
Two primary methods of vibration input are employed in the dynamic analysis of structures: the uniform excitation input method and the multi-point excitation input method. The uniform excitation input method applies identical vibration excitation to the base of all columns, neglecting time differences in the propagation of the vibration waves. In contrast, the multi-point excitation input method considers these time differences, requiring different vibration excitations at the base of each column. In this study, the uniform excitation input method was adopted, whereby identical vibration acceleration records were applied at the base of all columns. The rationale for this choice lies in its computational simplicity and its ability to reproduce the general trend of vertical vibration propagation within the building. Although metro-induced vibrations can exhibit spatial variability, the available dataset did not provide sufficient spatial resolution to support a rigorous multi-point excitation analysis. Furthermore, the primary objective of this work was to investigate relative differences in vibration responses under varying structural conditions, for which uniform excitation is considered an acceptable approximation.
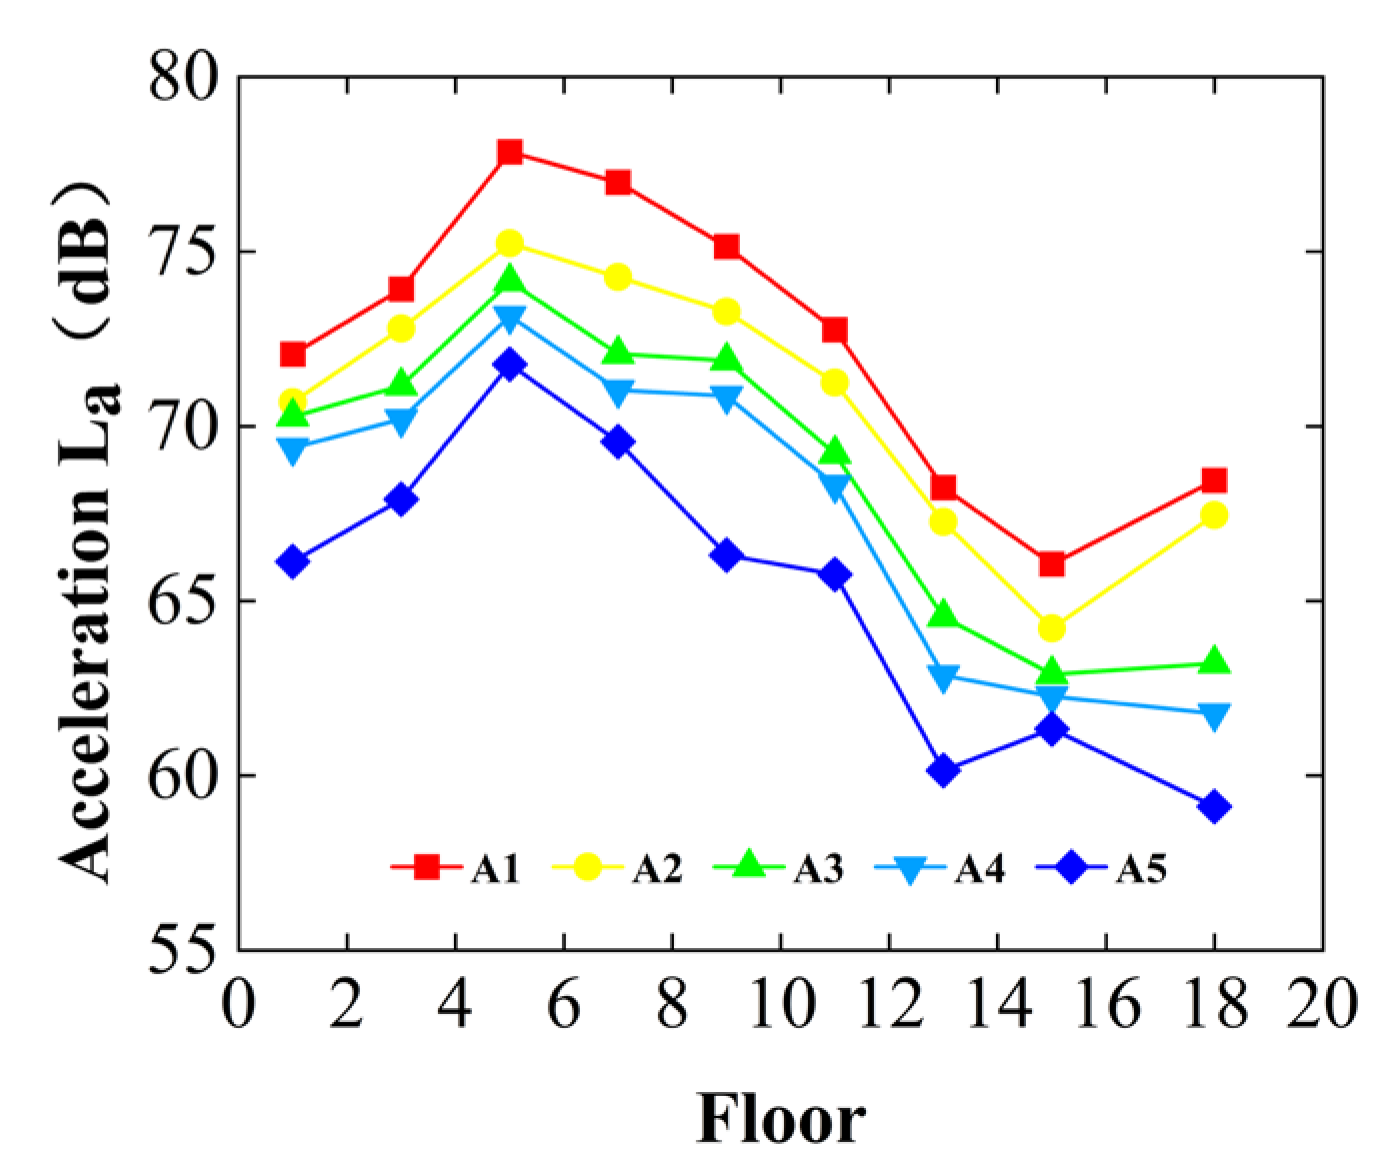
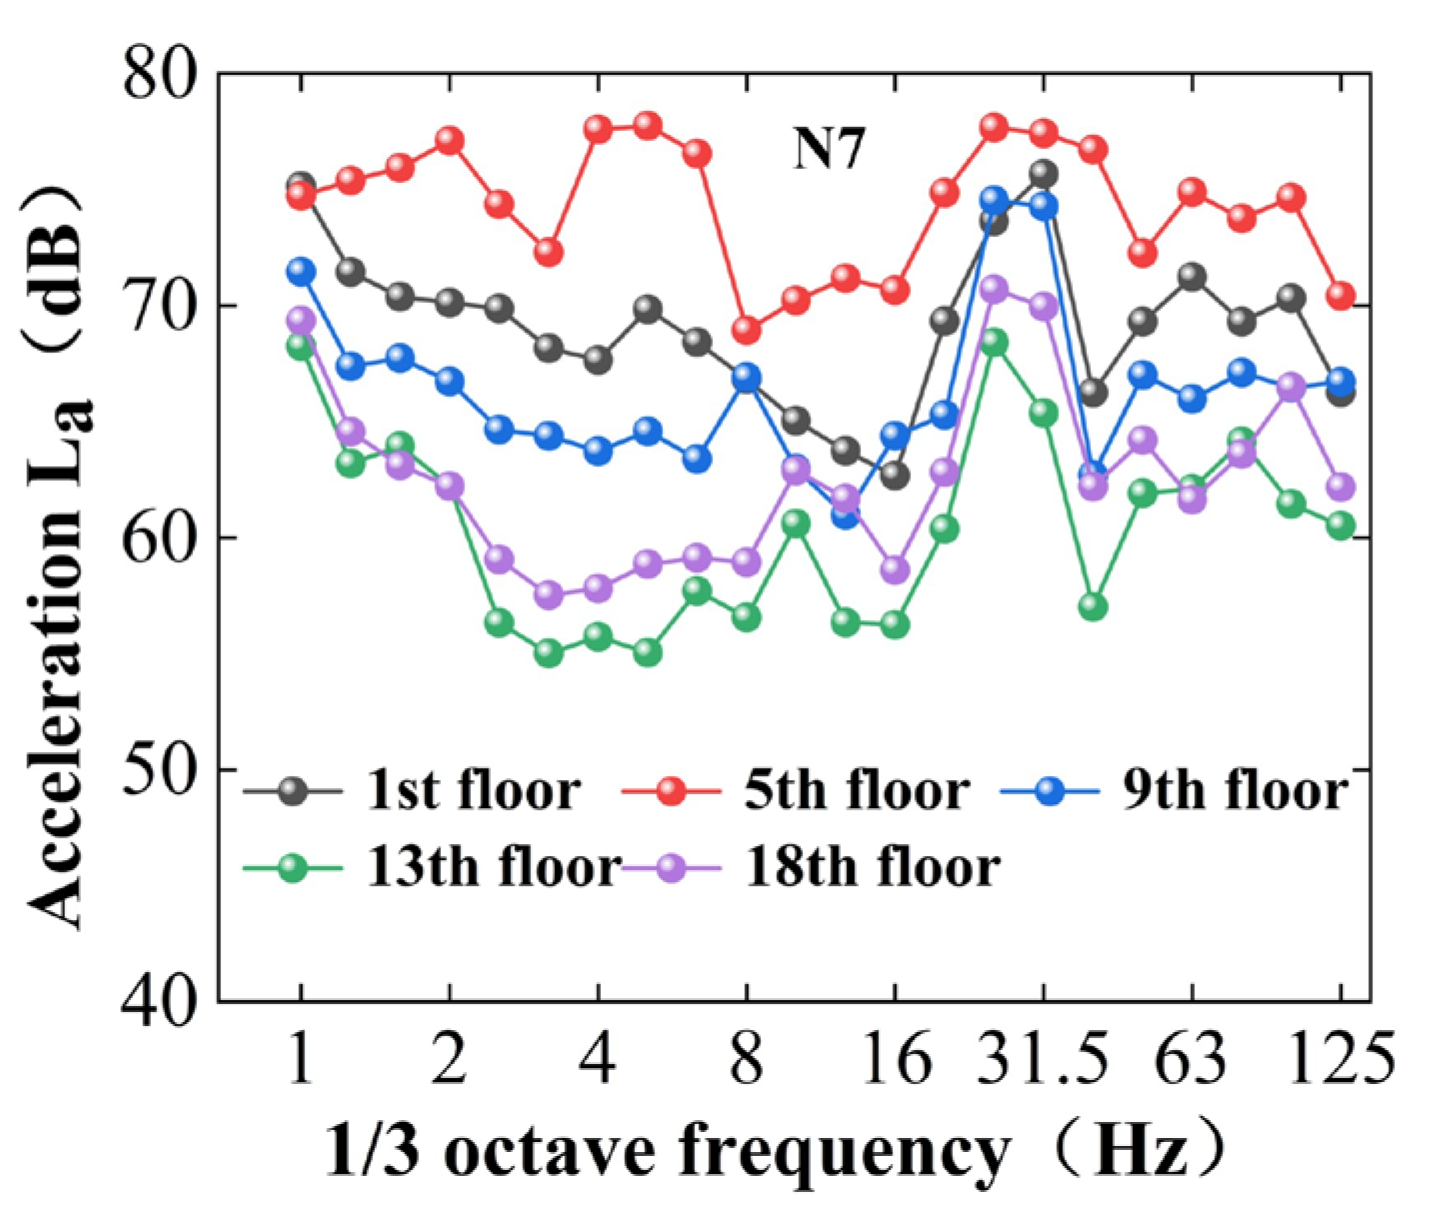
To evaluate the accuracy of the consistent input method, vibration data from five measurement points were utilized as load inputs for the structure. The vibration acceleration data are presented in Figure 12. Additionally, the 1/3 octave vibration levels for each story at measurement point N7 were analyzed, as shown in Figure 13. Although discrepancies exist in the results due to varying vibration inputs, the overall trend in vertical vibration levels remains consistent. This suggests that the uniform excitation input method is appropriate. Furthermore, the large mass of the structure is considered. Mass elements were added at the base of the columns, and the actual acceleration time histories were converted into inertial forces for these mass elements.

4.4. Results and Analysis

4.4.1. Vertical Vibration Level Results for Different Heights

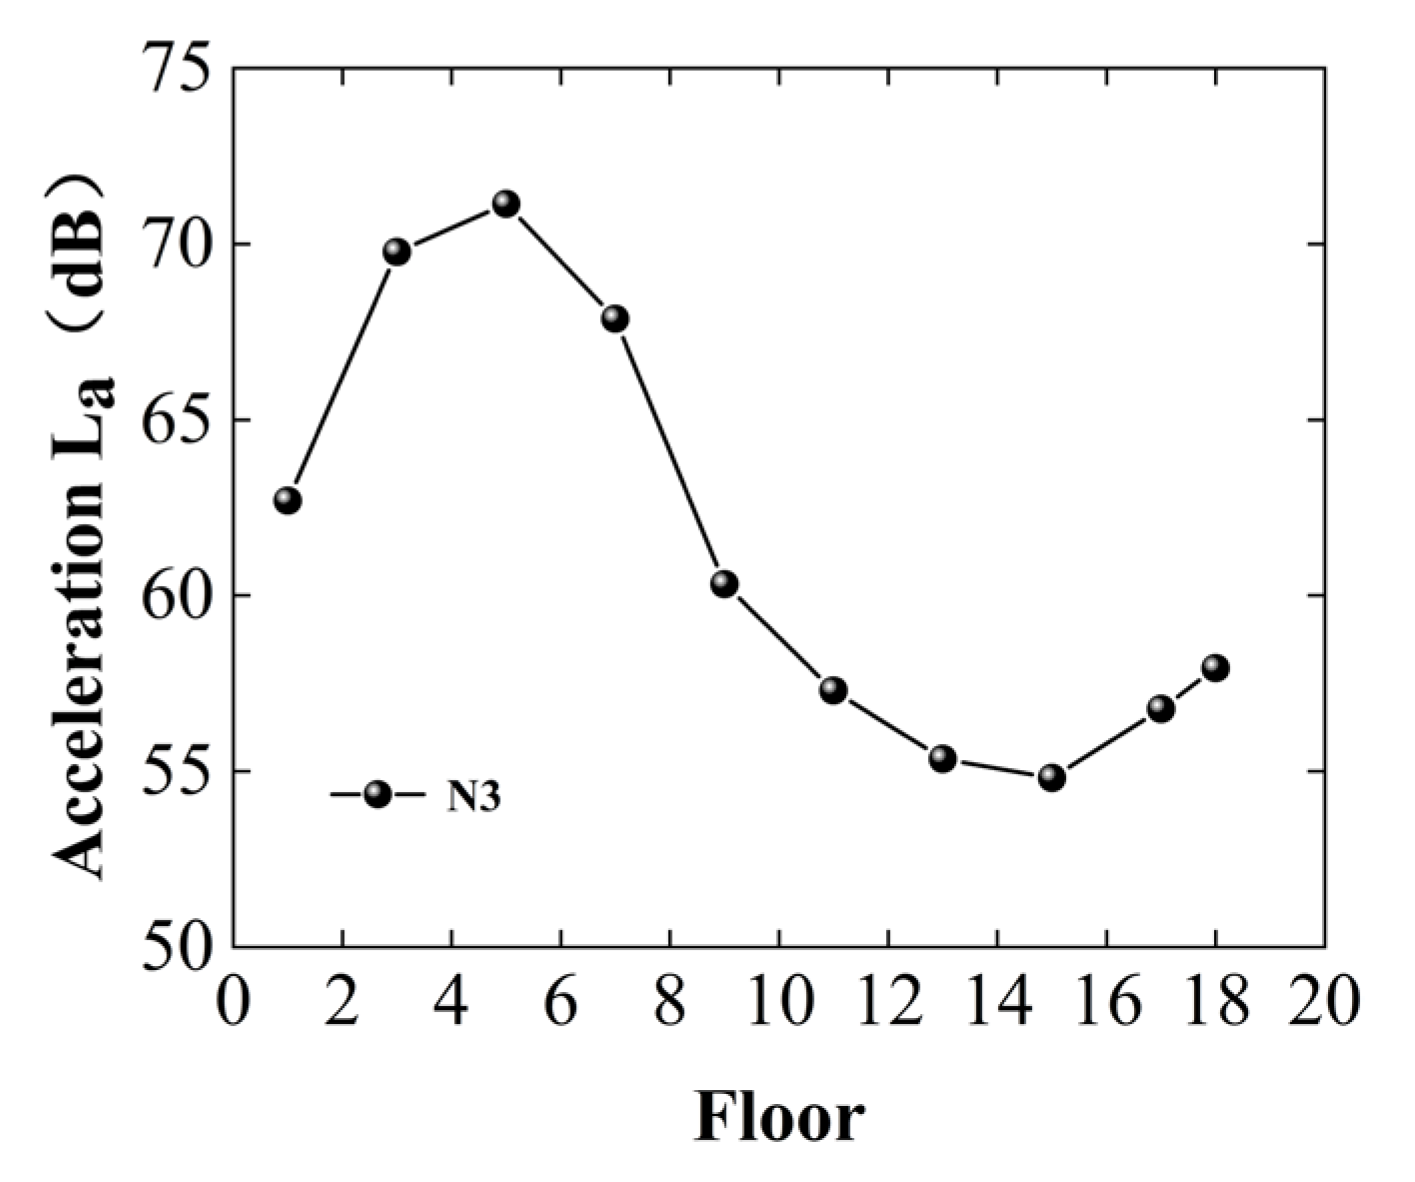
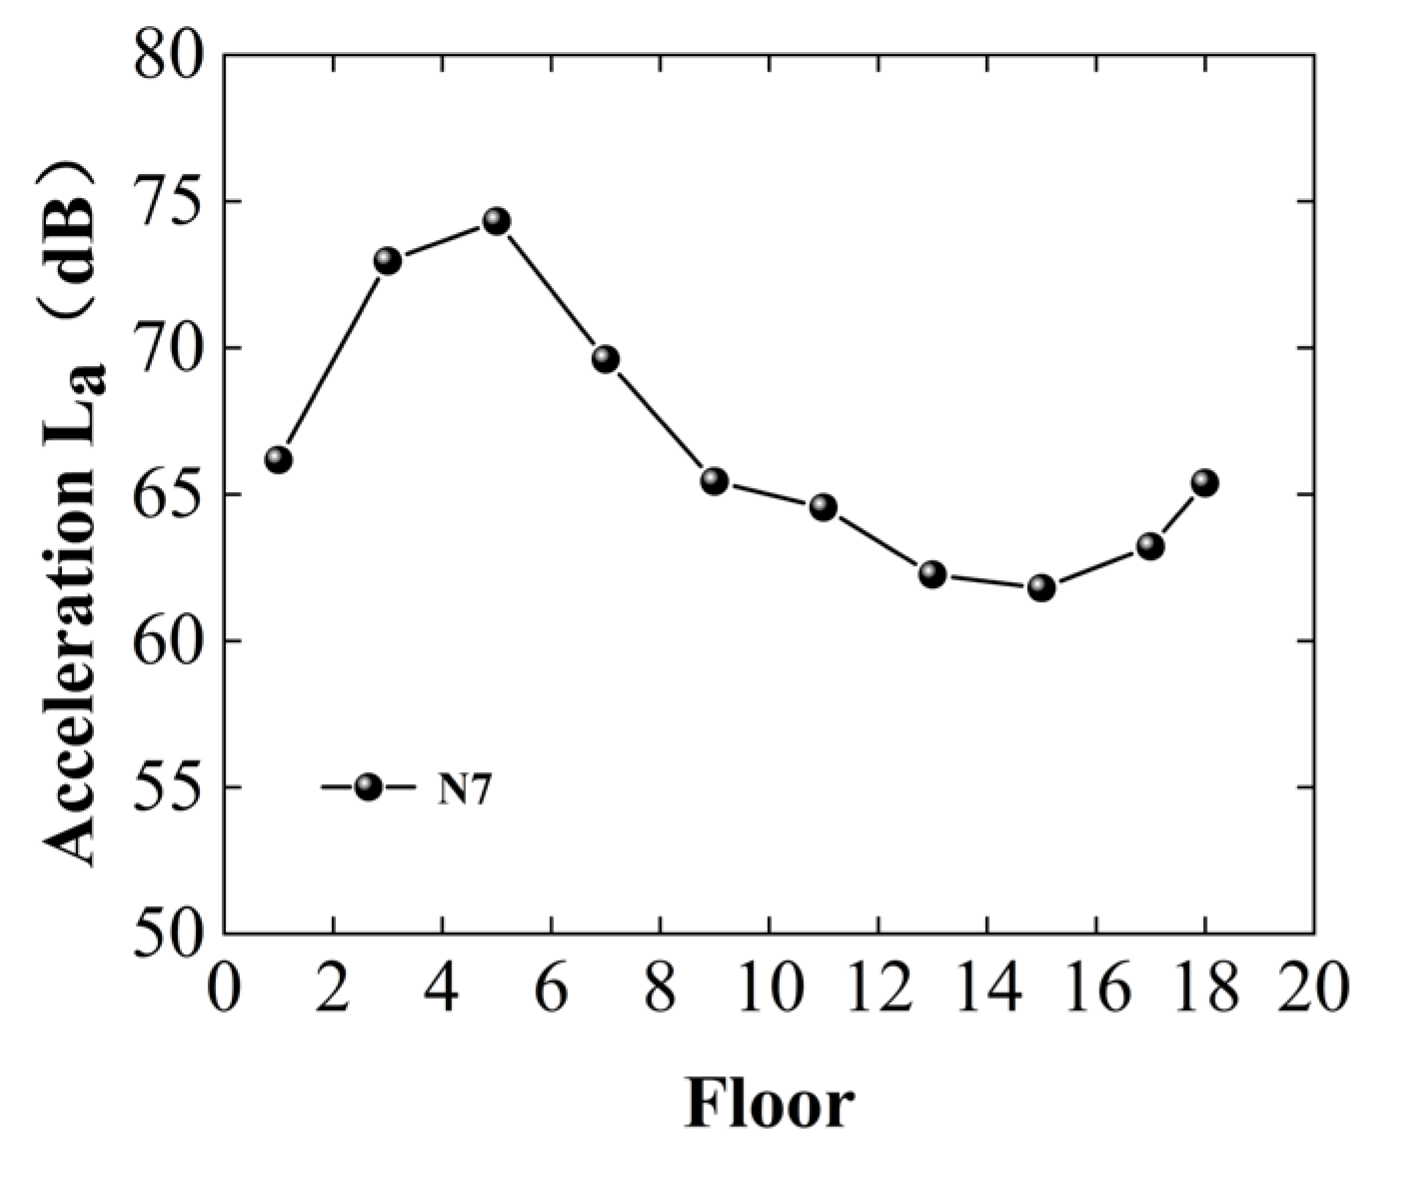
The 1/3 octave vibration levels at 31.5 Hz for measurement points N3 and N7 are shown in Figure 14 and Figure 15. It can be observed that the 1/3 octave vibration level initially increases with height, reaching a peak at the 4th floor, after which it gradually decreases. An increase in vibration levels is also observed on the 17th and 18th floors, likely due to the amplification of the vertical vibration acceleration caused by the amplification effect at the top of the building.
The amplification observed at approximately one-quarter of the total building height can be explained in terms of structural modal behavior. The first few vertical vibration modes obtained from the finite element analysis indicate that the maximum modal displacements occur at about one-quarter to one-third of the building height. This suggests that the observed peak vibration levels are primarily governed by resonance with the building’s fundamental vertical modes. In addition, the localized increase in vibration at the top floors may be attributed to the combined influence of higher-order modes and the reduced stiffness and mass participation near the roof. These findings highlight the importance of modal behavior in interpreting the vertical distribution of vibration levels in metro-adjacent buildings.

4.4.2. Vertical Vibration Level Results for Different Structural Members

Figure 16 presents a comparative analysis of the 1/3 octave vibration levels between measurement points N5 and N7 on each floor.
The results indicate that the 1/3 octave vibration levels at point N7 are higher than those at point N5, suggesting that the vertical vibration levels near the shear walls are lower than those in the floor slabs. This indicates that, as a relatively flexible component, the floor slab should be the primary focus.
The higher vibration levels observed at the slab center (point N7) compared to regions adjacent to shear walls (point N5) can be attributed to structural dynamic effects. From a modal perspective, slabs behave as flexible plates whose central regions exhibit larger amplitudes in their fundamental bending modes, whereas areas near shear walls or columns are closer to nodal regions with higher stiffness restraint. Consequently, the slab center acts as a dynamic amplification zone, where resonance effects under metro-induced excitations become more pronounced.

4.4.3. Vertical Vibration Level Results for Different Spans

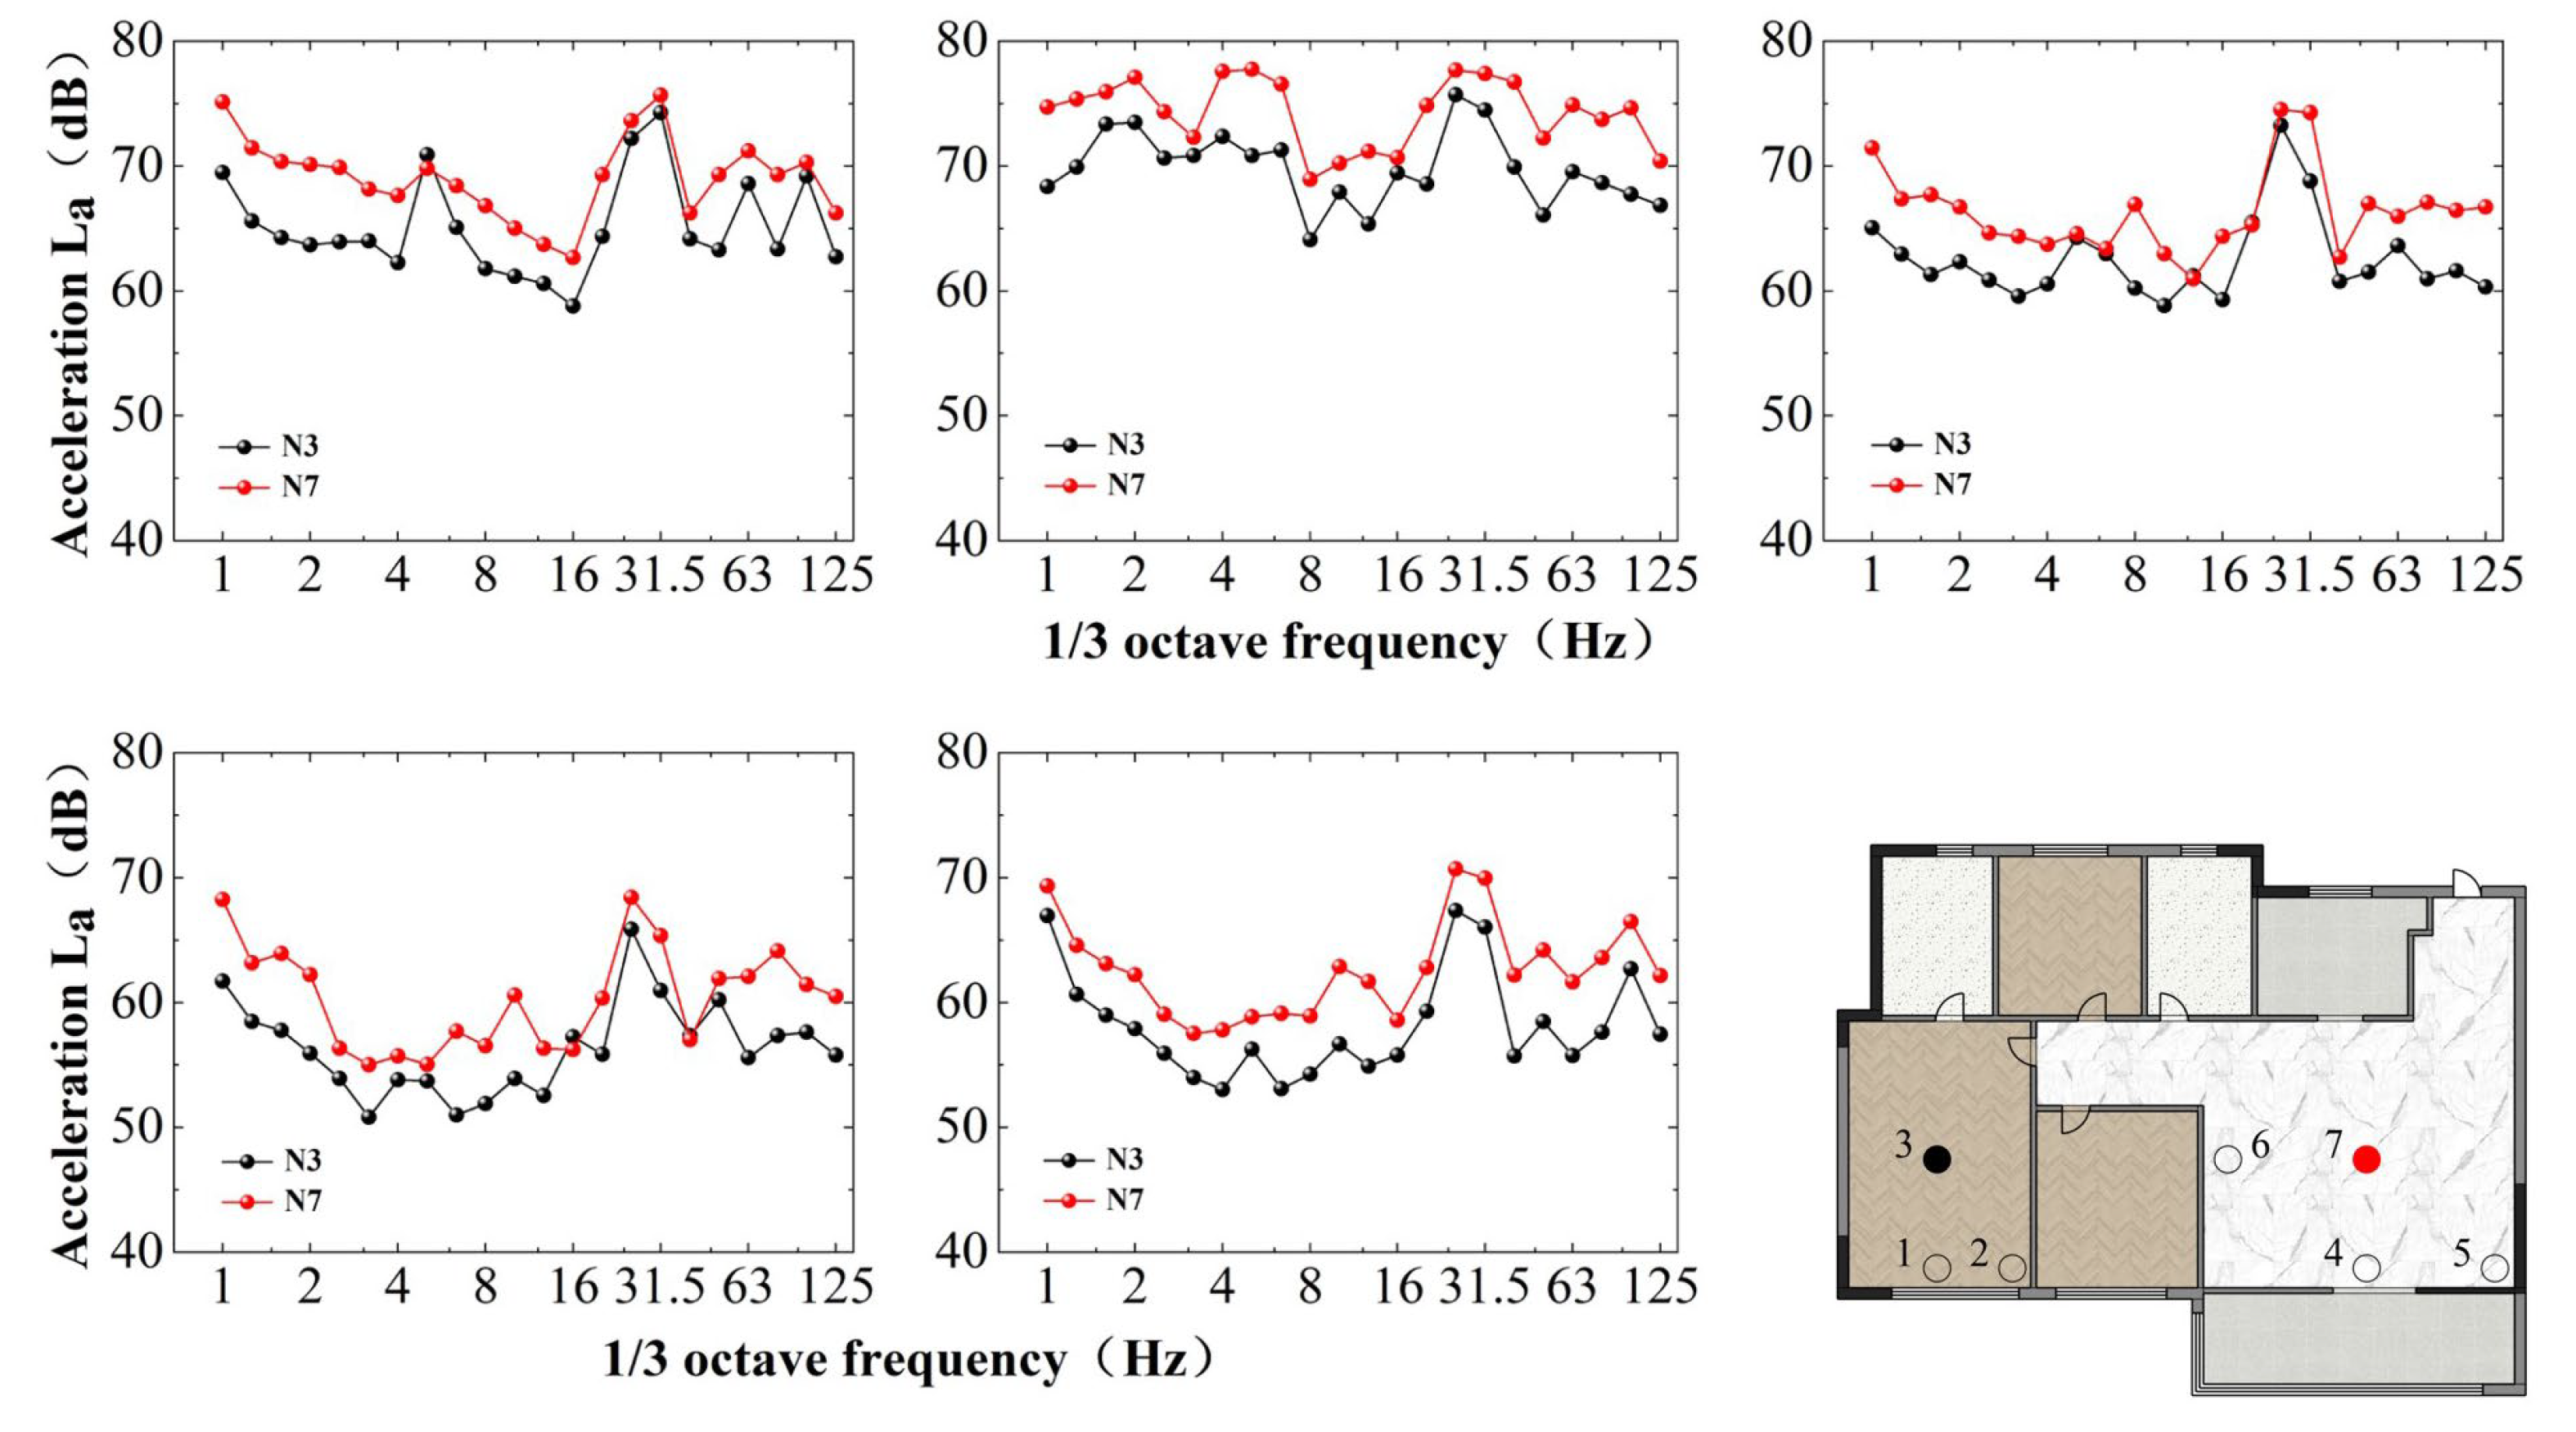
Figure 17 presents a comparative analysis of the 1/3 octave vibration levels between measurement points N3 and N7 on each floor. The results show that the 1/3 octave vibration levels at point N7 are higher than those at point N3, indicating a positive correlation between the building’s vibration levels and the span length. This suggests that as the span length increases, building vibration also intensifies.
This phenomenon is explained in terms of modal behavior or structural dynamics: The positive correlation between span length and vibration levels can also be explained by modal behavior. Increasing the span reduces the stiffness of the structural member, thereby lowering its natural frequency and bringing it closer to the dominant frequency band of metro-induced vibrations. As a result, longer-span slabs and beams experience stronger resonance effects, particularly at their mid-span regions where modal amplitudes are highest. This explains why the vibration levels at point N7 (long-span center) consistently exceed those at point N3 (short-span center).

5. Validation of Factors Affecting Maximum Vertical Vibration Levels

5.1. Influence of Height on Vertical Vibration Levels

The vibration levels at measurement points N7 and N3 are presented in Figure 18 and Figure 19, respectively. At measurement point N3, located at the center of the bedroom, the maximum vibration levels are primarily concentrated within the 20 Hz to 40 Hz frequency range, with values ranging from approximately 55 dB to 80 dB. In contrast, at measurement point N7, located at the center of the living room, the maximum vibration levels are distributed across the 16 Hz to 63 Hz frequency range, typically ranging from 60 dB to 80 dB. At a frequency of 31.5 Hz, the vibration level at measurement point N3 reaches a maximum of 74.47 dB on the 5th floor and a minimum of 60.97 dB on the 13th floor, resulting in a difference of 13.5 dB. Similarly, at measurement point N7, the vibration level reaches a maximum of 77.42 dB on the 5th floor and a minimum of 65.36 dB on the 13th floor, resulting in a difference of 12.06 dB.
The observed differences between vibration levels in bedrooms and living rooms can be explained by several physical factors. First, bedrooms are typically smaller in plan and often contain denser furniture arrangements (such as beds, wardrobes, and storage units), which contribute additional mass and localized damping, thereby reducing vibration transmission. In contrast, living rooms tend to have larger spans and fewer obstructions, leading to greater floor flexibility and higher susceptibility to vibration amplification. Second, floor coverings such as carpets or wooden finishes commonly found in bedrooms may provide additional vibration attenuation compared to the harder and more reflective finishes often used in living rooms. While these explanations are plausible, it should be noted that the present study did not explicitly quantify the influence of furniture layout or floor covering materials. Therefore, the lower vibration levels observed in bedrooms are likely due to a combination of geometric, structural, and furnishing-related factors.

5.2. Influence of Structural Component Types on Vertical Vibration Levels

To assess the influence of structural components, measurement point N7 was positioned at the center of the living room, while measurement point N5 was located at its corner. The measurement results are shown in Figure 20. The vibration level at the center of the living room is higher than that at the corner. The largest discrepancy between points N5 and N7 occurs on the 9th floor, at the 25 Hz center frequency, with a difference of 4.69 dB. It can be observed that the influence of floor slabs on vibration transmission is more significant than that of shear walls. This is demonstrated by the significantly higher vibration levels observed at the center of the slab compared to the edges. These findings are consistent with the results of the finite element analysis, suggesting that the central area of the floor slab should be the primary focus of further investigation.

5.3. Influence of Span Length on Vertical Vibration Levels

To examine the effect of span length, measurement points N3 and N7 were selected. The arithmetic average of the 1/3 octave vibration levels was employed as the evaluation metric to assess. The 1/3 octave vibration levels for each measurement point were calculated and are statistically presented in Figure 21. This figure compares the 1/3 octave vibration levels at measurement points N3 and N7, revealing that point N7 exhibits higher vibration levels than point N3. The largest discrepancy is observed at the 100 Hz center frequency on the 5th floor, with a difference of 6.91 dB between the two points. The data indicate a positive correlation between building vibration and span length, which is consistent with the finite element analysis.

6. Conclusions

The location of the maximum vibration level in buildings adjacent to metro lines is analyzed by considering various influencing factors, including structural components, span length, and vertical height. The effect of these factors on vertical vibration is systematically examined. The findings are summarized as follows:
(1)
A novel vibration filtering method based on machine learning is proposed to efficiently and accurately capture representative data that reflects the ground vibration characteristics. The decision tree thresholds (40–63 Hz, 0.1–0.2 m/s2, 3–4 s) were statistically validated against field data. Future work will optimize thresholds for varied soil types. The method first filters out data exhibiting significant anomalies by analyzing the vibration characteristics. It then removes abnormal vibration data caused by irregularities in the propagation path. The results of finite element simulations using the filtered data demonstrate strong agreement with actual measurements.
(2)
The maximum vertical vibration level in a tall building typically increases initially with height and then decreases. The location of the highest vibration levels typically occurs at approximately one-quarter to one-third of the total height of the building. Additionally, a localized amplification phenomenon is observed on the top two floors. However, the study’s conclusions are based on measured and simulated data from an 18-story shear wall–frame structure under specific geological conditions. The site geology primarily consists of highly and moderately weathered quartz diorite conglomerate, which exhibits high stiffness and vibration sensitivity. Furthermore, the observed vibration patterns, such as amplification effects at specific heights, may differ in other structural systems, including steel frames and composite structures.
(3)
Different structural components exhibit varying maximum vertical vibration levels within the same floor. Compared to shear walls, floor slabs have a more significant effect on vibration levels. Vibration levels are higher at the center of the slab than at the edges. Furthermore, the effect of metro-induced vibrations on buildings is strongly correlated with the span length of structural elements, with larger span elements exhibiting more pronounced vibration levels at their measurement points. For critical structural points, targeted renovations should be implemented to extend the building’s service life. This is key to creating a city that conserves resources.
Based on the findings of this study, several practical recommendations can be made for vibration measurement in metro-adjacent buildings: (Ⅰ) Measurement points should be prioritized at the centers of slabs rather than near shear walls or columns. (Ⅱ) In terms of vertical positioning, the most critical locations are at approximately one-quarter to one-third of the total building height. (Ⅲ) For buildings with long-span members, measurement points should be placed at the mid-span regions of beams or slabs. (Ⅳ) Although overall vibration levels tend to decrease with height, local amplification may occur at the top two floors; hence, measurement at roof levels can provide useful supplementary information. These recommendations can serve as guidelines for practitioners when planning on-site monitoring and evaluating human comfort in metro-adjacent buildings.
It should be noted that due to limitations imposed by the geological conditions and structural types of the study subjects, the generalizability of this research’s conclusions requires further validation. Future studies should apply this methodology to a broader range of cities, diverse geological environments, and varied building types, conducting comparative analyses to refine and substantiate the findings.

Author Contributions

J.W.: Data curation, Writing—Original draft preparation. Y.S.: Conceptualization, Supervision, Methodology, Software. H.Z.: Software, Validation. All authors have read and agreed to the published version of the manuscript.

Funding

This research received no external funding.

Institutional Review Board Statement

Not applicable.

Informed Consent Statement

Not applicable.

Data Availability Statement

Some or all data, models, or codes that support the findings of this study are available from the corresponding author upon reasonable request.

Conflicts of Interest

The authors declare no conflict of interest.

References

  1. Zou, C.; Wang, Y.; Wang, P.; Guo, J. Measurement of ground and nearby building vibration and noise induced by trains in a metro depot. Sci. Total Environ. 2015, 536, 761–773. [Google Scholar] [CrossRef] [PubMed]
  2. Sheng, T.; Liu, G.B.; Bian, X.C.; Shi, W.X.; Chen, Y. Development of a three-directional vibration isolator for buildings subject to metro-and earthquake-induced vibrations. Eng. Struct. 2022, 252, 113576. [Google Scholar] [CrossRef]
  3. Liang, Q.; Luo, W.; Zhou, Y.; Lu, Z.; Li, J.; He, Z. Vibration filtering effect of a novel three-dimensional isolation bearing on metro vibration isolation. Eng. Struct. 2024, 301, 117304. [Google Scholar] [CrossRef]
  4. Xie, W.; Hua, Y. Structural Vibration Comfort: A Review of Recent Developments. Buildings 2024, 14, 1592. [Google Scholar] [CrossRef]
  5. Farahani, M.V.; Sadeghi, J.; Jahromi, S.G.; Sahebi, M.M. Modal based method to predict subway train-induced vibration in buildings. Structures 2023, 47, 557–572. [Google Scholar] [CrossRef]
  6. ISO 2631-2:1989; Evaluation of Human Exposure to Whole-Body Vibration—Part 2: Continuous and Shock-Induced Vibration in Buildings (1 to 80 Hz). International Organization for Standardization: Geneva, Switzerland, 1989.
  7. Ministry of the Environment Government of Japan. Vibration Regulation Law. Japan. 1997. Available online: https://www.env.go.jp/en/laws/air/vibration/index.html (accessed on 17 September 2024).
  8. Liao, Y.; Zhang, P.; Wu, Q.; Zhang, H. A case study on structural serviceability subjected to railway-induced vibrations at TOD developed metro depot. Buildings 2022, 12, 1070. [Google Scholar] [CrossRef]
  9. Zou, C.; Wang, Y.; Moore, J.A.; Sanayei, M. Train-induced field vibration measurements of ground and over-track buildings. Sci. Total Environ. 2017, 575, 1339–1351. [Google Scholar] [CrossRef] [PubMed]
  10. Zhang, Y. Impact of Subway Train Vibrations in Curved Tunnels on Adjacent Buildings and Control Technology. Master’s Thesis, Beijing Jiaotong University, Beijing, China, 2022. Available online: https://link.cnki.net/doi/10.26944/d.cnki.gbfju.2022.002026 (accessed on 17 September 2024).
  11. Xia, H.; Chen, J.; Wei, P.; Jia, C.; De Roeck, G.; Degrande, G. Experimental investigation of railway train-induced vibrations of surrounding ground and a nearby multi-story building. Earthq. Eng. Eng. Vib. 2009, 8, 137–148. [Google Scholar] [CrossRef]
  12. Cao, Z.; Guo, T.; Zhang, Z.; Li, A. Measurement and analysis of vibrations in a residential building constructed on an elevated metro depot. Measurement 2018, 125, 394–405. [Google Scholar] [CrossRef]
  13. Qian, X.; Wen-Jun, Q. Experimental and numerical studies of metro train-induced vibrations on adjacent masonry buildings. Int. J. Struct. Stab. Dyn. 2016, 16, 1550067. [Google Scholar] [CrossRef]
  14. Chen, Z.; Wan, F.; He, C. Field Test and Numerical Study of Train-Induced Vibration of Over-Track Buildings Above Metro Depot. Urban Rail Transit 2024, 10, 361–375. [Google Scholar] [CrossRef]
  15. Pranno, A.; Greco, F.; Lonetti, P.; Luciano, R.; De Maio, U. An improved fracture approach to investigate the degradation of vibration characteristics for reinforced concrete beams under progressive damage. Int. J. Fatigue 2022, 163, 107032. [Google Scholar] [CrossRef]
  16. Liu, L.; Chen, R.C.; Zhao, Q.; Zhu, S. Applying a multistage of input feature combination to random forest for improving MRT passenger flow prediction. J. Ambient. Intell. Humaniz. Comput. 2019, 10, 4515–4532. [Google Scholar] [CrossRef]
  17. Yao, J.; Xia, H.; Zhang, N.; Yu, B. Prediction on building vibration induced by moving train based on support vector machine and wavelet analysis. J. Mech. Sci. Technol. 2014, 28, 2065–2074. [Google Scholar] [CrossRef]
  18. Wang, K.; Zhang, L.; Fu, X. Time series prediction of tunnel boring machine (TBM) performance during excavation using causal explainable artificial intelligence (CX-AI). Autom. Constr. 2023, 147, 104730. [Google Scholar] [CrossRef]
  19. Rajalakshmi, V.; Ganesh Vaidyanathan, S. Hybrid time-series forecasting models for traffic flow prediction. Promet Traffic Transp. 2022, 34, 537–549. [Google Scholar] [CrossRef]
  20. AlKhereibi, A.H.; Wakjira, T.G.; Kucukvar, M.; Onat, N.C. Predictive machine learning algorithms for metro ridership based on urban land use policies in support of transit-oriented development. Sustainability 2023, 15, 1718. [Google Scholar] [CrossRef]
  21. ISO 2631; Mechanical Vibration and Shock—Evaluation of Human Exposure to Whole-Body Vibration—Part 2: Vibration in Buildings (1 Hz to 80 Hz). International Organization for Standardization: Geneva, Switzerland, 2003.
  22. ISO 8041:2005; Human Response to Vibration—Measuring Instrumentation. International Organization for Standardization: Geneva, Switzerland, 2005.
  23. Zhi, G.; Xu, X.; Guo, T.; Chen, Z.; Zhang, M. Experimental and numerical investigation of vibrations in over-track scale model buildings. J. Build. Eng. 2023, 77, 107538. [Google Scholar] [CrossRef]
Figure 1. Methodology using machine learning for the regularity of metro-induced maximum vertical vibration levels. The collected vibration data are shown in (a). Key characteristics were extracted from field-measured vibration data, including frequency (f), amplitude (A), and effective vibration duration (t) (b). The remaining data are marked as “Good” and retained to form the final dataset (c). As depicted in Figure 2, the vibration propagation process from measurement point M to measurement point T is simplified using a single-degree-of-freedom system model (d). The arithmetic average of all stiffness and damping values is calculated to determine the average stiffness ( k ¯ ) and average damping ( c ¯ ) for the hypothetical single-degree-of-freedom system (e). Data falling outside these ranges were eliminated (f). The filtered vibration data were then averaged using a weighted approach to obtain the input data required for the finite element model (g). A finite element simulation was subsequently conducted to investigate the effects of factors such as span, vertical height, and structural components on the maximum vertical vibration levels (h). Validation was conducted through on-site vibration tests (i).
Sustainability 17 08764 g001
Figure 2. Measurement point on the ground and the vibration propagation path.
Sustainability 17 08764 g002
Figure 3. Testing instrumentation.
Sustainability 17 08764 g003
Figure 4. Plan view on the ground near the metro line.
Sustainability 17 08764 g004
Figure 5. Arrangement of acceleration sensors on the buildings to be tested.
Sustainability 17 08764 g005
Figure 6. Selection criteria of the dataset.
Sustainability 17 08764 g006
Figure 7. Selection criteria of the training set.
Sustainability 17 08764 g007
Figure 8. Vibration acceleration by machine learning.
Sustainability 17 08764 g008
Figure 9. Vibration acceleration spectrum.
Sustainability 17 08764 g009
Figure 10. The finite element model of the building to be tested.
Sustainability 17 08764 g010
Figure 11. Vibration response at measurement points N2 and N6.
Sustainability 17 08764 g011
Figure 12. Vibration acceleration input.
Sustainability 17 08764 g012
Figure 13. Vertical vibration levels of N7.
Sustainability 17 08764 g013
Figure 14. 1/3 Octave weighted vibration levels on each floor at measurement point N3.
Sustainability 17 08764 g014
Figure 15. 1/3 Octave weighted vibration levels on each floor at measurement point N7.
Sustainability 17 08764 g015
Figure 16. Comparison of 1/3 octave vibration levels for points N5 and N7.
Sustainability 17 08764 g016
Figure 17. Comparison of 1/3 octave vibration levels for points N3 and N7.
Sustainability 17 08764 g017
Figure 18. 1/3 Octave weighted vibration levels on each floor at measurement point N3.
Sustainability 17 08764 g018
Figure 19. 1/3 Octave weighted vibration levels on each floor at measurement point N7.
Sustainability 17 08764 g019
Figure 20. Comparison of 1/3 octave vibration levels between points N5 and N7 on each floor.
Sustainability 17 08764 g020
Figure 21. Comparison of 1/3 octave vibration levels between points N3 and N7 on each floor.
Sustainability 17 08764 g021
Table 1. Geological soil layer parameters.
Soil TypeThickness
d (m)
Water Content W (%)Volumetric Weight
γ (kN/m3)
Porosity Ratio eDensity
(g/cm3)
Elasticity
Modulus
(MPa)
Poisson
Ratio ν
VpVs
Plain Fill3.525.819.30.7621.871250.34301148
Silty Clay10.7025.819.60.7241.862900.33315159
Completely Weathered Diorite23.3///2.28723750.32472243
Moderately Weathered Diorite10.4///2.53650770.241106647
Table 2. Distribution and engineering properties of the geotechnical layer.
Name and Characteristics of Foundation SoilThicknessEngineering Properties
Highly Weathered Quartz Monzonite Porphyry2.5 mHigh strength, low compressibility, most of the rock mass structure is damaged, classified as extremely soft rock
Moderately Weathered Quartz Monzonite Porphyry12.3 mClassified as extremely soft to soft rock, the rock mass is relatively intact, with a basic quality rating of Grade IV to V
Table 3. Stiffness and damping of the equivalent SDOF system in the training set.
Numberk (kN/mm)c (kN·s/mm)
1500.08
2200.06
3300.1
4900.09
58800.07
59300.05
60600.08
Average value520.069
Table 4. Vertical frequencies and modes of buildings near the metro line.
Vertical ModePeriod/sFrequency/Hz
1st Order1.910.52
2nd Order1.740.57
3rd Order1.270.79
4th Order0.541.85
Table 5. Comparison of maximum vibration values at measurement points N2 and N6.
FloorCategoryPoint N2Point N6
Maximum
Acceleration (m/s2)
Maximum Frequency-Weighted Vibration Level (dB)Maximum
Acceleration (m/s2)
Maximum Frequency-Weighted Vibration Level (dB)
1FMeasured Value0.0735107.230.0943109.49
Simulated Value0.0715104.080.0924108.31
Relative Error2.72%2.94%2%1.07%
9FMeasured Value0.0453102.120.0735107.23
Simulated Value0.0450100.490.0712105.04
Relative Error0.66%1.6%3%2.04%
18FMeasured Value0.033398.950.0644104.17
Simulated Value0.032398.550.0637103.08
Relative Error3%0.4%1%1.04%
Disclaimer/Publisher’s Note: The statements, opinions and data contained in all publications are solely those of the individual author(s) and contributor(s) and not of MDPI and/or the editor(s). MDPI and/or the editor(s) disclaim responsibility for any injury to people or property resulting from any ideas, methods, instructions or products referred to in the content.