Article

Towards Sustainable Greenhouse Design: A Numerical Study on Temperature Control in Multi-Span Hoop Structures

School of Engineering & Technology, Central Queensland University, Bundaberg Campus, Branyan 4670, QLD, Australia
*
Author to whom correspondence should be addressed.
Sustainability 2025, 17(19), 8712; https://doi.org/10.3390/su17198712
Submission received: 13 August 2025 / Revised: 19 September 2025 / Accepted: 24 September 2025 / Published: 28 September 2025

Abstract

A greenhouse with properly managed temperature can provide 5 to 10 times greater yield than conventional methods for crops such as blueberries, cucumbers, and tomatoes; the yield is also of higher quality. However, existing designs in Australia often follow practices developed for cooler regions, making them less effective under local high-radiation conditions. To determine the design parameters for the local condition, this study develops and validates a numerical model of a commercial blueberry greenhouse, applying it to examine how structural parameters, including overall height, arch height, and number of spans, influence indoor temperature distribution in multi-span hoop structures. Results show that increasing greenhouse height by 0.40 m reduced average temperature by up to 0.62%, whereas raising arch height by the same increment led to a marginal increase of 0.15%. In contrast, expanding span numbers from 2 to 12 resulted in a maximum temperature difference of 6 °C (approximately 20% above ambient temperature) across the structure, posing significant risks to plant growth. These findings provide a theoretical basis for optimising design parameters that minimise heat stress while reducing reliance on fossil-fuel-based cooling. The study highlights how tailoring greenhouse design to local conditions can improve productivity and support both environmental and economic sustainability.

1. Introduction

Greenhouses, typically constructed with translucent materials, allow sunlight penetration to create a controlled environment for crop growth [1]. With proper regulation of internal conditions, yields can increase significantly compared to open-field farming [2]. These structures not only extend the growing season and protect plants from harsh weather but also shield them from pests, reducing losses. Today, more than 100 countries utilise greenhouses for large-scale crop production, underscoring their significant global role in meeting food demand [3]. This study focuses on a hoop-type structure commonly used for blueberry production in Australia. Blueberries are one of the growing horticultural crops in the country, and their cultivation increasingly relies on protected environments to manage temperature stress in hot climates. The widespread adoption reflects their ability to maintain favourable growing environments, sometimes with the aid of external heating or cooling [4,5].
The effectiveness of greenhouses depends on several microclimatic parameters, including solar radiation, temperature, humidity, and CO2 concentration [6,7]. Alongside these, structural design aspects such as the number of spans, the overall shape, the choice of cladding material, and orientation play a crucial role in regulating ventilation and temperature distribution within the structure [8,9]. Identifying the optimal configuration of these parameters is especially important in hot climates, where excessive temperatures can directly limit crop productivity.
Greenhouses provide stable growing conditions year-round and safeguard crops from unfavourable weather, enabling consistent yields [10,11]. Their internal climate, however, is sensitive to design choices, making structural optimisation a key factor in agricultural performance [8,9]. Previous studies have also investigated auxiliary thermal technologies, such as solar air heaters, which can contribute to heat during colder periods or assist in drying harvested crops [12,13,14]. In hotter regions, passive measures, particularly natural ventilation and shading, remain the most common and energy-efficient strategies for controlling temperature, although their effectiveness declines during extreme heat events [15,16,17]. Whereas the active systems, while more effective, depend on significant water and energy inputs and carry higher environmental impacts [18].
The relationship between food production and environmental constraints calls for integrated, sustainable solutions [19]. This means combining efficient cooling technologies with smart water management and energy optimisation, especially in harsh climates [20]. Active cooling can account for up to half of a greenhouse’s total energy use during summer months, and in hotter areas, demand may increase by as much as 70%, raising both costs and emissions [21]. Currently, all active greenhouse cooling systems rely on fossil fuels [22], contributing to greenhouse gas emissions and climate change [23]. As global temperatures rise, cooling requirements are expected to grow, creating a cycle of higher energy use to counteract the effects of climate change. Shifting to renewable power—through solar, wind, or geothermal systems—offers a path toward more sustainable cooling [24]. Integrating these resources with energy-efficient cooling designs can mitigate climate impacts while supporting long-term agricultural productivity. Nevertheless, barriers remain, including the intermittent nature of solar and wind energy [25] and the high upfront costs of installing renewable generation and storage technologies. Moreover, many greenhouses, especially in developing regions, lack access to advanced energy management and automation tools [26]. Overcoming these obstacles will require hybrid energy systems, improved storage options, and continued innovation in cooling efficiency to enable a cost-effective transition to renewable-powered greenhouse operations [27]. TRNSYS modeling has been shown to optimize renewable energy use in Australia [28], and recent studies on passive solar greenhouse models confirm that design optimization strongly affects temperature regulation and energy demand [29], which aligns with the focus of this study.
The importance and core challenge of a greenhouse is to control the internal environment—in hot climates, cooling energy consumption is the biggest challenge, so passive design is more sustainable than active systems—passive performance is mainly determined by geometric design parameters (shape, height, span, ventilation openings) and covering materials—however, for the specific climate in Queensland, Australia, research on how these parameters synergistically affect temperature distribution for multi span arched structures is not sufficient, lacking design optimization guidance—therefore, this study aims to explore the impact of shape, cladding material, span and ventilation parameters on temperature control through numerical simulation methods, in order to fill this gap.

1.1. Shape

The most commonly used shapes in greenhouse structures are rectangular, triangular, vinery, arch, and Quonset types. Sethi [30] conducted a comparison study on the above-mentioned greenhouse shapes. He observed that the uneven span greenhouse received maximum radiation from the selected shapes. Çakır and Şahin [31] considered multiple design parameters, length-to-width ratio, greenhouse azimuth angle and greenhouse orientation angle while investigating the greenhouse shape effect on solar energy gaining rates. He suggested that an elliptical-shaped greenhouse should be preferred for the Bayburt region. The above findings suggest that the shape selection of the greenhouse structure is also influenced by the coordinate location of the greenhouse.

1.2. Cladding Material

Solar radiation is essential for plants to undergo photosynthesis. Notably, short-wave radiation ranging from 0.4 to 0.7 μm and Photosynthetically Active Radiation (PAR) is vital for photosynthesis [8,32]. To enhance the crop plant yield, necessary PAR wavelengths must be transmitted through suitable cladding materials. Baxevanou, Fidaros [33] studied the effect of four different types of cladding materials, thermal polyethylene film (TPE), rose polyvinylchloride-based fluorescent (PVC), ethylene vinyl acetate film (EVA) and three-layer co-extruded film (3L) on temperature, air velocity and PAR at plant levels in a greenhouse. He concluded that EVA material offered satisfactory results from the tested treaties. Geoola, Kashti [34] compared the optical properties of anti-drop cladding materials and non-anti-drop cladding materials. He found that in dry weather conditions, non-anti-reflective cladding material had better light transmissivity compared to wet conditions. Cemek and Demir [35] investigated the optical properties of cladding materials with two main parameters under consideration: light transmissivity and condensation of water. Four different cladding materials—ultraviolet (UV)—stabilised polyethylene, polyethylene, infrared (IR)—absorbed polyethylene, and double-layer polyethylene films—were tested for a period of three months. His analysis revealed that simple polyethylene had a high degree of light transmittivity in dry conditions. However, when water condensation is factored, IR polyethylene material had better transmissivity. Research also shows that low-density polyethylene derivatives are predominantly used in greenhouse cladding materials due to their befitting optical properties and economic benefits [8,36,37].

1.3. Ventilation

The favourable microclimates developed inside a greenhouse structure provide a fillip for plant growth. The wind-driven natural ventilation process is one of the primary factors influencing microclimates within a greenhouse. The ambient air entering the greenhouse through windows, air vents, and other openings, driven by air pressure differences, wind speed, and temperature differences, is called a natural ventilation process [8,38]. Many greenhouse structures utilise a natural ventilation system to create the microclimates necessary for plant growth [39,40,41]. Unlike those equipped with heating and cooling systems, the natural ventilation process is highly beneficial, with zero energy consumption, low installation costs, and minimal maintenance [42]. Li, Huang [43] studied the effect of the natural ventilation process on the microclimates of a single-span greenhouse. He observed that the natural ventilation process lowered the indoor air temperature from 28.90 °C to 25.80 °C and the relative humidity from 96% to 84%. Therefore, he concluded that the natural ventilation process is a suitable system for creating the required microclimates for plant growth. In another study, the effect of ventilation design and layout was studied by Espinoza, Lopez [44]. A three-span greenhouse was selected for this study, featuring a moderate airflow arrangement design that extends into the adjacent spans. Their study concluded that ventilation design and layout diametrically influence the airflow patterns inside the greenhouse structure.

1.4. Spans

The number of spans in a greenhouse structure significantly influences the process of microclimate development and air ventilation rates in each span [45,46]. Studies conducted by Baeza, Pérez-Parra [47] and Espinoza, Lopez [44] show that the rate of air ventilation diminishes with an increase in span numbers in a greenhouse structure. He compared the ventilation rates of a greenhouse with 2, 3, 5, 7, 10, and 15 spans. Upon increasing the span numbers, they observed a significant drop in the ventilation rates for spans positioned at the far end on the air exit side.
A significant and core challenge of a greenhouse is controlling the internal environment. In hot climates, cooling energy consumption is the primary challenge, making passive design a more sustainable option than active systems. Passive performance is primarily determined by geometric design parameters (shape, height, span, and ventilation openings) and the type of covering materials. Existing studies do not place much emphasis on designing for local weather conditions in Queensland, Australia. However, for this specific climate condition, research on how these parameters synergistically affect temperature distribution for multi-span arched structures is not sufficient, lacking design optimisation guidance. Therefore, this study aims to investigate the impact of structural parameters, including overall height, arch height, and number of spans, on temperature control through numerical simulation methods, enabling future studies to utilise the data in achieving design optimisation of the multi-span greenhouse.

2. Materials and Methods

2.1. Greenhouse Structure and Design

To investigate the proposed objective, a numerical equation-based software simulation model is developed in this study. The dimensional parameters of the greenhouse are adapted from the greenhouse structures available at a private farm in Bundaberg, Australia. A hoop-type structure with two spans is selected for experimental data collection in this study. The dimensional data of the selected span structures is provided in Table 1. The greenhouse with the longer span is named Hoop 1, and the shorter structure is referred to as Hoop 2. The greenhouse structures were oriented north–south (at −24.92° Latitude, 152.28° longitude, 47 m altitude) on the east coast of Australia. The cladding material used in these structures is a low-density polycarbonate material with a thickness of 4 mm. The front and back facings of the greenhouse are concealed with cladding material, whereas the side facings of a greenhouse are either open to the abutting span or ambient atmosphere for airflow. Figure 1a,b show the thermocouples installed in the greenhouse structures to measure the temperature for experimental purposes. These thermometers are positioned at the centre of Hoop 1 and Hoop 2 structures for a balanced measurement, and then directly linked to a data logger to record the readings. Table 2 presents further details on the experimental data collected from the test site.
The thermocouples were calibrated prior to installation using a standard water bath method. The sensors had an accuracy of ±0.1 °C and a response time of less than 5 s, ensuring reliable capture of temperature variations within the greenhouse.

2.2. TRNSYSModel

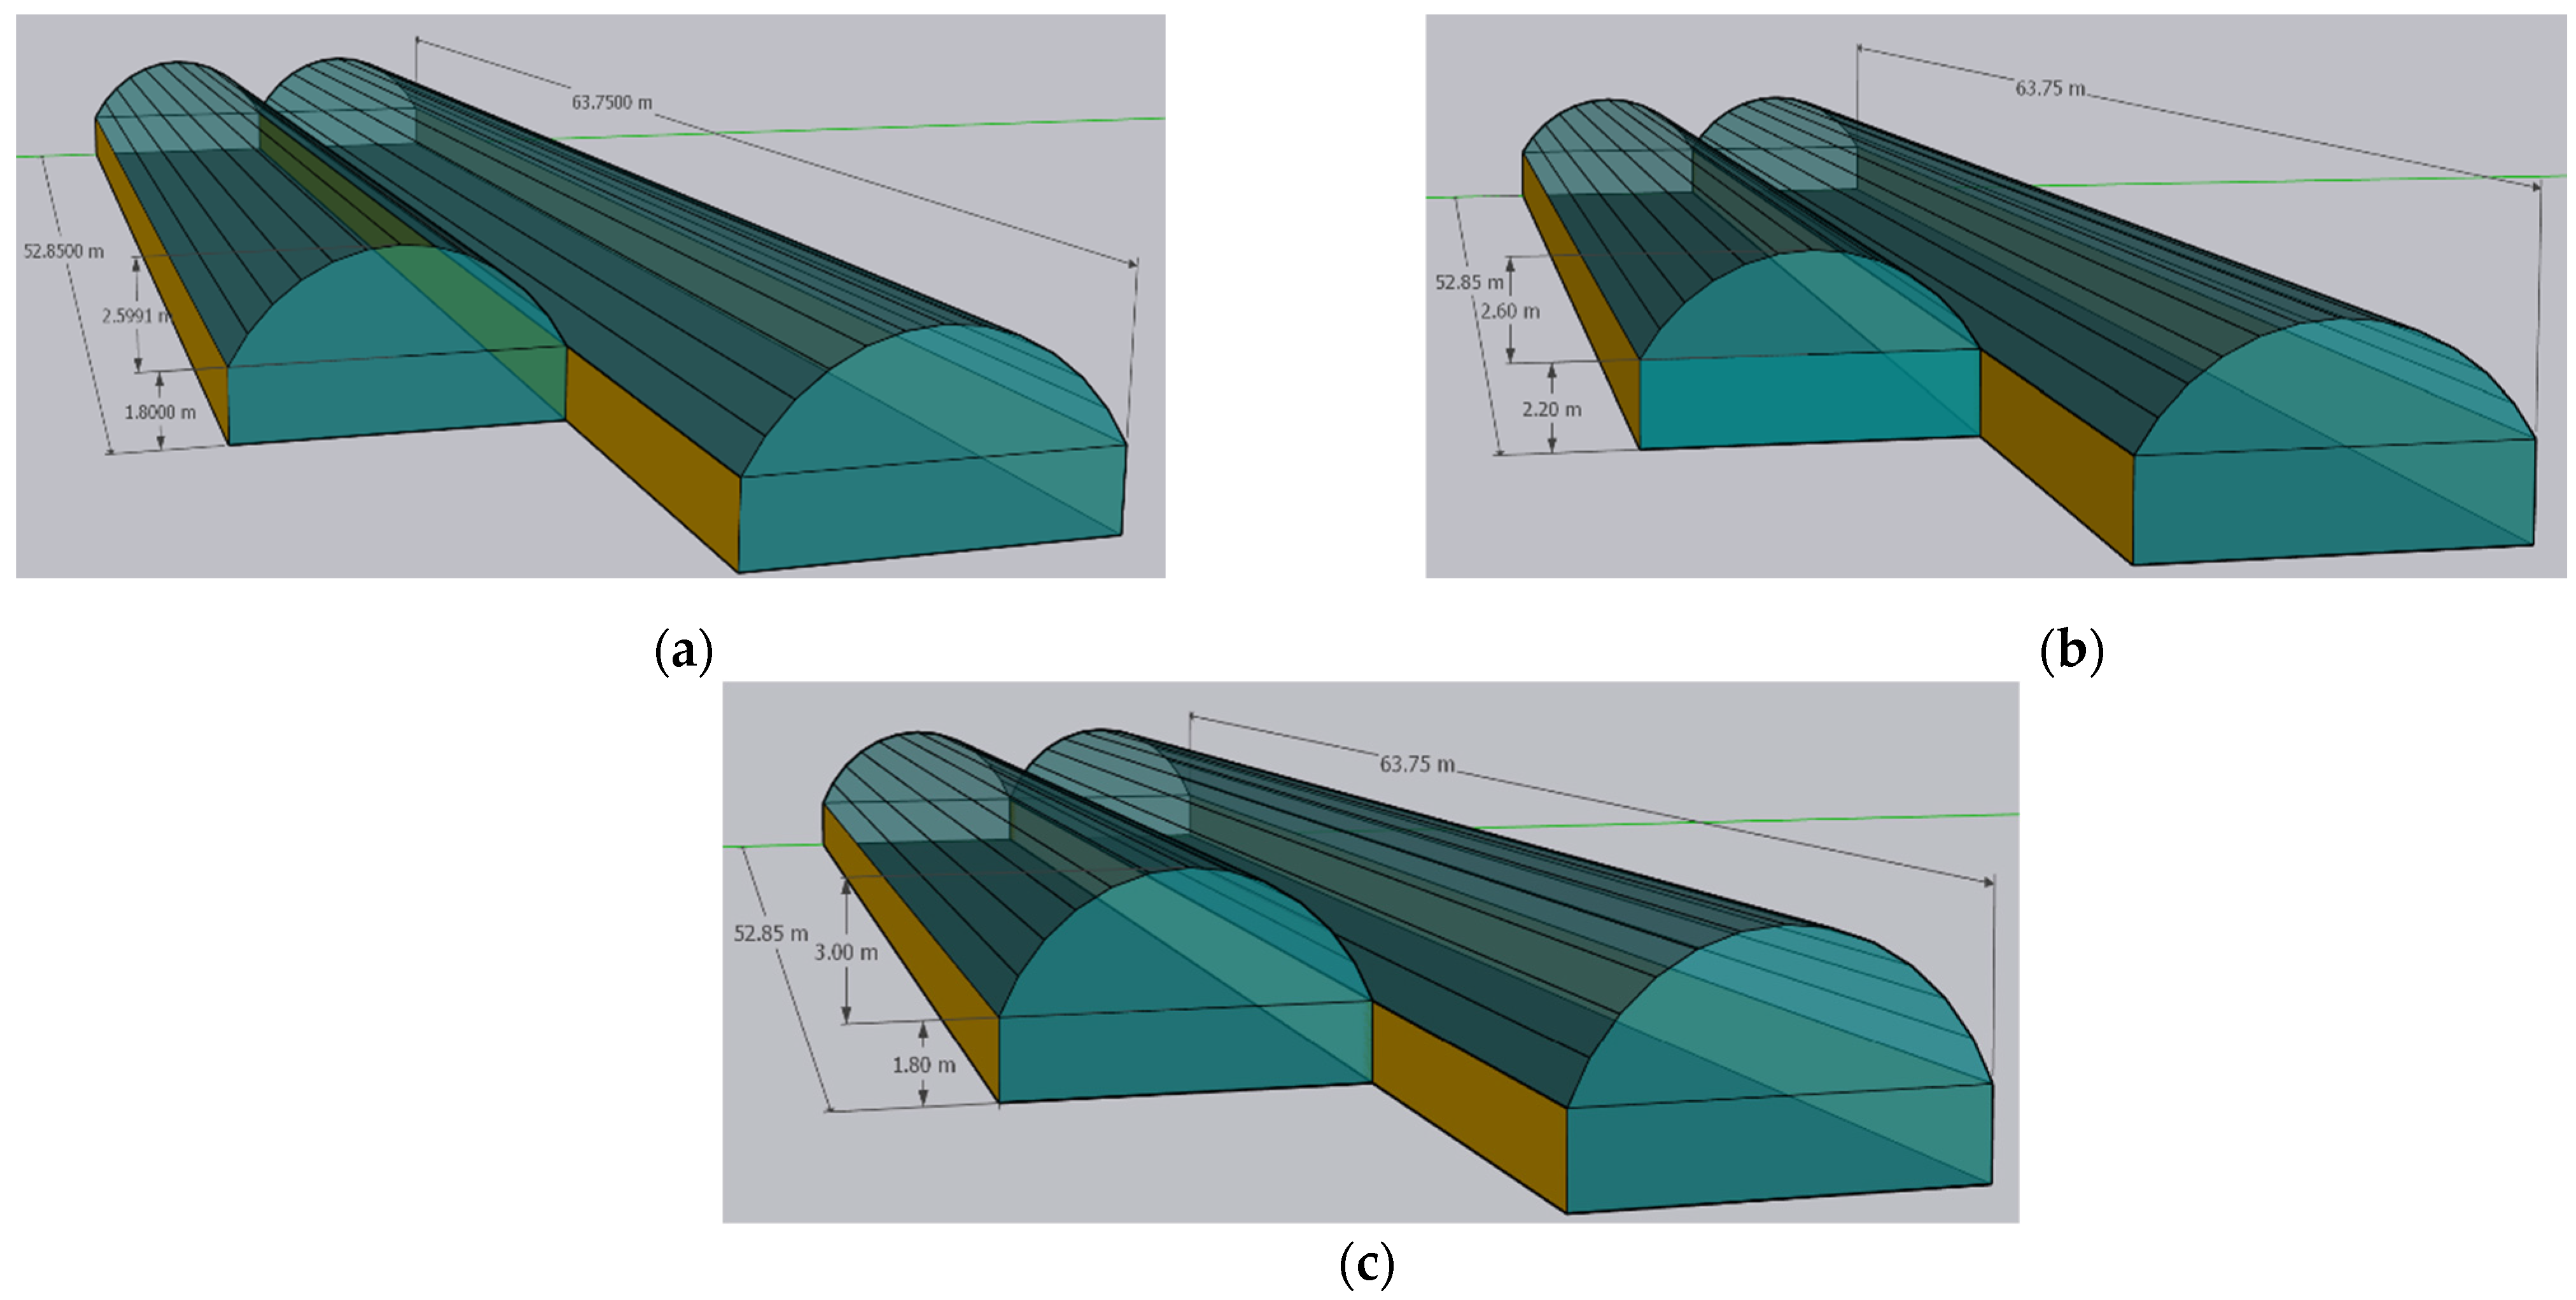
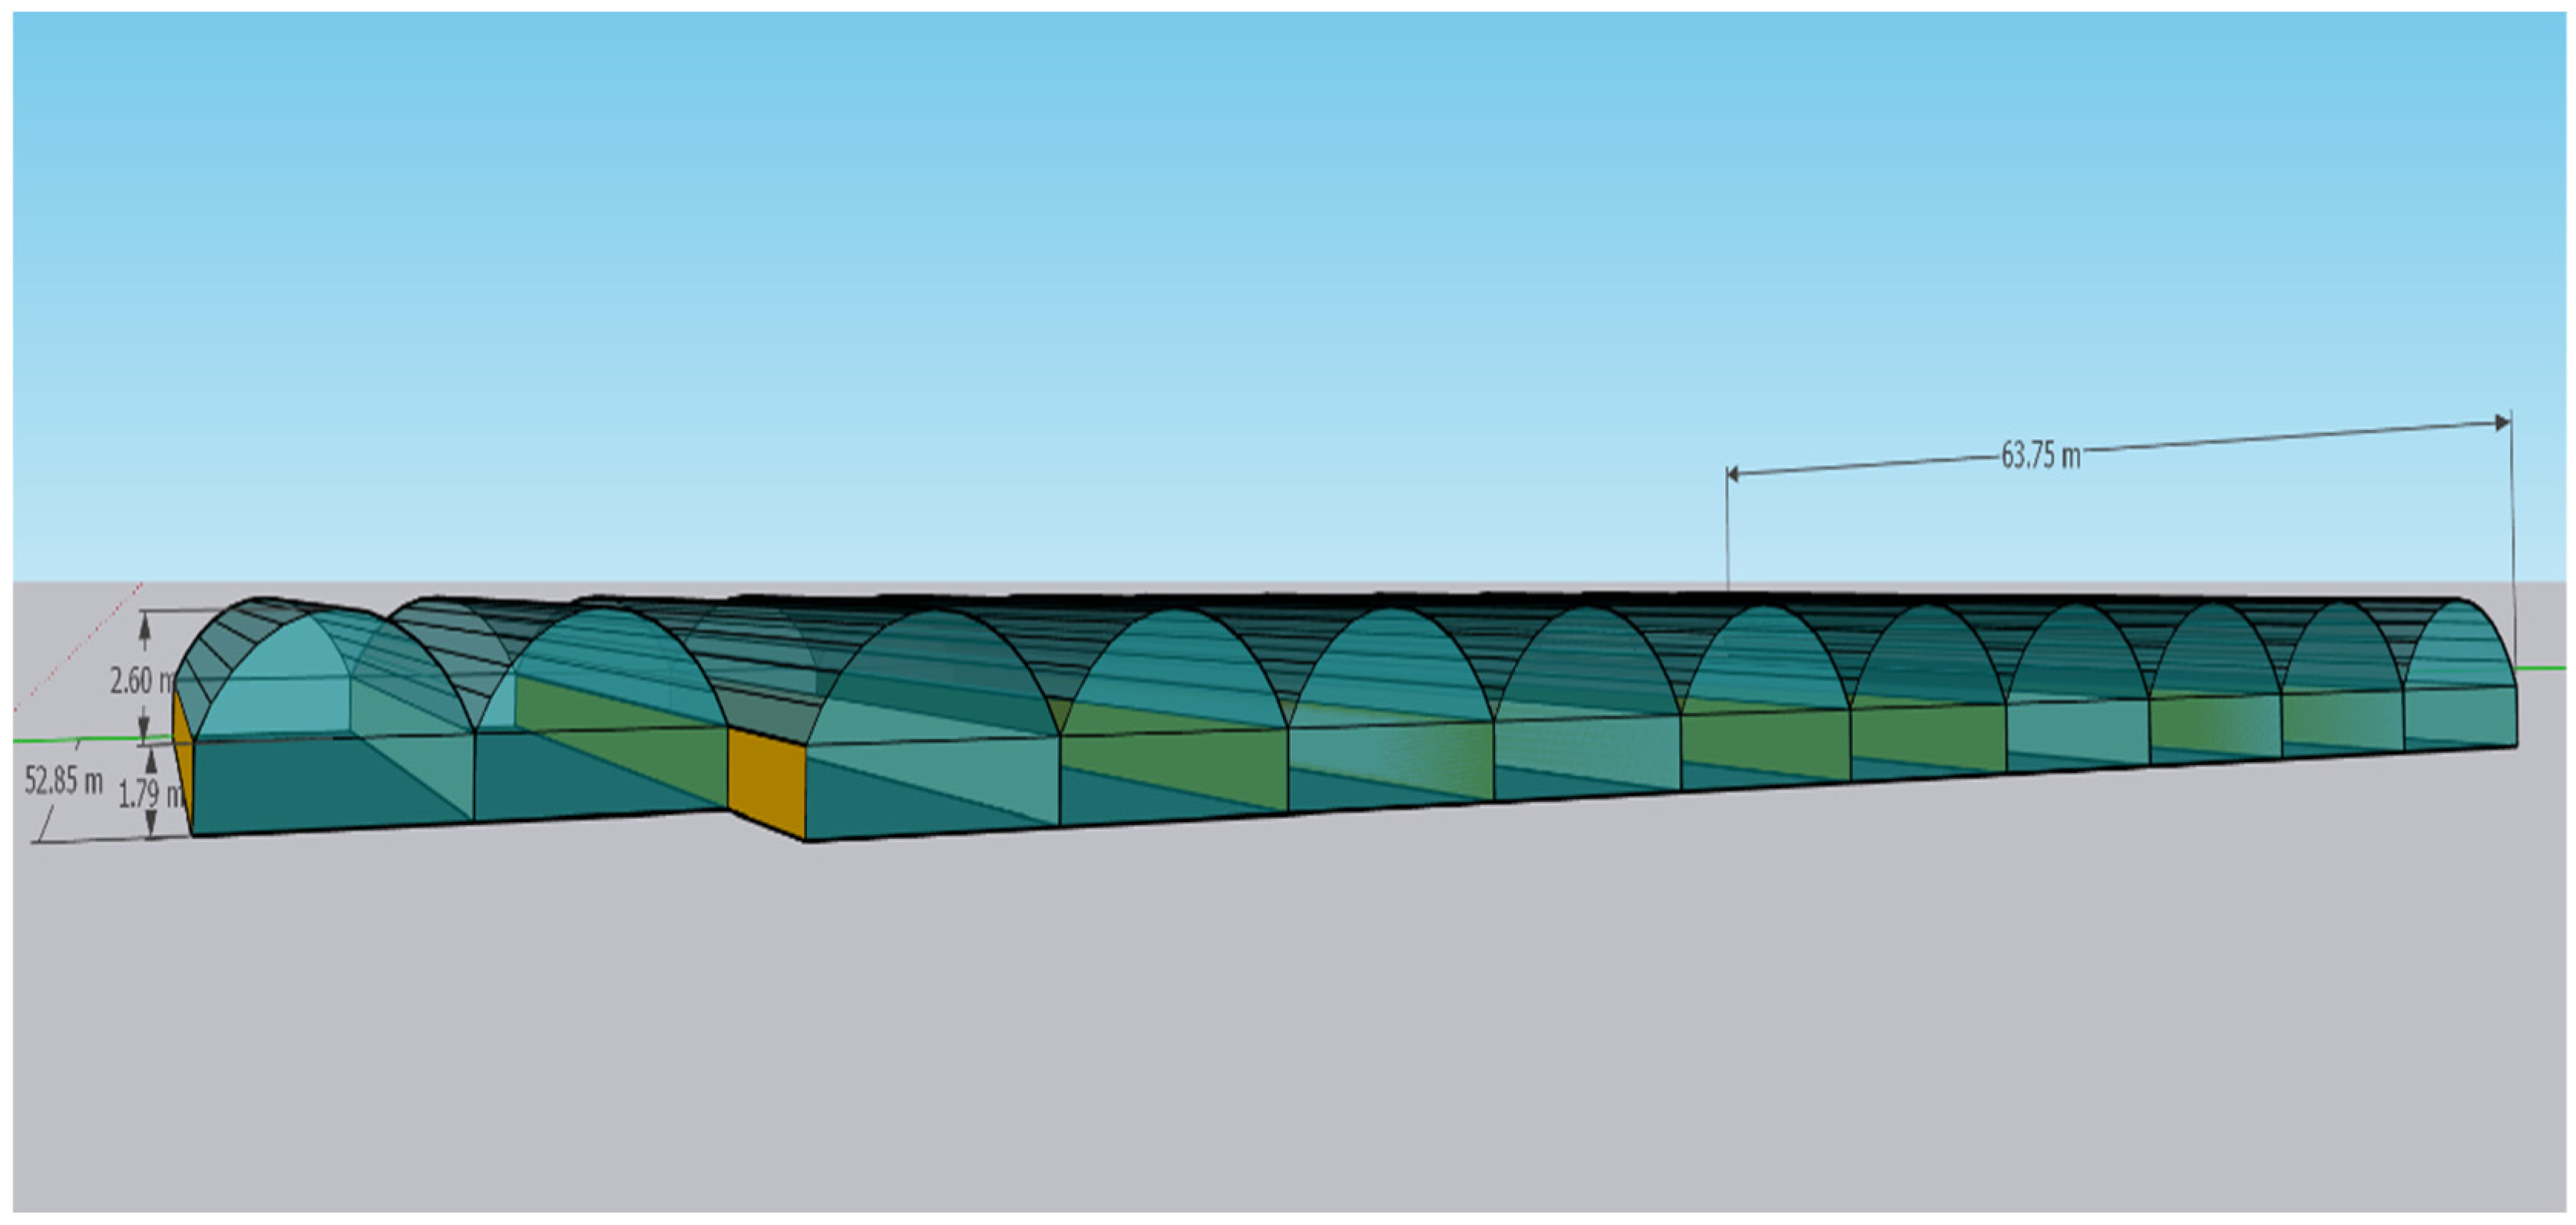
The numerical model developed using TRNSYS version 18 in this study investigated three different design parameters of the multi-span greenhouse structure. The parameters considered for investigation are greenhouse height, greenhouse arch height and span numbers. The proposed models are designed using Google SketchUp 20217 version, based on the dimensional data provided in Table 1. A total of four different types of greenhouse models are considered. The first model (Model 1) is designed according to the dimensions of the greenhouse experimental structure, and this design is used to validate the simulation model. The Model 1 design of the greenhouse is shown in Figure 2a. The second model (Model 2) is designed by increasing the greenhouse height by 0.4 m. The model 2 design of the greenhouse is shown in Figure 2b. The third model (Model 3) is designed by increasing the arch height of the greenhouse. The Model 3 greenhouse design is shown in Figure 2c. The fourth model (Model 4) is designed by adding adjacent spans from 2 to 12. The Model 4 design of the greenhouse is shown in Figure 3.
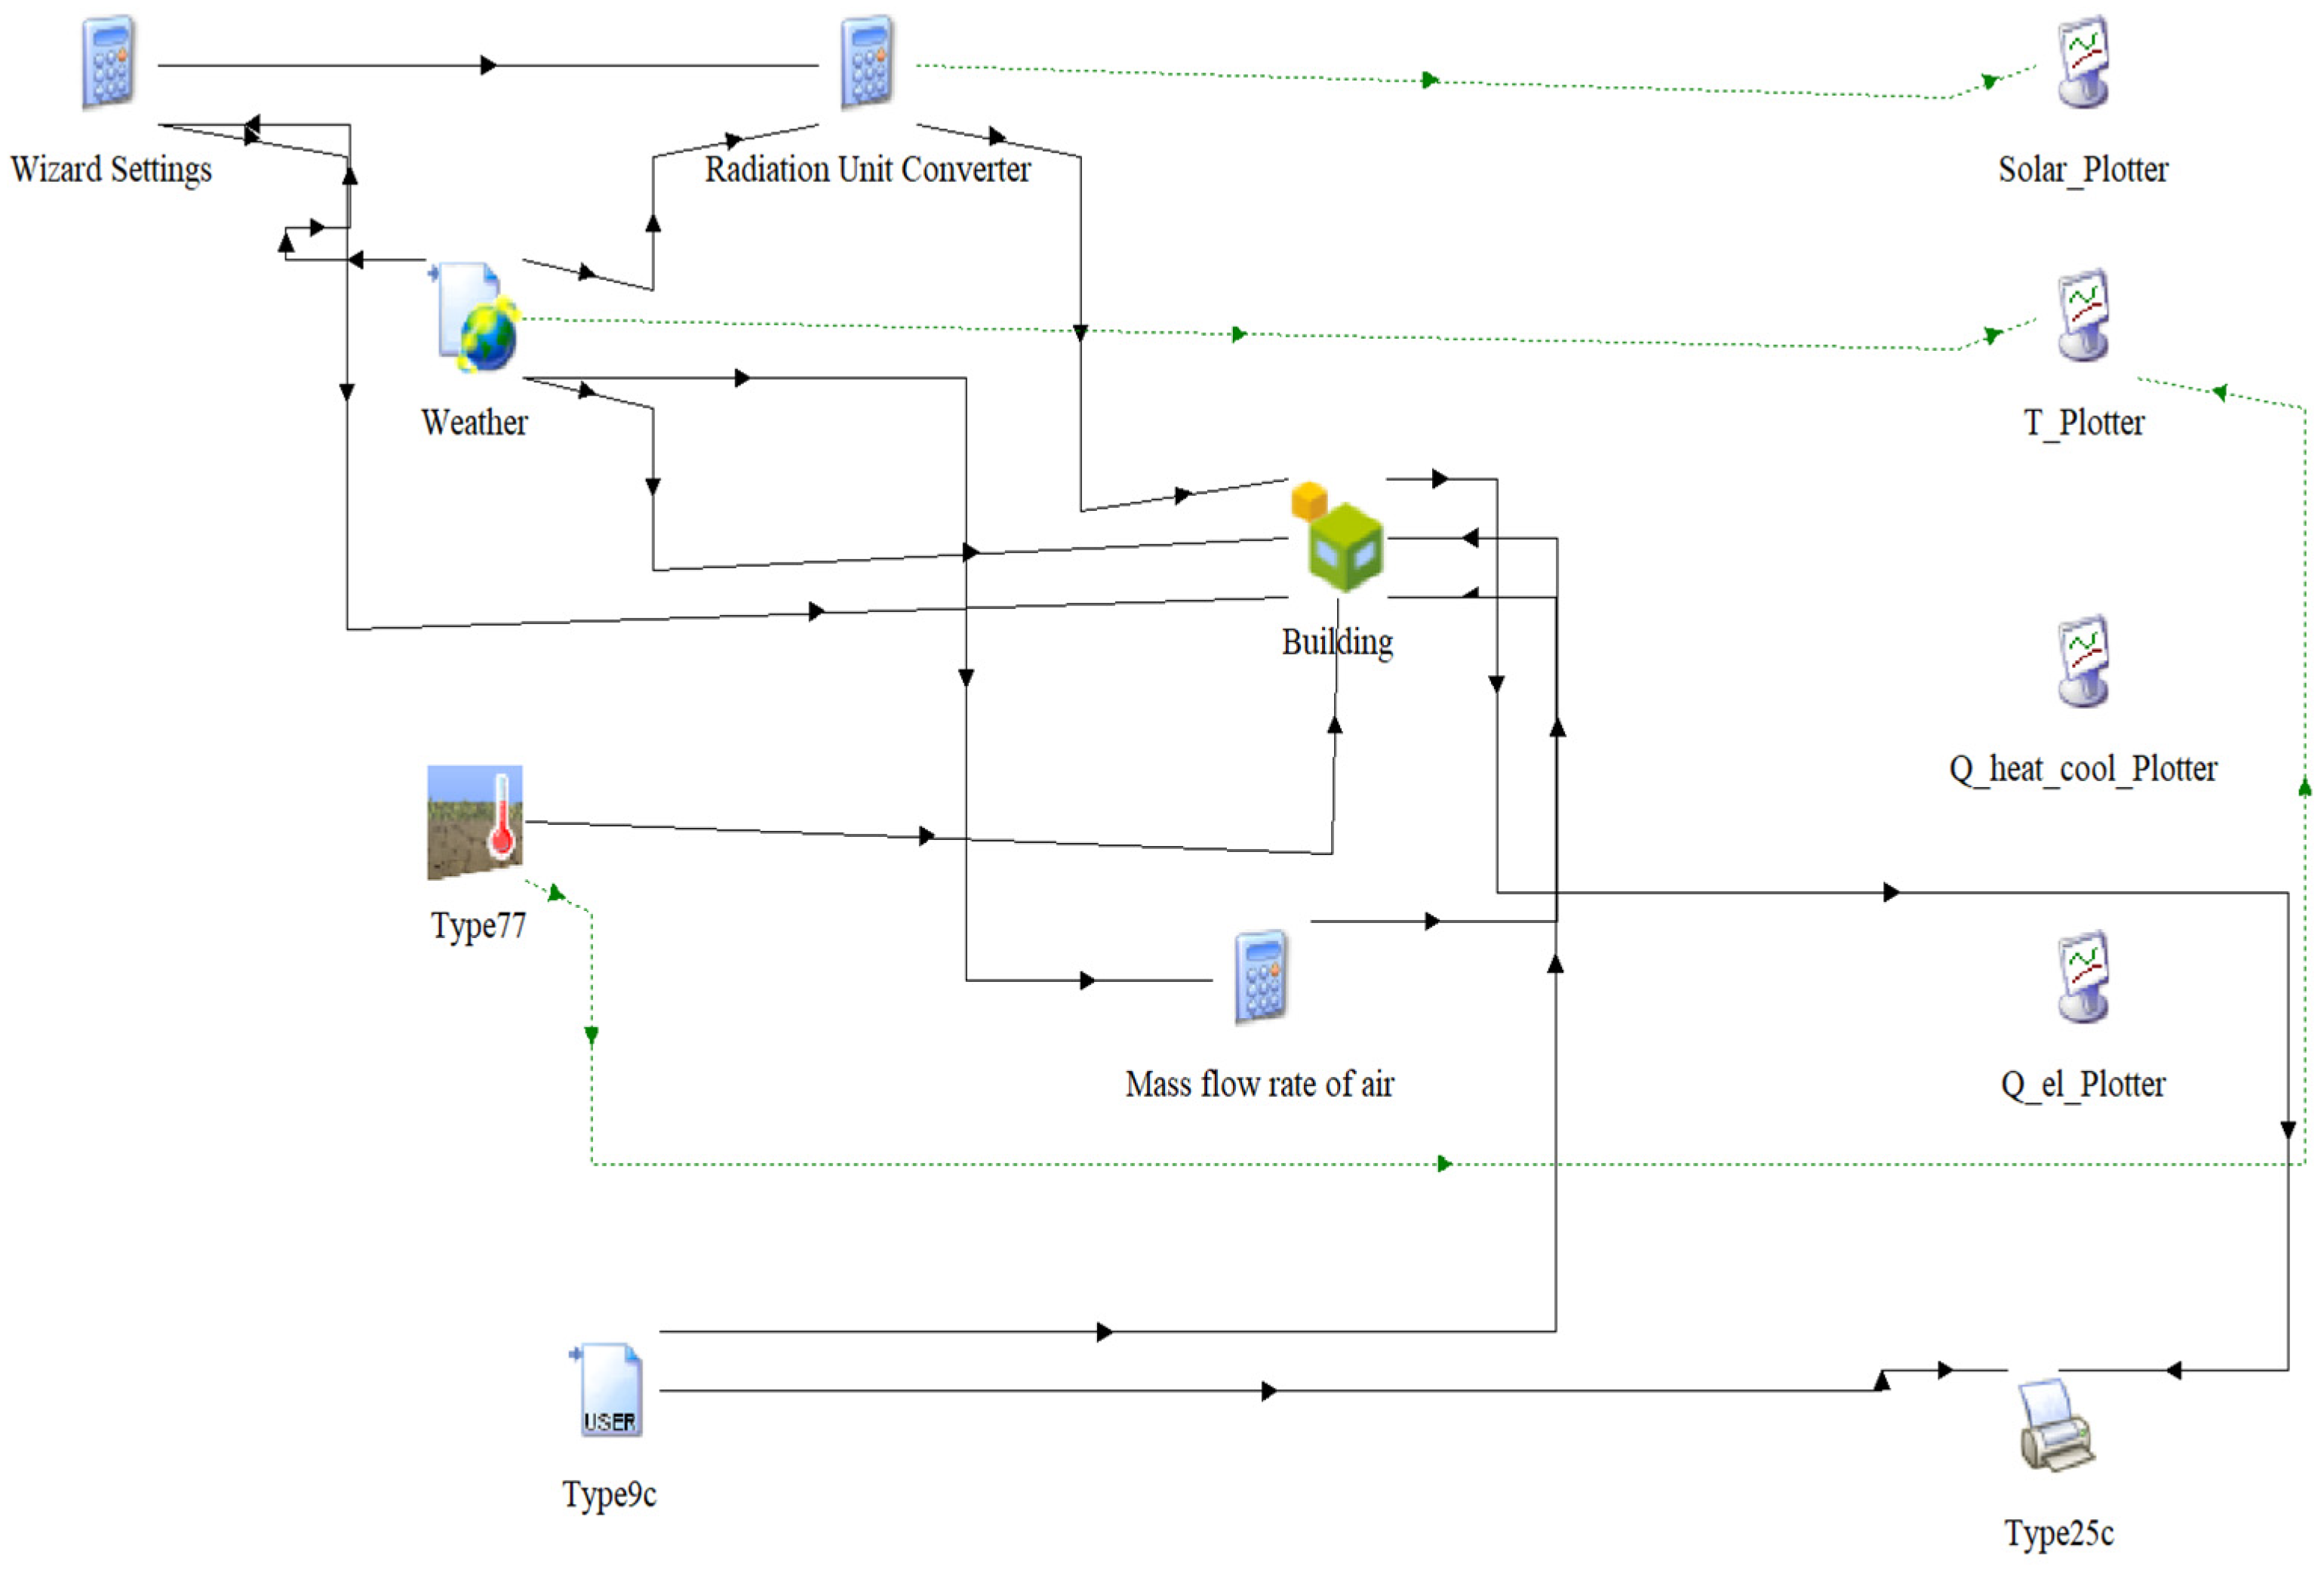
The construction material of the greenhouse structure is assigned as a glass window in SketchUp, and later, the properties are reassigned to polycarbonate material in TRNSYS 18 software. The polycarbonate covering used in the model exhibits a spectral transmittance in the photosynthetically active range of approximately 78–82%, a thermal conductivity of about 0.17–0.20 W m−1 K−1, and an emissivity ranging from 0.65 to 0.89 values drawn from established literature [48] on twin-wall polycarbonate performance. The designed 3D models are exported as TRNSYS-supported .idf files. Once the model is imported into the TRNSYS software, all the required input links are provided to the model, such as weather files (TYPE 15-6 and TYPE-9c), the mass flow rate of air (equation), and solar azimuth and zenith angles. The yearly weather data from the location is downloaded in the Meteonorm 8.0 software and uploaded into the TYPE 15-6 component. Experimentally measured ambient temperature data is uploaded into the TYPE 9c component, and the same data is used to validate the simulation Model 1 design. The complete design of the TRNSYS model is depicted in Figure 4.
The greenhouse model designs are parameterised with structural and site-specific conditions in the TRNBuild component of the TRNSYS software. TRNBuild component allows users to condition the thermal, structural and mechanical facets of the model. The cladding material, polycarbonate 4 mm single sheet, is imported from WINDOW 7.6 software and reconfigured into the window properties in the TRNBuild component. To create an air-flow channel for ambient air movement, a ventilation tool is utilised in the TRNBuild component. The ambient air entering the span is constantly moved into the abutting spans by activating the coupling effect. This movement of air in the spans is naturally driven by wind speeds. The mass flow rate of ambient air intake is calculated using the mass flow equation [49]:
ṁ = Cd·ρ·A·V
where ṁ is the mass flow rate of air (kg·s−1), ρ is the air density (kg·m−3), A is the effective opening area of the vent (m2), V is the wind velocity normal to the opening (m·s−1) and Cd is discharge coefficient (dimensionless, usually between 0.65 and 0.90 as found in ASHRAE and related standards).
The following Table 3 summarizes the key configuration aspects of TRNSYS Type 56, as described in the TRNSYS Multizone Building documentation [50]. It highlights the main parameters, inputs, and outputs relevant to greenhouse temperature control studies.

3. Model Validation

The developed TRNSYS Model 1 design is validated against on-site temperature data. A 24-h period of onsite data, including ambient temperature and temperature inside the greenhouse, was used to check for correspondence with simulation model temperatures. To condition the simulation model with the weather conditions of the experimental test site, the ambient data collected from the experimental site were provided to the TRNSYS software using the TYPE 9c component. The outputs from the TRNSYS Model 1 design are validated against the data collected from the experimental test site.
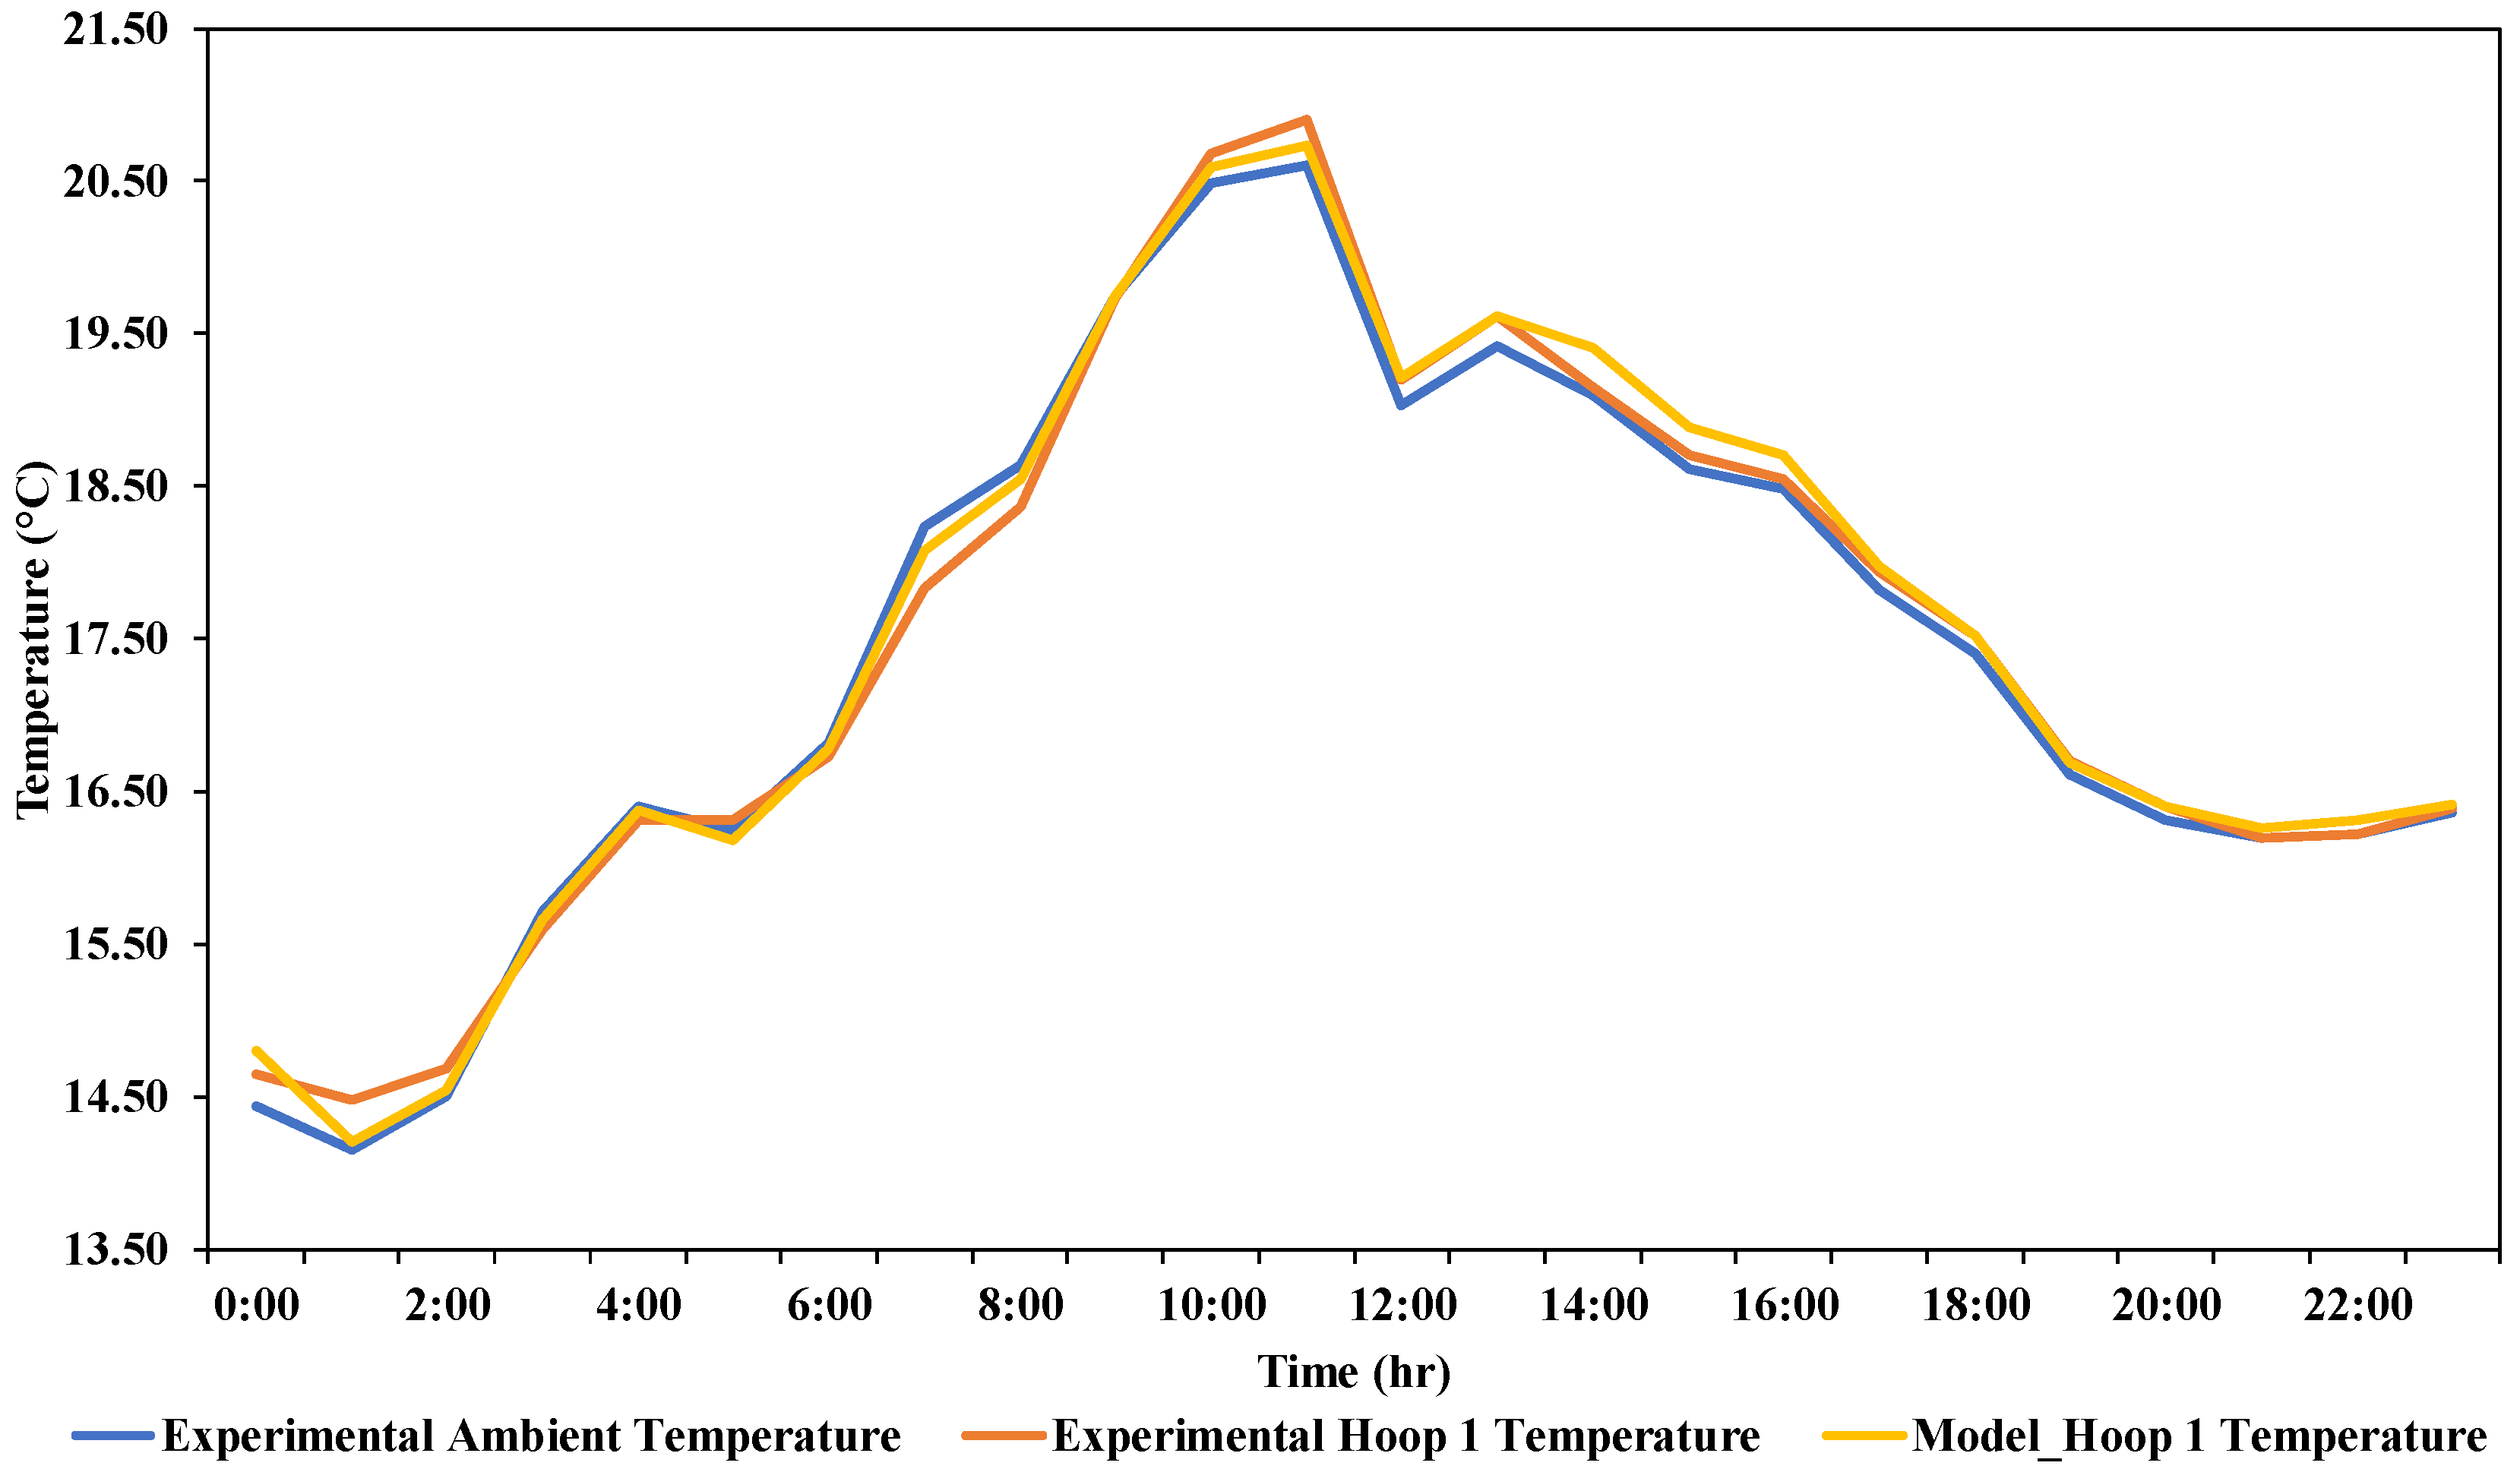
Table 2 shows that for both the simulation model and experimental-site greenhouses, the ambient airflow enters Hoop 1 and exits Hoop 2. Figure 5 shows the temperature data plotted for ambient air, Hoop 1 experimental and Hoop 1 simulation model. The graph shows that the temperature profiles developed in the Hoop 1 simulation model are in close agreement with the experimental data. In close observation, we can see that from 6:00 a.m. to 9:00 a.m., both experimental and simulation model temperatures rest below the ambient air. However, after 9:00 a.m., as the greenhouse structures receive increased solar radiation, the Hoop 1 experimental temperature rises above the ambient air, and a similar deviation is also observed for the temperature profiles of the Model 1 design. This correspondence between the experimental and simulation models shows that the output results of the model design, in further investigation, can output highly reliable data.
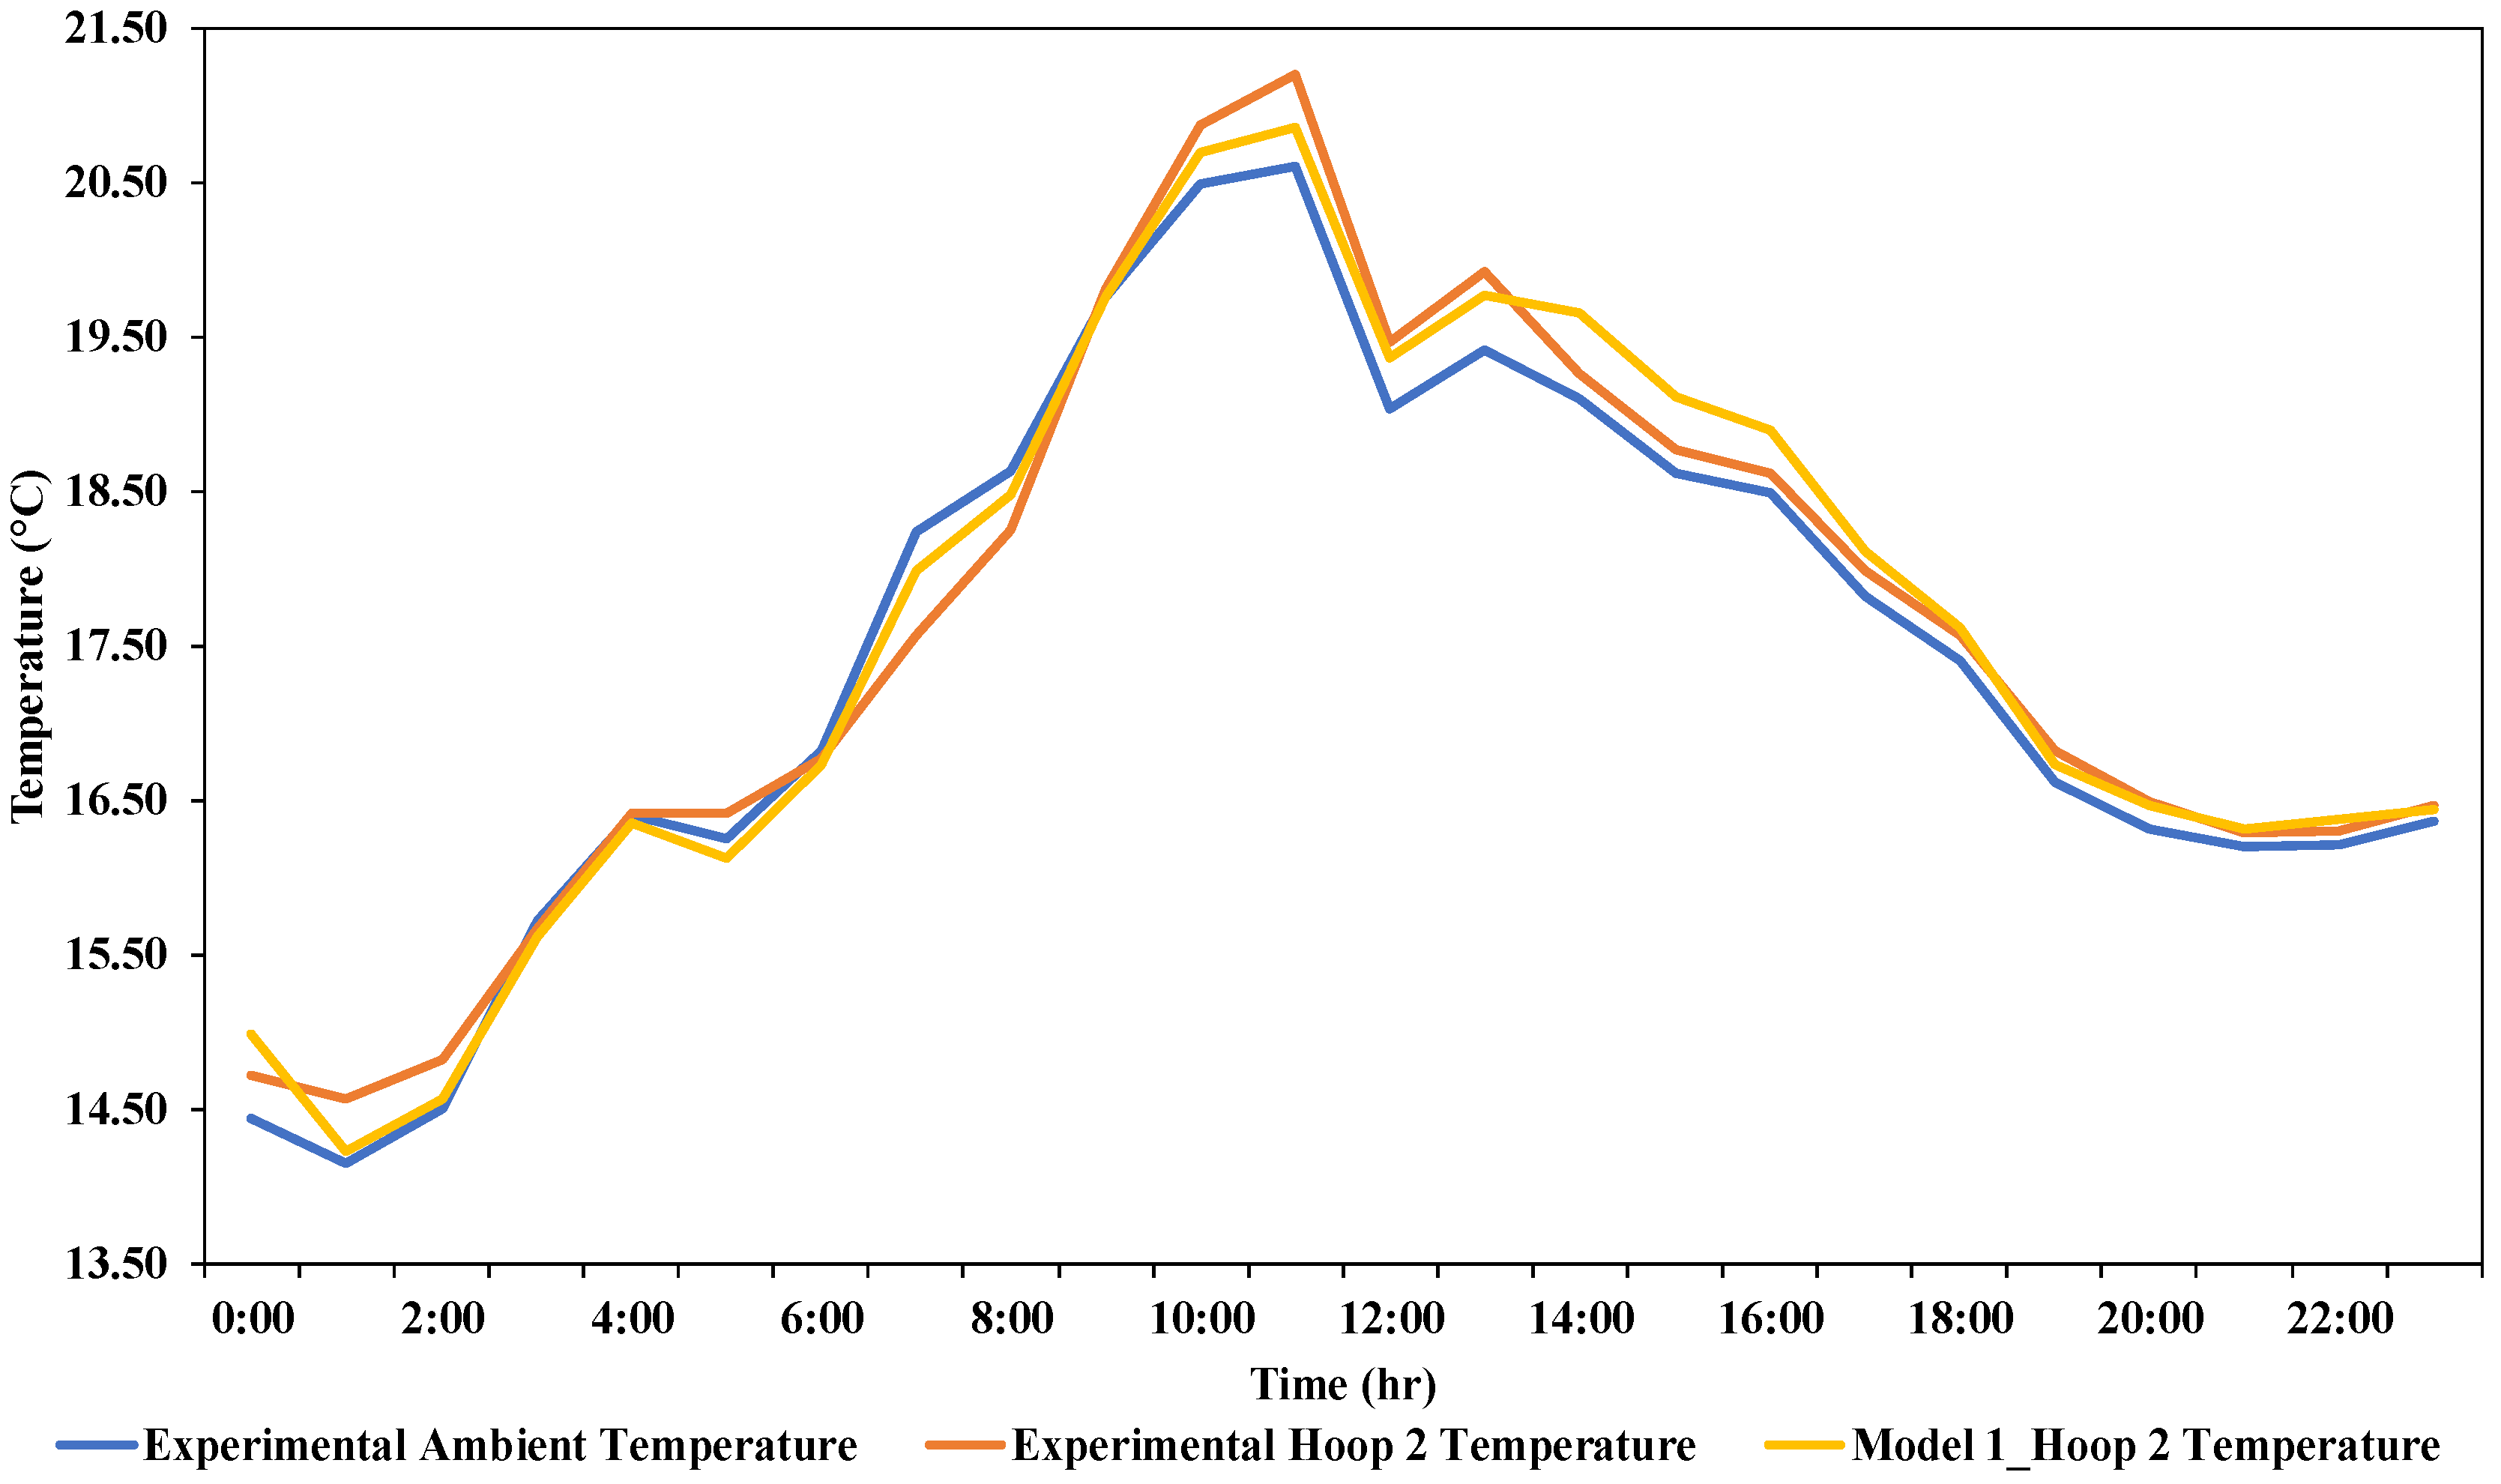
The graphical data presented in Figure 6 show the temperature profiles of ambient, experimental, and model simulations of the Hoop 2 structure. As observed earlier in the Hoop 1 data, the graphs for Hoop 2 follow a similar pattern. The Model 1 design temperature profile follows a very close agreement with the experimental measurements.

Error Analysis

To consolidate the model validation process, an error analysis approach was adapted in this study. Equation (2) represents the formula adapted for the error analysis formula taken from Jarimi, Abu Bakar [51] study.
R M S = 100 × X E x p X S i m X E x p 2 n
The root mean square (RMS) formula is used to measure the percentage deviation of simulation model results from the experimental data. A maximum percentage deviation of 2.3% was observed in both Hoop 1 and Hoop 2 from the experimental data, underscoring the accuracy and reliability of the simulation outputs. The comparison of simulation and experimental data shows good agreement in identifying how design parameters affect temperature patterns. While the magnitude of change differed slightly, the overall trends were consistent, supporting the reliability of the simulation outcomes.

4. Results and Discussion

After validating the simulation model, the considered design parameters of the greenhouse structure are investigated to analyse their effect on temperature profiles on the individual spans. To maintain a level test condition, all adapted design Models (1, 2, 3 and 4) are tested under the same weather settings. The differences observed in temperature control can be explained through underlying physical mechanisms rather than results alone. A taller greenhouse creates a larger vertical air column, which enhances buoyancy-driven ventilation and allows warm air to escape more efficiently. In contrast, increasing the number of spans reduces the effectiveness of cross-ventilation by extending airflow paths and limiting pressure differences across the structure, which causes greater heat retention. These outcomes reflect the interaction between solar radiation input, thermal storage within the structure, and the exchange of heat with the outside environment. In effect, the structural parameters modify the internal energy balance and airflow dynamics, resulting in the distinct temperature patterns observed in the simulations.

4.1. Greenhouse Height Increment

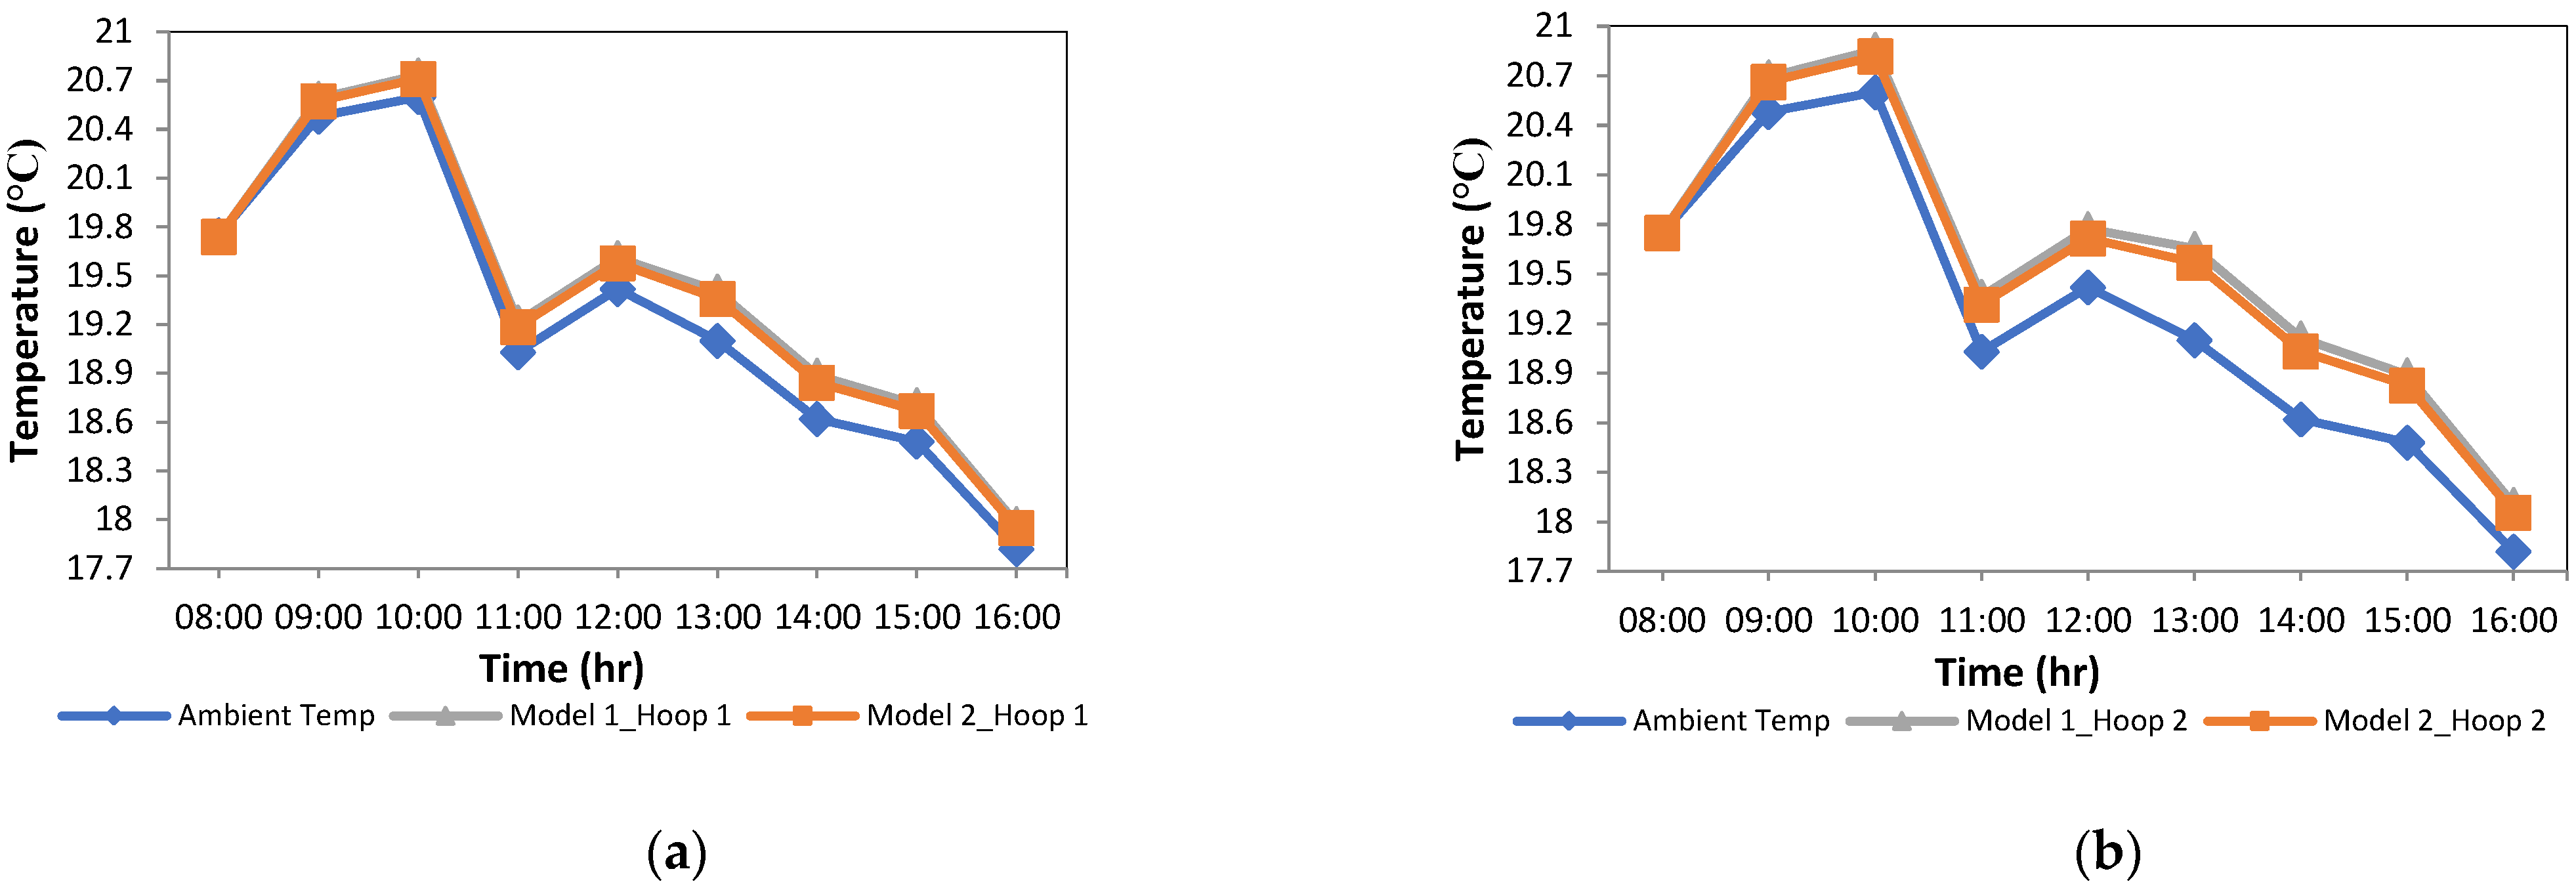
The height increment of the greenhouse structure is adapted in the Model 2 design of this study. The greenhouse height increment of 0.4 m from the base model is tested in this design. The number of spans and the airflow direction are maintained consistent with the base model design. After simulating the Model 2 design, the measured temperature levels of each span in the greenhouse structure are plotted in Figure 7. Figure 7a represents the temperature profiles of Hoop 1 structure in Model 1 and Model 2 design, whereas Figure 7b represents Hoop 2 temperature levels for the respective models. The results clearly indicate that increasing the greenhouse height for the Model 2 design resulted in a drop in temperature for both Hoop 1 and Hoop 2 structures compared to the Model 1 design. This drop in temperature level can be a result of increased ventilation rates in the greenhouse. Since the hoop undergoes wind-driven air ventilation through the side facing the greenhouse, an increment in height allows the hoop to draw more air into the structure. In addition to that, the ambient air temperature entering the span is lower than the indoor air. Collectively, the increased wind-driven ventilation rates and low ambient air temperature showed compounding effects in depleting the indoor air temperature levels of greenhouse structures.
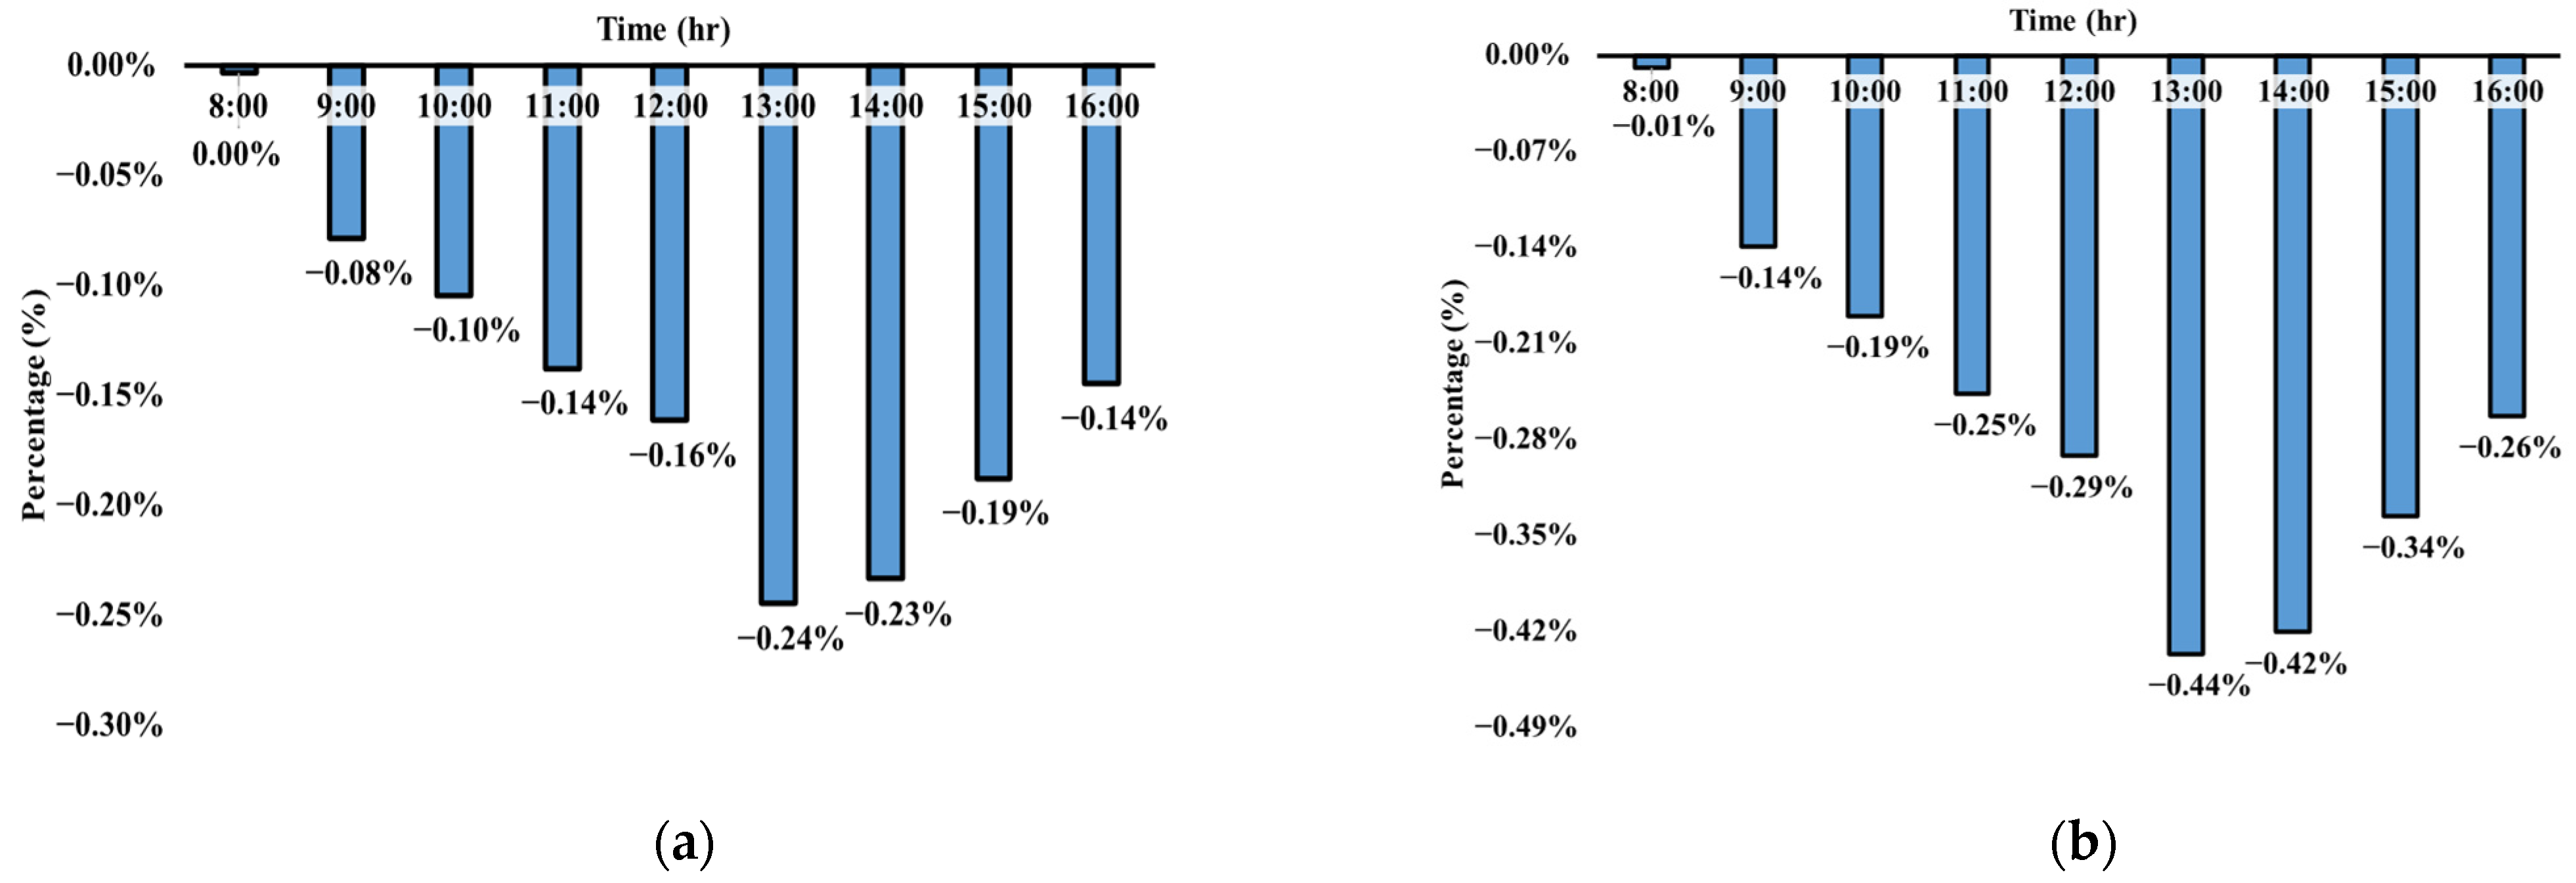
Figure 8a and Figure 8b represent the percentage difference in temperature levels between Model 1 and Model 2 designs of Hoop 1 and Hoop 2 structures, respectively. The results show that the maximum temperature difference is observed during the mid-time of the day at −0.24% for Hoop 1. As the indoor air travels from Hoop 1 to Hoop 2, the maximum percentage difference in temperature widens to −0.44% for the Hoop 2 structure. To expand the time period of data observation, a yearly analysis is performed by collecting the individual seasonal data. The maximum and average temperature difference observed in this analysis is tabulated in Table 4. Although the simulated temperature differences (−0.24% to −0.44%) may seem minor, even small shifts in greenhouse microclimate can significantly influence crop performance. Evidence shows that yield losses across major crops generally range from approximately 1% to 8% per 1 °C increase in temperature, depending on crop type and threshold effects [52]. Similarly, wheat varieties, including advanced breeding lines, have shown yield reductions of approximately 3–4% per 1 °C increase [53]. These findings suggest that even modest temperature variations, as observed in this study, can impact plant growth, stress tolerance, and energy demand. Therefore, the results remain significant for optimising greenhouse design and advancing sustainable production practices.
From the data presented, it can be observed that the peak percentage temperature difference occurs during the summer season and is lowest in the winter season. Table 4 data also shows that the average percentage difference in temperature for Hoop 1 and Hoop 2 structures is maximum in the spring season at −0.044% and 0.080%, respectively. However, the maximum percentage difference in temperature for Hoop 1 and Hoop 2 structures is highest in the winter season at −0.39% and −0.62%, respectively. This yearly analysis indicates that the decrease in temperature levels of hoop structures with an increase in greenhouse height remains consistent throughout the year in all seasons.

4.2. Greenhouse Arch Height Increment

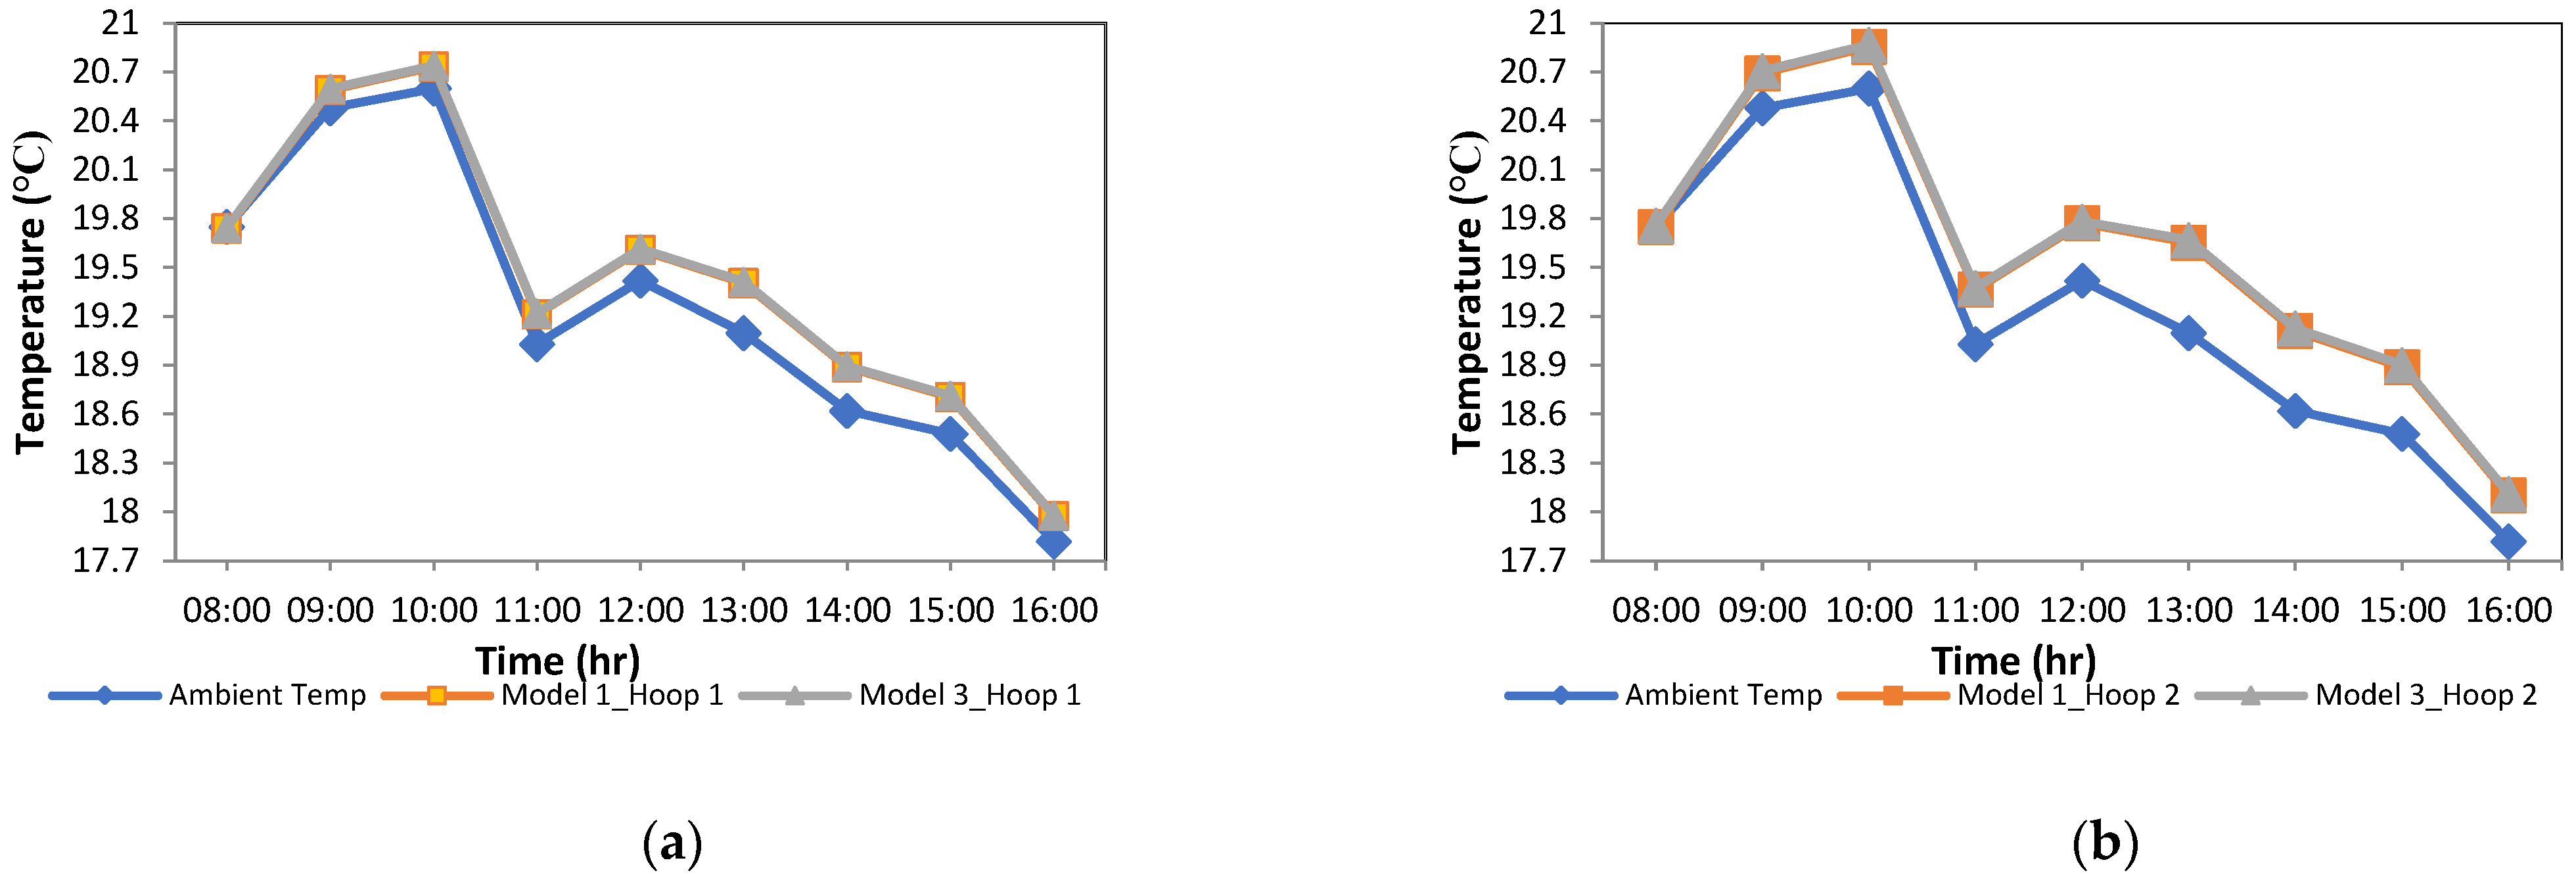
The greenhouse Model 3 design adapts the arch height increment characteristics with an increment of 0.4 m from the base model. The number of spans in this greenhouse and air ventilation rates remain consistent with the base model. One thing to note here is the rate of air ventilation, as the greenhouse arch height increment does not change the cross-sectional area for air intake, unlike the Model 2 design. Therefore, the air ventilation rates into the greenhouse remain unchanged with the Model 1 design. The temperature levels observed in the Hoop 1 and Hoop 2 structures of Models 1 and 3 are plotted in Figure 9a and Figure 9b, respectively. Figure 9a shows a marginal rise in indoor temperature levels of the Hoop 1 structure in comparison with the base model. The temperature levels of the Hoop 2 structure also follow a similar pattern, as shown in Figure 9b. The rise in indoor temperature levels can be directly associated with the amount of solar radiation received by the Hoop structures in the Model 3 design. The arch height increment expands the overall roof area, allowing the model to capture additional solar radiation compared to the Model 1 design. With the increase in solar radiation transmittance and unchanged air ventilation rates, it therefore raises the indoor air temperature levels within the hoop.
The percentage difference in temperature levels for hoop structures in the Model 3 design of the greenhouse is presented in Figure 10. As shown in Figure 10a and Figure 10b, the maximum temperature difference observed in Hoop 1 and Hoop 2 structures is 0.05% and 0.08%, respectively. Although the percentage difference in temperature levels between the Model 3 design and the Model 2 design is lower, this temperature difference does not fall into a negative figure, unlike the Model 2 design. The simulation indicated that increasing the arch height produced only marginal temperature differences (0.05–0.08%). These changes are close to the expected margin of numerical uncertainty and, therefore, less robust than the effects of greenhouse height or span number. Nonetheless, the results suggest that arch height exerts limited influence on thermal regulation compared to other structural parameters, highlighting that design optimisation should prioritise parameters with stronger impacts on temperature control.
The yearly analysis of the Model 3 design unveiled the percentage increment in span temperature for each season, and the results from this analysis are formulated in Table 5. The results show that the maximum average percentage difference in temperature for both Hoop 1 and Hoop 2 structures occurs during the winter season, at 0.0074% and 0.013%, respectively. The maximum percentage difference in temperature also occurs during the winter season, at 0.09% and 0.15% for Hoop 1 and 2 structures, respectively. The yearly analysis of the model shows that the percentage difference in temperature continues to remain a positive figure for all seasons.

4.3. Greenhouse with Increased Span Numbers

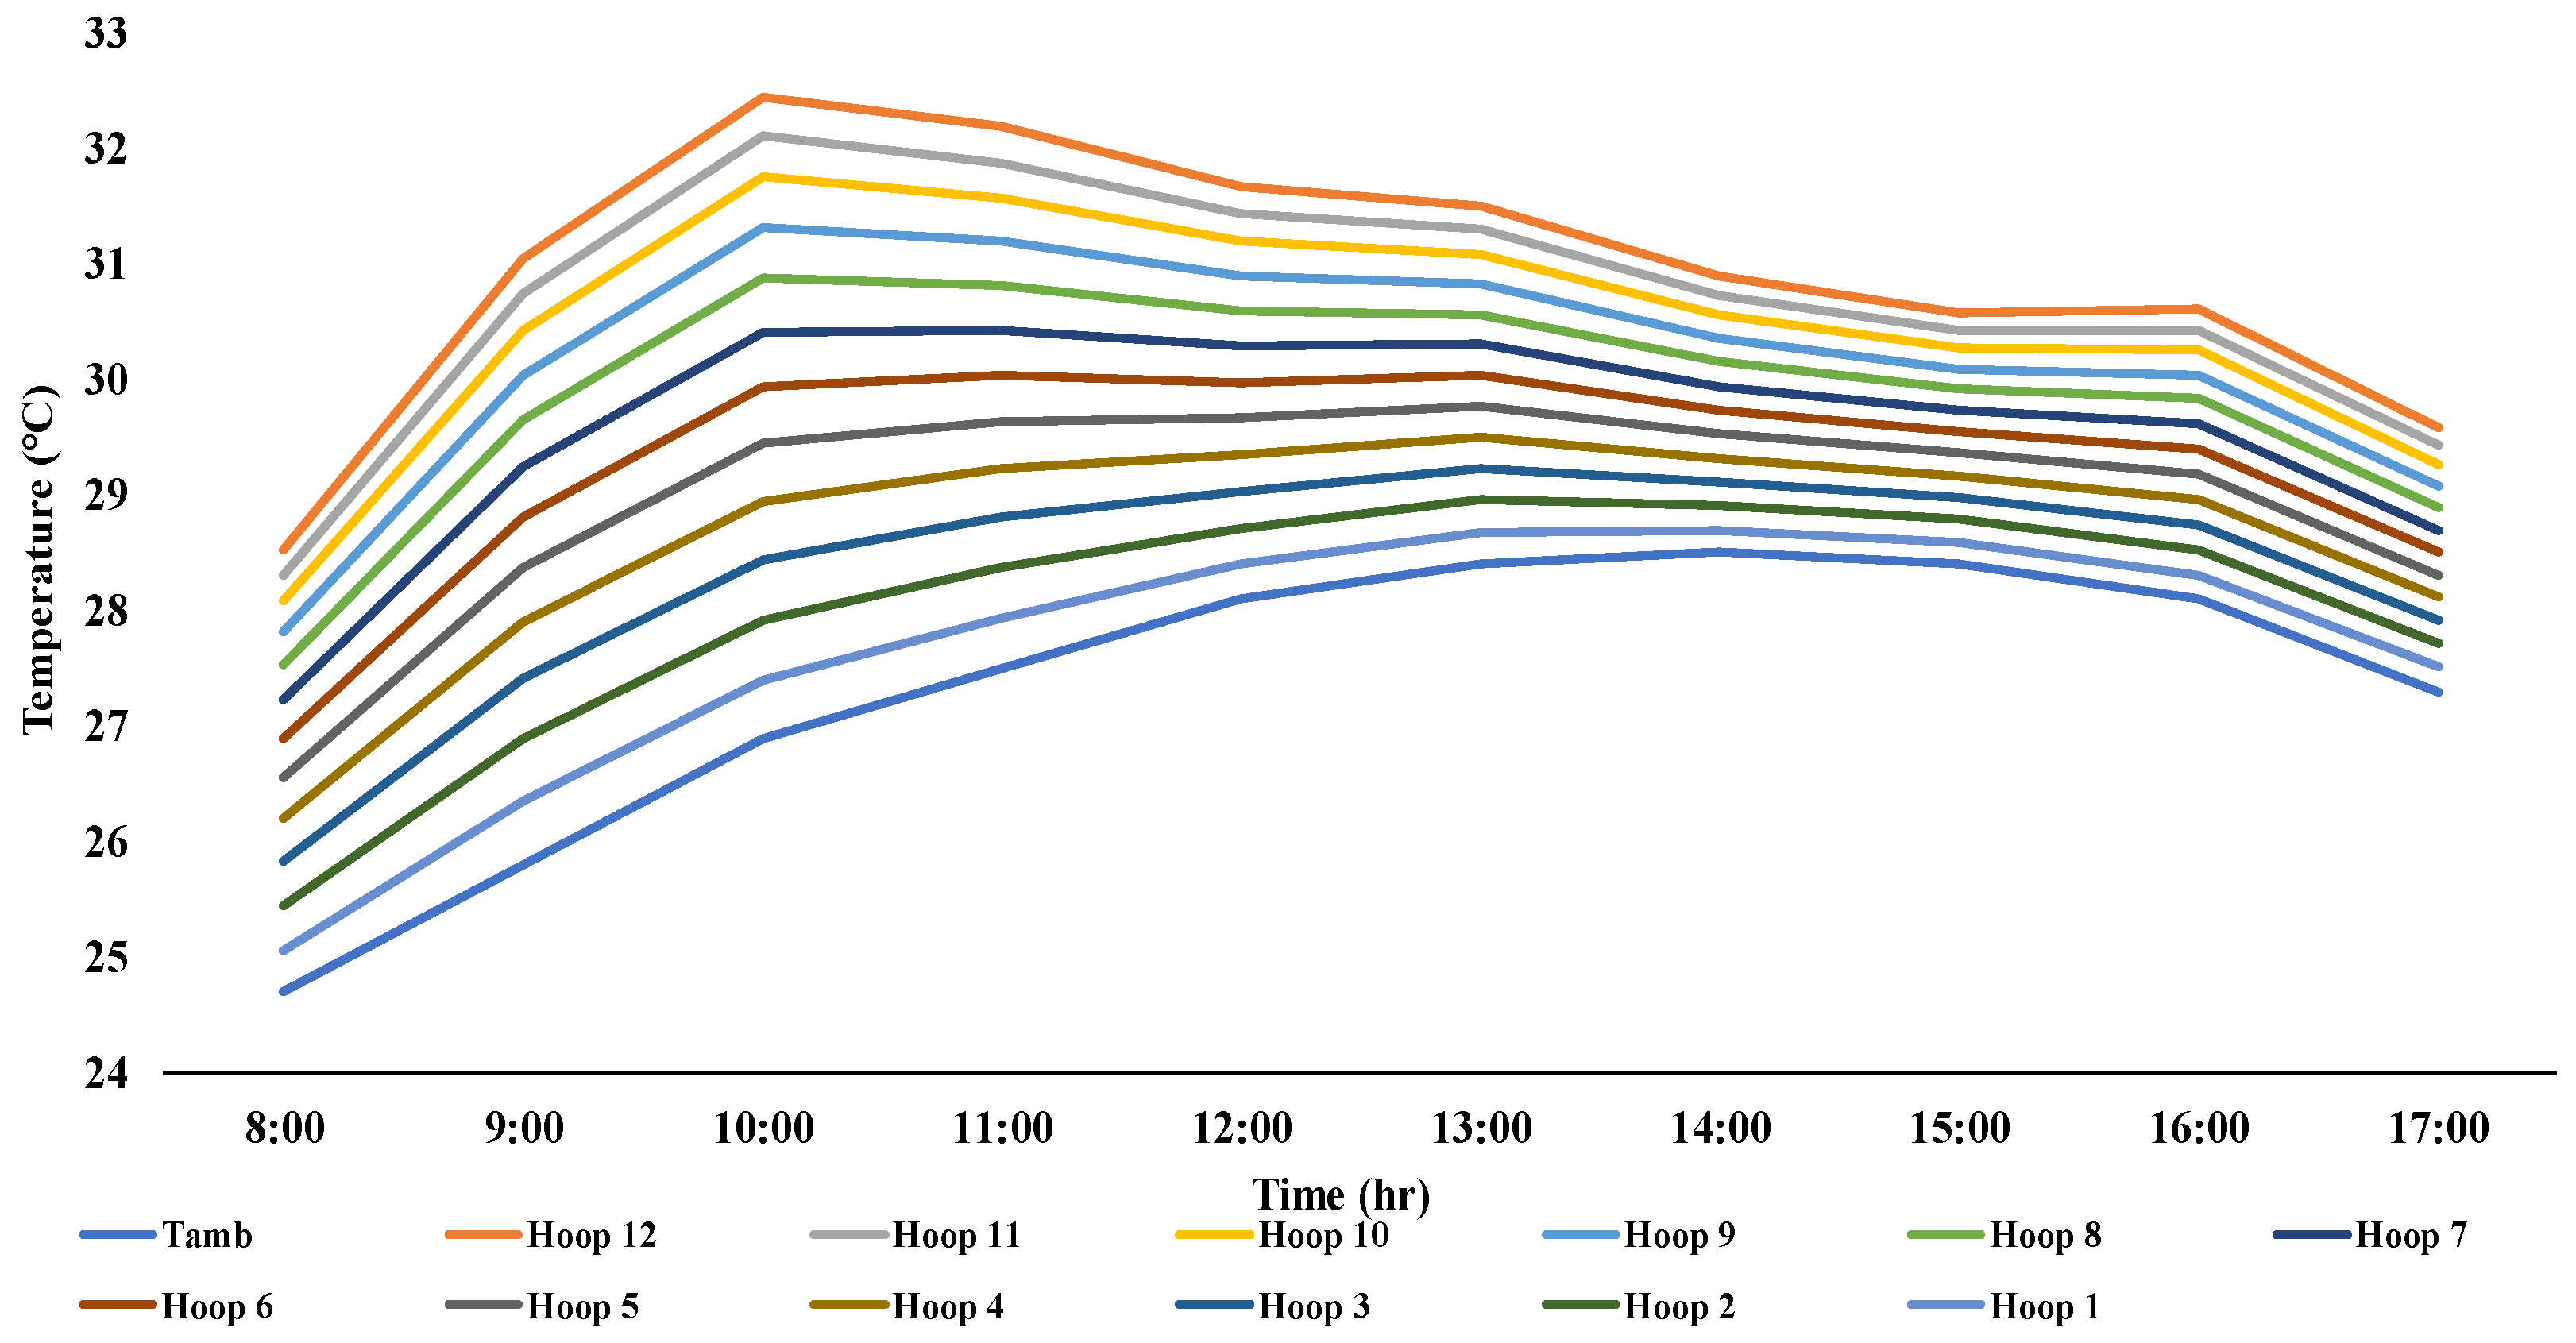
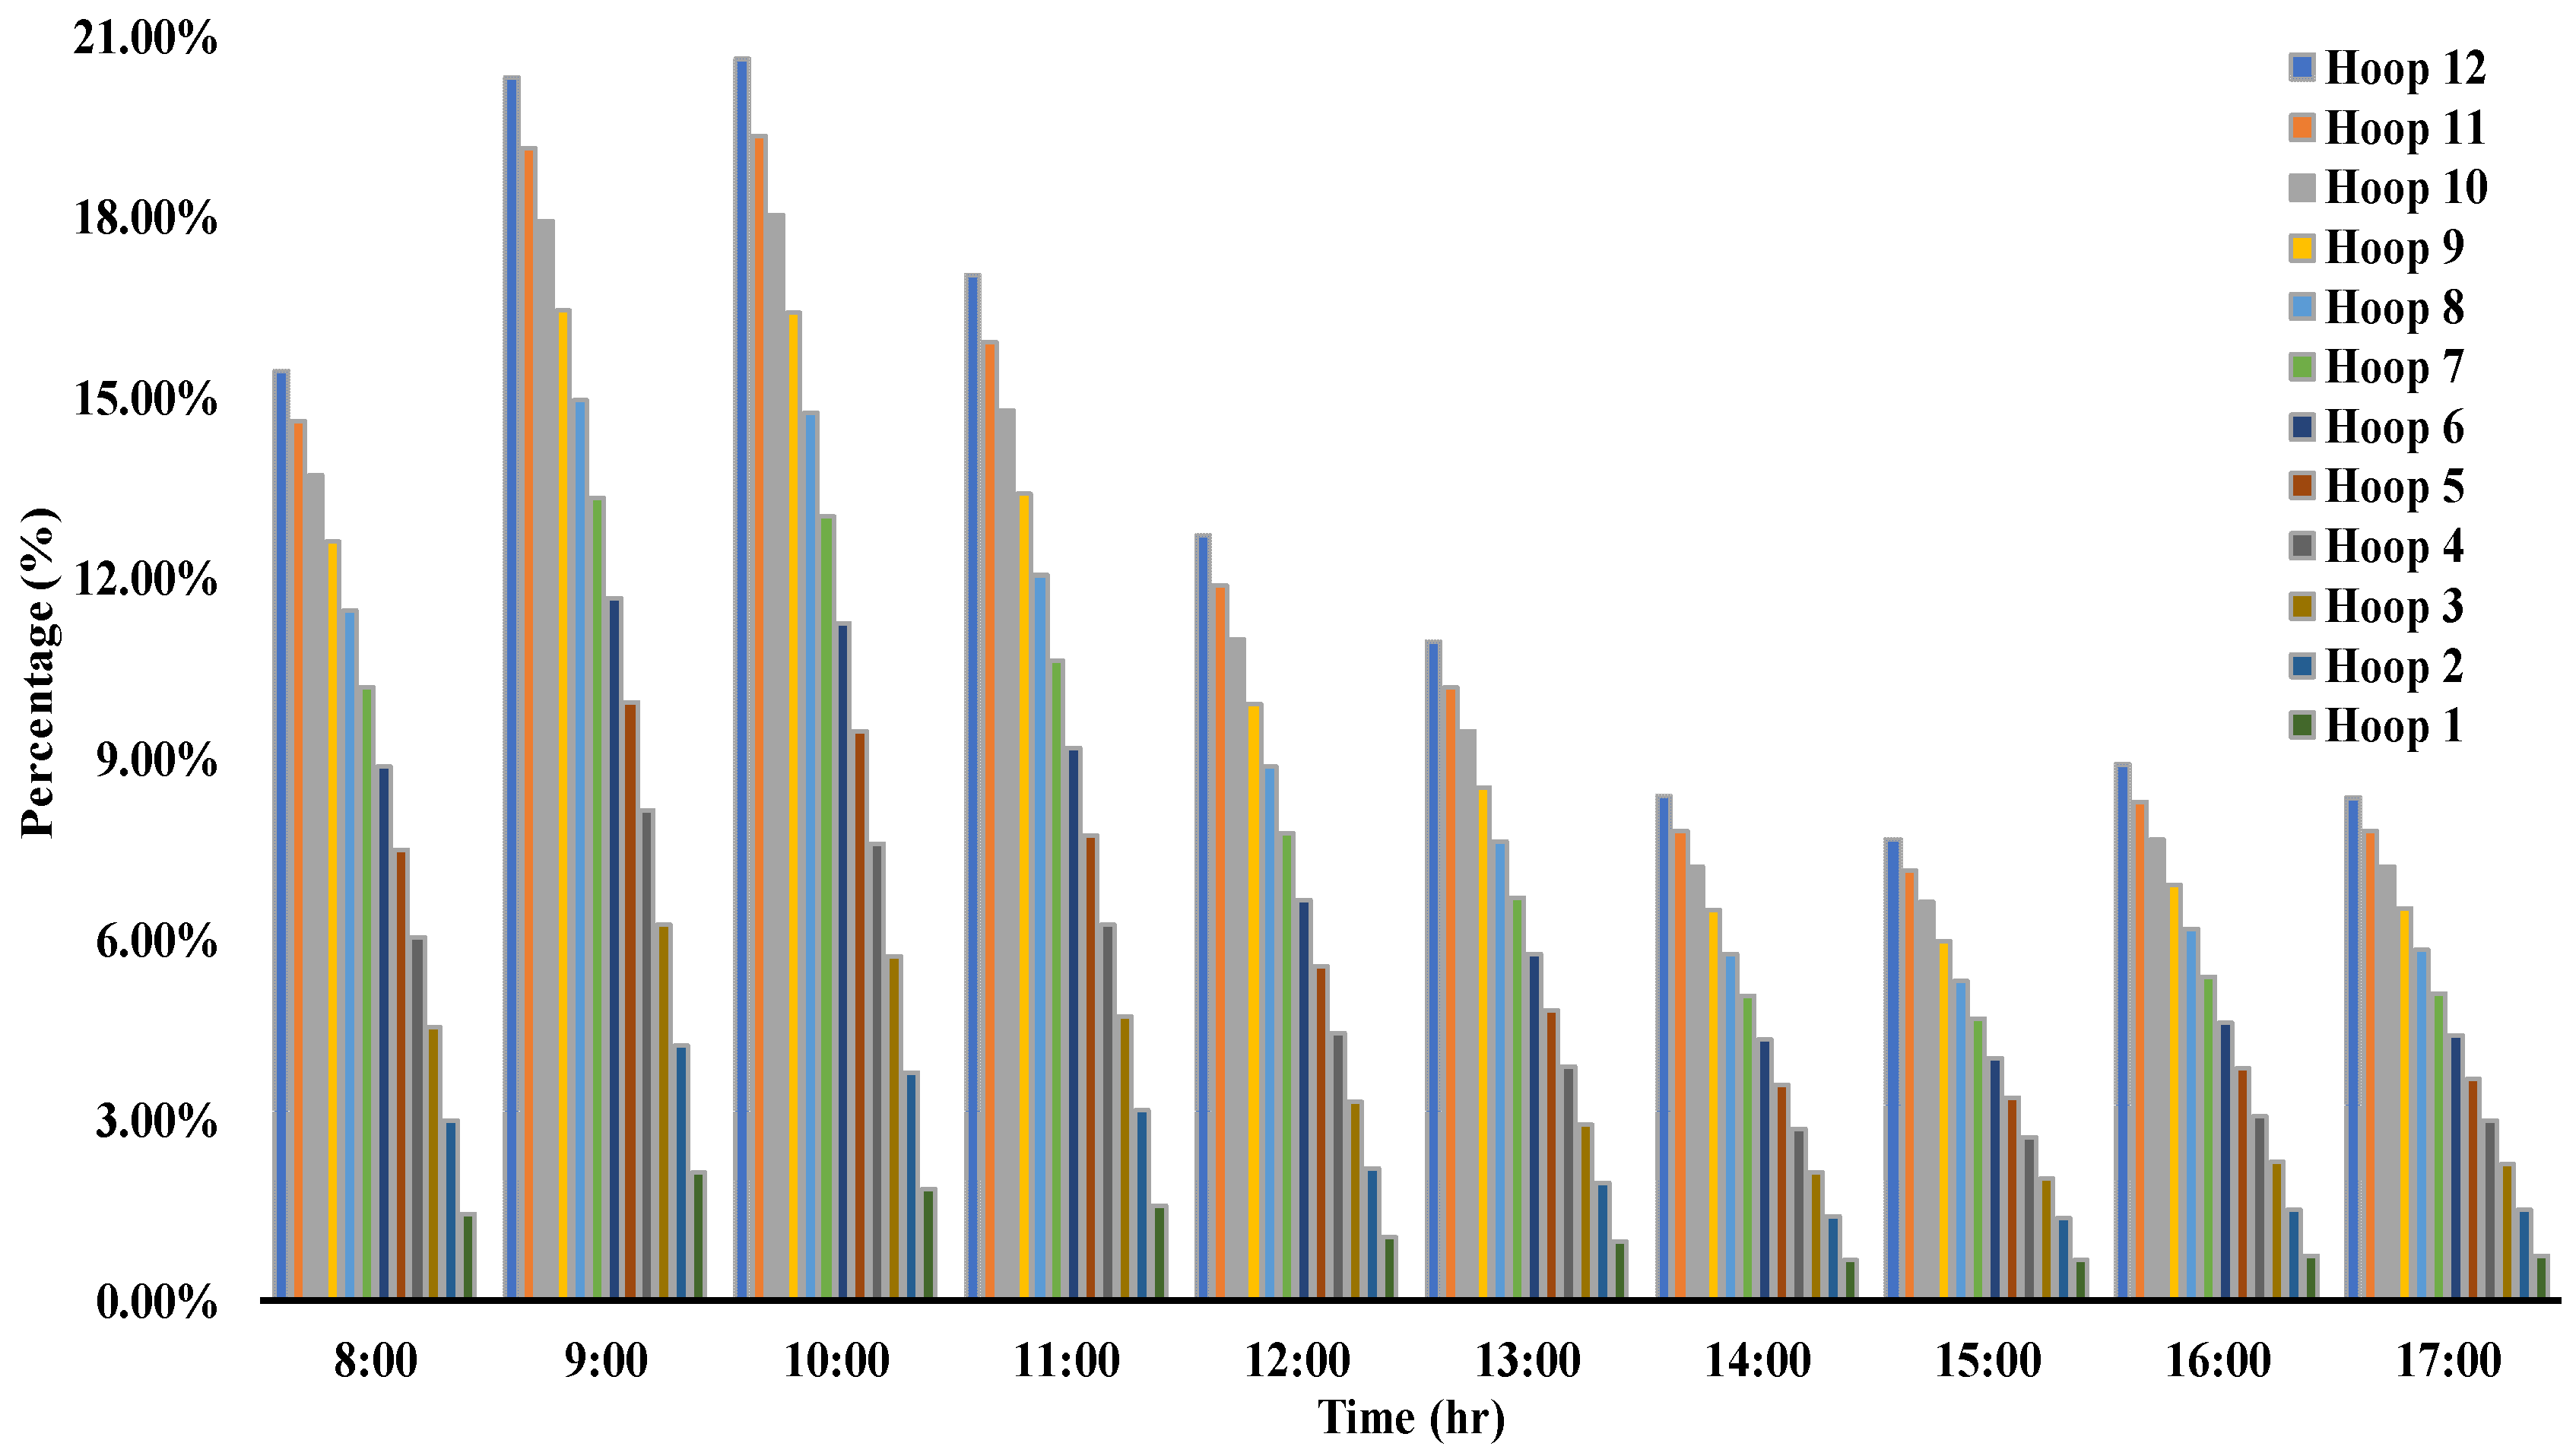
The greenhouse model with increased span numbers is developed in the Model 4 design of the study. The model considers 12 spans. The other dimensional parameters of the greenhouse remain consistent with those of Model 1. The direction of air flow for this model is presented in Table 2. The output temperature profiles of the hoop structures from the Model 4 design are plotted in Figure 11. The results from the simulation model show that as wind-driven air ventilation travels from Hoop 1 to 12, the solar radiation received on the spans progressively heats up the indoor air in greenhouse structures until it leaves the environment through Hoop 12. As shown in Figure 11, the progressive increase in temperature levels can reach up to 6 °C higher than the ambient air, posing a serious challenge to the plant’s growth in such an environment. This significant rise in temperature levels, especially for Hoop structures 8–12, can have a deleterious effect on plant health and lower the plant yield. From another perspective, Figure 12 shows the percentage difference in air temperature between the hoop structures and the ambient air. This data shows that the maximum temperature difference with ambient air can reach up to 20% for Hoop 12 structure and over 15% from Hoop structures 8–12. Apart from the air exchange between spans, lack of secondary ambient air ventilation is also a reason for developing such high air temperature profiles in Hoop structures 8–12. The span number had the greatest effect on temperature, driven by boundary condition shifts that accumulate across spans. This pattern, illustrated in Figure 11 and Figure 12 for the Model 4 design, highlights the potential risks of heat stress for crops under dense multi-span layouts.
The results from the yearly analysis of Model 4 design are presented in Table 6. The data from the table shows that the maximum average temperature difference with ambient air is observed for Hoop 12 structure in both summer and spring season at 2.83 °C. The average temperature difference rises above 20 °C for Hoop structures 8–12 in the summer season. The maximum temperature difference of 170 °C is observed in the summer season for the Hoop 12 structure, as shown in Table 5. This maximum temperature difference data informs the adverse indoor climatic conditions that may develop under certain circumstances inside a hoop structure. These adverse conditions could pose a serious challenge to the plant’s life and the indoor climatic conditions of the hoop structure.
The pronounced temperature variation in the 12-span structure indicates that simply increasing span numbers can create uneven thermal conditions. Future greenhouse designs should therefore integrate ventilation or other climate-control strategies to ensure uniform temperatures across all spans.
Extrapolating results from a two-span model to larger multi-span configurations has certain limitations. As spans increase, factors such as airflow distribution, heat accumulation, and microclimatic variability become more complex, and these effects may not scale linearly. Therefore, while the two-span results provide useful insights, additional validation is needed for larger greenhouse designs.
Each design parameter must be understood in relation to its sustainability implications. For example, while increasing greenhouse height helps lower inside temperature and reduces reliance on energy-intensive cooling, simply adding more spans without adequate ventilation can create heat accumulation, which in turn demands higher energy use to maintain plant-safe conditions. This indicates that structural adjustments are closely tied to environmental and economic outcomes. Careful optimisation of span number, ventilation strategy, and height can minimise fossil fuel dependence, cut operating costs, and support sustainable greenhouse production under hot climate conditions.
The observed temperature variations across different greenhouse configurations align with earlier findings that structural design has a strong influence on indoor microclimates. Previous studies have shown that span number and height influence ventilation efficiency and thermal stratification, which in turn affect plant health and yield [54]. Similarly, research on multi-span and single-span greenhouses has shown that convective heat transfer and airflow dynamics are strongly linked to structural dimensions [55]. Studies of ventilation efficiency further confirm that greenhouse geometry, particularly span configuration and vent layout, plays a crucial role in air circulation and thermal regulation [56]. Placing our results within this context highlights that the physical mechanisms driving temperature differences in our simulations are part of well-established patterns in greenhouse environmental dynamics.
The findings indicate that greenhouse height and the number of spans influence internal temperatures in different ways. Increasing height tends to reduce heat buildup by allowing greater air volume and improved thermal buffering, which supports more stable conditions. In contrast, increasing the number of spans amplifies temperature variation across the structure, resulting in significant differences between the outer and inner hoops. Together, these results suggest that while greater height can mitigate localised heating, excessive span numbers introduce thermal imbalances that require additional management, such as ventilation. The two parameters, therefore, complement each other only to a point, after which span expansion becomes a limiting factor for effective temperature control.
The greenhouse models examined in this study reflect typical multi-span hoop structures used in Australia. However, regional climatic factors such as solar intensity, wind, and humidity may affect temperature responses. While the observed trends provide a useful framework for design decisions, further work is needed to test these findings under diverse Australian conditions.
Unlike studies that examine fossil fuel demand for active cooling, this work emphasises structural design parameters as a passive means of regulating greenhouse temperature. By addressing temperature control through geometry rather than energy-intensive systems, the study highlights pathways for reducing reliance on fossil fuels and supporting sustainable practices.
Although this study was conducted in a Queensland blueberry greenhouse, the findings may also be relevant for other crops and climatic zones. Structural parameters such as height, arch shape, and span number influence temperature distribution in ways that are broadly applicable. For example, crops sensitive to heat stress in warmer climates could benefit from optimised span arrangements and improved ventilation, while in cooler regions, design adjustments may help retain heat more effectively. These implications suggest that the modelling framework developed here could support adaptable greenhouse design strategies across diverse agricultural settings.
While the model effectively captures the influence of structural parameters on temperature distribution, its applicability may be limited under broader environmental conditions. Factors such as extreme humidity, soil moisture variability, or sudden weather fluctuations were not explicitly considered, and these could influence greenhouse performance. Therefore, caution is advised when generalising the findings to regions with climatic conditions significantly different from those in this study.

5. Conclusions

The study focuses on evaluating the impact of various design parameters on the microclimate, specifically temperature, within a multi-span greenhouse. Specifically, it investigates the effects of greenhouse height, arch height and the number of spans on temperature profiles within the structure. The results of the simulations provide valuable insights into how alterations in these design elements influence the indoor climatic conditions.
  • The investigation showed that when the height of the greenhouse structure was increased by 0.40 m from the Model 1 design to the Model 2 design of the greenhouse structure, the maximum decrease in temperature was 0.39% and 0.62% for Hoop 1 and Hoop 2 structures, respectively.
  • The results showed that upon increasing the arch height of the greenhouse structure from Model 1 to Model 3 by 0.40 m, the temperature inside the hoop structures 1 and 2 increased by 0.09% and 0.15%, respectively. This rise in temperature was caused by the increase in solar radiation transmittance and heat accumulation due to the arch height increment.
  • The study showed that the increase in span numbers in a greenhouse from 2 to 12, had a significant increase in temperature inside the hoop structures. This temperature difference inside the hoop structures is observed in the comparison of Model 1 and Model 4 designs. The Model 4 design showed that the maximum temperature difference between Hoop 1 and Hoop 12 structure was 17 °C.
  • The findings from the study identify that increasing the span numbers of a multi-span greenhouse has a significant effect on the temperature levels of the hoop structures. Therefore, introducing ventilation could be a suitable solution to maintain the temperature inside the hoop structures at the required levels.
In summary, this study provides direction for sustainable greenhouse design in hot climates such as Australia. First, increasing overall greenhouse height should be prioritised, as it consistently reduces internal temperatures and improves natural ventilation efficiency. Second, arch height adjustments must be approached with caution, as their influence on thermal regulation is marginal and may fall within the bounds of simulation uncertainty. Finally, the challenge of overheating in multi-span structures remains critical; unless ventilation strategies and span layouts are carefully optimised, the risk of creating excessively warm and unsustainable environments increases. Together, these insights emphasise that sustainable temperature management depends on balancing structural choices with energy efficiency, ensuring designs are resilient to local climatic conditions and aligned with long-term sustainability goals.
The findings of this study indicate that beyond a certain number of spans, relying solely on wind-driven natural ventilation is insufficient to maintain suitable thermal conditions. As span numbers increase, distal sections are prone to excessive heat buildup due to restricted airflow. To address this, mixed ventilation strategies combining wind and buoyancy effects should be considered. In addition, optimising vent layouts or integrating physical partitions could help redistribute airflow and prevent stagnant hot zones. These design refinements would improve thermal balance and support more sustainable greenhouse operation in hot climates.
This study has primarily examined geometric parameters, including greenhouse height, arch height, and span number. However, the effects of crop transpiration and soil moisture on the internal climate were not included in the present scope. These biological and soil-related factors can significantly influence temperature and humidity dynamics; their integration would provide a more comprehensive assessment. Future research should also aim to couple these parameters with optimisation algorithms to establish practical design guidelines for multi-span greenhouses. Such advancements would help refine structural design strategies and support sustainable and efficient greenhouse management in hot climates.

Author Contributions

Conceptualization, R.N.; Methodology, R.N.; Software, R.N. and S.R.M.; Validation, R.N. and S.R.M.; Formal analysis, R.N., S.R.M. and R.S.; Investigation, R.N. and S.R.M.; Resources, R.N. and R.S.; Data curation, R.N. and R.S.; Writing—original draft, R.N. and S.R.M.; Writing—review & editing, R.N. and R.S.; Visualization, R.N.; Supervision, R.N.; Project administration, R.N.; Funding acquisition, R.N. All authors have read and agreed to the published version of the manuscript.

Funding

This research received no external funding.

Institutional Review Board Statement

Not applicable.

Informed Consent Statement

Not applicable.

Data Availability Statement

All data are included in the manuscript.

Conflicts of Interest

The authors declare no conflict of interest.

Abbreviations

The following abbreviations are used in this manuscript:
PARPhotosynthetically Active Radiation
TPEThermal polyethylene
PVCpolyvinylchloride
3LThree layers
EVAEthylene vinyl acetate
UVultraviolet
IRinfrared
RMSRoot mean square

References

  1. Angioni, A.; Porcu, L.; Dedola, F. Determination of famoxadone, fenamidone, fenhexamid and iprodione residues in greenhouse tomatoes. Pest Manag. Sci. 2012, 68, 543–547. [Google Scholar] [CrossRef]
  2. Jin, C.; Mao, H.; Chen, Y.; Shi, Q.; Wang, Q.; Ma, G.; Liu, Y. Engineering-oriented dynamic optimal control of a greenhouse environment using an improved genetic algorithm with engineering constraint rules. Comput. Electron. Agric. 2020, 177, 105698. [Google Scholar] [CrossRef]
  3. Sabir, N.; Singh, B. Protected cultivation of vegetables in global arena: A review. Indian J. Agric. Sci. 2013, 83, 123–135. [Google Scholar]
  4. Shamshiri, R.R.; Jones, J.W.; Thorp, K.R.; Ahmad, D.; Man, H.C.; Taheri, S. Review of optimum temperature, humidity, and vapour pressure deficit for microclimate evaluation and control in greenhouse cultivation of tomato: A review. Int. Agrophys. 2018, 32, 287–302. [Google Scholar] [CrossRef]
  5. Bo, Y.; Zhang, Y.; Zheng, K.; Zhang, J.; Wang, X.; Sun, J.; Wang, J.; Shu, S.; Wang, Y.; Guo, S. Light environment simulation for a three-span plastic greenhouse based on greenhouse light environment simulation software. Energy 2023, 271, 126966. [Google Scholar] [CrossRef]
  6. Benni, S.; Tassinari, P.; Bonora, F.; Barbaresi, A.; Torreggiani, D. Efficacy of greenhouse natural ventilation: Environmental monitoring and CFD simulations of a study case. Energy Build. 2016, 125, 276–286. [Google Scholar] [CrossRef]
  7. Cemek, B.; Demir, Y.; Uzun, S.; Ceyhan, V. The effects of different greenhouse covering materials on energy requirement, growth and yield of aubergine. Energy 2006, 31, 1780–1788. [Google Scholar] [CrossRef]
  8. Choab, N.; Allouhi, A.; El Maakoul, A.; Kousksou, T.; Saadeddine, S.; Jamil, A. Review on greenhouse microclimate and application: Design parameters, thermal modeling and simulation, climate controlling technologies. Sol. Energy 2019, 191, 109–137. [Google Scholar] [CrossRef]
  9. Gupta, M.J.; Chandra, P. Effect of greenhouse design parameters on conservation of energy for greenhouse environmental control. Energy 2002, 27, 777–794. [Google Scholar] [CrossRef]
  10. Maraveas, C.; Karavas, C.-S.; Loukatos, D.; Bartzanas, T.; Arvanitis, K.G.; Symeonaki, E. Agricultural greenhouses: Resource management technologies and perspectives for zero greenhouse gas emissions. Agric. For. 2023, 13, 1464. [Google Scholar] [CrossRef]
  11. Singh, M.C.; Singh, J.P.; Singh, K.G. Development of a microclimate model for prediction of temperatures inside a naturally ventilated greenhouse under cucumber crop in soilless media. Comput. Electron. Agric. 2018, 154, 227–238. [Google Scholar] [CrossRef]
  12. Singh, R.; Bhagoria, J.; Narayanan, R. Experimental Analysis of Thermo-Hydraulic Performance of Quadratic Duct with Artificial Roughness on a Single Broad Heated Surface of the Absorber Plate of Solar Air Heater. Case Stud. Therm. Eng. 2025, 72, 106415. [Google Scholar] [CrossRef]
  13. Achour, Y.; Ouammi, A.; Zejli, D. Technological progresses in modern sustainable greenhouses cultivation as the path towards precision agriculture. Renew. Sustain. Energy Rev. 2021, 147, 111251. [Google Scholar] [CrossRef]
  14. Allali, F.E.; Fatnassi, H.; Demrati, H.; Molina-Aiz, F.D.; Gourdo, L.; Errami, Y.; Wifaya, A.; Aharoune, A. CFD-based optimization of direct evaporative cooling systems for Canarian greenhouses in semi-arid regions. Energy Build. 2024, 323, 114767. [Google Scholar] [CrossRef]
  15. Hosny, K.M.; El-Hady, W.M.; Samy, F.M. Technologies, protocols, and applications of Internet of Things in greenhouse farming: A survey of recent advances. Inf. Process. Agric. 2024, 12, 91–111. [Google Scholar] [CrossRef]
  16. Johnston, N.L.; Narayanan, N.R.; Moola, N.M.R. CFD investigation on key design parameters of a Hoop-Type greenhouse. CFD Lett. 2023, 15, 59–66. [Google Scholar] [CrossRef]
  17. Brækken, A.; Sannan, S.; Jerca, I.O.; Bădulescu, L.A. Assessment of heating and cooling demands of a glass greenhouse in Bucharest, Romania. Therm. Sci. Eng. Prog. 2023, 41, 101830. [Google Scholar] [CrossRef]
  18. Alshenaifi, M.A.; Sharples, S.; Abuhussain, M.A.; Alotaibi, B.S.; Aldersoni, A.A.; Abdelhafez, M.H.H. Integrating a passive downdraught evaporative cooling tower into a Saudi house—The impact of climatic conditions on PDEC performance. Build. Environ. 2023, 242, 110497. [Google Scholar] [CrossRef]
  19. Muhie, S.H. Novel approaches and practices to sustainable agriculture. J. Agric. Food Res. 2022, 10, 100446. [Google Scholar] [CrossRef]
  20. Trepanier, M.-P.; Gosselin, L. Sensitivity analysis of lamp model parameters in energy and yield simulations of greenhouse. Biosyst. Eng. 2024, 239, 158–172. [Google Scholar] [CrossRef]
  21. Li, J.; Zhai, Z.; Li, H.; Ding, Y.; Chen, S. Climate change’s effects on the amount of energy used for cooling in hot, humid office buildings and the solutions. J. Clean. Prod. 2024, 442, 140967. [Google Scholar] [CrossRef]
  22. Carnie, J.-T.; Hardalupas, Y.; Sergis, A. Decarbonising building heating and cooling: Designing a novel, inter-seasonal latent heat storage system. Renew. Sustain. Energy Rev. 2024, 189, 113897. [Google Scholar] [CrossRef]
  23. Di Martino, M.; Namany, S.; Mahmood, F.; Al-Ansari, T.; Linke, P.; Pistikopoulos, E.N. Food-energy-water nexus considerations in optimal greenhouse farming systems design and operation. Appl. Energy 2025, 379, 124900. [Google Scholar] [CrossRef]
  24. Hosseini Monjezi, P.; Taki, M.; Abdanan Mehdizadeh, S.; Rohani, A.; Ahamed, M.S. Prediction of greenhouse indoor air temperature using artificial intelligence (AI) combined with sensitivity analysis. Horticulturae 2023, 9, 853. [Google Scholar] [CrossRef]
  25. Wu, H.; West, S.R. Co-optimisation of wind and solar energy and intermittency for renewable generator site selection. Heliyon 2024, 10, e26891. [Google Scholar] [CrossRef]
  26. Wang, H.; Xie, B.; Li, C. Review on operation control of cold thermal energy storage in cooling systems. Energy Built Environ. 2025, 6, 509–523. [Google Scholar] [CrossRef]
  27. Castro, R.; Silva, P.; Pires, L. Advances in solutions to improve the energy performance of agricultural greenhouses: A comprehensive review. Appl. Sci. 2024, 14, 6158. [Google Scholar] [CrossRef]
  28. Narayanan, R.; Parthkumar, P.; Pippia, R. Solar energy utilisation in Australian homes: A case study. Case Stud. Therm. Eng. 2021, 28, 101603. [Google Scholar] [CrossRef]
  29. Sedaghat, A.; Kalbasi, R.; Narayanan, R.; Mehdizadeh, A.; Soleimani, S.M.; Malayer, M.A.; Al-Khiami, M.I.; Salem, H.; Hussam, W.K.; Sabati, M.; et al. Integrating solar PV systems for energy efficiency in portable cabins: A case study in Kuwait. Sol. Energy 2024, 277, 112715. [Google Scholar] [CrossRef]
  30. Sethi, V.P. On the selection of shape and orientation of a greenhouse: Thermal modeling and experimental validation. Sol. Energy 2009, 83, 21–38. [Google Scholar] [CrossRef]
  31. Çakır, U.; Şahin, E. Using solar greenhouses in cold climates and evaluating optimum type according to sizing, position and location: A case study. Comput. Electron. Agric. 2015, 117, 245–257. [Google Scholar] [CrossRef]
  32. Sun, W.; Wei, X.; Zhou, B.; Lu, C.; Guo, W. Greenhouse heating by energy transfer between greenhouses: System design and implementation. Appl. Energy 2022, 325, 119815. [Google Scholar] [CrossRef]
  33. Baxevanou, C.; Fidaros, D.; Bartzanas, T.; Kittas, C. Yearly numerical evaluation of greenhouse cover materials. Comput. Electron. Agric. 2018, 149, 54–70. [Google Scholar] [CrossRef]
  34. Geoola, F.; Kashti, Y.; Levi, A.; Brickman, R. Quality evaluation of anti-drop properties of greenhouse cladding materials. Polym. Test. 2004, 23, 755–761. [Google Scholar] [CrossRef]
  35. Cemek, B.; Demir, Y. Testing of the condensation characteristics and light transmissions of different plastic film covering materials. Polym. Test. 2005, 24, 284–289. [Google Scholar] [CrossRef]
  36. Babaghayou, M.; Mourad, A.-H.I.; Lorenzo, V.; Chabira, S.; Sebaa, M. Anisotropy evolution of low density polyethylene greenhouse covering films during their service life. Polym. Test. 2018, 66, 146–154. [Google Scholar] [CrossRef]
  37. Seven, S.A.; Tastan, Ö.F.; Tas, C.E.; Ünal, H.; Ince, İ.A.; Menceloglu, Y.Z. Insecticide-releasing LLDPE films as greenhouse cover materials. Mater. Today Commun. 2019, 19, 170–176. [Google Scholar] [CrossRef]
  38. Guo, Y.; Zhao, H.; Zhang, S.; Wang, Y.; Chow, D. Modeling and optimization of environment in agricultural greenhouses for improving cleaner and sustainable crop production. J. Clean. Prod. 2021, 285, 124843. [Google Scholar] [CrossRef]
  39. Briscoe, B.J.; Galvin, K.P. The effect of surface fog on the transmittance of light. Sol. Energy 1991, 46, 191–197. [Google Scholar] [CrossRef]
  40. Taki, M.; Rohani, A.; Rahmati-Joneidabad, M. Solar thermal simulation and applications in greenhouse. Inf. Process. Agric. 2018, 5, 83–113. [Google Scholar] [CrossRef]
  41. Gruda, N.; Bisbis, M.; Tanny, J. Impacts of protected vegetable cultivation on climate change and adaptation strategies for cleaner production–a review. J. Clean. Prod. 2019, 225, 324–339. [Google Scholar] [CrossRef]
  42. McCartney, L.; Orsat, V.; Lefsrud, M.G. An experimental study of the cooling performance and airflow patterns in a model Natural Ventilation Augmented Cooling (NVAC) greenhouse. Biosyst. Eng. 2018, 174, 173–189. [Google Scholar] [CrossRef]
  43. Li, A.; Huang, L.; Zhang, T. Field test and analysis of microclimate in naturally ventilated single-sloped greenhouses. Energy Build. 2017, 138, 479–489. [Google Scholar] [CrossRef]
  44. Espinoza, K.; Lopez, A.; Valera, D.L.; Molina-Aiz, F.D.; Torres, J.A.; Pena, A. Effects of ventilator configuration on the flow pattern of a naturally-ventilated three-span Mediterranean greenhouse. Biosyst. Eng. 2017, 164, 13–30. [Google Scholar] [CrossRef]
  45. Kacira, M.; Sase, S.; Okushima, L. Effects of side vents and span numbers on wind-induced natural ventilation of a gothic multi-span greenhouse. Jpn. Agric. Res. Q. JARQ 2004, 38, 227–233. [Google Scholar] [CrossRef]
  46. Li, X.; Ma, J.; Zheng, L.; Chen, J.; Sun, X.; Guo, X. Optimization of the regulated deficit irrigation strategy for greenhouse tomato based on the fuzzy borda model. Agriculture 2022, 12, 324. [Google Scholar] [CrossRef]
  47. Baeza, E.J.; Pérez-Parra, J.J.; Montero, J.I.; Bailey, B.J.; López, J.C.; Gázquez, J.C. Analysis of the role of sidewall vents on buoyancy-driven natural ventilation in parral-type greenhouses with and without insect screens using computational fluid dynamics. Biosyst. Eng. 2009, 104, 86–96. [Google Scholar] [CrossRef]
  48. Asgari, N.; McDonald, M.T.; Pearce, J.M. Energy modeling and Techno-Economic feasibility analysis of greenhouses for tomato cultivation utilizing the waste heat of cryptocurrency miners. Energies 2023, 16, 1331. [Google Scholar] [CrossRef]
  49. Klein, S.A.; Beckman, W.A.; Mitchell, J.W.; Duffie, J.A.; Duffie, N.A.; Freeman, T.L.; Mitchell, J.C.; Braun, J.E.; Evans, B.L.; Kummer, J.P.; et al. TRNSYS 16—Mathematical Reference (Vol. 5). Available online: http://sel.me.wisc.edu/trnsys (accessed on 15 July 2020).
  50. Solar Energy Laboratory; Univ. of Wisconsin-Madison; TRANSSOLAR Energietechnik GmbH; CSTB—Centre Scientifique et Technique du Bâtiment; TESS—Thermal Energy System Specialists, LLC; TRANSSOLAR Energietechnik GmbH. TRNSYS 16—Multizone Building Modeling with Type56 and TRNBuild. In TRNSYS 16 (Vol. 6). Available online: https://sel.me.wisc.edu/trnsys/user18-resources/downloads/trnsys16-manuals.zip (accessed on 17 July 2020).
  51. Jarimi, H.; Bakar, M.N.A.; Othman, M.; Din, M.H. Bi-fluid photovoltaic/thermal (PV/T) solar collector: Experimental validation of a 2-D theoretical model. Renew. Energy 2016, 85, 1052–1067. [Google Scholar] [CrossRef]
  52. Tran, B.; Tseng, W.; Chen, C. Climate change impacts on crop yields across temperature rise thresholds and climate zones. Sci. Rep. 2025, 15, 23424. [Google Scholar] [CrossRef]
  53. Zhang, T.; He, Y.; DePauw, R.; Jin, Z.; Garvin, D.; Yue, X.; Anderson, W.; Li, T.; Dong, X.; Zhang, T.; et al. Climate change may outpace current wheat breeding yield improvements in North America. Nat. Commun. 2022, 13, 5591. [Google Scholar] [CrossRef] [PubMed]
  54. Fatnassi, H.; Boulard, T.; Benamara, H.; Roy, J.; Suay, R.; Poncet, C. Increasing the height and multiplying the number of spans of greenhouse: How far can we go? Acta Hortic. 2017, 1170, 137–144. [Google Scholar] [CrossRef]
  55. Kruger, S.; Pretorius, L. Evaluating the Effect of Number of Spans on Heat Transfer in Greenhouses. In Proceedings of the ASME 2019 International Mechanical Engineering Congress and Exposition, Salt Lake City, UT, USA, 11–14 November 2019. [Google Scholar] [CrossRef]
  56. He, K.; Chen, D.; Sun, L.; Liu, Z.; Huang, Z. The effect of vent openings on the microclimate inside multi-span greenhouses during summer and winter seasons. Eng. Appl. Comput. Fluid Mech. 2015, 9, 399–410. [Google Scholar] [CrossRef]
Figure 1. (a) Temperature probes used in the experimental site, (b) Temperature probe installed in the experimental test site.
Sustainability 17 08712 g001
Figure 2. Greenhouse models developed in SketchUp software version 2017: (a) Model 1, used to validate the simulation model; (b) Model 2, created by increasing the greenhouse height; (c) Model 3, created by increasing the arch height.
Sustainability 17 08712 g002
Figure 3. Model 4 design in Sketchup software, created by adding adjacent spans from 2 to 12.
Sustainability 17 08712 g003
Figure 4. Simulation model developed in TRNSYS software.
Sustainability 17 08712 g004
Figure 5. Comparison of measured and simulated temperature profiles in Hoop 1 during the validation period. The close alignment between curves confirms the accuracy of the TRNSYS model.
Sustainability 17 08712 g005
Figure 6. Comparison of measured and simulated temperature profiles in Hoop 2. Results again show strong agreement, further validating the model performance.
Sustainability 17 08712 g006
Figure 7. (a) Greenhouse Hoop 1 structure temperature profiles for Models 1 and 2 design, (b) Greenhouse Hoop 2 structure temperature profiles for Models 1 and 2 design. Findings indicate that increasing greenhouse height reduces peak internal temperature, creating more favorable conditions.
Sustainability 17 08712 g007
Figure 8. (a) Greenhouse Hoop 1 percentage difference in temperature between Models 1 and 2 design, (b) Greenhouse Hoop 2 percentage difference in temperature between Models 1 and 2 design.
Sustainability 17 08712 g008
Figure 9. (a) Greenhouse Hoop 1 structure temperature profiles for Models 1 and 3 design, (b) Greenhouse Hoop 2 structure temperature profiles for Models 1 and 3 design. Results suggest that increasing arch height leads to a slight rise in internal temperature due to higher solar radiation capture.
Sustainability 17 08712 g009
Figure 10. (a) Greenhouse Hoop 1 percentage difference in temperature between Models 1 and 3 design. (b) Greenhouse Hoop 2 percentage difference in temperature between Models 1 and 3 design.
Sustainability 17 08712 g010
Figure 11. Temperature profiles of hoop structures in Model 4 design. The results highlight a clear temperature gradient, with up to a 6 °C increase in distal spans compared to those near the ventilation inlet.
Sustainability 17 08712 g011
Figure 12. Percentage difference in air temperature of Hoop structures with the ambient air.
Sustainability 17 08712 g012
Table 1. Greenhouse air ventilation and dimensional data for TRNSYS models and experimental structure.
ParameterExperimentalModel 1Model 2Model 3Model 4
Short greenhouse structure length52.85 m52.85 m52.85 m52.85 m52.85 m
Long greenhouse structure length63.75 m63.75 m63.75 m63.75 m63.75 m
Greenhouse structure width9.5 m9.5 m9.5 m9.5 m9.5 m
Greenhouse height2.8 m2.8 m3.2 m2.8 m2.8 m
Greenhouse arch height2.6 m2.6 m2.6 m3.0 m2.6 m
Number of spans222212
Natural ventilation air inletHoop 2Hoop 2Hoop 2Hoop 2Hoop 1
Natural ventilation air outletHoop 1Hoop 1Hoop 1Hoop 1Hoop 12
Table 2. Details on experimental data collection.
VariablesValues/Range
Date of experimental data6 August 2020 to 20 August 2020
Data collection duration2 Weeks
Parameter measuredTemperature
Frequency of data collection1 min
Number of tunnels considered2
Data collectedTemperature
Table 3. TRNSYS Component Configuration (Type 56—Multizone Building).
CategoryComponentDescription
ParametersLUbLogical unit for reading the *.bui file created by TRNBuild.
T*-MODEDefines whether the star network is recalculated only at start or at each iteration, depending on heat transfer coefficient settings.
AopWeighting factor for operative room temperature: Top = Aop × Tair + (1 − Aop) × Tsurf.
InputsTRNBuild filesBuilding description (*.BLD) and transfer function coefficients (*.TRN) are generated and automatically linked.
INF fileProvides a list of required inputs and available outputs for proper model connections.
OutputsZone air temperaturesDefault output includes air temperature values for each zone.
Energy demandsProvides sensible energy demands, heating, and cooling loads for zones.
Optional summariesUsers can specify monthly or hourly reports by defining logical unit numbers.
The asterisk (*) denotes a wildcard character, indicating any filename with the specified extension.
Table 4. Yearly analysis of percentage difference in temperature for Models 1 and 2 designs.
Percentage Difference in Temperature with Model 1Hoop 1 (Average
Difference)
Hoop 2 (Average Difference)Hoop 1 (Maximum Difference)Hoop 2 (Maximum Difference)
Summer (%)−0.04296−0.07761−0.35743−0.59551
Autumn (%)−0.03503−0.06325−0.27189−0.4713
Winter (%)−0.0279−0.05025−0.39272−0.62729
Spring (%)−0.04469−0.08081−0.25239−0.39202
Table 5. Yearly analysis of the percentage difference in temperature for Models 1 and 3 designs.
Percentage Difference in Temperature with Model 1Hoop 1 (Average
Difference)
Hoop 2 (Average Difference)Hoop 1 (Maximum
Difference)
Hoop 2 (Maximum Difference)
Summer (%)0.001380.002600.025260.03518
Autumn (%)0.004670.008640.057710.10126
Winter (%)0.007480.013710.094990.15388
Spring (%)0.001690.003240.020880.03881
Table 6. Yearly analysis of temperature profiles for hoop structures in Model 4 design.
S. NoAverage Temperature Difference with Ambient
Air (°C)
Maximum Temperature Difference with Ambient Air (°C)
Summer
(8 a.m.–4p.m.)
Autumn
(8 a.m.–3 p.m.)
Winter
(8 a.m.–3 p.m.)
Spring
(8 a.m.–3 p.m.)
Summer
(8 a.m.–4 p.m.)
Autumn
(8 a.m.–3 p.m.)
Winter
(8 a.m.–3 p.m.)
Spring
(8 a.m.–3 p.m.)
Hoop 122.832.2971.742.8317.2115.6214.5911.92
Hoop 112.642.141.632.6416.3614.7214.2811.23
Hoop 102.461.951.522.4515.4613.7913.9110.50
Hoop 92.231.771.382.2214.3612.6513.469.81
Hoop 82.001.591.241.9913.2711.4812.899.17
Hoop 71.761.41.091.7612.1210.2312.168.41
Hoop 61.521.210.941.5111.028.9411.297.55
Hoop 51.281.020.791.279.747.5910.236.60
Hoop 41.030.820.641.028.276.268.945.52
Hoop 30.780.620.480.776.584.897.354.33
Hoop 20.520.410.320.514.633.365.363.05
Hoop 10.250.200.150.254.633.365.363.05
Disclaimer/Publisher’s Note: The statements, opinions and data contained in all publications are solely those of the individual author(s) and contributor(s) and not of MDPI and/or the editor(s). MDPI and/or the editor(s) disclaim responsibility for any injury to people or property resulting from any ideas, methods, instructions or products referred to in the content.