Article

Repurposing EoL WTB Components into a Large-Scale PV-Floating Demonstrator

by
Mário Moutinho
1,
Ricardo Rocha
1,
David Atteln
2,
Philipp Johst
2,
Robert Böhm
2,
Konstantina-Roxani Chatzipanagiotou
3,
Evangelia Stamkopoulou
3,
Elias P. Koumoulos
3 and
Andreia Araujo
1,4,*
1
INEGI—Institute of Science and Innovation in Mechanical and Industrial Engineering, Campus da FEUP, R. Dr. Roberto Frias 400, 4200-465 Porto, Portugal
2
Faculty of Engineering, HTWK Leipzig—University of Applied Sciences, Karl-Liebknecht-Straße 132, 04277 Leipzig, Germany
3
IRES—Innovation in Research & Engineering Solutions SNC, 1000 Brussels, Belgium
4
LAETA—Associated Laboratory of Energy, Transports and Aeronautics, Campus da FEUP, R. Dr. Roberto Frias 400, 4200-465 Porto, Portugal
*
Author to whom correspondence should be addressed.
Sustainability 2025, 17(19), 8717; https://doi.org/10.3390/su17198717
Submission received: 5 August 2025 / Revised: 19 September 2025 / Accepted: 26 September 2025 / Published: 28 September 2025

Abstract

The growing volume of decommissioned wind turbine blades (WTBs) poses substantial challenges for end-of-life (EoL) material management, particularly within the composite repurposing and recycling strategies. This study investigates the repurposing of EoL WTB segments in a full-scale demonstrator for a photovoltaic (PV) floating platform. The design process is supported by a calibrated numerical model replicating the structure’s behaviour under representative operating conditions. The prototype reached Technology Readiness Level 6 (TRL 6) through laboratory-scale wave basin testing, under irregular wave conditions with heights up to 0.22 m. Structural assessment validates deformation limits and identifies critical zones using composite failure criteria. A comparison between two configurations underscores the importance of load continuity and effective load distribution. Additionally, a life cycle assessment (LCA) evaluates environmental impact of the repurposed solution. Results indicate that the demonstrator’s footprint is comparable to those of conventional PV-floating installations reported in the literature. Furthermore, overall sustainability can be significantly enhanced by reducing transport distances associated with repurposed components. The findings support the structural feasibility and environmental value of second-life applications for composite WTB segments, offering a circular and scalable pathway for their integration into aquatic infrastructures.

1. Introduction

The expansion of wind energy plays a pivotal role in the decarbonisation of global energy systems. However, this rapid growth also presents a significant challenge: the disposal of end-of-life (EoL) wind turbine blades (WTBs). These WTBs, typically composed of thermoset glass fibre-reinforced polymers (GFRPs), are designed to exhibit high strength, low weight, and high durability [1]. However, recycling WTBs presents a significant challenge. Their complex composite structures are inherently resistant to degradation and difficult to separate into reusable constituents. As a result, recycling processes are both energy- and cost-intensive [2]. Despite increasing environmental and regulatory pressure to adopt alternative disposal methods, landfilling remains the predominant practice in many regions [3,4]. By the year 2050, it is estimated that Europe alone will generate 7.6 million tonnes of EoL WTB materials [5], with worldwide estimates exceeding 43 million tonnes [6].
This growing material stream has led to a surge of interest in circular economy (CE) solutions for EoL WTB materials. The CE framework is focused on reducing the use of virgin materials and extending the life span of products through R-strategies, namely reuse (R3), repair (R4), refurbish (R5), remanufacture (R6) and repurposing (R7) [7,8]. It is further emphasised that these strategies are not mutually exclusive but can support each other in combined approaches [9]. The strategy of structural repurposing—where EoL WTB materials are used in a new application with a different function—is gaining recognition as one of the most promising EoL strategies for WTBs as stated in, e.g., [10,11].
Recent studies have demonstrated the potential for structural repurposing in a variety of domains. As part of the Re-Wind network (https://www.re-wind.info/), full-scale bridges using decommissioned WTBs have been constructed as prototypes [12] and, in addition, applications in noise barriers and transmission poles [13] have been investigated. In the context of the EuReComp project (https://eurecomp.eu/), recent studies have explored the integration of EoL WTB segments into PV-floating systems. This innovative concept has been examined on a small scale [14,15].
As demonstrated by the cited applications, repurposing practices can significantly divert EoL WTB material from landfilling. The extent of this diversion depends on the specific R-strategy employed. For instance, complete repurposing can theoretically achieve 100% diversion by capitalizing on the blade’s intact structural integrity [16]. Beyond waste reduction, repurposing has been shown to offer both environmental and economic benefits, including material preservation, emission reductions, and decreased demand for virgin resources [17,18]. For example, diverting just 20% of WTB material through repurposing strategies may prevent approximately 135 tonnes of composite waste from entering landfills annually, while also reducing carbon emissions by an estimated 30,780 kg of CO2-equivalent per year [19].
Nevertheless, the field of repurposing faces considerable challenges. The structural diversity and complexity of WTBs contribute to high variability in the EoL material stream, complicating segmentation, handling, and integration into new applications. From a Life Cycle Assessment (LCA) perspective, the primary environmental burdens are associated with the energy required for blade segmentation processes and transportation activities [20]. The availability of standardised design methods and scalable applications is limited (e.g., highlighted in [21,22]).
This study addresses this gap by presenting, in contrast to a previously built small scale PV floating system, a functional, upscaled demonstrator that repurposes EoL WTB segments from an Enercon E66 wind turbine into floats for a large-scale PV-floating system, supported by numerical simulation and comparative LCA. This concept integrates two renewable energy sources—wind and solar—into a single circular system, while addressing the issue of EoL WTB material stream. During the manufacturing process, the repurposing strategy (R7) is combined with repair (R4) and refurbishing (R5) activities. The demonstrator’s incorporation of EoL WTB components, including spar caps and shear webs, is driven by the objective of enhancing the proportion of repurposed EoL WTB materials. The demonstrator achieved Technology Readiness Level 6 (TRL 6) through laboratory testing under controlled environmental conditions. The design process was supported by a calibrated numerical model aimed at replicating the physical behaviour under representative use-case scenarios. This model served as the foundation for simulation-based structural analysis, with the goal of informing future design refinement and supporting potential scale-up and deployment scenarios. Furthermore, LCA was conducted to evaluate its environmental performance.
By addressing issues of design complexity, validating mechanical and environmental performance, and maximising material repurposing, this study supports the transition towards circular solutions for EoL WTB materials and offers new pathways for scalable innovation.

2. Materials and Methods

The investigation of repurposed applications for EoL WTBs followed a multidisciplinary approach structured around four interdependent pillars, as summarized in Figure 1. The process begins with material sourcing and digitalisation of the EoL WTB sections, which provided the foundation for the design and fabrication of a physical demonstrator—a PV-floating platform integrating sections of an EoL WTB. The fabricated structure is subsequently subjected to full-scale experimental testing under realistic use-case conditions to evaluate its performance and quantify the maximum loading conditions under representative scenarios. In parallel, finite element numerical simulations are carried out and iteratively calibrated with experimental data to assess stress distributions under worst-case boundary conditions and guide potential structural optimisations. Finally, a preliminary LCA is conducted to evaluate the environmental impact of the proposed solution and benchmark its sustainability against conventional alternatives.

2.1. PV-Floating Demonstrator Design for Circularity

2.1.1. Material Sourcing from an EoL Enercon E66 WTB

Decommissioned Enercon E66 WTBs, measuring 33 m in length, were recovered after completing their 20-year operation life cycle at Ihlow, Germany, where they were dismantled and transported to Portugal. These WTBs are constructed using glass fibre, thermoset resin and adhesive, while the core includes balsa wood and aluminium. The combination of fibres and resin represents the majority of the WTB material composition. According to Jensen and Skelton [23], the proportion of reinforcing fibres and resin by weight is approximately 60–70% and 30–40%, respectively.
In the initial phase, structural segmentation of the WTB was employed based on the structural and geometric specifications of the E66 model. A typical WTB presents a twist angle that varies along the midspan relative to the radial position from the rotor hub, with the angle becoming more uniform toward the blade tip [24]. This more consistent geometry, combined with the smaller chord length (profile width), aligns with the requirements for both easy transport and the creation of a relatively level surface suitable for the PV platform base. Furthermore, WTBs experience lower lifetime fatigue loading closer to the tip compared to the root section, which may help preserve their original mechanical properties for second life applications [25]. For this reason, the section selected as most promising for the first design iteration was a 7.5 m segment, starting at 8 m from the tip (Figure 2), offering an optimal balance between structural integrity and geometric uniformity.
For this study, three 7.5 m EoL WTB segments from dismantled E66 turbines were cut on the transverse direction (TD) using a handheld cement saw equipped with a diamond blade (Figure 2a). One segment (sg_A) was used for digital 3D scanning to support design work, while the remaining two (sg_B, sg_C) were allocated for the demonstrator fabrication.
After scanning segment sg_A, longitudinal direction (LD) cuts were carried out using a jigsaw to extract the shear web and spar cap beam components, following the method described in [26]. This segmentation process is illustrated in Figure 2c, with section A-A shown in Figure 2b highlighting the internal blade structure. In the demonstrator, segments sg_B and sg_C were repurposed as floaters forming the base of a platform designed to support four PV panels. The ends of the blade segments were sealed using the previously extracted shear web components as cover lids, bonded in place through hand layup with reinforcing fibres. The spar cap beams were then used to construct the PV support structure.

2.1.2. Geometrical Characterization of EoL WTB Segments

Initially, one of the three 7.5 m WTB segments was subdivided into three consecutive 2.5 m sections to enable digital reconstruction. Surface geometry acquisition was performed using a HandySCAN 307 (Creaform, Lévis, QC, Canada), which generated a series of cross-sectional profiles (Figure 3a) for reconstructing the full surface geometry using boundary surface modelling in SolidWorks (Version 2025 SP3.0, Dassault Systèmes SE, Vélizy-Villacoublay, France). The resulting 3D model (Figure 3b) was subsequently validated against physical measurements obtained from the original segment, including chord length, leading and trailing edge curvature, and thicknesses, also represented as an example on the cross-sectional profile displayed on Figure 3c.

2.1.3. Design Steps and Support Integration

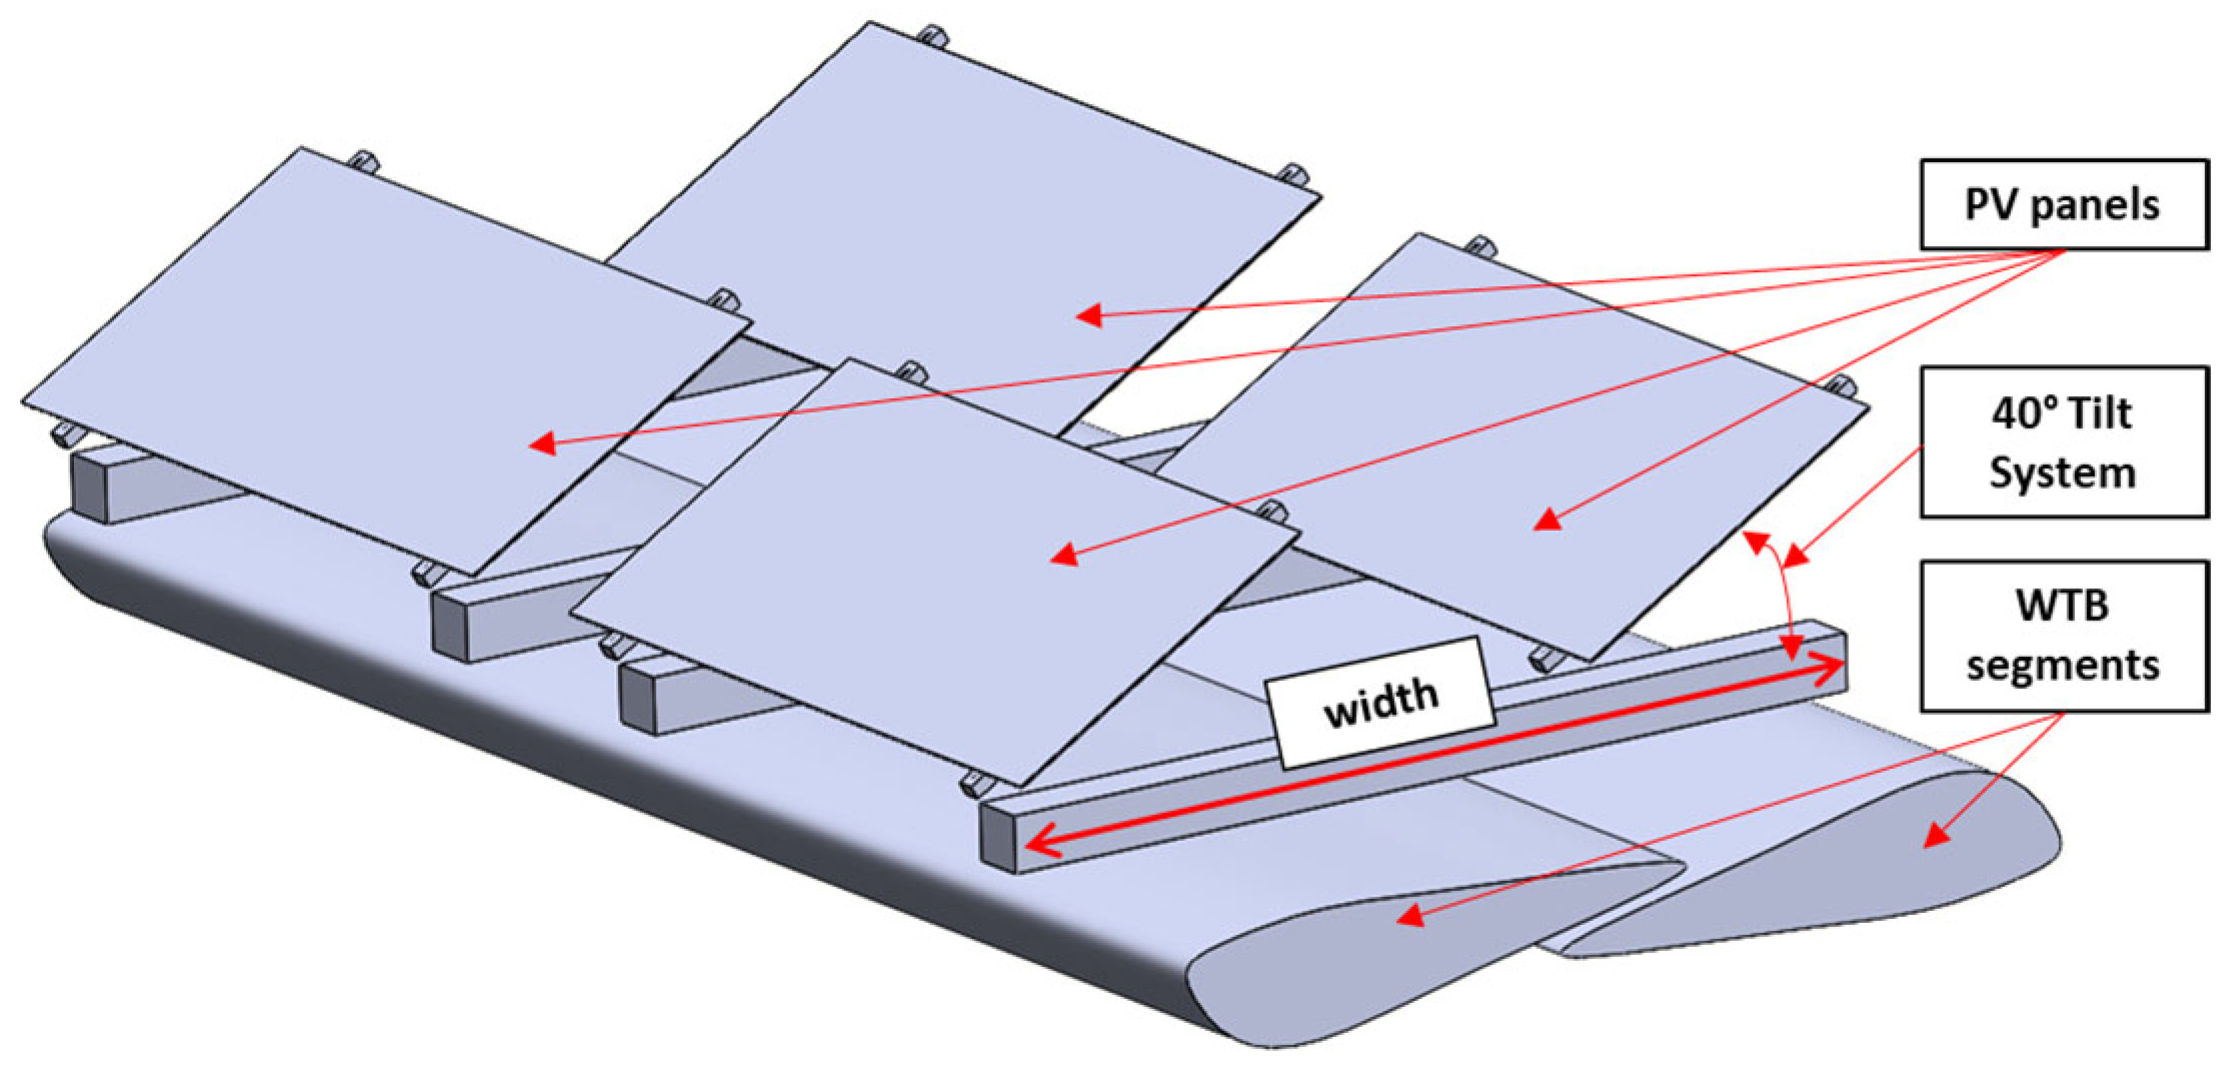
The PV system consists of four standard-sized PV panels (15 kg each, 1.68 m × 1.0 m) arranged in a two-by-two configuration (2 columns × 2 rows). The minimum required length of the WTB segments was determined by the space required to accommodate two PV panels placed side by side, resulting in a total of at least 3.4 m. For the structure’s width, both panel dimensions and a 40° tilt angle (identified as optimal for Porto, Portugal [27]) were considered, along with shadow-casting shadows effects. This yielded a minimum required width of 2.1 m. A schematic representation of the combined PV array and WTB-based floating structure is shown in Figure 4 to illustrate the general layout and installation arrangement.
The optimal configuration was established based on project-specific design objectives, balancing structural requirements with energy performance considerations. These criteria achieve the following: (i) minimizes gaps between the overlapping segments of two identical WTBs; (ii) allows the connection between the supporting structure and the WTB spar cap, which is the most rigid area; (iii) provides the flattest possible surface on top to support the PV structure; (iv) maintains a segment length of approximately 3.4 m; (v) ensures that the combined width of the two WTB segments prevents front PV panels from casting shadows on those behind.
Two possible concepts were evaluated. In the first hypothesis, the widest portion of one WTB segment overlapped with the narrowest portion of the other. In the second, the widest portions of both segments overlapped, as shown in Figure 5. After rotation and positioning adjustments, the second configuration (Figure 5b) was selected, as it offered reduced assembly gaps, a broader support surface for the PV structure, and simplified structural connections.
Considering the assembly clearances, the final WTB segment dimensions were set to 1.4 m in width at one end and 1.8 m at the opposite end, with a total length of approximately 3.6 m, as illustrated in Figure 6.
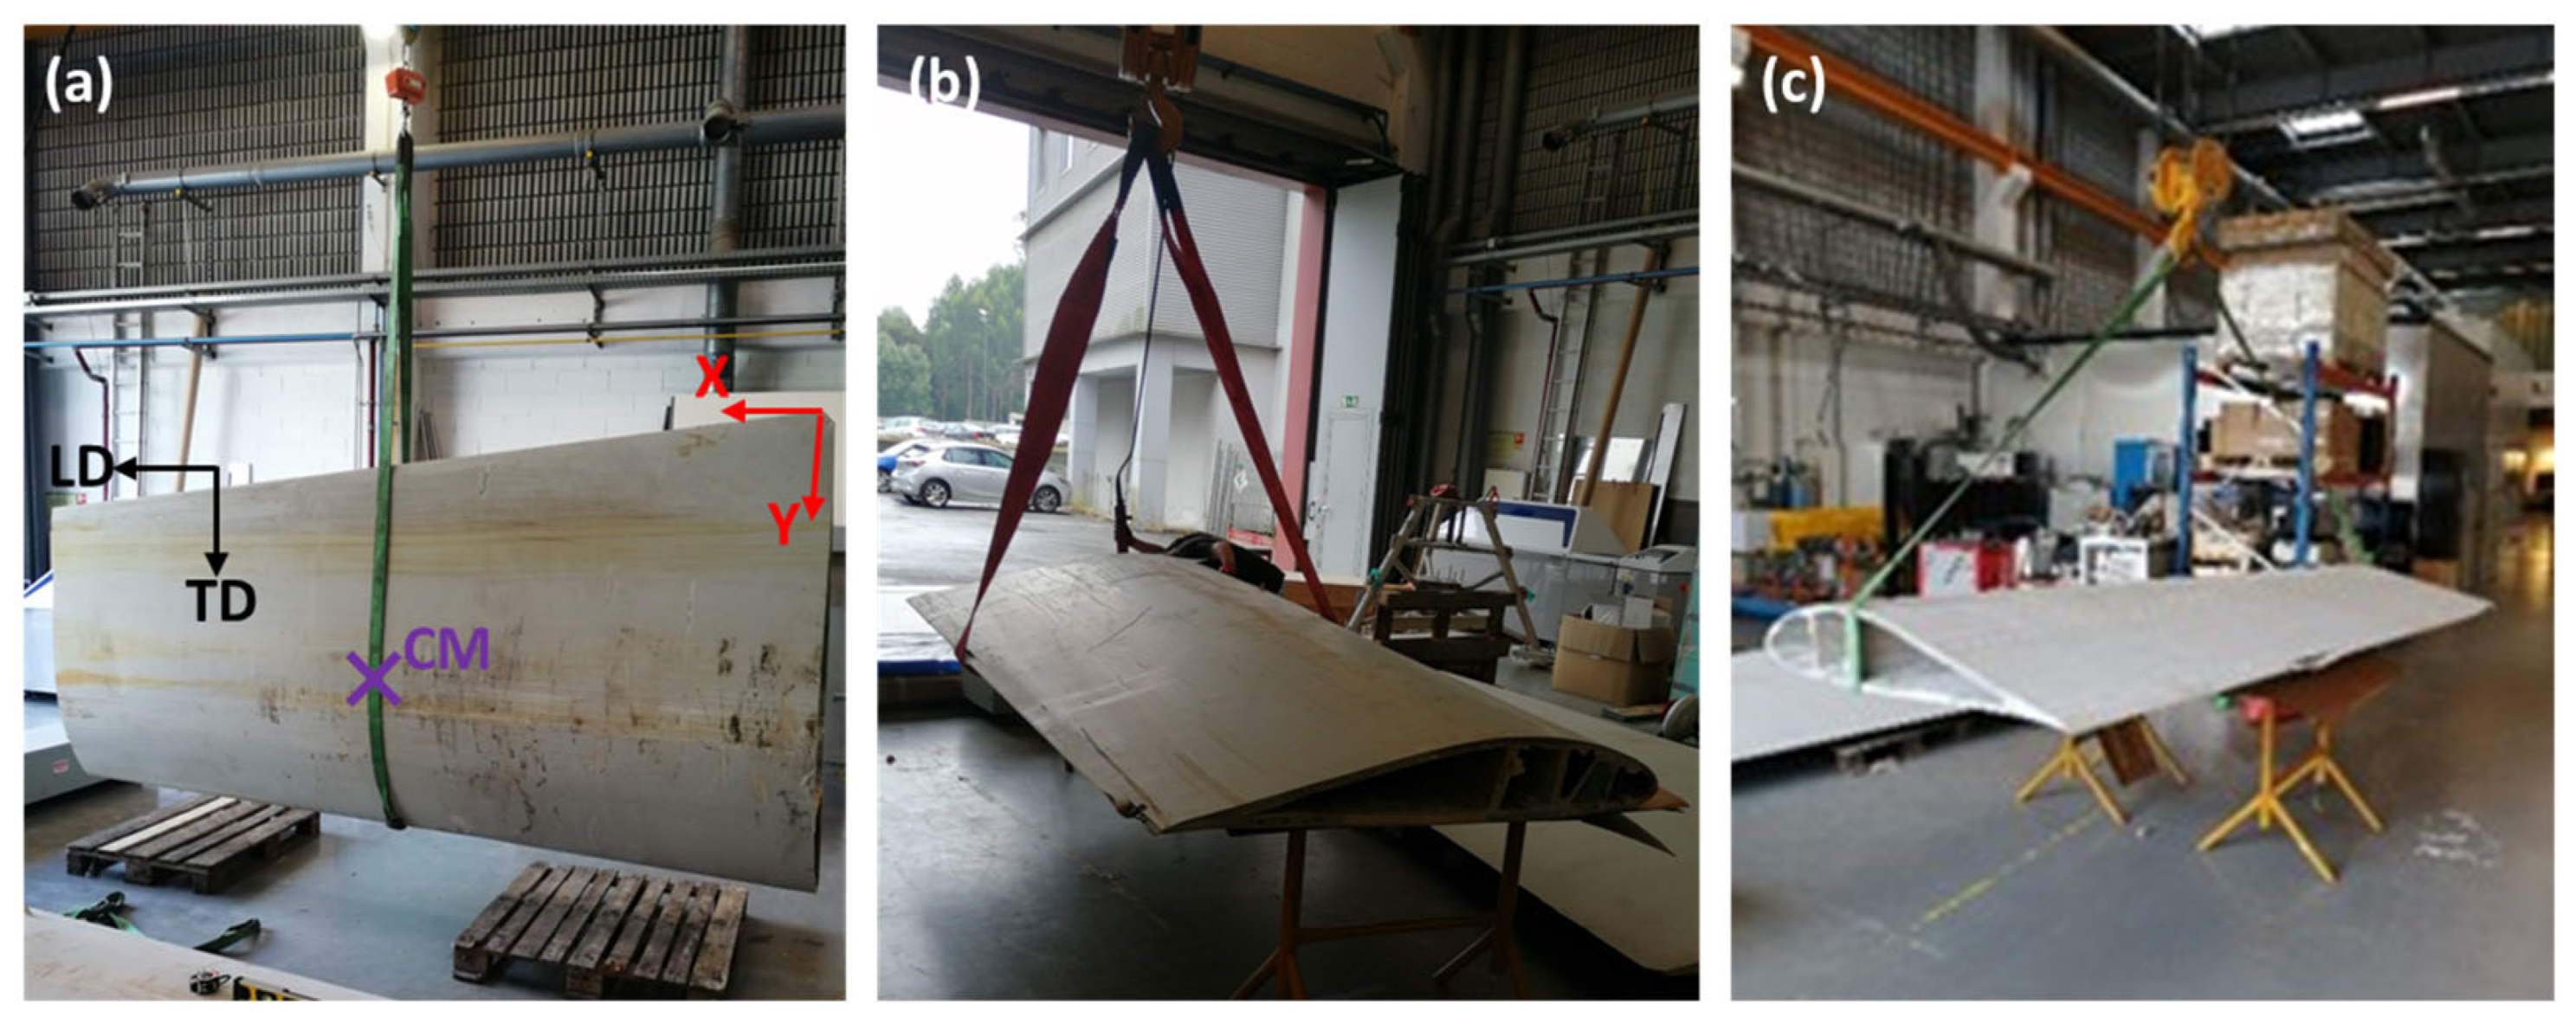
The centre of mass (CM) of the WTB segments was estimated experimentally using a trial-and-error approach, where each segment was lifted both in the LD and TD until it could be safely hoisted in a level position (Figure 7).
The experimental characterization of the selected segment’s CM yielded LD X 1.77 m and TD Y 0.95 m, out-of-plane Z 72.9 mm, with the coordinate system origin set at the tip of the leading edge on the wider side. Based on the CM of each WTB and assuming a spar cap beam density of 1.8 kg/dm3, the overall CM of the floating demonstrator was determined.
To evaluate static equilibrium in floating conditions, the demonstrator was iteratively sectioned by a hypothetical horizontal plane parallel to its base, representing the waterline. The submerged section generates defines the displaced volume and thus the buoyant force, which equals the weight of the displaced water, in accordance with Archimedes’ principle.
The support structure, depicted in Figure 8, functions both as the primary mounting system for the PV panels, and as the connecting frame that secures the two EoL WTB segments used as floats. This structure was designed to ensure stability and rigidity by using unidirectional (UD) fibre-reinforced spar cap beams extracted from EoL WTB segments (Figure 2c). This approach contributes to the system’s sustainable design and aligns with CE principles [7].
The framework consists of rectangular spar beams measuring 50 by 20 mm, arranged in a grid-like platform. Spar caps are traditionally engineered to withstand tensile and compressive loads along the LD of WTB and to transfer wind-induced bending moments to the rotor hub. Even after decommissioning, they retain considerable mechanical strength and stiffness, as demonstrated by Alshannaq et al. [28]. These favourable properties were also confirmed in [29], making them well-suited for integration into the support structure [26].
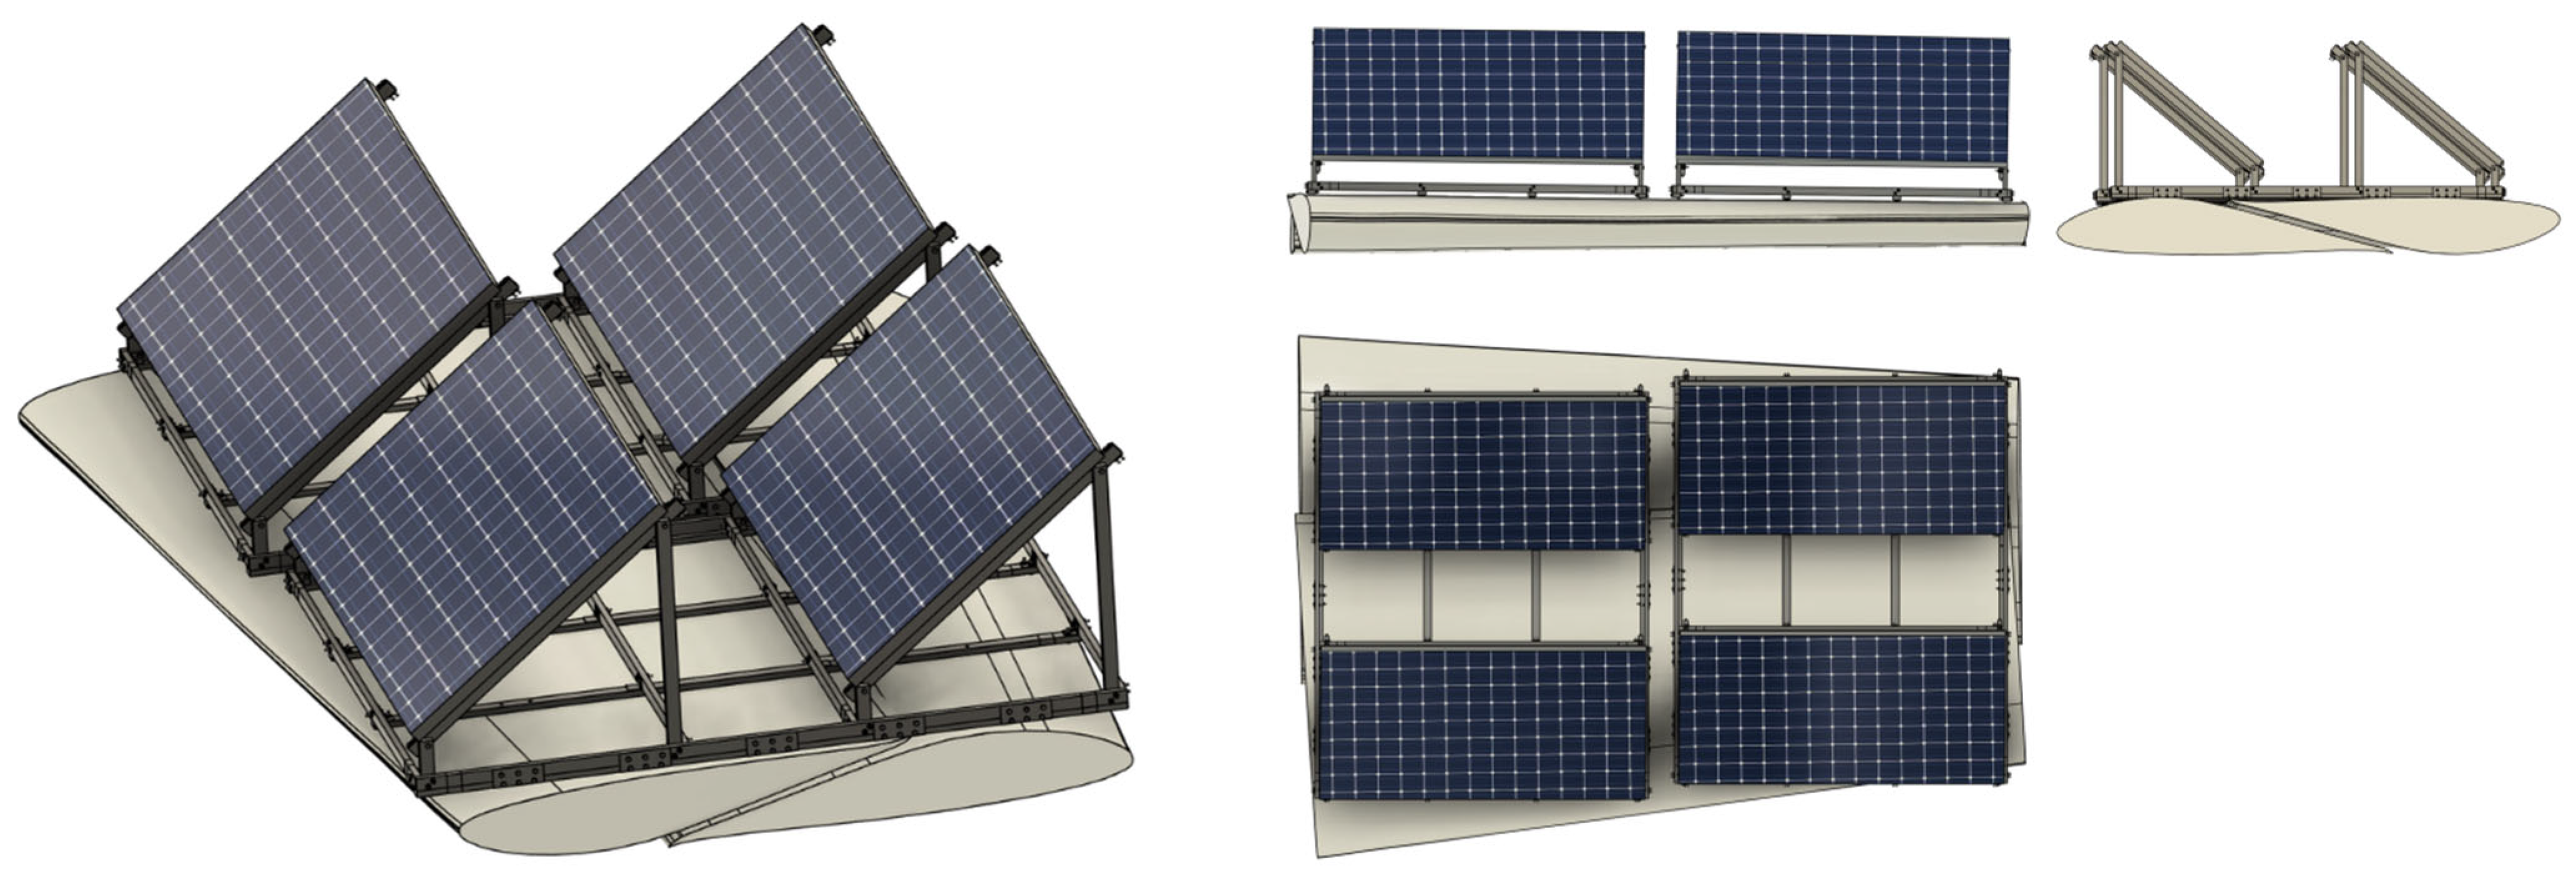
The final design of the full-scale PV-floating demonstrator is illustrated in Figure 9.

2.2. Demonstrator Assembly

2.2.1. Repair Methods to Ensure WTB Segments Floatability

The EoL WTB segments were visually inspected to identify defects requiring localized repair. While sufficient for feasibility assessment, visual inspection cannot detect subsurface or fatigue damage; thus, practical deployment would require non-destructive testing (e.g., ultrasonic, thermographic, or acoustic emission) to ensure long-term structural integrity under hydrodynamic loads. Surface abrasion [30,31] was conducted with a pneumatic orbital sander (80-grit) to remove the weathered surface layer and surface residues. The process was carefully controlled to avoid exposing laminate layers or removing structural material.
Local defects such as surface scratches, shallow dents, and holes up to ~5 mm in diameter were repaired using a two-component epoxy putty, applied and shaped to match the surrounding surface, and cured at room temperature. The same epoxy putty was used to seal areas where the laminate was exposed from transport or cutting operations, providing a protective barrier against moisture ingress and environmental degradation. After curing, repairs were sanded with 120-grit abrasives for surface uniformity. All edges and cut ends of the WTB segment were chamfered to reduce sharp transitions and minimize stress concentration. Shear web components were cut to size and used as lids for the WTB segments (boundary joints hand laminated using glass fibres and epoxy resin). Finally, the entire segment was coated with a waterproof maritime-grade paint (SEA-SPEED® V10X ULTRA CLEAR, Pinehurst, TX, USA) to enhance durability in aquatic environments, consistent with its intended function as a floating support element in the demonstrator.

2.2.2. PV-Floating Demonstrator Assembly

Assembly followed the procedures outlined in Section 2.1. After sealing the ends and applying the protective coating, the two WTB segments were positioned with a crane and overlapped longitudinally to form the platform geometry. TD spar cap beams were bolted across both segments to secure alignment, with silicone applied at bolt interfaces to ensure watertightness. The remaining support structure components were mounted using bolted connections, and the PV panels were then installed, completing the demonstrator assembly, as depicted in Figure S1 in the Supplementary Information.

2.3. Experimental Setup and Testing Methodology

The demonstrator was assembled and tested in the wave basin of the Hydraulics Laboratory at the Faculty of Engineering of the University of Porto (FEUP). The facility measures 28 × 12 × 1.2 m and is equipped with active wave absorption and a dissipating beach to minimize re-reflections. Waves were generated with a 16-paddle HR Wallingford piston-type wavemaker, capable of producing regular, irregular, and short-crested conditions. The objective was to evaluate demonstrator’s performance under representative aquatic environments such as lakes, reservoirs, and rivers. Wave elevation was measured using four resistive-type wave probes (WP). Two probes were placed upstream of the demonstrator in sequence to characterize the incoming wave field, and another two were positioned laterally on either side of the demonstrator (Figure 10). This setup allowed assessment of the wave–structure interaction, as well as reflection and transmission effects with the tank boundaries. All probes were calibrated prior to testing and managed using the HR DAQ Suite software, which was also employed for post-processing the free surface elevation time series.
A Qualisys motion tracking system was utilized to record demonstrator motions in real time across all six degrees of freedom (DoF). Three elevated cameras faced the wave tank to create an accurate volume measurement. Infrared markers were placed on the PV panels following manufacturer guidelines, and the demonstrator was digitally defined as a “rigid body.” Calibration tests were repeated daily or whenever residuals exceeded 0.5 mm, ensuring measurement reliability. Data was acquired at 100 Hz, matching the wave probes. Diagonal tension cables reinforced the demonstrator, providing stability under dynamic conditions such as wind or water movement, with attachment points fixed to the PV support structure corners. Translational (surge, sway, heave) and rotational (roll, pitch, yaw) motions were extracted from the recorded centre-of-mass trajectories for subsequent frequency-domain analysis.
Irregular waves were generated according to the JONSWAP spectrum (peak enhancement factor = 3.3). Three incidence configurations were tested: lateral (3.6 m side facing waves), frontal (1.8 m side facing waves), and oblique. Each test involved irregular waves with significant programmed heights up to 0.30 m and a peak period of 6 s, yielding ~600 waves per run. All three wave configurations were assessed experimentally. For the numerical simulation, the maximum response for each DoF across these configurations was employed (see Table S1), ensuring representation of the most pronounced responses observed.

2.4. Numerical Simulation for Further Optimization of the Design

A numerical simulation was conducted in ANSYS (V2024 R2, Ansys, Inc., Canonsburg, PA, USA) to identify critically stressed components within the assembly, assess weight-reduction potential, and provide a basis for optimization in prospective series production. A calibrated model replicating the final PV-floating demonstrator geometry (Figure 9) was developed for static structural analysis. The workflow employed ANSYS Composite PrepPost (ACP) to define and model layered composite regions in the spar cap beams, ensuring an accurate digital representation of the structural layout and material configuration. This enabled evaluation of the demonstrator’s mechanical response under representative loading conditions.
The WTB segments exhibit greater rigidity than the PV panel support structure, as confirmed by moment of inertia calculations performed using CATIA V5 (Version 6R2020, Dassault Systèmes, Vélizy-Villacoublay, France). For the support structure, the principal moments of inertia were 22.1, 22.4, and 41.5 kg·m2, while for a single WTB shell (20 mm thickness, no inner structure) they were 83.5, 456.4, and 533.7 kg·m2 (see Figure S2). Assuming a similar elastic modulus, the WTBs exhibited far higher bending rigidity and were therefore treated as rigid elements, excluded from the finite element model to avoid unnecessary computational cost.
In the prepared geometry, composite parts were modelled as surface bodies and steel parts as solid bodies, meshed separately and integrated within ACP. Each EoL spar cap beam was represented by a single UD ply (50 × 20 mm surface). Steel components were linked to the static structural analysis, and most contacts were defined as frictional, with “Adjust to Touch” applied where penetration was expected. Bolts were abstracted as deformable beam connectors, while those in contact with WTB segments were modelled as body–ground connections to represent support boundary conditions (Figure 11).
The demonstrator was designed to withstand operation loads, confirmed during wave basin tests (Section 2.3), and served as the primary reference scenario for structural assessment. This short duration experiments qualitatively represent the expected real-world wave conditions. Data were imported into MATLAB (Version R2024b, The MathWorks, Inc.; Natick, MA, USA) for processing (Figure 12). After importing the data and setting the down-sampling size to three, the translational (X, Y and Z) and rotational positions (RX, RY and RZ) of the CM were extracted. A Savitzky–Golay filter was then applied to smooth the dataset and suppress high-frequency noise by approximating a generalized moving average.
After filtering, the velocity is computed using MATLABs numerical gradient function, which applies the central difference method to all inner data points. The same approach is used to calculate acceleration. These calculations are repeated for all dataset configurations (frontal, lateral and oblique). Subsequently, the maximum acceleration for each DoF is identified, as indicated by red and blue dots. The exact maximum values are provided in the Supplementary Information, Table S1.
The maximum values are then applied as translational and rotational acceleration vectors in Ansys Mechanical (Figure 11). This approach provides a conservative representation of the dynamic effects induced by wave-driven displacements on the demonstrator. The loading scenario is thus simplified to be predominantly inertia driven. Modal amplifications were considered negligible, as the excitation frequencies were assumed to be sufficiently distant from the demonstrator’s natural frequencies. This assumption justifies the exclusion of a full modal analysis. Consequently, these simplifications enable the evaluation of potential failure in a quasi-static manner using a static structural analysis.
Potential failure of the UD-beams was assessed using ANSYS Composite Failure Tool, applying damage evaluation by maximum stress, Puck and Cuntze criteria. Material properties were taken from the ANSYS database for epoxy UD-E-Glass material with fibre volume fraction for the spar cap beams at 56%, consistent with experimental results on E66 spar cap material in [29].

2.5. Life Cycle Assessment Methodology and Scope

To assess the environmental impacts of the constructed floating installations, LCA methodology was applied, based on established standards [32,33], and consisted of four stages: (1) Goal and scope definition, (2) Inventory analysis, (3) Impact assessment, and (4) Interpretation. The definition of life cycle stages under investigation was based on EU standard [34], and is schematically depicted in Figure 13. In addition to the assessment of environmental impacts for the repurposed WTB structure (Figure 13a), a comparative LCA was performed with existing PV-floating structures (Figure 13b).

2.5.1. Goal and Scope Definition

This study evaluates the environmental impacts of a floating PV support structure primarily composed of repurposed WTB components at the end-of-life (EoL) stage. This application is assessed as an alternative to conventional EoL treatments for WTB components. A comparative analysis with conventional PV-floating structures made from virgin materials was also performed to determine whether repurposing provides environmental benefits. The functional unit for both systems (i.e., repurposed, conventional) under assessment was defined as “structural support for 1 m2 PV panels, in water, for 30 years”. The durability and thus stated service life of the components for at least 30 years under these operational conditions was based on previous reports for similar structures [35,36,37,38]. Specifically, a typical design lifetime of 25 or more years has been reported for glass fibre composite materials used in structural offshore and marine applications, while the durability and retention of mechanical properties of components depends on factors such as fibre type and orientation, temperature, surface coating, and repairs performed throughout the life cycle of the structure [35,36,38].
For this system, cradle-to-grave system boundaries were considered, excluding the use phase (stages B1–B5), as this was not investigated over long term, and therefore data related to required maintenance, repair, replacement and refurbishment were not available. Deconstruction of the floating structures (stage C1) was also excluded, due to lack of inventory data. Decommissioned components of WTB enter the system boundaries bearing no impacts from the construction, use, or EoL phase of the original structure (i.e., WTs, stages A1–B5). The impacts of separating the required components from the original structure (i.e., sawing certain parts from the WTs during deconstruction), and the impacts of the components’ transport from the original location (i.e., Ihlow, Germany) to the location of the demo installation (i.e., Porto, Portugal) are allocated to the life cycle of the system. Previous reports on the repurposing of decommissioned WTB components have revealed a significant contribution of the component transportation to the overall impacts [20]. Therefore, an alternative scenario, assuming a transport distance of 100 km, is also analysed in the present report, to reflect the contribution of the distance between the WTB location and the installation site of the demo. The remaining components of the WT, as well as their deconstruction prior to EoL treatment, are excluded from the system boundaries. Considering landfilling of WTB waste is banned in Germany [39], the incineration of these components was considered here as the conventional waste treatment process. The burdens of EoL treatment for the decommissioned components (i.e., after 30 years of providing structural support for PV panels) are allocated to the analysed system.
LCA analysis was performed using software SimaPro (version 9.6.0.1), and Ecoinvent library (version 3.10, Cut-off, U) was used to compile the Life Cycle Inventory (LCI). The Impact Assessment method Environmental Footprint 3.1 was selected to calculate the environmental impacts, under 16 Damage Assessment impact categories, namely Acidification Potential (AP) (in mol H+ eq); Climate Change Potential (CC) (in kg CO2 eq); Freshwater Ecotoxicity Potential (ET) (in CTUe); Particulate Matter Potential (PM) (in disease inc.); Marine Eutrophication Potential (ME) (in kg N eq); Freshwater Eutrophication Potential (FE) (in kg P eq); Terrestrial Eutrophication Potential (TE) (in mol N eq); Cancer Human Toxicity Potential (CT) and Non-Cancer Human Toxicity Potential (NT) (in CTUh); Ionizing Radiation Potential (IR) (in kBq U-235 eq); Land Use Potential (LU) (in Pt); Ozone Depletion Potential (OD) (in kg CFC11 eq); Photochemical Ozone Formation Potential (OF) (in kg NMVOC eq); Fossils Resource Use Potential (FR) (in MJ); Minerals and Metals Resource Use Potential (MR); and Water Use Potential (WU) (in m3 depriv.).

2.5.2. Life Cycle Inventory (LCI)

A detailed description of the bill of materials, processes, and waste included in the inventory of the repurposed structure is shown in Table 1. The corresponding Ecoinvent datasets for modelling sub-processes/materials are detailed in the Supporting Information. For the repurposed structure, all inputs, outputs, and corresponding amounts were collected during the construction of the demonstrator, following the processes described in Section 2.1 and Section 2.2. For the conventional structure, the inventory was compiled using available information from scientific literature and online resources [40,41].

3. Results

This section presents the results of the experimental and numerical evaluation of the demonstrator. First, buoyancy and wave basin tests are discussed, highlighting the hydrodynamic response under controlled wave conditions. Next, numerical simulation results are presented, focusing on environmental loading and structural behaviour. Finally, a life cycle assessment (LCA) evaluates the environmental impacts of the materials and configuration, contributing to the overall sustainability analysis of the system.

3.1. Experimental Results of Buoyancy and Wave Tests

The floatability of the demonstrator was assessed following the methodology in Section 2.3, through static equilibrium analysis based on Archimedes’ principle. The initial configuration, with no added ballast, predicted a slightly inclined floating position due to the asymmetry of the structure. Additional mass was added to the wider blade section, producing a waterline nearly parallel to the PV panel base, indicating stable flotation suitable for calm water deployment.
Wave elevation data, acquired using four resistive-type probes, recorded maximum free surface elevations of 0.216 m, 0.178 m, 0.178 m, and 0.180 m. The slight wave amplitude attenuation across the basin, attributed to geometric spreading and partial energy dissipation or reflection in proximity to the demonstrator. The decay pattern is consistent with the lateral positioning of the structure, which received wave impact on a single side, and suggests asymmetrical wave–structure interaction.
Figure 14 presents the power spectral density (PSD) of the measured free surface elevation time series. The graphs reveal a well-defined energy concentration near the target peak frequency (~0.167 Hz), as expected from the JONSWAP spectrum definition. The absence of significant secondary peaks confirms the fidelity of wave generation and minimal contamination from basin reflections or mechanical noise.
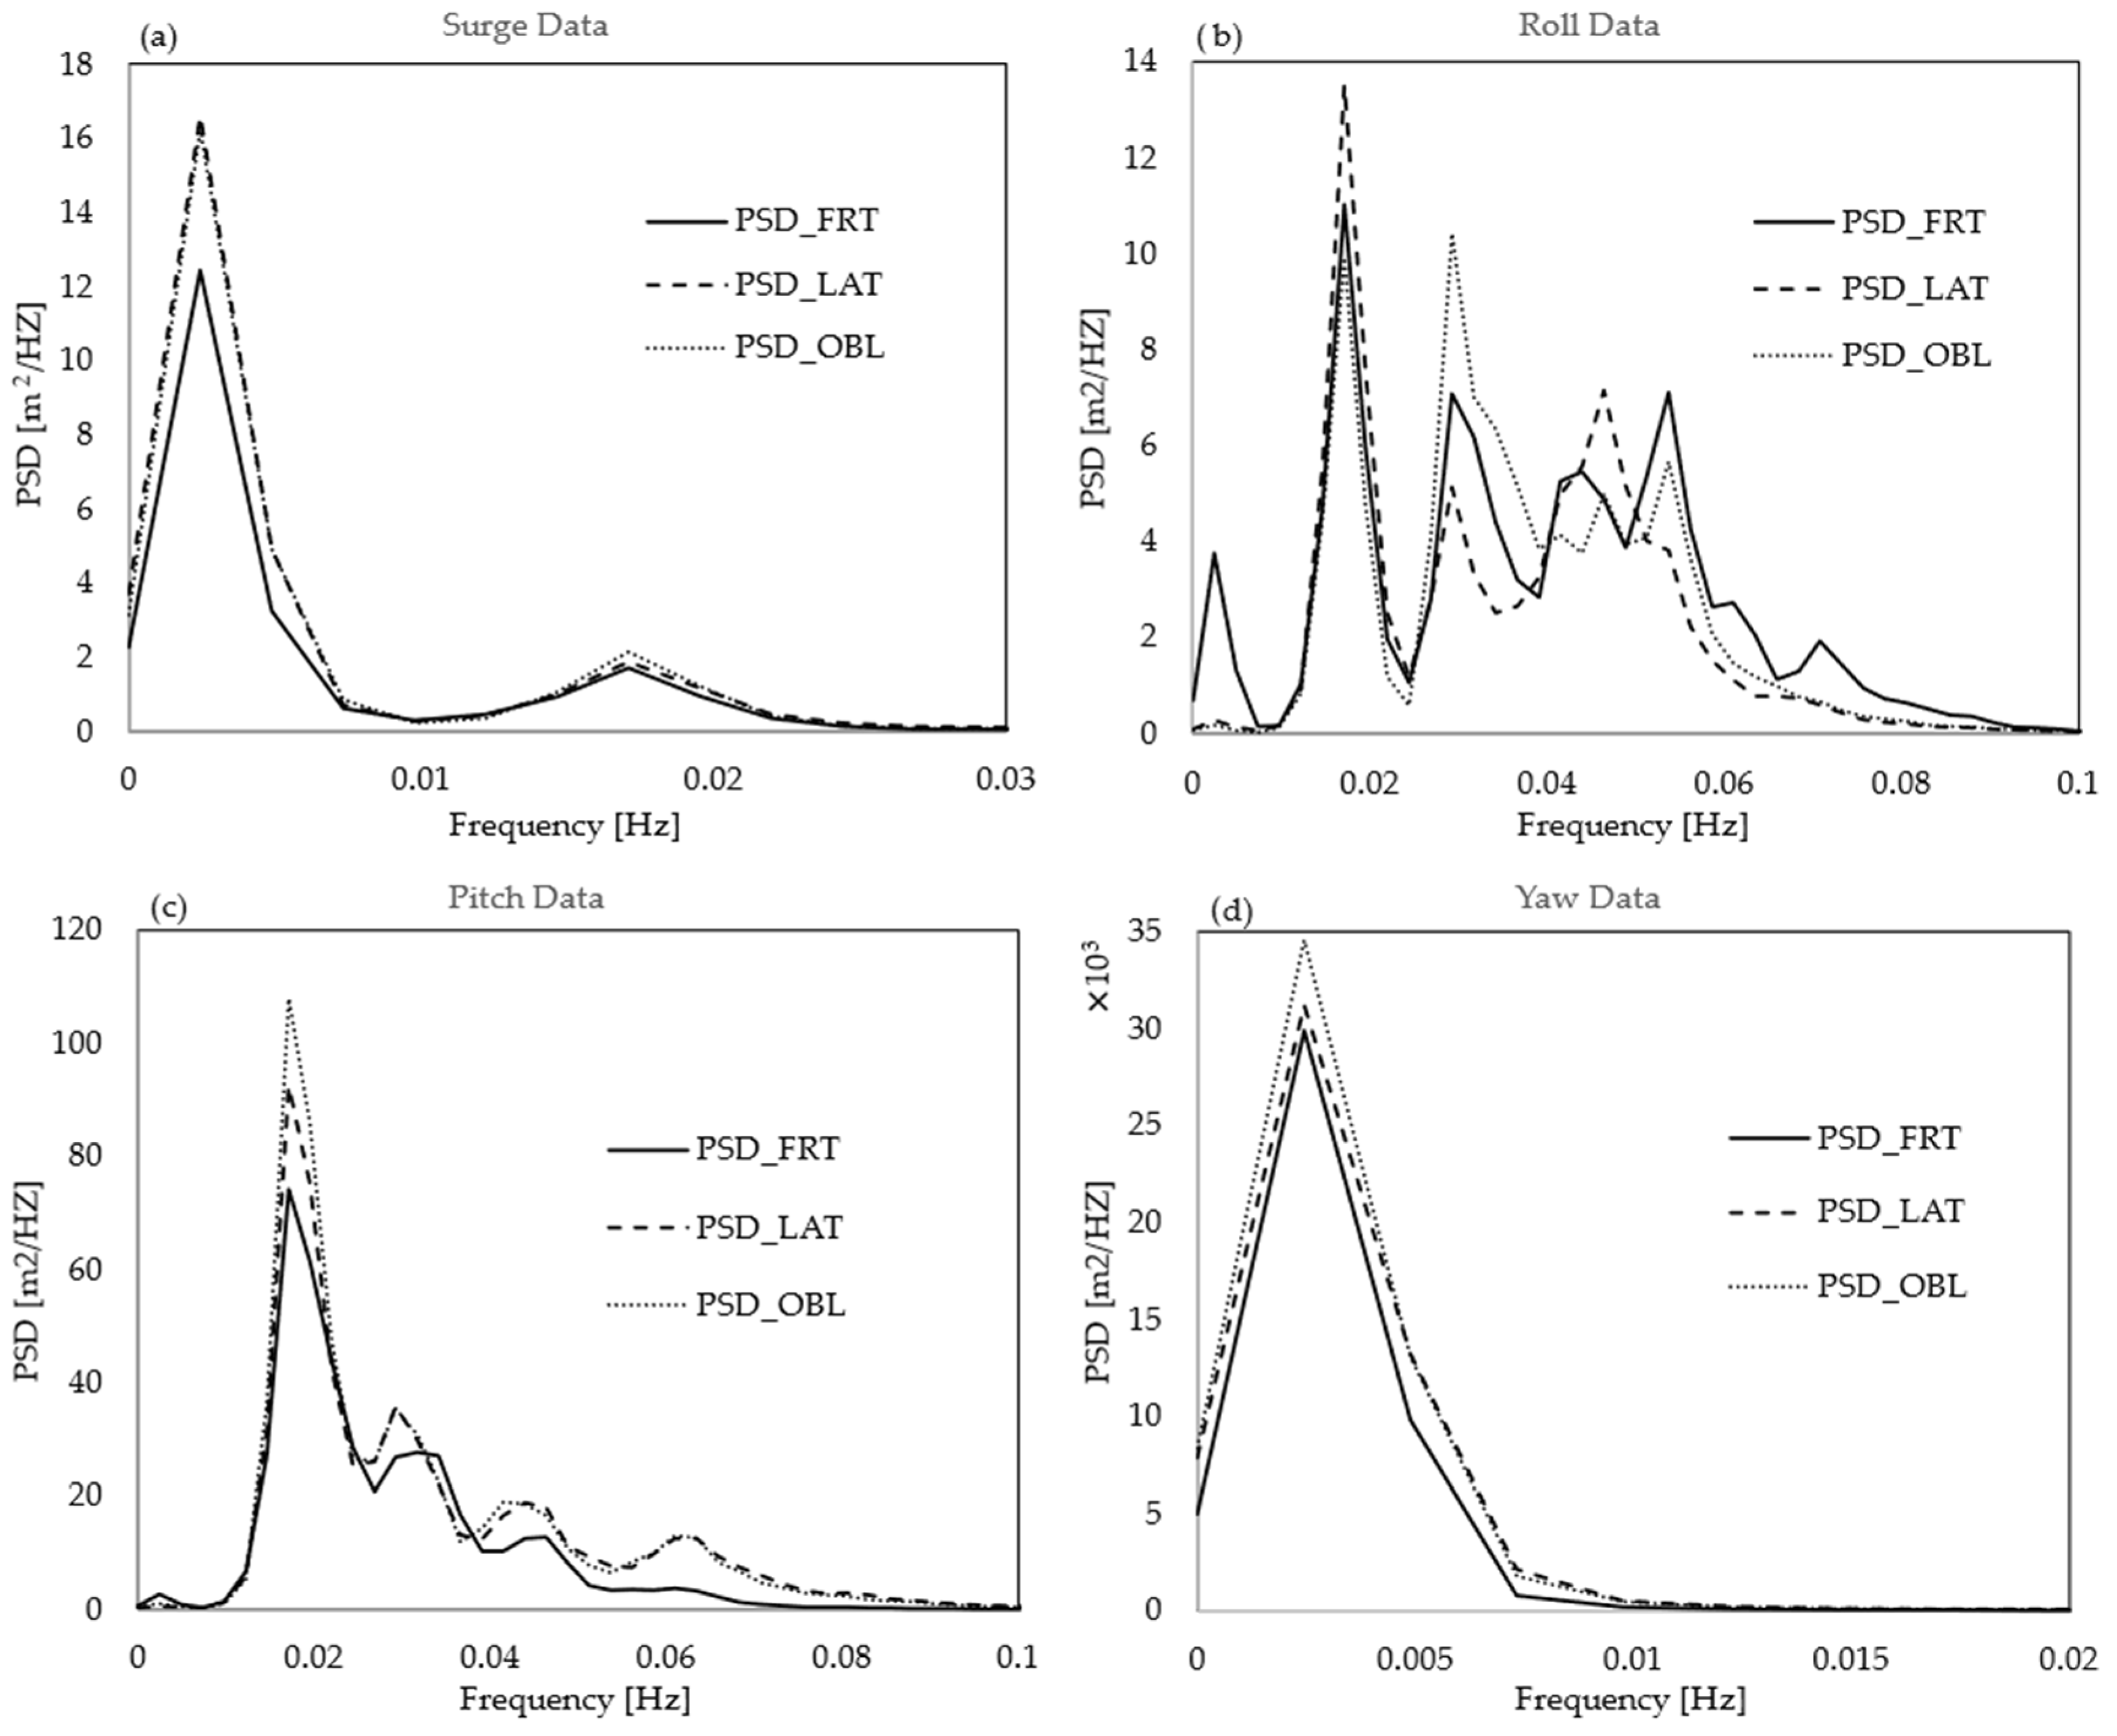
PSD functions for surge, pitch, and yaw were computed using the Welch method and are shown in Figure 15. Surge and pitch spectra reveal dominant energy near the expected wave excitation frequency, consistent with a first-order response to wave forcing. Pitch spectrum exhibited a sharp primary peak with a gradual decay across higher frequencies, indicating a strong resonance-driven response. Pitch response is most energetic under Oblique waves, followed by Lateral and then Frontal incidence, reflecting the directional coupling of wave excitation with platform geometry. Surge response also shows a primary low-frequency peak, along with a secondary higher frequency component, with slightly higher energy under Lateral and Oblique waves, suggesting off-axis excitation. In contrast, roll spectrum displays a series of smaller peaks distributed over a broader frequency range, with no significant variation across wave directions. This broadband behaviour suggests that roll motion is less sensitive to wave heading and likely driven by a combination of directional spreading and platform asymmetry, rather than distinct modal excitation. Finally, the yaw response presents a broader spectral distribution, with significant energy content concentrated at low frequencies, without identifiable secondary peaks. This behaviour indicates a quasi-static or slowly varying yaw motion, rather than a dynamic resonance phenomenon. Despite the absence of sharp spectral features, the yaw response reaches substantial angular excursions, with peak amplitudes reaching 83.7° under Oblique wave conditions and 74.8° in the Frontal case. The persistence and magnitude of these oscillations are of particular concern, as yaw misalignment directly affects the orientation-dependent efficiency of PV modules by altering the angle of solar incidence. These findings emphasize the critical role of yaw stability in the design of PV-floating platforms. Passive yaw-damping solutions or directional mooring strategies should be considered essential to minimize rotational drift and optimize long-term energy yield under realistic operation conditions.
Regarding structural assessment, the spectral content and corresponding motion amplitudes indicate that dynamic amplification is primarily governed by first-order wave effects. Given the absence of high-frequency energy and the predominance of low-frequency, quasi-static motions, it is reasonable to consider a static or quasi-static numerical simulation approach to estimate structural stresses. This is particularly valid if the worst-case accelerations—extracted from the recorded motion data—are used as conservative boundary conditions. Such simulations can provide reliable upper-bound estimates of loading, especially in preliminary design stages or when evaluating structural safety margins under extreme but infrequent operation conditions.

3.2. Numerical Simulation Results of the Environmental Conditions of the Demonstrator

The results of the conducted simulation are structured to feature the following: (i) Maximum displacement, (ii) Inverse Reserve Factor (IRF) utilizing Puck, Cuntze, and Maximum Stress for the spar cap beam support structure. Additionally, the results are compared to a demonstrator with fewer beams, to assess the potential for optimising material usage.
The total deformation reaches a maximum of 12.7 mm in the reduced-beam configuration (Figure 16a) and 9.8 mm in the standard configuration (Figure 16b). In both cases, the maximum deformation occurs in the support structure of the solar panels. However, the assembly with fewer beams additionally suffers from higher deformation in the front. In this region, the overall bottom supporting structure is less rigid than the one with four additional beams.
When looking at the IRF, a similar effect can be observed. In every location, except one on the top left, the factor is higher for the assembly with fewer beams (Figure 17a). Figure 17b shows the configuration with the full number of beams, which generally results in lower factors. Because the configuration with fewer beams shows significantly higher IRF and deformation, the following work focuses solely on the demonstrator with the full number of beams.
Figure 18 highlights four regions of interest that exhibit relatively high IRF values. In Figure 18a, the maximum reaches 0.63, suggesting the potential for local damage. This value is associated with the Puck failure criteria, which identifies matrix-dominated failure near the bolt fixating region. Figure 18b shows a local IRF of 0.583, interpreted using the Cuntze matrix failure criterion. Although, this value remains below critical thresholds, it reflects locally elevated matrix stresses due to bending and contact interaction with an adjacent beam.
A similar trend appears in Figure 18c, where the IRF reaches 0.72, again indicating matrix stress concentrations. This value corresponds to a bonded contact between the solar panel and the supporting beam. Although this result is higher than in other regions, it appears consistently across all panel–beam contact areas and may be attributed to localized contact modelling effects. Finally, Figure 18d displays IRF of 0.628, also classified under the Cuntze criterion, which results from a combination of bending moments and contact interactions with an adjoining beam.
In the full assembly, the numerical analysis identifies potential failure zones that warrant careful monitoring to ensure long-term integrity. The following improvements for future designs of the demonstrator are proposed:
(i)
To mitigate high IRF values near the connection bolts of the WTB segments, a higher number of bolts should be introduced to distribute the load more evenly. Additionally, the use of Class 12.9 Hex Bolts is recommended, as internal stresses in the bolts can be high (see Figure S3)).
(ii)
Plastic end caps connecting the side and bottom spar cap beams could be added for additional reinforcement purposes.
(iii)
If less lateral flexibility in the solar panel structure is desired, lowering the height could save material, increase more rigidity, and offer less contact area for additional wind loads in aquatic conditions.
(iv)
A lower height combined with wider spar cap beams could also reduce bending stresses in the corner beams.

3.3. LCA of Repurposed Floating Demonstrator

LCA was performed on the repurposed structure, and the results were expressed over the 16 impact categories of the Environmental Footprint method. Figure 19 presents the contribution of each type of input and output, along the life cycle of the system. Different components had a different contribution to the impacts but overall, the analysis reveals that the steel used, tooling and machining, surface coating, inbound transport, and EoL treatment were major contributors to the total impacts.
Steel has a significant contribution (≥20%) to the impact categories of human toxicity (CT and NT), MR and FE. NC potential from the upstream production of steel is primarily linked to Lead (II) emissions to air (10% of total impacts per m2), as part of the upstream process of Ferronickel production along the life cycle of steel (25% of total Lead (II) emission impacts per m2). Environmental pollution with Lead along various stages of Ferronickel production have been previously reported [51,52]. CT from the upstream production of steel is primarily due to Antracene emissions (36% of total CT impacts), associated with coke production (i.e., an industrial fuel produced from hard coal), responsible for 37% of total anthracene emission impacts per m2 of repurposed structure. Finally, chromium depletion for the upstream production of steel (modelled as hot-rolled chromium steel) had a significant contribution to MR impacts (37% of MR impacts per repurposed system).
In the comparative LCA, the repurposed structure was compared with two conventional PV floating structures described in the literature: conventional structure A [40,41] and conventional structure B [40,41]. The contribution of different components to the total weight of the structure for the three analysed systems is shown in Table 2. Furthermore, the contribution of each component to CC impacts is also shown for the different structures. The composition of the repurposed structure in terms of main components resembles the one for conventional structure A, with the floating structure components having a major contribution to the weight (>90%), while steel does not exceed 3%. It should be noted that the Ecoinvent process to model steel for the repurposed structure and conventional structure B (i.e., chromium steel) was different than the library process used for conventional structure A (low alloyed steel and its processing), with the latter having lower impact per kg of steel in most impact. Using low-alloyed hot-rolled steel instead of chromium steel to model the overall impacts of the repurposed structure results in over 10% decrease of impacts for several impact categories (AP, FE, NT, IR, MR), with up to 41% increase for MR impacts, whereas ET and CT impacts increase by 7% and 24%, respectively. Therefore, a more careful selection of proxy for the steel components should be considered. This selection should reflect the intended service environment (i.e., long-term structural support in aquatic conditions over 30 years) and account for relevant required material properties, particularly corrosion resistance.
Tooling and machining also contributed significantly (≥20%) to several impact categories, namely FE, IR, and OD (Figure 19). For EF, the main source was the surface abrasion process (17% of impacts per m2 of system), largely due to compressed air use, which accounted for over 80% of total impacts in all categories per hour of surface abrasion. FE was mainly associated with phosphate emissions to water, linked to spoil treatment from hard coal and lignite mining, i.e., two key inputs in the upstream electricity generation for compressed air production (87% of total FE impacts per hour of surface abrasion). Similarly, electricity consumption for compressed air production was the dominant source of IR impacts (99% contribution per hour), largely due to the treatment of uranium milling tailings from the production of nuclear electricity used in the European grid. A combination of various sources was used to model surface abrasion, as a suitable proxy for treatment of composite material surfaces was not available in the Ecoinvent library (Table 1). To place the achieved results in context, an abrasive blasting process for carbon steel using alumina as the abrasive agent was selected as an alternative proxy from Ecoinvent, and the total impacts per m2 of repurposed structure were calculated. Compared to the system modelled as reported in Table 1, the Ecoinvent library proxy for surface abrasion results in significant increase in all impact categories, ranging between 23% (for OD) and over 400% increase (for FE and IR). For this proxy from Ecoinvent, the sub-processes contributing primarily to impacts are similar as for the process modelled here (i.e., compressed air and electricity use). Overall, considering the high variation between the impacts of the selected and alternative proxy, it is advisable to calculate the actual energy and compressed air use for the tools employed in the construction of the demo, for a more reliable assessment of the impacts of the process. Besides surface abrasion, other employed tools during stage A5 also had a significant contribution to impacts. Namely, OD impacts stemmed primarily (44% per m2 surface) from the cutting of shear web components during stage C1. Nearly all of these impacts (>99% per m2) were traced to tetrafluoroethylene, used to model a protection net within the inventory for stone cutting with diamond wire technology [44]. While informative, the overall contribution of machining should be interpreted with caution, as process-specific impacts of proxy data must be evaluated on a case-by-case basis, according to the actual cutting or surface treatment equipment and its corresponding LCI.
The surface coating of the repurposed structures had a measurable contribution (≥20%) to the impact categories of FE, OD, ET, and WU (Figure 19). Among the different coating components, the waterproof maritime-grade coating was the largest contributor (over 70% of total coating impacts) in every impact category. For ET, several of the components in the coating, and their corresponding upstream production, had a significant contribution (≥20% per Litre of coating) to impacts, namely Hexamethyldisilazane (HMDS), Tetraethyl orthosilicate, and Bisphenol A epoxy resin. FE per Litre of coating was primarily due to the upstream production of propanol (50% of impacts) and HMDS (26% of impacts per Litre of coating). OD potential per Litre of coating was primarily (90%) due to the upstream production of HMDS, and more specifically the emissions of Dichlorodifluoromethane (85% of impacts per Litre of coating) during the production of the Methylchloride included in the LCI of HMDS. Finally, WU impacts per Litre of coating were also primarily (over 55% per Litre of coating) due to the upstream production of HMDS. It should be noted that the commercial two-component silane siloxane maritime-grade nano coating used during the construction of the demo could not be modelled based on its ingredients, as only the hazardous components were disclosed in the corresponding Material Safety Data Sheet (i.e., Dibutyltin Dineodecanoate, 3-Aminopropyltriethoxy silane), which contributed to less than 15% of the total mass of the product. Instead, a previously published LCA study on an anti-corrosion coating for maritime applications was used as source of LCI data for the coating’s composition [43]. In addition, several proxies were selected to model this composition, as the actual ingredients were not available in the Ecoinvent library (i.e., HMDS instead of 3-Glycidyloxypropyltrimethoxysilane, Bisphenol A epoxy instead of Poly (bisphenol A-co-epichlorohydrin) glycidyl end-capped, Methyl ethyl ketone instead of Acetil acetone, and Titanium Dioxide instead of Titanium isopropoxide). Interestingly, while the two studies considered here for the conventional structures did not analyse the impacts of the coating (Table 2), Hayibo et al. [53] included a polyurethane marine sealant in their assessment of a floating structure for PV panels, which had a significant contribution to both the weight (67% of total materials) and environmental impacts (up to 94% contribution to the total system’s impacts, for ET). Considering their significant contribution to the overall impacts, the composition of protective coatings, and the selected proxies to model its individual ingredients, should be better evaluated on a case-by-case basis for the specific application (i.e., for surfaces exposed to water), both for future studies on EoL component repurposing applications, but also, in general, for LCA on structures exposed to seawater during their use phase, which require the use of coating.
The transportation of decommissioned components from the original location of the WTB (Germany) to their final installation site (Portugal) (i.e., stage A4), over a distance of 2310 km, had a significant contribution (≥20%) to most impact categories (Figure 19). These impacts are partially depended on how the transport process was modelled. For example, when the European market process from Ecoinvent used to model the transport of repurposed components is switched from EURO4 (current scenario) to EURO6 (i.e., adhering to more strict regulations regarding emissions), significant decrease of up to 37% is calculated for AP, OF, ME and TE impacts per m2 of PV surface. Furthermore, when the lorry size is changed from 16–32 metric tonnes (current scenario) to 3.5–7.5 metric tonnes, all impact categories exhibit increase in impacts by up to 49%, whereas switching to a larger capacity lorry (>32 metric ton) results in decrease in all impacts by up to 13%. Therefore, the selection of an accurate process to model transportation as realistically as possible is important, to decrease the uncertainty of the calculated results.
Besides the process used to model transportation, an alternative scenario was also investigated related to the transportation distance, assuming that the construction of the PV-floating structure takes place closer to the original location of the EoL WTB (100 km distance). The corresponding decrease in impacts per m2 of repurposed structure was calculated, as shown in Figure 20. Measurable decrease, ranging between 12% (for WU) and 57% (for LU), can be observed for all impact categories. Considering the large weight of decommissioned components used here, compared to alternative designs of floating PV installations (Table 2), it is important to optimize the distance of the source material to the installation site, in order for repurposing applications of WTB components to remain environmentally competitive with the use of (virgin) plastic material for floating structures. Overall, different alternative repurposing strategies for EoL materials from WTB should be selected on a case-by-case basis, considering the original location of the materials, the distance from the envisioned location for the repurposed structure, and the application-specific conditions and logistics of the final location (e.g., in this case, the solar irradiance for PV panels).
Finally, the EoL treatment process for the decommissioned components also had a measurable contribution to impacts, particularly (≥20%) for the ET, NT, and CC potential impact categories (Figure 21). The contribution of different sub-processes to the EoL treatment of WTB components (per m2 of structure) is shown in Figure 19. All three impact categories are primarily (i.e., 71%, 63% and 62%, respectively) caused by the incineration of the resin and adhesive portion of the WTB segment (i.e., 25% of the 600 kg component), modelled as mixed plastic waste incineration. ET is primarily (71% of impact per kg of CFRP waste) caused by chloride emissions to water, likely associated with the presence of PVC in the mixed waste composition as modelled in Ecoinvent, which can result in the release of chlorine-containing pollutants [54,55]. NT (per kg of CFRP waste incinerated) is primarily due to Mercury (II) emissions to air and Arsenic ion emissions to water (34% and 37% of total impacts per kg of waste, respectively), released during the incineration of mixed plastic waste (81% of total Hg emission impacts), as has been previously reported [54], or during the landfilling of residual waste from mixed plastic incineration (91% of total As emission impacts), respectively. Finally, per kg of CFRP material being incinerated, 95% of the CC impact is due to CO2 emitted during mixed plastic waste incineration. Considering the significant contribution to impacts of the EoL treatment process, an alternative scenario was investigated as part of a sensitivity analysis, wherein all waste was diverted to a sanitary landfill, instead of incinerated. Per m2 of PV panel surface in the repurposed structure, landfilling results in less than 10% decrease for most impact categories, except for NT (11%), CC (48%) and WU (95% decrease), while for other impact categories the landfill process resulted in increase in impacts (33% for ME and over 150% for ET). These variations in environmental impacts under different alternative EoL treatment scenarios ought to be investigated, particularly considering the expected trends in EoL treatment technologies over the coming 30 years, which necessitate the use of prospective LCA methodology in order to predict and optimize the impacts of WTB component repurposing. Overall, considering the incineration scenario analysed here, per 1 system described here (6.72 m2 PV surface), the EoL treatment of the repurposed components (including all the processes shown in Figure 21) corresponds to CC potential of 575 kg CO2 eq, equal to the impacts of producing 185 kg of virgin polyethylene material (i.e., same material used for constructing approximately 14 m2 conventional structures). Such insights highlight the importance of diverting decommissioned components from waste treatment and developing strategies for the replacement of virgin materials with repurposed components.
The environmental impacts of the repurposed structure (per m2 of PV surface) were compared to the two conventional structures from literature, and the results are shown in Figure 22. It should be noted that for both conventional structures, the protective coating is not included in the LCI (or at least not analysed separately from the plastic components). Similarly, the tooling required for stage A5 is also not included in the LCI. Therefore, the impacts of the repurposed structure are likely overestimated. Nevertheless, for most impact categories, the impacts of the repurposed structure (under the original transport scenario) are within range of the impacts calculated for the conventional systems. In fact, when the alternative inbound transport scenario is considered for the WTB components, the impacts closely follow those of the Conventional A structure, which uses a similar bill of materials in its construction as the repurposed structure (Table 2).

4. Discussion

The presented work demonstrates the feasibility of repurposing EoL WTB segments as floating structural elements for PV support platforms. The assembly process confirmed the practical viability of adapting large-scale composite structures, originally designed for high-performance aerodynamic applications, into buoyant infrastructures. The overlapping of WTB segments and the use of existing structural features, such as spar caps, for integration proved effective in achieving mechanical stability and ease of assembly. Nonetheless, to better support the design, a detailed quantitative comparison of stress distribution, buoyancy performance, and material usage should be addressed in future work.
The integration of experimental testing and calibrated numerical simulation enabled the identification of critical loading areas and informed recommendations for design optimization. Stress concentrations were observed near bolt connections and overlapping components but remained within acceptable limits under Puck and Cuntze failure criteria. Attention to contact conditions and boundary interfaces is recommended for future iterations, particularly in preparation for TRL 7 deployment in real environments.
The simulation employed a simplified static load derived from experimental data, omitting dynamic amplification but capturing realistic inertial effects. Comparative results showed that the original configuration—with more spar cap beams—exhibited better structural performance. Attempts to reduce beam count without geometric redesign led to excessive deformation and IRF values, highlighting that material savings require deeper optimization rather than direct component removal.
Future work should include simulations based on representative EoL material properties, employing appropriate prediction tools to improve accuracy and identify potential reinforcement needs.
Comparative LCA results suggest that repurposed WTB components are a viable substitute for virgin plastics commonly used in floating PV structures. Demonstrators built with repurposed components exhibited environmental impacts comparable to conventional alternatives. Transport distances, however, were shown to strongly influence sustainability: minimizing the distance between turbine decommissioning sites and installation locations can substantially improve environmental performance. A similar service life (30 years, as stated in the Functional Unit definition) was assumed for both systems, but the long-term durability of repurposed components under aquatic conditions must be verified in future studies. A more detailed LCI for tooling and coatings is also needed, as these stages are underrepresented in the literature-based LCIs for conventional systems. This likely overestimates the demonstrator’s environmental footprint, suggesting that the actual benefits of replacing virgin plastics with repurposed WTB components could be greater than reported here.
Despite these promising findings, several barriers must be addressed before industrial-scale implementation. Economically, costs associated with reconditioning EoL WTBs—including transport, cutting, repair, and inspection—must be balanced against those of conventional materials. Technically, long-term evaluation in real-world environments is essential to ensure durability and safety. Logistically, scaling remains challenging due to the size and handling requirements of blade segments. Future research should therefore prioritize life cycle cost analysis, extended field testing, and the development of efficient logistics chains to bridge the gap between laboratory-scale demonstrators and industrial deployment.
Overall, these results highlight both the potential and limitations of integrating repurposed composites into floating PV applications. Key considerations for scaling include design for disassembly, material compatibility, and regional resource availability. Addressing these factors will be critical for advancing toward serial production and embedding this concept within broader CE frameworks.

5. Conclusions

This study demonstrated the technical and environmental feasibility of reusing EoL WTB segments in a full-scale PV-floating demonstrator. By integrating structural design, experimental validation, numerical simulation, and LCA, a holistic framework was established for evaluating second-life applications of composite waste.
From a structural standpoint, the demonstrator reached TRL 6, with laboratory-scale testing confirming adequate performance under realistic conditions. Experimental measurements provided boundary conditions for calibrating a numerical model that informed design decisions and lays the groundwork for a future digital twin framework to support long-term monitoring and optimization.
Environmentally, the repurposed demonstrator performed comparably to conventional floating PV platforms reported in the literature. The LCA identified key hotspots—including cutting and tooling operations, transport, steel reinforcements, surface coatings, and EoL treatment—with transport distance emerging as the most influential factor. While incomplete inventory data for conventional structures may have led to an overestimation of impacts, the results nonetheless support the reuse of WTB components as an effective strategy for diverting waste from landfills and reducing virgin material use in aquatic infrastructure.
Overall, this work highlights the potential of repurposing EoL composites to contribute to CE objectives and sustainable energy solutions (UN SDG7 and UN SDG12). Future efforts should focus on real-world deployment, digital twin integration, and scaling through standardization and modular design.

Supplementary Materials

The following supporting information can be downloaded at https://www.mdpi.com/article/10.3390/su17198717/s1. Excel SI1: Floating_PV_additional_LCA_inventories, Word SI2: Supplementary Information Document.

Author Contributions

Conceptualization, P.J., M.M. and A.A.; methodology, M.M., R.R. and K.-R.C.; software, D.A. and M.M.; formal analysis, M.M., D.A., K.-R.C. and E.S.; investigation, M.M., R.R., P.J., D.A., K.-R.C. and E.S.; resources, A.A. and E.P.K.; writing—original draft preparation, M.M., R.R., P.J., D.A., K.-R.C. and E.S.; writing—review and editing, A.A., R.B. and E.P.K.; visualization, M.M., P.J., D.A. and K.-R.C.; supervision, A.A. and E.P.K.; project administration, A.A. and E.P.K.; funding acquisition, A.A., R.B. and E.P.K. All authors have read and agreed to the published version of the manuscript.

Funding

The study has been performed within the HORIZON-CL4-2021-RESILIENCE-01 project “European recycling and circularity in large composite components (EuReComp),” called “A Digitized, Resource-Efficient and Resilient Industry 2021,” HORIZON Research and Innovation Actions, Contract Number 101058089.

Institutional Review Board Statement

Not applicable.

Informed Consent Statement

Not applicable.

Data Availability Statement

The raw data of this article will be made available by the authors on request.

Acknowledgments

We would like to express our gratitude to Ventos Metódicos (https://www.ventosmetodicos.eu/de) for providing the EoL WTB components. During the preparation of this study, the authors used ChatGPT 4.0 in order to improve readability, grammar and language. The authors have reviewed and edited the output and take full responsibility for the content of this publication.

Conflicts of Interest

The authors declare that the research was conducted in the absence of any commercial or financial relationships that could be constructed as potential conflicts of interest.

Abbreviations

ACPANSYS Composite PrepPost
APAcidification Potential
CCClimate Change Potential
CECircular Economy
CFRPCarbon fibre-reinforced polymer
CMCentre of Mass
CTHuman Toxicity Potential
DoFDegrees of Freedom
EoLEnd-of-life
ETFreshwater Ecotoxicity Potencial
FEFreshwater Eutrophication Potential
FRFossils Resource Use Potential
FRPFibre-reinforced polymer
GFRPGlass fibre-reinforced polymer
GLOGlobal
HMDSHexamethyldisilazane
IRIonizing Radiation Potential
IRFInverse Reserve Factor
LCALife Cycle Assessment
LCILife Cycle Inventory
LDLongitudinal direction
LULand Use Potential
MEMarine Eutrophication Potential
MRMetals Resource Use Potential
NTNon-Cancer Human Toxicity Potential
ODOzone Depletion Potential
OFPhotochemical Ozone Formation Potential
PMParticulate Matter Potential
PSDPower Spectral Density
PtPoints
PTPortugal
PVPhotovoltaic
REREurope
RoWRest of World
TDTransverse direction
TETerrestrial Eutrophication Potential
TRLTechnology Readiness Level
UDUnidirectional
WPWave Probe
WTBWind turbine blade
WUWater Use Potential

References

  1. Mishnaevsky, L.; Branner, K.; Petersen, H.N.; Beauson, J.; McGugan, M.; Sørensen, B.F. Materials for Wind Turbine Blades: An Overview. Materials 2017, 10, 1285. [Google Scholar] [CrossRef] [PubMed]
  2. Beauson, J.; Laurent, A.; Rudolph, D.P.; Pagh Jensen, J. The complex end-of-life of wind turbine blades: A review of the European context. Renew. Sustain. Energy Rev. 2022, 155, 111847. [Google Scholar] [CrossRef]
  3. Pyrzowski, Ł.; Sabik, A.; Kluska, J.; Zembrzuski, J. Stiffness assessment of the laminate recovered from end-of-life wind turbine blade. Compos. Struct. 2024, 348, 118439. [Google Scholar] [CrossRef]
  4. Gopalraj, S.K.; Kärki, T. A review on the recycling of waste carbon fibre/glass fibre-reinforced composites: Fibre recovery, properties and life-cycle analysis. SN Appl. Sci. 2020, 2, 433. [Google Scholar] [CrossRef]
  5. Lahuerta, F.; Gesto, D.; Prieto, C.; Johst, P.; Kucher, M.; Mozas, E.; Gracia, O.; Böhm, R.; Bielsa, J.M. Decommissioning Inventory for Wind Turbine Blades Installed Until 2022 in Europe. Mater. Circ. Econ. 2023, 5, 16. [Google Scholar] [CrossRef]
  6. Liu, P.; Barlow, C.Y. Wind turbine blade waste in 2050. Waste Manag. 2017, 62, 229–240. [Google Scholar] [CrossRef]
  7. Potting, J.; Hekkert, M.; Worrell, E.; Hanemaaijer, A. Circular Economy: Measuring Innovation in the Product Chain. Available online: https://www.pbl.nl/sites/default/files/downloads/pbl-2016-circular-economy-measuring-innovation-in-product-chains-2544.pdf (accessed on 25 January 2023).
  8. Ellen MacArthur Foundation. Towards the Circular Economy: Economic and Business Rationale for an Accelerated Transition. Available online: https://emf.thirdlight.com/file/24/xTyQj3oxiYNMO1xTFs9xT5LF3C/Towards%20the%20circular%20economy%20Vol%201%3A%20an%20economic%20and%20business%20rationale%20for%20an%20accelerated%20transition.pdf (accessed on 20 February 2023).
  9. Johst, P.; Kucher, M.; Schulz, P.; Knorr, A.; Kupfer, R.; Böhm, R. Identification of circular eco-subsystems for end-of-life aviation composite components based on a systematized R6-strategy. J. Phys. Conf. Ser. 2023, 2526, 12055. [Google Scholar] [CrossRef]
  10. Leahy, P.G. End-of-life Options for Composite Material Wind Turbine Blades: Recover, Repurpose or Reuse? In Proceedings of the 14th SWEDES Conference, Dubrovnik, Croatia, 1–6 October 2019; pp. 1–6. [Google Scholar] [CrossRef]
  11. Vishnupriya, V.; Meldrum, J.; Kahandawa, R.; Domingo, N.; Shahzad, W.; Shen, X. Closing the Loop: A Comprehensive Review of Circular Repurposing Options for Decommissioned Wind Turbine Blade Materials. Future Cities Environ. 2024, 10, 17. [Google Scholar] [CrossRef]
  12. Ruane, K.; Soutsos, M.; Huynh, A.; Zhang, Z.; Nagle, A.; McDonald, K.; Gentry, T.R.; Leahy, P.; Bank, L.C. Construction and Cost Analysis of BladeBridges Made from Decommissioned FRP Wind Turbine Blades. Sustainability 2023, 15, 3366. [Google Scholar] [CrossRef]
  13. Alshannaq, A.A.; Bank, L.C.; Scott, D.W.; Gentry, R. A Decommissioned Wind Blade as a Second-Life Construction Material for a Transmission Pole. Constr. Mater. 2021, 1, 95–104. [Google Scholar] [CrossRef]
  14. Johst, P.; Seibert, D.; Zschiebsch, W.; Kucher, M.; Carneiro, C.; Araújo, A.; Santos, R.M.; Rodriguez-Ortiz, L.A.; Alexandra Tapia, E.; Böhm, R. Eco-efficient manufacturing: Transforming end-of-life wind turbine blade components into floats for PV-floating systems. MATEC Web Conf. 2024, 401, 5006. [Google Scholar] [CrossRef]
  15. Rodriguez-Ortiz, L.A.; Suárez, E.A.T.; Muíños-Landín, S.; Boga, D.C.; Araújo, A.; Carneiro, C.; Santos, R.M.; Johst, P.; Böhm, R. Business Guidance on Conformity Assessment of Reuse and Repair for Aeronautics and Wind Energy. In Proceedings of the 14th EASN International Conference on “Innovation in Aviation & Space Towards Sustainability Today & Tomorrow”, Thessaloniki, Greece, 8–11 October 2024; MDPI: Basel, Switzerland, 2025; p. 101. [Google Scholar]
  16. Delaney, E.L.; Leahy, P.G.; McKinley, J.M.; Gentry, T.R.; Nagle, A.J.; Elberling, J.; Bank, L.C. Sustainability Implications of Current Approaches to End-of-Life of Wind Turbine Blades—A Review. Sustainability 2023, 15, 12557. [Google Scholar] [CrossRef]
  17. Henao, Y.; Grubert, E.; Korey, M.; Bank, L.C.; Gentry, R. Life Cycle Assessment and Life Cycle Cost Analysis of Repurposing Decommissioned Wind Turbine Blades as High-Voltage Transmission Poles. J. Constr. Eng. Manag. 2024, 150, 05024004. [Google Scholar] [CrossRef]
  18. Ramaswamy, N.; Joshi, B.; Song, G.; Mo, Y.L. Repurposing Decommissioned Wind Turbine Blades: A Circular Economy Approach to Sustainable Resource Management and Infrastructure Innovation. Renew. Sustain. Energy Rev. 2024, 215, 115629. [Google Scholar] [CrossRef]
  19. Nagle, A. Sustainability Assessment of the Repurposing of Wind Turbine Blades. Ph.D. Thesis, University College Cork, Cork, Ireland, 2022. [Google Scholar]
  20. Johst, P.; Kucher, M.; Bühl, M.; Schulz, P.; Kupfer, R.; Schilling, L.; Santos, R.M.; Carneiro, C.; Voigt, P.; Modler, N.; et al. Identification and Environmental Assessments for Different Scenarios of Repurposed Decommissioned Wind Turbine Blades. Mater. Circ. Econ. 2023, 5, 13. [Google Scholar] [CrossRef]
  21. André, A.; Bru, T.; Abbasi, A.G.; Sinha, S.; Nunes, S.; Juntikka, M.; Kazmierczak, K.; Egilsson, N.Ó.; Frid, G.; Sobczyk, M.; et al. A Holistic and Circular Approach for Managing End-of-Service Wind Turbine Blades. Sustainability 2024, 16, 7858. [Google Scholar] [CrossRef]
  22. Beauson, J.; Brøndsted, P. Wind Turbine Blades: An End of Life Perspective. In MARE-WINT; Ostachowicz, W., McGugan, M., Schröder-Hinrichs, J.-U., Luczak, M., Eds.; Springer International Publishing: Cham, Switzerland, 2016; pp. 421–432. ISBN 978-3-319-39094-9. [Google Scholar]
  23. Jensen, J.P.; Skelton, K. Wind turbine blade recycling: Experiences, challenges and possibilities in a circular economy. Renew. Sustain. Energy Rev. 2018, 97, 165–176. [Google Scholar] [CrossRef]
  24. Hau, E. Wind Turbines; Springer: Berlin/Heidelberg, Germany, 2013; ISBN 978-3-642-27150-2. [Google Scholar]
  25. Ziegler, L.; Gonzalez, E.; Rubert, T.; Smolka, U.; Melero, J.J. Lifetime extension of onshore wind turbines: A review covering Germany, Spain, Denmark, and the UK. Renew. Sustain. Energy Rev. 2018, 82, 1261–1271. [Google Scholar] [CrossRef]
  26. Joustra, J.; Flipsen, B.; Balkenende, R. Structural reuse of wind turbine blades through segmentation. Compos. Part C Open Access 2021, 5, 100137. [Google Scholar] [CrossRef]
  27. Calabrò, E. An Algorithm to Determine the Optimum Tilt Angle of a Solar Panel from Global Horizontal Solar Radiation. J. Renew. Energy 2013, 2013, 1–12. [Google Scholar] [CrossRef]
  28. Alshannaq, A.A.; Respert, J.A.; Bank, L.C.; Scott, D.W.; Gentry, T.R. As-Received Physical and Mechanical Properties of the Spar Cap of a GE37 Decommissioned Glass FRP Wind Turbine Blade. J. Mater. Civ. Eng. 2022, 34, 04022266. [Google Scholar] [CrossRef]
  29. Johst, P.; Bühl, M.; André, A.; Kupfer, R.; Protz, R.; Modler, N.; Böhm, R. Characterisation of End-of-Life Wind Turbine Blade Components for Structural Repurposing: Experimental and Analytic Prediction Approach. Sustainability 2025, 17, 7783. [Google Scholar] [CrossRef]
  30. Katnam, K.B.; Comer, A.J.; Roy, D.; Da Silva, L.F.M.; Young, T.M. Composite Repair in Wind Turbine Blades: An Overview. J. Adhes. 2015, 91, 113–139. [Google Scholar] [CrossRef]
  31. Duong, C.N.; Wang, C.H. Composite Repair: Theory and Design; Elsevier: Amsterdam, The Netherlands, 2007; ISBN 9780080451466. [Google Scholar]
  32. ISO 14040; Environmental Management—Life Cycle Assessment—Principles and Framework. International Organization for Standardization: Geneva, Switzerland, 2006.
  33. ISO 14044; Environmental Management—Life Cycle Assessment—Requirements and Guidelines. International Organization for Standardization: Geneva, Switzerland, 2006.
  34. EN 15978:2011; Sustainability of Construction Works—Assessment of Environmental Performance of Buildings—Calculation Method. European Committee for Standardization: Brussels, Belgium, 2012.
  35. Krauklis, A. Environmental Aging of Constituent Materials in Fiber-Reinforced Polymer Composites. Ph.D. Thesis, Norwegian University of Science and Technology, Trondheim, Norway, 2019. [Google Scholar]
  36. Bazli, M.; Zhao, X.-L.; Jafari, A.; Ashrafi, H.; Raman, R.S.; Bai, Y.; Khezrzadeh, H. Durability of glass-fibre-reinforced polymer composites under seawater and sea-sand concrete coupled with harsh outdoor environments. Adv. Struct. Eng. 2021, 24, 1090–1109. [Google Scholar] [CrossRef]
  37. Chen, C.-F. Offshore floating photovoltaic system energy returns assessment—A life cycle energy analysis-based perspective. AIMSE Energy 2023, 11, 540–554. [Google Scholar] [CrossRef]
  38. Keller, T.; Zand, S.M.; Habibi, T. Composite engineering structures in seawater—Review of durability and environmental performance. Compos. Struct. 2025, 357, 118891. [Google Scholar] [CrossRef]
  39. Deeney, P.; Nagle, A.J.; Gough, F.; Lemmertz, H.; Delaney, E.L.; McKinley, J.M.; Graham, C.; Leahy, P.G.; Dunphy, N.P.; Mullally, G. End-of-Life alternatives for wind turbine blades: Sustainability Indices based on the UN sustainable development goals. Resour. Conserv. Recycl. 2021, 171, 105642. [Google Scholar] [CrossRef]
  40. Cromratie Clemons, S.K.; Salloum, C.R.; Herdegen, K.G.; Kamens, R.M.; Gheewala, S.H. Life cycle assessment of a floating photovoltaic system and feasibility for application in Thailand. Renew. Energy 2021, 168, 448–462. [Google Scholar] [CrossRef]
  41. Kester, J.; Liu, J.; Binani, A. Carbon Footprint Analysis of Floating PV Systems: IEA PVPS Task 12—PV Sustainability Activities. Technical Report. Available online: https://iea-pvps.org/wp-content/uploads/2024/07/IEA-PVPS-T12-29-2024-EXEC-SUMM-Floating-PV-Carbon-Footprint.pdf (accessed on 26 June 2025).
  42. MSDS—Ficha de Dados de Segurança. Available online: https://media.adeo.com/media/2570120/media.pdf (accessed on 3 July 2025).
  43. Borgaonkar, A.; McNamara, G. Environmental Impact Assessment of Anti-Corrosion Coating Life Cycle Processes for Marine Applications. Sustainability 2024, 16, 5627. [Google Scholar] [CrossRef]
  44. Bianco, I. Life Cycle Inventory of Cutting Technologies in the Ornamental Stone Supply Chain. Doctoral Thesis, Politecnico di Torino, Turin, Italy, 2018. [Google Scholar]
  45. Joteo. Electricity Usage and Cost Calculator. Available online: https://joteo.net/electricity-usage-calculator (accessed on 7 July 2025).
  46. Zhu, M.; Guo, W.; Ouyang, J.; Wei, C.; Pratomo, E.S.; Mativenga, P.; Li, L. Low carbon high quality simultaneous laser and mechanical hybrid drilling of carbon fibre reinforced polymer composite. CIRP J. Manuf. Sci. Technol. 2023, 46, 1–18. [Google Scholar] [CrossRef]
  47. Fingersh, L.; Hand, M.; Laxson, A. Wind Turbine Design Cost and Scaling Model. Available online: https://www.nrel.gov/docs/fy07osti/40566.pdf (accessed on 2 February 2023).
  48. Nagle, A.J.; Delaney, E.L.; Bank, L.C.; Leahy, P.G. A Comparative Life Cycle Assessment between landfilling and Co-Processing of waste from decommissioned Irish wind turbine blades. J. Clean. Prod. 2020, 277, 123321. [Google Scholar] [CrossRef]
  49. Johst, P.; Lee, S.; Kim, E.; Bae, S.; Böhm, R.; Na, W. Structural integrity assessment of repurposed wind turbine blade composite components with acoustic emission testing and Ib-value analysis. Compos. Part B Eng. 2025, 301, 112490. [Google Scholar] [CrossRef]
  50. Schindler, A.K.; Duke, S.R.; Galloway, W.B. Co-processing of end-of-life wind turbine blades in portland cement production. Waste Manag. 2024, 182, 207–214. [Google Scholar] [CrossRef] [PubMed]
  51. Fry, K.L.; Gillings, M.M.; Isley, C.F.; Gunkel-Grillon, P.; Taylor, M.P. Trace element contamination of soil and dust by a New Caledonian ferronickel smelter: Dispersal, enrichment, and human health risk. Environ. Pollut. 2021, 288, 117593. [Google Scholar] [CrossRef]
  52. Marrugo-Negrete, J.; Pinedo-Hernández, J.; Marrugo-Madrid, S.; Díez, S. Assessment of trace element pollution and ecological risks in a river basin impacted by mining in Colombia. Environ. Sci. Pollut. Res. Int. 2021, 28, 201–210. [Google Scholar] [CrossRef] [PubMed]
  53. Hayibo, K.S.; Mayville, P.; Pearce, J.M. The greenest solar power? Life cycle assessment of foam-based flexible floatovoltaics. Sustain. Energy Fuels 2022, 6, 1398–1413. [Google Scholar] [CrossRef]
  54. Verma, R.; Vinoda, K.S.; Papireddy, M.; Gowda, A. Toxic Pollutants from Plastic Waste- A Review. Procedia Environ. Sci. 2016, 35, 701–708. [Google Scholar] [CrossRef]
  55. Kudzin, M.H.; Piwowarska, D.; Festinger, N.; Chruściel, J.J. Risks Associated with the Presence of Polyvinyl Chloride in the Environment and Methods for Its Disposal and Utilization. Materials 2023, 17, 173. [Google Scholar] [CrossRef]
Figure 1. Flowchart of methodology adopted.
Sustainability 17 08717 g001
Figure 2. Cutting process for extracting WTB segments and spar cap beams from EoL WTBs: (a) TD cuts, (b) cross-section, and (c) LD cuts.
Sustainability 17 08717 g002
Figure 3. Geometric characterisation of E66 WTBs, (a) WTB scanned stations’ profiles, (b) WTB segment with dimensions, (c) cross-sectional profile of the blade at 15.5 m from tip.
Sustainability 17 08717 g003
Figure 4. Schematic representation of preliminary concept design of WTB floats for PV panels.
Sustainability 17 08717 g004
Figure 5. Hypothesis for overlapping two WTB segments. In (a), hypothesis one, the short width overlaps with the long width. In (b), hypothesis two, the long width overlaps with the long width.
Sustainability 17 08717 g005
Figure 6. Final segmentation after the design.
Sustainability 17 08717 g006
Figure 7. Experimental characterization of the centre of mass. (a) LD direction CM giving the X position where the straps balance the WTB; (b) is the same as (a), confirming the X position of CM; (c) TD direction CM giving the Y position where the straps balance the WTB.
Sustainability 17 08717 g007
Figure 8. Support structure for the WTB segments as floaters and PV panels.
Sustainability 17 08717 g008
Figure 9. Design of the repurposed PV-floating demonstrator.
Sustainability 17 08717 g009
Figure 10. Floatability test setup with 4 resistive-type WP.
Sustainability 17 08717 g010
Figure 11. Boundary and Load conditions (blue: body–ground beam connection; yellow: acceleration load at the centre of mass).
Sustainability 17 08717 g011
Figure 12. Exemplary MATLAB approach for short-cycle-test dataset in frontal configuration, maximum acceleration for each DoF is indicated by red and blue dots.
Sustainability 17 08717 g012
Figure 13. Value chain of repurposed (a) and conventional (b) PV-floating structures. The processes included in the system boundaries are indicated with black icons and font, while processes excluded from the system boundaries are indicated by grey icons and font.
Sustainability 17 08717 g013
Figure 14. PSD for Water Level Height on Lateral configuration under irregular waves.
Sustainability 17 08717 g014
Figure 15. PSD during irregular wave test for three demonstrator configurations: Frontal (FRT), Lateral (LAT) and Oblique (OBL) considering (a) surge, (b) roll, (c) pitch and (d) yaw.
Sustainability 17 08717 g015
Figure 16. Total Deformation (in mm) of the two assemblies: (a) with fewer beams used (b) with full number of beams.
Sustainability 17 08717 g016
Figure 17. IRF of the two assemblies. (a) With less beams used. (b) With full number of beams.
Sustainability 17 08717 g017
Figure 18. Detailed view of the IRF of the final assembly: (a) Bottom spar cap beam connecting bolt load area. (b) Side spar cap beam showing a bending load. (c) Spar cap beam in bonded contact with the solar panel. (d) Smaller spar cap beam in the corner showing a bending load.
Sustainability 17 08717 g018
Figure 19. LCA outcomes for repurposed structure: contribution (%) of different inputs and outputs throughout the system’s life cycle to the overall impacts for different impact categories.
Sustainability 17 08717 g019
Figure 20. Impact decrease for alternative inbound transportation scenario for WTB components.
Sustainability 17 08717 g020
Figure 21. Contribution of different sub-processes to the EoL treatment of decommissioned WTB components (per m2 of floating structure).
Sustainability 17 08717 g021
Figure 22. Comparative assessment of conventional and repurposed structures (per m2). Repurposed structures are analysed based on original transportation distance (DE-PT scenario, 2310 km) and alternative WTB component transport (100 km scenario). Conventional structures include 100 km transport scenario for used materials and generated waste.
Sustainability 17 08717 g022
Table 1. LCI for repurposed system.
Input/OutputDatasetAmountUnitComment
EoL wind turbine componentsn.a.2 × 300kg-
Spar cap beamsn.a.97kg-
Epoxy putty for surface defectsCreated composition1.5kgbased on [42]
Epoxy resin and glass fibres for laminatingCreated composition (resin); Glass fibre, market, GLO1 L (resin); 400 g (fibre)L; gramsbased on proxy
Waterproof maritime-grade paintCreated composition14.7kgfrom [43]
Steel (i.e., brackets, plates, bolts, nuts, washers)Chromium steel 18/8, hot-rolled, market, GLO16.7kg-
SiliconeSilicone product, market, RER320g-
Cement sawing, for TD cuts (stage C1)Soft stone cutting using
diamond wire technology, created process
1.06m2from [44]
Surface abrasion with pneumatic orbital sander (stage A5)Electricity, Compressed air, Waste2 × 6hprocess compiled from various sources
Cutting shear web components (stage A5)Power sawing, with catalytic converter, RER1h-
Table saw for cutting spar beams (stage A5)Electricity, high voltage, market, PT20 kWh/10 hKWh, hfrom Joteo calculator [45]
Drilling holes on steel connections (stage A5)Steel removed by drilling, computer numerical controlled, RER229grams steel removed-
Drilling holes on composite (stage A5)Electricity, high voltage, market, PT38 MJ/6 hMJ, hfrom [46]
Cutting steel brackets and plates (stage A5)Power sawing, with catalytic converter, RER3h-
Inbound transport EoL components (stage A4)Transport, freight, lorry 16–32 metric ton, EURO4, market, RER2310 or 100kmactual distance and assumed distance
Inbound and Waste
transport (other materials)
(stage A4 and C2)
Transport, freight, lorry 16–32 metric ton, EURO4, market, RER100kmAssumed distance
Product: Repurposed floating systemn.a.6.72m2Surface area of PV panels
EoL treatment: composite structuresCreated process2 × 300kgBased on stated composition [47]
EoL treatment: shredding composite structuresElectricity, high voltage, market, PT102 per structure; 0.71 per kgMJfrom [48]
EoL treatment: spar cap beamsWaste polyethylene, treatment, municipal incineration, GLO61% × 97kgBased on composition, from [49,50]
Waste glass, treatment, municipal incineration, GLO39% × 97kg
EoL treatment: coatingsWaste plastic, mixture, treatment, municipal incineration, GLO18kg-
EoL treatment: steelWaste reinforcement steel, treatment, recycling, RoW16.7kg-
Table 2. Weight percentage of different components per structure, and calculated CC contribution to the overall structure impacts.
IndicatorConventional Structure AConventional Structure BRepurposed
Weight percentage steel (%)3%30%2%
Contribution to CC of steel (%)1%24%8%
Weight percentage plastic/WTB parts (%)92%70%95%
Contribution to CC of plastic/WTB parts (%)55%44%0%
Weight percentage coating (%)n.a.n.a.3%
Contribution to CC of coating (%)n.a.n.a.8%
Total structure weight (per m2)12.4 kg20.3 kg109 kg
Contribution to CC of EoL plastic/WTB parts (%)38%31%47%
Contribution to CC of WTB/plastic parts inbound transport (%)<1%<1%26%
Contribution to CC of tools (%)n.a.n.a.5%
Disclaimer/Publisher’s Note: The statements, opinions and data contained in all publications are solely those of the individual author(s) and contributor(s) and not of MDPI and/or the editor(s). MDPI and/or the editor(s) disclaim responsibility for any injury to people or property resulting from any ideas, methods, instructions or products referred to in the content.