Article

Are There Differences in the Response of Lake Areas at Different Altitudes in Xinjiang to Climate Change?

1
College of Urban and Environmental Sciences, Shihezi University, Shihezi 832000, China
2
College of Information and Science Technology, Shihezi University, Shihezi 832000, China
3
Tarim River Basin Management Bureau, Korla 841000, China
4
Xinjiang Water Conservancy Society, Urumqi 830000, China
*
Author to whom correspondence should be addressed.
Sustainability 2025, 17(19), 8705; https://doi.org/10.3390/su17198705
Submission received: 14 August 2025 / Revised: 9 September 2025 / Accepted: 24 September 2025 / Published: 27 September 2025

Abstract

Lakes account for approximately 87% of the Earth’s surface water resources and serve as sensitive indicators of climate and environmental change. Understanding how lake areas respond to climate change across different elevation gradients is crucial for guiding sustainable water resource management in Xinjiang. We utilized Landsat series remote sensing imagery (1990–2023) on the Google Earth Engine (GEE) platform to extract the temporal dynamics of natural lakes larger than 10 km2 in Xinjiang, China (excluding reservoirs). We analyzed the relationships between lake area dynamics, climatic factors, and human activities to assess the sensitivity of lakes at different altitudinal zones to environmental change. The results showed that (1) the total area of Xinjiang lakes increased by 1188.36 km2 over the past 34 years, with an average annual area of 5998.54 km2; (2) plain lakes experienced fluctuations, reaching their maximum in 2000 and their minimum in 2015, alpine lakes peaked in 2016, and plateau lakes continued to expand, with the maximum recorded in 2020 and the minimum in 1995; and (3) human activities such as urban and agricultural water use were the primary causes of shrinking plain lakes, while an increased PET accelerates evaporation, alpine lakes were influenced by both climate variability and human disturbance, and plateau lakes were highly sensitive to climate change, with rising temperatures increasing snowmelt and glacial runoff into lakes, which were the main drivers of their expansion. These findings highlight the importance of incorporating elevation-specific lake responses into climate adaptation strategies and sustainable water management policies in arid regions.

1. Introduction

Lakes are a critical component of the terrestrial hydrosphere, accounting for 87% of the Earth’s surface water resources [1,2], and serve as a sensitive indicator of climate change [3]. With global warming and rapid human economic development, the spatial distribution of water resources, including wetlands, lakes, and rivers, has undergone substantial changes [4]. Human activities have increasingly altered lake dynamics, and studies have shown a continuous decline in lake and wetland areas in recent decades, making them among the fastest disappearing ecosystems under anthropogenic pressures [5,6] and making them the natural ecosystems with the fastest rate of area reduction under the influence of human activities [7]. Climate change has further intensified these transformations by significantly affecting the duration of stratification in low-elevation lakes as well as in middle and high-altitude lakes and ice-covered systems [8].
Climate driven fluctuations in lake surface area have been widely observed in remote regions worldwide under conditions of global ecosystem degradation and severe water scarcity. In the Third Pole region, warming accelerates glacier melt and alters precipitation regimes, reshaping the dynamics in high-elevation glacial lakes in the Third Pole [9] as well as in lakes that rely on snow and ice meltwater as their primary source of recharge [10]; Arctic perennial permafrost areas are losing lake area [11]. Greenland has already lost 326 high-elevation glacial lakes [12]; in the Italian Alps, low-elevation ponds are shrinking or vanishing due to an increase in evaporation/precipitation ratios [13]. Human-induced fluctuations are also well documented; the retreat of major saline lakes has been closely tied to large-scale water abstraction [7]; agricultural irrigation has intensified water scarcity in the Yangtze River Basin [14]; and in the Middle East and Central Asia, anthropogenic diversions, damming, and unsustainable water-use practices account for nearly 70% of global permanent water loss [15].
Arid and semi-arid ecosystems are fragile, and water resources play a central role in regional socioeconomic development and watershed management. The combined effects of climate change and human activities have intensified water resource pressures in arid and semi-arid regions [16,17,18]. On the one hand, climate change, including rising temperatures, altered precipitation patterns, and increased evaporation, and on the other hand, the continuous expansion of human activities, particularly agricultural irrigation and accelerated urbanization, directly or indirectly affect lake areas [19]. In arid zones, extensive lake shrinkage has already triggered severe ecological degradation and substantial economic losses [20]. In North African and North American arid regions, persistent drought and enhanced evaporation have led to rapid lake shrinkage [21,22]. However, the scarcity of data on lakes in arid regions and the rapid fluctuations in their dynamics make it challenging to achieve rapid monitoring through routine surveys [23]. Therefore, to protect lake ecosystems, it is important to monitor particularly vulnerable arid areas promptly and to explore the factors that contribute to changes in lake size.
Xinjiang, located in northwestern China at the heart of the Eurasian continent, is characterized by an arid to semi-arid climate [24]. The region has experienced prolonged periods of water scarcity. The region is characterized by a typical inland arid landscape, with numerous lakes distributed across different altitudinal gradients, including plains, alpine, and plateau lakes. This diversity of lake types makes Xinjiang an ideal region for studying the changes in lakes. These water bodies play crucial ecological and socioeconomic roles, exerting significant influence on basin scale ecological stability and sustainable development [25]. In the context of climate change, which has led to increased temperatures and humidity in the region [26], the substantial changes in the lake area in Xinjiang [27] have significant implications for the basin’s ecological environment. In recent years, many studies have employed multi-source remote sensing imagery to examine long-term lake area dynamics in Xinjiang and to assess the impacts of both climate change and human activities. The interannual fluctuation of the oasis lake area change at low altitude is obvious with a decreasing trend [16]. Climate fluctuations and human activities (urban and agricultural water use) together dominate the interannual variability characteristics of oasis lakes, and anthropogenic disturbances increase the complexity of lake responses to the climate [28]. Although oasis lakes with surface runoff as the main recharge source have been well studied, the climate response of lakes located at other altitudes needs to be further explored.
In order to gain an in-depth understanding of the changes in the long-term time series of lake water resources in Xinjiang, this study utilized the Google Earth Engine (GEE) platform to extract lake area time series data for Xinjiang from 1990 to 2023. Water bodies were delineated using an enhanced Modified Normalized Difference Water Index (MNDWI) combined with Otsu’s thresholding method. A trend analysis was conducted via Theil Sen slope estimation and nonparametric Mann–Kendall tests. Finally, a partial correlation analysis examined the driving roles of meteorological and anthropogenic factors in lake area changes. The main objectives of this paper are (1) to analyze the trend of lake area changes in Xinjiang from 1990 to 2023 based on remote sensing image data; (2) to study the spatial and temporal changes in typical lakes at different altitude gradients separately; and (3) to identify the driving factors of the changes in the lake area at different altitude gradients.

2. Materials and Methods

2.1. Study Area

Located in the northwestern part of China, Xinjiang Uygur Autonomous Region lies at the heart of the Eurasian hinterland (Figure 1), at the center of the Eurasian continent, and is a typical inland arid landscape with a variety of terrain types and complex structures. The Altai Mountains lie in the northernmost part of the region, while the Tien Shan Mountains traverse the central region, dividing Xinjiang into southern and northern Xinjiang. The Kunlun Mountains lie in the southernmost part of the region, while the Junggar Basin is situated between the Altai Mountains and the Tien Shan Mountains, and the Tarim Basin extends between the Tien Shan and Kunlun Mountains, together forming the characteristic topography of “three mountain ranges and two basins.” In the context of global climate change, temperature in Xinjiang typically rises at a rate that exceeds the global and Chinese averages, and precipitation patterns change [29].
Based on Xinjiang’s topographical structure, Xinjiang’s lakes are classified by elevation into plain lakes (<1500 m), alpine lakes (1500–3500 m), and plateau lakes (>3500 m). An elevation of 1500 m is a critical threshold for climate change; Figure 1 shows all lakes larger than 10 km2 in 2023. Historical temperature data from the Tianshan Mountains indicate a distinct temperature gradient at this elevation; precipitation analysis shows a significant increase in precipitation above this elevation; additionally, many ecological species (such as Tibetan antelopes and golden monkeys) are primarily distributed above this elevation, indicating that ecosystems exhibit a significant response to this elevation [30,31,32]. Areas above 3500 m are typically located at the edge of the Qinghai–Tibet Plateau, characterized by permafrost, year-round snow cover, and minimal human disturbance.
Table 1 presents the basic information of three representative lakes at different elevation gradients, with data sourced from the global lake database HydroLAKES (available from https://www.hydrosheds.org/products/hydrolakes, accessed on 11 September 2025).

2.2. Data Sources

The basic data include meteorological data (annual precipitation, average annual temperature, and potential evapotranspiration), nighttime lighting data, and land cover data, and each data source is listed in Table 2.
For temperature data, ERA5-Land was selected due to its high temporal resolution and global consistency. Previous studies have indicated that ERA5 performs well in most regions of China, particularly in terms of temperature simulation [33]. For precipitation data, the TerraClimate dataset was used. This dataset integrates multi-source information from CRU, PRISM, and reanalysis products, undergoes bias correction, and provides precipitation estimates at a 1/24° spatial resolution that are closer to observed values. Compared to ERA5, TerraClimate demonstrates higher accuracy in capturing precipitation changes in arid inland regions with sparse observation stations. Therefore, this study selected ERA5 (temperature) and TerraClimate (precipitation) to ensure the optimal applicability of both variables in the arid regions of Xinjiang. To ensure consistency and comparability across datasets, all raster data were resampled to a spatial resolution of 1 km before subsequent analysis.

2.3. Lake Selection and Mapping

To ensure the stability of lake boundary extraction and data consistency, only lakes larger than 10 km2 were selected for analysis. Compared with small water bodies, medium-sized and large lakes are more likely to exist for a long period of time in arid zones and are less affected by seasonal changes, which makes the extraction accuracy in 30 m resolution images higher.
GEE (Google Earth Engine) is a cloud platform specialized in computing and processing of satellite remote sensing data, which is of great significance for large-scale geoscientific studies [34]. Given the large extent of the study area, a mosaic stitching of at least 113 views of raw satellite imagery is required for a single year if the imagery needs to be covered in the entire study area. Considering the data quality, quantity, and continuity, this study decided to use Landsat5/7/8/9 top-of-atmosphere (TOA) reflectance data (with atmospheric radiometric and geometric corrections) for the years 1990–2023. In this study, we used the GEE platform to retrieve Landsat satellite images from July to September, which is the period after the glacier melt and rainy season, during which most lakes in the high-altitude area reach the maximum area of the year and show relatively stable water levels, which is suitable for long-term water dynamics monitoring. In order to avoid image quality degradation due to image turbidity [35], the remote sensing images were de-clouded and median synthesized as the main data source for this study. Lake extents were identified through the Modified Normalized Difference Water Index (MNDWI) [36]. To separate water and non-water pixels, the Otsu algorithm was applied to automatically identify the optimal classification threshold. The algorithm automatically identifies the optimal segmentation point between water bodies and non-water bodies by maximizing the inter-class variance of pixel values, avoiding the uncertainty associated with subjectively set thresholds. The method can realize adaptive classification of water bodies in different years and lake environments. Finally, lakes with an area larger than 10 km2 are screened as the study objects to obtain the lake area series in Xinjiang from 1990 to 2023. The above work was processed in the GEE platform. The water body index was calculated by the following formula:
M N D W I = G r e e n S W I R / G r e e n + S W I R

2.4. Statistical Analysis

2.4.1. Trend Analysis

To analyze the long-term trends of lake area changes, we applied the non-parametric Mann–Kendall (MK) test to assess the significance of trends [37], which is widely used for monotonic trend detection in hydrological and climatological time series. The MK statistic S is calculated as follows:
S = i = 1 n 1 j = i + 1 n s g n x j x i
Here, sgn() is the sign function, calculated as follows:
s g n x j x i = + 1 ,   x j x i > 0 0 ,   x j x i = 0 1 ,   x j x i < 0
Here, x i and x j are sequential observations of the time series, and n is the length of the series. Under the null hypothesis of no trend, the variance of S is
V a r S = n n 1 2 n + 5 18
The standardized test statistic Z is then computed as follows:
Z = S 1 V a r S ,   S > 0 0 ,   S = 0 S + 1 V a r S ,   S < 0
Z > 0 (<0) indicates an upward (downward) trend, and the corresponding p-value determines the significance level of the trend.
To further quantify the rate of change, we adopted the Sen’s slope estimator [38], which calculates the median slope of all pairwise data points in the time series:
S l o p e = m e d i a n ( x j x i j i ) j > i
Here, xi and xj are the time series data, the slope table lake area change trend, where >0 means area expansion and <0 means area shrinkage.
In this study, the long-term trend analysis of lake area changes is based on the combined Theil Sen median–Mann–Kendall method, and the criteria for determining the significance of the trends are shown in Table 3.

2.4.2. Partial Correlation Analysis

The partial correlation between each influence factor and lake area was calculated, and the Pearson correlation coefficient (r) was used to characterize the strength of the (partial) correlation, with the p-value indicating the level of significance: the closer the |r| is to 1, the stronger the (partial) correlation is; p < 0.05 indicates a significant (partial) correlation at the 0.05 level; and p < 0.01 indicates a significant (partial) correlation at the 0.01 level.

2.5. Accuracy Recognition

In order to quantitatively evaluate the accuracy of the water body identification results from remote sensing images and the reliability of the extraction method, validation points were established on the original remote sensing images using the random point generation tool, and the feature categories were identified to obtain the correct attribute information of water bodies and non-water bodies, then the water body extraction results were compared with the corresponding feature categories of the validation points, and the statistics of the correctly identified water bodies, the incorrectly identified water bodies, the correctly identified non-water bodies, and incorrectly recognized non-water bodies constructed a confusion matrix to evaluate the accuracy of water body extraction with overall accuracy (OA) and Kappa coefficient. Considering that the random sampling points mainly fall inside the water body or land area, which may ignore the classification errors at the boundary and lead to overestimation of the accuracy, this paper further constructs a 100 m buffer zone around the boundary line of the lake, and 100 points are randomly selected within this range, focusing on the coverage of the water–land interface area to capture the boundary errors more sensitively. Eventually, the boundary validation points are integrated with the regular random points, which are jointly used to construct the confusion matrix and calculate the accuracy index, thus reflecting the accuracy and reliability of the water body extraction method more comprehensively.
The research framework diagram for this study is shown in Figure 2.

3. Results

3.1. Lake Water Extraction

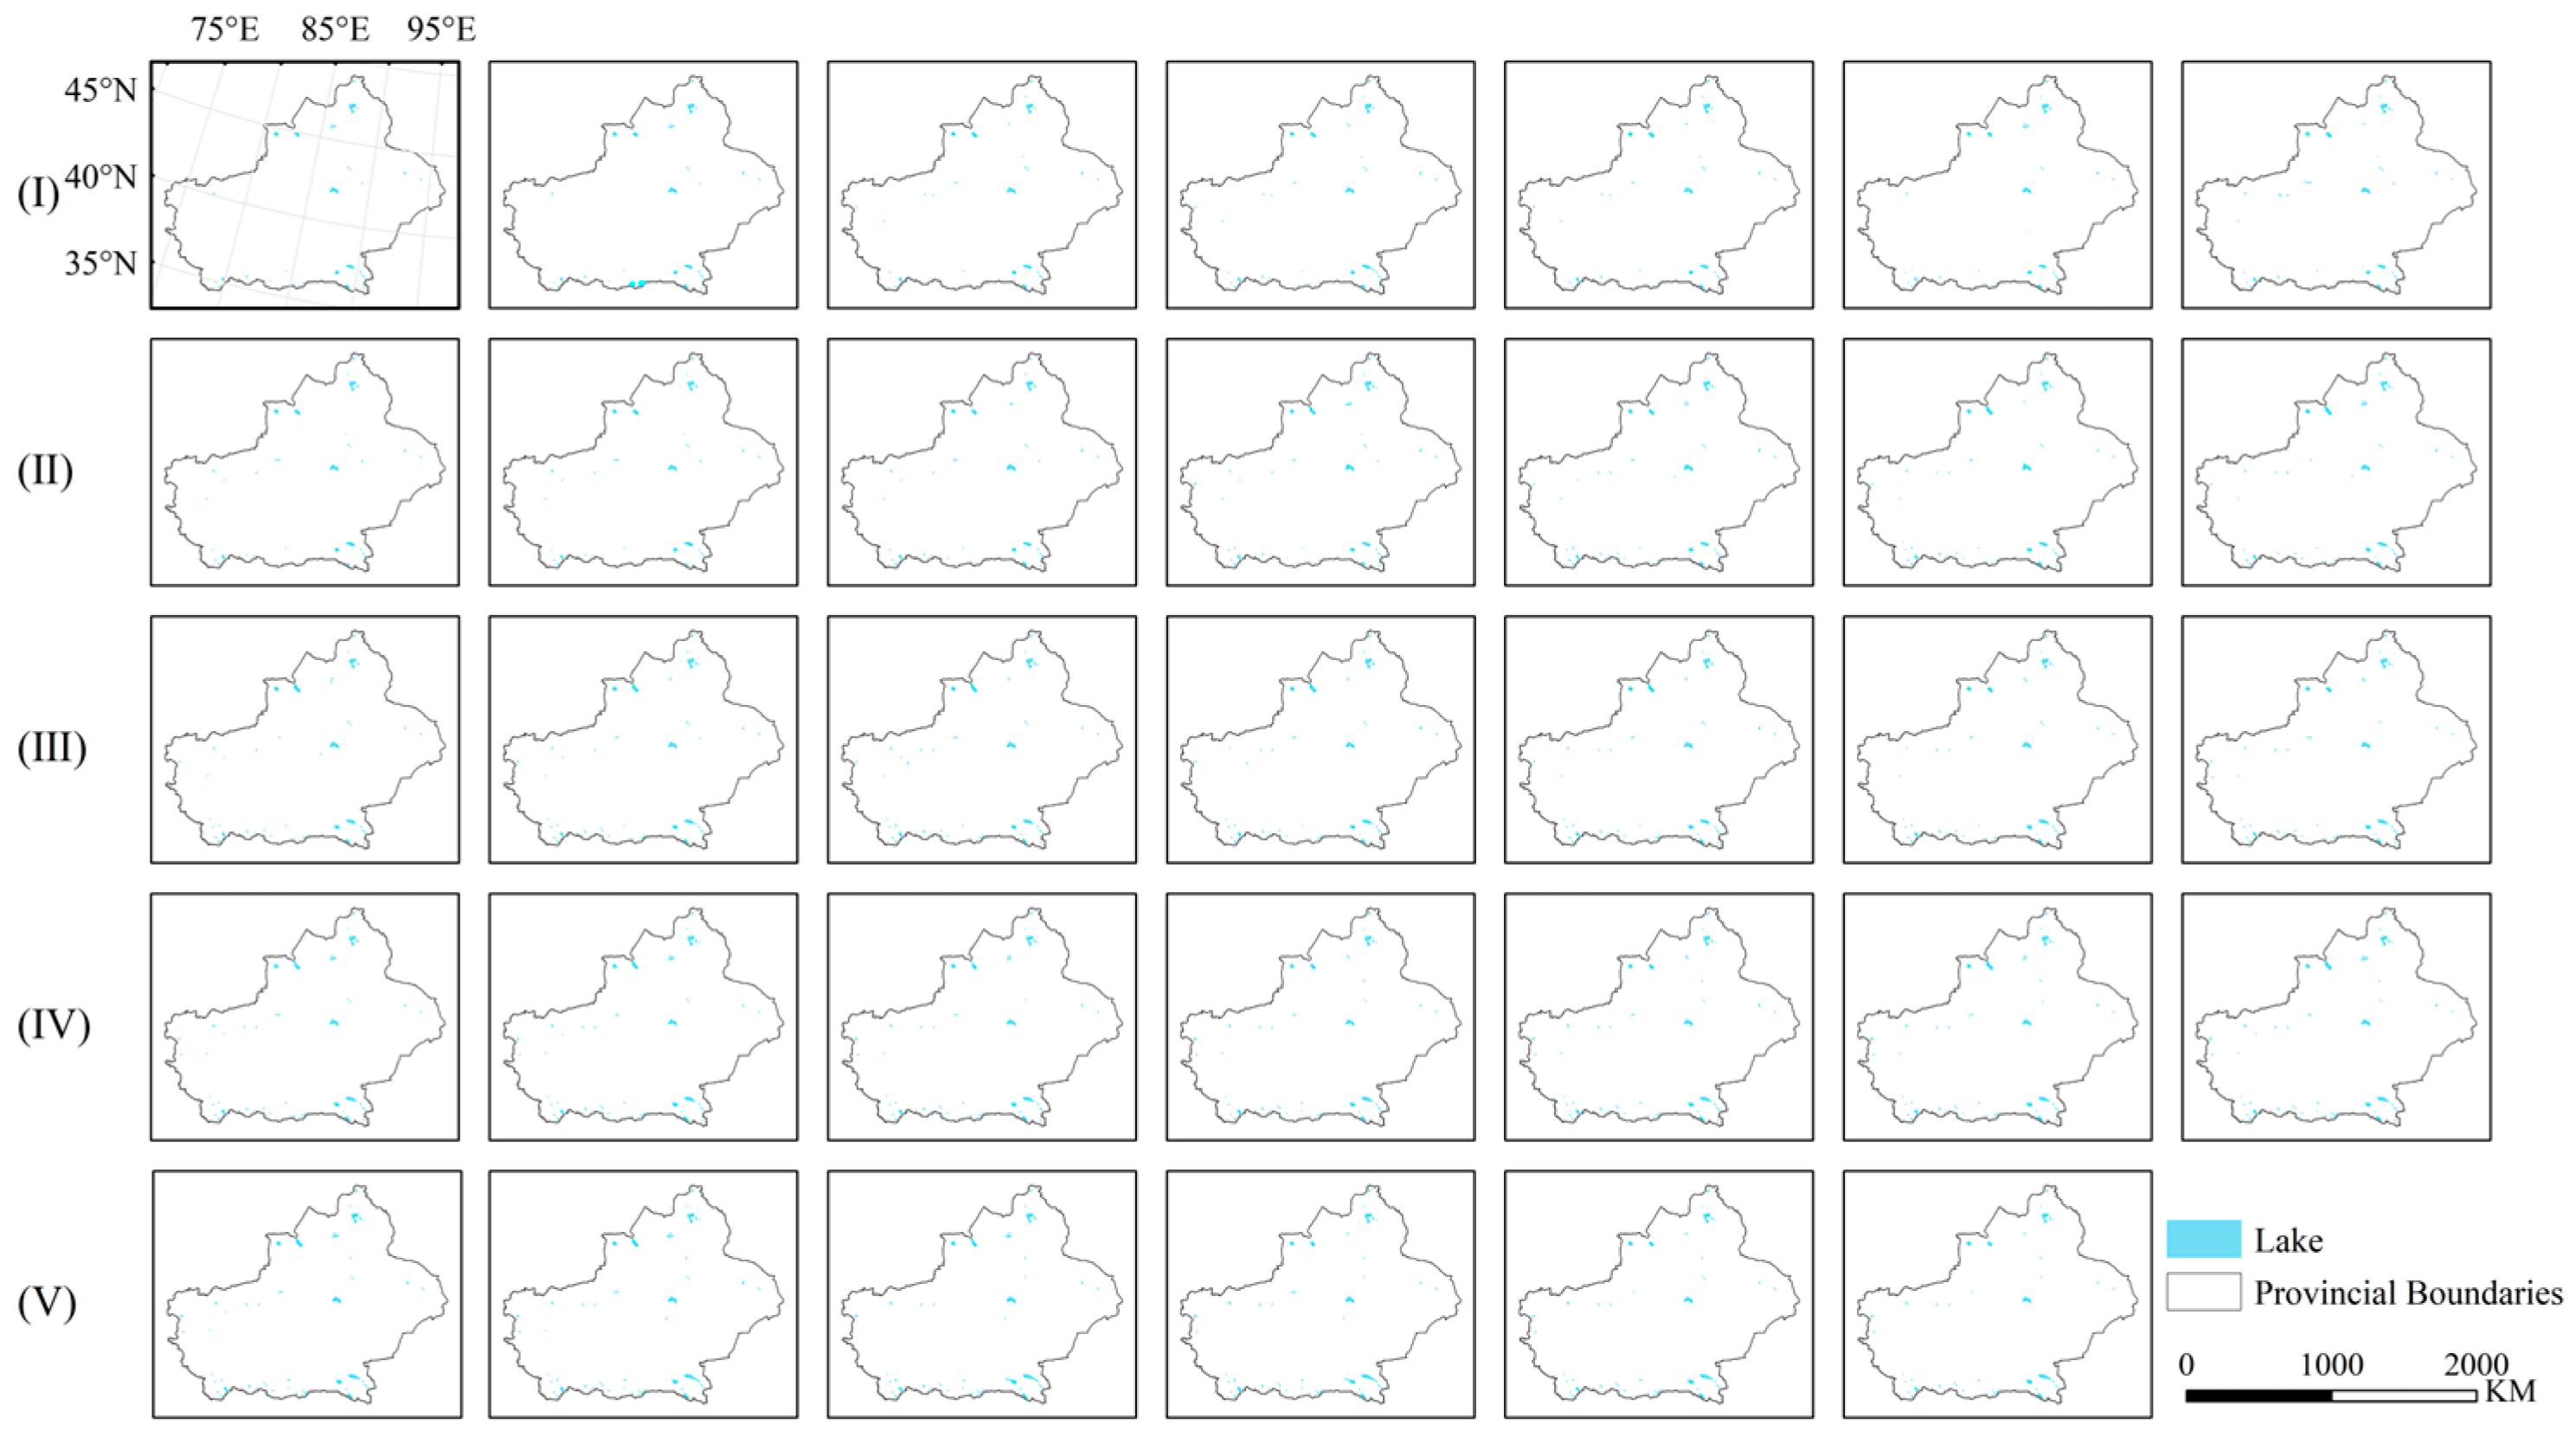
According to the results of water body classification accuracy validation, the extracted OA of water bodies in this study reaches 89.16%, and the Kappa coefficient is 0.7824, so the classification results have good reliability. This paper shows the distribution of validation points of three typical lakes at different altitudes (Figure 3) and produces the distribution map of lakes in Xinjiang from 1990 to 2023 (Figure 4).
In order to further verify the validity of the lake area extracted from this paper in Xinjiang, the Chinese lake dataset was obtained from the National Scientific Data Center for the Tibetan Plateau (https://data.tpdc.ac.cn/), and the data on the area of lakes (greater than 10 km2) in Xinjiang from 1990 to 2020 in this dataset were collected and compared with the results of this study. Thus, the validity of the lake area data was verified. The dataset is the Chinese lake data (1960s, 1970s, 1990, 1995, 2000, 2005, 2010, 2015, and 2020) mapped by Zhang [4] in combination with the Landsat satellite images and topographic maps. In this study, the lake area results of four periods of data (1990, 2000, 2010, and 2020) were selected as reference values and compared with the lake area data extracted in this paper, and the correlation between the two groups of lake areas is shown in Figure 5. The slopes of the fitted curves of the four periods of data are close to one, and the R2 is greater than 0.9, which proves that the area data extracted in this paper have validity.

3.2. Interannual Changes in Lake Area

3.2.1. Overall Change Trend of Lakes in Xinjiang

According to the extracted lakes in Xinjiang, the total number of lakes with an area greater than 10 km2 in 1990 was 36; 14 plain lakes accounted for 38.9% of the total, 4 alpine lakes accounted for 11.1% of the total, and 18 plateau lakes accounted for 50% of the total. By 2023, the number of lakes with an area greater than 10 km2 will be 47, with 15 plain lakes accounting for 31.91% of the total, 5 alpine lakes accounting for 10.64% of the total, and 27 plateau lakes accounting for 57.44% of the total, which is an increase of 11 lakes from the 1990 total, including the emergence of 14 new expanding lakes and a decrease of 3 shrinking lakes. Among them, the number of plain lakes increased by four and decreased by three, the number of alpine lakes increased by one, and the number of plateau lakes increased by nine. The lakes are unevenly distributed geographically (Figure 1), dominated by the circum-Tianshan region and the Qiangtang Plateau in the southern Kunlun Mountains, which is the main reason for the main cause of the spatial differences in water resources in Xinjiang. Analyzing the interannual changes in lake area in Xinjiang, the total lake area increased significantly during the last 34 years (S = 47.960, Z = 5.544, and p < 0.01), from a total area of 5115.600 km2 in 1990 to 6303.960 km2 in 2023, with a total expansion of 1188.359 km2, and an average annual total area of 5998.54 km2, which was mainly due to the following reasons of a high number and area of expanding lakes (Figure 6).
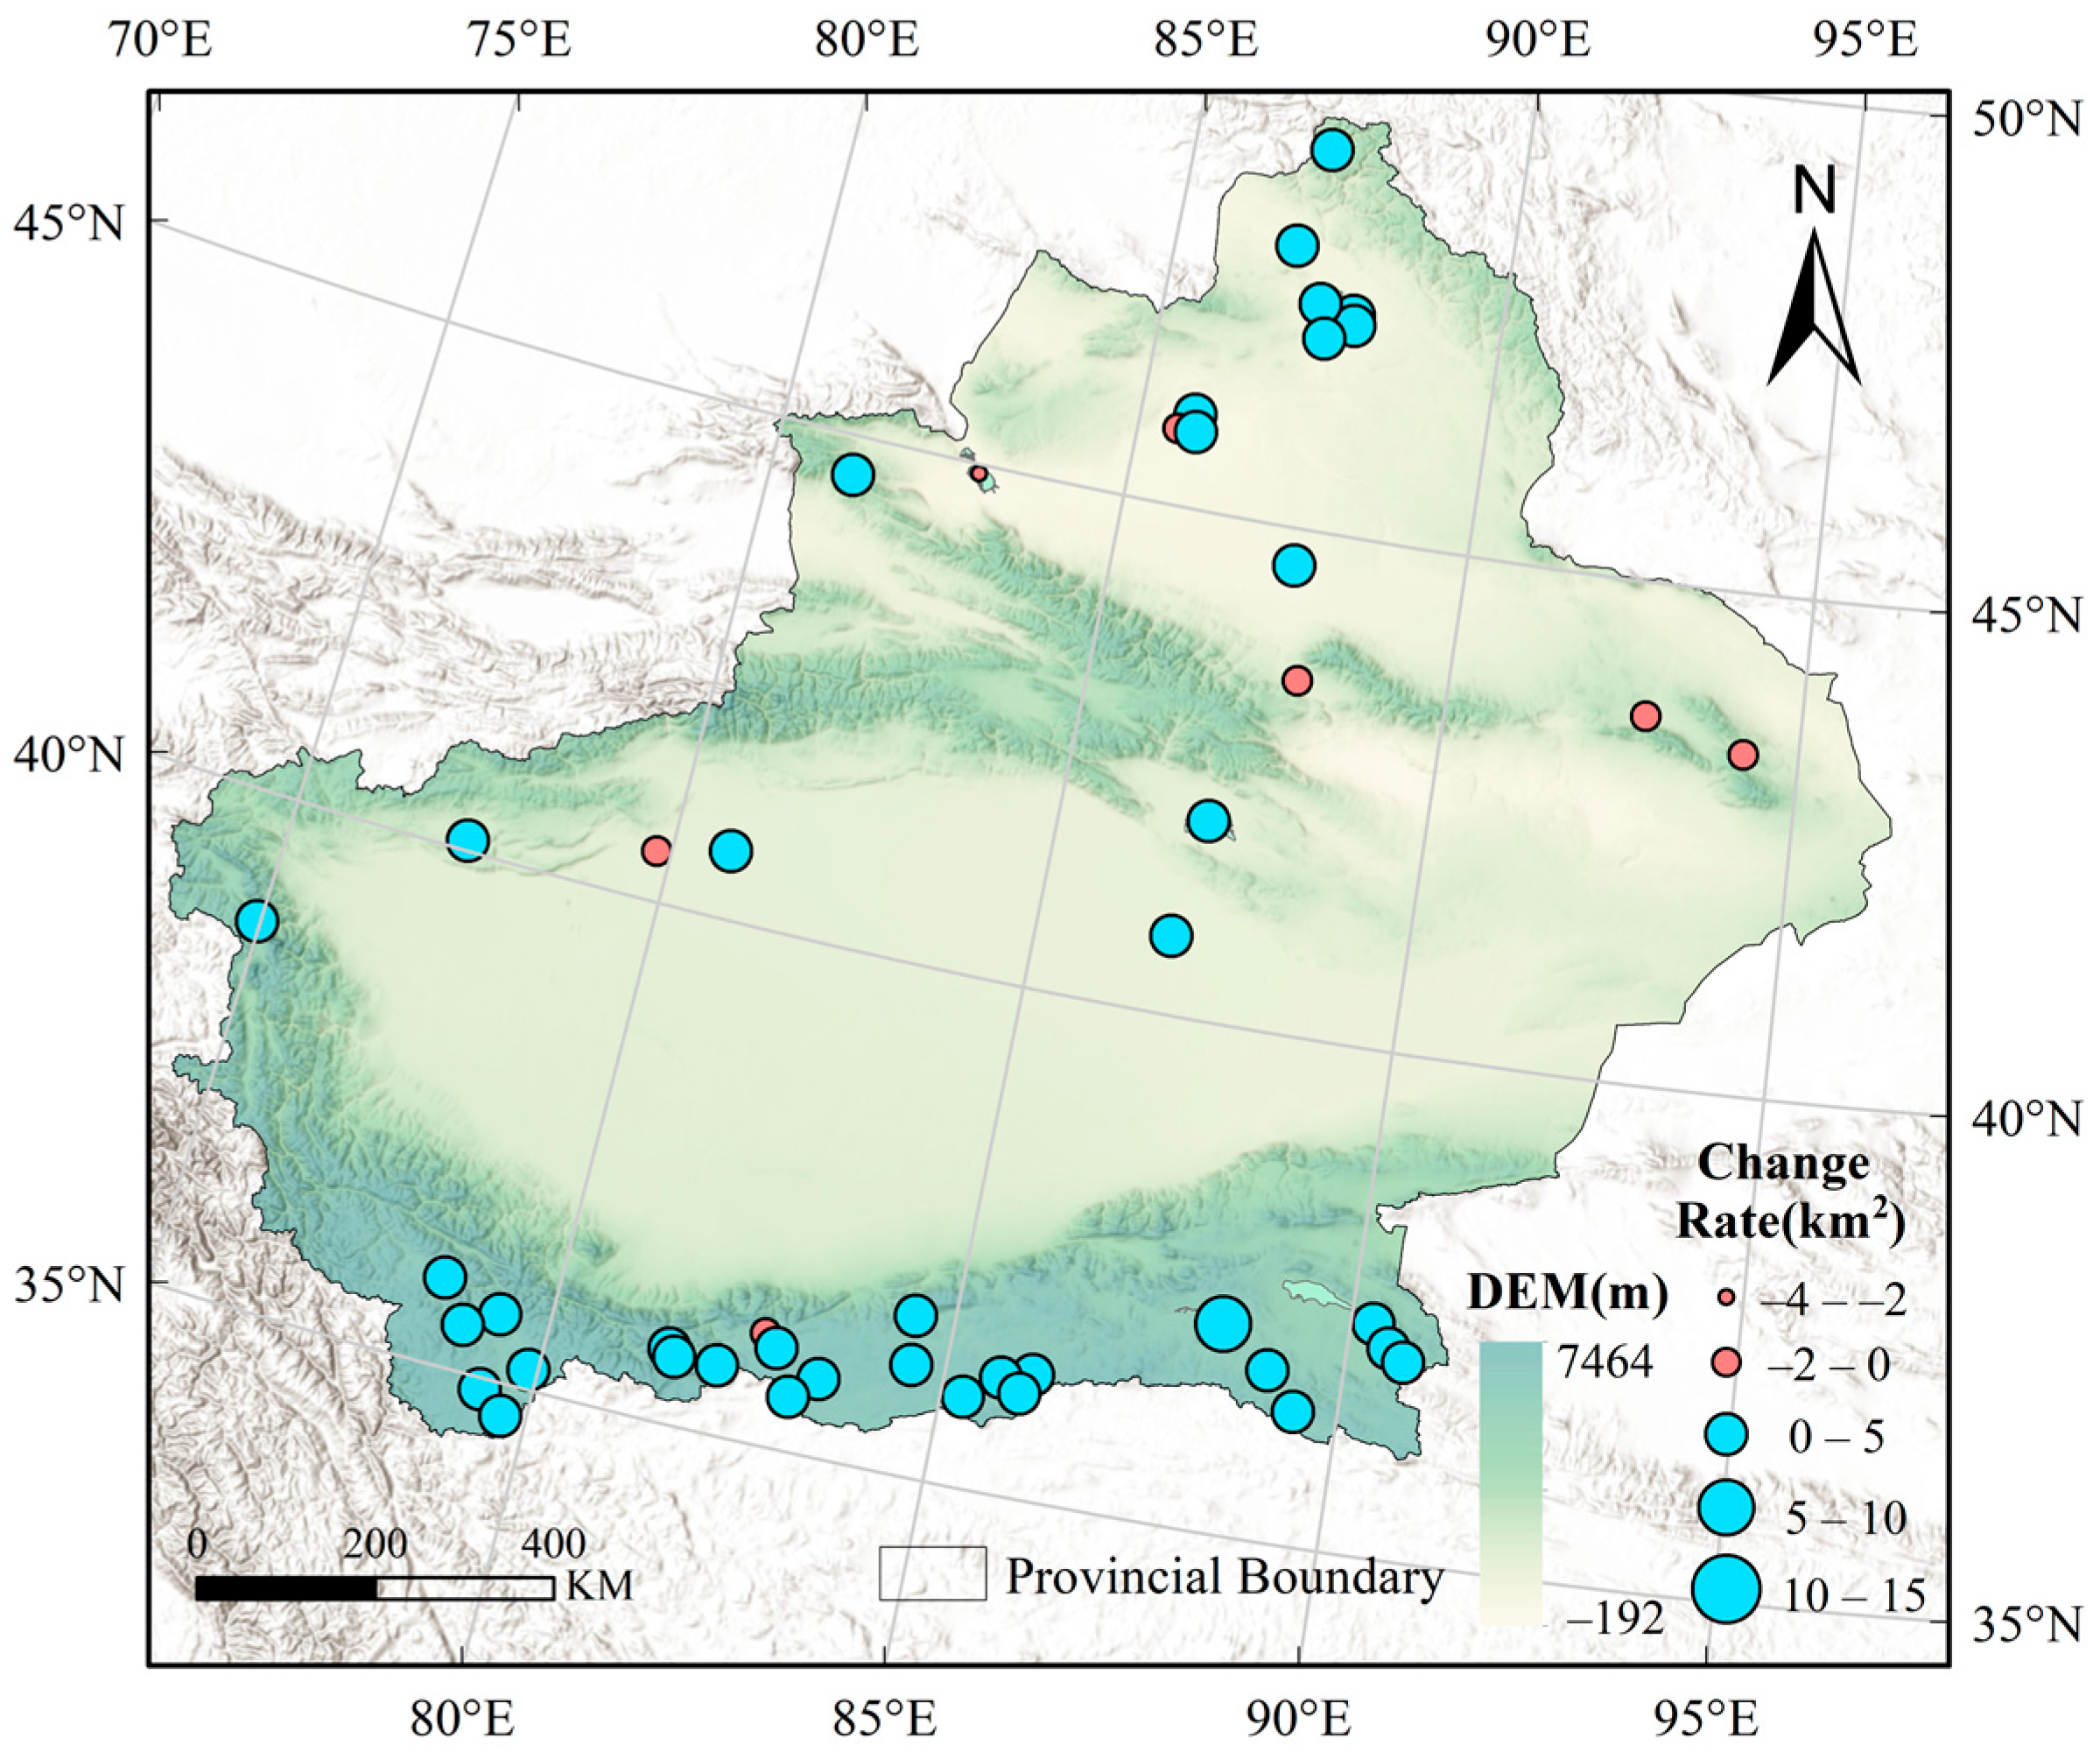
Lakes in Xinjiang are dominated by plateau lakes, and there are nine large lakes (four plain lakes, one alpine lake, and four plateau lakes) with an average area of more than 100 km2 from 1990 to 2023, namely Bosten Lake, Ulungu Lake, Ebi Lake, Jili Lake, Sayram Lake, Ayakkumu Lake, Achigkul Lake, Whale Lake, and Aksaiqin Lake. Among the large lakes, the most obvious changes were observed in the plateau lakes, all of which showed a highly significant expansion, with the fastest expanding Ayakkumu Lake showing a rate of change of +13.606 km2/a (S = 18.416, Z = 7.353, and p < 0.01); the alpine lake, Sayram Lake, showed a highly significant trend of expansion (S = 0.153, Z = 7.086, and p < 0.01), with a rate of change of +0.119 km2/a; and the alpine lake, Sayram Lake, showed a highly significant trend of expansion (S = 0.153, Z = 7.086, and p < 0.01), with a rate of change of +0.119 km2/a. Among the plain lakes, Bosten Lake, Ulungu Lake, and Aibi Lake showed no significant change, and Jili Lake expanded very significantly (S = 0.434, Z = 4.507, and p < 0.01), with a rate of change of +0.335 km2/a (Figure 7).

3.2.2. Interannual Variation in Plain Lakes Area

In 1990, there were 14 plain lakes, with a total increase of 4 during the last 34 years, namely, 65_010, Manas Lake, Dongdao Haizi, and Yingkur Haizi, and a decrease of 3, namely Manas Lake, Qinggdahu, and Aiding Lake, which are mainly located in the Altay region south of the Altai Mountains and the northern region of the Tarim Basin south of the Tianshan Mountains, and, due to the generally arid climate and sparse precipitation in these regions, the lakes rely mainly on the water sources of surrounding rivers and groundwater recharge. The lake with the largest average area is Bosten Lake (983.29 km2), and the smallest average area is Ingkur Haizi (11.28 km2), which was newly added in 2018. The area increased from 1990 to 2000, expanding by 34.25%, and reached the maximum value (3692.23 km2) in 2000, then fluctuated and decreased sharply from 2000 to 2010, decreasing by −24.20%, mainly due to the strong interannual fluctuation of the area of the Aibi Lake, Manas Lake, and Bosten Lake by the dual role of climate change and human activities in the basin, and then the area decreased and then increased after 2010, with a minimum value (2698.121 km2) in 2015 (Figure 6b). Among all the plain lakes, four lakes showed an expansion trend in area, of which Jili Lake, Erik Lake, and 65_010 showed a highly significant expansion trend; five lakes showed a contraction trend, of which Chaiwuobao Lake, Salt Lake, Qinggueda Lake, and Aiding Lake showed a highly significant contraction; and the remaining lakes showed a relatively stable change in area during the study period (Figure 7).
Bosten Lake, located in the southeast of Yanqi Basin in Bohu County, Bayingolin Mongolian Autonomous Prefecture, is the largest inland freshwater throughput lake in China, its area typically changed during the study period, and the process was divided into three phases of expansion–shrinkage–expansion (Figure 8e). From 1990 to 2002, the area increased significantly and reached the peak of the Bosten Lake area in 2002, with a total expansion of 208.791. During the period of 2002–2013, the area fluctuated down and reached the valley of Bosten Lake in 2013, shrinking 234.783 km2; during the period of 2013–2023, the area of Bosten Lake was floating up overall, expanding 79.05 km2. Spatially, in the first stage of the expansion of the lake area (1990–2002), the lake expanded significantly to the north and the east, and the small lake expanded to the east, with expansion to the north and east and a small expansion to the southwest (Figure 8a,c). In the stage of lake area shrinkage (2002–2013), all directions of southeast and northwest show a relatively obvious trend of retreat, and the boundary of the water body shrinks inward as a whole, of which the northwestern lakeshore wetland area and the eastern edge shrink to a greater extent (Figure 8c,d). The northern part of the lake is dominated by sandy land, with a small amount of arable land and the existence of a number of seasonal streams, and the west bank is mainly sandy and affected by anthropogenic factors. There is no runoff into the lake. In the second lake area expansion phase (2013–2023), the most significant areas of expansion are in the northern and southern parts of the lake.

3.2.3. Interannual Variation in the Area of Alpine Lakes

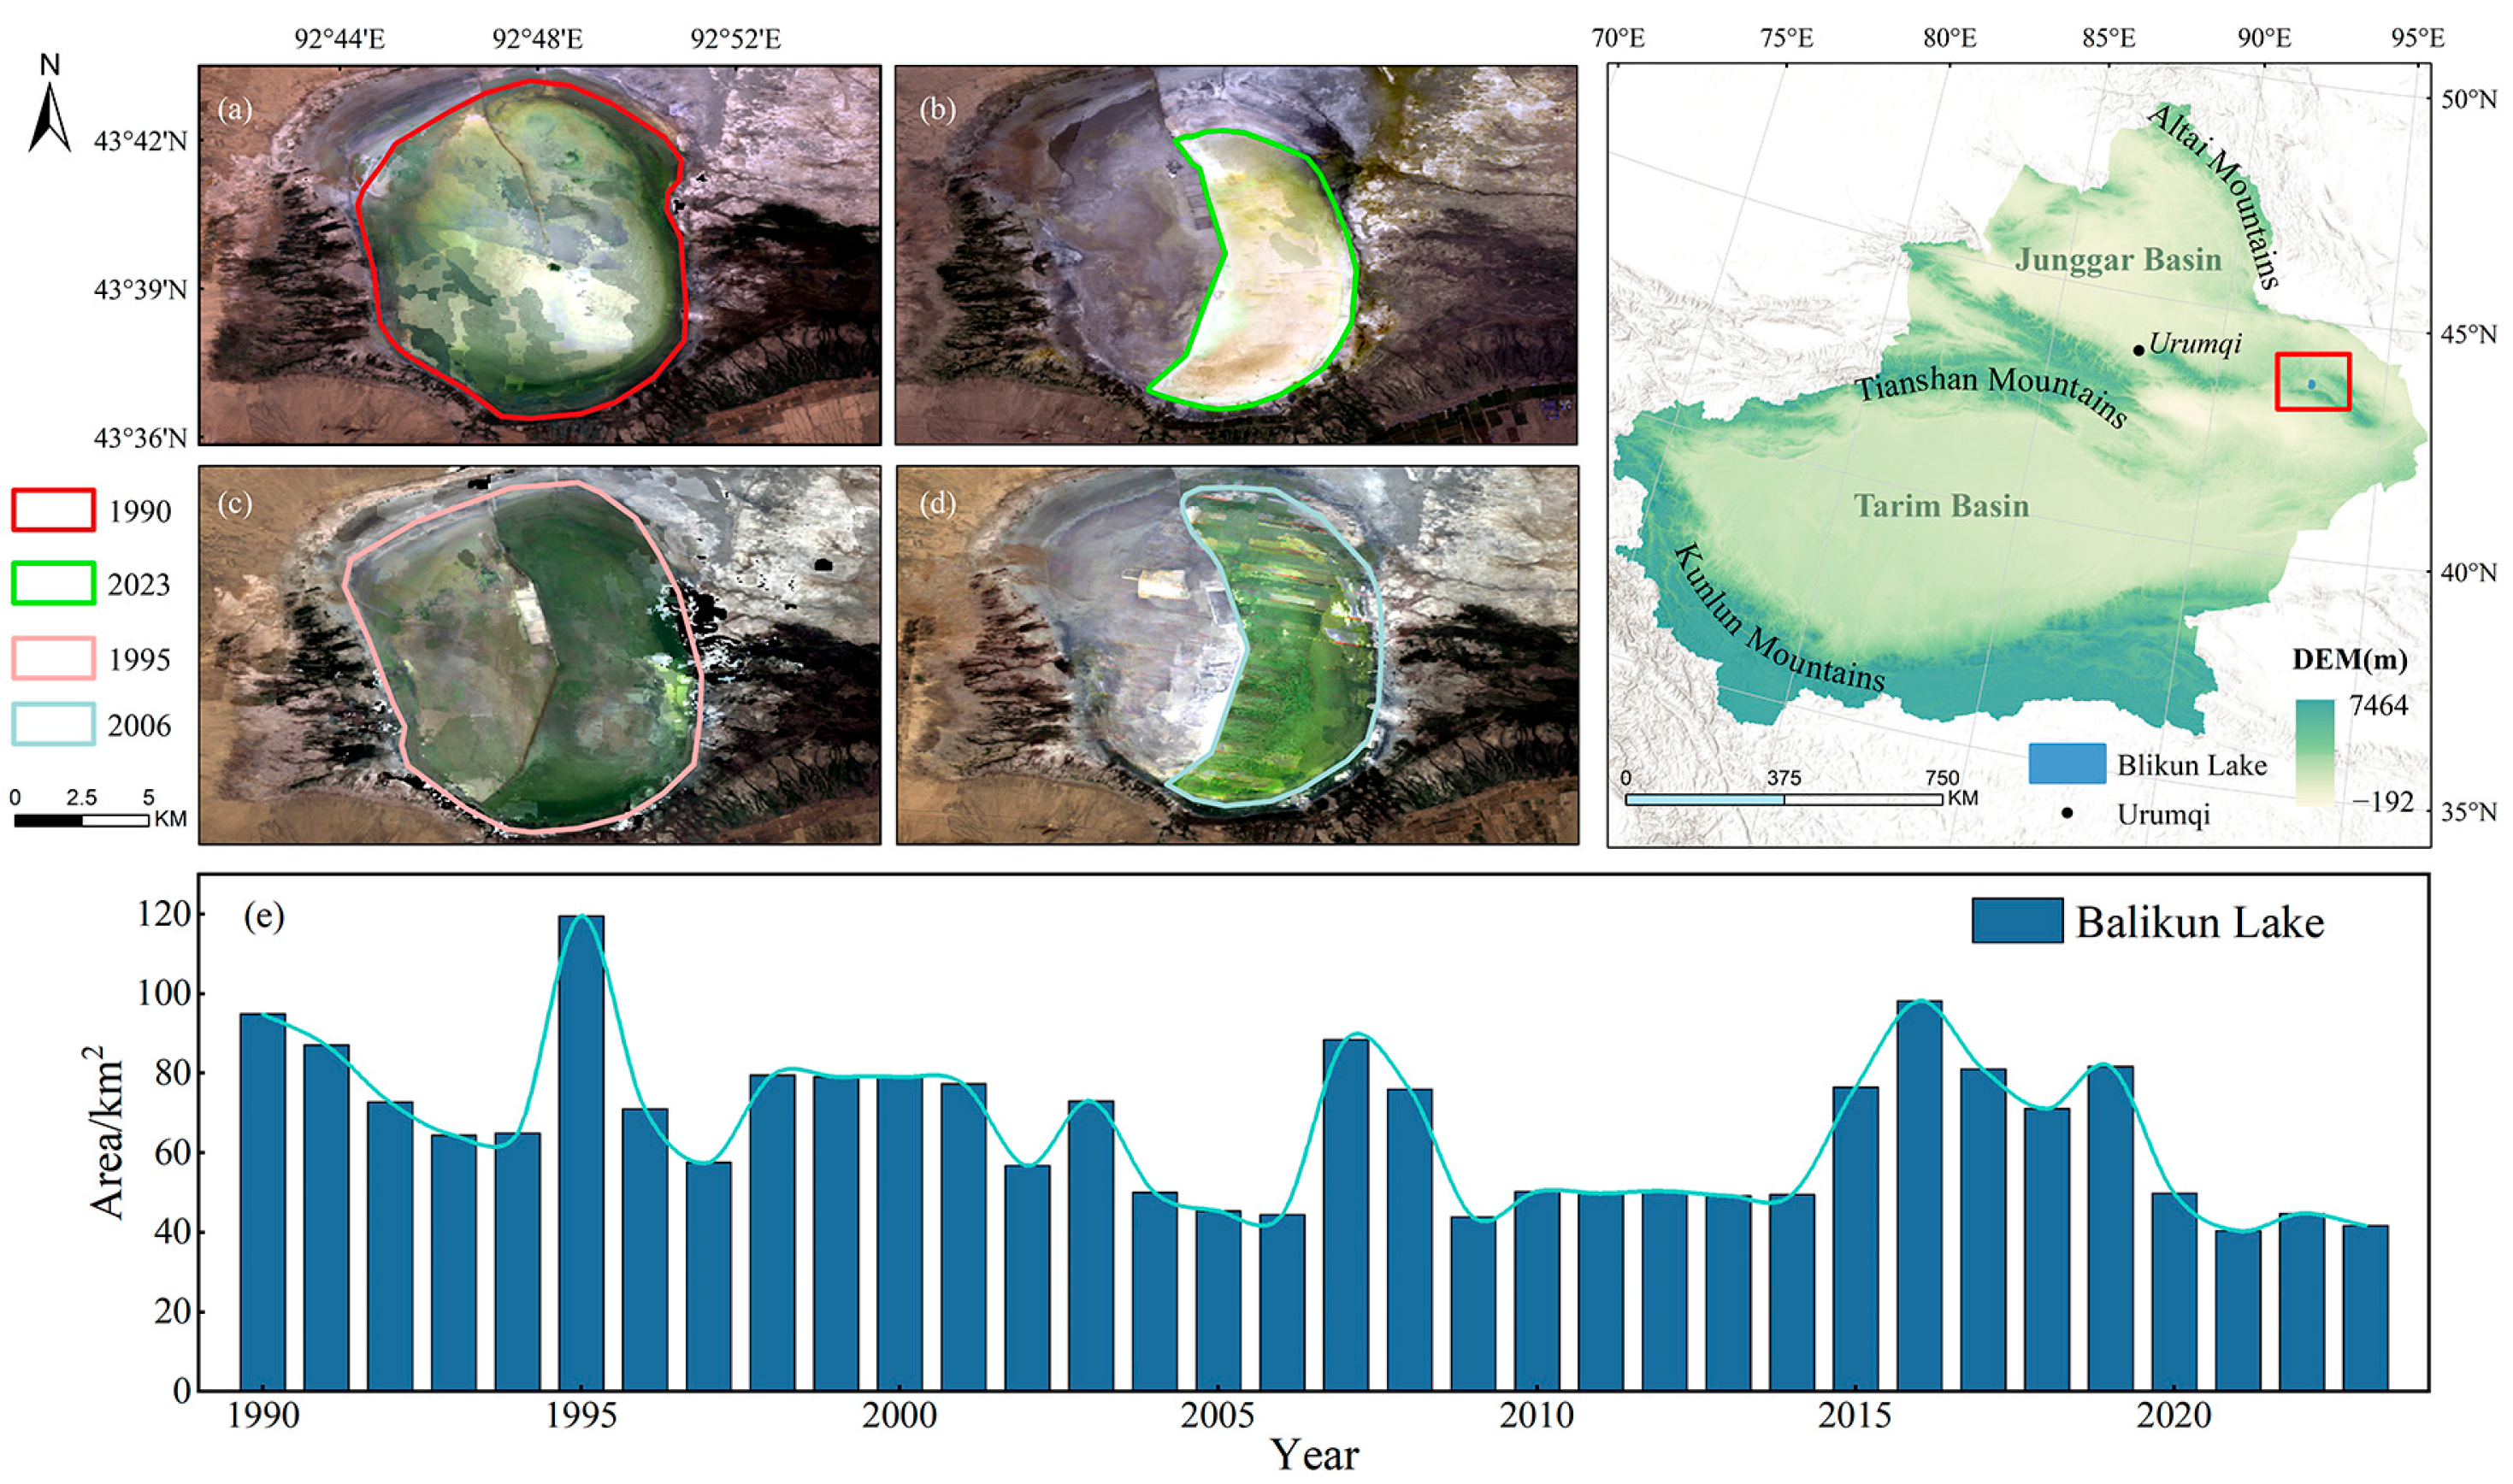
There were four alpine lakes in 1990, with an increase of one during the last 34 years. The geographical distribution was uneven. The lake with the largest mean area was Sayram Lake (461.25 km2), and the smallest mean area was Qiongkualebash (25.77 km2), which was newly added in 1992. The change in the total area was unstable and fluctuated from 1990 to 2010 and then it continued to increase from 2010 to 2020 and reached a maximum value of 705.783 km2 in 2016 (Figure 6c). The five alpine lakes expanded extremely significantly during the study period, with a rate of change of 0.119 km2/a for the Sayram Lake; Qiongluan Lebashi expanded extremely significantly, with an area expansion of nearly four times, and with a rate of change of +1.066 km2/a; Xiaoerkule Lake expanded extremely significantly, with a 60.35% increase in area from 1990 (42.16 km2) to 2023 (67.60 km2), and with a rate of change of +0.748 km2/a; and Balikun Lake and Huancai Lake shrank extremely significantly, with a decrease in area of 56.11% and 11.430%, respectively.
Balikun Lake is located in the Hami region of eastern Xinjiang, where water resources are scarce and the economy is less developed, and its area changes dramatically, first decreasing and then increasing, with overall shrinkage and a retreat rate of −56.12% (Figure 9e). During the study period, the lake surface area of Balikun Lake fluctuated and decreased between 1990 and 2006, and the water body on the west side gradually dried up, reaching a minimum value of 44.479 km2 in 2006 (Figure 9d) during the study period, of which there was a maximum value of 119.566 km2 in 1995 (Figure 9c). The lake area increased dramatically in 2007–2008, but the shrinkage of the lake did not change, followed by a sharp decline in area and a significant increase in the lake area in 2009–2016, followed by a fluctuating decline. Due to a north–south gravel dyke in the center of Balikun Lake, the dyke separates Balikun Lake into two parts, east and west, when the east side of the water level exceeds the elevation of the dam in order to enter the west side and vice versa. The east side of the lake water experiences a decline in the absence of diffusion over the dam; the west side of the lake, due to the lack of surface runoff recharge, is in a state of dryness. Balikun Lake, in terms of spatial change, is very dramatic; when the east side of the water level is lower than the lowest elevation of the dam, the water body is circled on the east side, and the lake is presented as a crescent shape. Due to differences in topography, the southern and southeastern part of the lake close to the Balikun Mountain has a steeper slope, and the lake boundary only experiences a small range of changes; the northern and northeastern terrain is flat, the lake shoreline changes are obvious, and the lake’s spatial change is in the main direction of the main changes. When the lake comes to more water, due to the Balikun Lake basin being relatively flat, the lake on the west side of the lake from south to north rapidly expands, the lake area suddenly increases, and the west side of the lake boundary reaches the position of the water by diffusion. When the amount of diffused water is sufficient, the shape of the lake will be restored to a near-oval before the construction of the dam. In the Balikun Lake geographical location, evaporation is strong; when the east side lacks water recharge, the lake water level drops and stops on the west side of the diffusion, the west side of the formation of the water surface is shallow, and the surface is large, making it very easy to be evaporated and disappeared. The lake will then be restored to a crescent shape.

3.2.4. Interannual Variation in the Area of Plateau Lakes

There were 18 plateau lakes in 1990, with a total increase of 9 during the last 34 years, and all the plateau lakes were centrally distributed in the eastern Kunlun Mountains near the Qiangtang Plateau region, with the largest average area of Ayakkumu (829.96 km2) and the smallest average area of the 2017 addition of the Colulecuo (10.60 km2). The area of plateau lakes was dominated by an expansion trend during the study period, with the total area increasing by 8.99% from 1990 to 2000 and the minimum value occurring in 1995 at 1607.003 km2, the total area rising rapidly from 2000 to 2010, with an increase of 34.50%, and the area continuing to expand after 2010, with an increase of 24.72%, reaching a maximum value in 2020 at 3096.622 km2 (Figure 6d). Among all the plateau lakes, only one lake showed shrinkage, and there existed eight lakes with insignificant changes in the area; the remaining nineteen lakes showed an expansion trend during the study period, and the remaining eighteen lakes showed highly significant expansion, except 65_125, which was significant.
Located in the eastern region of the Kunlun Mountains, Ayakkumu Lake, which belongs to the Kumkuli endorheic zone, has an overall increase in area during the study period, and the trend of change has changed from shrinkage to dramatic expansion, which is highly significant (Figure 10). Among them, there was a slight fluctuation and decrease from 1990 to 1995, and the lake shrank more seriously in 1995, reached the valley of the area, and began to rise violently. The surface area of Ayakkumu Lake surpassed Bosten Lake in 2011, becoming the largest lake in Xinjiang, and reached the maximum value of 1132.65 km2 in 2021 during the study period. Spatially, the changes in Lake Ayakkumu are very strong, and it can be seen that the areas of lake expansion or contraction are mainly distributed in the eastern catchment area of the inlet of the Yixiekpati River, followed by the southern catchment area of the inlet of the Seskoya River and the western region, because these areas are in the lower position of the lake basin of Lake Ayakkumu and are affected by climate warming and humidification and the increase in ice and snowmelt in the basin. When there is sufficient water replenishment, the boundary of the lake is rapidly expanded outward along the direction of the inlet of the Yixiekpati River and Seskoya River, and most of the wetlands at the mouth of Seskoya River become the surface of the lake. The Yixiekpati River and Seskoya River inlet direction rapidly expands outward and most of the wetlands at the inlet of the Yixiekpati River become the lake surface, while the alluvial fan at the mouth of the Seskoya River is heavily inundated, and the southern boundary of the lake gradually advances to the south, whereas the northern watershed is located in the southern part of the Yixiemantag Mountain with a steeper gradient, and the changes in the lake’s shoreline are relatively weaker.

3.3. Background to Meteorological Factor Changes in Xinjiang

Relevant studies have shown that climatic factors are key drivers of the dynamics of regional water supply and demand patterns. In recent decades, due to the influence of cyclical climate change and rapid glacier ablation, the lake area in Xinjiang has shown changes in shrinkage and expansion in different periods. In this paper, the annual average temperature (AAT), annual precipitation (AP), and potential evapotranspiration (PET) are selected as the climate factors affecting lake changes, and the temporal trends and spatial distribution of climate factors in Xinjiang are explored.
During the study period, AAT changes in Xinjiang were dominated by an upward trend with significant altitudinal differences, and overall global warming was strongly expressed in arid and semi-arid regions (Figure 11a). The temperature increase was slower from 1990 to 2000 but accelerated after 2000, especially from 2010 to 2020, when the magnitude of warming was further expanded. The AAT in the Tianshan Rim region, especially the northern slope of the Tianshan Mountains and the eastern part of the Junggar Basin and the Tarim Basin, rises significantly, while the middle- and high-altitude regions of the Tianshan Mountains warm up less; the AAT in the western and eastern parts of the Kunlun Mountains shows a different trend, with the western part cooling down while the eastern part warms up, and the southern Altai Mountains and the central part of the Junggar Basin show no obvious change in the AAT, a spatial pattern which may be affected by the effect of topography, with the lower altitude regions more susceptible to the temperature rise. This spatial pattern may be influenced by topographic effects, and low-altitude areas are more likely to be significantly affected by temperature changes.
The AP as a whole showed an increasing trend during the study period, with the most pronounced increase in precipitation during 1990–2000, but the rate of increase in precipitation slowed down during 2000–2010, with some areas even experiencing a decrease in precipitation (Figure 11b). The southern Altai Mountain foothill region and the northern slope of the Tianshan Mountains showed the most significant increase in AP, especially in the Altai Mountains, which showed the largest increase in AP, with an increase of 300 mm over 34 years; meanwhile, the eastern part of the Tianshan mountain range region, the Tarim Basin of the southern border, and the eastern arid regions showed smaller changes in precipitation. The PET showed an overall increasing trend during the study period, with a larger increase in PET between 2010 and 2020 (Figure 11c). The increase in PET was most significant in the arid, low-elevation areas such as the Tarim Basin and the Turpan Basin, implying more evaporation of water, which negatively affects the change in lake area, while the changes in the high-elevation areas such as the Tianshan Mountains and the Altai Mountains were relatively small.

3.4. Changes in Human Activities

Lake changes are mainly affected by geological formations, human activities, and climate change, whereas the effects of geological formations on lakes require long time scales, and lakes at high altitudes are less disturbed by human activities, so only the effects of human activities on plain lakes and alpine lakes are analyzed in this study.

3.4.1. Changes in Urban Water Use

The enhancement of human activities needs to consume a large amount of water. Nighttime light (NTL) can reflect the intensity of economic and human activities in the city, and its spatial distribution and brightness are directly and closely related to the intensity of human activities, the level of economic development, and the distribution of the population, and these activities are often closely related to the demand for water in the city, so the intensity of NTL is used to characterize the intensity of human activities, thus reflecting the changes in the demand for water in the city. Due to data acquisition problems, this paper only analyses NTL from 1992 to 2023.
High-intensity NTL is mainly distributed in low-elevation areas, other than deserts (Figure 12), suggesting that these areas may be densely populated or economically active cities or towns, and the distribution of NTL in Xinjiang is inhomogeneous, limited by topographic conditions (such as mountain ranges and deserts) and mainly concentrated in a few specific areas. The southern border has a sparser distribution of NTL due to natural conditions, while the relatively brighter areas in the northern border are likely to be areas of more concentrated economic development, mainly centered on Urumqi, the capital of Xinjiang, and extending in all directions. Since 1992, human activities have continued to intensify, and NTL has shown an overall increasing trend, with the circum-Tianshan region and the northwest Kunlun Mountains becoming brighter, especially in the core urban area centered on Urumqi, which has significantly increased in brightness, reflecting the intensification of urbanization and human activities. New bright spots gradually appear in the originally darker regions, indicating the expansion of urbanization or the economic development of rural areas. Meanwhile, due to the topographic conditions, the brightness increases rapidly in some regions while the change is not obvious in others, which laterally reflects the spatial imbalance of economic development in Xinjiang.

3.4.2. Changes in Agricultural Water Use

In water-dependent agricultural areas, changes in the cropland area (CA) will directly affect agricultural water use, which then, through water supply, scheduling, and allocation, will further affect changes in water levels and areas of plain lakes. An increase in cropland area usually means more land for crop cultivation, leading to a rise in irrigation water use, especially in arid or semi-arid regions where water demand increases with cropland area, which in turn affects changes in lake areas.
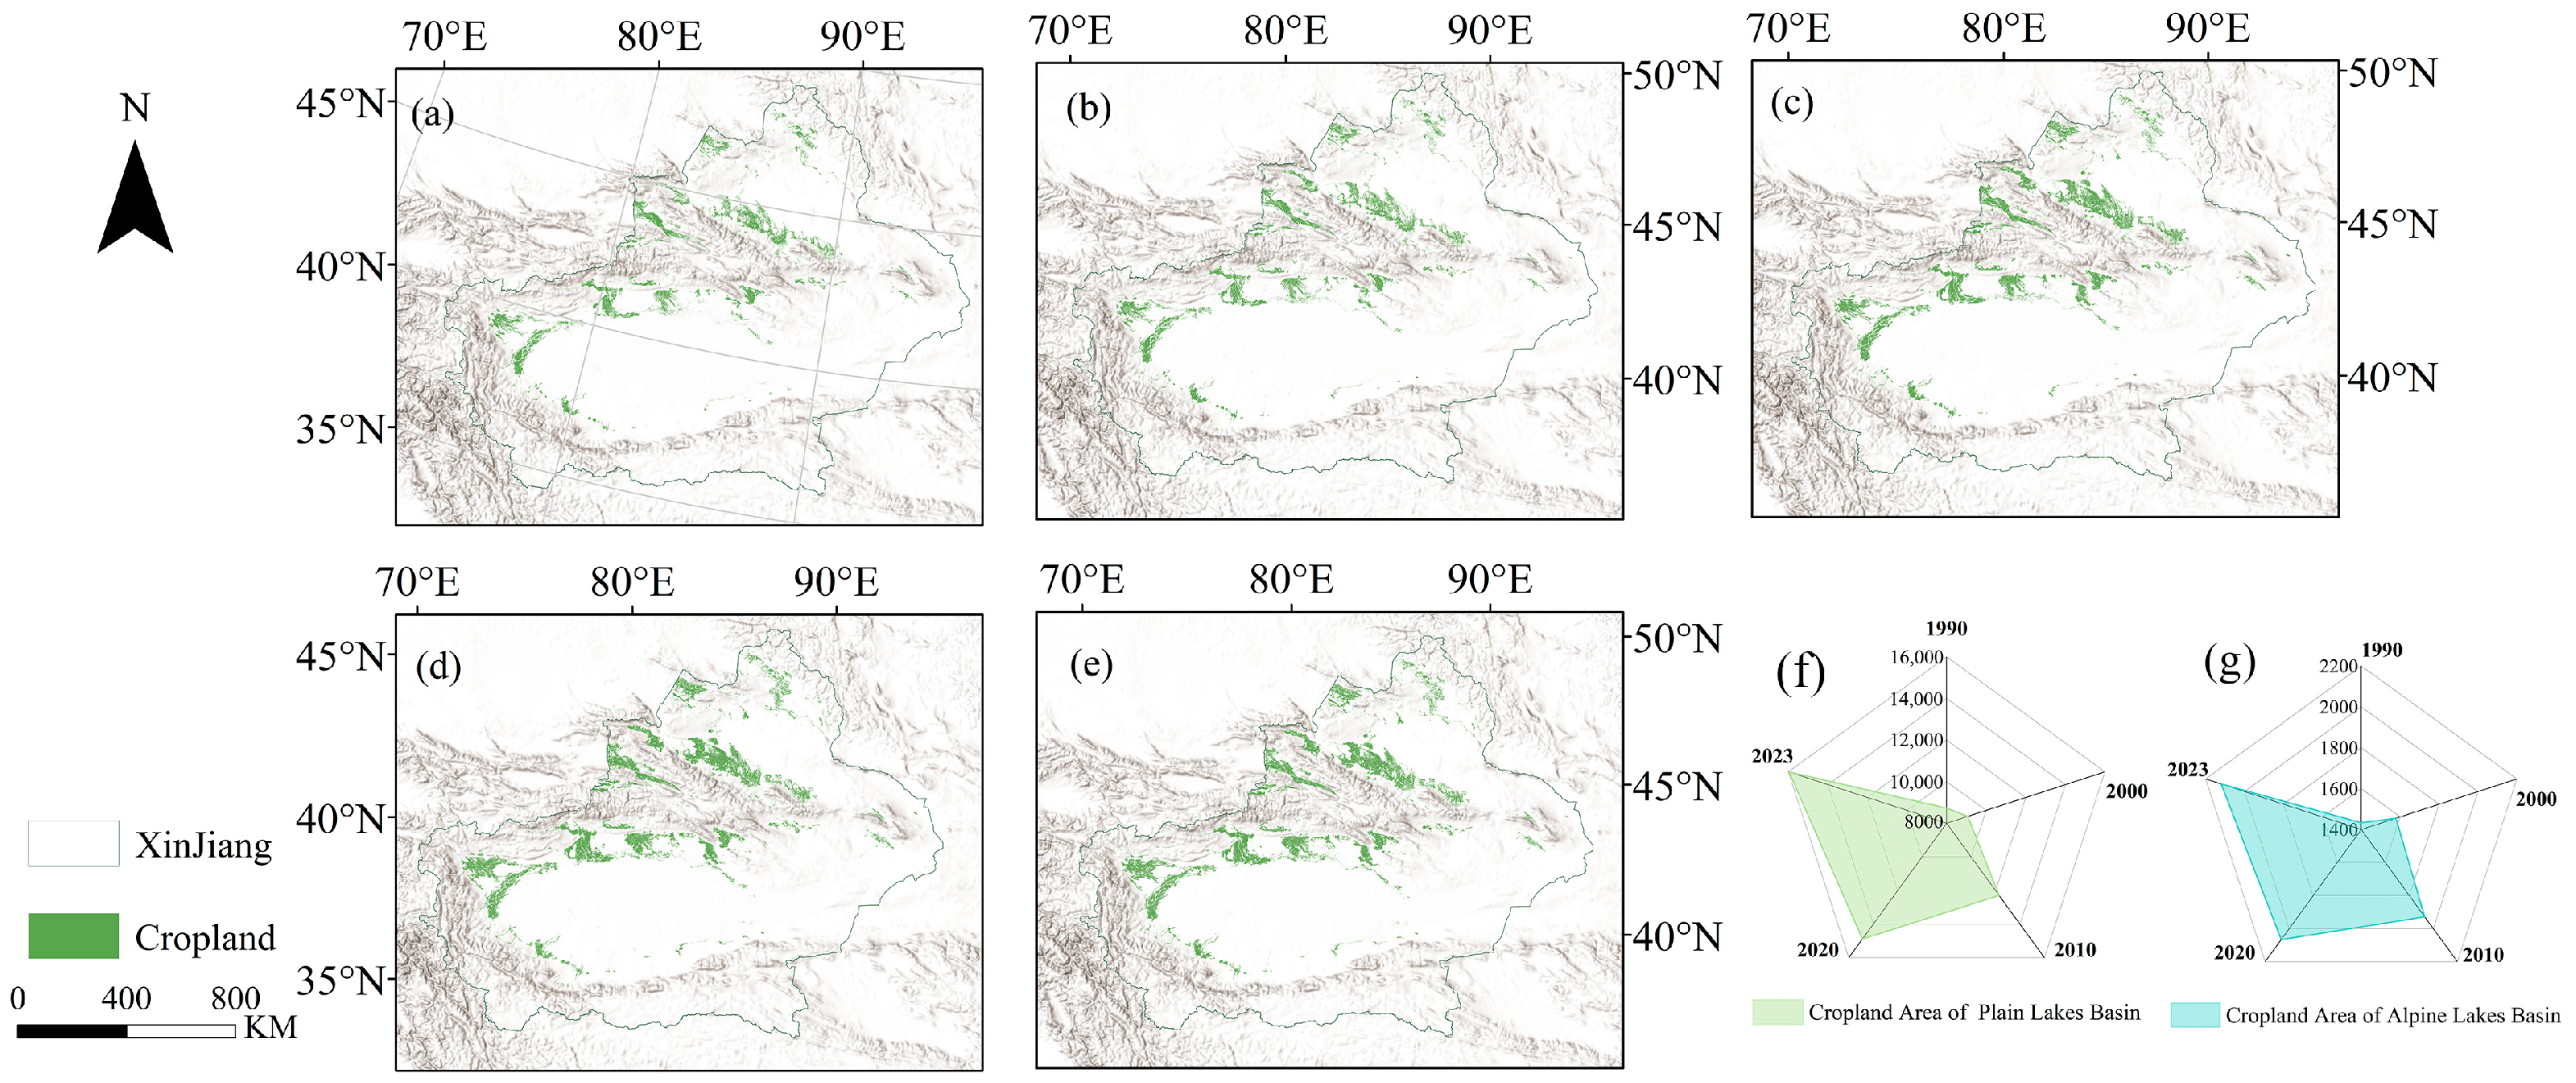
As of 2023, the total area of cropland in Xinjiang reached 87,982.516 km2 (Figure 13), which increased substantially during the study period, with a total increase of 31,757.796 km2 in 34 years, driven by the impacts of agricultural technological advances, the development of water resources utilization, and population growth. In 1990, the distribution of cropland was relatively small, mainly concentrated in the oases north and south of the Tien Shan Mountains, the periphery of the Tarim Basin, the southern edge of the Junggar Basin, and other oasis areas (Figure 13a); in 2000, the area of cropland was expanded by 4887.470 km2 compared with that in 1990, especially in oasis areas and the areas along the rivers, which were more obvious (Figure 13b); and with the increase in the trend of economic development and agricultural development, the trend of expansion in 2010 was more obvious, expanding by 15,616.126 km2 compared with that in 2000, and the expansion of cropland in oases around the Tarim Basin is remarkable (Figure 13c). With the increase in economic development and agricultural exploitation, the trend of arable land expansion is more obvious in 2010 compared with the expansion of 15,616.126 km2 in 2000, and the expansion of arable land in the oasis around the Tarim Basin is remarkable (Figure 13c). The arable land area will further expand in 2020 and 2023, and will continue to expand outward, mainly around the oasis and the river area, and its distribution will be more intensive (Figure 13d,f). From a spatial perspective, Xinjiang’s arable land is mainly distributed in the oasis belts at the northern and southern foothills of the Tianshan Mountains, the periphery of the Tarim Basin, and the southern edge of the Junggar Basin, such as the Manas River Basin, which has favorable water resource conditions. The arid and semi-arid natural conditions of Xinjiang constrain the expansion of arable land, and the development of arable land is limited by the distribution of water resources and topographic conditions, which are always centered around oases and rivers. From the cropland area of Xinjiang, the cropland area of cities and counties (districts) where plain lake basins and alpine lake basins are located is further extracted (Figure 13f,g), and the results show that the cities and counties (districts) where plain lake basins are located are continuously enhanced in agricultural development and utilization, and the cropland area continues to grow, especially after 2010, with an accelerated rate of growth. Cities and counties (districts) where alpine lake basins are located are constrained by the natural environment, such as high elevation and low temperature, and always focus on oases and rivers. The cities and counties (districts) where the high mountain lake basins are located are constrained by a high altitude, low temperature, and other natural environmental constraints, and the cropland cannot be developed on a large scale, the change in area is small, and the overall trend is slow growth.

3.5. Statistical Analysis of the Relationship Between Changes in Lake Area and Influencing Factors

A partial correlation analysis was used to remove the effects of other influencing elements and analyze the extent to which a single influencing element was correlated with changes in the lake area (Table 4).
In plain lakes, the effect of CA on the lake area was significantly positively correlated (p < 0.01), with a partial correlation coefficient of 0.491, and NTL was negatively correlated (p < 0.05) with the lake area, with a partial correlation coefficient of −0.160; among the climatic factors, AP did not have a significant partial correlation with lake area, and AAT and PET were both significantly correlated with the area, with correlation coefficients of 0.540 and −0.556, respectively; and in high mountain lakes, the effects of human activities on the area were all positively correlated, with the effect of CA on the area being significantly positive (p < 0.05) and a partial correlation coefficient of −0.556. In alpine lakes, the effects of human activities on the lake area were all positively correlated, of which CA was significantly positively correlated with the area (p < 0.05), with a partial correlation coefficient of 0.193; climatic factors were all significantly correlated with the lake area (p < 0.05), with partial correlation coefficients of 0.663, 0.195, and −0.602 for AAT, AP, and PET, respectively. In plateau lakes, the effects of AAT and AP on area changes were significantly positively correlated (p < 0.05), with partial correlation coefficients of 0.723 and 0.485, respectively, and the PET did not have a significant partial correlation with area.

4. Discussion

In the context of global climate change, the average annual warming rate in Xinjiang from 1961 to 2018 was about 0.30 °C/10a above the global level [39], and the degree of response to climate change varied across regions. With the accelerated global melting of snow and ice and the increased flow in most rivers [40,41], the meltwater contribution from the southern slopes of the Tianshan region has led to a significant increase in river runoff in the region [42]. Evapotranspiration rates increased in the northern slopes of the Tianshan Mountains and the Tarim River Basin, while they decreased in the mountainous regions of Xinjiang [43], which is consistent with the study here. However, these changes need to be analyzed on a case-by-case basis for different geographical regions.

4.1. Factors Affecting Plain Lakes

Plain lakes are primarily distributed in the Altay region south of the Altai Mountains and the northern part of the Tarim Basin south of the Tianshan Mountains. These lakes are characterized by low-lying terrain and a simple lake replenishment structure, making them highly susceptible to significant human influence. The surrounding areas are densely populated with farmland, and the regional water-use structure is highly dependent on surface water resources. Changes in these lakes are closely related to human factors such as agricultural irrigation and reservoir construction. During the study period, the PET in low-altitude regions such as the Tarim Basin and the Turpan Basin showed a significant increase, leading to greater water loss and having a significant negative impact on lake area changes. Although precipitation in the plain regions is limited and plays only a minor direct role in sustaining lake levels, interannual fluctuations in rainfall still influence surface water availability. Years with above-average precipitation slightly alleviated water stress and contributed to temporary lake expansion, while persistent low rainfall periods exacerbated water shortages and accelerated lake shrinkage, especially under intensive irrigation demands. Over the past few decades, the land-use pattern in the plain regions of Xinjiang has undergone profound changes, with farmland areas continuously expanding and a large amount of other land-use types being converted into farmland [44]. Due to the region’s scarce precipitation, farmland requires irrigation. However, rainfall in the plain areas is limited, so constructing dams or diverting rivers in the upper reaches of rivers for agricultural irrigation is an important water resource development and utilization method in the region, indirectly leading to changes in the lake area in the downstream plain. The continuous increase in the NIL and arable land area has led to increased water demand for urban and agricultural production and living needs, especially in the Tianshan Mountain region, which is densely populated, has well developed urban clusters, and has a large scale of irrigated agriculture. This has resulted in significant human interference with surface water resources such as rivers and lakes, thereby reducing the potential for lake area expansion. For example, during the study period, the area of Bosten Lake experienced an expansion–shrinkage–expansion process, which corresponded to precipitation variations in its basin (which first rose slightly, then declined, and subsequently increased) as well as changes in the Kaidu River runoff, both influenced by climate variability and human activities [26,45]. After 1986, with the implementation of the irrigation quota system, water resource utilization efficiency improved, irrigation water use within the basin was effectively controlled, and the lake’s ecological environment improved, leading to an increase in lake surface area; however, with the continuous increase in the cultivated land area within the basin, changes in the regional land cover led to a temporary reduction in lake area. As public awareness of ecological conservation grew, a series of ecological engineering measures were gradually implemented to artificially intervene and protect the lake ecosystem [46], resulting in a gradual recovery of the Bositen Lake’s area, indicating that policy regulation plays a positive role in lake ecological restoration. In addition to agricultural water use, urban water use is also an important human factor driving changes in lake area. The changes in Chaiwoba Lake further validate this influence. Between 2009 and 2023, the lake’s area rapidly shrank. Although there was no significant increase in the cultivated land area within the Chaiwoba Lake basin, agricultural water use was not the primary human factor causing the reduction in lake area. During this period, NIL significantly increased, showing a negative correlation with lake area. The increase in urban water use was the primary human factor leading to the shrinkage of Chaiwoba Lake’s area [28].

4.2. Factors Affecting Alpine Lakes

The process of alpine lake change as a whole is characterized by the combined effects of climate change and human activities dominated by climate change. A significant rise in AAT in the Tian Shan region and higher temperatures promote glacier and snow melting, which increases lake replenishment water sources and partially offsets water loss due to evapotranspiration, ultimately leading to an increase in lake area, such as the expansion of the area of Nilkul Lake, an alpine lake located in the Tian Shan mountain range. Balikun Lake is located in the northern foothills of the Tien Shan Mountains, and due to the middle- and high-altitude regions of the Tien Shan Mountains, warming is small, so the AAT has a certain impact on its area change, but it is not significant; however, the increase in precipitation will directly promote the increase in the lake area, combined with the significant increase in precipitation in the northern foothills of the eastern Tien Shan Mountains after 2010. The increase in precipitation is an important factor in the rise in the lake area at this stage [47]. The PET and alpine lake area is significantly negatively correlated, which further makes the area of the Balikun Lake decrease; in addition, the enhancement of human activities is another driving factor leading to the rapid shrinkage of the lake area, so under the combined influence of climate change and human activities, the area of Balikun Lake is in a highly significant shrinkage state. The Sayram Lake is located in the western part of the northern slope of the Tianshan Mountain, which is a closed basin with less human activities, so the change in the area of the lake in the basin is closely related to the water recharge. Sayram Lake is surrounded by mountains with no surface outlet for the lake, precipitation and snowmelt are the main water recharge sources, and significant warming increased the glacier runoff as well as increased the precipitation, which led to more water sources flowing into Sayram Lake; however, the significant increase in the PET also depleted the lake’s water reserves, and the combined effect of multiple meteorological factors dominated the change in the area of the Sayram Lake. It should be noted that when separate biased correlation analyses were conducted between the area of Phantom Lake and the drivers, it was found that the area of Phantom Lake was not significantly correlated with the meteorological factors, although there was a negative effect (Table 5), suggesting that changes in the lake area may not necessarily be sensitive to a particular climatic factor.

4.3. Factors Affecting Highland Lakes

Plateau lakes have altitudes greater than 3500 m, a steep topography, minimal anthropogenic interference with the lake area, and a more sensitive response to climate change. The interaction of several meteorological factors has led to a significant expansion of the area of plateau lakes, with a rising AAT being an important meteorological factor leading to changes in the area of plateau lakes (Table 4).
Usually, among the climatic factors, the temperature has a negative effect on rain-fed lakes and a positive effect on ice–snowmelt water-fed lakes, and the increase in AAT can significantly increase the water recharge of plateau lakes by enhancing the melting rate of glaciers and snow, which has a direct effect on the ice–snowmelt water-fed closed lakes. Xinjiang plateau lakes are all located in the eastern Kunlun Mountains. Under the background of global warming, the rise in AAT in the eastern Kunlun Mountains accelerates the glacier and snowmelt, increasing the water source of the lakes, whereas the change in PET in the high-elevation mountain ranges is not significant, so the negative impact on the area of the plateau lakes is low. In addition, increased rainfall is also an important factor in the expansion of plateau lakes. For example, extreme rainfall events are frequent, which provide additional recharge to the lakes and affect the change in lake water volume [48,49]. Rainfall, ice meltwater, and seasonal snow together constitute the main recharge system of highland lakes, and the synergistic changes among them can amplify the influence of climate on the lake system. Changes in the area of Lake Ayakkumu validate this analysis. Ayakkumu Lake is a typical plateau lake that uses snow and ice meltwater as a recharge source and mainly depends on the inlet river, the Yixiekpati River, which has dramatically increased in area during the study period, which is fully consistent with the trend of warm and humid climate change in the eastern Kunlun Mountain region.

4.4. Ecological Effects of Changes in Lake Area

Xinjiang is an arid and semi-arid region, and lakes, as important water resources, experience changes in area that not only relate to the reserve and distribution of water resources in the region but also have far-reaching impacts on the stability of ecosystems, agricultural development, and disaster risks. In the plain area, the shrinkage and contraction of lakes can seriously damage the surrounding ecological environment, leading to a reduction in the area of wetlands around the lakes and a decline in biodiversity [50]; expansion of the exposed area of lake beds and salt-dust pollution formed under the action of wind can be deposited to the surrounding cultivated land with airflow, which not only affects the air quality but also aggravates soil salinization, inhibits the growth of crops, and poses a long-term threat to downstream agriculture. This is a long-term threat to the downstream agricultural ecosystem [51]. As natural reservoirs, lakes have the ecological functions of regulating runoff and mitigating drought, and the degradation of oasis lakes not only reduces their water storage capacity but also makes regional ecosystems more vulnerable in the context of drought [52]. Soil salinization and desertification due to the shrinking of oasis lakes can make the lake storage function decline, and human activities and increased water demand in the watershed exacerbate the salinization of lakes, thus reducing the availability of lake water resources [53].
Changes in lakes also create feedback mechanisms to agricultural systems. Lakes in the plains are generally involved in the regional agricultural irrigation system, and their shrinking size means weaker storage functions and reduced irrigation efficiency, forcing an increase in groundwater extraction and exacerbating water resource constraints. At the same time, the negative feedback mechanism between irrigation expansion and lake shrinkage further induces soil salinization and arable land degradation, restricting the sustainable development of regional agriculture.
In high-altitude areas, the increase in lake area enhances the total water resources but leads to a decrease in the salinity of the lake water, and changes in the physical and chemical properties of the lakes threaten lake ecosystems, leading to the merger and reorganization of the watersheds and a series of chain reactions [54]. Under the influence of climate warming and humidification, the water volume and area of glacial lakes, with snow and ice meltwater as the main source of recharge, increase significantly [55,56], the water level rises rapidly, and the lake area expands rapidly, which damages the surrounding ecological environment, and when the area reaches a certain level, the glacial lake dam breaks, thus triggering glacial lake outburst. Glacial lake outburst induces the formation of a large-scale flood and mudslide disaster chain, which causes serious economic losses and casualties to the downstream areas [57]. Water resource problems in different regions are prominent, and it is necessary to strengthen water resource management, take lake basin ecosystems as the core, integrate the “mountains, water, forests, fields, lakes, grasses and sands” community of life, couple nature–society–economy, pay attention to the impacts of human activities on the natural environment and the harmony between each other, and explore new ways of ecological civilization construction with regional characteristics.
From a practical perspective, this study provides scientific reference for provincial-level water resource management in arid regions such as Xinjiang. The highly specific response patterns of lakes indicate that plain lakes are primarily influenced by agricultural and urban water use. Efforts should steadily advance water resource recycling and regeneration, leveraging technological empowerment to explore efficient water-saving measures such as channel engineering water conservation, drip irrigation, and water–fertilizer integration. This will continuously enhance water-use efficiency and achieve symbiosis between humans and water. Alpine lakes face dual impacts from climate variability and human activities, underscoring the importance of integrated watershed management and ecological conservation. Particular attention should be paid to preventing lake ecosystem degradation caused by excessive tourism development. Plateau lakes exhibit strong responses to rising temperatures and increased precipitation, necessitating enhanced glacier and snowmelt monitoring to anticipate the potential risks of rapid lake expansion. These findings assist provincial governments in developing differentiated water management strategies tailored to unique drivers of change across distinct elevation zones, thereby supporting sustainable development and climate adaptation in arid regions.
Due to data limitations, this study only examined the relationships between lake area changes and a limited set of climatic and anthropogenic factors without incorporating other potentially important drivers such as glacier mass balance and runoff data. In addition, the classification of lakes into plain, alpine, and plateau types was based solely on elevation thresholds, which may overlook spatial heterogeneity among different basins (for example, different types of supplies, the strength of human activities). Future research should extend the analysis to the scale of individual lakes, integrating lake-specific hydrological and catchment characteristics to more clearly disentangle the relative contributions of climate variability and human activities to lake dynamics.

5. Conclusions

This study analyzed lake area dynamics across different elevation zones in Xinjiang from 1990 to 2023 using Landsat data on the GEE platform. The main conclusions are as follows:
(1) During the study period, the total area of lakes in Xinjiang was expanding as a whole, with a total increase of 1188.359 km2 during the 34-year period, and with an average annual total area of 5998.54 km2.
(2) The plain lakes area reached the maximum value in 2000 and then decreased to the minimum value in 2015. The lakes are dominated by anthropogenic activities such as the expansion of arable land area, irrigation water use, and watershed regulation, and increased PET accelerates evaporation.
(3) The alpine lakes total area change was unstable and fluctuated greatly from 1990 to 2010 and then continued to rise from 2010 to 2020, influenced jointly by rising air temperatures and human activity disturbances, while potential evapotranspiration exerted a suppressing effect.
(4) The plateau lakes, dominated by the expansion trend, responded strongly to a warm and wet climate, with rising temperatures enhancing the glacier meltwater supply and precipitation being a dominant driver, while the negative effect of PET was relatively minor.
(5) Xinjiang lakes show different response mechanisms under the altitudinal gradient. The plain lakes area is dominated by humans and has a low sensitivity to climate change; alpine lakes are dominated by climate change, but human activities also impact their changes; and finally, changes in plateau lakes are triggered by the interaction of multiple meteorological factors.

Author Contributions

Conceptualization, K.Z. and L.X.; methodology, K.Z.; validation, C.C.; writing—original draft preparation, K.Z.; writing—review and editing, J.L. and L.C.; supervision, G.W. All authors have read and agreed to the published version of the manuscript.

Funding

This research was funded by National Natural Science Foundation of China, grant number 32460290.

Data Availability Statement

The data presented in this study are available on request from the corresponding author.

Acknowledgments

The authors thank Zhijun Li from Dalian University of Technology for his valuable support and assistance in this study. We also acknowledge the editor and anonymous reviewers for their insightful comments and constructive suggestions, which helped improve the quality of this manuscript.

Conflicts of Interest

The authors declare no conflicts of interest.

References

  1. Hu, R.; Jiang, F.; Wang, Y.; Sun, Z. On the importance of research on the lake in arid land of China. Arid Zone Res. 2007, 24, 137–140. (In Chinese) [Google Scholar] [CrossRef]
  2. Woolway, R.I.; Kraemer, B.M.; Lenters, J.D.; Merchant, C.J.; O’Reilly, C.M.; Sharma, S. Global Lake Responses to Climate Change. Nat. Rev. Earth Environ. 2020, 1, 388–403. [Google Scholar] [CrossRef]
  3. Yang, X.; Wang, N.; Chen, A.; He, J.; Hua, T.; Qie, Y. Changes in area and water volume of the Aral Sea in the arid Central Asia over the period of 1960–2018 and their causes. Catena 2020, 191, 104566. [Google Scholar] [CrossRef]
  4. Zhang, G.; Yao, T.; Chen, W.; Zheng, G.; Shum, C.K.; Yang, K.; Piao, S.; Sheng, Y.; Yi, S.; Li, J.; et al. Regional differences of lake evolution across China during 1960s–2015 and its natural and anthropogenic causes. Remote Sens. Environ. 2019, 221, 386–404. [Google Scholar] [CrossRef]
  5. Naeem, M.; Zhang, Y.; Vahid, N.; Tian, X.; Miao, P. Both climate and anthropogenic impacts on recent lake area change in the Erdos Plateau. J. Environ. Manag. 2025, 373, 123443. [Google Scholar] [CrossRef] [PubMed]
  6. Luo, Y.; Chen, R.; Yang, K.; Zhou, X.; Jia, T.; Shang, C.; Pei, X.; Wang, Q.; Li, D.; Peng, C.; et al. Response of changes in lake area to drought and land use change. Sci. Total Environ. 2024, 947, 174638. [Google Scholar] [CrossRef]
  7. Wurtsbaugh, W.A.; Miller, C.; Null, S.E.; DeRose, R.J.; Wilcock, P.; Hahnenberger, M.; Howe, F.; Moore, J. Decline of the world’s saline lakes. Nat. Geosci. 2017, 10, 816–821. [Google Scholar] [CrossRef]
  8. Vinna, L.R.; Medhaug, I.; Schmid, M.; Bouffard, D. The vulnerability of lakes to climate change along an altitudinal gradient. Commun. Earth Environ 2021, 2, 35. [Google Scholar] [CrossRef]
  9. Zhang, T.; Wang, W.; An, B.; Wei, L. Enhanced glacial lake activity threatens numerous communities and infrastructure in the Third Pole. Nat. Commun. 2023, 14, 8250. [Google Scholar] [CrossRef]
  10. Zhang, G.; Yao, T.; Shum, C.K.; Yi, S.; Yang, K.; Xie, H.; Feng, W.; Bolch, T.; Wang, L.; Behrangi, A.; et al. Lake volume and groundwater storage variations in Tibetan Plateau’s endorheic basin. Geophys. Res. Lett. 2017, 44, 5550–5560. [Google Scholar] [CrossRef]
  11. Su, Y.; Ran, Y.; Zhang, G.; Li, X. Remotely sensed lake area changes in permafrost regions of the Arctic and the Tibetan Plateau between 1987 and 2017. Sci. Total Environ. 2023, 880, 163355. [Google Scholar] [CrossRef] [PubMed]
  12. Dømgaard, M.; Kjeldsen, K.; How, P.; Bjørk, A. Altimetry-based ice-marginal lake water level changes in Greenland. Commun. Earth Environ. 2024, 5, 365. [Google Scholar] [CrossRef]
  13. Salerno, F.; Gambelli, S.; Viviano, G.; Thakuri, S.; Guyennon, N.; D’Agata, C.; Diolaiuti, G.; Smiraglia, C.; Stefani, F.; Bocchiola, D.; et al. High alpine ponds shift upwards as average temperatures increase: A case study of the Ortles-Cevedale mountain group (southern Alps, Italy) over the last 50 years. Glob. Planet. Change 2014, 120, 81–91. [Google Scholar] [CrossRef]
  14. Wu, F.; Yang, X.; Cui, Z.; Ren, L.; Jiang, S.; Liu, Y.; Yuan, S. The impact of human activities on blue-green water resources and quantification of water resource scarcity in the Yangtze River Basin. Sci. Total Environ. 2024, 909, 168550. [Google Scholar] [CrossRef]
  15. Pekel, J.F.; Cottam, A.; Gorelick, N.; Belward, A.S. High-resolution mapping of global surface water and its long-term changes. Nature 2016, 540, 418–422. [Google Scholar] [CrossRef]
  16. Chen, T.; Zhao, S.; Zhang, D. Remote sensing estimation of water volume changes of typical lakes in Xinjiang, China from 1990 to 2021. Chin. J. Appl. Ecol. 2024, 35, 3141–3148. (In Chinese) [Google Scholar] [CrossRef]
  17. Wufu, A.; Wang, H.; Chen, Y.; Rusuli, Y.; Ma, L.; Yang, S.; Zhang, F.; Wang, D.; Li, Q.; Li, Y. Lake water volume fluctuations in response to climate change in Xinjiang, China from 2002 to 2018. PeerJ 2020, 8, e9683. [Google Scholar] [CrossRef]
  18. Feng, Y.; Zheng, B.; Jia, H.; Peng, J.; Zhou, X. Influence of social and economic development on water quality in Dongting Lake. Ecol. Indic. 2021, 131, 108220. [Google Scholar] [CrossRef]
  19. Chen, Y.; Li, Z.; Fan, Y.; Wang, H.; Fang, G. Research progress on the impact of climate change on water resources in the arid region of Northwest China. Acta Geogr. Sin. 2014, 69, 1295–1304. (In Chinese) [Google Scholar] [CrossRef]
  20. Zhu, B. The recent evolution of dune landforms and its environmental indications in the mid-latitude desert area (Hexi Corridor). J. Geogr. Sci. 2022, 32, 617–644. [Google Scholar] [CrossRef]
  21. Hall, D.K.; O’Leary, D.S.; DiGirolamo, N.E.; Miller, W.; Kang, D.H. The role of declining snow cover in the desiccation of the Great Salt Lake, Utah, using MODIS data. Remote Sens. Env. 2021, 252, 112106. [Google Scholar] [CrossRef]
  22. Binh, P.D.; Florence, S.; Fabrice, P.; Frappart, F.; Bouchez, C.; Crétaux, J.F. The Lake Chad hydrology under current climate change. Sci. Rep. 2020, 10, 5498. [Google Scholar] [CrossRef]
  23. Wei, X.; Xu, W.; Bao, K.; Hou, W.; Su, J.; Li, H.; Miao, Z. A water body extraction methods comparison based on FengYun Satellite data: A case study of Poyang Lake Region, China. Remote Sens. 2020, 12, 3875. [Google Scholar] [CrossRef]
  24. Tulbure, M.G.; Broich, M.; Stehman, S.V.; Kommareddy, A. Surface water extent dynamics from three decades of seasonally continuous Landsat time series at subcontinental scale in a semi-arid region. Remote Sens. Environ. 2016, 178, 142–157. [Google Scholar] [CrossRef]
  25. Herath, H.M.P.I.K.; Halwatura, R.U.; Jayasinghe, G.Y. Evaluation of green infrastructure effects on tropical Sri Lankan urban context as an urban heat island adaptation strategy. Urban For. Urban Green. 2018, 29, 212–222. [Google Scholar] [CrossRef]
  26. Tang, X.; Xie, G.; Deng, J.; Shao, K.; Hu, Y.; He, J.; Zhang, J.; Gao, G. Effects of climate change and anthropogenic activities on lake environmental dynamics: A case study in Lake Bosten Catchment, NW China. J. Environ. Manag. 2022, 319, 115764. [Google Scholar] [CrossRef]
  27. Liu, C.; Zhang, F.; Jim, C.Y.; Johnson, V.C.; Tan, M.L.; Shi, J.; Lin, X. Controlled and driving mechanism of the SPM variation of shallow Brackish Lakes in arid regions. Sci. Total Environ. 2023, 878, 163127. [Google Scholar] [CrossRef] [PubMed]
  28. Zhang, J.; Zhou, J.; Zhang, G.; Ji, Y.; Zeng, Y.; Fan, W. Climate and human-driven variations in lake area and number in North Xinjiang, China. Int. J. Remote Sens. 2021, 42, 469–485. [Google Scholar] [CrossRef]
  29. Wang, Q.; Zhai, P.; Qin, D. New perspectives on ‘warming–wetting’ trend in Xinjiang, China. Adv. Clim. Change Res. 2020, 11, 252–260. [Google Scholar] [CrossRef]
  30. Xu, M.; Kang, S.; Wu, H.; Yuan, X. Detection of spatio-temporal variability of air temperature and precipitation based on long-term meteorological station observations over Tianshan Mountains, Central Asia. Atmos. Res. 2018, 203, 141–163. [Google Scholar] [CrossRef]
  31. Yao, J.; Yang, Q.; Mao, W.; Zhao, Y.; Xu, X. Precipitation trend-Elevation relationship in arid regions of the China. Glob. Planet. Change 2016, 143, 1–9. [Google Scholar] [CrossRef]
  32. Zhuang, H.; Zhang, C.; Jin, X.; Ge, A.; Chen, M.; Ye, J.; Qiao, H.; Xiong, P.; Zhang, X.; Chen, J.; et al. A flagship species-based approach to efficient, cost-effective biodiversity conservation in the Qinling Mountains, China. J. Environ. Manag. 2022, 305, 114388. [Google Scholar] [CrossRef]
  33. Xu, W.; Lei, X.; Chen, S.; Yu, T.; Hu, Z.; Zhang, M.; Jiang, L.; Bao, R.; Guan, X.; Ma, M.; et al. How Well Does the ERA5 Reanalysis Capture the Extreme Climate Events Over China? Part II: Extreme Temperature. Front. Environ. Sci. 2022, 10, e921659. [Google Scholar] [CrossRef]
  34. Gorelick, N.; Hancher, M.; Dixon, M.; Ilyushchenko, S.; Thau, D.; Moore, R. Google earth engine: Planetary-scale geospatial analysis for everyone. Remote Sens. Environ. 2017, 202, 18–27. [Google Scholar] [CrossRef]
  35. Wan, J.; Yong, B. Automatic extraction of surface water based on lightweight convolutional neural network. Ecotoxicol. Environ. Saf. 2023, 256, 114843. [Google Scholar] [CrossRef] [PubMed]
  36. Xu, H. Modification of normalised difference water index (NDWI) to enhance open water features in remotely sensed imagery. Int. J. Remote Sens. 2006, 27, 3025–3033. [Google Scholar] [CrossRef]
  37. Mann, H.B. Nonparametric test against trend. Econometrica 1945, 13, 245–259. [Google Scholar] [CrossRef]
  38. Sen, P. Estimates of the Regression Coefficient Based on Kendall’s Tau. J. Am. Stat. Assoc. 1968, 63, 1379–1389. [Google Scholar] [CrossRef]
  39. Yu, Y.; Chen, X.; Disse, M.; Cyffka, B.; Lei, J.; Zhang, H.; Brieden, A.; Welp, M.; Abuduwaili, J.; Li, Y.; et al. Climate change in Central Asia: Sino-German cooperative research findings. Sci. Bull. 2020, 65, 689–692. [Google Scholar] [CrossRef]
  40. Hugonnet, R.; McNabb, R.; Berthier, E.; Menounos, B.; Nuth, C.; Girod, L.; Farinotti, D.; Huss, M.; Dussaillant, I.; Brun, F.; et al. Accelerated global glacier mass loss in the early twenty-first century. Nature 2021, 592, 726–731. [Google Scholar] [CrossRef]
  41. Huss, M.; Hock, R. Global-scale hydrological response to future glacier mass loss. Nat. Clim. Change 2018, 8, 135–140. [Google Scholar] [CrossRef]
  42. Chen, F.; Chen, J.; Huang, W.; Chen, S.; Huang, X.; Jin, L.; Jia, J.; Zhang, X.; An, C.; Zhang, J.; et al. Westerlies Asia and monsoonal Asia: Spatiotemporal differences in climate change and possible mechanisms on decadal to sub-orbital timescales. Earth-Sci. Rev. 2019, 192, 337–354. [Google Scholar] [CrossRef]
  43. Yao, J.; Chen, Y.; Zhao, Y.; Guan, X.; Mao, W.; Yang, L. Climatic and associated atmospheric water cycle changes over the Xinjiang, China. J. Hydrol. 2020, 585, 124823. [Google Scholar] [CrossRef]
  44. Liao, N.; Wang, Y.; Xu, H.; Fam, Z.; Zhang, Z.; Yao, J.; Zhang, Q.; Huang, Y. Differences in and driving forces of cultivated land expansion in the Manas River Basin oasis, Xinjiang. Chin. J. Eco-Agric. 2021, 29, 1008–1017. (In Chinese) [Google Scholar] [CrossRef]
  45. Li, X.; Zhang, F.; Shi, J.; Chan, N.W.; Cai, Y.; Cheng, C.; An, C.; Wang, W.; Liu, C. Analysis of surface water area dynamics and driving forces in the Bosten Lake basin based on GEE and SEM for the period 2000 to 2021. Environ. Sci. Pollut. Res. Int. 2024, 31, 9333–9346. [Google Scholar] [CrossRef] [PubMed]
  46. Cheng, C.; Zhang, F.; Li, X.; Tan, M.L.; Kumar, P.; Johnson, B.A.; Shi, J.; Zhao, Q.; Liu, C. Variations in water storage of Bosten Lake, China, over the last two decades based on multi-source satellite data. J. Hydrol. Reg. Stud. 2023, 49, 101496. [Google Scholar] [CrossRef]
  47. Hu, W.; Yao, J.; He, Q.; Chen, J. Changes in precipitation amounts and extremes across Xinjiang (northwest China) and their connection to climate indices. PeerJ 2021, 9, e10792. [Google Scholar] [CrossRef]
  48. Zhou, Y.; Liu, Z.; Liu, J.; Yang, X.; Zhang, M.; Zhou, Y. Analysis of Convection-Symmetric Instability and Triggering Mechanism for Extreme Rainstorms on the Northern Slope of the Middle Kunlun Mountains. Chin. J. Atmos. Sci. 2024, 48, 987–1011. (In Chinese) [Google Scholar] [CrossRef]
  49. Chen, Y.; Liu, B.; Cai, X.; Zhou, T.; He, Q. Moisture transport and sources of an extreme rainfall event of June 2021 in southern Xinjiang, China. Adv. Clim. Change Res. 2022, 13, 843–850. [Google Scholar] [CrossRef]
  50. Cheng, N.; Yang, T.; Wu, T.; Hu, R.; He, X. Lake shrinkage-induced terrestrial ecological environmental quality degradation in a semiarid lake basin. Environ. Sci. Pollut. Res. 2023, 30, 120892–120902. [Google Scholar] [CrossRef] [PubMed]
  51. Wang, R.; Ding, J.; Ge, X.; Wang, J.; Qin, S.; Tan, J.; Han, L.; Zhang, Z. Impacts of climate change on the wetlands in the arid region of Northwestern China over the past 2 decades. Ecol. Indic. Indic. 2023, 149, 110168. [Google Scholar] [CrossRef]
  52. Wu, J.; Liu, Z.; Yao, H.; Chen, X.; Chen, X.; Zheng, Y.; He, Y. Impacts of reservoir operations on multi-scale correlations between hydrological drought and meteorological drought. J. Hydrol. 2018, 563, 726–736. [Google Scholar] [CrossRef]
  53. Guo, M.; Zhou, X.; Li, J.; Wu, W.; Chen, Y. Assessment of the salinization processes in the largest inland freshwater lake of China. Stoch. Environ. Res. Risk Assess. 2015, 29, 1823–1833. [Google Scholar] [CrossRef]
  54. Zhang, G.; Woolway, R.I.; Yang, K.; Wada, Y.; Wang, J.; Crétaux, J.F. Widespread societal and ecological impacts from projected Tibetan Plateau lake expansion. Nat. Geosci. 2024, 17, 516–523. [Google Scholar] [CrossRef]
  55. Zhang, G.; Yao, T.; Xie, H.; Yang, K.; Zhu, L.; Shum, C.K.; Bolch, T.; Yi, S.; Allen, S.; Jiang, L.; et al. Response of Tibetan Plateau lakes to climate change: Trends, patterns, and mechanisms. Earth-Sci. Rev. 2020, 208, 103269. [Google Scholar] [CrossRef]
  56. Yong, B.; Wang, C.; Chen, J.; Chen, J.; Barry, D.A.; Wang, T.; Li, L. Missing water from the Qiangtang Basin on the Tibetan Plateau. Geology 2021, 49, 867–872. [Google Scholar] [CrossRef]
  57. Liu, W.; Carling, P.A.; Hu, K.; Wang, H.; Zhou, Z.; Zhou, L.; Liu, D.; Lai, Z.; Zhang, X. Outburst floods in China: A review. Earth-Sci. Rev. 2019, 97, 102895. [Google Scholar] [CrossRef]
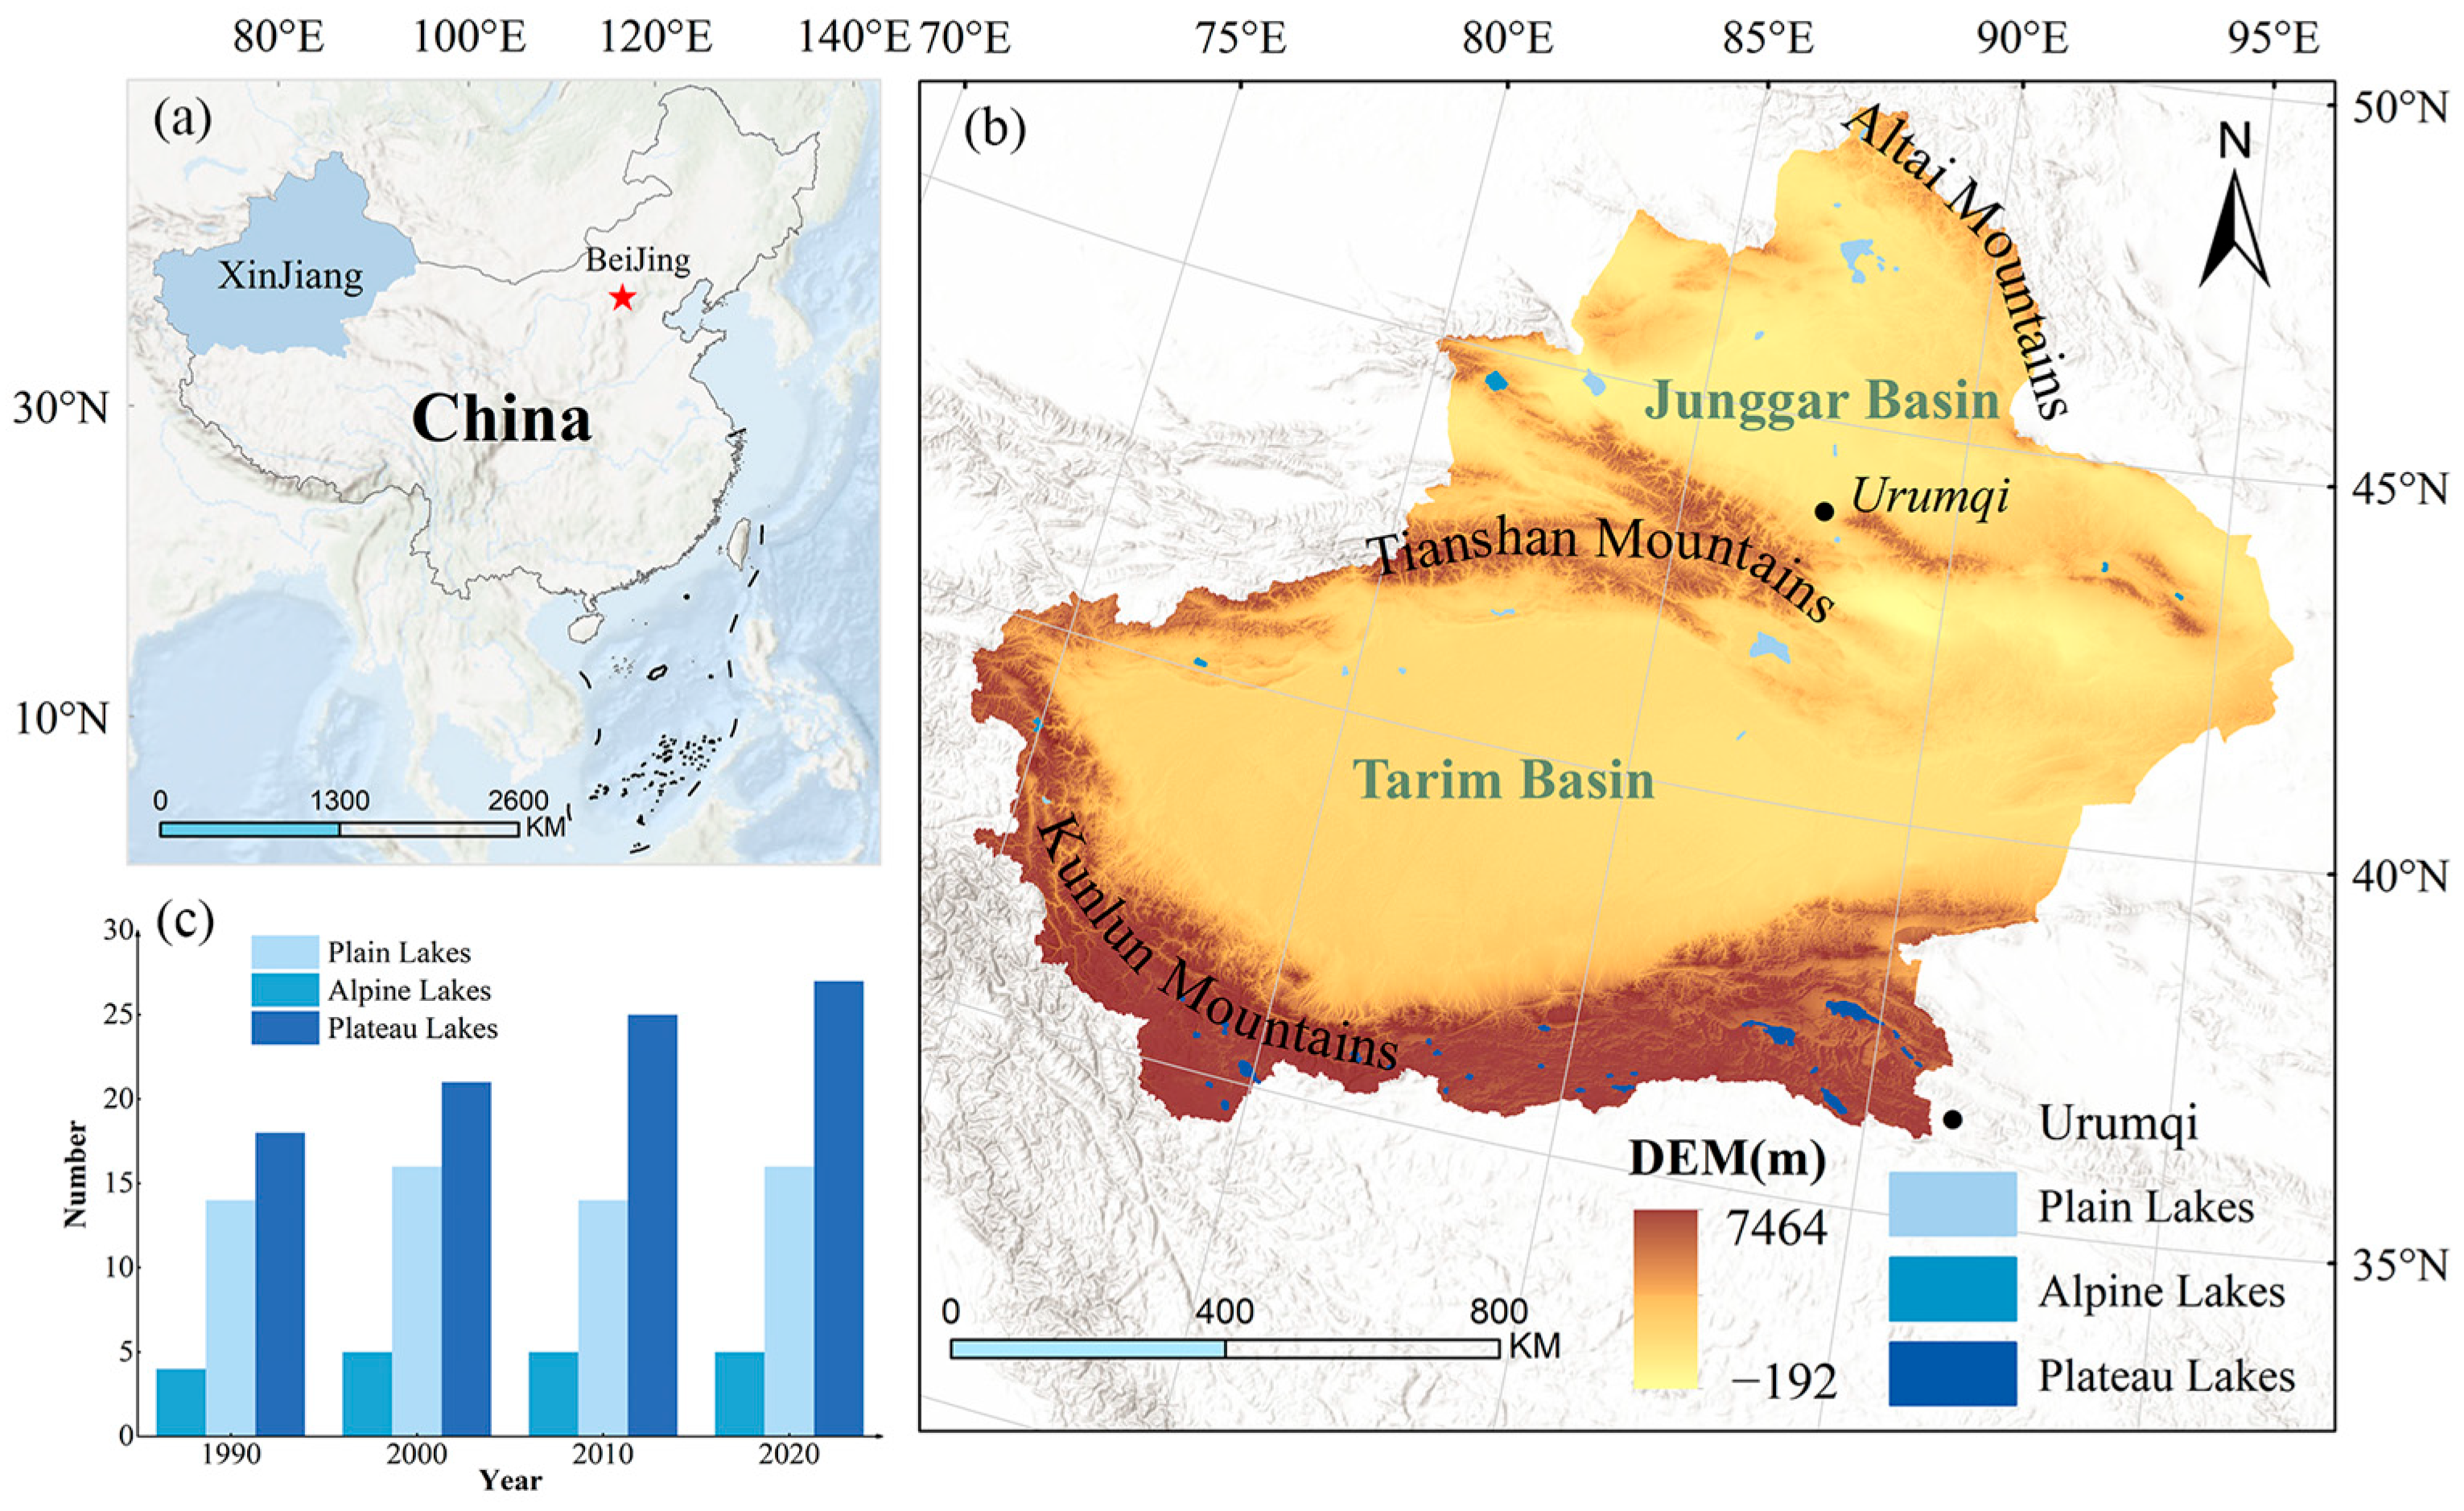
Figure 1. Overview map of the research area ((a): China border; (b): locations of lakes larger than 10 km2 in Xinjiang in 2023; and (c): number of lakes with different altitude gradients).
Sustainability 17 08705 g001
Figure 2. Research framework.
Sustainability 17 08705 g002
Figure 3. Assessment of water extraction accuracy ((a): plain lake Bosten; (b): alpine lake Balikun; and (c): plateau lake Ayakkumu).
Sustainability 17 08705 g003
Figure 4. Distribution of lakes in Xinjiang, 1990–2023 (Group (I): 1990–1996; Group (II): 1997–2003; Group (III): 2004–2010; Group (IV): 2011–2017; and Group (V): 2018–2023).
Sustainability 17 08705 g004
Figure 5. Comparison of lake areas extracted in this paper with previous studies.
Sustainability 17 08705 g005
Figure 6. Interdecadal changes in lake area. (a) Total area, (b) plain lakes area, (c) alpine lakes area, and (d) plateau lakes. The red text indicates the rate of area change per decade, while the green text represents the maximum and minimum values within the study period.
Sustainability 17 08705 g006
Figure 7. Rate of change in lake areas in Xinjiang, 1990–2023.
Sustainability 17 08705 g007
Figure 8. Comparison of spatiotemporal changes in Bosten Lake: ((a,b) represent the starting and ending times of the study period, respectively; (c,d) represent the maximum and minimum values of the lake area; and (e) represents the change in lake area from 1990 to 2023).
Sustainability 17 08705 g008
Figure 9. Comparison of spatiotemporal changes in Balikun Lake: ((a,b) represent the starting and ending times of the study period, respectively; (c,d) represent the maximum and minimum values of the lake area; and (e) represents the change in lake area from 1990 to 2023).
Sustainability 17 08705 g009
Figure 10. Comparison of spatiotemporal changes in Ayakkumu Lake: ((a,b) represent the starting and ending times of the study period, respectively; (c,d) represent the maximum and minimum values of the lake area; and (e) represents the change in lake area from 1990 to 2023).
Sustainability 17 08705 g010
Figure 11. The change in climate in XinJiang (In the figure, groups (ac) are AAT, AP, and PET; (a1a4,b1b4,c1c4) represent the changes from 1990 to 2023, 1990 to 2000, 2000 to 2010, and 2010 to 2020, respectively. For example, (a1) represents the changes in AAT from 1990 to 2023).
Sustainability 17 08705 g011
Figure 12. NTL intensity in Xinjiang from 1992 to 2023 ((a): 1992; (b): 2000; (c): 2010; (d): 2020; and (e): 2023).
Sustainability 17 08705 g012
Figure 13. Trend of changes in cropland area in Xinjiang ((a): 1990; (b): 2000; (c): 2010; (d): 2020; (e): 2023; (f): cropland area of plain lakes basin from 1990 to 2023; and (g): cropland area of alpine lakes basin from 1990 to 2023).
Sustainability 17 08705 g013
Table 1. Basic information on typical lakes.
Lake TypeNameDepth
(m)
Area
(km2)
Elevation (m)Latitude (°N)Longitude (°E)
plain lakeBosten9.1961.84105041.8386.75
alpine lakeBalikun1.632.43157743.6692.78
plateau lakeAyakkum10616.34387637.5689.43
Table 2. Data sources.
DataPeriodData SourcesResolution
Annual Average Temperature Data1990–2023ERA5-Land9 km
Precipitation Data1990–2023TerraClimate4638.3 m
Potential Evapotranspiration1990–2023National Earth System Science Data Center, National Science & Technology Infrastructure of China (http://www.geodata.cn, accessed on 18 April 2025)1 km
Nighttime Light Data1992–2023National Earth System Science Data Center, National Science & Technology Infrastructure of China (http://www.geodata.cn, accessed on 18 April 2025)1 km
Land Cover Data1990–2023The 30 m resolution land-use classification dataset developed by Professor Yang Jie’s team at Wuhan University30 m
DEM-Copernicus DEM (https://www.earthdata.nasa.gov/data/catalog/lpcloud-nasadem-hgt-001, accessed on 5 April 2025)90 m
Table 3. Lake area change trend features.
Area Change TrendSlopeZ Valuep Value
Extremely significant expansionSlope > 0Z > 2.58p < 0.01
Significant expansionSlope > 01.96 ≤ Z ≤ 2.580.01 ≤ p ≤ 0.05
No obvious changesAny value−1.96 < Z < 1.96p > 0.05
Significant shrinkageSlope < 0−2.58 ≤ Z ≤ −1.960.01 ≤ p ≤ 0.05
Extremely significant shrinkageSlope < 0Z < −2.58p < 0.01
Table 4. Partial correlation analysis between lake area changes and driving factors.
Lakes TypeMeteorological FactorsHuman Activities
AAT (r)AP (r)PET (r)NIL (r)CA (r)
Plain Lakes0.540 *−0.042−0.556 *−0.160 *0.491 **
Alpine Lakes0.633 *0.195 *−0.602 *0.1500.193 *
Plateau Lakes0.723 *0.485 *−0.281
p < 0.05 *, p < 0.01 **.
Table 5. Partial correlation analysis between Huancai lake area change and driving factors.
LakeMeteorological FactorsHuman Activities
AAT (r)AP (r)PET (r)NIL (r)CA (r)
Huancai Lake−0.07−0.02225−0.13475−0.176860.08186
Disclaimer/Publisher’s Note: The statements, opinions and data contained in all publications are solely those of the individual author(s) and contributor(s) and not of MDPI and/or the editor(s). MDPI and/or the editor(s) disclaim responsibility for any injury to people or property resulting from any ideas, methods, instructions or products referred to in the content.