Abstract
Under the dual backdrop of the Healthy China strategy and the concept of sustainable development, optimizing the spatial layout of primary healthcare facilities is important for fairly distributing healthcare resources and strengthening the resilience of the public health system in a sustainable way. This study introduces an innovative 3D spatial resilience evaluation framework, covering transmission (service accessibility), diversity (facility type matching), and stability (supply demand balance). Unlike traditional accessibility studies, the concept of “resilience” here highlights a system’s ability to adapt to sudden public health events through spatial reorganization, contrasting sharply with vulnerable systems that lack resilience. Method-wise, the study uses an improved Gaussian two-step floating catchment area method (Ga2SFCA) to measure spatial accessibility, applies a geographically weighted regression model (GWR) to analyze spatial heterogeneity factors, combines network analysis tools to assess service coverage efficiency, and uses spatial overlay analysis to identify areas with supply demand imbalances. Harbin is located in northeastern China and is the capital of Heilongjiang Province. Since Harbin is a typical central city in the northeast region, with a large population and clear regional differences, it was chosen as the case study. The case study in Harbin’s main urban area shows clear spatial differences in medical accessibility. Daoli, Nangang, and Xiangfang form a highly accessible cluster, while Songbei and Daowai show clear service gaps. The GWR model reveals that population density and facility density are key factors driving differences in service accessibility. LISA cluster analysis identifies two typical hot spots with supply demand imbalances: northern Xiangfang and southern Songbei. Finally, based on these findings, recommendations are made to increase appropriate-level medical facilities, offering useful insights for fine-tuning the spatial layout of basic healthcare facilities in similar large cities.
1. Introduction
1.1. Research Background and Significance
Improving the spatial fairness of healthcare systems and their resilience to uncertain risks is not only a key part of the “Healthy China” strategy but also an essential element of the Sustainable Development Goals (SDGs) in the global urbanization process. In recent years, as sustainable urbanization speeds up, city spaces are becoming much more sensitive to external pressures, making them noticeably more vulnerable [1]. In this context, building urban systems that are resilient and sustainable has become a key focus in urban planning research and practice [2]. Among these systems, the network of medical facilities plays a vital role in maintaining urban safety and health, highlighting its increasing importance. Directly tied to the fundamental health needs of the population, the healthcare facility system is essential for the continuity and stability of urban activities. In the face of sudden public health emergencies [3]. At the 10th Summit Forum for Hospital Architects in China and Abroad in 2022, experts pointed out that in the stage of high-quality development [4], primary healthcare facilities should move beyond their limited roles and connect more closely with urban resilience efforts [5]. Better integrate with urban resilience efforts and embed sustainable development principles. Strengthening collaboration between primary healthcare and other city systems helps manage shocks, maintain normal urban operations, and achieve sustainable renewal and growth [6].
The 2025–2028 Global Health Strategy, part of WHO’s 14th General Programme of Work, aims to tackle the growing complexity of health challenges worldwide. It focuses on promoting health equity and strengthening the resilience of healthcare systems amid multiple crises like climate change, geopolitical conflicts, pandemic risks, and rising inequalities. The strategy highlights the importance of universal health coverage and the right to health in today’s unstable world. Amid efforts to build a harmonious society, healthcare reform in China is shifting the traditional tiered medical model toward sustainability. Medical resources are increasingly being “pushed down” to community levels, with more healthcare facilities integrating deeply into urban life by offering “sustainable services.” In recent years, city development has moved from expanding new areas to sustainably upgrading existing ones, with public services improving mainly through sustainable renovation. Against this backdrop, healthcare buildings need to rethink their role in the city and actively meet the modern demands of sustainable living and transportation.
In this study, the medical resources in the main urban area of Harbin are grouped according to the Health Statistics Yearbook. National healthcare institutions are divided into four categories: hospitals, primary medical institutions [7], specialized public health institutions, and other facilities. This research focuses specifically on primary healthcare institutions within the central area of Harbin’s urban district. For this analysis, outpatient departments and clinics (medical offices) [8] within primary healthcare are merged into a single category referred to as “clinics.” Consequently, the subjects of this study encompass three types: hospitals [9], community hospitals, and clinics. These categories are further delineated into hierarchical levels based on the classification of healthcare resources and service scope: hospitals, community hospitals, and clinics, the specific classification of medical facilities is shown in Figure 1.
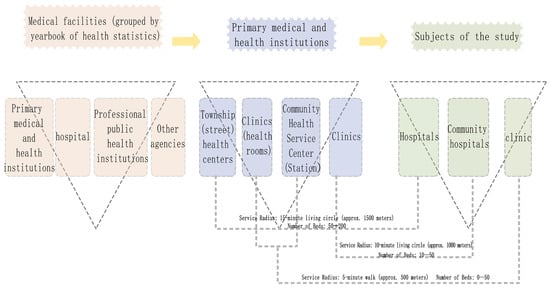
Figure 1.
Definition of medical facilities.
1.2. Literature Review
The WHO Healthy Cities Framework emphasizes that equitable access to primary health care is fundamental to sustainable urban development [10]. Currently, when exploring the resilience layout of medical facilities and ways to improve it, most studies focus on spatial data visualization. They commonly use Baidu POI data, social platform data, and heatmaps to turn diverse data into references for urban planning. However, these studies often lack clear starting points and reasons when applying the data to spatial optimization, making it hard to effectively implement layout improvements [11]. In view of the background of the epidemic, some papers sorted out the relevant research on the concept of resilience at home and abroad, integrated the concept of urban resilience into the existing healthcare facilities (HCF) and community space [12]. With multi-functional and flexible spatial layouts and modular and flexible facility design, communities that achieve a dynamic balance and resilience in response to environmental impacts are built [13]. Such as the Tokyo Metro Station Regional Clinic, which achieved a 40% higher service continuity through a dynamic bed resource reallocation algorithm (Takahashi et al., 2023). Crucially, UN-Habitat’s (2022) Global Urban Monitoring Report highlights [14] that less than 12% of Asian cities meet benchmarks for diversity and stability; researchers have used a three-level hierarchical multi-level model to illustrate the impact of accessibility, availability of health facilities, and community health program variables on the utilization of institutional health services, gradually beginning to view the importance of medical facilities from a demand-oriented perspective [15]; other researchers have calculated the accessibility index of healthcare facilities in sparsely populated areas (APMI) by using geographic information such as the distance residents have to travel to healthcare facilities and to bus stops, and estimated the number of patients considered difficult to access using national health insurance data (KDB) owned by local governments. Through analysis, it is clear to see both accessibility and the number of patients [16]. However, most studies only remain at the stage of number quantification at the end of the analysis, with very few specifically conducting targeted optimization of layouts.
From a holistic perspective, existing research rarely examines healthcare access from the multiple dimensions of residents’ needs. There has been little extension from the intrinsic characteristics of resilience to detailed analyses, and the optimization of healthcare layouts frequently lacks practical implementation. Firstly, concerning the choice of research methods and perspectives, most studies tend to focus on the diverse and multidimensional demands of residents seeking medical treatment [17]. However, there is a notable scarcity of studies that incorporate resilience theory into the analysis of residents’ healthcare systems. Consequently, it is necessary to conduct more in-depth research on the actual operation of medical institutions at different regions and levels. By leveraging modern technological approaches such as big data analysis, it is crucial to propose actionable and targeted optimization strategies. Furthermore, there should be an emphasis on specific studies addressing the practical implementation of layout optimization, with the objective of constructing a more efficient, equitable, and resilient healthcare environment for residents [18].
Wardek proposed six fundamental characteristics of resilient systems [19], including internal stability, diversity, high mobility, flatness, buffering, and redundancy. In the medical resource system, ‘resilience’ refers to the system’s ability to maintain functionality and recover quickly after external disturbances [20]. This can specifically be characterized in terms of three aspects at the level of residents seeking medical treatment: a stable healthcare network structure, diversified medical resource supply paths, and an efficient mechanism for sharing medical facility resources [21]. From a spatial dimension, these properties can be further summarized into three core characteristics: transmissibility, diversity, and stability.
Transmissibility reflects the internal stability mechanism of the system, relying on the hierarchical diagnosis and treatment system to achieve a dynamic balance and efficient flow of medical resources; diversity echoes the high mobility demand of the system, providing flexible and alternative medical pathways through the medical supply system; stability characterizes the system’s structural resistance to interference and redundancy, enhancing the overall network’s reliability through a multi-center node layout [22]. These three characteristics are interrelated and work synergistically: stability ensures the heterogeneity and robustness of the system’s underlying structure, improving the service efficiency of grassroots medical facilities and the overall robustness of the system [23]; diversity provides more medical choices within residents’ reach, enhancing the system’s adaptability to change; transmissibility promotes the efficient flow and integration of medical resources by optimizing resource acquisition and transportation convenience [24]. The logical framework between resilience and grassroots medical facilities is shown in Figure 2.
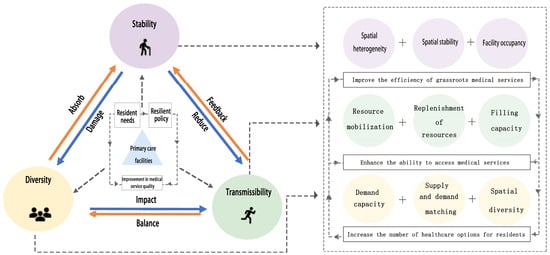
Figure 2.
Resilience and the framework of primary care facilities.
2. Data and Methodology
2.1. Research Framework
This study is divided into five parts. The first part is all about explaining why important to optimize the layout of healthcare facilities from a resilience perspective, and it categorizes the basic medical facilities accordingly. The second part covers data selection, picking relevant data indicators based on the methods used and their sources. The third part involves quantitative analysis from multiple angles to gather initial data. The fourth part discusses the results in detail. Finally, the study uses these findings to optimize the layout. The research framework is shown in Figure 3.
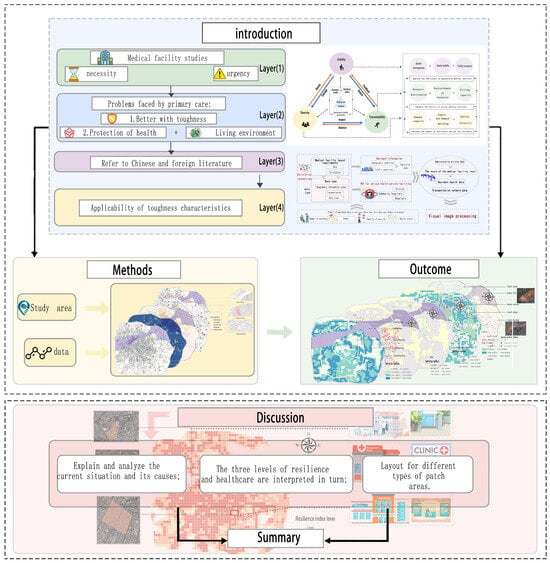
Figure 3.
Research Process Framework.
2.2. Scope of the Study
Harbin, the capital city of Heilongjiang Province, is located in northeastern China, approximately 1200 km northeast of Beijing. This study, utilizing satellite map data from 2023, focuses on the main urban area of Harbin, specifically examining five administrative districts: Xiangfang, Nangang, Daoli, Daowai, and Songbei, all located within the Fourth Ring Road, covering an area of 589.03 square kilometers. The main urban area has a higher population density and a more diverse group of residents, which creates a greater demand for healthcare services. With healthcare reforms underway, the connectivity between medical facilities and communities, as well as the tiered management of medical services, is more prominent in these central areas. So, studying healthcare facilities in the main urban area better reflects how city healthcare actually operates and stays resilient, meeting the needs of most residents. Why Harbin’s main urban area was chosen for this study, rather than including the surrounding regions.
As illustrated in Figure 4, the terrain of the study area displays a traditional spatial structure, characterized by a ring-radiation pattern within the main urban center of Harbin. This main urban area is situated along the Fourth Ring Road, which has been progressively expanding in the north south direction in conjunction with the highway. In the north, it connects to the urban center via Heihe Road, while to the south, it is linked through the Jingha Expressway. This spatial configuration significantly supports the flow of information within Harbin. The focus of this study is on the urban built-up area of the main urban district as its research scope (see Figure 4).
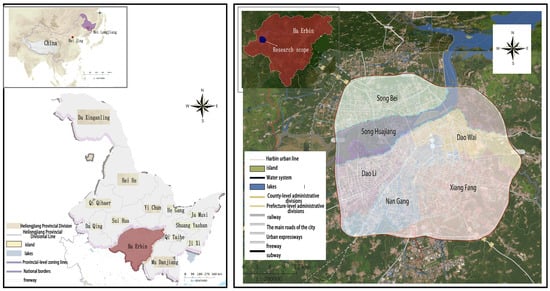
Figure 4.
Scope of the study, the central urban area of Harbin (Base map from BIGEMAP, via BIGEMAP; created using BIGEMAP Map).
2.3. Research Methods
2.3.1. Transmissibility Analysis
- (1)
- Gaussian two-part mobile search method
Dai proposed the Gaussian two-step moving search method [25] in 2010. Its general expression is:
In the formula, Ai represents the accessibility of demand point i to obtain medical resources. Sj is the service capacity of point j medical facilities, generally replaced by the number of beds and doctors. Sj is the service capacity; Dk is the demand for medical services, Ra represents the two-week visit rates for these three age groups, which are 22, 52.3, and 32.8, respectively, based on the 2013 National Health Service Survey report. dij is the distance or time cost between supply point j and demand point i, and f(dij) is a Gaussian distance decay function, which can be further expressed as:
Among them, d0 is the threshold of the search range. Referring to the service radius standard for primary medical facilities recommended by the World Health Organization [26], combined with the service capacity requirements of different levels of institutions in the Specifications for the Establishment of Urban Community Health Service Institutions, the d0 of community health centers was set to 1500 m, and the d0 of community health service station centers was set to 1000 m, matching the planning of a 15-min walking life circle for urban residents. The community clinic d0 is set at 500 m [27] to meet the immediate accessibility requirements for urgent medical needs. The Gaussian two-step moving search method can effectively assess the resilience of healthcare systems, as it not only incorporates the spatial matching of service capacity of medical facilities with population demand when evaluating resource accessibility, but also simulates the diminishing availability of resources with distance using a Gaussian decay function, reflecting the “transmission efficiency” emphasized by resilience. Additionally, the calculation introduces age-specific visit rates to meet the diversity of healthcare behaviors among different groups. By setting service thresholds, it can identify redundancies and coverage blind spots within the service area, providing a clear spatial basis for assessing stability and recovery.
- (2)
- Geographically weighted regression models
Geographically weighted regression (GWR) models consider non-stationary spatial relationships by modifying the coefficients of different locations [28]. Unlike global regression model estimation parameters, which are the same for the entire study area, GWR develops local models for each location separately to show different spatial associations between dependent and independent variables. GWR comes from adjacent features by “borrowing” them and weights them according to their distance from the regression features. The GWR model can be expressed as
The n represents the number of divided regions, m represents the number of independent variables, i represents the coordinates (i.e., latitude and longitude) of the regression analysis point i, βi0 is the intercept coefficient at position i, xij and βij are the j-th independent variable and its local coefficient at position i, εi is the error term, and yi is the dependent variable. Geographically weighted regression is based on the traditional least squares model, which integrates the geographic location information of the data into the parameters of the regression model and fully considers the spatial weights between adjacent data points, so as to achieve local parameter estimation [29]. In this study, the geographically weighted regression model (GWR) is used as the core method for spatial heterogeneity analysis, and its advantage over the traditional OLS model is that it can reveal the geographic nonstationarity characteristics of the transmission influencing factors through the spatial variation coefficient [30]. Referring to related research, the 500 × 500 m fishing net base map generated in ArcGIS was selected, and the construction of the variable system followed the three-dimensional theory of “spatial interaction-environmental carrier-socio-economy” [31]: the spatial interaction dimension selected “medical facility kernel density” (service accessibility) and “transportation facility POI density” (mobile support); The dimensions of the built environment include “road density” (network connectivity), “street green coverage” (environmental impedance), and “residential area ratio” (spatial bearing intensity). The socio-economic dimension includes “population density” (demand pressure) and “disposable income per capita” (ability to access resources).
2.3.2. Diversity Analysis
According to the current situation of medical resources in the main urban area of Harbin, the tertiary medical resources that need to be analyzed are determined. According to the actual situation of medical resources, a reasonable service radius. The network analysis tool [32] was used to analyze the network of medical resource points and obtain the service area. If there are multiple medical resource points, their service areas overlap and need to be mutually exclusive or combined. The analysis results are visualized to facilitate the intuitive understanding of the service scope.
2.3.3. Stability Analysis
- (1)
- Local autocorrelation analysis
LISA can be used to identify spatial units and their agglomeration with significant mismatch between supply and demand of primary healthcare facilities [33], so as to provide a basis for planning optimization. In this study, we will use Gaode Desktop Version 7.5 to conduct a local bivariate LISA analysis of primary care facility accessibility and street health service demand, and identify the spatial stability matching pattern between the supply and demand of primary care facilities.
- (2)
- Overlay analysis
The service radius is set according to the location of medical resources, and the overlapping analysis of each service level of medical resource points is carried out [34]. The analysis results in service areas, which can be mutually exclusive or combined [35]. The results of the analysis are displayed to facilitate the understanding of the scope of stable services.
2.4. Data Collection and Preprocessing
In order to show the distribution of medical facilities in relation to factors such as population density, demand for health services, and traffic and road conditions. Through the visualization in Figure 5, it is possible to intuitively identify which factors have significant correlations with each other, which provides a basis for subsequent layout optimization.
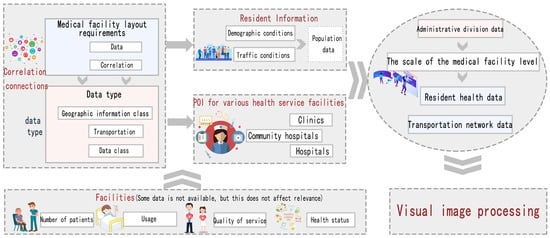
Figure 5.
Correlations between data.
The data sources used in this study are as follows: (1) after the administrative division data is cropped, the regional raster data is obtained; Process CAD road network basemaps, conduct field surveys and road spatial network simulations, and update road data. The road data restores the real three-dimensional connection network relationship of the spatial network to improve the authenticity and accuracy of the research. The building vector data and population distribution data reflect the demand for medical facilities in urban space, and objectively show the supply and demand relationship of urban space. The data of medical facilities were obtained from the AutoNavi map in June 2023, and a total of 244 health centers, 184 health service stations, and 872 clinics in the study area were obtained. The regional raster data is obtained by clipping the administrative division data, in which key facilities such as tertiary hospitals and disease control centers are dynamically updated in real time. Community health service centers/stations are updated on a monthly basis; Private clinics, pharmacies and other POIs are updated on a quarterly basis. To address the issue of delayed updates in POI data, this study maintains consistent attention on the monthly updates of community health service centers; for private clinics, pharmacies, and other POIs, it focuses on quarterly rolling updates and conducts on-site investigations to verify the data, enhancing its timeliness and completeness.
2.4.1. Road Network Data and Points of Interest
The study area encompasses an area of 589.03 square kilometers. Figure 6 employs a variety of colors, iconography, and sizes to differentiate between the various types of healthcare resources.
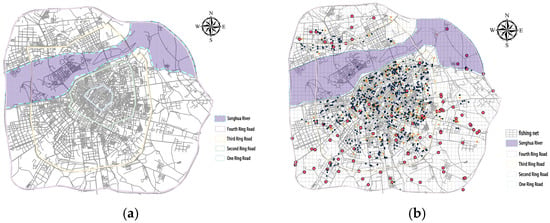
Figure 6.
(a) Database map. (b) Distribution of medical resources.
By analyzing the reasons and influencing factors behind the differences in the service capacity of medical facilities through the number of grassroots medical facilities at different levels summarized in Table 1, this article proposes measures or suggestions for improvement to optimize the allocation of medical resources.

Table 1.
Proportion of medical resources.
2.4.2. Building Contour Data and Population Data
The density of the building contour can reflect the population distribution of the area. Areas with many buildings and complex contours, higher population density, large number of residents, and more diversified medical needs, which reflect the population distribution and urban development status, are important factors to consider in the layout of medical facilities.
In the main urban area, Red lines divide the polygonal building or complex. Figure 7 clearly illustrates the spatial distribution and shape characteristics of the buildings, showing that their distribution within the region is relatively concentrated (see Figure 7).
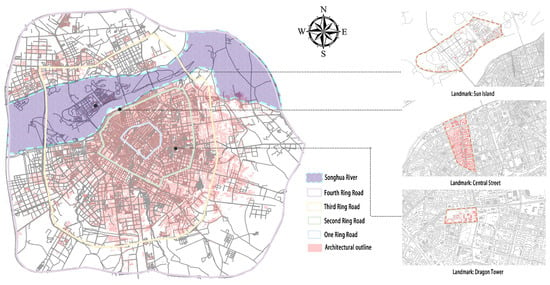
Figure 7.
Outline of the building (Note: The diagram shows the number of buildings with different numbers distributed around landmark buildings, and analyzes the distribution relationship between medical resources and buildings).
The following charts clearly illustrate the quantity of healthcare resources at different levels within the designated zones, along with the population figures. This presentation facilitates a clearer understanding of population distribution and trends (see Figure 8).

Figure 8.
(a) Medical resource (b) population analysis charts (Note: This figure compares resources and population for demand and transmission analysis).
2.4.3. Create Spatial Analysis Units
Healthcare resources were classified into health centers, community hospitals, and clinics, after which the road network data was integrated with the Point-of-Interest (POI) data for these healthcare facilities. The study area was divided into 2482 grids, each with a side length of 500 m. A mask was generated to exclude the water body of the Songhua River. Spatially connect POI data to the grid to count facilities in each grid and within it. The results revealed that among the 2482 grids, 1968 were found to be empty (see Figure 9).
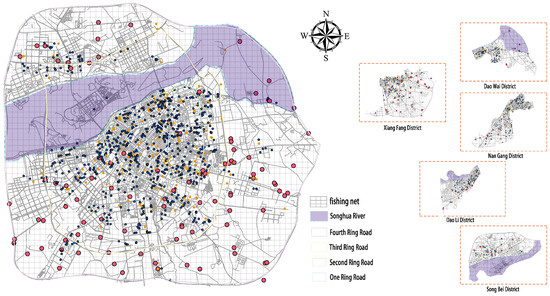
Figure 9.
Fishing net spatial analysis unit.
3. Analysis
3.1. Transmissibility Analysis
3.1.1. Gaussian Attenuation Function Analysis
Referencing relevant literature, the d0 values are set as follows: 1500 m for community health centers, 1000 m for community health service stations, and 500 m for clinics [36]. Using medical facilities as the center and d0 as the search radius, calculating the Transmission Value of Medical Facilities for Residents at the Cost of Spatial Distance [37]. The relative portability conditions among different regions in Harbin’s main urban area are presented in Table 2 (Refer to Table 2).

Table 2.
Quantitative results of accessibility by administrative region.
From Table 2, the average value and analysis of transmission in each administrative region are as follows:
- (1)
- From the analysis of the transmission values, it can be seen that the main urban area displays a distribution pattern, where, compared to Songbei District and Daowai District, the transmission is relatively high in Daoli District, Nangang District, and Xiangfang District. The road carrying capacity reflects a characteristic that gradually weakens from the center to the periphery. The ranking of accessibility is as follows: Nangang > Daoli > Xiangfang > Songbei > Daowai to the other four districts within the research scope, Songbei District has a significantly lower transmission rate.
- (2)
- In the analysis of peak regions, Nangang District shows relatively low accessibility discrepancies. This is attributed to its close proximity to the main urban area, high population density, and a dense road network that predominantly occupies the center of Harbin’s main urban area, providing Nangang District with a notable advantage in transportability. The transmission standard deviation in Daowai District is high due to its extensive unoccupied areas and low street transmission.
- (3)
- Overall, the analysis reveals significant differences in accessibility values among Daowai, Songbei, and Xiangfang Districts, resulting in varying levels of convenience for residents in accessing medical services within these three districts.
3.1.2. Geographically Weighted Regression
In this study, the influencing factors were analyzed based on the Gaussian attenuation function analysis data. In order to avoid the multiple commonalities between multiple factors and ensure the accuracy and reliability of the GWR model, this study used the OLS model to screen the influencing factors of the transmission of primary care facilities with the help of the OLS model [38], and the screening followed the following principles: first, the variance inflation factor (VIF) value was much lower than 7.5 [39]; Second, the R2 value of the adjustment coefficient of determination should be as large as possible; Third, the information criterion for the impact factor portfolio should be as small as possible [40]. Finally, the distribution of medical facilities, transportation facilities, street greening, population density, residential quarters, and road density were significantly correlated with ecological risks, and the VIF value was much lower than 7.5, and there was no multi-factor commonality, and the GWR model could be used to further analyze the spatial heterogeneity of the influencing factors [41] (Table 3).

Table 3.
Results of exploratory regression.
The larger the absolute average value of the regression coefficients of each influencing factor in the GWR model, the closer the relationship between the influencing factor and the transmissibility in the model [42]. The results of the GWR model are shown in Table 4, and the effects of medical facilities, transportation facilities, residential quarters and road density on the of the study area are positively correlated as a whole. The effects of street greening and population density on the ecological risk in the study area were negatively correlated. From the absolute mean of the regression coefficients, among the many factors affecting the transmission of medical treatment, population density plays the most significant role, followed by medical facilities and residential communities, while the impact of street greening, road density and traffic facilities on ecological risk is relatively small. It should be noted that GWR, as a local regression method, has some uncertainty in its coefficient estimates, and the model results may be affected by scale, bandwidth selection, and spatial heterogeneity. The conclusions in this regard only represent the trend characteristics of the model under the current data and parameter settings.

Table 4.
Descriptive statistics of regression coefficients for GWR models.
3.1.3. Analysis of Influencing Factors
Spatial regression analysis based on the Geographically Weighted Regression (GWR) model reveals significant spatial heterogeneity between medical accessibility and five influencing factors (distribution of medical facilities, transportation facilities, population density, road density, residential communities and street greening) within the core urban area of Harbin. Key findings include:
- (1)
- Negative Correlation Drivers: A significant negative correlation between street greening and medical service accessibility was observed in the southern part of Nangang District. This area has high green coverage but sparse medical resources. This suburb, comprising five villages, experiences limited medical mobility between areas due to spatial segmentation caused by vegetation. The concentrated population density of Songbei University Town and Central Street exemplifies the negative correlation. On-campus medical services reduce the need for off-campus care, while the high volume of transient people on Central Street leads to lower stability in seeking medical treatment.
- (2)
- Positive Correlation Drivers: Medical facilities, transportation facilities, residential communities, and road density collectively enhance medical service accessibility in the Xiangfang, Daowai, and central Nangang districts. These urban areas exhibit high facility-to-service ratios and dense public transportation networks.
3.2. Diversity Analysis
3.2.1. Analysis of the Concentration of Medical Facilities
Cold and hot spot analysis effectively identifies spatial clustering areas of medical resources, providing a clear visual representation of their distribution across different regions [43]. This analysis highlights areas with ample medical resources and those that are comparatively lacking. Investments in hot spot regions can be increased to enhance the quality and efficiency of healthcare services. In contrast, cold spot areas require greater support for healthcare resources, improved medical facilities, and service conditions to adequately meet the healthcare needs of local residents (Refer to Figure 10).
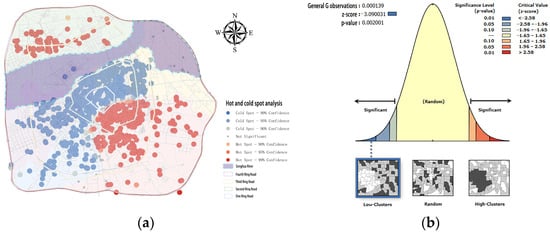
Figure 10.
(a) Analysis of the degree of concentration of medical facilities. (b) Analysis of the Concentration Index of Medical Facilities.
- (1)
- The distribution of medical resources in the main urban area of Harbin reveals a significant negative z-score of −3.090031, with a p-value of less than 0.5, indicating pronounced clustering of medical facility locations.
- (2)
- The figure demonstrates that the cold and hot spot clusters are primarily situated in Nangang District, Xiangfang District, and Songbei District. Conversely, Daoli District and Daowai District yield insignificant results. Thus, it can be concluded that the facility points in Nangang District, Xiangfang District, and Songbei District are of considerable significance. In the distribution of primary healthcare facilities, Songbei District shows a notable clustering of general hospitals, primarily due to the scarcity of grassroots medical facilities in that area, despite having a limited number of general hospitals. The majority of relatively high values are concentrated within Xiangfang District.
3.2.2. Buffer Analysis Based on Multiple Service Radii
According to the upper limit of the walkable range of the fifteen-minute living circle in the “Standards for Planning and Design of Urban Residential Areas”, 1000 m is chosen as one of the criteria for analyzing the service area under walking conditions to assess the coverage of facilities. The choice of 1500 m as the standard is based on a reasonable travel range for residents using bicycles or electric scooters, which is used to analyze the extension coverage capability of community-level services. Additionally, a comfortable distance for short motor vehicle trips (about 10–15 min of travel time) is set at 3000 m as a standard to evaluate the service range of tertiary medical services.
The maximum allowable distance for residents when seeking medical care is defined as the service radius, which establishes the service network and areas (polygons) of medical service facilities. This framework quantifies the diversity of these facilities within a spatial context [44]. When integrated with cluster points, it enables a comprehensive analysis of healthcare service distribution (see Figure 11).
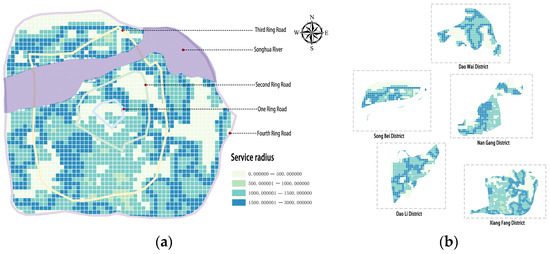
Figure 11.
(a) Analysis of urban service radius. (b) Regional service radius analysis.
- (1)
- The figure illustrates that the service radius of medical assistance facilities in Songbei District and Daowai District predominantly extends to 3000 m, offering limited diversity in healthcare options. This situation results in prohibitively high walking costs for residents seeking medical care. In contrast, Xiangfang District, Daoli District, and Nangang District feature a lower frequency of 3000-m service radii, combined with a wider variety of available options, which in turn lowers the walking costs for residents. Notably, Nangang District presents the most medical care choices and the lowest walking costs for its residents.
To enhance clarity regarding the distribution of healthcare resources across different levels, the service area ranges have been connected using a fishnet spatial layout, as illustrated in Figure 12.

Figure 12.
(a) Analysis of the radius of clinic services. (b) Community Hospital Service Radius Analysis. (c) Analysis of the service radius of the health center.
- (2)
- From the perspective of the range within which medical facilities are established, the fishnet map indicates that there are a total of 398 clinics situated within the service range accessible to residents of 0 to 1500 m. However, an additional 455 clinics are located in the blank area between 1501 and 3000 m. This data reveals that nearly half of the clinics are easily reachable for residents in their vicinity, while the remaining clinics require residents to traverse some distance within the 1501–3000 m range. The clinics occupying the blank area are primarily concentrated in the southwestern sector of Daoli District and the central zone of Songbei District, resulting in limited diversity in the routes residents can take to access clinics.
- (3)
- Within the service range of 0 to 2000 m, the fishnet map shows that 137 community hospitals are established within this accessible range, while 107 clinics are found in the blank area between 2001 and 3000 m. The data suggests that over half of the community hospitals are situated in areas that are easily accessible for nearby residents, while the others still fall within the 2001–3000 m range. It is noteworthy that the diversity of path choices for residents accessing community hospitals in Daowai District is relatively limited.
- (4)
- In the 0 to 3000 m service range, the distribution of health clinics is rather balanced, corresponding well with the reachability for residents. Within this range, residents benefit from a diverse array of pathways to access health clinics.
The quantities of clinics, community hospitals, and health clinics within their respective service areas are compiled in Table 5, allowing for a clearer perspective on the concentration of medical resources.

Table 5.
The distribution of medical resources in the service area.
3.3. Stability Analysis
3.3.1. Spatial Autocorrelation Analysis
In particular, the Moran’s I value for the global autocorrelation analysis of total depth space is 0.774045, significantly exceeding the critical threshold of 0. This indicates a strong positive correlation among spatial units. Furthermore, the global Z value amounts to 22.724167, considerably surpassing the significance level of 1.65, thereby reinforcing the significance of the observed spatial autocorrelation. Meanwhile, both the global and partial p-values are recorded at 0.0000, which is effectively indistinguishable from zero, thus confirming the statistical significance of these findings. These indicators collectively demonstrate that the spatial distribution of the road network is highly concentrated, resulting in significant spatial heterogeneity within the main urban area of Harbin. This observation reflects the convergence trend of the spatial structure and highlights distinct clustering features (see Figure 13).
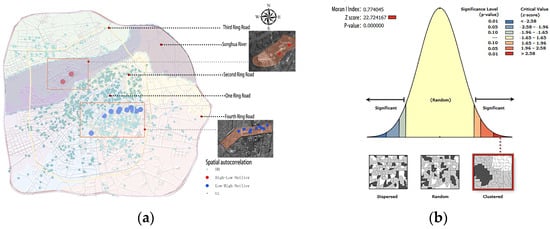
Figure 13.
(a) Spatial autocorrelation analysis. (b) Spatial autocorrelation index analysis.
(1) The spatial autocorrelation analysis reveals a total of 11 areas of high and low concentration within Xiangfang District, with the Changjiang Road Street and Heping Road Street being the most prominent. These streets are located in the heart of Harbin’s main urban area and are home to a lot of large hospitals and medical facilities. In the southern part of Songbei District, there are two identified areas of high and low concentration, primarily on the northern side of the Songhua River, where there is a higher density of higher education institutions and the resident population is relatively small. For the identified unreasonable areas, it is essential to conduct a thorough analysis of the current situation, including aspects such as population mobility and road conditions, to inform the addition of medical facilities of appropriate levels to the respective land parcels.
(2) While Songbei District broadly meets the healthcare service needs of its permanent residents, the spatial distribution of medical facilities is uneven. The stability of the medical facility network is not strongly evident, largely due to the numerous university campuses that host their own medical service facilities, resulting in a sparse and uneven distribution of medical resources catering to the permanent population.
3.3.2. Overlay Analysis
Based on the service radius of 500, 1000 and 1500 different levels of medical facilities, the service scope of the spatial layout of medical facilities in the main urban area is superimposed by superposition and reclassification analysis methods, and the results can show that the area with high coverage rate of medical facilities in this region, that is, the service area where medical facilities at all levels can provide services, that is, the stable area in the system (See Figure 14).
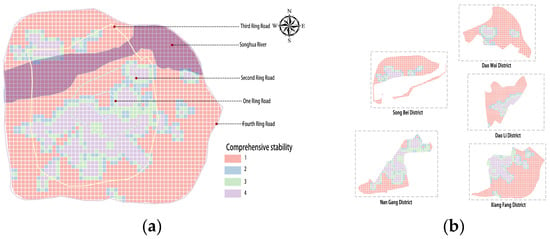
Figure 14.
(a) Stability map of urban areas. (b) Regional stability map.
3.4. Improvement Suggestions
Superimposing the quantitative results of transferability, diversity, and stability yields corresponding resilience levels. Based on these results, we perform detailed optimization:
(1) Regarding the transferability of healthcare access, to significantly improve the accessibility of community-level hospitals in urban areas, we prioritize optimizing the allocation of community-level medical resources in these two key areas: Songbei District and Daowai District. The southern part of Songbei District, where Ice and Snow World and Sun Island are located, is a relatively isolated entertainment area. The large number of universities results in a small permanent population and a large floating population. Transportation is convenient, with Metro Line 2 and readily available bus services. Combining the functional area distribution, it can be seen that, apart from commercial and entertainment areas, most are mixed-use and public office areas, and are mostly distributed along main traffic arteries. For these grids, the service capacity of tertiary medical facilities—clinics—should be increased in main traffic arteries and densely populated office areas to meet and address basic medical needs, and also to meet the medical needs of tourists.
(2) Regarding the diversity of healthcare access options, Songbei District and Daowai District exhibit limited path choices. Clinics should be added in the southwest of Daoli District and the central area of Songbei District to meet residents’ needs for primary care services; in the eastern part of Daowai District, secondary medical facilities—community hospitals—should be added. This area consists of crowded old residential areas with a large permanent population and a small floating population. It is located in Gongxingdun Subdistrict of Chengguan District and has only one tertiary clinic, but transportation is convenient. While difficult to build larger medical facilities in this area, residents have relatively easy access to tertiary medical facilities, so we recommend adding tertiary medical facilities to meet daily medical needs.
(3) From the analysis of spatial equity matching, high-demand, low-configuration (H-L) areas are mainly concentrated in the southern part of Songbei District. At the same time, the southern part of Songbei District and the eastern part of Daowai District face a shortage of facilities and require subsequent addition and upgrading of facilities. The Changjiang Road Subdistrict and Heping Road Subdistrict in Xiangfang District are large areas with high floating populations, mostly mixed-use areas integrating commercial entertainment, public offices, and residential living, and are densely populated with medical resources, located close to universities and multiple residential communities. The residential area is located around Wanda Plaza, with many catering facilities along the streets and fewer service facilities. There are large medical facilities nearby. On the other hand, the service capacity of secondary and tertiary medical facilities should also be strengthened by increasing investment in the basic construction of secondary and tertiary medical facilities, such as the number of medicines, beds, and doctor. Therefore, it is recommended to add secondary and tertiary medical facilities in this area to meet the current needs of the large floating population. (See Figure 15).
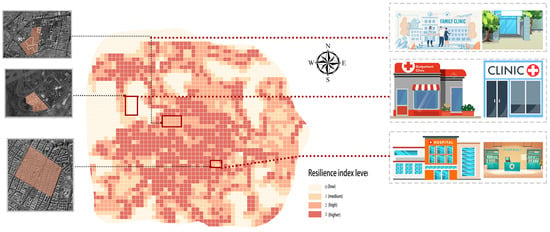
Figure 15.
Optimization diagram.
4. Discussion
This article systematically introduces the perspective of resilience into the optimization of healthcare facility layout. Resilience in the medical system mainly refers to the ability of the system to maintain key functions, quickly adapt, and recover when facing short-term shocks such as public health emergencies and natural disasters, as well as long-term pressures like changes in population structure and an increased burden of chronic diseases. Currently, the planning and construction of healthcare facilities are still largely oriented towards daily needs, lacking sufficient consideration of the capabilities of the primary healthcare network system. This results in many cities having inadequate capacity to withstand pressure and low response efficiency in the face of major crises. Previous studies have mostly focused on accessibility analysis of healthcare facilities, which provides an important foundation for planning practice. However, they often fail to view the healthcare system as an integrated resilient network and lack evaluation of the system’s interference resistance and recovery processes. Compared to similar cities in the country (such as Wuhan and Chengdu), Harbin shows insufficient adaptability and redundancy planning in its healthcare layout when facing specific challenges such as harsh climatic conditions and high-density development in old urban areas. On the other hand, some international cases of resilience-oriented healthcare planning (such as in Singapore and Copenhagen) pay more attention to graded response and community integration, emphasizing the enhancement of the system’s overall resilience through spatial strategies. This research also adopts SDNA visualization of transportation capacity on roads and a two-step decay method to calculate the transmission of regions, linking healthcare facilities with surrounding urban roads and emphasizing the need for these facilities to integrate into the urban environment, thus strengthening the connections with communities through roads. This perspective has been less explored in previous research. Therefore, incorporating resilience concepts into the spatial layout of healthcare resources not only holds theoretical innovation value but is also of significant importance for improving the sustainability and adaptability of the overall healthcare system.
The theoretical framework of this research is inspired by urban resilience theory and innovatively visualizes the concept of resilience as three core dimensions: transportability, diversity, and stability. This framework has strong systematic and universal characteristics, providing a generic analytical tool for optimizing public health resources across regions and levels. Compared to previous studies, this framework is the first to integrate the three-dimensional characteristics of resilience into the healthcare field, emphasizing the core role of infrastructure layout in responding to public health emergencies and enhancing system sustainability, thus filling a research gap in traditional planning which tends to prioritize efficiency over resilience and normalcy over emergency responses.
On an empirical level, this study takes the main urban area of Harbin as an example, analyzing spatial units through network segmentation and spatial assignment. It proposes operable and scalable optimization strategies for medical facilities by combining the convenience of residents’ daily medical treatment and emergency response needs. This achievement has significant reference value for similar cities, indicating that enhancing connectivity efficiency through transmission, promoting functional complementarity through diversity, and ensuring system reliability through stability can effectively improve the overall resilience of the medical facilities network. This research not only expands the application boundaries of urban resilience theory but also emphasizes the unique contributions of spatial planning from a public health perspective in enhancing community health resilience, optimizing resource allocation efficiency, and improving emergency management capabilities. Thus, it promotes the development of public health services towards a fairer, more efficient, and more adaptive direction in both academic and practical aspects. By optimizing the layout of grassroots medical facilities, the medical service capacity of urban residents can be effectively enhanced, improving resilience in response to residents’ medical convenience and sudden public health events, which contributes to achieving the city’s sustainable development goals and improving residents’ quality of life.
5. Conclusions, Implications and Future Works
5.1. Conclusions
Regarding the accessibility of residents’ distances to medical treatment, there are significant differences among various administrative districts. The most convenient area is Nangang District, as it is located in the main urban region, resulting in a significantly higher level of convenience compared to other areas. In contrast, both Songbei District and Daowai District are not very convenient due to the current state and functionality of the land, this causes an uneven distribution of basic healthcare resources, making medical care inconvenient for residents.
An analysis of the diversity of treatment options reveals an overall balanced pattern; however, due to the limited number of medical facilities in Songbei District and Daowai District, these areas show a trend of fewer diverse choices. In the southwestern region of Daoli District and the center of Songbei District, residents have limited diversity in their paths to clinics. Additionally, community hospitals established in Daowai District offer few diverse path choices for residents to reach them.
An analysis of the stability of the healthcare system reveals that the H-L area is primarily distributed in the southern part of Songbei District, with over ten data points indicating areas of inefficiency. Overall, these points mainly occupy two concentrated regions. The consistency of the medical facility system in the northern part of Xiangfang District, the southern part of Songbei District, and the eastern part of Daowai District is relatively poor.
5.2. Implications and Challenges
- (1)
- Implications
This study systematically applies resilience theory to optimize the layout of medical facilities, expanding the use of urban resilience theory in public health, and offering new theoretical perspectives and tools for spatial allocation of medical resources. By integrating data on resident needs, population movement, road accessibility, and service capacity, it proposes a more practical layout optimization plan and conducts an empirical study in Harbin’s main urban area, establishing an analysis framework based on resilience theory.
The innovation of this study lies in the systematic application of resilience theory to the optimization of healthcare facility layout. This paper breaks through the limitations of traditional healthcare facility planning. It not only expands the scope of urban resilience theory in the public health field but also provides new theoretical perspectives and methodological tools for research on the spatial allocation of healthcare resources, demonstrating strong academic value. Additionally, it proposes an urban planning strategy from the residents’ perspective, emphasizing the relationship between healthcare facilities and the accessibility for nearby residents, thereby promoting the layout of healthcare facilities towards a more equitable, convenient, and resilient direction. Through an empirical study of the main urban area in Harbin, this paper establishes a research framework based on resilience theory. The results help researchers make scientific decisions regarding resource allocation and facility layout. Furthermore, the findings assist governments and planners in making more scientific and long-term decisions about the distribution of healthcare resources and facility configuration. This study aims to enhance the healthcare system’s ability to respond to public health emergencies by optimizing the spatial distribution of medical services, while also fundamentally improving residents’ healthcare experience and raising public health standards and life satisfaction.
- (2)
- Challenges
Amid rapid urbanization and frequent public health events, Harbin’s main urban area is struggling with unevenly distributed basic medical facilities, outdated infrastructure, and inadequate service response, which seriously affect healthcare quality and public safety. Optimizing the layout of existing facilities to boost their resilience and adaptability has become a pressing issue. This study faces several challenges: how to systematically integrate diverse data to accurately assess current facilities and service capacity, how to plan healthcare facilities at different levels in a city marked by significant population movement and spatial function differences, and how to implement effective facility upgrades in space-limited areas like aging neighborhoods without duplicating resources or leaving service gaps.
5.3. Future Works
It should be noted that there are certain limitations to this study. It concentrates on Harbin’s primary urban area, providing robust empirical analysis; however, the results may not be entirely applicable to other cities or regions. Future research could involve comparing various urban contexts. In terms of research data, the analysis of medical facility layout in this paper heavily relies on the POI (Point of Interest) data provided by Gaode Map. Although this type of data is widely covered and easy to obtain, it still has potential issues, such as delayed updates, mismatches between the classification system and research objectives, and inconsistent location accuracy, which may introduce biases in the calculations of service range and accessibility of facilities. In the future, it is necessary to integrate multi-source data (such as remote sensing) to improve the accuracy and spatiotemporal consistency of the data. Additionally, this study is mainly based on cross-sectional data analysis and lacks longitudinal tracking and dynamic evaluation of the changes in medical facility layout over time. Therefore, it cannot reflect the long-term evolution and the sustained effects of policy interventions due to urban development. Future research could introduce time-series data, combined with case tracking, to evaluate the effectiveness and adaptability of resilience strategies over a longer period, thus promoting the continuous improvement of the resilience of urban healthcare systems.
Author Contributions
B.W. and M.S. contributed to the conception and design of the study; B.W. organized the database; M.S. performed the statistical analysis; B.W. wrote the first draft of the manuscript; M.S. wrote sections of the manuscript. All authors have read and agreed to the published version of the manuscript.
Funding
This work was supported by China Association of Higher Education “2023 Annual Higher Education Scientific Research Planning Project”, grant number 23DF0405, Heilongjiang Provincial Association of Higher Education 2023 Higher Education Research Project, grant number 23GYBJ006, and the Fundamental Research Funds for the Central Universities, grant number 2572024DZ31.
Institutional Review Board Statement
Not applicable.
Informed Consent Statement
Not applicable.
Data Availability Statement
The original contributions presented in this study are included in the article. Further inquiries can be directed to the corresponding author.
Conflicts of Interest
The authors declare no conflict of interest.
References
- Barcellos-Paula, L.; Castro-Rezende, A.; Gil-Lafuente, A.M. Understanding Urban Resilience and SDGs: A New Approach in Decision-Making for Sustainable Cities. J. Public Aff. 2025, 25, e70007. [Google Scholar] [CrossRef]
- He, W.; Guo, X.; Zhang, C. Assessing the Impact of Climate-Resilient City Development on Urban Sustainability: Evidence from China. Sustainability 2025, 17, 4381. [Google Scholar] [CrossRef]
- Moglia, M.; Wise, R.M.; Meharg, S. A New Paradigm for Resilient Urban Infrastructure Planning: Game-Changing Interventions, Tipping Points, and Capacities; Springer: Singapore, 2025. [Google Scholar] [CrossRef]
- Cuce, P.M.; Cuce, E.; Santamouris, M. Towards Sustainable and Climate-Resilient Cities: Mitigating Urban Heat Islands Through Green Infrastructure. Sustainability 2025, 17, 1303. [Google Scholar] [CrossRef]
- Dong, C.; Zhai, S.; Kong, Y.; Feng, Y.; Han, J.; Zhang, G.; Jayathilaka, H.B.T.P. Improving Spatial Equality in Primary Healthcare Facilities Through a Minimum Distance and Spatial Envy Location Model: A Case Study in Changyuan, China. Trans. GIS 2025, 29, e70031. [Google Scholar] [CrossRef]
- Kanbara, S. Multicultural Nursing Approach on Primary Health Care to Enhancing Globalized Community Resilience in Japan; Springer: Singapore, 2025. [Google Scholar] [CrossRef]
- Liu, D.; Wang, H.; Zhang, W.; Chen, P.; Lin, Y.; Xie, Y.; Zou, M.; Li, D.; Fang, M.; Hu, B.; et al. Sociodemographic characteristics, occupational characteristics, motivational factors, and job satisfaction among primary health service practitioners. BMC Prim. Care 2025, 26, 24. [Google Scholar] [CrossRef] [PubMed]
- Wong, F.K.Y.; Wang, S.L.; Ng, S.S.M.; Lee, P.H.; Wong, A.K.C.; Li, H.; Wang, W.; Wu, L.; Zhang, Y.; Shi, Y. Effects of a transitional home-based care program for stroke survivors in Harbin, China: A randomized controlled trial. Age Ageing 2022, 51, afac027. [Google Scholar] [CrossRef]
- Ghodsi, V.B.; Terzi, F. Measuring the Accessibility and Capacity Sufficiency of Private and Public Health Centers in the Istanbul Metropolitan Area. Appl. Spat. Anal. Policy 2024, 17, 729–752. [Google Scholar] [CrossRef]
- Hayvon, J.C. Health equity via inclusive communications: Self-censorship of marginalized health needs in qualitative research. Educ. Gerontol. 2025, 51, 9–22. [Google Scholar] [CrossRef]
- Ben Amara, D.; Zhu, Q.; Qiao, J.; Safro, I.; Regmi, K. China’s transition to a low-carbon economy and climate resilience: The impact of sustainable modernization indicators. J. Geogr. Sci. 2024, 34, 2145–2165. [Google Scholar] [CrossRef]
- Baskoro, W.; Amin, C.; Taryono, T. The Influence of Socio-Economic Facilities and Population Density on Landuse Changes in Gunungpati District, Semarang City. In IOP Conference Series: Earth and Environmental Science; IOP Publishing: Bristol, UK, 2024. [Google Scholar]
- Guo, S.; Diao, Y. Spatio-temporal coordinated development pattern evolution and driving factors of regional population and green economy: Evidence from Shandong Province in China. PLoS ONE 2024, 19, e0304562. [Google Scholar] [CrossRef]
- Hertig, E.; Hunger, I.; Kaspar-Ott, I.; Matzarakis, A.; Niemann, H.; Schulte-Droesch, L.; Voss, M. Climate change and public health in Germany An introduction to the German status report on climate change and health 2023. J. Health Monit. 2023, 8 (Suppl. S3), 27. [Google Scholar] [CrossRef]
- Rachana, P.; Laishram, L.; Vikrant, S. Do Physical Proximity and Availability of Adequate Infrastructure at Public Health Facility Increase Institutional Delivery? A Three Level Hierarchical Model Approach. PLoS ONE 2015, 10, e0144352. [Google Scholar]
- Garg, S.; Basu, S.; Rustagi, R.; Borle, A. Primary Health Care Facility Preparedness for Outpatient Service Provision During the COVID-19 Pandemic in India: Cross-Sectional Study. JMIR Public Health Surveill. 2020, 6, e19927. [Google Scholar] [CrossRef]
- Yang, X.; Luo, L.; Liu, J.; Chen, H.; Li, J. Evaluating the Improvement of Healthcare Accessibility for Urban Residents via the Construction of New Hospitals: A Case Study of Xi’an, China. Appl. Spat. Anal. Policy 2025, 18, 5. [Google Scholar] [CrossRef]
- Nunes, A.R.; Dale, J. Global trends in sustainable healthcare research: A bibliometric analysis. Future Healthc. J. 2025, 12, 100251. [Google Scholar] [CrossRef] [PubMed]
- Sankovi, M. Healthy Urban Planning for a Better Future for Healthy Ageing–Healthy Urban Planning, the Croatian Healthy Cities Network, and the City of Vinkovci (Croatia). Lijec. Vjesn. 2020, 142, 77. [Google Scholar]
- Wu, K.; Zhang, J.; Li, D. Comprehensive evaluation and influencing factors of healthy cities in China’s urban agglomerations. J. Geogr. Sci. 2025, 35, 821–845. [Google Scholar] [CrossRef]
- Manley, J. Organisations and Citizens Building Back Better? Climate Resilience, Social Justice & COVID-19 Recovery in Preston, UK. Sustainability 2024, 16, 3003. [Google Scholar] [CrossRef]
- Pelling, M.; Comelli, T.; Cordova, M.; Kalaycioğlu, S.; Menoscal, J.; Upadhyaya, R.; Garschagen, M. Normative future visioning for city resilience and development. Clim. Dev. 2024, 16, 335–348. [Google Scholar] [CrossRef]
- Kaveh, F.; Karbasian, M.; Boyer, O.S.H. A strategic and operational framework for pre-disaster management considering sustainability, resilience, and smart city using multi-criteria decision-making and mathematical optimization. J. Optim. Ind. Eng. 2024, 17, 63–85. [Google Scholar]
- Oppi, C.; Cattaneo, C.; Galizzi, G. Network effectiveness in healthcare and the impact of the COVID-19 pandemic: Connecting the dots. J. Public Budg. Account. Financ. Manag. 2024, 36, 597–616. [Google Scholar] [CrossRef]
- Liu, Z.; Li, S.; Cheng, L.; Shen, Z.; Witlox, F. Exploring accessibility to medical facilities for older adults: Potential vs. Revealed accessibility. J. Transp. Health 2025, 40, 101952. [Google Scholar] [CrossRef]
- Wang, B. Evaluating Human Needs: A Study on the Spatial Justice of Medical Facility Services in Social Housing Communities in Guangzhou. Land 2024, 13, 1109. [Google Scholar] [CrossRef]
- Liang, Y.; Xie, Z.; Chen, S.; Xu, Y.; Xin, Z.; Yang, S.; Jian, H.; Wang, Q. Spatial Accessibility of Urban Emergency Shelters Based on Ga2SFCA and Its Improved Method: A Case Study of Kunming, China. J. Urban Plan. Dev. 2023, 149, 05023013. [Google Scholar] [CrossRef]
- Li, S.; Ma, L.; Huang, Q.; Cui, X.; Zhu, Z.; Zong, Y. Accessibility and Optimization of Rural Healthcare Facilities From the Perspective of the Rural Living Circle. Appl. Spat. Anal. Policy 2025, 18, 2. [Google Scholar] [CrossRef]
- Aleksieiev, O.H.; Taranov, V.; Petrykhin, V.P. The experience, results, and possible perspectives of organizing the optimally accessible primary medical care for the rural population of Zaporizhzhia region. Curr. Issues Pharm. Med. Sci. Pract. 2021, 14, 369–373. [Google Scholar] [CrossRef]
- Tiwari, V.; Kumar, A.; Mukherjee, M. GIS and AHP-based groundwater recharge potential zones in urban region: A study of Ajmer City, Rajasthan, India. Urban Clim. 2024, 54, 101840. [Google Scholar] [CrossRef]
- Chen, F.; Leung, Y.; Wang, Q.; Zhou, Y. Spatial non-stationarity test of regression relationships in the multiscale geographically weighted regression model. Spat. Stat. 2024, 62, 100846. [Google Scholar] [CrossRef]
- Musella, G.; Castellano, R.; Bruno, E. Evaluating the spatial heterogeneity of innovation drivers: A comparison between GWR and GWPR. METRON 2023, 81, 343–365. [Google Scholar] [CrossRef]
- Cao, X.Y.; Xu, J.G.; Feng, D.C. Infrastructure Safety from the Perspective of Resilience Theory. Energies 2022, 15, 5778. [Google Scholar] [CrossRef]
- Han, Q.; Yang, K. Spatial Distribution Characteristics and Coverage Rate of Commercial Facilities in 15-minute Radius Livelihood Service Circles of Chunshu Street. J. Landsc. Res. 2024, 16, 17–21. [Google Scholar] [CrossRef]
- Hutabarat, A.N.; Puspitasari, N. Spatial autocorrelation analysis on coronavirus transmission and population density in East Java Province 2020. J. Biom. Dan Kependud. 2023, 12, 230–238. [Google Scholar] [CrossRef]
- He, J.; Zhang, X.-S. Spatial Autocorrelation Analysis of Arable Land Quality at County and Township Scale—A Case Study of Guangshui City, Hubei Province. J. Anhui Agric. Ences 2018, 14, 7–11. [Google Scholar]
- Yan, X.; Wang, B.; He, X. Spatial Autocorrelation Analysis of Town Population of Kunming and Its Temporal and Spatial Change from 2000 to 2010. Geomat. Spat. Inf. Technol. 2018, 3, 16–19. [Google Scholar]
- Babandi, Z.S.; Usman, S.; Abubakar, B.G.; Umar, A.A.; Suleiman, A.G.; Aliyu, A.T.; Isa, M.F.; Dahiru, T. Geospatial Distribution, Accessibility and Utilization of Basic Emergency Obstetric and New-born Care in Jigawa State, Northwest Nigeria. Niger. Med. J. 2024, 65, 865–884. [Google Scholar] [CrossRef] [PubMed]
- Vodyan, M.E.; Panin, A.A.; Plyasunov, A.V. A Study of the Threshold Stability of the Bilevel Problem of Facility Location and Discriminatory Pricing. J. Appl. Ind. Math. 2024, 18, 558–574. [Google Scholar] [CrossRef]
- Liu, S.; Wu, L.; Zhen, S.; Lin, Q.; Hu, X.; Li, J. Terrain or climate factor dominates vegetation resilience? Evidence from three national parks across different climatic zones in China. Microelectron. J. 2024, 11, 100212. [Google Scholar] [CrossRef]
- Yuan, X.; Li, Y.; Song, Y.; Lu, H.; Wang, Y.; Ge, B.; Wang, J. Spatial Distribution Characteristics and Driving Factors of 777 Traditional Villages in Yunnan Province: A Study Based on GWR Model and Geodetector. Land 2024, 13, 2004. [Google Scholar] [CrossRef]
- Li, M.; Wang, J. The productivity effects of two-way FDI in China’s logistics industry based on system GMM and GWR model. J. Ambient. Intell. Humaniz. Comput. 2023, 14, 581–595. [Google Scholar] [CrossRef]
- Zhao, W.; Zhong, J.; Lv, J. Influencing factors and spatial differentiation of rental housing in a smart city: A GWR model analysis. Meas. Sens. 2024, 33, 101126. [Google Scholar] [CrossRef]
- Liu, X. Spatiotemporal Heterogeneity Analysis of Provincial Road Traffic Accidents and Its Influencing Factors in China. Sustainability 2024, 16, 7348. [Google Scholar] [CrossRef]
Disclaimer/Publisher’s Note: The statements, opinions and data contained in all publications are solely those of the individual author(s) and contributor(s) and not of MDPI and/or the editor(s). MDPI and/or the editor(s) disclaim responsibility for any injury to people or property resulting from any ideas, methods, instructions or products referred to in the content. |
© 2025 by the authors. Licensee MDPI, Basel, Switzerland. This article is an open access article distributed under the terms and conditions of the Creative Commons Attribution (CC BY) license (https://creativecommons.org/licenses/by/4.0/).