Abstract
In the pursuit of sustainable development, optimizing water resources management while maintaining ecological balance is crucial. This study introduces a Chaos-enhanced Harris Hawks Optimizer (CEHHO) aimed at optimizing natural flow patterns in cascade reservoirs. First, an ecological scheduling model considering ensuring guaranteed output is established based on the similarity of ecological flows. Subsequently, the CEHHO algorithm is proposed, which uses tilted skew chaos mapping for population initialization, improving the quality of the initial population. In the exploration phase, an adaptive strategy enhances the efficiency of group search algorithms, enabling effective navigation of the complex solution space. A random difference mutation strategy, combined with the Q-learning algorithm, mitigates premature convergence and maintains algorithmic diversity. Comparative analysis with the existing technology under different typical hydrological frequency shows that the search accuracy and convergence efficiency of the proposed method are significantly improved. Under the guaranteed output limit of 1000 MW, the proposed method enhances the optimal, median, mean, and worst values by 293.92, 493.23, 422.14, and 381.15, respectively, compared to the HHO. Furthermore, the results of the multi-purpose guaranteed output scenario highlight the superior detection and exploitation capabilities of this algorithm. These findings highlight the great potential of the proposed method for practical engineering applications, providing a reliable tool for optimizing water resources management while maintaining ecological balance.
1. Introduction
Reservoirs enhance the efficiency of water resource utilization by capturing and storing water through the construction of dams on rivers or other water bodies [1]. During reservoir operation, river hydrology is influenced by changes in outflow magnitude, frequency, and duration [2,3]. Existing reservoir dispatching and operation methods primarily aim to maximize power generation benefits by optimizing water level management [4,5]. Often, discharge flow is adjusted to control turbine operation, leading to substantial changes in downstream river flow compared to pre-reservoir conditions, thereby impacting the river ecosystem and causing serious negative effects on the ecological environment. For instance, reducing discharge flow during the impoundment period can lead to downstream river desiccation, disrupting continuity and ecological integrity [6]. Discharging low-temperature water may delay fish spawning times and reduce spawning success, while releasing high-temperature water can degrade fish habitats and increase mortality rates [7]. Additionally, improper reservoir operation can result in eutrophication in slow-flow areas or tributary backwaters within the reservoir [8]. In recent years, growing environmental awareness has spurred global attention and research aimed at mitigating or eliminating the adverse effects of reservoirs on river health, which is of significant importance to the concept of sustainable development [9,10,11]. Li et al. [12] proposed the Dam Ecological Effect Index (DEEI) to quickly identify the ecological and environmental changes in dams over the past 36 years. Yan et al. [13] defined two ecological objectives, water quantity level (WQL) and hydrological alteration (HA), and developed an optimal operational strategy that balances economic and ecological benefits for hydropower stations in a certain river basin in China. Wang et al. [14] proposed a new ecological indicator, the reservoir outflow variations across different time scales (OVDTS), which helps to protect the ecological benefits of the downstream river basin. In addition, unreasonable water resource management measures also lead to insufficient guaranteed output of reservoirs, affecting the stable operation of reservoirs [15]. Therefore, the reservoir operation mode considering the natural river flow situation has become a prominent topic of current research.
Existing reservoir management typically involves the joint operation and cooperation of cascade reservoirs, presenting a complex multi-stage decision-making problem characterized by multiple constraints and spatiotemporal coupling [16]. The main solution methods can be summarized into two categories [17]. The first category involves traditional mathematical programming methods, including nonlinear programming [18], linear programming [19], and dynamic programming [20]. These methods typically require the optimization problem to have clear mathematical expressions and constraints, which often need to meet certain requirements such as concavity and continuity. However, many constraints in cascade operation and scheduling problems are challenging to describe with precise mathematical models, complicating the solution process. The second category encompasses heuristic optimization methods that have gained popularity in recent years [21,22,23]. These methods do not depend on the specific form of the problem but handle various types of optimization problems by simulating natural processes or human intelligent behavior [24]. However, heuristic algorithms can easily fall into local optima during the search process and struggle to balance exploration and exploitation effectively, posing challenges for practical applications. Thus, developing an algorithm with robust search capabilities and high convergence accuracy is crucial for identifying sustainable scheduling schemes for cascade reservoirs.
In recent years, due to the high efficiency and ease of implementation of heuristic algorithms, they have been designed and employed as powerful solvers for many reservoir operation problems. These methods mainly include the Whale Optimization Algorithm (WOA) [25], which is based on whale behavior; the Marine Predators Algorithm (MPA) [26], which simulates the behavior of predators in marine ecosystems; and the Harris Hawks Optimizer (HHO) [27], inspired by the hunting behavior of eagle groups. The HHO algorithm has garnered widespread attention from researchers across various fields and has been successfully applied to tasks such as feature selection [28], image segmentation [29], vehicle routing [30] and so on. Despite its excellent search performance, the HHO algorithm has certain limitations. For instance, the random generation of the initial population is influenced by hardware conditions, making it difficult to ensure population diversity. Additionally, there is an imbalance between exploration and exploitation in multiple local optimum optimization problems, which can impede accurately locating the global optimum or lead to search stagnation. Therefore, it is both important and meaningful to study and develop an improved version of the HHO algorithm to enhance reservoir operation optimization.
To address the shortcomings identified in the preceding analysis and research, this paper first develops an ecological scheduling model that accounts for the natural flow regime. Subsequently, a chaos-enhanced Harris Hawks Optimizer (CEHHO) is introduced to derive the optimal scheduling solution. The CEHHO incorporates a chaotic population initialization strategy, an exploration phase adaptive strategy, and a random difference mutation strategy. These enhancements improve population diversity and balance the exploration and exploitation capabilities of the algorithm. To verify the effectiveness of the proposed method, four cascade reservoirs in the Jinsha River Basin are used as research targets for practical exploration.
The main contributions of this paper are as follows:
- A new ecological scheduling model is proposed, which incorporates the natural flow regime to more accurately represent hydrological conditions under ecological demand.
- Utilizing the skew tent chaotic map for population initialization significantly improves both the quality and diversity of initial solutions.
- Introducing a random mutation strategy with Q-learning, along with incorporating an adaptive exploration strategy, enhances the ability of algorithm to navigate complex solution spaces, improve exploration efficiency, and avoid premature convergence.
- The method demonstrates superior search accuracy and convergence efficiency in optimizing four cascade reservoirs in the Jinsha River Basin, highlighting its strong potential for practical engineering applications.
2. Problem Formulation
Reservoir construction often disrupts the integrity and functioning of basin ecosystems. The natural flow regime is considered the optimal state of the ecosystem for reservoir operation. To more accurately assess hydrological changes, the dynamic time warping (DTW) method is employed to measure the discrepancies between the current reservoir operations and the natural flow system. The following section provides a detailed explanation of how the DTW algorithm is applied to address this issue.
2.1. Dynamic Time Warping (DTW) Based on Sakoe-Chiba Band
Dynamic Time Warping (DTW) [31], as shown in Figure 1a, is an algorithm based on dynamic programming (DP) to measure the similarity between two time series. DTW has been widely used in various fields such as speech recognition [32], gesture recognition [33], and data mining [34]. The Sakoe-Chiba band constraint, as shown in Figure 1b, is a method to limit the degree of time warping in the DTW algorithm, which defines a band-shaped area on the distance matrix and only allows points within the area to be matched, thereby limiting the degree of time warping to improve the efficiency and accuracy of the algorithm [35]. The process of the DTW method based on the Sakoe-Chiba band constraint is as follows:
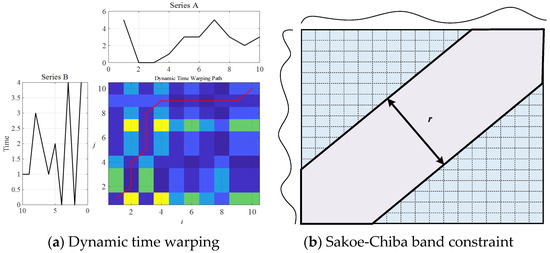
Figure 1.
Dynamic time warping and Sakoe-Chiba band constraint.
(1) Set the band width r of the Sakoe-Chiba band and assume two time series A = [a1, a2,…, al1] and B = [b1, b2,…, bl2], l1 and l2 represent the length of time series A and B, separately.
(2) Construct an n × m distance matrix Dn×m and initialize it:
where Di,j represents the distance between the i-th element of series A and the j-th element of series B.
(3) Create a cumulative distance matrix Cn×m of the same size as the distance matrix Dn×m and initialize all elements to infinity except C0,0 = 0.
(4) Then set the initial condition: C1,1 = D1,1, which indicates the cumulative distance from the starting point; For other elements in the first column, if |i − 1| < r, then let Ci,1 = Di,1 + Ci−1,1; For other elements in the first column, if |j − 1| ≤ r, then let C1,j = D1,j + C1,j−1.
(5) For the other elements in C in the cumulative matrix, the formula considering the Sakoe-Chiba band is used as follows:
(6) The dynamic programming algorithm is used to trace back the path and obtain the minimum cumulative distance as the difference value of the two series.
2.2. Objective Function
The objective function aims to minimize the variation in flow at the reservoir control section, particularly the difference between the natural flow and the regulated flow. Its primary function is to serve as a quantitative indicator to guide the optimization process. By minimizing the DTW distance between the natural flow sequence and the regulated flow sequence, this function ensures that the regulation strategy maintains flow conditions as close as possible to the natural state throughout the entire scheduling period, which is expressed as follows:
where Obj represents the difference between the natural flow regime of the controlled section and the reservoir-controlled flow regime; Fni and Foi represent the flow series of the natural flow state of the river in the i-th control section and the flow series after the reservoir is built, respectively. dist[·] denotes the DTW distance between sequences Fni and Foi, T represents the number of time periods in the scheduling cycle.
2.3. Operation Constraints
The following are the physical constraints that must be observed when operating a cascade reservoir system [16]:
(1) Reservoir water balance constraint:
where Vi,t+1 denotes the water level of the i-th reservoir at time period t + 1; Ii,t, Oi,t and qi,t symbolize the inflow, outflow and local flow of the i-th reservoir at time period t, respectively; Ui denotes the number of upstream reservoirs that are directly hydraulically connected to reservoir i.
(2) water level constraint:
where and symbolize the minimal and maximal operating boundaries of the water level of the i-th reservoir at time period t, respectively.
(3) Reservoir discharge constraint:
where and symbolize the minimal and maximal operating boundaries of the outflow of the i-th reservoir at time period t, respectively.
(4) Outflow balance constraint
where si,t and symbolize the spillage flow and turbine flow of the i-th reservoir at time period t.
(5) Power output constraint:
where and symbolize the minimal and maximal boundaries of the output of the i-th reservoir at time period t, respectively.
(6) Output guarantee constraint:
where denotes guaranteed output operation limit of the i-th power station.
(7) Initial and terminal level constraint:
where and symbolize the initial and terminal water level of reservoir i during the entire scheduling period, respectively.
3. Proposed Chaotic-Enhanced Harris Hawks Optimizer (CEHHO)
3.1. Harris Hawks Optimizer (HHO)
The Harris Hawks Optimizer (HHO) is a population-based, gradient-free optimization technique inspired by the heuristic cooperative predation behavior observed in Harris hawks groups, as shown in Figure 2, which includes prey exploration, surprise attacks, and various attack strategies [35,36,37]. In the HHO, the positions of different Harris hawks within the population are abstracted as potential candidate solutions to the optimization problem, with the optimal solution corresponding to potential location of the target. The operational mechanism of the HHO primarily encompasses three phases: exploration, transition, and exploitation. These phases are succinctly described below.
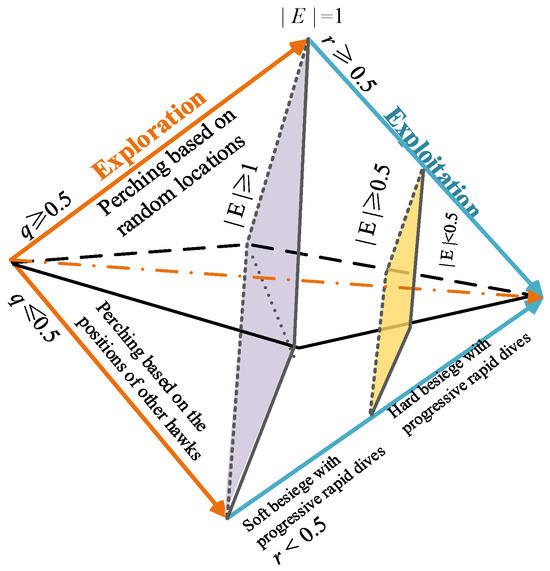
Figure 2.
Schematic diagram of the search principle of the HHO.
3.1.1. Exploration Phase
In the Harris Hawks Optimizer (HHO), Harris hawks employ two equal-opportunity strategies to wait, observe, monitor, and capture prey at relatively random locations. Simultaneously, Harris hawks can obtain possible prey location information based on the roosting positions of other group members. The mathematical expression is as follows:
where X(k + 1) represents the position vector of the hawk during the (k + 1)-th iteration; Xrand(k) represents the position vector of the hawk randomly selected from the k-th iteration; r1, r2, r3, r4 and q represent different random numbers uniformly distributed in the interval [0, 1], respectively; Xprey(k) represents the position vector of the tracked prey during the (k + 1)-th iteration; Xm(k) represents the average position vector of the population at the k-th iteration, and its mathematical expression is as follows:
where N represents the number of hawks in the population.
3.1.2. Transition from Exploration to Exploitation
To facilitate the transition from exploration to exploitation, the HHO proposes a prey escape energy function model, E. Initially, a starting energy value is given. As the number of iterations increases, the escape energy of prey gradually decreases. When the escape energy |E| ≥ 1, the algorithm executes the exploration phase; otherwise, it executes the exploitation phase, the mathematical expression is as follows:
where E0 represents the initial escape energy; K represents the maximum number of iterations for the population.
3.1.3. Exploitation Phase
- (a). Soft besiege
When r ≥ 0.5 and |E| ≥ 0.5, the hawk population performs a soft besiege on the prey. At this point, the prey has enough energy and attempts to escape by making random misleading jumps. During these attempts, Harris hawks gradually surround the prey to exhaust it before pouncing. The mathematical expression is as follows:
where ∆X(k) is the position vector difference between the prey and the current hawk group in the k-th iteration. r5 is a random number in [0, 1], and J represents the jumping intensity of the prey in the random escape process in each iteration.
- (b). Hard besiege
When r ≥ 0.5 and |E| < 0.5, the hawk population performs a hard besiege on the prey, as shown in Figure 3. Because the prey has been escaping for a long time, the escape energy is very low. At this time, the Harris Hawk pounces on the prey and updates its position with the formula:
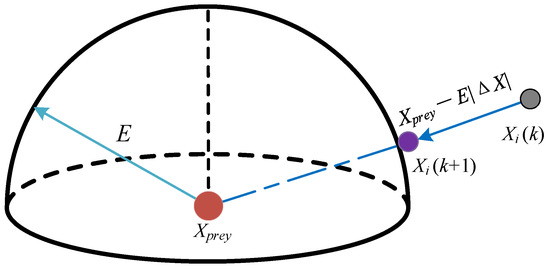
Figure 3.
The example of hawk population in the stage of hard besiege.
- (c). Soft besiege with progressive rapid dives
When r < 0.5 and |E| ≥ 0.5, the HHO algorithm assumes that when hawks compete for prey, they can gradually select the best dive path to chase the fleeing prey. During the hunting and escaping phase, Levy Flight (Lf) is adopted to simulate the deceptive actions of the prey and the diverse dive patterns of the hawks. The mathematical representation of this phase is expressed as follows:
At the same time, when the prey performs more deceptive movements, the hawks may also perform irregular and rapid dives directly when approaching the prey. As shown in Figure 4, the rules can be expressed as follows:
where D represents the dimension of the problem to be calculated; S is a randomly generated position vector of size 1 × D; Lf represents the Levy flight function, which is expressed as follows:
where u and v are random values obtained randomly in [0, 1]; β is a constant, which is taken as 1.5 in this paper.
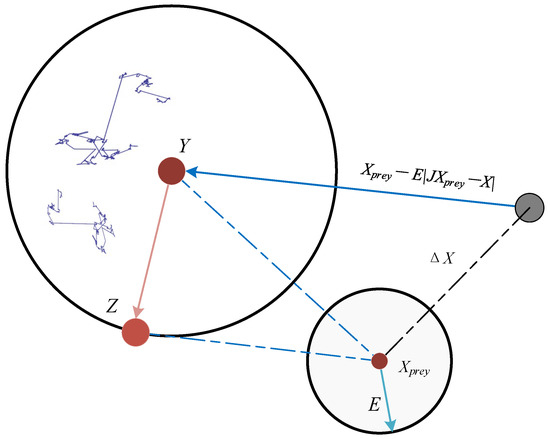
Figure 4.
The example of hawk population in soft besiege with progressive rapid dives.
Therefore, the mathematical representation of the final position of the hawks update during the soft siege phase is as follows:
where F(·) denotes the fitness function.
- (d). Hard besiege with progressive rapid dives
When r < 0.5 and |E| < 0.5, the prey has no energy to escape, and the hawks try to shorten the average distance between themselves and the escaping prey. The mathematical expression for the hard siege state is as follows:
where Y and Z are the position vectors obtained by searching using the mathematical forms in Equation (21), as follows:
where denotes the average position vector of the population during the kth iteration.
3.2. Chaotic Population Initialization Strategy
Numerous studies have shown that population initialization is critical to algorithm performance [38,39,40]. The standard Harris Hawks Optimizer (HHO) relies on traditional random initialization to generate the initial population. This often leads to uneven population distribution, slow early convergence, and entrapment in local optima. In contrast, chaotic systems, being pseudo-random and ergodic, allow individuals generated through chaotic mapping to cover the search space more uniformly. The resulting enhanced population diversity improves search capabilities and helps avoid premature convergence to local optima.
The skew tent chaotic map (STCM) [41], as shown in Figure 5, is used in this study to improve the performance of the initial population. The skew tent chaotic map is a nonlinear, piecewise-defined function widely used in chaos theory and related applications. It is a variant of the standard tent map, designed to generate chaotic sequences with specific properties, thereby ensuring the diversity of the initial population. The STCM is defined as follows:
where χj and φ represent the random number uniformly distributed in the interval [0, 1]; Lb and Ub represent the upper and lower bounds of the problem that can be searched by individuals in the hawk group, respectively. Xi represents the position vector of i-th hawk in the population.
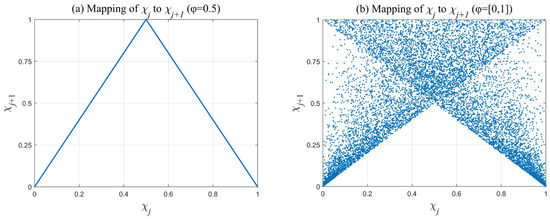
Figure 5.
The mapping relationship between χj and χj+1.
3.3. Exploration Phase Adaptive Strategy
In the exploration phase of the standard HHO, the hawk group employs two strategies to search for possible prey locations, with an equal probability of executing each strategy. However, this equal probability method does not consider the impact of individual performance, which significantly limits the population’s exploration efficiency. Particularly in the q < 0.5 stage, simply considering the intermediate position between the prey and the hawk group, and using the upper limit of the problem space to determine the next stage position of the population, makes it likely that the algorithm cannot guarantee convergence in the later search process. To address this flaw, this study reconstructs the exploration phase by adjusting the strategy for the q < 0.5 stage to account for the average performance of the current hawk’s position and its historical optimal position. Furthermore, it proposes that the hawk balance factor η determines the strategy for individual search, with its magnitude based on the performance of the current hawk within the population. The mathematical expression is as follows:
where A1(k) represents position obtained by the i-th hawk through random perching at k-th iteration; Xhis(k) represents historical best position at k-th iteration; A2(k) represents the position obtained by the i-th hawk through a comprehensive consideration of the current position and historical best position at k-th iteration; max[F(X(k))] represents the maximum fitness within the hawk group during the k-th iteration. η represents the balance factor of the i-th hawk.
3.4. Random Difference Mutation Strategy with Q-Learning
Mutation and crossover are key components in evolutionary algorithms such as differential evolution [42]. Mutation introduces random perturbations into a single solution, promoting exploration and preventing premature convergence by diversifying the population. Crossover, on the other hand, combines features of parent solutions to produce potentially superior offspring, leveraging the best features of each parent solution to improve the overall solution quality. Together, these operators balance exploration and exploitation, enhancing the ability of the algorithm to efficiently search complex solution spaces and find optimal solutions.
The mutation factor is particularly critical in population evolution, as it significantly influences its performance. Q-learning, shown in Figure 6, is a popular reinforcement learning method that mimics human behavior to establish dynamic interactions between the environment and actions, facilitating repeated learning through reward patterns. Since its inception, Q-learning has found extensive applications in various fields, including autonomous driving, gaming, and robotics. In the Q-learning algorithm, the agent learns by interacting with the environment and then selects actions from the Q-table to receive corresponding rewards. The detail process is given in Algorithm 1, and the formula for updating the Q-table values is as follows:
where Qt+1(s, a) represents the updated value of the action-value function for the state s and action a at the time step (t + 1); α and γ represent the learning rate and discount factor between [0, 1], respectively; Ra(s, a) represents the reward value for the state s and action a; represents the maximum Q-value for all actions in the new state .
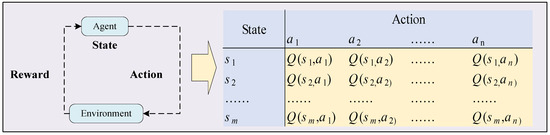
Figure 6.
The schematic diagram of Q-learning.
The CEHHO algorithm employs Q-learning to adaptively adjust the mutation factor value, aiming to identify the most suitable algorithm parameters to each individual. The probability of selecting action aj in state si is generated by SoftMax technology:
where n denotes the total number of actions taken by the agent; exp[·] denotes the exponential function.
Within this context, two states are defined: (1) The performance of offspring individual surpasses that of the parent, resulting in a reward value of 1. (2) The performance of offspring is inferior to that of the parent, yielding a reward value of 0. Each state corresponds to three possible actions regarding the mutation factor R, (1) r = 0.01; (2) r = 0; (3) r = −0.01; the reward R for each individual is updated as follows:
where r represents the mutation adjustment factor obtained through Q-learning. R represents the mutation factor.
| Algorithm 1: The adaptive adjustment process of the Q-learning algorithm |
| 1. Initialize the Q-table and randomly select the initial state st. 2. While the search termination condition is not met do: 3. (a). Select the optimal action at from the Q-table based on the current state st; 4. (b). Execute the action at and obtain reward r based on the environment; 5. (c). Calculate the maximum Q-value for the next state st+1; 6. (d). Update the Q-table using the formula by Equation (26); 7. (e). Update the current state: st = st+1; 8. Output: State s. |
Then, the random difference mutation strategy to improve the level of the HHO to obtain better offspring individuals is expressed as follows:
where Bij(k) represents the mutation position of the i-th hawk in j-th dimension at the k-th iteration; rand1, rand2 and rand3 (rand1 ≠ rand2 ≠ rand3) represent the position indexes randomly selected from the hawk group, respectively; cr represents the crossover factor; randi(D) represents the randomly selected dimension index. r6 represents the random number in [0, 1].
3.5. The Execution Process of CEHHO
To address the performance deficiencies of the traditional HHO and elevate its exploration and development capabilities, this study integrates three optimization strategies for the first time, proposing the Chaotic-enhanced Harris Hawks Optimizer (CEHHO). Firstly, the skew tent chaotic map (STCM) is introduced during the initialization phase of the HHO to enhance population space traversal, thereby ensuring initial population diversity effectively. Secondly, an adaptive strategy for the exploration phase is introduced to redefine its search strategy, selecting appropriate exploration processes based on individual performance to enhance effective search. Lastly, a random difference mutation strategy is incorporated to enhance the ability of the HHO to generate superior offspring.
Notably, the STCM-based population initialization method does not increase computational complexity of the CEHHO. Similarly to random population initialization, its complexity depends solely on the dimensionality of problem. Similarly, the complexity of the Q-learning adjustment strategy, which is applied individually to each population member, depends only on the population size. This analysis indicates that the introduction of these core strategies does not significantly increase overall computational time of the CEHHO. The specific framework of the CEHHO is illustrated in Figure 7 as follows:
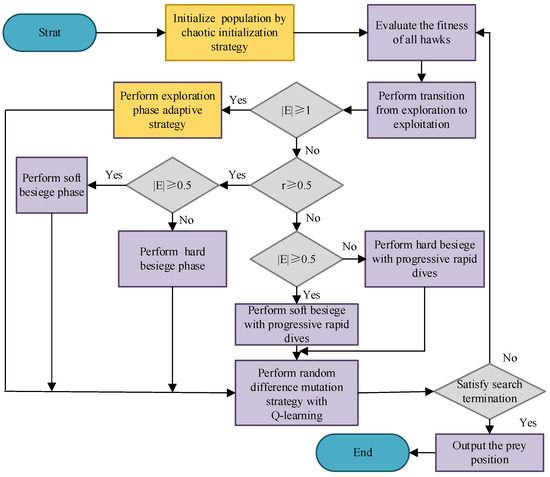
Figure 7.
The execution process of CEHHO.
4. Experimental Implementation
To demonstrate the effectiveness of the proposed method CEHHO, a simulation experiment was conducted using four cascade hydropower stations in the lower reaches of the Jinsha River: Wudongde (WDD), Baihetan (BHT), Xiluodu (XLD), and Xiangjiaba (XJB), which form a group of large reservoirs. The Pingshan hydrological station (PS) downstream of XJB was used as the control section for hydrological conditions. The ecological flow process under natural hydrological conditions was obtained by averaging the monthly observed flows at the PS hydrological station over the years 1988 to 2000, as shown in Figure 8.
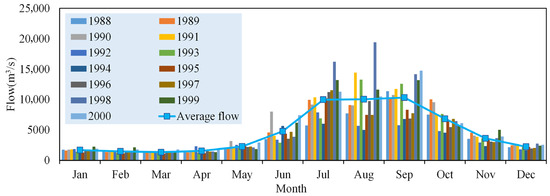
Figure 8.
The flow process in PS hydrological station.
Additionally, four commonly used methods—Sine Cosine Algorithm (SCA) [43], Repairable Gray Wolf Optimization (RGWO) algorithm [44], Whale Optimization Algorithm (WOA) [45], and Harris Hawks Optimizer (HHO)—were introduced for comparative validation. For all methods, the population size was uniformly set to 30, the maximum number of evaluations was set to 30,000, and each method was independently trialed 20 times for statistical analysis. The detailed parameter settings for each algorithm are shown in Table 1 below:

Table 1.
The detailed parameter settings of multi algorithms.
4.1. Case Study 1: Analysis in Different Typical Year
To evaluate the effectiveness of the proposed CEHHO algorithm, a statistical analysis of long-term hydrological data was conducted. Water inflow processes corresponding to annual frequencies of 25%, 50%, and 75% were selected as model inputs. The performance of the CEHHO method was compared with other process optimization methods, including SCA, RGWO, WOA, and HHO. Table 2 presents the statistical results of the proposed method and the comparison methods, based on the best value, median value, mean value, worst value, and standard deviation (STD).
Table 2.
Statistical results of multi algorithms in typical years.
As shown in Table 2, the proposed CEHHO method outperforms most indicators compared to other control methods. Specifically, for the frequency of 75%, CEHHO achieves optimal values that are 35%, 24%, 7%, and 21% lower than those of SCA, RGWO, WOA, and HHO, respectively. Additionally, the standard deviation is improved by 98%, 98%, 98%, and 99%, respectively.
It is worth noting that, although the STD for the proposed method is higher for the 25% frequency compared to other methods, its overall target value is smaller. This indicates that there may be more minimum points within the distribution range of the better results, suggesting that the proposed strategy effectively finds more accurate solutions. Overall, the results of the proposed method are significantly better than those of other technical solutions, demonstrating its superior performance.
To further examine the effectiveness of the CEHHO, the statistical results of the target values of the five optimizers at 25%, 50%, and 75% frequencies were recorded over 20 repetitions, as shown in Figure 9. The results in Figure 9 indicate that, under all three water inflow frequencies, the proposed method consistently finds better and more stable solutions compared to other mature optimizers. These observations are also consistent with the results presented in Table 2.
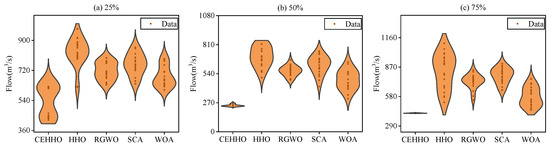
Figure 9.
The robustness analysis of various methods in typical year.
Figure 10 shows the statistical ranking of the best value, median, mean, worst value, and STD of different meth. As shown in the inflow scenario shown in Figure 10a, the proposed method performs poorly in terms of standard deviation compared to other methods, but it obtains the best ranking for other metrics. In addition, combined with the data in Figure 9a, it can be clearly seen that the overall distribution of the proposed method is better than that of other methods. In the inflow scenarios shown in Figure 10b,c, it is obvious that the results of the original HHO method are the worst among all methods. In contrast, the proposed CEHHO method outperforms all other methods and obtains the highest ranking. This clearly demonstrates the effectiveness of the proposed strategy.
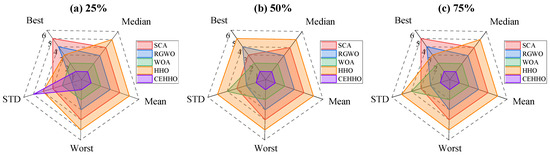
Figure 10.
The statistical ranking of various methods in typical year.
Figure 11 further illustrates the convergence curves of different methods under three frequencies. As shown in Figure 11, SCA performs the worst at the 25% frequency and performs averagely at the 50% and 75% frequencies. The HHO algorithm exhibits average performance across all three frequencies. In contrast, the proposed CEHHO method demonstrates the best convergence speed and accuracy among the three frequencies. This fully demonstrates the effectiveness and efficiency of the proposed method.
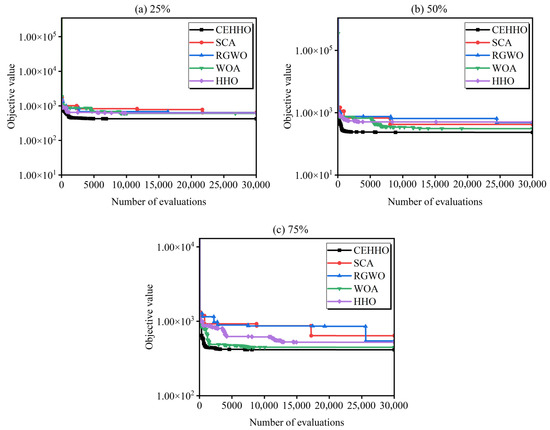
Figure 11.
The convergence analysis of various methods in typical year.
4.2. Case Study 2: Different Guaranteed Output
In this section, different guaranteed output limits are used t to examine their impact on the CEHHO algorithm’s performance. By exploring the algorithm results under various output requirements, the search efficiency and engineering practicability of the proposed method in solving the problem can be demonstrated. Table 3 presents the statistical results of the CEHHO and other algorithms for the 50% frequency water inflow process, including the best, worst, median, mean, standard deviation (STD), and execution time (in seconds).
Table 3.
Statistical results of multi algorithms in different guaranteed output.
As summarized in Table 3, the proposed method demonstrates excellent results in all simulation scenarios. Specifically, under the guaranteed output limit of 1000 MW, the proposed method improves the optimal value, median, mean, and worst value by 293.92, 493.23, 422.14, and 381.15, respectively, compared to the HHO. Under the guaranteed output limit of 1800 MW, the proposed method improves the optimal value index by 619.51, 304.96, 418.59, and 183.9 compared to SCA, HHO, RGWO, and WOA, respectively, and improves the worst value index by 977.55, 2458.98, 702.2, and 388.04, respectively. These findings fully demonstrate that the proposed method maintains good search accuracy under different guaranteed output requirements and has significant engineering practical value.
Building on the results presented in Table 3, Figure 12 illustrates the average CPU execution times of the five methods under various guaranteed output limits, validating the efficiency of each algorithm. All algorithms were executed in the same hardware and software environment. The execution time for each run was recorded, and the average values were calculated to facilitate a statistical comparison of the execution times of different algorithms. Figure 12 demonstrates that with varying guaranteed output limits, the solution times for all methods remain relatively stable. The average execution times for the SCA, HHO, RGWO, WOA, and CEHHO methods are 0.47 s, 0.34 s, 0.53 s, 0.38 s, and 0.45 s, respectively. The HHO method exhibits the highest efficiency, while the improved CEHHO method shows a moderate execution time. This suggests that the proposed method achieves improved solutions at the cost of an additional runtime of 0.11 s. Compared to other optimization techniques, the proposed CEHHO method effectively reveals an enhanced ecological scheduling scheme for reservoir operations without significantly increasing the algorithm runtime.
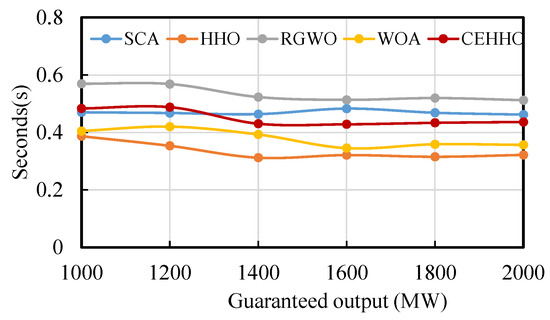
Figure 12.
The average CPU time of various algorithms.
To analyze the performance trends of various methods under different guaranteed output constraints, Figure 13 presents the average statistical results for each method, where darker colors represent better performance metrics. As the guaranteed output requirements increase, it is evident that the target values for all methods generally rise, highlighting the growing difficulty in finding optimal solutions across the board. Notably, the increases for the SCA, HHO, RGWO, and WOA methods are particularly pronounced. In contrast, the proposed method maintains target values between 480 and 600 and consistently outperforms the others in every guaranteed output constraint scenario. Specifically, under the condition of a guaranteed output of 2000 MW, the performance of the SCA, HHO, RGWO, and WOA methods is suboptimal, while the proposed method achieves a superior average result. This clearly demonstrates the stability and effectiveness of the proposed approach.
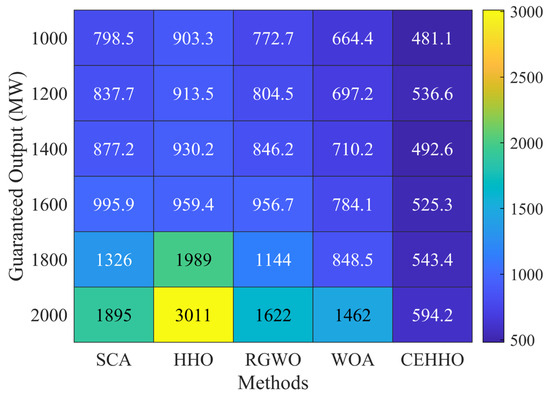
Figure 13.
The average performance under different guaranteed outputs.
To clearly analyze the distribution of target value results across multiple runs, Figure 14 provides the box plot statistics for different methods. The box plot allows for an intuitive observation of the distribution of target values for each method, including the mean and interquartile range. Specifically, the target value distributions of the SCA and RGWO methods are concentrated, indicating that these methods offer more consistent solutions during the optimization process. The HHO method shows considerable variability, suggesting that its results may differ significantly between runs. The WOA exhibits a relatively poor distribution in the 1000 MW to 1400 MW output limit scenario, while it demonstrates improved stability in the 1600 MW to 2000 MW output limit scenario. The proposed CEHHO method maintains a concentrated solution distribution within an optimal target range across all output scenarios. This analysis provides a crucial basis for evaluating and comparing the optimization performance of different methods, indicating that the proposed method demonstrates superior stability and practicality.
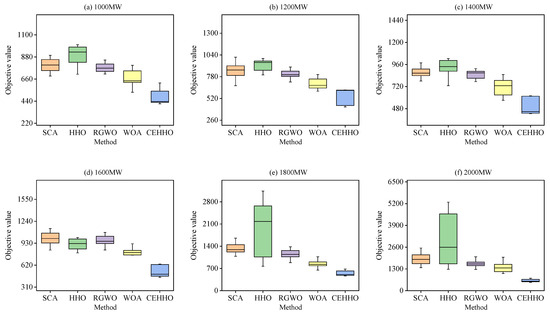
Figure 14.
The box plot analysis of various methods.
5. Conclusions
This study introduces an advanced version of the Harris Hawks Optimizer (CEHHO), specifically designed to determine the natural flow pattern process following the construction of cascade reservoirs, incorporating chaos-based techniques. The key innovations of this research are as follows:
(1) Chaotic initialization: The skew tent chaotic map enhances population initialization, improving the quality and diversity of the initial population and augmenting the algorithm’s exploration capabilities.
(2) Adaptive exploration strategy: An adaptive strategy is proposed for the exploration phase, improving individual exploration efficiency by introducing a balance factor and selecting exploration strategies based on individual performance.
(3) Integration of random mutation with Q-learning: The integration of random mutation and Q-learning introduces random perturbations to individuals, enhancing the algorithm’s ability to navigate complex solution spaces and generate superior offspring.
(4) Application to practical engineering: The proposed method simulates the natural hydrological situation of four cascade reservoirs in the lower Jinsha River, demonstrating advantages in search accuracy and convergence efficiency compared to several widely used techniques under different water inflow frequencies.
Finally, the proposed method is used to simulate the natural hydrological situation of four cascade reservoirs in the lower reaches of the Jinsha River. Initially, the proposed method is compared against several widely used techniques under three typical water inflow frequencies, demonstrating its advantages in search accuracy and convergence efficiency. Furthermore, to meet the needs of practical engineering applications, a multi-use guaranteed output scenario is established, and various methods are applied for solutions. The experimental results indicate that the proposed CEHHO algorithm significantly outperforms existing popular techniques in search capabilities, demonstrating strong potential for engineering applications.
Despite these encouraging results, the CEHHO algorithm has several limitations. First, this study focused on a relatively modest-sized cascade reservoir system; therefore, the algorithm’s performance and scalability in larger and more complex cascade systems remain to be thoroughly evaluated. Second, combining Q-learning with random mutation inevitably increases computational cost; future work will explore methods that incorporate inherent reinforcement learning heuristics to mitigate this challenge. Finally, while the current implementation runs on a single computational thread, there are plans to incorporate parallel computing techniques to improve scalability and reduce runtimes for large-scale problems.
Author Contributions
Z.T.: Writing—original draft, Writing—review and editing, Data curation. S.L.: Investigation, Methodology, Visualization, Formal analysis. H.Q.: Writing—review and editing, Supervision, Conceptualization. Y.Z.: review and editing, Methodology, Supervision, Conceptualization. X.Z.: Writing—original draft. X.C.: Methodology, Formal analysis. P.R.: Supervision, Conceptualization. All authors have read and agreed to the published version of the manuscript.
Funding
This paper is supported by the National Key Research and Development Program of China (Grant No.2021YFC3200303), Key Project of the Natural Science Foundation of China (Grant No.52039004), and Key Project of Chinese Water Resources Ministry (Grant No.SKS-2022120), China Yangtze Power Co., Ltd. (contract No.Z242302044) and funded by the Natural Science Foundation of Hubei Province (Grant No.2022CFD027).
Institutional Review Board Statement
Not applicable.
Informed Consent Statement
Not applicable.
Data Availability Statement
The authors do not have permission to share data.
Acknowledgments
Special thanks are given to the anonymous reviewers and editors for their constructive comments.
Conflicts of Interest
Author Zhengyang Tang was employed by the China Yangtze Power Co., Ltd. The remaining authors declare that the research was conducted in the absence of any commercial or financial relationships that could be construed as a potential conflict of interest.
References
- Shah, Z.; Kumar, M.D. In the midst of the large dam controversy: Objectives, criteria for assessing large water storages in the developing world. Water Resour. Manag. 2008, 22, 1799–1824. [Google Scholar] [CrossRef]
- Yun, X.; Tang, Q.; Wang, J.; Liu, X.; Zhang, Y.; Lu, H.; Wang, Y.; Zhang, L.; Chen, D. Impacts of climate change and reservoir operation on streamflow and flood characteristics in the Lancang-Mekong River Basin. J. Hydrol. 2020, 590, 125472. [Google Scholar] [CrossRef]
- Xu, Y.; Jiang, Z.; Dai, Y.; Li, Z.; Liu, Y.; Gu, L. Ancient wisdom: A new perspective on the past and future Chinese precipitation patterns based on the twenty-four solar terms. J. Hydrol. 2024, 641, 131873. [Google Scholar] [CrossRef]
- Lei, X.; Zhang, J.; Wang, H.; Wang, M.; Khu, S.; Li, Z.; Tan, Q. Deriving mixed reservoir operating rules for flood control based on weighted non-dominated sorting genetic algorithm II. J. Hydrol. 2018, 564, 967–983. [Google Scholar] [CrossRef]
- Yang, G.; Guo, S.; Liu, P.; Li, L.; Liu, Z. Multiobjective cascade reservoir operation rules and uncertainty analysis based on PA-DDS algorithm. J. Water Resour. Plan. Manag. 2017, 143, 04017025. [Google Scholar] [CrossRef]
- Fantin-Cruz, I.; Pedrollo, O.; Girard, P.; Zeilhofer, P.; Hamilton, S.K. Effects of a diversion hydropower facility on the hydrological regime of the Correntes River, a tributary to the Pantanal floodplain, Brazil. J. Hydrol. 2015, 531, 810–820. [Google Scholar] [CrossRef]
- Li, F.; Wei, J.; Qiu, J.; Jiang, H. Determining the most effective flow rising process to stimulate fish spawning via reservoir operation. J. Hydrol. 2020, 582, 124490. [Google Scholar] [CrossRef]
- Luo, W.; Luo, X.; Lu, J.; Bo, M. Contribution of the reservoir backflow to the eutrophication of its tributary: A case study of the Xiangxi River, China. Hydrol. Res. 2022, 53, 467–482. [Google Scholar] [CrossRef]
- Ehsani, N.; Vörösmarty, C.J.; Fekete, B.M.; Stakhiv, E.Z. Reservoir operations under climate change: Storage capacity options to mitigate risk. J. Hydrol. 2017, 555, 435–446. [Google Scholar] [CrossRef]
- Suwal, N.; Huang, X.; Kuriqi, A.; Chen, Y.; Pandey, K.P.; Bhattarai, K.P. Optimisation of cascade reservoir operation considering environmental flows for different environmental management classes. Renew. Energy 2020, 158, 453–464. [Google Scholar] [CrossRef]
- Scott Winton, R.; Calamita, E.; Wehrli, B. Reviews and syntheses: Dams, water quality and tropical reservoir stratification. Biogeosciences 2019, 16, 1657–1671. [Google Scholar] [CrossRef]
- Li, B.; Chen, N.; Wang, W.; Wang, C.; Schmitt, R.J.P.; Lin, A.; Daily, G.C. Eco-environmental impacts of dams in the Yangtze River Basin, China. Sci. Total Environ. 2021, 774, 145743. [Google Scholar] [CrossRef] [PubMed]
- Yan, M.; Fang, G.; Dai, L.; Tan, Q.; Huang, X. Optimizing reservoir operation considering downstream ecological demands of water quantity and fluctuation based on IHA parameters. J. Hydrol. 2021, 600, 126647. [Google Scholar] [CrossRef]
- Wang, Y.; Liu, P.; Dou, M.; Li, H.; Ming, B.; Gong, Y.; Yang, Z. Reservoir ecological operation considering outflow variations across different time scales. Ecol. Indic. 2021, 125, 107582. [Google Scholar] [CrossRef]
- Huang, K.; Liu, P.; Ming, B.; Kim, J.; Gong, Y. Economic operation of a wind-solar-hydro complementary system considering risks of output shortage, power curtailment and spilled water. Appl. Energy 2021, 290, 116805. [Google Scholar] [CrossRef]
- Niu, W.J.; Feng, Z.K.; Li, Y.R.; Liu, S. Cooperation Search Algorithm for Power Generation Production Operation Optimization of Cascade Hydropower Reservoirs. Water Resour. Manag. 2021, 35, 2465–2485. [Google Scholar] [CrossRef]
- Niu, W.J.; Feng, Z.K.; Jiang, Z.Q.; Wang, S.; Liu, S.; Guo, W.; Song, Z.G. Enhanced harmony search algorithm for sustainable ecological operation of cascade hydropower reservoirs in river ecosystem. Environ. Res. Lett. 2021, 16, 055013. [Google Scholar] [CrossRef]
- Abhijnan, A.; Desai, K.; Wang, J.; Rodríguez-Martínez, A.; Dkhili, N.; Jellema, R.; Grossmann, I.E. Mixed-Integer Nonlinear Programming Model for Optimal Field Management for Carbon Capture and Storage. Ind. Eng. Chem. Res. 2024, 63, 12053–12063. [Google Scholar] [CrossRef]
- Ginting, B.M.; Harlan, D.; Taufik, A.; Ginting, H. Optimization of reservoir operation using linear program, case study of Riam Jerawi Reservoir, Indonesia. Int. J. River Basin Manag. 2017, 15, 187–198. [Google Scholar] [CrossRef]
- Rani, D.; Pant, M.; Jain, S.K. Dynamic programming integrated particle swarm optimization algorithm for reservoir operation. Int. J. Syst. Assur. Eng. Manag. 2020, 11, 515–529. [Google Scholar] [CrossRef]
- Wang, W.; Jia, B.; Simonovic, S.P.; Wu, S.; Fan, Z.; Ren, L. Comparison of Representative Heuristic Algorithms for Multi-Objective Reservoir Optimal Operation. Water Resour. Manag. 2021, 35, 2741–2762. [Google Scholar] [CrossRef]
- Beiranvand, B.; Ashofteh, P.S. A Systematic Review of Optimization of Dams Reservoir Operation Using the Meta-heuristic Algorithms. Water Resour. Manag. 2023, 37, 3457–3526. [Google Scholar] [CrossRef]
- Lai, V.; Huang, Y.F.; Koo, C.H.; Ahmed, A.N.; El-Shafie, A. A Review of Reservoir Operation Optimisations: From Traditional Models to Metaheuristic Algorithms. Arch. Comput. Methods Eng. 2022, 29, 3435–3457. [Google Scholar] [CrossRef]
- Abualigah, L.; Elaziz, M.A.; Khasawneh, A.M.; Alshinwan, M.; Ibrahim, R.A.; Al-qaness, M.A.A.; Mirjalili, S.; Sumari, P.; Gandomi, A.H. Meta-heuristic optimization algorithms for solving real-world mechanical engineering design problems: A comprehensive survey, applications, comparative analysis, and results. Neural Comput. Appl. 2022, 34, 4081–4110. [Google Scholar] [CrossRef]
- Dadrasajirlou, Y.; Karami, H. A survey of different Whale Optimization Algorithm applications in water engineering and management. In Handbook of Whale Optimization Algorithm; Elsevier: Amsterdam, The Netherlands, 2023; pp. 613–624. [Google Scholar]
- Moradi-Far, S.; Ashofteh, P.S.; Loáiciga, H.A. Development of the marine predators algorithm for optimizing the performance of water supply reservoirs. Environ. Dev. Sustain. 2024, 27, 12871–12892. [Google Scholar] [CrossRef]
- Shen, X.; Wu, Y.; Li, L.; He, P.; Zhang, T. A Novel Hybrid Algorithm Based on Beluga Whale Optimization and Harris Hawks Optimization for Optimizing Multi-Reservoir Operation. Water Resour. Manag. 2024, 38, 4883–4909. [Google Scholar] [CrossRef]
- Peng, L.; Li, X.; Yu, L.; Heidari, A.A.; Chen, H.; Liang, G. Q-learning guided mutational Harris hawk optimizer for high-dimensional gene data feature selection. Appl. Soft Comput. 2024, 161, 111734. [Google Scholar] [CrossRef]
- Haris, U.; Kabeer, V.; Afsal, K. Breast cancer segmentation using hybrid HHO-CS SVM optimization techniques. Multimed. Tools Appl. 2024, 83, 69145–69167. [Google Scholar]
- Peng, Z.; Pirozmand, P.; Xiong, Y. Improved Harris Hawks Optimizer algorithm to solve the multi-depot open vehicle routing problem. Evol. Intell. 2024, 17, 2495–2513. [Google Scholar] [CrossRef]
- Salvador, S.; Chan, P. Toward accurate dynamic time warping in linear time and space. Intell. Data Anal. 2007, 11, 561–580. [Google Scholar] [CrossRef]
- Boujnah, S.; Ferjaoui, R.; Khalifa, A.B.; Amara, N.E.B.; Sourin, A.; Sourina, O.; Rosenberger, C. Hybrid approach for speaker recognition based on formant and pitch extraction. In Proceedings of the 2023 International Conference on Cyberworlds (CW), Sousse, Tunisia, 3–5 October 2023; Institute of Electrical and Electronics Engineers Inc.: New York, NY, USA, 2023; pp. 365–372. [Google Scholar]
- Li, H.; Hu, H. Head Gesture Recognition Combining Activity Detection and Dynamic Time Warping. J. Imaging 2024, 10, 123. [Google Scholar] [CrossRef] [PubMed]
- Middlehurst, M.; Schäfer, P.; Bagnall, A. Bake off redux: A review and experimental evaluation of recent time series classification algorithms. Data Min. Knowl. Discov. 2024, 38, 1958–2031. [Google Scholar] [CrossRef]
- Geler, Z.; Kurbalija, V.; Ivanovic, M.; Radovanovic, M.; Dai, W.; Koprinkova-Hristova, P.; Yildirim, T.; Piuri, V.; Iliadis, L.; Camacho, D. Dynamic Time Warping: Itakura vs Sakoe-Chiba. In Proceedings of the IEEE International Symposium on INnovations in Intelligent SysTems and Applications (INISTA), Sofia, Bulgaria, 3–5 July 2019; Institute of Electrical and Electronics Engineers Inc.: New York, NY, USA, 2019. [Google Scholar]
- Behnamfar, M.R.; Abasi, M. Uncertainty Management in Short-Term Self-Scheduling Unit Commitment Using Harris Hawks Optimization Algorithm. J. Oper. Autom. Power Eng. 2024, 12, 280–295. [Google Scholar]
- Li, M.W.; Lei, Y.Z.; Yang, Z.Y.; Huang, H.P.; Hong, W.C. An optimization method for maintenance routing and scheduling in offshore wind farms based on chaotic quantum Harris hawks optimization. Ocean Eng. 2024, 308, 118306. [Google Scholar] [CrossRef]
- Agushaka, J.O.; Ezugwu, A.E.; Abualigah, L.; Alharbi, S.K.; Khalifa, H.A.E. Efficient initialization methods for population-based metaheuristic algorithms: A comparative study. Arch. Comput. Methods Eng. 2023, 30, 1727–1787. [Google Scholar] [CrossRef]
- Rahnamayan, S.; Tizhoosh, H.R.; Salama, M.M. A novel population initialization method for accelerating evolutionary algorithms. Comput. Math. Appl. 2007, 53, 1605–1614. [Google Scholar] [CrossRef]
- Pervaiz, S.; Bangyal, W.H.; Ashraf, A.; Nisar, K.; Haque, M.R.; Ibrahim, A.; Ag, A.B.; Chowdhry, B.; Rasheed, W.; Rodrigues, J.J. Comparative research directions of population initialization techniques using PSO algorithm. Intell. Autom. Soft Comput. 2022, 32, 1427–1444. [Google Scholar] [CrossRef]
- Rong, H. Design of automatic block section signalling layout of appling chaos embedded particle swarm optimization algorithm based on skew tent map. In Informatics in Control, Automation and Robotics; Lecture Notes in Electrical Engineering; Springer: Berlin/Heidelberg, Germany, 2011; pp. 785–792. [Google Scholar]
- Bilal; Pant, M.; Zaheer, H.; Garcia-Hernandez, L.; Abraham, A. Differential Evolution: A review of more than two decades of research. Eng. Appl. Artif. Intell. 2020, 90, 103479. [Google Scholar] [CrossRef]
- Abualigah, L.; Diabat, A. Advances in Sine Cosine Algorithm: A comprehensive survey. Artif. Intell. Rev. 2021, 54, 2567–2608. [Google Scholar] [CrossRef]
- Ebrahimi, S.M.; Hasanzadeh, S.; Khatibi, S. Parameter identification of fuel cell using Repairable Grey Wolf Optimization algorithm. Appl. Soft Comput. 2023, 147, 110791. [Google Scholar] [CrossRef]
- Sapnken, F.E.; Khalili Tazehkandgheshlagh, A.; Salomon Diboma, B.; Hamaidi, M.; Gopdjim Noumo, P.; Wang, Y.; Gaston Tamba, J. A whale optimization algorithm-based multivariate exponential smoothing grey-holt model for electricity price forecasting. Expert Syst. Appl. 2024, 255, 124663. [Google Scholar] [CrossRef]
Disclaimer/Publisher’s Note: The statements, opinions and data contained in all publications are solely those of the individual author(s) and contributor(s) and not of MDPI and/or the editor(s). MDPI and/or the editor(s) disclaim responsibility for any injury to people or property resulting from any ideas, methods, instructions or products referred to in the content. |
© 2025 by the authors. Licensee MDPI, Basel, Switzerland. This article is an open access article distributed under the terms and conditions of the Creative Commons Attribution (CC BY) license (https://creativecommons.org/licenses/by/4.0/).