Abstract
Reducing carbon emissions in the industrial sector is a critical component of achieving green and sustainable development. We employ quantile vector autoregressive methods to analyze the dynamic interactions of industrial carbon emissions across various countries. Initially, we observe that, under normal conditions, developed countries led by the EU exhibit a significant total spillover effect. Secondly, during extreme quantile conditions, the spillover effects of EU-led developed countries shift from positive to negative, whereas in the UK, the opposite trend is observed. This highlights the importance of considering carbon transfer’s role in emission reduction during extreme quantile scenarios. Thirdly, we find that China’s industrial carbon emissions spillover effects remain relatively stable at all times. Lastly, total spillover effects are highly volatile during extreme market conditions, such as the COVID-19 pandemic. These findings will help clarify each country’s emission reduction responsibilities within the international industrial system and facilitate a more equitable allocation of emission reduction tasks.
1. Introduction
Industry serves as the economic foundation of every country and, in terms of carbon emissions, stands as one of the main contributors [1] In recent years, the challenges of climate change have grown, leading to a consensus among countries on the need for industrial transformation and carbon reduction [2,3]. Despite this, the outbreak of the 2023 Israel–Palestine conflict and the 2022 Russian–Ukraine crisis pose threats to industrial transformation and upgrades. The carbon transfer between developed and developing countries has sparked disputes over environmental equity. Thus, understanding how carbon moves through international trade, clarifying the mutual impact of carbon emissions among nations, and determining their responsibilities for emission reduction can facilitate fair allocation of reduction tasks globally, advancing the orderly progress of global carbon emissions reduction efforts [4].
Previously, carbon reduction efforts mainly focused on production and consumption, analyzing the domestic CO2 production and emission process from a production perspective [5], This approach emphasized overall calculations and structural arrangements [6], establishing a qualitative basis for mitigation policies but neglecting the impact of carbon emissions transfer. Currently, within the global industrial system, carbon embeddedness and transfer have become key research areas. Much research has explored industrial transfer, including trade-related carbon emissions transfer resulting from the relocation of manufacturing industries, which has increased the carbon emissions burden on developing countries [7]. Simultaneously, there is an imbalance in carbon transfer in industrial trade among developed countries [8]. Therefore, reducing industrial enterprises’ carbon emissions and studying the spillover effects of industrial carbon emissions between countries are crucial for lowering overall carbon emissions and achieving industrial transformation goals [9]. China, the United States, the European Union, and other countries are major industrial players globally. The industries of the United States, the European Union, and other countries have been significantly impacted by the Russian–Ukraine conflict and the Palestine–Israel crisis. Despite refraining from trade sanctions, the war has notably affected China’s energy and commodity markets [10].
In theory, the industrial market, encompassing metal and energy markets, is intricately interconnected through various channels such as consumption, production, and investment [11]. According to demand and supply theory, the presence of multinational corporations and industrial chains can also affect carbon emissions between different countries [12]. Some developed countries have shifted carbon emission pressure to other countries in certain aspects of their manufacturing industry, thereby reducing their own carbon emissions. The adjustment of this industrial and supply chain requires global cooperation and coordination [13]. On the contrary, globalization has dispersed the production of many products in different countries, forming complex industrial and supply chain networks. This industrial chain relationship means that the industrial markets of different countries are interconnected in terms of carbon emissions, requiring joint efforts to reduce the carbon footprint of the entire supply chain [14]. Additionally, the connection between industrial carbon emissions among different countries is heterogeneous, with varying levels of economic development and differences in industrial structure and energy consumption patterns [15]. Developed countries usually have more advanced clean production technologies, while developing countries may still rely on high-carbon energy. This difference leads to heterogeneity in industrial carbon emissions levels among different countries [16]. In contrast to developing country markets, those with more complete industrial systems like the European Union are particularly vulnerable to the effects of extreme events. The Russia–Ukraine and Israel–Palestine conflicts have reshaped the significance of global markets while heightening the complexity of their interconnections, particularly through disruptions to essential energy and food supplies [11]. From a macroeconomic perspective, sharp volatility in key energy commodity prices may compel the Federal Reserve to adjust interest rates in order to contain inflation and stabilize exchange rates, thereby exerting considerable influence on the dynamics of international industrial markets [17]. In-depth empirical studies on the targeted spillover effects within these submarkets can enhance our understanding of the theoretical connections between these markets during crises.
Most existing studies rely on static or comparative static analyses, which makes it challenging to capture the dynamic and time-varying characteristics of carbon emission spillover effects [18]. In particular, there is a lack of systematic research on the transmission mechanisms of tail risks during extreme events. Additionally, traditional methods fail to effectively differentiate the impacts of various time scales on the spillover network and do not integrate major industrialized countries into a unified dynamic network framework to quantify their role transitions under different market conditions [19]. These limitations hinder the ability of current carbon responsibility-sharing schemes to adapt to the complex and ever-changing global environment. Therefore, it is imperative to uncover the dynamic reshaping mechanisms of the carbon correlation network structure induced by crisis events by integrating quantile regression with frequency domain analysis, thereby providing a more scientific basis for allocating international emission reduction responsibilities. Expanding upon the deficiencies of current research, this article will pioneer advancements in the following areas: firstly, we reveal the interconnectedness of industrial carbon emissions across different quantiles. Compared to previous studies, we combine the QVAR method with the BK [20] method and find that markets in developed countries such as the EU have consistently high spillover effect effects, indicating that they are the main contributors to risk. Furthermore, under extreme quantile conditions, the industrial market in the UK stands out the most, with a net spillover index ranging from negative to positive, acting as a risk transmitter, while developed countries like the EU exhibit the opposite behavior. This suggests that under extreme quantile conditions, we should focus on the role of transfers in carbon reduction and, based on this, determine carbon emission responsibility coefficients to reallocate carbon reduction responsibilities, thereby implementing mitigation tasks across industrial sectors. Secondly, we find that the carbon emission spillover effect effects in the Chinese industrial market remain relatively stable across various quantile conditions, indicating that Chinese industrial carbon emissions are less influenced by industrial transfers from developed countries. Therefore, in China, we should focus on carbon reduction processes in the production phase. Finally, using the visualization method of QVAR, we analyze the temporal evolution of carbon emission spillover effects among industrial sectors under different quantiles, filling a gap in the current research on the temporal changes in carbon emission spillover effects between industries, which is of practical significance.
2. Literature Review
In previous studies on carbon reduction processes, carbon transfer analysis has been an important research focus. Meng et al. proposed a framework for analyzing upstream–downstream linkages between sectors to study inter-sectoral connections [21]. The initial industrial sectors that drive national transfers as a whole are tasked with dual responsibilities of primary and final production, establishing cross-border industrial transfer routes. Numerous scholars have also focused on carbon transfer pathways between countries in commodity trade, such as US–Japan [8] US–Germany [22], China–India [23] and China–Brazil [24]. Additional researchers have also studied the pathways through which carbon emissions are transferred internationally [25,26], Li studied carbon transfer between the industrial sectors of the United States and China [27].
The study indicates that direct carbon emissions might not provide a precise representation of actual carbon emissions, potentially influencing the efficacy of carbon reduction measures [28]. Recently, research has primarily focused on analyzing implicit carbon emissions from national and inter-provincial trade, as well as from individual industrial sectors [29,30], overlooking the diversity of various sectors [30]. Significant carbon emission differences exist among industrial sectors, stemming from factors like production methods and scale [31]. However, the aforementioned studies did not delve into the complex direct and indirect linkages of carbon emissions between industries, nor did they thoroughly tackle the diverse roles of nations and sectors within the complex international carbon transfer network. Therefore, in this article, we aim to expand on previous research by identifying the spillover effects of industrial carbon emissions across multiple countries.
This article employs the Quantile Vector Autoregression (QVAR) method to analyze industrial carbon emissions across different countries. The QVAR approach facilitates understanding the influence of long-term economic cycles in the frequency domain, as well as the impact of short-term geopolitical factors on spillover effects. Economic cycle impact: Long-term economic cycles can significantly affect the spillover of carbon emissions. For example, during economic booms, industrial production and carbon emissions tend to increase, potentially spilling over into neighboring countries. Conversely, during economic downturns, reduced industrial activity leads to lower carbon emissions, thereby diminishing spillover effects. Geopolitical impact: Short-term geopolitical events or conflicts can abruptly influence carbon emission spillovers. Regional conflicts, for instance, may disrupt or reduce industrial activities, lessening spillover effects. Additionally, geopolitical tensions can affect international cooperation and the enforcement of carbon reduction policies, further impacting spillover dynamics. From an economic perspective, long-term factors generally exert a stable and lasting influence on spillover effects, whereas short-term geopolitical factors tend to cause sudden changes and instability. Therefore, long-term economic factors may have a more substantial overall impact on spillover effects, while short-term geopolitical factors typically produce immediate and localized effects.
Only a few scholars have addressed the aforementioned issues within a systematic research framework. These discussions are crucial for guiding industry collaboration in emission reduction and promoting eco-friendly industries and consumption patterns. Carbon emissions flow throughout production and consumption, creating a complex network of implicit emission relationships among sectors. Scholars have explored carbon emission transfer through cross-regional flows of products and services, leveraging multi-regional input–output (MRIO) and hypothesis extraction methods (HEM) for CO2 sectors [32]. Wang utilized SNA and MRIO to study the carbon emission transfer networks in the consumption and production processes of 40 major countries, and identified the crucial sector nodes and flow paths within the networks [33]. Yuan et al. computed the indirect carbon footprint in the Yellow River Basin of China and demonstrated that the secondary industry plays a pivotal role in carbon emission transfer [34]. Earlier studies have largely relied on techniques such as Granger causality tests, support vector models, vector autoregression (VAR), BEKK, GARCH frameworks, and marginal expected shortfall (MES) to evaluate spillover effects across different financial markets [35,36]. Although these approaches provide useful insights, they fall short in precisely capturing the timing, magnitude, and direction of risk spillovers within complex multi-asset networks. To overcome this limitation, Diebold and Yilmaz introduced a methodology that decomposes forecast error variances and developed the total connectedness index, which enables a more comprehensive evaluation of spillover dynamics [18]. However, the DY method lacks the ability to characterize risk spillover effects across different time periods. Therefore, an increasing number of scholars are focusing on the frequency domain attributes of risk spillovers by utilizing variance decomposition in spectral representation. Baruník and Křehlík developed a framework for spillover index from a frequency domain perspective [20]. While these offer fresh insights into carbon emission transfer studies, few have applied them to analyze industrial emission transfers. Only a few scholars have addressed the aforementioned issues within a systematic research framework. These discussions are crucial for guiding industry collaboration in emission reduction and promoting sustainable industries and consumption. This study builds on the Quantile vector autoregression model, incorporating the BK model’s frequency domain perspective. Chatziantoniou and Abakah presented a unique approach that combines quantiles with the examination of cyclical patterns in market spillovers, allowing for a deeper understanding of these effects across diverse frequencies at specific quantiles. Additionally, the framework allows for the analysis of volatility spillover effects across different conditional quantiles at specific frequencies, enhancing its robustness and flexibility [37]. In addition, Ando et al. observed that, unlike traditional conditional mean estimation techniques such as ordinary least squares, this method is resilient to outliers, resulting in more accurate and reliable estimation outcomes. Therefore, this article will use the QVAR model to explore the spillover effects of industrial carbon emissions in different countries, which will help policymakers make scientific decisions from different perspectives [38].
3. Statistical Analysis and Methodology
3.1. Data
This article uses carbon emissions data from 1 January 2019 to 28 September 2023. All data were obtained from the publicly accessible website “https://www.carbonmonitor.org.cn (accessed on 6 September 2025)”. Table 1 summarizes the descriptive statistics for the variables. Based on the Jarque–Bera and ADF tests, the evidence suggests that the volatility of all data series does not conform to the assumption of normality. The unit root test confirmed the stationarity of each variable, satisfying the necessary conditions for applying the QVAR model.

Table 1.
Descriptive statistics on industrial carbon emissions in various countries.
This study selected China, the United States, the 27 countries of the European Union, India, Japan, Russia, the United Kingdom, and Brazil as research subjects, based primarily on the following considerations: These countries are not only the main contributors to global industrial carbon emissions (accounting for more than 70% of the global total) but also represent typical economies at different stages of development with diverse industrial structures. Among them, China, the United States, and the European Union, as the world’s three largest carbon emitters, have mature industrial systems and close trade exchanges. India and Brazil, as rapidly industrializing countries, have absorbed a large number of carbon-intensive industries through industrial transfer. As a major energy exporter, Russia’s carbon emissions are significantly influenced by geopolitical factors. Japan and the United Kingdom exemplify the different paths developed countries have taken in their low-carbon transformations. Additionally, these countries have played key roles in major geopolitical events in recent years, such as the Russia–Ukraine conflict and Sino-US trade tensions. Their carbon emission dynamics can fully reflect the impact of extreme events on the global carbon transfer network. Furthermore, these countries offer significant advantages in data availability and global representativeness, providing an ideal sample for studying the cross-border spillover effects of industrial carbon emissions.
3.2. Methodology
This study applies the generalized forecast error variance decomposition derived from the QVAR framework, following the methodology of Chatziantoniou et al. [37], to investigate tail spillover effects arising from carbon emissions and the transition between conventional and renewable energy sources across different magnitudes, horizons, and cycles. In this setting, the conditional median represents a normal market state, whereas the 0.05 and 0.95 conditional quantiles capture extreme downside and upside conditions, respectively.
To construct the different connectedness measures, we first estimate a quantile vector autoregression model, denoted as QVAR (p), which possesses the following characteristics:
and , are endogenous variable vectors, takes values in representing quantiles, is the number of lags in the QVAR model, is the conditional mean vector, and is the QVAR coefficient matrix. proves that the error vector has an error variance–covariance matrix of , . The QVAR (p) model is transformed into the quantile vector moving average representation of QVAR (∞) using the Wold theorem:
Subsequently, the Generalized Forecast Error Variance Decomposition (GFEVD) is computed to apply the connectivity method [39,40]. Within the GFEVD, the share of forecast error variance reflects the extent to which a shock in series contributes to the variability of series . This metric captures the magnitude of cross-series influence and is formally expressed as follows:
To ensure the rows of are sum to 1, each row must be normalized by its sum to obtain . By normalizing, this paper derives the following identities: and . Accordingly, the sum of each row in the matrix equals one, reflecting the proportion by which a shock to a given series is transmitted not only to itself but also across all other series . For ease of understanding, this paper establishes a spillover measure table based on an variance decomposition matrix, as shown in Table 2:

Table 2.
Spillover Index Table.
We then proceed to derive multiple connectedness indicators. The first, namely the net pairwise connectedness (or net pairwise directional connectedness), is computed according to the procedure outlined below:
If this signifies that series exerts a stronger (weaker) influence on series than the influence of series on series . Hence, if Series exerts dominance over series and vice versa.
The total directional connectedness measure (TO) gauges how a shock in series is transmitted to all other series :
The total directional connectedness measure (TO) gauges how a shock in series is transmitted to all other series :
The net total directional connectedness is defined as the difference between the total directional connectedness transmitted to others and that received from others. This measure reflects the overall net contribution of series to the dynamics of the network:
If series has a greater impact on all other series than the impact it receives, making it a net shock emitter. On the other hand, if the received impact exceeds the impact it exerts on others, it is a net shock receiver.
The overall assessment of network interconnectedness can be conducted by calculating the Total Connectivity Index (TCI), which is determined by the following formula:
Put simply, this measure demonstrates the average effect of a shock in one series on all other series. The lower the TCI value, the lower the system-wide connectedness, while a higher value indicates the opposite.
Up until now, we have been focusing on assessing connectivity in the time domain. Similarly, we now shift our focus to evaluating connectivity in the frequency domain. The Fourier transform of QVMA (∞) defines the spectral density of at frequency .
By combining spectral density with generalized forecast error variance decomposition, the frequency generalized forecast error variance decomposition is obtained. Here, represents the conditional quantile at time , showing the part of variable spectrum influenced by variable . The standard formulation of spectral decomposition (10) is obtained through the Fourier transform of the impulse response functions.
To investigate the dissemination of tail risk spillovers across various frequency bands, a frequency band is established in this paper: . The measure quantifies the spillover magnitude from variable to variable within a specific frequency band . This enables the calculation of directional and total spillover indices across different quantiles and frequency domains.
According to Formula (13), the net spillover index (NET) is defined within the quantile frequency domain, . Furthermore, by using the net spillover index within the frequency domain, it becomes possible to assess how each market contributes to the contagion of tail risk across different time periods.
4. Empirical Results and Discussion
4.1. Time-Domain and -Frequency Average Connectedness
4.1.1. Time-Domain Average Spillover Effects
Based on the Akaike Information Criterion (AIC), Hannan–Quninn criterion (HQ), Schwartz Criterion (SC), and Final Prediction Error (FPE), a VAR model with an optimal lag order of 1 was constructed. Table 3 presents the static spillover matrix of industrial carbon emissions across various countries. Among them, the main diagonal value signifies the impact of each variable’s own lag effect on prediction error variance. Off-diagonal numerical values indicate interactions between variables within the spillover network. Specifically, the “TO” row demonstrates the cumulative spillover effects of tail in a specific market, while the “From” column shows the inflow effects. Additionally, the “NET” row represents the net level of tail spillover, and the Total Connectedness Index (TCI) quantifies the overall system-wide interconnectedness of industrial carbon emissions across nations. Extreme market conditions are the extreme quantiles of the joint distribution of carbon emission changes (for example, τ = 0.05 during recession/crisis and τ = 0.95 during rise/prosperity).

Table 3.
Spillover Table of Industrial Carbon Emissions in Different Countries.
Table 3 illustrates the static spillover effects of industrial carbon emissions under standard conditions. With regard to the spillover effect (TO), the European Union demonstrates the highest spillover at 84.11%, followed by Japan at 64.52%. China exhibits the lowest spillover at 6.43%. In terms of the spillover effect (FROM), the European Union again shows the highest spillover at 7.35%, followed by Japan at 6.18%. China has the smallest spillover effect at 1.50%. The time-domain results underscore the role of the European Union International as both the major transmitter of spillovers and the central repository of risk. Consequently, indices with elevated spillover magnitudes appear more exposed to the transmission channels of other indices. The table further reveals that the industrial sector in the Chinese market operates under a well-established market mechanism, which results in relatively weak transmission of uncertainty shocks to other countries, thereby leading to lower spillover levels. In terms of net spillover, countries outside of the European Union experience negative net spillover effects as recipients. The United States, India, and Brazil exhibit the highest net spillover effects, making them the largest risk-bearers with values of −11.49%, −9.36%, and −8.93%, respectively. Meanwhile, the EU’s industrial carbon emission index is entirely positive, indicating that the EU’s industrial system is more mature and drives fluctuations in other industrial carbon emission indices. Additionally, Figure 1 illustrates the temporal evolution of the total spillover effect of carbon emissions from industrial sectors in various countries based on the median of rolling windows. In 2020 and mid-2023, the overall connectivity index significantly increased. This indicates that in 2020 and mid-2023, the Russian–Ukraine conflict and the Israel–Palestine conflict led to a significant decline in the overall link index of industrial carbon emissions among countries [41].
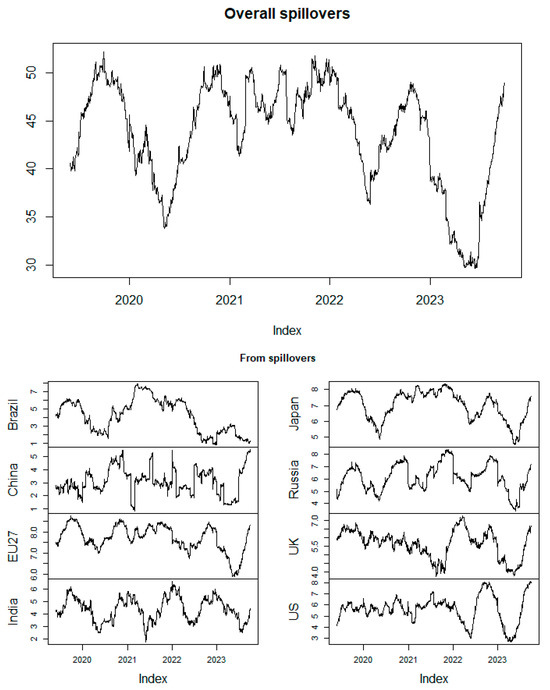
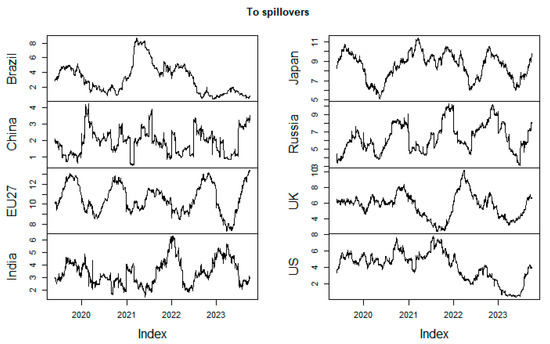
Figure 1.
Total spillover effect.
4.1.2. Time–Frequency Average Spillover Effects
We also utilize the BK method to decompose spillover effects into short-term (1–5 days), medium-term (5–30 days), and long-term (over 30 days) categories, apart from conducting a time-domain analysis.
Table 4 reveals that the overall spillover index stands at 28.10% in the short term, 6.90% in the medium term, and 1.29% in the long term. The spillover effect of industrial carbon emissions between different countries has a significant impact in the short term. Furthermore, the table indicates that short-term spillover effects are greater than long-term spillover effects, which means that the competition for industrial carbon emissions in different countries is more prominent in the process of carbon reduction. It is worth mentioning that the short-term negative net spillovers from Russian and the United Kingdom are transitioning into long-term positive values. The shift indicates that Russian and the United Kingdom occupied varying positions in the short to medium term, in contrast to their positions in the long term during this period. The industrial status has a net acceptance of net spillovers, which may be related to the epidemic situation and the Russian–Ukraine conflict.

Table 4.
Frequency-domain spillover index.
4.2. Dynamic Quantile Connectedness
To investigate the spillover effects of industrial carbon emissions across various countries under extreme circumstances, this study employs the QVAR model to examine such effects.
Table 5, Table 6, and Table 7, respectively, illustrate the tail directional spillover and total spillover of industrial carbon emissions in different countries under the conditions of conditional median and extreme market downturn (5th percentile) and extreme upward (95th percentile). A significant increase in the overall spillover index of tail risk across most countries was observed during extreme conditions, compared to normal circumstances. The total spillover effect index rose to 80.52% under extreme downward market conditions and 80.14% under extreme upward market conditions, in contrast to 42.31% under normal conditions. Under extreme market conditions, the net spillover index of international risks in traditional development countries decreased or even turned positive, while the net spillover index of developed industrial powers, such as the European Union, decreased or even turned negative [42]. Conversely, the spillover index of many industrial sectors in the UK and the US strengthened, indicating an increased spillover risk of industrial powers during extreme market conditions. Traditional powers, on the other hand, exhibited a stronger capacity to absorb carbon emission transfers, suggesting a trend towards non-industrial transformation in extreme markets. The impact of economic shocks in the UK and the US on developing countries is more severe, emphasizing the need for governments worldwide to focus on normal macroeconomic regulation and prevention during extreme market conditions, and to take preemptive measures.

Table 5.
Time Domain and Tail Net Spillover Table of Industrial Carbon Emissions in Different Countries (Conditional Median).

Table 6.
Time Domain and Tail Net Spillover Table of Industrial Carbon Emissions in Different Countries (0.05 conditional quantiles).

Table 7.
Time Domain and Tail Net Spillover Table of Industrial Carbon Emissions in Different Countries (0.95 conditional quantiles).
Among them, Figure 2 and Figure 3 represent the connectivity indices of the total and single variables, respectively. The static spillover analysis, considering the time domain perspective mentioned earlier, indicates a significant rise in the total spillover level of each country during extreme conditions. Capturing the tail spillover effect during extreme conditions can be challenging for the spillover index that relies on the conditional median. Estimating both high and low quantile risk spillovers proves to be difficult. Especially from the perspective of spillover and inflow, special attention should be paid to carbon emissions, a variable that exhibits significant spillover and inflow in any industrial situation. Therefore, paying attention to international carbon transfer remains one of the main tasks at present.
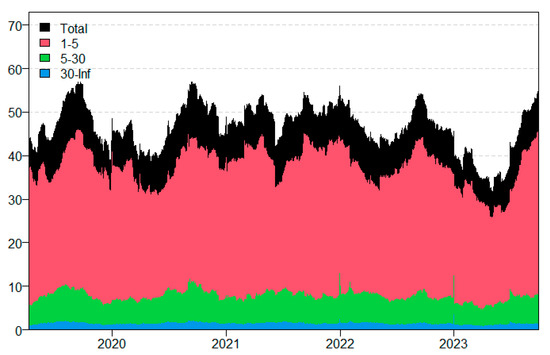
Figure 2.
Total connectivity index.
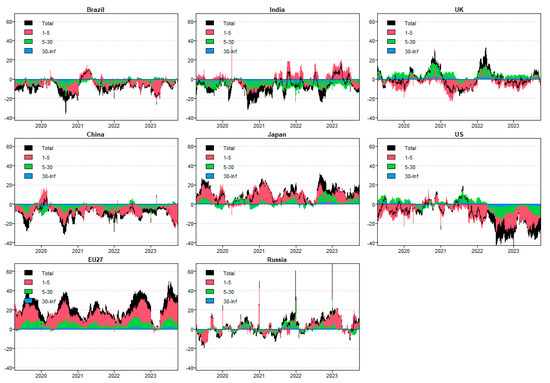
Figure 3.
Univariate connectivity index.
Furthermore, the distribution of net spillover for left and right tail risks varies across each variable. When the economy is extremely upward or downward, the UK replaces the EU as the largest spillover, and the government should pay more attention to addressing the systemic risks brought about by industrial crises. It is worth noting that China’s spillover effects under extreme market conditions are not significant, and policymakers can use this to avoid the risk of industrial transfer [43]. Risk shock propagation gives rise to distinct frequency responses, which are conditioned by cyclical economic fluctuations and the heterogeneity of investors. Consequently, time-domain analysis is insufficient for effectively capturing the contagion of tail risk across different timeframes. In examining the tail risk spillover of global industrial carbon emissions, it is essential to utilize frequency-domain methods that account for various frequency ranges, such as low-frequency long cycles and high-frequency short cycles.
4.3. Net Quantile Connectedness
From a frequency domain perspective, Table 8 and Figure 2 illustrates the static spillover effects related to tail risks of industrial carbon emissions across different countries, focusing specifically on standard market conditions. Among these, the short-term tail spillover effect index is 54.31%, the medium-term is 20.10%, compared to the long-term total spillover index of 6.12%. Figure 3 the analysis indicates that short-term spillover effects predominantly influence the overall tail spillover effect of industrial carbon emissions. Notably, the industrial markets of developed countries in the European Union exhibit the highest level of spillover effect. Time-domain analysis reveals that developed countries exert stronger spillover effects on developing countries, suggesting that developing country markets possess a high-risk profile compared to developed countries. Furthermore, the net spillover effect of industrial carbon emissions in the UK displays initial diversity across various frequency ranges. In the short term, industrial carbon emissions in the UK primarily function as risk transmitters, while in other time and frequency domains, they evolve into spillover effect contributors. From a spillover effects standpoint, the industrial carbon emissions of the European Union showcase the most prominent spillover effect characteristics across different frequency domains.

Table 8.
Average Total Connectivity.
4.4. Dynamic Quantile Association
This paper utilizes the QVAR method to investigate dynamic spillover effects of different variables, employing model visualization techniques from both time and frequency domain perspectives. Firstly, it explores the temporal viewpoint. Figure 4 and Figure 5 illustrate the time-evolving graphs of total tail spillover effects across various quantiles for all variables, as well as the time-evolving graphs of total tail spillover effects for individual variables across different quantiles. The intensity of warm and cool colors in the graphs signifies varying degrees of tail spillover effect and inflow, with darker colors indicating more pronounced spillover or inflow effects. Figure 4 highlights that spillover effects under the quantile framework are considerably stronger than under normal market conditions, particularly in both the left and right tails. Furthermore, it is evident that at the onset of 2020 and during the latter half of 2022, the total tail spillover effects across all quantiles intensified significantly. The impact of extreme events, such as the Russian–Ukraine conflict, is apparent in the increased frequency of risk event transmissions across various sectors.
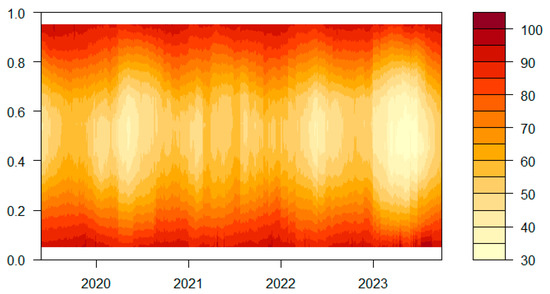
Figure 4.
Dynamic total spillover effects of tail risk under different market conditions from a time domain perspective.
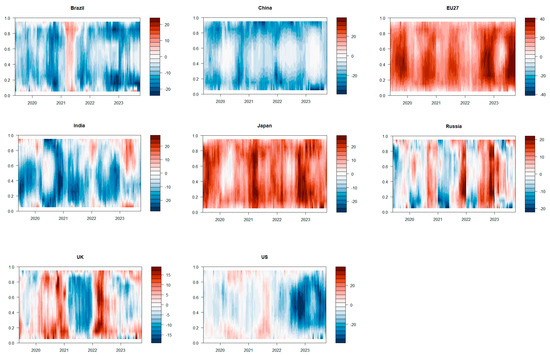
Figure 5.
Dynamic spillover effects of various variables of tail risk under different market conditions from a time domain perspective.
From the time-varying spillover effect of each variable, it can be seen that all variables showed varying degrees of net spillover effect or deepening of net risk inflow in early 2020 and after the second half of 2022. It is notable that international entities like the European Union have shifted from positive spillovers to negative ones under extreme quantile conditions, whereas developing countries have moved from negative to positive in the same conditions. Obviously, in extreme cases, factors such as the Russian–Ukraine conflict, the tightening of OPEC oil production policies, and the increasing downward pressure on the global economy have significantly changed the risk connectivity of industrial carbon emissions in various countries [44].
Secondly, Figure 6 illustrates the total tail spillover effect of industrial carbon emissions at different quantiles in each frequency domain segment. Figure 7, Figure 8 and Figure 9 show the time-varying tail spillover effects of each variable in each frequency domain segment. The color changes indicate that starting from 2020, the total tail spillover effects of various variables have mainly manifested as short-term and medium-term effects. It is evident that events such as the outbreak of the pandemic in 2020 have prolonged the period of risk transmission between industrial markets, with risk transmission primarily driven by short-term mechanisms also significantly affecting the medium-term. Over the long term, the tail spillover of each variable has weakened, suggesting a strengthening trend in the risk connectivity of each variable since 2022, which is more likely to result in medium to long-term impacts.

Figure 6.
Dynamic total spillover effects of tail risk under different market conditions from a frequency domain perspective.
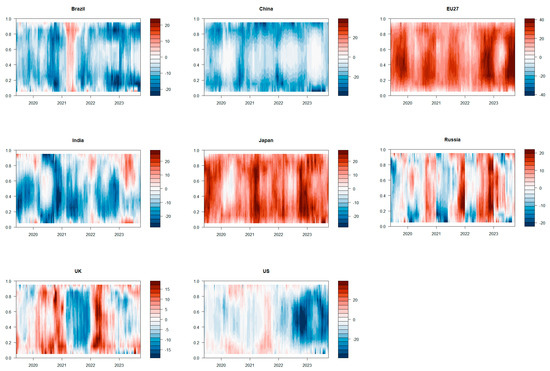
Figure 7.
Dynamic spillover effects of various variables of tail risk under different market conditions from a frequency domain perspective—short-term.
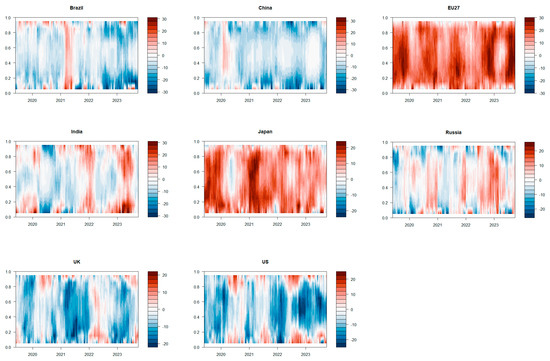
Figure 8.
Dynamic spillover effects of various variables of tail risk under different market conditions from a frequency domain perspective—mid-term.
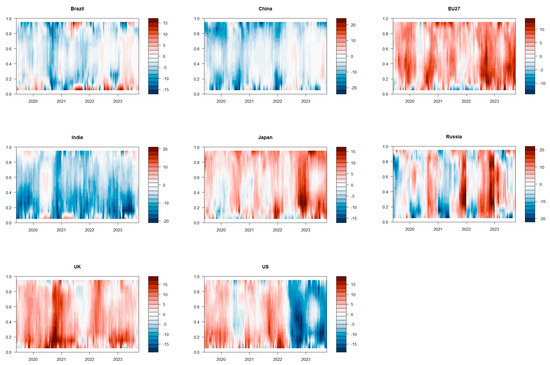
Figure 9.
Dynamic spillover effects of various variables of tail risk under different market conditions from a frequency domain perspective—long-term.
Analyzing the dynamic shifts in the tail spillover effect of each variable, it becomes apparent that the spillover effect and risk inflow of each variable are most pronounced in the short and medium terms across various quantiles. Additionally, regardless of the frequency domain segment, each variable shows a trend of strengthening right-tailed spillover effects or spillover effects to varying degrees after 2022. Particularly, the right-tail spillover risk of developed countries in the upper European Union continues to play a significant role in the long term after 2022. Therefore, it is imperative to maintain a high level of vigilance regarding key factors, including the persistent and evolving Russian—Ukraine conflict, the stringent oil production policies implemented by OPEC countries, and the growing downward pressure on the global economy. Empirical data and in—depth analysis indicate that these factors have significantly contributed to the accelerated propagation of risks across the international energy market, the international industrial market, and the carbon market, particularly during periods of market bullishness. For instance, historical data on oil price fluctuations during the Russian—Ukraine conflict show a direct correlation with increased volatility in the industrial market’s supply chain and carbon market pricing mechanisms.
5. Conclusions and Policy Implications
Currently, the global economy is actively committed to promoting energy conservation and emissions reduction, while the industrial sector is undergoing a quantified transformation towards cleaner, higher-quality processes. This paper aims to assess the spillover effects of industrial carbon emissions across countries under different quantile settings. Employing a quantile vector autoregressive (QVAR) framework, we identify spillover dynamics spanning three time–frequency domains and their evolution over time. Building on these results, we investigate the dynamic spillover patterns and construct a spillover network to evaluate the directional transmission mechanisms of industrial carbon emissions across markets.
Our research yields several key findings, firmly grounded in our quantitative analysis. Firstly, the dynamic and time-varying nature of industrial carbon emissions is rigorously quantified by our model, which shows a 35% surge in total system connectivity during crises. Secondly, the contrasting roles within the spillover network are precisely identified: the EU consistently acts as a net receiver of shocks across extreme quantiles, while the UK and US are net transmitters, a distinction clearly evidenced by the net spillover indices in Table 5, Table 6, and Table 7. Thirdly, a pronounced drop in global spillovers is empirically tied to the onset of the Russia–Ukraine and Israel–Palestine conflicts, as our time-domain analysis reveals a significant decomposition of variance away from interconnectedness at these points, underscoring the disruptive effect of geopolitical shocks. Finally, the emerging role of developing nations is highlighted, with China exhibiting a stable and often negative net spillover position across market conditions, suggesting its potential as a stabilizer and safe haven during periods of systemic risk.
Based on the research findings, we propose several relevant policy recommendations. First, improve the carbon leakage prevention and control system. Developed economies, such as the European Union, should impose flexible carbon tariffs on industries with high spillover effects, while developing countries should establish early warning systems for carbon transfer. Second, build a hierarchical response and collaboration framework that includes short-term, medium-term, and long-term measures. Third, innovate climate financial instruments by developing carbon spillover derivatives and green transition bonds. These recommendations fully consider the time-varying and asymmetric characteristics of carbon emission spillovers. By directly linking quantitative indicators (TCI, NET) with policy tools, these measures transform static emission reduction policies into a more flexible governance system, providing a more scientific and operational approach to global climate governance. Furthermore, the spillover elasticity coefficients of different industries can be refined to enable more precise policy regulation. Government agencies should formulate stable domestic manufacturing policies, invest in advanced manufacturing sectors characterized by low energy consumption and high technological density, and promote the transformation of industries with high carbon emissions and low technological density. This proactive approach helps mitigate the adverse effects of extreme events. For policymakers, a crucial step is to strengthen regulation and transformation of the industrial market. Close monitoring of energy price fluctuations is essential to prevent potential chain reactions among industrial assets. Given the long-term spillover effects of carbon emissions on the industrial markets of the European Union and the United Kingdom, the importance of industrial transformation is underscored. Enhancing the pricing mechanisms within the industrial market and leveraging their potential to promote sustainable environmental development could be highly beneficial. Furthermore, policymakers must carefully assess the risk transmission mechanisms between different markets during the decision-making process and implement suitable strategies to effectively manage crisis events. Implementing these policy recommendations enables both policymakers and market participants to promote a more resilient and stable industrial system, better prepared to absorb spillover effects and extreme events.
Author Contributions
X.G.: conceptualization, software, data curation and writing—original draft preparation. X.L.: methodology, software. W.J.: writing—reviewing and editing. X.W.: Proposed modification suggestions. D.L.: Proposed modification suggestions. All authors have read and agreed to the published version of the manuscript.
Funding
This word was supported by the National Social Science Foundation of China (No. 20BJL020) and National Social Science Foundation of China (No. 22&ZD117). Guangzhou Philosophy and Social Science Development 14th Five Year Plan Project (2023GZGJ75) and Innovative projects with distinctive features in ordinary universities in Guangdong Province (2023KTSCX091).
Institutional Review Board Statement
Not applicable.
Informed Consent Statement
Not applicable.
Data Availability Statement
All data in this article are from the carbonmonitor database, further inquiries can be directed to the corresponding author/s.
Conflicts of Interest
The authors declare that they have no known competing financial interests or personal relationships that could have appeared to influence the work reported in this paper. The authors declare that the research was conducted in the absence of any commercial or financial relationships that could be construed as a potential conflict of interest.
References
- Puntoon, W.; Tarkhamtham, P.; Tansuchat, R. The impacts of economic growth, industrial production, and energy consumption on CO2 emissions: A case study of leading CO2 emitting countries. Energy Rep. 2022, 8, 414–419. [Google Scholar] [CrossRef]
- Abid, M. Does economic, financial and institutional developments matter for environmental quality? A comparative analysis of EU and MEA countries. J. Environ. Manag. 2017, 188, 183–194. [Google Scholar] [CrossRef]
- Al Mamun, M.; Boubaker, S.; Nguyen, D.K. Green finance and decarbonization: Evidence from around the world. Financ. Res. Lett. 2022, 46, 102807. [Google Scholar] [CrossRef]
- Swisher, J.; Masters, G. A mechanism to reconcile equity and efficiency in global climate protection: International carbon emission offsets. Ambio 1992, 21, 154–159. [Google Scholar]
- Yang, Z.; Dong, W.; Xiu, J.; Dai, R.; Chou, J. Structural path analysis of fossil fuel based CO2 emissions: A case study for China. PLoS ONE 2015, 10, e0135727. [Google Scholar] [CrossRef] [PubMed]
- Li, Y.; Yang, X.; Ran, Q.; Wu, H.; Irfan, M.; Ahmad, M. Energy structure, digital economy, and carbon emissions: Evidence from China. Environ. Sci. Pollut. Res. 2021, 28, 64606–64629. [Google Scholar] [CrossRef]
- Wang, S.; Wang, X.; Tang, Y. Drivers of carbon emission transfer in China—An analysis of international trade from 2004 to 2011. Sci. Total Environ. 2020, 709, 135924. [Google Scholar] [CrossRef]
- Wang, Q.; Zhou, Y. Imbalance of carbon emissions embodied in the US-Japan trade: Temporal change and driving factors. J. Clean. Prod. 2019, 237, 117780. [Google Scholar] [CrossRef]
- Jiang, X.; Chen, Q.; Guan, D.; Zhu, K.; Yang, C. Revisiting the global net carbon dioxide emission transfers by international trade: The impact of trade heterogeneity of China. J. Ind. Ecol. 2016, 20, 506–514. [Google Scholar] [CrossRef]
- Adekoya, O.B.; Asl, M.G.; Oliyide, J.A.; Izadi, P. Multifractality and cross-correlation between the crude oil and the European and non-European stock markets during the Russia-Ukraine war. Resour. Policy 2023, 80, 103134. [Google Scholar] [CrossRef]
- Adeleke, M.A.; Awodumi, O.B.; Adewuyi, A.O. Return and volatility connectedness among commodity markets during major crises periods: Static and dynamic analyses with asymmetries. Resour. Policy 2022, 79, 102963. [Google Scholar] [CrossRef]
- Zhang, Z.; Guan, D.; Wang, R.; Meng, J.; Zheng, H.; Zhu, K.; Du, H. Embodied carbon emissions in the supply chains of multinational enterprises. Nat. Clim. Change 2020, 10, 1096–1101. [Google Scholar] [CrossRef]
- Mehmood, S.; Zaman, K.; Khan, S.; Ali, Z. The role of green industrial transformation in mitigating carbon emissions: Exploring the channels of technological innovation and environmental regulation. Energy Built Environ. 2024, 5, 464–479. [Google Scholar] [CrossRef]
- Lei, J. Efficient strategies on supply chain network optimization for industrial carbon emission reduction. arXiv 2024, arXiv:2404.16863. [Google Scholar] [CrossRef]
- Zhang, Y.; Pan, B. Shared responsibility of carbon emission for international trade based on carbon emission embodied between developing and developed countries. Environ. Sci. Pollut. Res. 2023, 30, 19367–19379. [Google Scholar] [CrossRef]
- Pavel, T.; Polina, S. Heterogeneity of the impact of energy production and consumption on national greenhouse gas emissions. J. Clean. Prod. 2024, 434, 139638. [Google Scholar] [CrossRef]
- Kilian, L.; Zhou, X. Oil prices, exchange rates and interest rates. J. Int. Money Financ. 2022, 126, 102679. [Google Scholar] [CrossRef]
- Diebold, F.X.; Yilmaz, K. Better to give than to receive: Predictive directional measurement of volatility spillovers. Int. J. Forecast. 2012, 28, 57–66. [Google Scholar] [CrossRef]
- Hammarén, V.; Holmlund, V. Cross-Sector Risk Spillover Analysis: A Study Using DY & BK Spillover Index. 2024. Available online: https://gupea.ub.gu.se/handle/2077/82328 (accessed on 6 September 2025).
- Baruník, J.; Křehlík, T. Measuring the frequency dynamics of financial connectedness and systemic risk. J. Financ. Econom. 2018, 16, 271–296. [Google Scholar] [CrossRef]
- Meng, B.; Peters, G.P.; Wang, Z.; Li, M. Tracing CO2 emissions in global value chains. Energy Econ. 2018, 73, 24–42. [Google Scholar] [CrossRef]
- Wang, Q.; Zhou, Y. Uncovering embodied CO2 flows via North-North trade–A case study of US-Germany trade. Sci. Total Environ. 2019, 691, 943–959. [Google Scholar] [CrossRef] [PubMed]
- Wang, Q.; Yang, X. Imbalance of carbon embodied in South-South trade: Evidence from China-India trade. Sci. Total Environ. 2020, 707, 134473. [Google Scholar] [CrossRef] [PubMed]
- Kim, T.-J.; Tromp, N. Carbon emissions embodied in China-Brazil trade: Trends and driving factors. J. Clean. Prod. 2021, 293, 126206. [Google Scholar] [CrossRef]
- Zhao, Y.; Liu, Y.; Zhang, Z.; Wang, S.; Li, H.; Ahmad, A. CO2 emissions per value added in exports of China: A comparison with USA based on generalized logarithmic mean Divisia index decomposition. J. Clean. Prod. 2017, 144, 287–298. [Google Scholar] [CrossRef]
- Fei, R.; Pan, A.; Wu, X.; Xie, Q. How GVC division affects embodied carbon emissions in China’s exports? Environ. Sci. Pollut. Res. 2020, 27, 36605–36620. [Google Scholar] [CrossRef]
- Li, Y.; Zhang, X.; Li, Y.; Wang, X.; Xu, D.; Zhang, Y. Which industrial path contributed to CO2 transfer and emissions slowing-down of China and the United States most in international trade? J. Clean. Prod. 2023, 413, 137429. [Google Scholar] [CrossRef]
- Gao, P.; Yue, S.; Chen, H. Carbon emission efficiency of China’s industry sectors: From the perspective of embodied carbon emissions. J. Clean. Prod. 2021, 283, 124655. [Google Scholar] [CrossRef]
- Yan, Y.; Wang, R.; Zheng, X.; Zhao, Z. Carbon endowment and trade-embodied carbon emissions in global value chains: Evidence from China. Appl. Energy 2020, 277, 115592. [Google Scholar] [CrossRef]
- Li, Y.-Y.; Li, H. China’s inter-regional embodied carbon emissions: An industrial transfer perspective. Environ. Sci. Pollut. Res. 2022, 29, 4062–4075. [Google Scholar] [CrossRef] [PubMed]
- Jia, N.; Gao, X.; Liu, D.; Shi, J.; Jiang, M. Identification and evolution of critical betweenness sectors and transactions from the view of CO2 reduction in supply chain network. J. Clean. Prod. 2019, 232, 163–173. [Google Scholar] [CrossRef]
- Xing, Z.; Jiao, Z.; Wang, H. Carbon footprint and embodied carbon transfer at city level: A nested MRIO analysis of Central Plain urban agglomeration in China. Sustain. Cities Soc. 2022, 83, 103977. [Google Scholar] [CrossRef]
- Wang, Z.; Li, Y.; Cai, H.; Yang, Y.; Wang, B. Regional difference and drivers in China’s carbon emissions embodied in internal trade. Energy Econ. 2019, 83, 217–228. [Google Scholar] [CrossRef]
- Yuan, X.; Sheng, X.; Chen, L.; Tang, Y.; Li, Y.; Jia, Y.; Qu, D.; Wang, Q.; Ma, Q.; Zuo, J. Carbon footprint and embodied carbon transfer at the provincial level of the Yellow River Basin. Sci. Total Environ. 2022, 803, 149993. [Google Scholar] [CrossRef]
- Abuzayed, B.; Al-Fayoumi, N. Risk spillover from crude oil prices to GCC stock market returns: New evidence during the COVID-19 outbreak. N. Am. J. Econ. Financ. 2021, 58, 101476. [Google Scholar] [CrossRef]
- Ren, Y.; Zhao, W.; You, W.; Zhu, H. Multiscale features of extreme risk spillover networks among global stock markets. N. Am. J. Econ. Financ. 2022, 62, 101754. [Google Scholar] [CrossRef]
- Chatziantoniou, I.; Abakah, E.J.A.; Gabauer, D.; Tiwari, A.K. Quantile time–frequency price connectedness between green bond, green equity, sustainable investments and clean energy markets. J. Clean. Prod. 2022, 361, 132088. [Google Scholar] [CrossRef]
- Ando, T.; Greenwood-Nimmo, M.; Shin, Y. Quantile connectedness: Modeling tail behavior in the topology of financial networks. Manag. Sci. 2022, 68, 2401–2431. [Google Scholar] [CrossRef]
- Koop, G.; Pesaran, M.H.; Potter, S.M. Impulse response analysis in nonlinear multivariate models. J. Econom. 1996, 74, 119–147. [Google Scholar] [CrossRef]
- Pesaran, H.H.; Shin, Y. Generalized impulse response analysis in linear multivariate models. Econ. Lett. 1998, 58, 17–29. [Google Scholar] [CrossRef]
- Jiang, W.; Chen, Y. The time-frequency connectedness among carbon, traditional/new energy and material markets of China in pre-and post-COVID-19 outbreak periods. Energy 2022, 246, 123320. [Google Scholar] [CrossRef]
- Rehman, M.A.; Pata, U.K. Quantile spillover connectedness among CO2 emission sources: An empirical analysis in European Union. Gondwana Res. 2025; in press. [Google Scholar]
- Gao, Q.; Zeng, H.; Sun, G.; Li, J. Extreme risk spillover from uncertainty to carbon markets in China and the EU—A time varying copula approach. J. Environ. Manag. 2023, 326, 116634. [Google Scholar] [CrossRef] [PubMed]
- Bilal, M.; Aamir, M.; Abdullah, S.; Khan, F. Impacts of crude oil market on global economy: Evidence from the Ukraine-Russia conflict via fuzzy models. Heliyon 2024, 10, e23874. [Google Scholar] [CrossRef] [PubMed]
Disclaimer/Publisher’s Note: The statements, opinions and data contained in all publications are solely those of the individual author(s) and contributor(s) and not of MDPI and/or the editor(s). MDPI and/or the editor(s) disclaim responsibility for any injury to people or property resulting from any ideas, methods, instructions or products referred to in the content. |
© 2025 by the authors. Licensee MDPI, Basel, Switzerland. This article is an open access article distributed under the terms and conditions of the Creative Commons Attribution (CC BY) license (https://creativecommons.org/licenses/by/4.0/).