Abstract
The aim of the study was to evaluate the feasibility of using exhaust gases as a CO2 source in the cultivation of Tetraselmis subcordiformis microalgae for biomass and hydrogen production. It was shown that the growth rate of T. subcordiformis biomass and its biochemical composition depended on the CO2 source. The highest growth rate of 286 ± 15 mgVS/L-d and a final biomass concentration of 2710 ± 180 mgVS/L were achieved in the variant where exhaust gases from a coal and biomass supplementary combustion plant were the CO2 source (V2). The highest CO2 reduction efficiency of 90.3 ± 3.2% was achieved in the case where waste gases from biogas combustion were the CO2 source (V1). In V2, the highest CO2 utilization efficiency was achieved (CO2UE = 46.7 ± 2.4%). Analyzing the biomass composition confirmed differences in total carbon content (TC) and polysaccharide fraction. The highest H2 production efficiency and rate, which were 70.9 ± 2.7 mL/gVS and 2.27 ± 0.08 mL/gVS·h, respectively, were obtained in V2. The results obtained indicate the possibility of integrating fuel combustion processes with the cultivation of T. subcordiformis and photobiological H2 production, which is a promising solution in the context of climate neutrality and the implementation of circular economy postulates. This approach demonstrates a sustainable strategy for linking industrial CO2 emissions with the production of renewable biohydrogen and thus contributes to climate protection and the promotion of circular economy concepts.
1. Introduction
The rising concentration of greenhouse gases in the atmosphere, particularly carbon dioxide (CO2), represents one of the major environmental challenges of the 21st century. In 2023, average CO2 levels reached 421 ppm, approximately 50% higher than in the pre-industrial era [1]. In light of the need to reduce greenhouse gas emissions and the ambition to achieve carbon neutrality by 2050, technologies enabling efficient utilization of CO2 streams as feedstocks for industrial processes are increasingly important [2]. Approaches that simultaneously reduce emissions and generate renewable energy, in line with circular economy principles, are particularly promising [3,4]. One such strategy involves using CO2 from exhaust gases to cultivate microalgae, which can then be applied in the photobiological production of biofuels [4], including hydrogen [5], methane [6], biodiesel [7], or biomass for thermal energy conversion [8]. Biogas, once purified and combusted, typically produces an exhaust stream containing 5–15% CO2 by volume, along with water vapor and trace amounts of NOx and SO2 that can be removed or neutralized. In comparison, exhaust from fossil fuel or coal-biomass co-combustion plants can contain up to 16–17% CO2 [9]. The CO2 from biogas is part of the short carbon cycle, and its use in microalgae cultivation enhances the overall energy efficiency of the system [10]. In contrast, for co-combustion of coal and biomass, only CO2 from biomass contributes to the short carbon cycle, while fossil carbon emissions remain a net burden [11].
Microalgae such as the green alga Tetraselmis subcordiformis exhibit high photosynthetic rates. Maximum biomass productivity can reach 0.4–0.6 g/L·d [12], and the species tolerates elevated CO2 levels, often up to 10–15%, without significant growth reduction [13]. T. subcordiformis is also capable of photobiological hydrogen production under anaerobic conditions. Hydrogenases catalyze the reduction in protons to hydrogen molecules, utilizing electrons from water photolysis or cellular metabolites like NADH [14]. These enzymes are activated under sulfur-limited conditions, which inhibit photosystem II, enhance cyclic electron flow, and initiate water photoreduction [15]. Under optimal conditions, immediate hydrogen production rates of 4–6 mmol H2/g TS·d have been observed, with total yields exceeding 50 mL H2/L culture in long-term experiments [13].
The species combines high photosynthetic efficiency, rapid biomass growth, and resilience to variable environmental conditions, making it a promising candidate for biohydrogen production [16]. For example, cultivation in a medium containing effluent from soilless tomato production achieved a biomass concentration of 3030 ± 183 mg VS/L and a chlorophyll-a content of 67.9 ± 3.5 mg/L [17]. The growth rate during the logarithmic phase was 270 ± 16 mg VS/L·d, and hydrogen production reached 161 ± 8 mL, with an average rate of 4.67 ± 0.23 mL/h [17]. In another study, using CO2 from the anode chamber of microbial fuel cells (MFC) as the carbon source resulted in optimal growth at 220 ± 8 mg CO2/L. Under these conditions, the biomass growth rate reached 0.52 ± 0.03 g VS/L·d, chlorophyll-a content was 11.54 ± 0.42 mg/L·d, final biomass concentration was 2.68 ± 0.10 g VS/L, and H2 production totaled 312 ± 38 mL, corresponding to 62.4 ± 6.1 mL/d [18].
Previous studies integrating CO2 biosequestration from waste gases with microalgae cultivation mainly focused on biomass production for fertilizers [19], animal feed [20], or biodiesel from lipid accumulation [21]. Research on photobiological biohydrogen production is less common, particularly when using CO2 directly from power plant exhaust streams [22]. To date, the scientific literature has not provided comprehensive analyses on the use of T. subcordiformis for capturing CO2 from real exhaust gases, whether from biogas combustion or conventional municipal heating plants. In particular, studies integrating the assessment of CO2 assimilation efficiency with simultaneous evaluation of biomass growth dynamics, changes in biochemical composition, and the impact of these parameters on secondary biohydrogen production via water photoreduction are lacking. Most previous research has focused on laboratory-scale cultivation using pure CO2 streams, which does not reflect the complexity of real exhaust gases containing toxic components, variable gas concentrations, and particulate matter.
This study investigates for the first time the utilization of CO2 from biogas combustion and the co-combustion of coal and biomass as an inorganic carbon source in the autotrophic culture of T. suncordiformis for biohydrogen production. The growth of the biomass, the macromolecular composition and the H2 production were analyzed under laboratory conditions with exhaust gas injection and provide insights for integrated energy–biotechnology systems that combine biohydrogen with CO2 emission reduction.
2. Materials and Methods
2.1. Research Organization
The research was conducted on a laboratory scale. The experiments were divided into two stages (S). In the first stage (S1), T. subcordiformis was cultured using different carbon dioxide (CO2) sources. The research focused on the evaluation of CO2 biosequestration efficiency, carbon dioxide utilization efficiency and monitoring the yield and kinetics of microalgae biomass production. The produced T. subcordiformis biomass was then separated from the culture medium by sedimentation. In the second stage (S2), the T. subcordiformis biomass was transferred to anaerobic respirometric bioreactors, which were fed with a new culture medium (for biohydrogen production) and stimulated to produce H2. The experimental work carried out in S2 focused on evaluating the yield and kinetics of H2 production. Each S was divided into three variants (V) whose isolation criterion was the source of CO2 supplied to the culture system. In variant 1 (V1), the CO2 source consisted of waste gases from biogas combustion in a gas furnace. In variant 2 (V2), desulphurized waste gases from the co-combustion of coal and biomass in a municipal heating plant were used. In variant 3 (V3), the T. subcordiformis culture was fed with atmospheric air. The organizational scheme of the experimental work is shown in Figure 1.
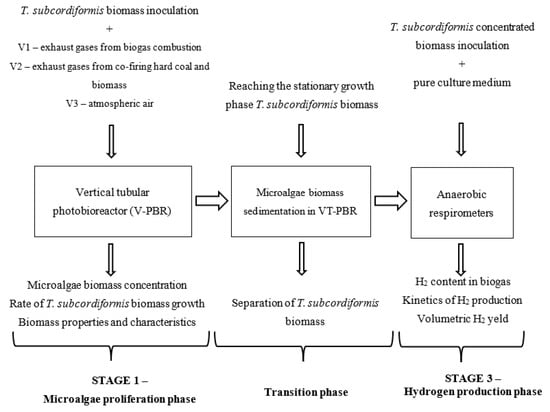
Figure 1.
Organization chart of the experimental work carried out.
2.2. Materials
2.2.1. T. subcordiformis Biomass
The microalgal strain T. subcordiformis SAG 161-1a was obtained from the University of Göttingen algae culture collection (SAG, Goettingen, Germany) [23]. To obtain sufficient biomass for the experimental procedures, the culture was initially propagated under controlled laboratory conditions. Microalgae were first grown in sterile 50 mL glass tubes (Biospace, Poznań, Poland) and subsequently transferred to 1.0 L glass bioreactors (Duran Bottle System, Mainz, Germany) for further scale-up. All laboratory glassware was sterilized in a 2840 EL-D autoclave (Tuttnauer, New York, NY, USA) at 121 °C for 15 min prior to use.
2.2.2. Culture Medium Used in S1 (Biomass Production)
The composition of the synthetic medium in S1, as described by Guan et al. [24], comprised: 100.00 mg/L NaNO3, 20.00 mg/L NaH2PO4, 1.30 mg/L FeCl3, 33.60 mg/L H3BO3, 45.00 mg/L EDTA, 0.36 mg/L MnCl2, 0.21 mg/L ZnCl2, 0.20 mg/L CuSO4, 0.20 mg/L CoCl2, 0.09 mg/L (NH4)4Mo7O24, and vitamins 1.00 μg/L VB1 and 0.10 μg/L VB12. The salt content in the medium was 30–33 ppt, while the pH was 8.00–8.20.
2.2.3. Culture Medium Used in S2 (Biohydrogen Production)
For all experiments in S2, the medium used for hydrogen production was prepared using deionized water and analytical-grade chemical reagents, with the following composition: 27.23 mg/L NaCl, 5.079 mg/L MgCl2, 1.123 mg/L CaCl2, 0.667 mg/L KCl, 0.196 mg/L NaHCO3, 0.098 mg/L H3BO3, 0.098 mg/L KBr, 0.024 mg/L SrCl2, 0.003 mg/L NaF and 0.002 mg/L CuCl2. The pH value of the medium was kept in the range of 7.90–8.00. The composition of the medium in S2 was based on literature data and previous studies by the authors.
2.2.4. Carbon Dioxide (CO2) Sources
In variant V1, exhaust gases derived from the combustion of biogas produced at a commercial agricultural biogas plant (53°36′03.31427″ N, 020°36′12.86527″ E) were cooled to 20 °C before use. The biogas was produced in a fermentation reactor fuelled with cattle manure, maize silage and grass, operating under mesophilic conditions. The basic technological parameters for the operation of the biogas plant were as follows: Organic compound load (OLR) ≈ 2.4 kgVS/m3·d, hydraulic retention time (HRT) ≈ 40 days, process temperature approx. ≈ 39 °C, substrate dosing twice daily with a frequency of every 12 h, complete mixing with vertical axis mixers and total plant power ≈ 30 kWe. The composition of the purified biogas fed to the Bentone BG Biogas ~30 kW gas furnace (Bentone AB, Enertech Group, Ljungby, Sweden) contained 63.1 ± 1.2% CH4; 32.9 ± 1.7% CO2; 70 ± 5 ppm H2S; 1.2 ± 0.3% O2 and 3.4 ± 0.6% N2. The average CO2 content in the flue gases was 13.4% ± 1.2%. In V2, exhaust gases cooled to 20 °C from a coal and biomass auxiliary combustion plant of the municipal thermal power plant in Olsztyn (53°74′77.64492″ N, 20°44′62.22156″ E) were used. The average CO2 content in the exhaust gases was 14.9% ± 1.7%. In V3, the T. subcordiformis culture was supplied with atmospheric air in which the CO2 concentration was approximately 420 ppm.
For variants V1 and V2, exhaust gases were collected daily and stored in sealed 70 L Tedlar bags. In all experimental setups, the CO2 mass flow supplied to the V-PBR was maintained at 8.0 mg CO2/min. The exhaust gases were introduced into the V-PBR using a peristaltic pump (FASTLoad Programmable Control Peristaltic Pump, VWR, Darmstadt, Germany) for V1 and V2, whereas in V3, a diaphragm pump (Mistral 200, Aqua Medic, Brentwood Essex, UK) with a flow rate of 10.8 L/min was employed. In V3, the air was discharged from the V-PBR reactor after passing through the culture medium, while in reactors V1 and V2 the exhaust gases were recirculated using a peristaltic pump (VWR Germany) with a capacity of 10.8 L/min. Therefore, the volume flow of gases through the culture medium was the same in all photobioreactors.
2.3. Photobioreactors for T. subcordiformis Biomass Cultivation (S1)
The experiments were carried out in vertically orientated V-PBR tubular reactors made of transparent acrylic glass (polymethyl methacrylate). The active volume of the culture medium was 10.0 L, while the gas space was 5.0 L. CO2 was introduced into the medium through a valve at the bottom of the reactor and the gas was vented through the top of the system. Each V-PBR was equipped with a pH probe that allowed continuous measurement. Daily measurements were performed and the data were subsequently compiled, averaged, and stored in the pH meter memory for further analysis. The vertical photobioreactor (V-PBR) was illuminated with 10 W white LED lamps (Leddy Slim, Aquael, Warsaw, Poland) with a color temperature of 900 K. The lighting system provided a luminous flux of 720 lm, corresponding to photosynthetically active radiation (PAR) of 270–300 μmol·m−2·s−1 within the 400–700 nm wavelength range. The photoperiod was set to 14 h of illumination followed by a 10 h dark phase each day, ensuring consistent light–dark cycles throughout the cultivation period. The temperature of both the incoming gases (air and exhaust) and the culture medium was carefully maintained at 20 ± 2 °C throughout the experiment.
2.4. Hydrogen Production Bioreactor (S2)
The biomass of T. subcordiformis, separated by gravity sedimentation, was transferred into 1.0 L respirometric reactors (OxiTop®-IDS, WTW, Weilheim, Germany) and incubated at a controlled temperature of 25 ± 1 °C. The reactor contents were continuously stirred at 60 rpm using magnetic stirrers, while changes in gas pressure were recorded every 10 h. Pressure measurements were subsequently converted to volumetric gas production under standard conditions using the ideal gas law. The biomass concentration in each experimental variant was determined by the amount of culture harvested from the S1 system. The experiment was conducted over 120 h, comprising a 30 h dark period followed by 90 h of illumination. The respirometers were illuminated with a 58 W linear fluorescent lamp (Philips Lighting MASTER TL-D Super 80, Philips Lighting, Eindhoven, The Netherlands) providing a color temperature of 6500 K.
2.5. Analytical, Computational and Statistical Methods
Samples for volatile solids (VS) and chlorophyll a (Chl-a) were taken at 48 h intervals. The VS content was determined gravimetrically by calcining the biomass in a muffle furnace at 550 °C (LAC L, Dąbrowica, Poland) and weighing the remaining ash (DanLab AX423, Białystok, Poland). The chlorophyll a concentration was determined using a fluorescence technique (Algae Online Analyser, bbe Moldanke, Schwentinental, Germany). Taxonomic analyses were performed using an MF 346 optical microscope equipped with an Optech 3MP camera (Eduko, Warsaw, Poland). The basic physicochemical parameters of the culture medium were determined using a DR 5000 UV/VIS spectrophotometer (Hach Lange, Düsseldorf, Germany). Salinity was measured with a Marine Control Digital device (Aqua Medic, Janików, Poland) and pH with a VWR meter (International, Radnor, PA, USA). Light intensity was measured with a HI 97500 Luxmeter (Hanna Instruments, Woonsocket, RI, USA). Total nitrogen (TN), total carbon (TC) and total organic carbon (TOC) were determined in the biomass samples dried at 105 °C using a Thermo Flash 2000 elemental analyser (Thermo Scientific, Waltham, MA, USA). Total phosphorus (TP) was determined colourimetrically after digestion in a mixture of H2SO4 and HClO4 using ammonium metavanadate (V) and ammonium molybdate (λ = 390 nm, DR 2800, Hach-Lange, Berlin, Germany). The total protein content was calculated as TN × 6.25. Lipids were extracted using the Soxhlet method with a Büchi B-811 device (BÜCHI Labortechnik, Flawil, Switzerland). Reducing sugars were determined colourimetrically with Anthron reagent (λ = 600 nm, DR 2800, Hach-Lange, Germany). Gas samples (CO2, O2, H2) were taken from the respirometers with a gas-tight syringe and analyzed with a GC 7890 A gas chromatograph (Agilent Technologies, Santa Clara, CA, USA). The exhaust gas composition was determined using a Testo 340 analyser (Testo Ltd., Alton, UK, EN 50379 certificate of conformity). The hydrogen production rate (r) and the kinetic constants (k) were determined using iterative non-linear regression. The carbon dioxide utilization efficiency (CO2UE) was calculated according to [25] using Equation (1):
where the coefficient 1.88 results from the adopted summary formula for microalgae biomass (CO0.48H183N0.11P0.01) [26]; (MPBR − M0) denotes the increase in dry biomass in the V-PBR and MCO2 is the mass of CO2 supplied. The MCO2 value was calculated as the total gas volume multiplied by the density ρCO2 = 1.8 g/L (28–30 °C, 105 Pa). The total CO2 volume (VCO2) was determined based on the efficiency of the pumps supplying CO2-containing gases (flow rate RGAM) and the gas analyser (molar fraction nCO2) (2):
All experiments were performed in quadruplicate. Statistical analyses were performed with Statistica 13.3 (Statsoft, Inc., Tulsa, OK, USA). The significance of differences was assessed with p = 0.05. Normality of distribution was tested using the Shapiro–Wilk test, homogeneity of variance was tested using the Levene test and differences between means were analyzed using a one-way analysis of variance (ANOVA). Tukey’s HSD test was used to identify significant differences between the groups.
3. Results and Discussion
3.1. T. subcordiformis Culture and Properties of the Obtained Biomass
Analysis of biomass concentration changes in T. subcordiformis over the cultivation period revealed a significant (p ≤ 0.05) effect of the CO2 source on growth dynamics. In variant V1, which was supplied with exhaust gases from biogas combustion, a 5-day lag phase was observed, followed by a 7-day exponential growth phase (Figure 2a). During this phase, the biomass growth rate reached 264 ± 11 mg VS/L·day, resulting in high biomass concentrations of approximately 2010 ± 69 mg VS/L at the end of exponential growth (Figure 2b). The subsequent 3-day stationary phase saw the biomass peak at 2660 ± 123 mg VS/L, followed by a short die-off phase with stabilization of the biomass (Figure 2c). These results indicate efficient utilization of CO2 for cellular biosynthesis, as reflected by both the growth rate and final biomass concentration (Figure 2d).
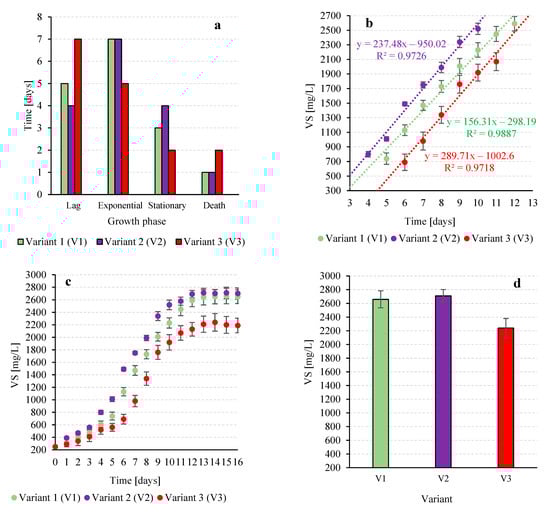
Figure 2.
Characteristics of changes in the concentration of volatile solids in the T. subcordiformis culture depending on the CO2 source: duration of the biomass growth phases (a), course of the linear growth phase (b), changes in the T. subcordiformis biomass concentration over time (c), the highest biomass concentrations obtained (d).
Previous studies on biogas combustion gases as a CO2 source have been conducted with Chlorella vulgaris [27] and Arthrospira platensis [28]. In these cases, biomass growth rates during the first 9 days of the logarithmic phase were 77.8 ± 3.1 mg VS/L·day, with concentrations reaching 745 ± 42 mg VS/L. Maximum biomass (754 ± 45 mg VS/L) was observed on day 13, after which the culture entered the death phase. For cyanobacteria, growth rates during the logarithmic phase were 148 ± 12 mg VS/L·day with air supply and 209 ± 17 mg VS/L·day when CO2 was supplied from exhaust gas [28].
In variant V2, supplied with waste gases from co-combustion of hard coal and biomass, the lag phase was slightly shorter (4 days, Figure 2a). The linear growth phase lasted 7 days, with the highest growth rate among all variants at 286 ± 9 mg VS/L·day (Figure 2b), reaching a biomass concentration of 2340 ± 42 mg VS/L. The stationary phase extended for 4 days, with a maximum biomass of 2710 ± 91 mg VS/L. The higher CO2 content in this variant enhanced growth dynamics and final biomass compared to V1 (Figure 2c,d). Similar results were reported for Chlorella sp. ABC-001 cultivated with CO2-enriched exhaust gases [29]. At 1% CO2, biomass reached 2330 mg VS/L, with no significant increase at 5% or 10% CO2 (2320 mg VS/L and 2200 mg VS/L, respectively). However, increasing the gas flux to 0.6 vvm at 10% CO2 raised biomass to 2900 mg VS/L, while 15% CO2 produced 2730 mg VS/L after 7 days. These findings highlight that efficient gas delivery, rather than higher CO2 concentration alone, plays a key role in optimizing biomass production [29].
Variant V3, supplied with atmospheric air, exhibited the longest lag phase of 7 days (Figure 2a) and the shortest linear growth phase of 5 days, with a growth rate of 230 ± 11 mg VS/L·day. Exponential phase biomass reached 1760 ± 123 mg VS/L, peaking at 2240 ± mg VS/L during the stationary phase (Figure 2b,d). Using atmospheric air as a CO2 source generally leads to lower growth rates and biomass productivity compared to CO2-enriched sources, and full photosynthetic potential typically requires CO2 concentrations between 400 and 1000 ppm [30]. In V1, a typical growth curve of T. subcordiformis was observed, which was characterized by the concentration of chlorophyll a in the culture medium. The adaptation phase (lag) lasted 4 days (Figure 3a), indicating a moderate period of time required for the physiological adaptation of cells to new environmental conditions [31]. During this time, the chlorophyll a concentration reached 24.9 ± 2.1 mgchl-a/L (Figure 3b). The intensification of chlorophyll a biosynthesis occurred in the exponential growth phase between day 4 and 11 of the culture (Figure 3a,b). During this period, an increase of over 62 mgchl-a/L was recorded, and the average growth rate was 9.9 ± 0.9 mgchl-a/L∙d. The stationary phase lasted 3 days and the maximum pigment concentration of 94.8 ± 4.2 mgchl-a/L was reached on day 15 (Figure 3c,d).
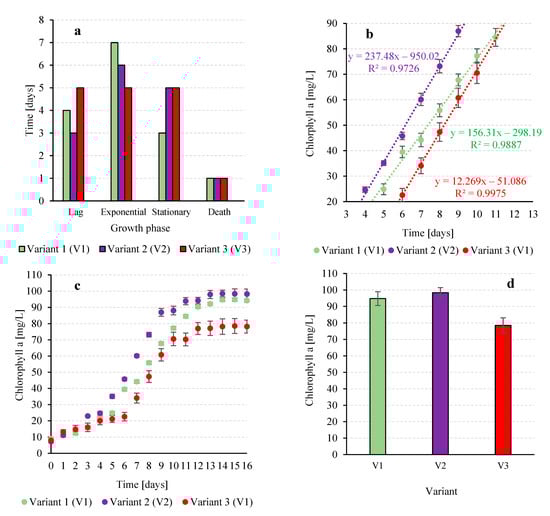
Figure 3.
Characteristics of chlorophyll a changes in the T. subcordiformis culture depending on the CO2 source: duration of the biomass growth phases (a), course of the linear growth phase (b), changes in the biomass concentration of T. subcordiformis over time (c), the highest biomass concentrations obtained (d).
The total increase in chlorophyll a concentration reached 85.19 ± mg chl-a/L, with an average growth rate of 9.94 mg chl-a/L·d throughout the cultivation period. Similar trends were reported by [18], where T. subcordiformis exhibited a daily biomass increase of 0.52 ± 0.03 g VS/L·d, accompanied by a chlorophyll a rise of 11.54 ± 0.42 mg chl-a/L·d, resulting in a total pigment content of 92.32 mg chl-a/L, comparable to the values obtained in our study.
The strongest chlorophyll a accumulation was observed in V2. Starting from 7.2 ± 0.1 mg chl-a/L (Figure 3c), the maximum reached 98.5 ± 3.1 mg chl-a/L on day 14. The adaptation phase was the shortest among all variants, lasting only 3 days (Figure 3a). A 6-day exponential phase followed, with an average growth rate of 12.4 ± 0.9 mg chl-a/L·d, about 25% higher than in V1. The stationary phase lasted 5 days, during which chlorophyll a stabilized near 100 mg chl-a/L, while the dieback phase caused minimal pigment loss (<0.3%) (Figure 3c).
In comparison, Ref. [32] investigated the effect of CO2 on Spirulina platensis PCC 9108. The highest chlorophyll a content (21.86 mg chl-a/L) was observed at 8% CO2. Despite a similar initial concentration (7.9 ± 0.1 mg chl-a/L), V3 showed the lowest chlorophyll a accumulation. The lag phase extended to 5 days, indicating a longer adaptation period, likely due to sub-optimal conditions (Figure 3a). During the exponential phase (days 5–10), chlorophyll an increased by ~49 mg chl-a/L at an average rate of 9.9 ± 0.2 mg chl-a/L·d (Figure 3b). The maximum pigment concentration on day 15 was 78.57 ± mg chl-a/L, about 20% lower than in V1 and more than 25% lower than in V2 (Figure 3c,d). The stationary phase lasted 5 days, but pigment growth was limited, and the final chlorophyll a concentration (78.21 ± 4.0 mg chl-a/L) remained significantly lower (p ≤ 0.05) than in the other variants. The overall average growth rate was 9.6 mg chl-a/L·d, the lowest among all tested conditions.
For comparison, Ref. [33] cultured local Scenedesmus sp. and Chlorella sp. strains on raw sewage with access to air containing 0.04% CO2. The highest chlorophyll a concentration was 19.04 mg chl-a/L for Scenedesmus sp., and 13.10 mg chl-a/L for Chlorella sp. on day 8. After the logarithmic growth phase ended (day 12), pigment content decreased to approximately 8.6–8.9 mg chl-a/L [33]. Analysis of the elemental and biochemical composition of T. subcordiformis biomass showed relatively stable values across the three experimental variants, although some differences indicate that gas supply conditions influenced microalgal metabolism (Table 1).

Table 1.
Characteristics of T. subcordiformis biomass depending on the experimental variant.
The content of volatile solids (VS) ranged from 88.3 ± 2.0% (V3) to 89.3 ± 1.7% (V1), confirming a high proportion of organic matter in the dry biomass and indicating good quality for energy conversion (Table 1). Differences between variants were statistically insignificant (p > 0.05), suggesting that organic composition remained stable regardless of growth conditions. Total nitrogen (TN) ranged from 46.3 ± 1.3 to 48.1 ± 4.1 mg/g TS, with the highest value in V3, corresponding to a protein content of 28.9 ± 0.9% TS (V2) to 30.0 ± 3.2% TS (V3) (Table 1). Although differences were not significant (p > 0.05), a trend toward higher protein accumulation was observed in V3, the variant with lower CO2 availability, possibly reflecting a metabolic shift toward nitrogen fraction synthesis under limited carbon conditions [34]. This aligns with previous observations that the C/N ratio in microalgae cells depends on inorganic carbon availability [35,36]. Specifically, when the C/N ratio is below 12:1, protein content in Chlorella vulgaris remains high (>57.3%), whereas ratios around 19:1 significantly reduce protein synthesis (p < 0.05) [36].
Total phosphorus (TP) ranged from 8.7 ± 0.9 mg/g TS (V1) to 9.1 ± 1.4 mg/g TS (V2), with differences within the measurement error, indicating that CO2 availability had little effect on phosphorus metabolism. The largest differences between variants were observed in total carbon (TC) and organic carbon (TOC). Variant V2 had significantly higher TC (577 ± 27 mg/g TS) and TOC (493 ± 12 mg/g TS) compared to V1 (539 ± 21 and 470 ± 17 mg/g TS) and V3 (554 ± 47 and 483 ± 29 mg/g TS) (Table 1). This suggests that higher CO2 availability promoted greater carbon accumulation and enhanced polysaccharide biosynthesis. Similar trends were reported in previous studies [27], where TC and TOC were highest in reactors supplied with 13.0 ± 1.0% CO2 and lowest under atmospheric air conditions.
Key biochemical fractions were largely comparable across variants (Table 1). Lipid content ranged from 7.2 ± 1.1% TS (V2) to 8.1 ± 1.9% TS (V3), suggesting that limited CO2 may have favored lipid synthesis as an alternative energy reserve. Sugar content was highest in V2 (37.2 ± 1.4% TS), consistent with the higher TC and TOC, reflecting intensified photosynthesis and carbohydrate accumulation under increased CO2 availability [37,38,39]. Overall, T. subcordiformis biomass composition was relatively stable. Significant differences (p < 0.05) were observed in TC, TOC, and the proportions of sugars and lipids. Variant V2, with more CO2-rich gas, favored carbon accumulation and polysaccharide synthesis, whereas limited CO2 in V3 slightly enhanced protein and lipid content (Table 1). These results indicate that inorganic carbon availability is a key determinant of the metabolic profile of microalgae, with direct implications for CO2 biosequestration efficiency and the potential use of biomass in bioenergy and value-added products.
3.2. CO2 Biofixation and pH Changes
Analysis of the composition of the gases fed to the V-PBR showed that the T. subcordiformis culture effectively bioassimilates CO2 and completely eliminates the pollutants contained in the exhaust gases. The concentrations of the main pollutants present in the tested exhaust streams at the inlet and outlet of the V-PBR are shown in Table 2.
Table 2.
Characteristics of the gas composition supplied to the V-PBR used for the cultivation of T. subcordiformis.
In V1, where biogas combustion gases were used, the CO2 concentration in the inflow was 13.4 ± 1.2%. In the effluent, it decreased to 1.3 ± 0.2%, corresponding to a removal efficiency of 90.3 ± 3.2% (Figure 4). The carbon dioxide utilization efficiency reached 43.1 ± 3.1% (Table 2). Oxygen levels increased from 8.2 ± 0.9% to 21.3 ± 0.4%, while nitrogen slightly rose from 75.8 ± 2.3% to 77.4 ± 0.8%. Initial concentrations of other monitored pollutants were CO—141 ± 14 ppm, NOx—145 ± 33 ppm, and SOx—83 ± 11 ppm; in the exhaust gas, these fell below the detection limit, indicating complete removal (100%) (Table 2). The high efficiency of CO2 removal may be partially explained by the potential role of the Target of Rapamycin (TOR) signaling pathway in regulating microalgal metabolism [40]. TOR is a key regulator of cell growth and resource allocation in eukaryotic cells, including microalgae, integrating signals related to nutrient availability, energy status, and environmental stress [41]. In the context of autotrophic cultivation of T. subcordiformis, the presence of elevated CO2 concentrations in the medium may stimulate the activity of photosynthetic enzymes, leading to enhanced carbon assimilation. By modulating protein synthesis and carbohydrate metabolism, the TOR pathway may facilitate efficient redistribution of carbon within the cell from photosynthetically fixed CO2, through cellular biomass, to energy-related metabolites, including those associated with H2 production [42]. In this way, TOR could support both high CO2 sequestration efficiency and the optimization of biomass and energy metabolite production under conditions of increased carbon availability, highlighting its potential role in the adaptation of microalgae to CO2-rich waste gas streams [43].
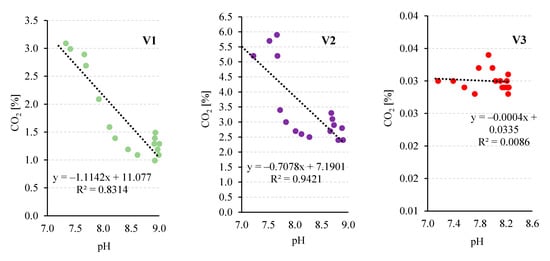
Figure 4.
CO2 concentration in the exhaust gases from the V-PBR and pH values in the culture medium during the cultivation of T. subcordiformis.
The decrease in CO2 concentration strongly correlated with a rapid pH increase in the medium from 7.20 ± 0.04 to 8.9–9.0 (Figure 4 and Figure 5), reflecting intensive CO2 uptake by the growing microalgae population. Biomass growth dynamics support this mechanism: the fastest increase occurred on days 5–10, coinciding with the sharpest CO2 decrease and pH rise, highlighting the link between photosynthetic CO2 assimilation and medium alkalisation [44].
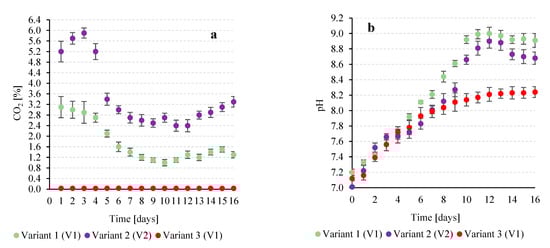
Figure 5.
Relationships between the observed CO2 concentration in the gases flowing out of the V-PBR (a) and the pH value (b) in the following experimental variants.
Alkalinisation primarily occurs through uptake of CO2 and HCO3−, but additional processes contribute. During growth, microalgae secrete extracellular polymeric substances (EPS) that bind cations (e.g., Ca2+, Mg2+, Na+), altering the local ion balance. This reduces free ion concentrations and shifts the carbonate equilibrium toward alkaline forms (HCO3− and CO32−) [45]. Furthermore, enzymatic activity, particularly of carbonic anhydrase on the cell surface, promotes the conversion CO2 ↔ HCO3−. Since photosynthetic CO2 consumption predominates, additional protons are removed from the solution, further increasing pH. Under air-saturated conditions, with low CO2 availability (~0.04%), these effects are amplified, as microalgae activate carbon concentration mechanisms and enhance EPS secretion, together causing pronounced medium alkalisation [45].
In V2, where gases from coal combustion plants were used, the CO2 concentration in the inflow was 14.9 ± 1.7% (Table 2). At the V-PBR outflow, CO2 decreased to 1.8 ± 0.3%, corresponding to a removal efficiency of 77.8 ± 2.4% (Figure 4), while the carbon dioxide utilization efficiency reached 46.7 ± 2.4% (Table 2). During cultivation, the medium pH gradually rose from 7.01 ± 0.08 to 8.68–8.90 (Figure 4), and biomass increased from 250 ± 21 mg/L to approximately 2700 ± 62 mg/L (Figure 2c). The correlation between decreasing CO2 in the off-gas and rising pH was strong (R2 = 0.9421), though the slope was less steep than in V1 (Figure 5). Similarly, in [28] with Arthrospira platensis, CO2 biostorage ranged from 87 to 96%, the pH reached 9.33 during growth, and biogas feeding enabled complete removal of CO, NOx, and SOx. In that study, O2 increased from 6.9 ± 2.1% to 20.9 ± 0.4%, and N2 from 73.7 ± 1.9% to 76.9 ± 1.1%, while CO, NOx, and SOx concentrations fell below detection limits.
The intensive conversion of CO2 to HCO3− during the cultivation of T. subcordiformis can be largely attributed to enzymatic activity, particularly that of cell-surface carbonic anhydrase (CA) [46]. This enzyme catalyzes the reversible reaction CO2 ↔ HCO3−, facilitating the rapid transformation of CO2 captured from the medium [47]. Under autotrophic conditions, where photosynthesis is the primary mechanism of CO2 consumption, this reaction leads to efficient carbon fixation and the simultaneous removal of protons from the solution, resulting in the observed increase in medium pH [48]. This mechanism not only supports high CO2 capture efficiency but also contributes to the stabilization of the bioreactor environment, creating favorable conditions for further biomass growth and the production of energy-related metabolites [49]. In other microalgae, such as Chlorella vulgaris and Scenedesmus sp., CA also accelerates the hydration of CO2, but the enzyme can be localized both in the chloroplasts and on the cell surface. In these species, CO2 uptake often leads to proton release, resulting in a decrease in the medium pH during intensive photosynthesis [50]. In marine microalgae, such as Dunaliella salina and Phaeodactylum tricornutum, cell-surface CA enables efficient CO2 conversion even at low dissolved concentrations, enhancing carbon assimilation and promoting biomass growth [51]. In higher plants, such as wheat and tobacco, CA is predominantly localized within chloroplasts and supports the Calvin cycle, i.e., intracellular CO2 assimilation. In this case, the enzyme does not directly affect apoplastic pH, and its primary role is to improve photosynthetic efficiency rather than alter the external environment [52].
In V3, supplied with atmospheric air, the initial CO2 concentration was 0.04 ± 0.002%, decreasing to 0.029 ± 0.002% in the effluent, corresponding to a CO2 utilization efficiency of 37.5 ± 1.2% (Table 2). Other gas components changed minimally: O2 increased slightly from 21.1 ± 0.1% to 21.3 ± 0.1%, and N2 decreased from 78.2 ± 0.1% to 78.0 ± 0.1%. Traces of NOx (7 ± 1 ppm) and SOx (9 ± 1 ppm) were completely removed during cultivation of T. subcordiformis (Table 2). Previous studies confirm that CO2 removal efficiency decreases as feed concentration rises. For example, Ref. [53] reported efficiencies of 81.82%, 45.10%, 44.04%, and 38.73% at CO2 feed concentrations of 2%, 5%, 10%, and 15%, respectively. This trend reflects the limited capacity of microalgae systems to assimilate higher CO2 concentrations [53]. Our results showed a similar relationship: increasing CO2 concentration in the feed stream corresponded with a decline in relative capture efficiency.
The implementation of CO2 capture technologies from exhaust gases of varying origin and composition, based on the use of microalgae, including T. subcordiformis, involves multiple challenges that must be considered when assessing its industrial potential. The primary barriers relate to high capital and operational costs [54] as well as technological and process complexity [55]. It has been repeatedly demonstrated that the construction and subsequent operation of photobioreactors (PBRs) require substantial financial investment [56]. Similarly, the implementation and functional integration of modules for exhaust gas purification, targeting NOx, SOx, or particulate matter, are highly resource-intensive. Studies have shown that, in many cases, without highly efficient pre-treatment of exhaust gases, the long-term viability of microalgal cultures cannot be maintained [57].
Operational costs have been identified by many researchers as a critical limitation [58]. Cultivation of T. subcordiformis requires stable light and temperature conditions. In temperate climates, intensive artificial lighting is necessary, which can account for 40–50% of total system costs [59]. Regular supplementation with nutrient-rich growth media, containing nitrogen, phosphorus, and trace elements, is also required, further increasing financial demands [60]. Biomass harvesting processes—separation, dewatering, and concentration—are particularly energy-intensive; at low cell concentrations (<3.0 g VS/L), they can consume 20–30% of operational expenses [61]. Consequently, 60–70% of total operating costs may be attributed to auxiliary operations (lighting, nutrient supply, harvesting) rather than to the CO2 bio-assimilation itself.
From a technological standpoint, maintaining the purity and stability of microalgal cultures over extended periods remains a challenge [62]. Cultures are susceptible to bacterial contamination, invasion by other microorganisms, and biofilm formation, leading to decreased photosynthetic efficiency and potentially requiring costly interventions, such as inoculum replacement. It should be noted that most studies to date have been conducted under laboratory conditions, which do not fully reflect practical challenges. In particular, there is a lack of data on the long-term effects of complex exhaust gas components on the physiology and stability of T. subcordiformis. Scaling up processes to large volumes also presents engineering challenges, including uneven light distribution, mixing, and gas exchange [63]. The absence of comprehensive pilot- or demonstration-scale studies currently prevents reliable assessment of long-term performance and stability of microalgal systems under industrial conditions [64]. Overcoming the barriers outlined above requires further research into the resilience of T. subcordiformis strains to gas contaminants, optimization of photobioreactor design, reduction in biomass harvesting costs, and integration of cultivation systems with renewable energy sources. Advancements in these areas are essential to enable the technology to become a feasible industrial solution, simultaneously addressing CO2 emission reduction and the production of valuable biomass.
3.3. Hydrogen Production
V1 was characterized by an efficiency of hydrogen production of 68.4 ± 3.7 mL/gVS (Figure 6a,d). The reaction rate constant was 0.030 l/gVS·h, and the H2 production rate was 2.05 ± 0.11 mL/gVS·h. The H2 content in the biogas was 58.2 ± 1.1%, CO2 40.6 ± 1.2% and oxygen 1.2 ± 0.2% (Table 3). V2 showed the highest H2 production efficiency among the analyzed variants and reached 70.9 ± 2.7 mL/gVS (Figure 6b,d). At the same time, the highest reaction rate constant was measured at 0.032 1/gVS·h and the maximum hydrogen production rate was 2.27 ± 0.08 mL/gVS·h (Table 3).
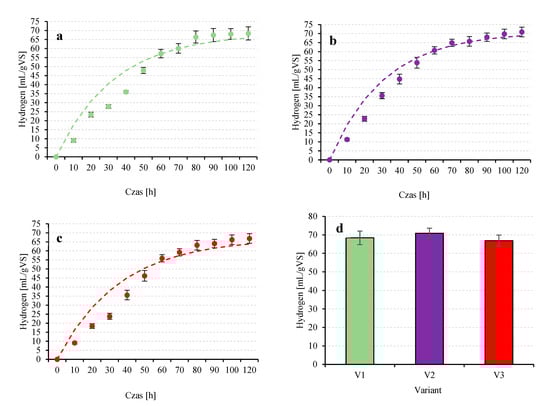
Figure 6.
The course of hydrogen production in the following experimental variants V1 (a), V2 (b), V3 (c) and comparison of the final values achieved (d).
Table 3.
Comparison of the efficiency and kinetics of H2 production and the composition of the biogas produced by T. subcordiformis as a function of the experimental variant tested.
The qualitative composition of the biogas showed the highest proportion of hydrogen with 59.1 ± 2.3% and 39.7 ± 2.0% CO2. In turn, in the study [18], the highest biohydrogen production efficiency achieved was 58.2 ± 6.7 mL/g VS with a carbon dioxide content in the culture medium of 220.0 ± 8.0 mg/L. The percentage of biohydrogen in the biogas was 38.2 ± 1.4% [18]. Variant V3 was characterized by the lowest process efficiency (Table 2, Figure 6d).
The total H2 production was 66.9 ± 3.0 mL/gVS (Figure 6c), and the production rate reached 1.87 ± 0.06 mL/gVS·h, which was significantly lower compared to the other variants. The reaction rate constant was also the lowest at 0.028 1/gVS·h. The gas composition (58.9 ± 1.7% H2; 39.5 ± 1.1% CO2; 1.6 ± 0.3% O2) was comparable to the other variants (Table 3). To evaluate the potential of different microalgae strains for biohydrogen production, experiments were conducted with Chlorella pyrenoidosa, Scenedesmus obliquus and Chlorella sorokiniana [65]. The maximum hydrogen production was 45.50 ± 0.32 mL/g VS for C. pyrenoidosa, 38.43 ± 0.42 mL/g VS for S. obliquus and 34.83 ± 1.82 mL/g VS for C. sorokiniana [65]. The results obtained in our own studies were higher than those reported above but did not deviate from the frequently reported values typical of T. subcordiformis. Among the microalgae analyzed in the literature, T. subcordiformis stands out for its relatively high potential for biohydrogen generation. However, the efficiency of the process is strongly dependent on cultivation conditions as well as on the initial experimental parameters, particularly the inoculum density. This is confirmed by Ji et al. [66], who observed that increasing the biomass concentration from 0.5 g TS/L to 3.2 g TS/L resulted in nearly a tenfold increase in the H2 evolution rate. In practical terms, this translated into an increase in hydrogen yield from 16 mL H2/g TS to 49 mL H2/g TS. A detailed quantitative comparison of hydrogen production efficiencies among different microalgal species, including the relative advantages of T. subcordiformis, has already been presented in our earlier review [67].
Based on the biomass concentrations of T. subcordiformis introduced into the growth medium, the hydrogen production yields per unit reactor volume were 181.9 ± 9.8 mL/L (V1), 192.1 ± 7.3 mL/L (V2), and 149.8 ± 6.7 mL/L (V3) (Table 3). These values were statistically significant (p < 0.05). Previous studies on T. subcordiformis indicate a wide range of achievable biohydrogen yields, reflecting the high sensitivity of this species to environmental conditions and process strategy. Ji et al. (2011) demonstrated that nitrogen limitation combined with CCCP treatment promoted hydrogen accumulation of 55.8 mL/L, whereas sulfur deprivation resulted in only 15.2 mL/L [68]. These results clearly show that nitrogen deficiency is a stronger factor driving metabolism towards biohydrogenogenesis than sulfur limitation, correlating with observed reorganization of protein and photosynthetic metabolism.
Significant improvements have also been achieved by integrating biohydrogen production with an alkaline fuel cell (AFC). Guo et al. (2016) reported that in a photobioreactor integrated with an AFC and using CCCP, hydrogen yields of 78 ± 5 mL/L were achievable [69]. Furthermore, subsequent optimization of the light regime demonstrated that a light/dark cycle of 9/6 h increased production to 126 ± 10 mL/L [70], highlighting the critical importance of tuning photosynthetic and mitochondrial respiration dynamics to a redox balance favorable for hydrogenase activity. Recent studies focusing on the use of agricultural waste and wastewater as growth media indicate the practical applicability of the technology. Under respirometric conditions, T. subcordiformis produced total H2 volumes of approximately 150–170 mL/L [17]. The results obtained in the present study fall within the upper range of hydrogen production yields reported in the literature for T. subcordiformis (Figure 5, Table 3).
It should be emphasized that, despite demonstrating the technological feasibility of a system integrating fuel combustion, CO2 sequestration using Tetraselmis subcordiformis, and subsequent biohydrogen production, this study does not include a detailed economic analysis. The absence of estimates for capital expenditures (construction of photobioreactors, exhaust gas purification systems, lighting infrastructure), operational costs (growth medium, electricity, biomass separation and dewatering), and potential revenue streams (biofuels, feed, biohydrogen) currently represents a significant limitation for the practical assessment of the proposed technology.
It is important to emphasize that the results presented here were obtained under controlled laboratory conditions, where factors such as illumination, gas flow distribution, and culture stability were tightly regulated. While this allowed for high CO2 removal efficiencies (up to 90.3 ± 3.2%) and biohydrogen yields of 70.9 ± 2.7 mL/gVS, translating these outcomes to industrial-scale systems is far more complex. Large photobioreactors are subject to uneven light penetration, mass transfer limitations, higher risk of contamination, and significantly greater operational costs related to lighting, mixing, and biomass harvesting. Consequently, the laboratory-scale findings should be regarded as a proof of concept, whereas the evaluation of their industrial feasibility requires pilot- and demonstration-scale studies combined with comprehensive techno-economic analyses. It should also be noted that results obtained under laboratory conditions cannot serve as a reliable basis for estimating economic performance, due to scale-up challenges. Parameters characterizing small experimental systems, such as gas and liquid flow rates, working pressures, mass and energy transfer, and long-term stability of productivity, differ substantially from those encountered in full-scale installations. Consequently, it is necessary to advance the technology readiness level (TRL) to include pilot- and demonstration-scale systems operated under conditions close to real-world scenarios. Only at this stage will it be possible to reliably identify key process- and cost-driving factors and perform a comprehensive techno-economic assessment.
Future research should prioritize the integration of technological findings with detailed economic modeling, enabling an evaluation of the real competitiveness of the proposed solution relative to other CO2 mitigation technologies and alternative energy sources.
4. Conclusions
Cultivation of T. subcordiformis in V-PBRs fuelled with different gas sources showed a high CO2 removal efficiency, exceeding 90% in the biogas off-gas variant. These results indicate that microalgae can play a significant role as biological absorbers of exhaust gases, even in mixtures containing pollutants typical of fuel or biofuel combustion.
The growth analysis of T. subcordiformis revealed significant differences between the variants. The highest growth rate and final biomass concentration was achieved in the V-PBR fuelled with exhaust gases from the co-combustion of coal and biomass. However, the use of atmospheric air resulted in the lowest yields and the lowest dynamics of microalgae biomass growth, confirming that low CO2 concentrations could limit the intensity of photosynthesis and biosynthesis.
The biochemical profile of the microalgae varied considerably between the variants. The highest total carbon and carbohydrate contents were observed when the V-PBR was fuelled with exhaust gases from the co-combustion of coal and biomass. When the system was fed with air, a higher proportion of lipids and proteins was observed, which could indicate a shift in metabolism towards nitrogen and lipid fractions under carbon stress conditions.
The highest efficiency and hydrogen production rate were observed in the variant using the exhaust gases of a municipal energy company, while significantly lower values were observed when air was used as a CO2 source. The results confirm that carbohydrate-rich biomass is the most effective substrate for biohydrogenogenesis, while the presence of the lipid fraction can limit the process rate. The composition of the biogas remained stable regardless of the variant.
The results of the study demonstrate the feasibility of integrating off-gas systems with photobioreactors for simultaneous CO2 biostorage and biohydrogen production. The use of such systems promotes the reduction in greenhouse gas emissions, improves the energy balance of the plant and supports the achievement of climate neutrality and the goals of circular economy.
Author Contributions
Conceptualization, M.D. and M.Z.; methodology, M.D.; software, M.D. and I.Ś.; validation, M.D. and J.K.; formal analysis, M.D. and J.K.; investigation, M.D., J.K., I.Ś. and M.Z.; resources, M.D., J.K., I.Ś. and M.Z.; data curation, M.D. and I.Ś.; writing—original draft preparation, M.D., J.K., I.Ś. and M.Z.; writing—review and editing, M.D., J.K., I.Ś. and M.Z.; visualization, M.D., J.K. and I.Ś.; supervision, M.Z.; funding acquisition, M.D. All authors have read and agreed to the published version of the manuscript.
Funding
This research was financially supported by works No. 29.610.023-110 of the University of Warmia and Mazury in Olsztyn and WZ/WB-IIŚ/3/2025 of the Bialystok University of Technology, funded by the Ministry of Science and Higher Education.
Institutional Review Board Statement
Not applicable.
Informed Consent Statement
Not applicable.
Data Availability Statement
Data are contained within the article.
Conflicts of Interest
The authors declare no conflicts of interest.
References
- Friedlingstein, P.; O’Sullivan, M.; Jones, M.W.; Andrew, R.M.; Hauck, J.; Landschützer, P.; Le Quéré, C.; Li, H.; Luijkx, I.T.; Olsen, A.; et al. Global Carbon Budget 2024. Earth Syst. Sci. Data 2025, 17, 965–1039. [Google Scholar] [CrossRef]
- Rajabloo, T.; Valee, J.; Marenne, Y.; Coppens, L.; De Ceuninck, W. Carbon capture and utilization for industrial applications. Energy Rep. 2023, 9, 111–116. [Google Scholar] [CrossRef]
- Siddique, M.H.; Maqbool, F.; Shahzad, T.; Waseem, M.; Rasul, I.; Hayat, S.; Afzal, M.; Faisal, M.; Muzammil, S. Recent advances in carbon dioxide utilization as renewable energy. In Green Sustainable Process for Chemical and Environmental Engineering and Science; Elsevier: Amsterdam, The Netherlands, 2023; pp. 197–210. [Google Scholar] [CrossRef]
- Omokaro, G.O.; Nafula, Z.S.; Iloabuchi, N.E.; Chikukula, A.A.; Osayogie, O.G.; Nnoli, E.C. Microalgae as biofactories for sustainable applications: Advancing carbon sequestration, bioenergy, and environmental remediation. Sustain. Chem. Clim. Action 2025, 7, 100098. [Google Scholar] [CrossRef]
- Soudagar, M.E.M.; Sharma, A.; Srinivasan, R.; Nagarajan, N.; Mohanavel, V.; Ravichandran, M.; Ayyar, M.; Al Obaid, S.; Alharbi, S.A. Collection of rich microalgae from textile wastewater and utilized for hydrogen production via hydrothermal gasification route: Performance study. Algal Res. 2025, 89, 104052. [Google Scholar] [CrossRef]
- Quinn, J.C.; Hanif, A.; Sharvelle, S.; Bradley, T.H. Microalgae to biofuels: Life cycle impacts of methane production of anaerobically digested lipid extracted algae. Bioresour. Technol. 2014, 171, 37–43. [Google Scholar] [CrossRef] [PubMed]
- Pandey, S.; Narayanan, I.; Selvaraj, R.; Varadavenkatesan, T.; Vinayagam, R. Biodiesel production from microalgae: A comprehensive review on influential factors, transesterification processes, and challenges. Fuel 2024, 367, 131547. [Google Scholar] [CrossRef]
- Spennati, E.; Casazza, A.A.; Converti, A.; Busca, G. Investigation on thermal pyrolysis of microalgae grown in winery wastewater: Biofuels and chemicals production. Biomass Convers. Biorefinery 2024, 14, 17647–17661. [Google Scholar] [CrossRef]
- Zhakupov, D.; Kulmukanova, L.; Sarbassov, Y.; Shah, D. Flue gas analysis for biomass and coal co-firing in fluidized bed: Process simulation and validation. Int. J. Coal Sci. Technol. 2022, 9, 59. [Google Scholar] [CrossRef]
- Li, G.; Xiao, W.; Yang, T.; Lyu, T. Optimization and Process Effect for Microalgae Carbon Dioxide Fixation Technology Applications Based on Carbon Capture: A Comprehensive Review. C 2023, 9, 35. [Google Scholar] [CrossRef]
- Ye, Q.; Shen, Y.; Zhang, Q.; Wu, X.; Guo, W. Life-cycle assessment of flue gas CO2 fixation from coal-fired power plant and coal chemical plant by microalgae. Sci. Total Environ. 2022, 848, 157728. [Google Scholar] [CrossRef]
- Dammak, M.; Hadrich, B.; Miladi, R.; Barkallah, M.; Hentati, F.; Hachicha, R.; Laroche, C.; Michaud, P.; Fendri, I.; Abdelkafi, S. Effects of nutritional conditions on growth and biochemical composition of Tetraselmis sp. Lipids Health Dis. 2017, 16, 41. [Google Scholar] [CrossRef]
- Guo, Z.; Chen, Z.; Zhang, W.; Yu, X.; Jin, M. Improved hydrogen photoproduction regulated by carbonylcyanide m-chlorophenylhrazone from marine green alga Platymonas subcordiformis grown in CO2-supplemented air bubble column bioreactor. Biotechnol. Lett. 2008, 30, 877–883. [Google Scholar] [CrossRef] [PubMed]
- Ji, C.; Cao, X.; Liu, H.; Qu, J.; Yao, C.; Zou, H.; Xue, S. Investigating Cellular Responses During Photohydrogen Production by the Marine Microalga Tetraselmis subcordiformis by Quantitative Proteome Analysis. Appl. Biochem. Biotechnol. 2015, 177, 649–661. [Google Scholar] [CrossRef]
- Nagarajan, D.; Dong, C.; Chen, C.; Lee, D.; Chang, J. Biohydrogen production from microalgae—Major bottlenecks and future research perspectives. Biotechnol. J. 2021, 16, 2000124. [Google Scholar] [CrossRef]
- Mehariya, S.; Annamalai, S.N.; Thaher, M.I.; Quadir, M.A.; Khan, S.; Rahmanpoor, A.; Kashem, A.; Faisal, M.; Sayadi, S.; Al Hawari, A.; et al. A comprehensive review on versatile microalga Tetraselmis: Potentials applications in wastewater remediation and bulk chemical production. J. Environ. Manag. 2024, 365, 121520. [Google Scholar] [CrossRef] [PubMed]
- Zieliński, M.; Barczak, Ł.; Rusanowska, P.; Kazimierowicz, J.; Dębowski, M. Comparison of Biohydrogen Production by Tetraselmis subcordiformis During Cultivation Using Soil-Less Agricultural Wastewater and Effluent from Microbial Fuel Cells. Energies 2024, 17, 5287. [Google Scholar] [CrossRef]
- Zieliński, M.; Barczak, Ł.; Rusanowska, P.; Nowicka, A.; Dębowski, M. Microbial Fuel Cells as CO2 Source in the Autotrophic Cultivation of the Green Microalgae Tetraselmis subcordiformis: Impact on Biomass Growth, Nutrient Removal, and Hydrogen Production. Energies 2025, 18, 874. [Google Scholar] [CrossRef]
- Gonçalves, J.; Freitas, J.; Fernandes, I.; Silva, P. Microalgae as Biofertilizers: A Sustainable Way to Improve Soil Fertility and Plant Growth. Sustainability 2023, 15, 12413. [Google Scholar] [CrossRef]
- Ahmad, A.; Hassan, S.W.; Banat, F. An overview of microalgae biomass as a sustainable aquaculture feed ingredient: Food security and circular economy. Bioengineered 2022, 13, 9521–9547. [Google Scholar] [CrossRef]
- Aslam, A.; Thomas-Hall, S.R.; Manzoor, M.; Jabeen, F.; Iqbal, M.; uz Zaman, Q.; Schenk, P.M.; Tahir, M.A. Mixed microalgae consortia growth under higher concentration of CO2 from unfiltered coal fired flue gas: Fatty acid profiling and biodiesel production. J. Photochem. Photobiol. B Biol. 2018, 179, 126–133. [Google Scholar] [CrossRef]
- Jiao, H.; Tsigkou, K.; Elsamahy, T.; Pispas, K.; Sun, J.; Manthos, G.; Schagerl, M.; Sventzouri, E.; Al-Tohamy, R.; Kornaros, M.; et al. Recent advances in sustainable hydrogen production from microalgae: Mechanisms, challenges, and future perspectives. Ecotoxicol. Environ. Saf. 2024, 270, 115908. [Google Scholar] [CrossRef]
- Department Experimental Phycology and Culture Collection of Algae (EPSAG). Available online: https://sagdb.uni-goettingen.de/detailedList.php?str_number=161-1a (accessed on 27 August 2025).
- Guan, Y.; Deng, M.; Yu, X.; Zhang, W. Two-stage photo-biological production of hydrogen by marine green alga Platymonas subcordiformis. Biochem. Eng. J. 2004, 19, 69–73. [Google Scholar] [CrossRef]
- Gabrielyan, D.A.; Gabel, B.V.; Sinetova, M.A.; Gabrielian, A.K.; Markelova, A.G.; Shcherbakova, N.V.; Los, D.A. Optimization of CO2 Supply for the Intensive Cultivation of Chlorella sorokiniana IPPAS C-1 in the Laboratory and Pilot-Scale Flat-Panel Photobioreactors. Life 2022, 12, 1469. [Google Scholar] [CrossRef]
- Zhao, B.; Su, Y. Process effect of microalgal-carbon dioxide fixation and biomass production: A review. Renew. Sustain. Energy Rev. 2014, 31, 121–132. [Google Scholar] [CrossRef]
- Zieliński, M.; Kazimierowicz, J.; Dębowski, M. The Possibility of Deploying CO2 from Biogas Combustion to Improve the Productivity of a Periodical Chlorella vulgaris Culture. Front. Biosci. 2023, 15, 3. [Google Scholar] [CrossRef]
- Dębowski, M.; Zieliński, M.; Vdovychenko, A.; Kazimierowicz, J. The Use of the Autotrophic Culture of Arthrospira platensis for CO2 Fixation from Biogas Combustion. Processes 2024, 12, 396. [Google Scholar] [CrossRef]
- Cho, J.M.; Oh, Y.-K.; Lee, J.; Chang, Y.K.; Park, W.-K. Development of dual strain microalgae cultivation system for the direct carbon dioxide utilization of power plant flue gas. Bioresour. Technol. 2024, 393, 130051. [Google Scholar] [CrossRef] [PubMed]
- Qin, J.; Jia, M.; Sun, J. Examining the effects of elevated CO2 on the growth kinetics of two microalgae, Skeletonema dohrnii (Bacillariophyceae) and Heterosigma akashiwo (Raphidophyceae). Front. Mar. Sci. 2024, 11, 1347029. [Google Scholar] [CrossRef]
- Vermeersch, L.; Perez-Samper, G.; Cerulus, B.; Jariani, A.; Gallone, B.; Voordeckers, K.; Steensels, J.; Verstrepen, K.J. On the duration of the microbial lag phase. Curr. Genet. 2019, 65, 721–727. [Google Scholar] [CrossRef]
- Seyedmahdi, H.; Saeed, A.; Mohamad, S.H.; Fatemeh, M. Growth response of Spirulina platensis PCC9108 to elevated CO2 levels and flue gas. Biol. J. Microorg. 2014, 2, 29–36. [Google Scholar]
- Ansari, A.A.; Khoja, A.H.; Nawar, A.; Qayyum, M.; Ali, E. Wastewater treatment by local microalgae strains for CO2 sequestration and biofuel production. Appl. Water Sci. 2017, 7, 4151–4158. [Google Scholar] [CrossRef]
- Kusi, P.A.; McGee, D.; Tabraiz, S.; Ahmed, A. Bicarbonate concentration influences carbon utilization rates and biochemical profiles of freshwater and marine microalgae. Biotechnol. J. 2024, 19, 2400361. [Google Scholar] [CrossRef]
- Lin, Q.; Gu, N.; Li, G.; Lin, J.; Huang, L.; Tan, L. Effects of inorganic carbon concentration on carbon formation, nitrate utilization, biomass and oil accumulation of Nannochloropsis oculata CS 179. Bioresour. Technol. 2012, 111, 353–359. [Google Scholar] [CrossRef] [PubMed]
- Cai, Y.; Zhai, L.; Fang, X.; Wu, K.; Liu, Y.; Cui, X.; Wang, Y.; Yu, Z.; Ruan, R.; Liu, T.; et al. Effects of C/N ratio on the growth and protein accumulation of heterotrophic Chlorella in broken rice hydrolysate. Biotechnol. Biofuels Bioprod. 2022, 15, 102. [Google Scholar] [CrossRef]
- Cheng, Y.-S.; Labavitch, J.M.; VanderGheynst, J.S. Elevated CO2 concentration impacts cell wall polysaccharide composition of green microalgae of the genus Chlorella. Lett. Appl. Microbiol. 2015, 60, 1–7. [Google Scholar] [CrossRef]
- Li, J.; Tang, X.; Pan, K.; Zhu, B.; Li, Y.; Ma, X.; Zhao, Y. The regulating mechanisms of CO2 fixation and carbon allocations of two Chlorella sp. strains in response to high CO2 levels. Chemosphere 2020, 247, 125814. [Google Scholar] [CrossRef]
- Mahmoudi, H.; Kossalbayev, B.; Sarsekeyeva, F.; Zaletova, D.; Lyaguta, M. The influence of varying concentrations of CO2 on the buildup of carbohydrates in microalgae biomass. BIO Web Conf. 2024, 100, 02013. [Google Scholar] [CrossRef]
- Zhang, Z.; Li, Y.; Yang, S.; Wen, S.; Zhu, H.; Zhou, H. Target of Rapamycin Is a Crucial Regulator of Photosynthesis and Nutrient Metabolism Partitioning in Nannochloropsis gaditana. Biotechnol. Biofuels Bioprod. 2025, 18, 1–19. [Google Scholar] [CrossRef]
- Pancha, I.; Chokshi, K.; Tanaka, K.; Imamura, S. Microalgal Target of Rapamycin (TOR): A Central Regulatory Hub for Growth, Stress Response and Biomass Production. Plant Cell Physiol. 2020, 61, 675–684. [Google Scholar] [CrossRef]
- Mallén-Ponce, M.J.; Pérez-Pérez, M.E.; Crespo, J.L. Deciphering the Function and Evolution of the Target of Rapamycin Signaling Pathway in Microalgae. J. Exp. Bot. 2022, 73, 6993–7005. [Google Scholar] [CrossRef] [PubMed]
- Mallen-Ponce, M.J.; Perez-Perez, M.E.; Crespo, J.L. Photosynthetic Assimilation of CO2 Regulates TOR Activity. Proc. Natl. Acad. Sci. USA 2022, 119, e2115261119. [Google Scholar] [CrossRef]
- Gao, K. Approaches and involved principles to control pH/pCO2 stability in algal cultures. J. Appl. Phycol. 2021, 33, 3497–3505. [Google Scholar] [CrossRef]
- Babiak, W.; Krzemińska, I. Extracellular Polymeric Substances (EPS) as Microalgal Bioproducts: A Review of Factors Affecting EPS Synthesis and Application in Flocculation Processes. Energies 2021, 14, 4007. [Google Scholar] [CrossRef]
- Iakovidou, G.; Itziou, A.; Tsiotsias, A.; Lakioti, E.; Samaras, P.; Tsanaktsidis, C.; Karayannis, V. Application of Microalgae to Wastewater Bioremediation, with CO2 Biomitigation, Health Product and Biofuel Development, and Environmental Biomonitoring. Appl. Sci. 2024, 14, 6727. [Google Scholar] [CrossRef]
- Russo, M.E.; Capasso, C.; Marzocchella, A.; Salatino, P. Immobilization of Carbonic Anhydrase for CO2 Capture and Utilization. Appl. Microbiol. Biotechnol. 2022, 106, 3419–3430. [Google Scholar] [CrossRef] [PubMed]
- Yao, D.; Wu, L.; Tan, D.; Yu, Y.; Jiang, Q.; Wu, Y.; Wang, H.; Liu, Y. Enhancing CO2 Fixation by Microalgae in a Photobioreactor: Molecular Mechanisms with Exogenous Carbonic Anhydrase. Bioresour. Technol. 2024, 408, 131176. [Google Scholar] [CrossRef]
- Viswanaathan, S.; Perumal, P.K.; Sundaram, S. Integrated Approach for Carbon Sequestration and Wastewater Treatment Using Algal–Bacterial Consortia: Opportunities and Challenges. Sustainability 2022, 14, 1075. [Google Scholar] [CrossRef]
- Liu, X.; Wang, Y.; Chen, H.; Zhang, J.; Wang, C.; Li, X.; Pang, S. Acute Toxicity and Associated Mechanisms of Four Strobilurins in Algae. Environ. Toxicol. Pharmacol. 2018, 60, 12–16. [Google Scholar] [CrossRef] [PubMed]
- Lager, I.; Andréasson, O.; Dunbar, T.L.; Andreasson, E.; Escobar, M.A.; Rasmusson, A.G. Changes in External PH Rapidly Alter Plant Gene Expression and Modulate Auxin and Elicitor Responses. Plant. Cell Environ. 2010, 33, 1513–1528. [Google Scholar] [CrossRef] [PubMed]
- Kessler, A.; Baldwin, I.T. Plant Responses to Insect Herbivory: The Emerging Molecular Analysis. Annu. Rev. Plant Biol. 2002, 53, 299–328. [Google Scholar] [CrossRef]
- Yang, Q.; Li, H.; Wang, D.; Zhang, X.; Guo, X.; Pu, S.; Guo, R.; Chen, J. Utilization of chemical wastewater for CO2 emission reduction: Purified terephthalic acid (PTA) wastewater-mediated culture of microalgae for CO2 bio-capture. Appl. Energy 2020, 276, 115502. [Google Scholar] [CrossRef]
- Kazemifar, F. A Review of Technologies for Carbon Capture, Sequestration, and Utilization: Cost, Capacity, and Technology Readiness. Greenh. Gases Sci. Technol. 2022, 12, 200–230. [Google Scholar] [CrossRef]
- Nwabueze, Q.A.; Leggett, S. Advancements in the Application of CO2 Capture and Utilization Technologies—A Comprehensive Review. Fuels 2024, 5, 508–532. [Google Scholar] [CrossRef]
- Sudha, P.N.; Vijayalakshmi, K.; Hemapriya, D.; Saranya, M.; Kim, S.K. Microalgal Efficiency for Wastewater Treatment. Encycl. Mar. Biotechnol. 2020, 1, 459–495. [Google Scholar] [CrossRef]
- Padhi, D.; Kashyap, S.; Mohapatra, R.K.; Dineshkumar, R.; Nayak, M. Microalgae-Based Flue Gas CO2 Sequestration for Cleaner Environment and Biofuel Feedstock Production: A Review. Environ. Sci. Pollut. Res. 2025, 32, 13539–13565. [Google Scholar] [CrossRef] [PubMed]
- Wang, R.; Wang, X.; Zhu, T. Research Progress and Application of Carbon Sequestration in Industrial Flue Gas by Microalgae: A Review. J. Environ. Sci. 2025, 152, 14–28. [Google Scholar] [CrossRef]
- Schade, S.; Meier, T. A Comparative Analysis of the Environmental Impacts of Cultivating Microalgae in Different Production Systems and Climatic Zones: A Systematic Review and Meta-Analysis. Algal Res. 2019, 40, 101485. [Google Scholar] [CrossRef]
- Arora, K.; Kaur, P.; Kumar, P.; Singh, A.; Patel, S.K.S.; Li, X.; Yang, Y.H.; Bhatia, S.K.; Kulshrestha, S. Valorization of Wastewater Resources Into Biofuel and Value-Added Products Using Microalgal System. Front. Energy Res. 2021, 9, 646571. [Google Scholar] [CrossRef]
- Wu, N.; Moreira, C.M.; Zhang, Y.; Doan, N.; Yang, S.; Phlips, E.J.; Svoronos, S.A.; Pullammanappallil, P.C.; Wu, N.; Moreira, C.M.; et al. Techno-Economic Analysis of Biogas Production from Microalgae through Anaerobic Digestion. Anaerob. Dig. 2019. [Google Scholar] [CrossRef]
- Foo, S.C.; Mok, C.Y.; Ho, S.Y.; Khong, N.M.H. Microalgal Culture Preservation: Progress, Trends and Future Developments. Algal Res. 2023, 71, 103007. [Google Scholar] [CrossRef]
- Novoveská, L.; Nielsen, S.L.; Eroldoğan, O.T.; Haznedaroglu, B.Z.; Rinkevich, B.; Fazi, S.; Robbens, J.; Vasquez, M.; Einarsson, H. Overview and Challenges of Large-Scale Cultivation of Photosynthetic Microalgae and Cyanobacteria. Mar. Drugs 2023, 21, 445. [Google Scholar] [CrossRef]
- Choudhary, S.; Poluri, K.M. Microalgal-Based Biorefinery Approaches Toward a Sustainable Future. In Industrial Microbiology and Biotechnology; Springer: Singapore, 2024; pp. 229–275. [Google Scholar] [CrossRef]
- Satheesh, S.; Pugazhendi, A.; Al-Mur, B.A.; Balasubramani, R. Biohydrogen production coupled with wastewater treatment using selected microalgae. Chemosphere 2023, 334, 138932. [Google Scholar] [CrossRef]
- Ji, C.F.; Legrand, J.; Pruvost, J.; Chen, Z.A.; Zhang, W. Characterization of Hydrogen Production by Platymonas Subcordiformis in Torus Photobioreactor. Int. J. Hydrog. Energy 2010, 35, 7200–7205. [Google Scholar] [CrossRef]
- Dębowski, M.; Dudek, M.; Zieliński, M.; Nowicka, A.; Kazimierowicz, J. Microalgal Hydrogen Production in Relation to Other Biomass-Based Technologies—A Review. Energies 2021, 14, 6025. [Google Scholar] [CrossRef]
- Ji, C.F.; Yu, X.J.; Chen, Z.A.; Xue, S.; Legrand, J.; Zhang, W. Effects of Nutrient Deprivation on Biochemical Compositions and Photo-Hydrogen Production of Tetraselmis subcordiformis. Int. J. Hydrog. Energy 2011, 36, 5817–5821. [Google Scholar] [CrossRef]
- Guo, Z.; Li, Y.; Guo, H. Characterization of H2 Photoproduction by Marine Green Alga Tetraselmis subcordiformis Integrated with an Alkaline Fuel Cell. Biotechnol. Lett. 2016, 38, 435–440. [Google Scholar] [CrossRef] [PubMed]
- Guo, Z.; Li, Y.; Guo, H. Effect of Light/Dark Regimens on Hydrogen Production by Tetraselmis subcordiformis Coupled with an Alkaline Fuel Cell System. Appl. Biochem. Biotechnol. 2017, 183, 1295–1303. [Google Scholar] [CrossRef] [PubMed]
Disclaimer/Publisher’s Note: The statements, opinions and data contained in all publications are solely those of the individual author(s) and contributor(s) and not of MDPI and/or the editor(s). MDPI and/or the editor(s) disclaim responsibility for any injury to people or property resulting from any ideas, methods, instructions or products referred to in the content. |
© 2025 by the authors. Licensee MDPI, Basel, Switzerland. This article is an open access article distributed under the terms and conditions of the Creative Commons Attribution (CC BY) license (https://creativecommons.org/licenses/by/4.0/).