Article

Spatiotemporal Evolution and Driving Mechanisms of Coupling Coordination Between Green Innovation Efficiency and Urban Ecological Resilience: Evidence from Yangtze River Delta, China

School of Public Finance and Taxation, Capital University of Economics and Business, Beijing 100070, China
Sustainability 2025, 17(19), 8528; https://doi.org/10.3390/su17198528
Submission received: 29 July 2025 / Revised: 15 September 2025 / Accepted: 16 September 2025 / Published: 23 September 2025
(This article belongs to the Topic Green Technology Innovation and Economic Growth)

Abstract

As a flagship low-carbon transition zone in China, the Yangtze River Delta (YRD) faces challenges in synergizing green innovation efficiency (GIE) and urban ecological resilience (UER). This study establishes a dual-system evaluation framework to quantify their coupling coordination degree (CCD) across the 41 cities of the YRD from 2010 to 2023 using coupling coordination modeling, Geodetector, as well as Geographically and Temporally Weighted Regression (GTWR). Key findings reveal the following: (1) Temporally, GIE surged from 0.252 to 0.692, while UER rose steadily from 0.228 to 0.395. This joint improvement elevated the CCD from mildly discordant to primary coordination. (2) Spatially, an east–high, west–low gradient defined three regional typologies: coastal clusters with high coupling and intermediate coordination; the Yangtze River corridor with high coupling yet only primary coordination; and inter-provincial border zones with low coupling and low coordination. In these border zones, administrative fragmentation resulted in a CCD that was 10–23% lower than that of inland regions. (3) Mechanistically, the green innovation driving force and policy synergy degree were the dominant promoters. In contrast, urban expansion pressure and rigid ecological regulation exhibited spatially heterogeneous effects, with their overall inhibitory impacts most pronounced in highly urbanized coastal cores and inland industrial transition zones. The findings may serve as a practical case reference for tailoring governance strategies in global mega-city regions pursuing synergistic low-carbon transitions.

1. Introduction

The intensifying pressure on the ecological environment during the global urbanization process profoundly challenges sustainable urban development paths [1,2]. The United Nations Office for Disaster Risk Reduction (UNDRR) identifies “protecting ecosystems and natural barriers” as a core clause for building resilient cities. This signifies that urban ecological resilience (UER) has become an issue of international consensus [3,4]. As the country with the fastest urbanization rate globally, China explicitly proposes the strategic goal of “coordinating green innovation and ecological security” in its “14th Five-Year Plan for Ecological Protection.” The core challenge, under the “dual carbon” goals, is to achieve urban modernization characterized by harmonious human–nature coexistence. This necessitates technological empowerment enabled by green innovation efficiency (GIE) and systemic restructuring driven by UER [5,6,7].
Research on GIE and UER has evolved along three interrelated trajectories. GIE research increasingly employs dual-focus evaluation frameworks. These frameworks simultaneously assess innovation performance and environmental externalities, using pollution and resource indicators to move beyond purely economic metrics [8,9]. Methodologically, multidimensional input–output approaches predominate, with Super-Slack-Based Measure Data Envelopment Analysis (Super-SBM DEA) and stochastic frontier analysis serving as established tools for quantifying efficiency under ecological constraints [10,11,12,13]. Empirical analyses confirm significant spatial dependencies driven by three core mechanisms: clean technology diffusion, eco-conscious demand patterns, and regulatory pressures [14,15,16]. Although spatial econometric techniques confirm the existence of spillover effects, there is no scholarly consensus on their nature, specifically, whether high-efficiency clusters consistently generate positive spillovers. Furthermore, although coupling analyses with economic and ecological systems indicate progressive coordination, they predominantly employ static frameworks that obscure dynamic co-evolutionary pathways, particularly concerning UER integration. UER describes an urban ecosystem’s ability to withstand disturbances while maintaining core functions through self-organization [17,18]. Current research has deepened the conceptual understanding of UER, spanning from engineering to evolutionary resilience perspectives [19]. It employs diverse metrics, such as urban renewal and ecosystem services, to measure resistance, adaptability, and recovery across multiple scales [20]. Furthermore, there is growing emphasis on examining the interactions between UER and socioeconomic factors [21]. However, a critical gap persists: mainstream UER evaluation frameworks still lack the systematic integration of green technology innovation (GTI). This oversight ignores GTI’s proven ability to enhance adaptive capacity and improve resource efficiency [22,23].
Driven by accelerating synergies between climate pressures and urban development, research on the interplay between GIE and UER is expanding. Critical knowledge gaps, however, continue to hinder actionable policy guidance. Interdisciplinary studies confirm that GIE and UER engage in mutual reinforcement [24,25]. As the core of GIE, pollution control technologies directly strengthen ecological resilience by reducing environmental stressors, empirically validated by Kates et al. [26]. Conversely, robust UER stimulates green innovation, with quantitative evidence confirming its significant role in advancing GIE capabilities [27,28].
Despite these advances, three critical constraints impede further progress. Firstly, sophisticated frameworks modeling the spatiotemporal co-evolution of GIE and UER remain underdeveloped, especially for strategic regions like the Yangtze River Delta. Secondly, studies inadequately examine spatial heterogeneity in underlying drivers, particularly regarding cross-jurisdictional policy coordination such as ecological compensation schemes and place-specific innovation ecosystems. Thirdly, prevailing static analyses often poorly capture temporal non-stationarity and threshold effects in driver efficacy. Consequently, identifying dominant factors and their evolving spatial patterns is essential for evidence-based governance.
To bridge these gaps, this study proposes an integrated Monitor–Diagnose–Optimize framework by (1) employing Super-SBM DEA, Pressure–State–Response (PSR) models, and a coupling coordination model to quantify green innovation efficiency, urban ecological resilience, and their coupling coordination degree (CCD); (2) visualizing spatiotemporal evolution patterns via ArcGIS spatial analysis tools; (3) quantifying spatial autocorrelation to identify agglomeration features; and (4) integrating Geodetector and GTWR models to identify driving mechanisms. Theoretically, this redefines resilience quantification by structuring PSR capacities. Methodologically, it develops a generalizable causal analysis framework for complex systems with an emphasis on reproducibility. Practically, the developed tiered synergy mechanisms and adaptive governance strategies advance progress toward Sustainable Development Goal 11 (SDG 11). The sequential methodology is illustrated in Figure 1.

2. Materials

2.1. Study Area

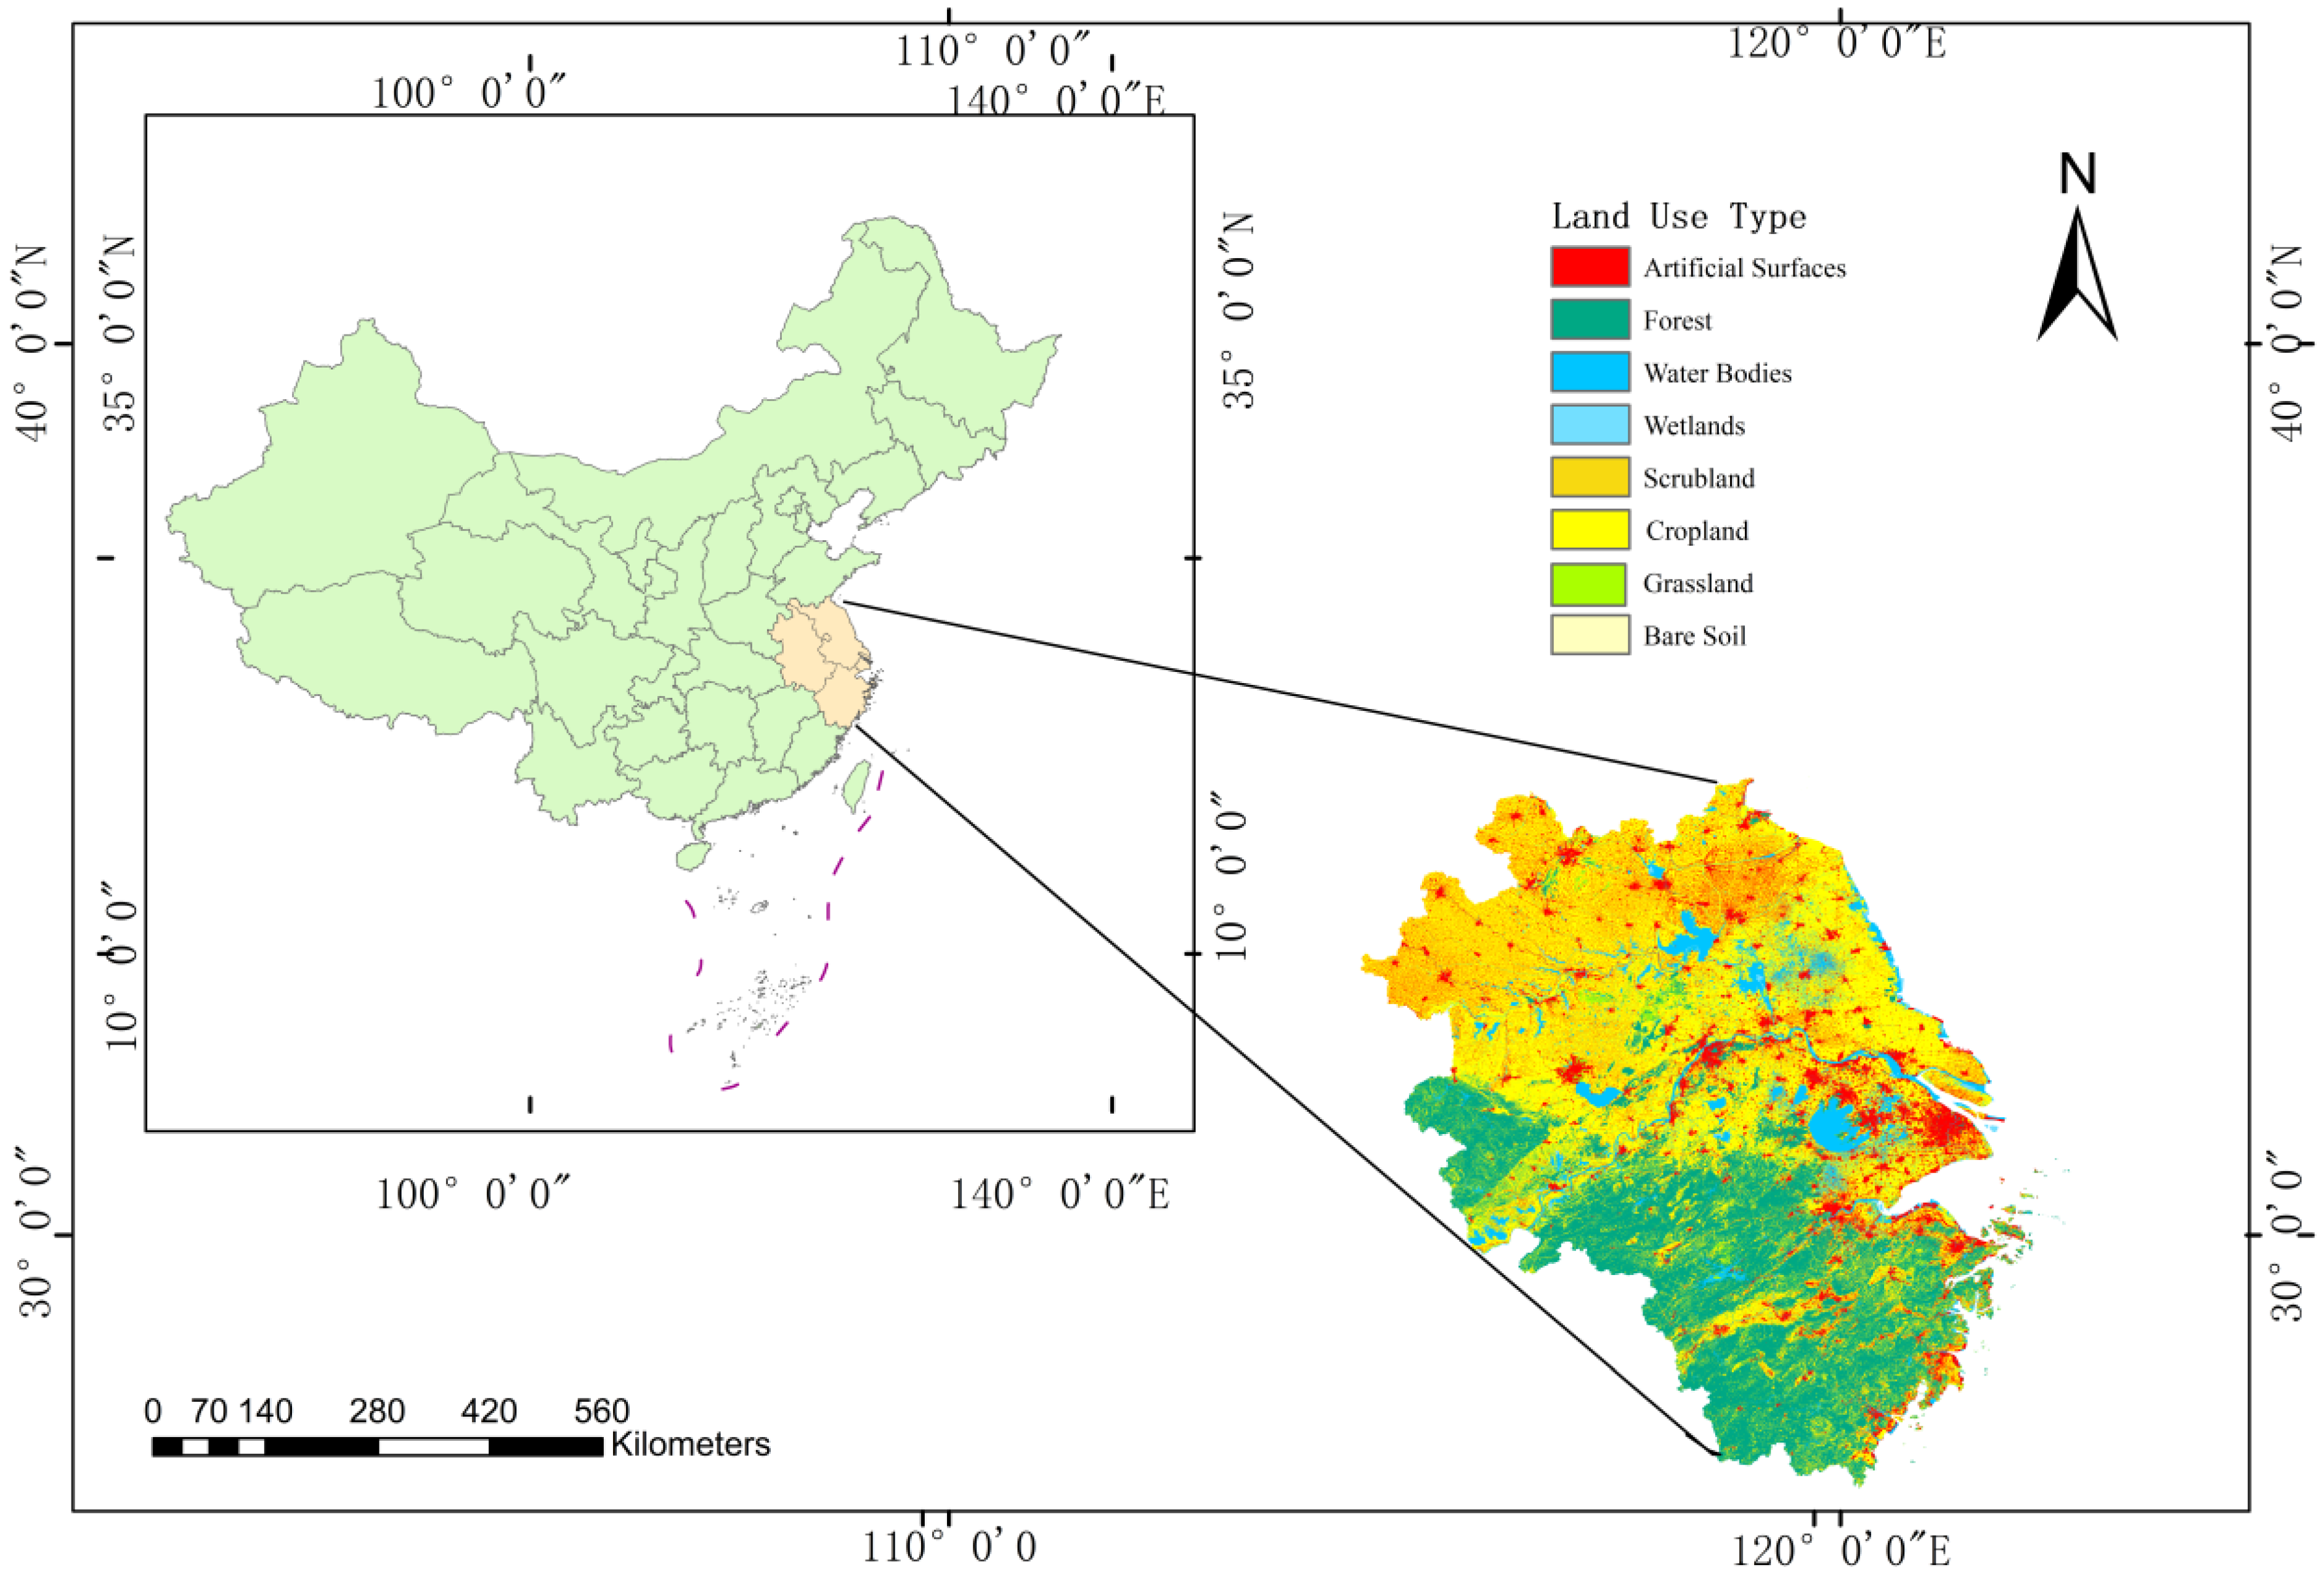
This study examines the YRD (27°12′–34°20′ N, 116°21′–123°10′ E) in China, encompassing 41 cities across Shanghai, Jiangsu, Zhejiang, and Anhui, as shown in Figure 2. Representing 3.7% of Chinese land area yet 24.1% of its GDP, the YRD epitomizes high-density polycentric urbanization. Its selection reflects dual significance: (1) a microcosm of urbanization pressures including urbanization surge, wetland loss, and pollution; (2) a green innovation hub with 25% of national R&D investment and cutting-edge eco-technologies. This duality offers globally transferable insights for balancing ecological resilience and innovation in megacity regions.

2.2. Data

This study employed panel data from 41 prefecture-level cities within the YRD from 2010 to 2023. The data were sourced from a multi-tiered system of authoritative references: (1) provincial statistical yearbooks; (2) national statistical yearbooks including the China City Statistical Yearbook, China Environmental Statistical Yearbook, and China Statistical Yearbook on Science and Technology; (3) municipal-level documents such as Water Conservancy Yearbooks, economic and social development bulletins, and government work reports; and (4) remote sensing data, where the vegetation coverage index and wetland area change rate was calculated based on GlobeLand30 data and the annual average Normalized Difference Vegetation Index (NDVI). Given the multi-source and heterogeneous nature of these data, which vary in statistical units, spatial resolution, and precision, a standardized processing procedure was implemented to ensure robustness and comparability. All data were harmonized to the administrative boundaries of the 41 prefecture-level cities as the fundamental spatial units. For raster-based remote sensing data, zonal statistics were applied to calculate annual average NDVI values per city, thereby aggregating pixel-level data to the city scale. Economic indicators were adjusted to constant 2010 prices and expressed in standardized units. Any missing values were addressed through linear interpolation and time-series trend extrapolation techniques. This framework established a high-precision, standardized, and reproducible data foundation for the subsequent spatiotemporal analysis.

2.3. Index System Construction

2.3.1. Green Innovation Efficiency (GIE) Evaluation Framework

Green innovation intrinsically internalizes environmental externalities, maximizing outputs while minimizing resource inputs and ecological costs [29]. Our evaluation system therefore captures innovation effectiveness and environmental sustainability through three dimensions: inputs, desirable outputs and undesirable outputs (Table 1). This framework extends traditional innovation metrics by incorporating negative externalities to quantify efficiency under ecological constraints.

2.3.2. Urban Ecological Resilience (UER) Evaluation Framework

This study constructed the UER evaluation system based on the PSR model. Proposed by the United Nations Environment Programme (UNEP), the PSR model describes how human activities pressure ecosystems, the resulting environmental state, and how societal responses dynamically interact. This framework directly reflects core aspects of ecological resilience, namely an urban ecosystem’s capacities to withstand pressure, maintain stability, and adapt to disturbances [30]. Within this framework, the following is true:
  • The pressure subsystem quantifies the stress intensity of socioeconomic activities on the ecosystem. Indicators like per capita industrial wastewater discharge are selected to directly reflect the pressure-bearing capacity characterizing the system’s risk.
  • The state subsystem assesses the real-time health level of the ecosystem’s structure and function. Metrics like built-up area green coverage rate and wetland area change rate capture the system’s efficacy in preserving stability and functional continuity during disturbances.
  • The response subsystem measures socio-technical interventions against ecological risks. Its distinctive feature is the systematic integration of green technology innovation as a driving force. Specifically, this subsystem quantifies the effectiveness of pollution control technologies such as per capita industrial SO2 removal and the implementation level of resource circulation technologies such as centralized sewage treatment rate.
The selection of indicators for the GIE and UER evaluation systems was guided by three core principles to ensure necessity and scientific rigor. First, the selection was strictly aligned with the theoretical frameworks of Pressure–State–Response and green innovation theory to comprehensively represent system inputs, outputs, and managerial responses. Second, we incorporated indicators that are robust and widely adopted in the existing literature using similar models, thereby ensuring the comparability and validity of our results. Third, priority was given to indicators with data available from authoritative national statistical yearbooks to guarantee the reliability of the panel data. Furthermore, recognizing the Yangtze River Delta’s specific vulnerabilities as a low-lying alluvial and estuary region, we introduced two unique indicators: the wetland area change rate and the percentage of flood control investment. This adaptation enhances the contextual accuracy of our assessment beyond generic metrics.

3. Methodologies

3.1. Super-SBM DEA Model

To quantify green innovation efficiency (GIE) and its dual outputs which include economic–environmental benefits and pollution, this study employs the output-oriented SBM model [31,32]. Unlike radial DEA methods, the non-radial SBM framework simultaneously addresses excess inputs, desirable output shortfalls, and undesirable outputs, thereby overcoming the slack variable limitation and capturing the complexity of urban innovation systems. Each city is modeled as a decision-making unit (DMU) with three core components: inputs, desirable outputs, and undesirable outputs. The model specification is given below:
ρ * = min 1 1 m i = 1 m s i x i 0 1 + 1 s 1 + s 2 [ i = 1 s 1 s r g y r 0 g + i = 1 s 2 s r b u r 0 b ]
s . t . x 0 = X λ + s y 0 g = Y g λ s g u 0 b = U b λ + s b s 0 , s g 0 , s b 0 , λ 0
where x 0 denotes the input vector, y 0 g represents the desirable output vector, and u 0 b indicates the undesirable output vector, with ρ * being the resulting green innovation efficiency (GIE) value. A DMU achieves efficiency if and only if all slack variables equal zero ( s - =   0 , s g =   0 , s b =   0 ), which corresponds to ρ * = 1 . The presence of any non-zero slack variable ( s - , s g , or s b ) indicates inefficiency, suggesting potential for improvement through input–output quantity optimization.

3.2. Entropy Weight Method

To objectively determine indicator weights, this study applied the entropy weight method. In this process, min-max normalization was employed to eliminate dimensional effects while preserving relative distribution patterns of the raw data [33]. The formula used is as follows:
Firstly, standardization of positive indicators is performed:
x i j = x i j min ( x 1 j , x 2 j , , x n j ) max ( x 1 j , x 2 j , , x n j ) min ( x 1 j , x 2 j , x n j )
Standardization of negative indicators is performed:
x i j = max ( x 1 j , x 2 j , x n j ) x i j max ( x 1 j , x 2 j , , x n j ) min ( x 1 j x 2 j , x n j )
Next, the entropy value ej is defined as follows:
e j = 1 ln ( n ) i = 1 n x i j i = 1 n x i j ln x i j i = 1 n x i j
Then, we derive the entropy weight wj using the following formula:
w j = 1 e j j = 1 m ( 1 e j )
Finally, we compute comprehensive indicator weights and scores:
U = j = 1 m ( w j x i j )
where x i j is the standardized value of the j-th indicator for the i-th city (where i = 1, 2, …, n; j = 1, 2, …, m); wj is the weight calculated by using the entropy weight method; and U represents the score of urban ecological resilience.

3.3. Coupling Coordination Model

Coupling describes the phenomenon where multiple systems or patterns form interrelated and interdependent relationships through interaction [34,35]. This study regards the green innovation efficiency (GIE) system and the urban ecological resilience (UER) system as two interacting subsystems. The coupling degree between them specifically refers to the intensity of interaction generated through key coupling elements. The formula used is as follows:
C = 2 ( U 1 × U 2 ) / [ ( U 1 + U 2 ) ( U 1 + U 2 ) ] 1 2
where C represents the coupling degree, U 1 represents the state or level of the GIE system, and U 2 represents the development stage achieved by the UER system. The value of the coupling degree ranges from 0 to 1. A larger C value, closer to ordered development, indicates a stronger correlation between the two systems. Conversely, the systems are more disordered. The level of coupling degree reflects the closeness of mutual influence between systems, but it alone cannot determine whether this interaction is benign or coordinated. Therefore, it is necessary to further introduce the coordination degree (T) and the coupling coordination degree (D), as shown in Equations (9) and (10).
T = α U 1 + β U 2
D = C × T
where T quantifies the synergistic level. D comprehensively characterizes both the interaction intensity and co-development state of the two systems. The coefficients α and β represent the relative weights assigned to the green innovation efficiency and the urban ecological resilience subsystems in the calculation of the synergistic level, under the constraint α + β = 1. The weights are set as α = β = 0.5. This is based on the principle of strategic equivalence between technological innovation and ecological security, which serves as a cornerstone of sustainable urban development under China’s “dual carbon” policy framework. This weighting scheme is also consistent with established methodologies in regional coupling coordination studies [36]. The D value ranges within [0, 1], with higher values indicating stronger coordination. Following prior research, the coupling coordination states are classified into the categories presented in Appendix A.

3.4. Spatial Auto-Correlation

Spatial auto-correlation serves as a crucial method for measuring the spatial association of geographic elements, primarily encompassing global and local spatial auto-correlation. To characterize the global association pattern of the coupled coordination between GIE and UER in the YRD, this study employed the global Moran’s I index. Furthermore, local Moran’s I indices were utilized to analyze the localized association characteristics of this coupled coordination within the study area. The specific computational procedures followed those outlined by Gai et al. [36].

3.5. Geodetector Model

The Geodetector model quantifies spatial heterogeneity and identifies the dominant drivers influencing the coupling coordination degree between GIE and UER through detecting factor-stratified heterogeneity. Its core mechanism computes explanatory power (q-statistic) via the following equation:
q = 1 h = 1 L N h σ h 2 N σ 2
where q denotes the detection power value of the influencing factor; L represents a stratum (or category) of the factor; Nh and N are the number of samples in stratum h and the entire region, respectively; σh2 and σ2 are the variance in the coupling coordination degree within stratum h and the entire region, respectively.
Prior to the Geodetector analysis, all continuous driving factors were discretized into categorical variables using the Natural Breaks (Jenks) method to align with the model’s requirement for categorical inputs [37,38,39]. The relative importance (q-value ranking) of the driving factors remained consistent under alternative discretization schemes (Quantile, 6-class Natural Breaks), confirming the robustness of our findings (Supplementary Table S2 for details).

3.6. Spatiotemporal Weighted Regression

The GTWR model, an extension of the Geographically Weighted Regression (GWR) model, simultaneously accounts for both spatial and temporal non-stationarity. This enables simultaneous exploration of the underlying mechanisms driving spatiotemporal variations in geographical phenomena. This study employed the GTWR model to analyze the factors influencing the CCD between GIE and UER in the YRD over the 2010–2023 period. The specific computational formula is presented as follows:
y i = β 0 ( u i , v i , t i ) + k = 1 p β k ( u i , v i , t i ) x i k + ε i
where y i is the dependent variable value at spatiotemporal point i with coordinates ( u i , v i , t i ) ; β 0 ( u i , v i , t i ) is the local intercept at i ; β k ( u i , v i , t i ) is the local coefficient for independent variable k at i ( k = 1 , 2 , , p ), with p being the total number of independent variables; x i k is the value of variable k at i ; e i is the random error at i .
To ensure computational rigor and reproducibility, all analyses were conducted using specialized software tailored to each methodological approach. The Super-SBM DEA model was computed in MATLAB 2020a to precisely measure efficiency under ecological constraints. Data normalization, entropy weight calculations, and spatial autocorrelation analyses were performed using Stata 16. The Geodetector model, developed by Professor Wang Jinfeng’s team, was employed to identify key driving factors via its dedicated software. All spatial visualizations such as distribution maps of GIE were generated using ArcGIS 10.8.2. This integrated software framework supports robust, transparent, and replicable empirical results.

4. Results

4.1. Analyzing the Spatiotemporal Evolution of Green Innovation Efficiency (GIE)

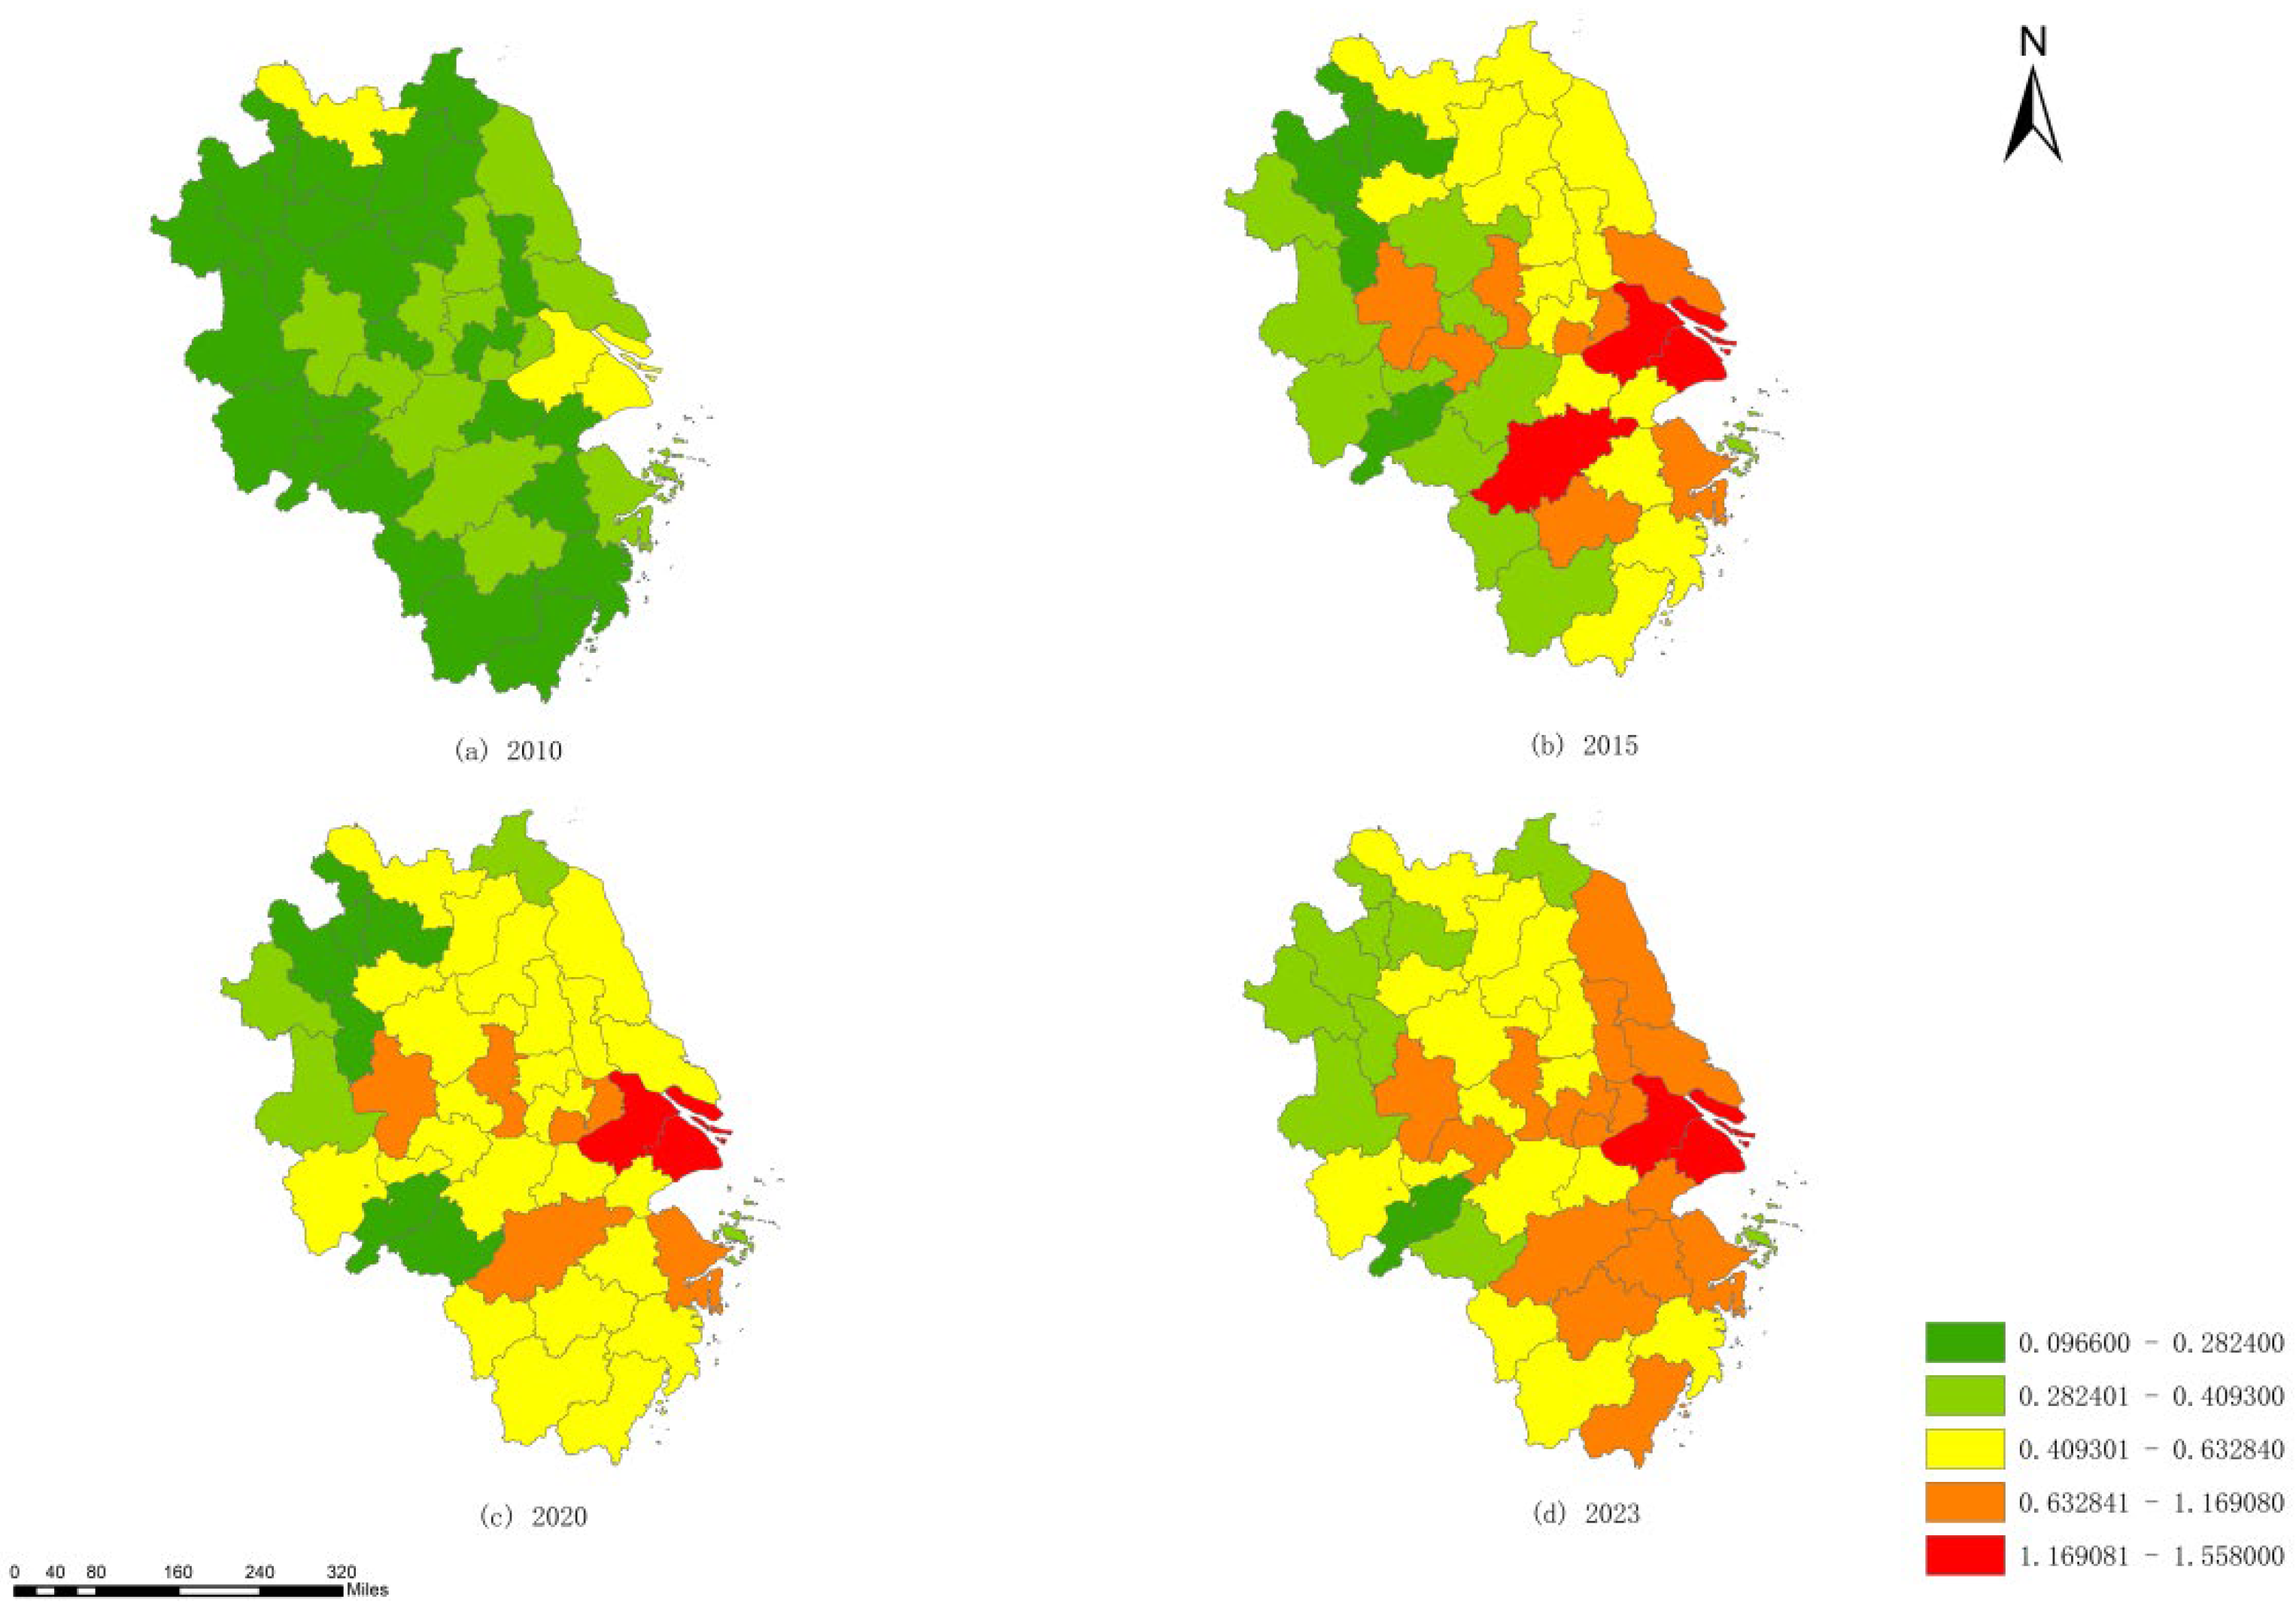
The temporal evolution of green innovation efficiency (GIE) in the Yangtze River Delta is depicted in Figure 3a. Between 2010 and 2023, the regional average GIE exhibited a steady upward trajectory from 0.252 to 0.692, progressing through distinct phases of gradual initial improvement, fluctuating growth, and rapid acceleration. This dynamic was shaped by a complex interplay of technological progress, market development, and policy support. Specifically, during the initial stage (2010–2015), growth was moderate, constrained by nascent green technologies, limited consumer environmental awareness, and an industrial structure still dominated by pollution-intensive sectors. Although policy initiatives such as the Shanghai Pilot Free Trade Zone facilitated technology transfer, these were insufficient to fully counteract structural limitations. The period from 2016 to 2020 was characterized by fluctuating growth. This phase was driven by advancements in digital monitoring, declining costs of renewable energy, and rising consumer demand for eco-friendly products [40]. However, the growth path was not smooth, as the system underwent internal adjustments and responded to external shocks, as evidenced by the minor setback in 2017. Despite these fluctuations, the overall trend remained solidly positive, consolidating the gains from the previous period. The post-2020 period marked a decisive break towards rapid acceleration, as the pandemic, while initially disruptive, ultimately acted as a catalyst by forcing a rapid shift toward digital R&D and accelerating the formation of localized green manufacturing clusters. Enhanced regional policy measures further reinforced supply chain integration, facilitating a critical transition to endogenous innovation networks. This synergy of factors unlocked a new wave of growth, as evidenced by the record year-on-year increase of 10.9% in 2023.
As shown in Figure 4, spatial analysis reveals a persistent “east–high west–low” gradient in GIE across the Yangtze River Delta (YRD) from 2010 to 2023. This gradient is anchored by Shanghai’s sustained coastal leadership, which is supported by the city’s advanced international linkages and financial resources. Specifically, from 2010 to 2015, core polarization dominated with Shanghai–Suzhou (Jiangsu)–Hangzhou forming an eastern cluster that benefited from agglomeration economies. In contrast, northern Anhui cities (e.g., Bozhou) and northern Jiangsu areas (e.g., Huai’an) within the YRD remained efficiency-depressed due to less developed industrial foundations. The 2016–2019 phase witnessed rapid, multipolar improvement. This growth was characterized by Hefei’s emergence as a western innovation nucleus, driven by strategic R&D investments, which accelerated development along the Hefei–Wuhu–Ma’anshan corridor. Concurrently, coastal surges were observed in Ningbo and Jiaxing, where foreign investment played a key role. Throughout the 2020–2023 pandemic adjustment period, regional divergences intensified. This divergence was marked by digital technology adoption propelling efficiency gains in cities like Wuxi, Jinhua, and Nanjing. In contrast, traditional industrial hubs such as Huai’an and Lianyungang experienced declines due to slower technological adaptation. Meanwhile, northern Anhui border cities, including Suzhou, remained chronically low-efficiency zones, constrained by structural limitations and less integrated innovation ecosystems.

4.2. Analyzing the Spatiotemporal Evolution of Urban Ecological Resilience (UER)

The urban ecological resilience (UER) level in the Yangtze River Delta showed a strong and consistent upward trend from 2010 to 2023, rising from 0.228 to 0.395, as shown in Figure 3b. This evolution can be divided into three distinct phases. The initial stage (2010–2015) was characterized by investment-driven growth, largely fueled by large-scale green infrastructure and pollution control projects, under national strategies such as the 12th Five-Year Plan. These “gray-green” engineering interventions, including new wastewater treatment plants and centralized waste processing facilities, significantly enhanced the “response” capacity of urban ecosystems, consistent with the PSR framework [30,41]. This approach reflects early environmental governance patterns that emphasized centralized, end-of-pipe solutions to combat pressing pollution issues. The mid-phase (2016–2020) sustained growth despite pressures from ongoing urban expansion and land consumption. Resilience improvements were supported by the institutionalization of earlier policies, including the strict enforcement of the 2018 “Environmental Protection Tax Law” and the national “Sponge City” pilot programs. This transition from standalone projects to systematic governance helped counterbalance negative impacts from urbanization, demonstrating enhanced adaptive capacity in urban management [42]. Notably, ecological systems saw little disruption in the 2020 COVID-19 pandemic, which highlighted their buffering capacity. During the 2021–2023 period, urban ecological resilience (UER) growth re-accelerated, reflecting a more adaptive and synergistic approach to regional sustainability. This was largely driven by the maturation of regional collaborative mechanisms. The Yangtze River Delta Ecological and Green Integrated Development Demonstration Zone exemplifies these mechanisms, which have enabled cross-jurisdictional ecological compensation and reduced administrative fragmentation. At the same time, the integration of nature-based solutions and digital governance significantly enhanced ecosystem connectivity and overall functionality. These developments improved the “state” subsystem not only through pollution control but also through transformative adaptation, allowing the system to reorganize toward higher functionality amid environmental stresses [43].
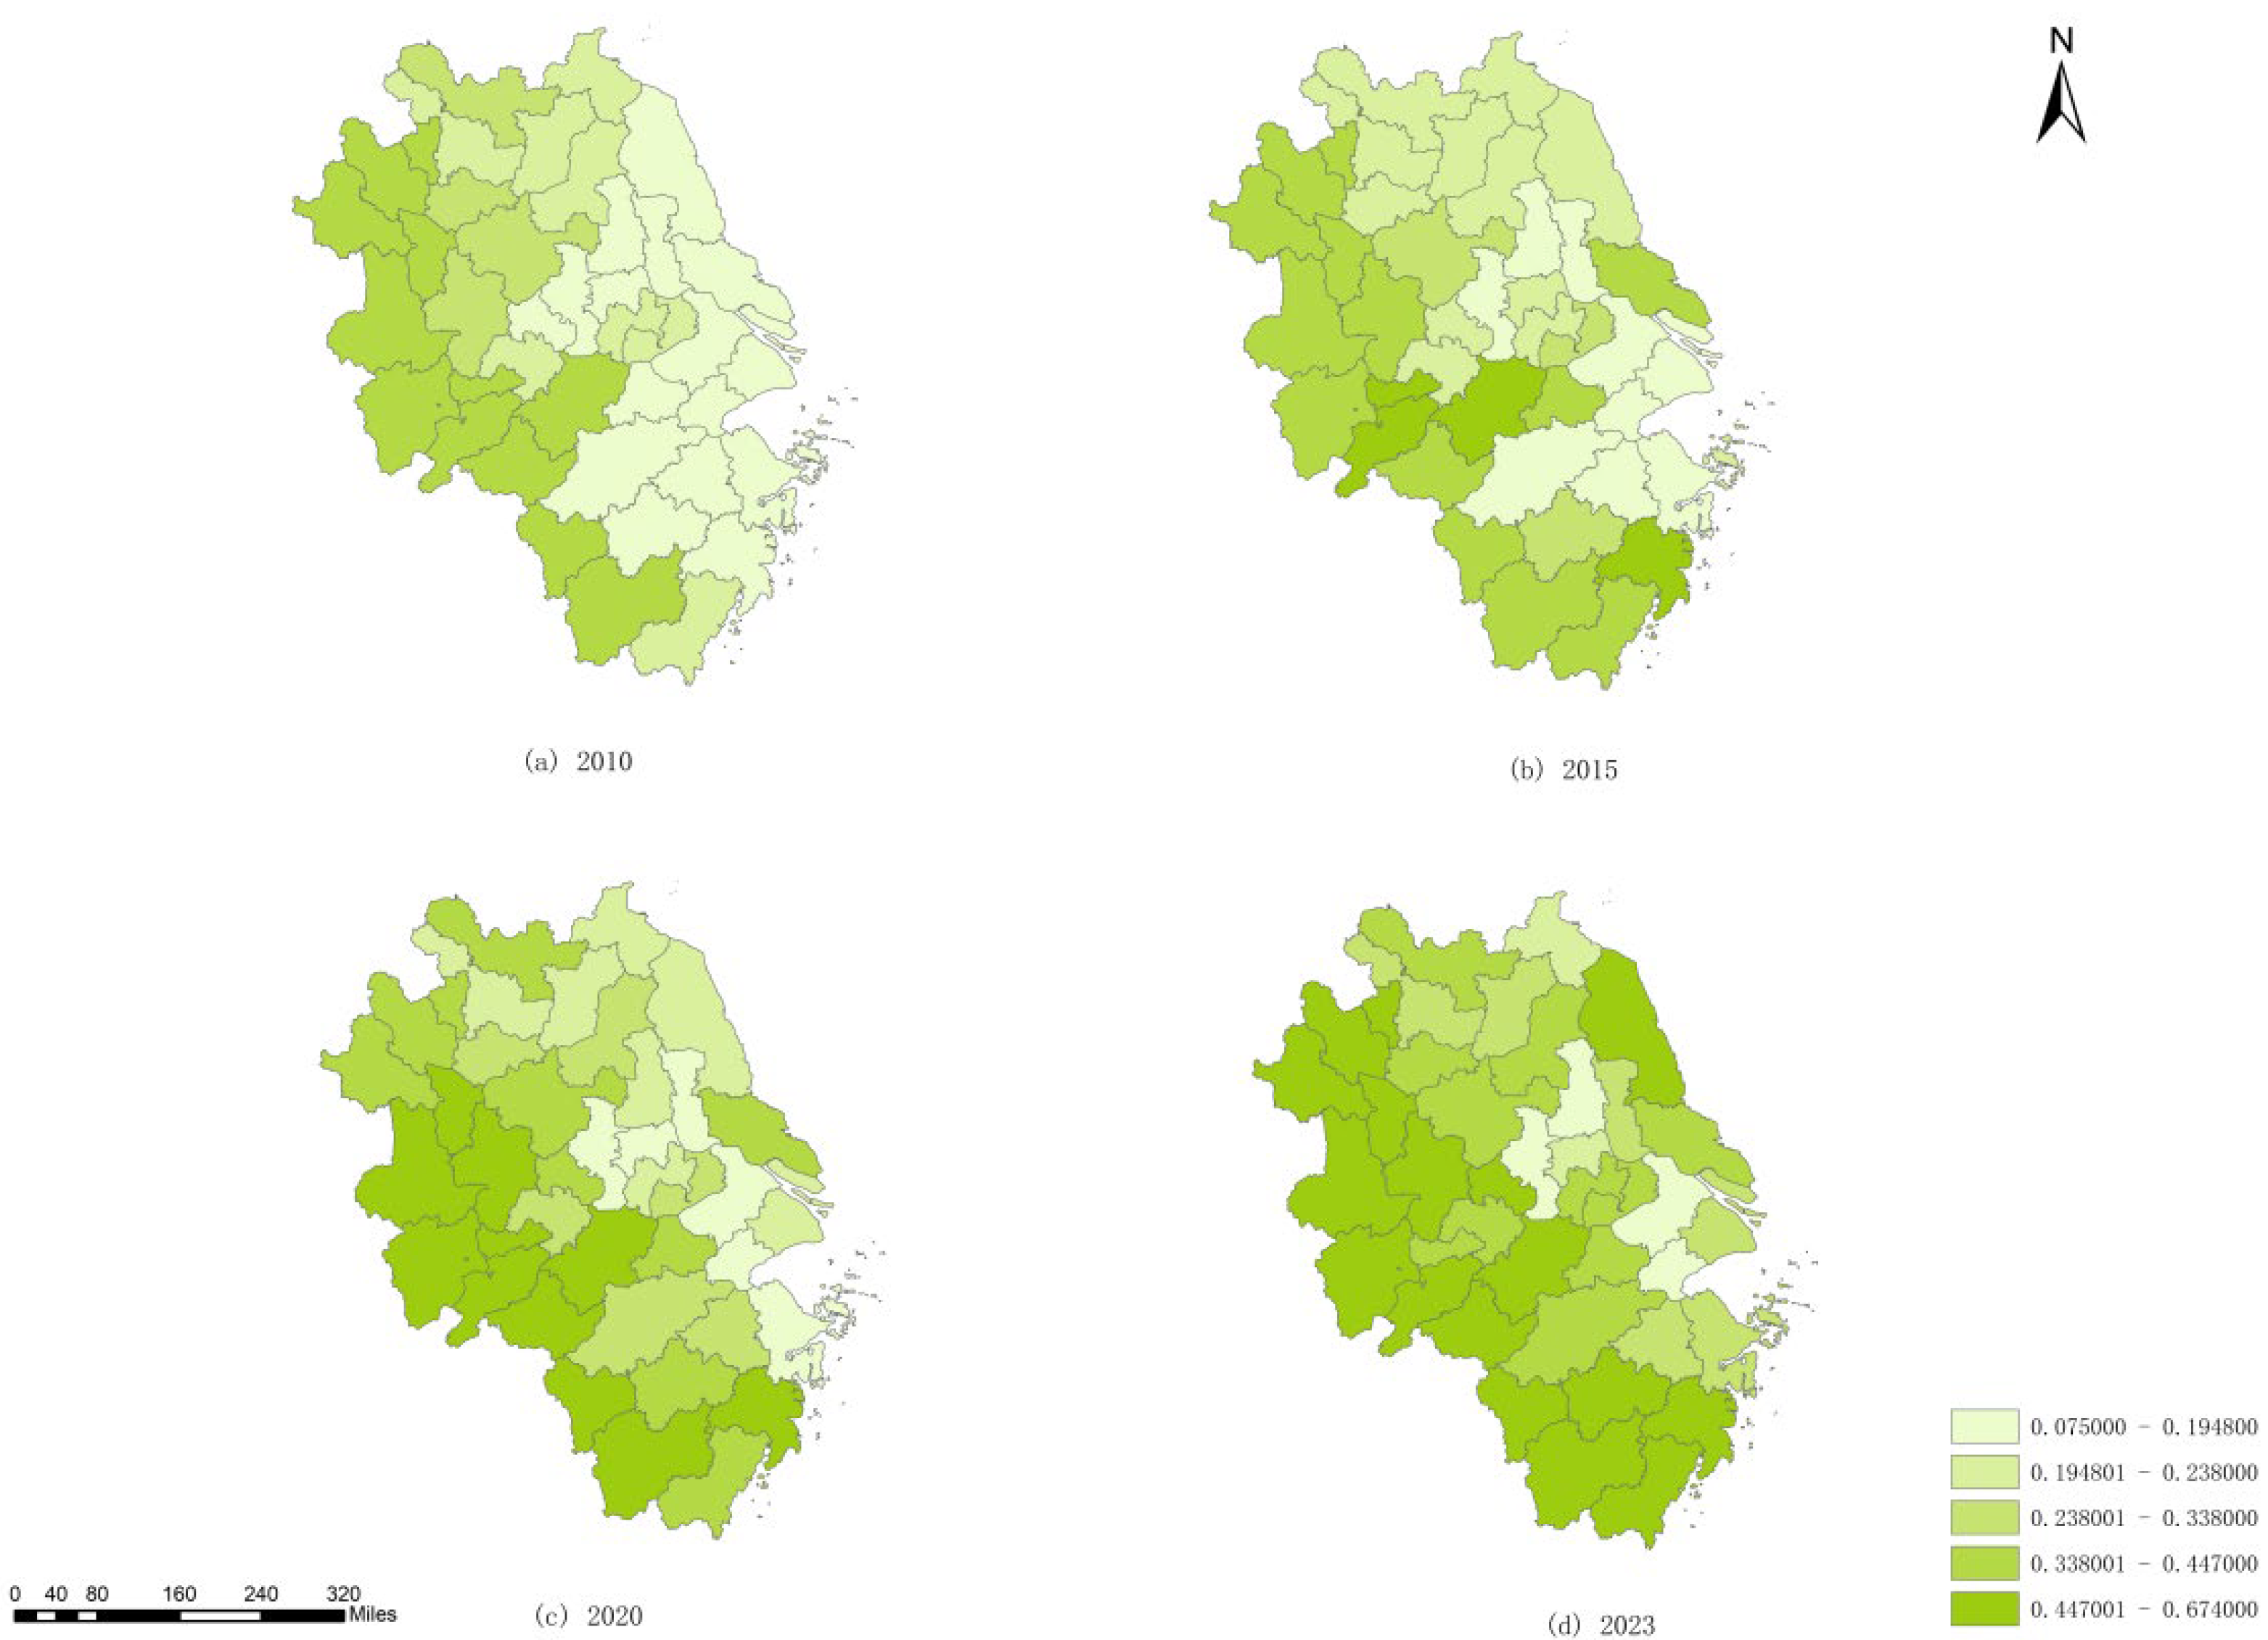
As shown in Figure 5, the spatial pattern of UER in the YRD underwent profound evolution from 2010 to 2023. The regional spatial pattern has evolved significantly. Initially dominated by a resilient western core alongside extensive underdeveloped areas, it has transitioned towards a more complex structure. This new pattern features a persistent western concentration, the emergence of multiple resilience hubs in the south and north, and entrenched underdevelopment in the east. Phase-specific dynamics show the following: From 2010 to 2015, high-resilience cities clustered in the west (e.g., Tongling, Chizhou), while low-resilience areas concentrated in the south (e.g., Hangzhou, Ningbo, Shaoxing) and the east (e.g., Shanghai, Suzhou, Nantong). During 2015–2020, cities in the south like Wenzhou and Taizhou and the north including Chuzhou and Xuancheng drove regional resilience improvement, with low-resilience areas transforming from contiguous distribution to scattered spots. By 2020–2023, a gradient pattern basically took shape: dense high-resilience zones in the west, clustered relatively high-resilience belts in the south, and low-resilience areas in the east. This fundamentally stems from the spatial mismatch between ecological endowments and urbanization pressures. The west, which relies on superior natural conditions, maintains high-resilience zones. In contrast, eastern core cities are constrained by ultra-high population density, excessive expansion of construction land, and inertia of heavy chemical industrial structures. These constraints lead to severe fragmentation of ecological space, forming persistent low-resilience zones.

4.3. Analyzing the Spatiotemporal Evolution of the Coupling Coordination Degree (CCD)

As shown in Figure 3c, the coupling coordination degree (CCD) increased steadily from 2010 to 2023, rising from a mildly discordant level (0.351) to one of primary coordination (0.650). This upward trajectory reflects a qualitative leap in systemic synergy, evolving through three distinct phases over this period. Specifically, the technology-driven phase (2010–2015) was characterized by low-speed cultivation, exhibiting high coupling yet low coordination. This gap resulted from shallow interactions: policies such as the Shanghai Free Trade Zone facilitated technology imports, yet deeper synergy was hindered by immature technologies, low ecological demand, and GDP-oriented governance. During the system consolidation phase (2015–2020), regional integration policies synergized multiple drivers, including reduced administrative fragmentation, growing consumer environmental awareness, and declining renewable energy costs. As a result, the growth in coordination outpaced that of coupling for the first time. The pandemic adjustment phase (2020–2023) revealed regional divergence. Digitally advanced cities such as Hangzhou stabilized through adaptive capacities, while industrially dependent regions experienced declines in green innovation efficiency (GIE). This contrast underscored the critical role of economic structure and inherent resilience in sustaining coordination. Notably, coordination inflection points in 2015 and 2018 aligned with implementation of the Yangtze River Delta Urban Agglomeration Development Plan and Eco-Green Integrated Development Demonstration Zone Plan, empirically validating institutional innovation’s catalytic role [44,45].
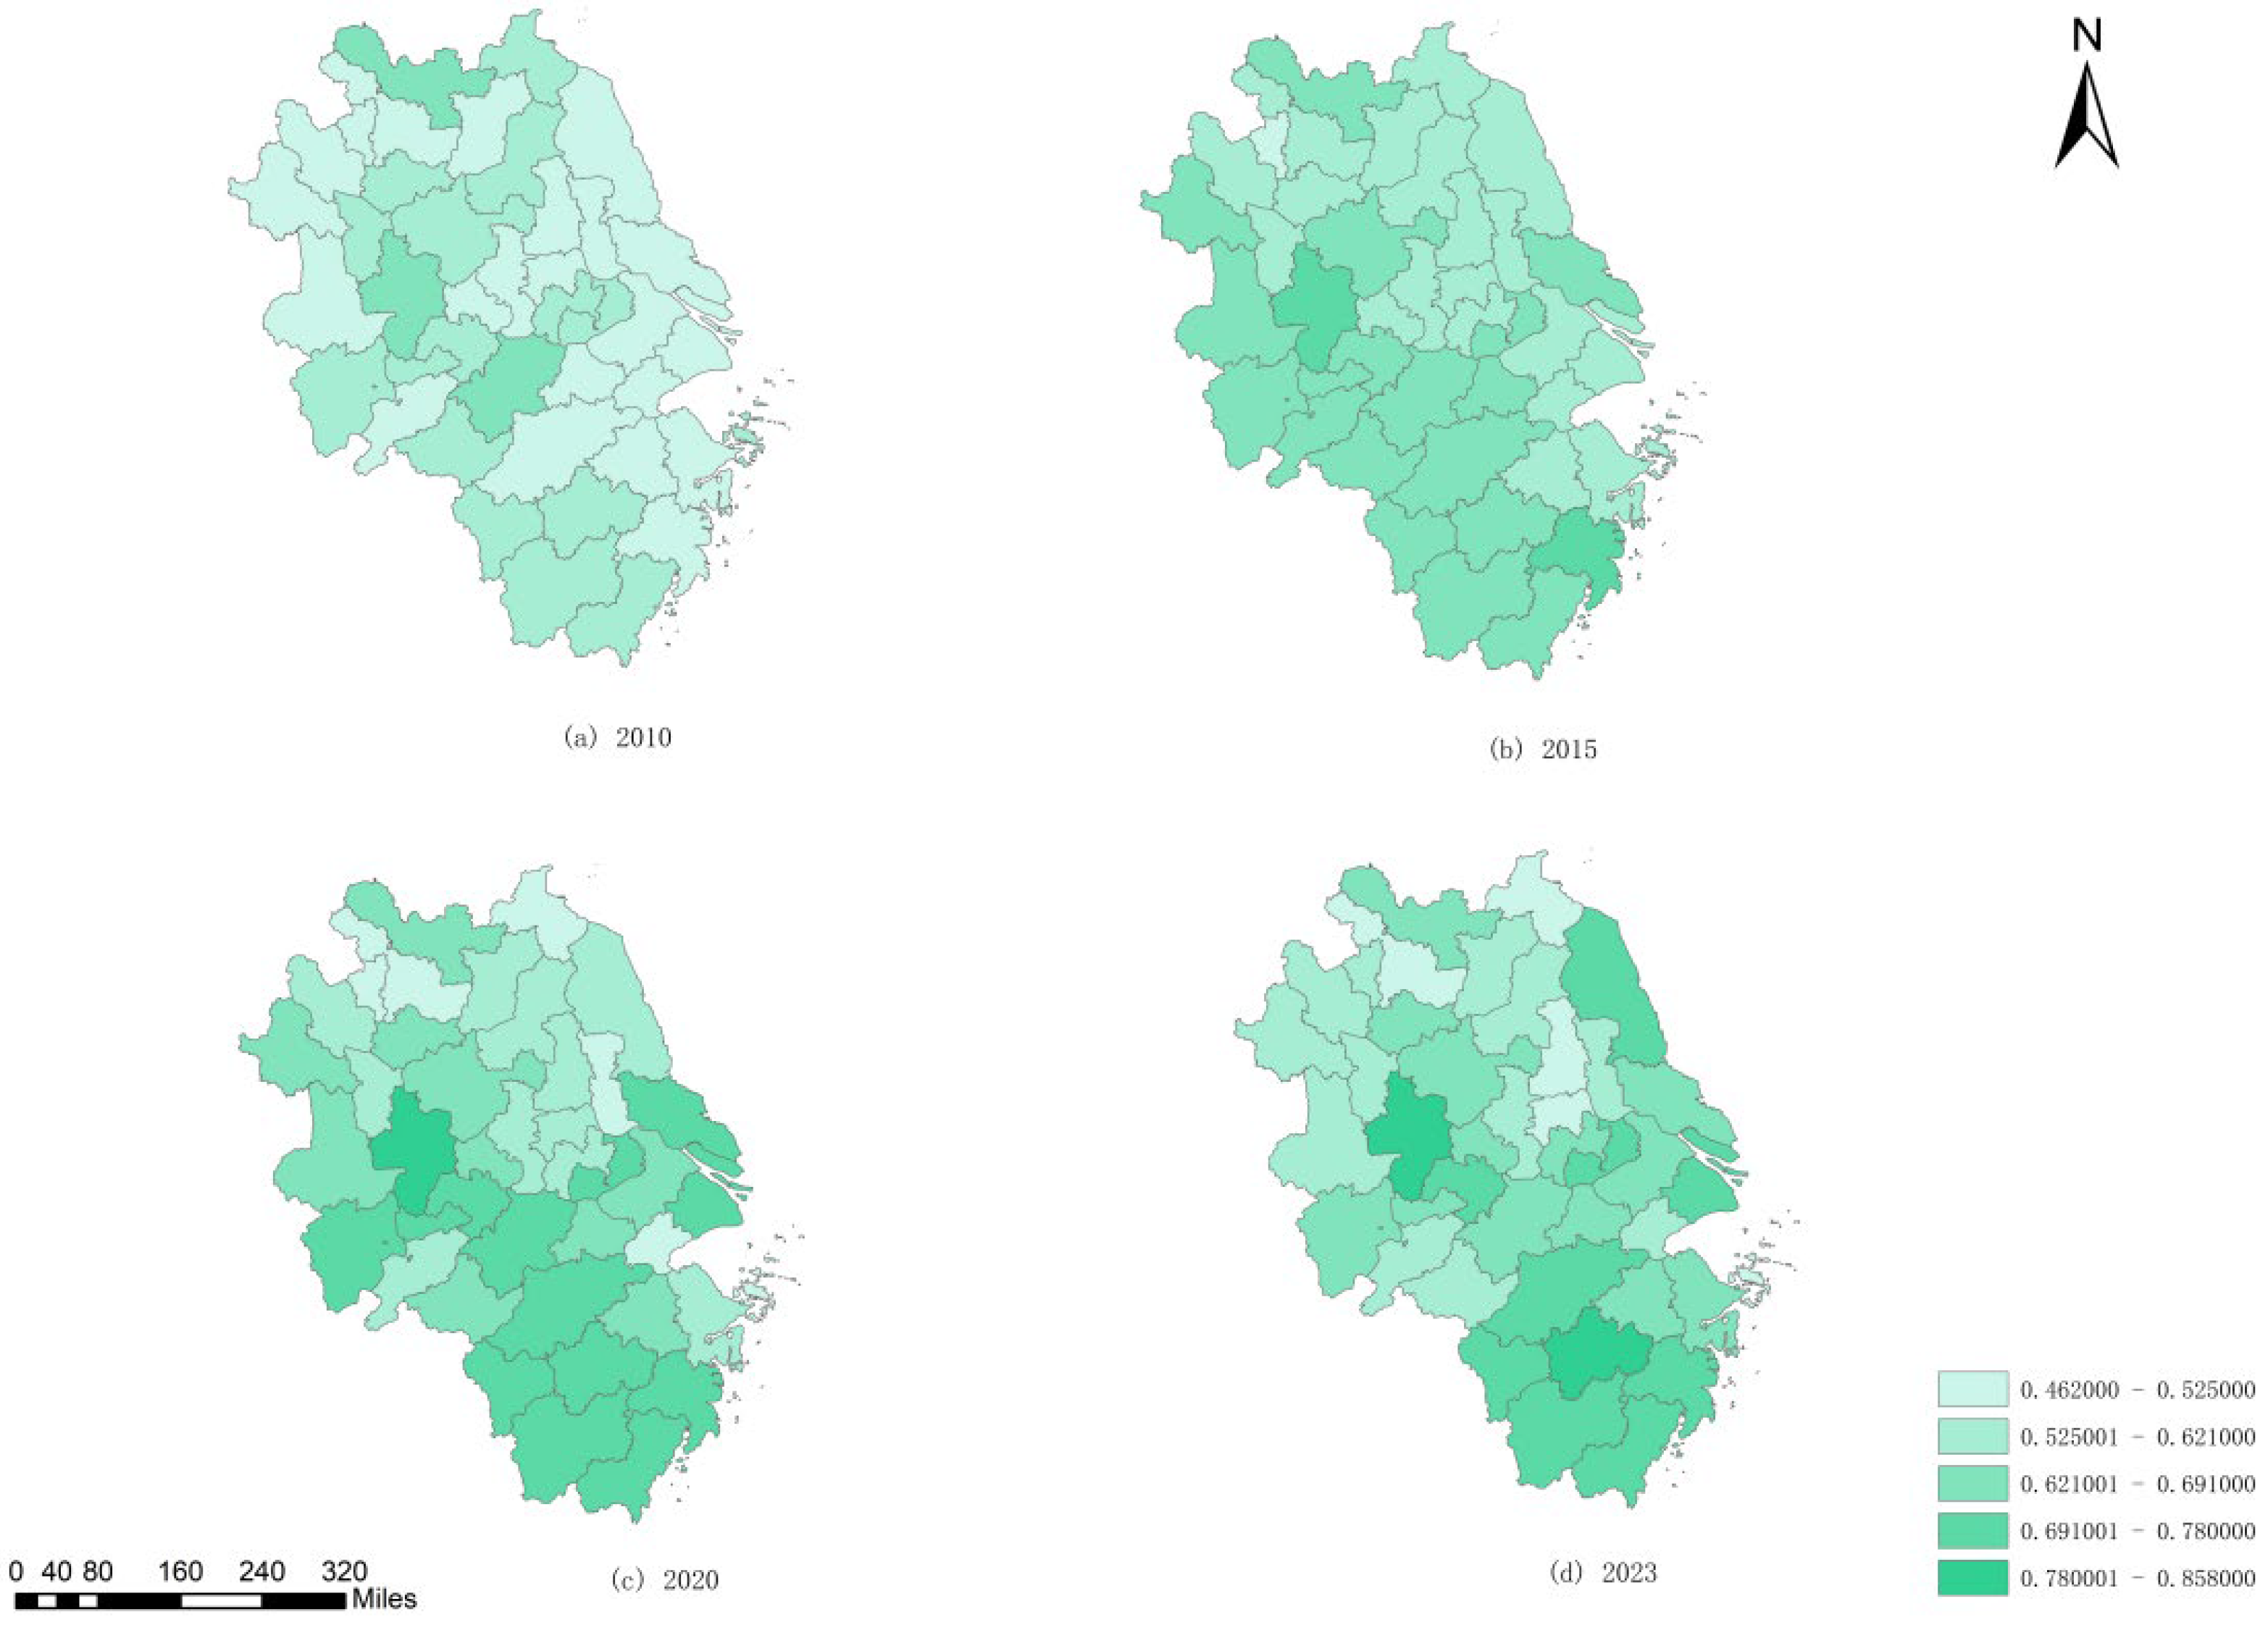
As illustrated in Figure 6, the spatial distribution of the CCD exhibits a pronounced east–high west–low gradient, characterized by three distinct regional typologies. The Hangzhou–Ningbo–Shaoxing coastal cluster exemplifies high coupling with intermediate coordination, achieving synergistic balance through concentrated innovation activity and market-driven ecological compensation mechanisms. In contrast, the Nanjing–Hefei–Wuhu corridor along the Yangtze River maintains high coupling with the primary coordination level, indicating persistent bottlenecks in institutional alignment and technology diffusion despite strong systemic interactions. Northern Anhui border cities, including Bozhou and Suzhou, consistently demonstrate low coupling and low coordination, forming a clear regional periphery. Functioning as inter-provincial frontiers, these areas are marginalized within broader regional innovation networks and ecological governance frameworks due to factors such as administrative fragmentation, misaligned policies, and limited fiscal capacity. This has resulted in a performance gap of approximately 10–23% in the CCD compared to more integrated inland regions. This disparity highlights a spatial paradox: relatively abundant ecological resources fail to translate into synergistic outcomes. This is largely due to localized innovation deficits and weak institutional integration, a finding consistent with existing empirical studies [46,47].

5. Spatial Heterogeneity of Driving Mechanisms for Coupling Coordination Degree (CCD) Evolution

5.1. Spatial Correlation of Coupling Coordination Degree (CCD)

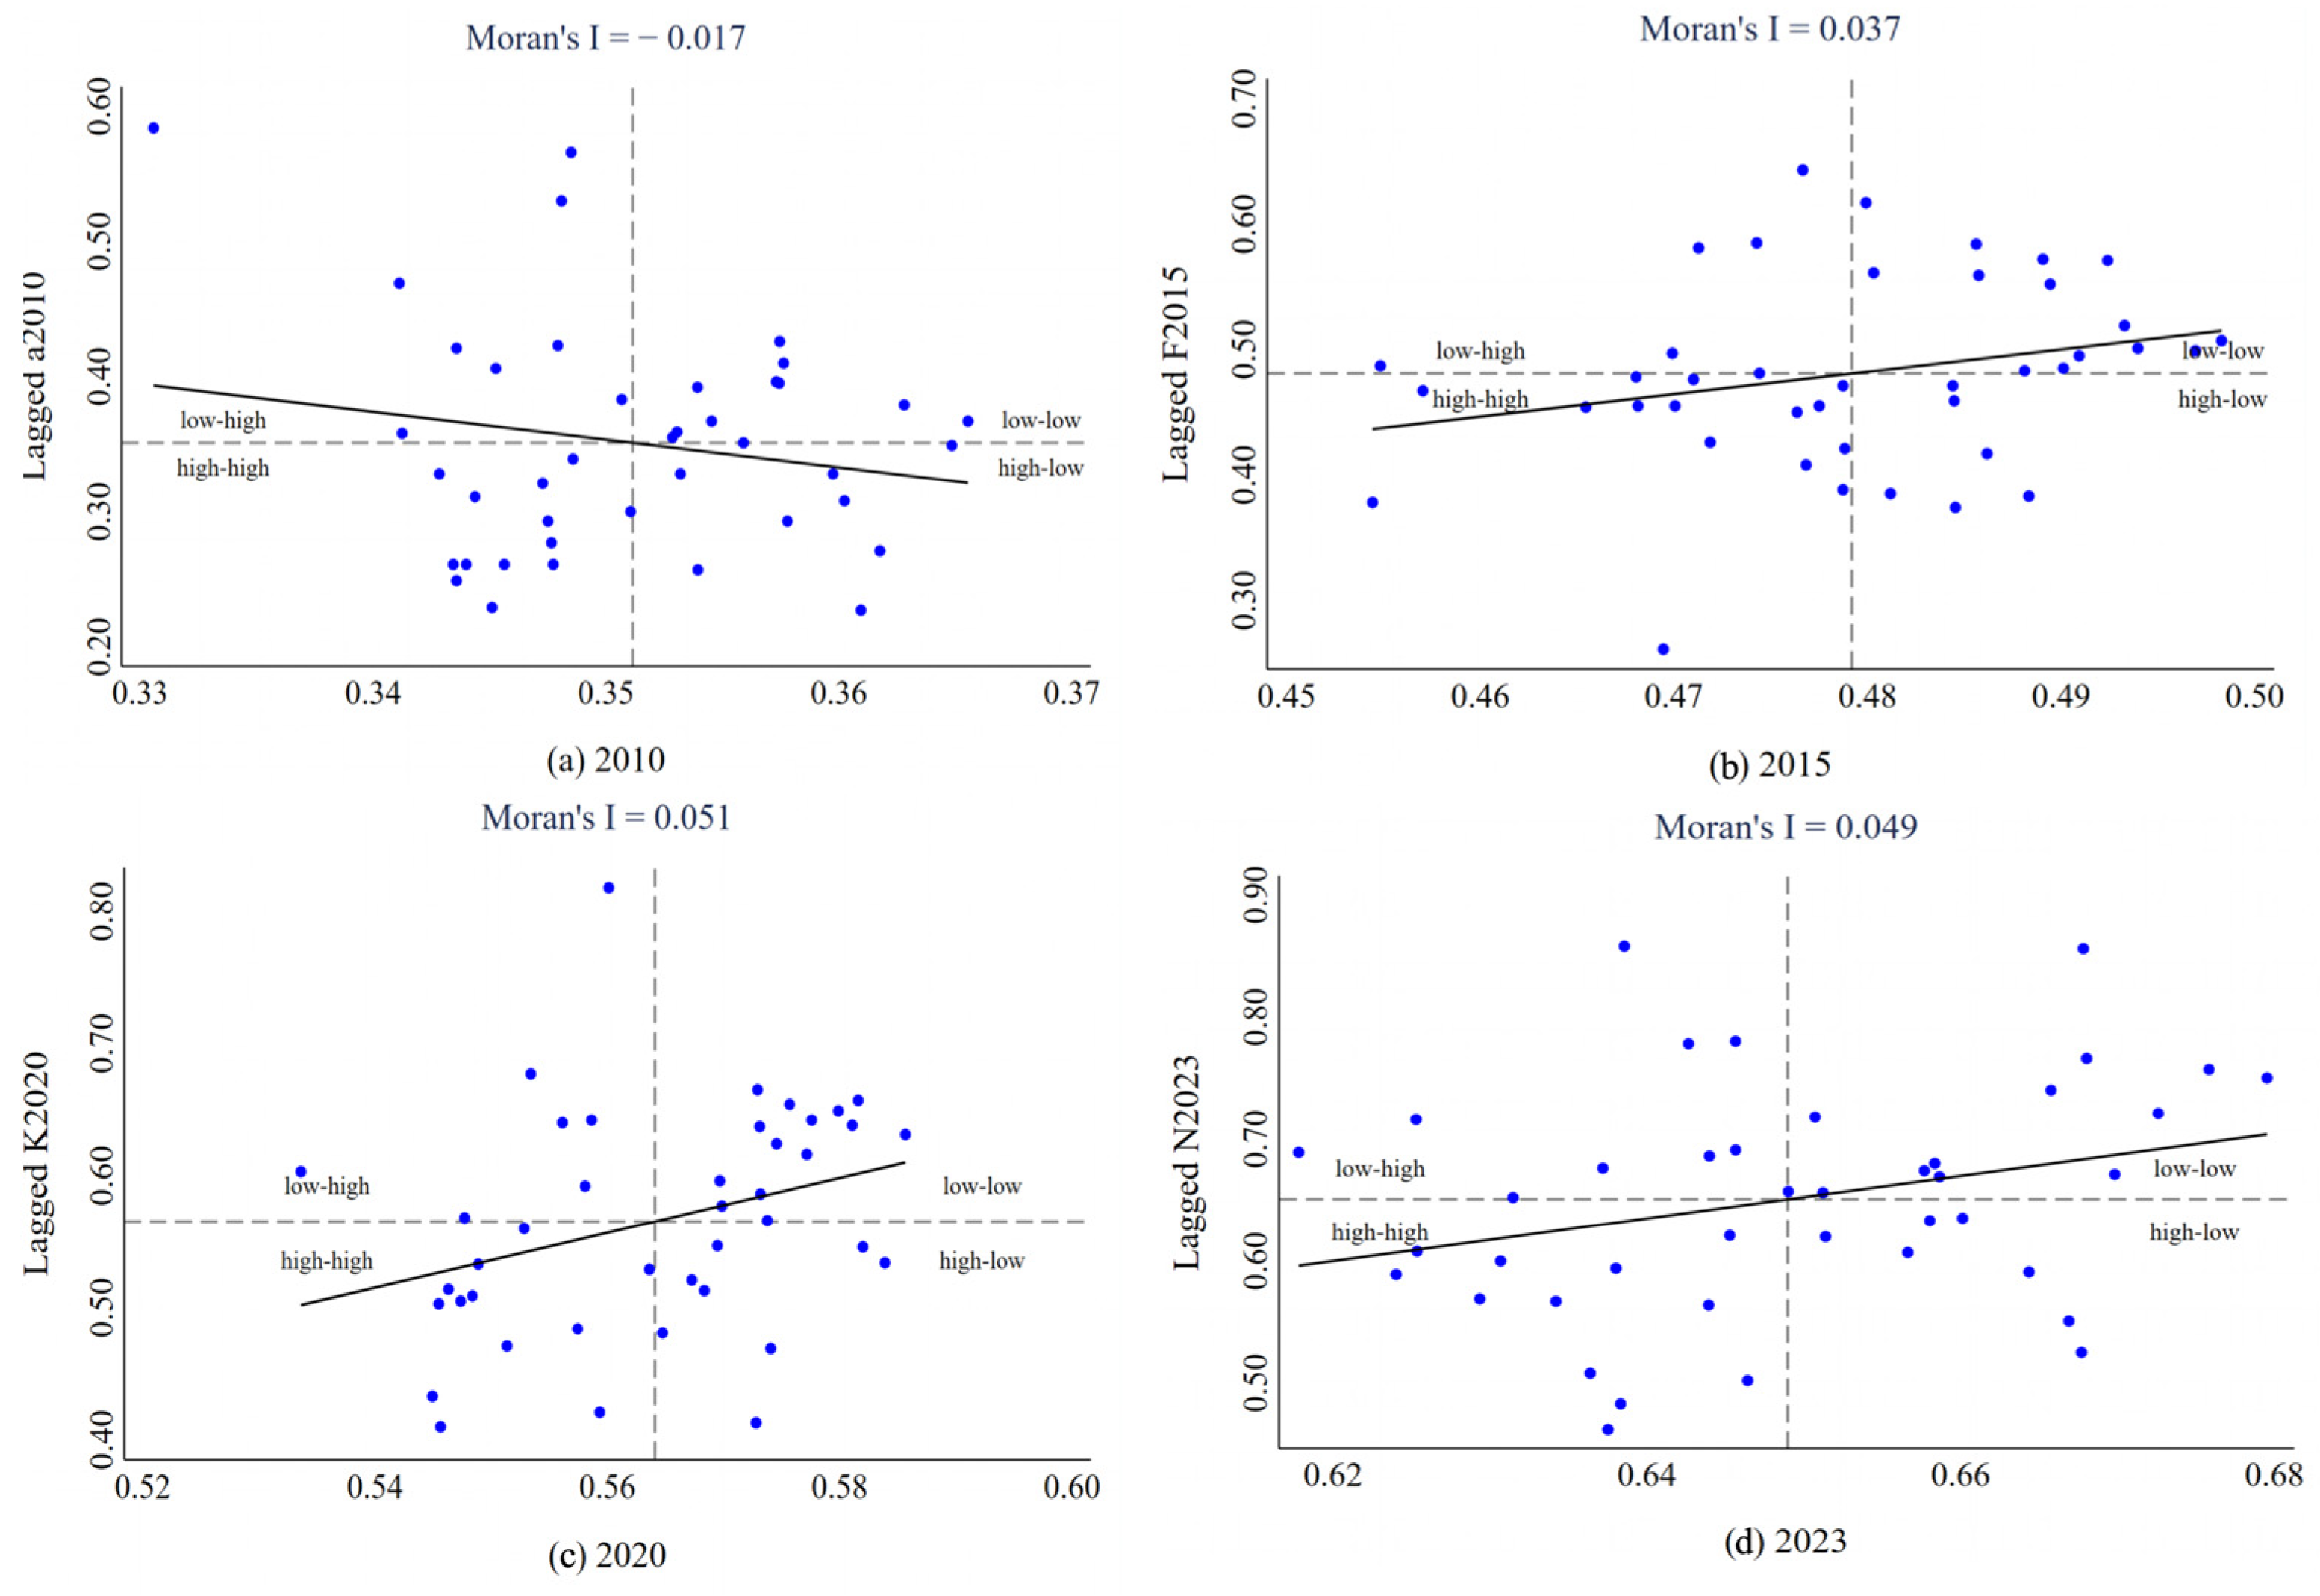
To analyze the spatial evolution characteristics of the coupling coordination degree (CCD) between green innovation efficiency (GIE) and urban ecological resilience (UER), a global spatial auto-correlation analysis was conducted for the study area from 2010 to 2023. As shown in Table 2, the global Moran’s I index exhibited an overall upward trend from 2010 to 2023. After being non-significant in 2010, it showed a significant positive spatial autocorrelation (p < 0.05) in most years after 2012. This indicates that the positive spatial dependence of the CCD strengthened and became a persistent feature over time.
Local spatial autocorrelation analysis identified a predominance of high–high and low–low clusters of the CCD across the Yangtze River Delta (YRD), as shown in Figure 7. High–high clusters were primarily concentrated along the Shanghai–Nanjing–Hangzhou–Ningbo innovation corridor, whereas low–low clusters were contiguously distributed across northern Anhui and Jiangsu provinces, including cities such as Fuyang and Suqian. Overall, these spatial patterns reflect a core–periphery structure with polarized differentiations. High–high clusters expanded along major development axes, whereas low–low clusters experienced increasing pressures for transformation and upgrading.

5.2. Dominant Drivers of the Coupling Coordination Degree (CCD) Identified by Geodetector

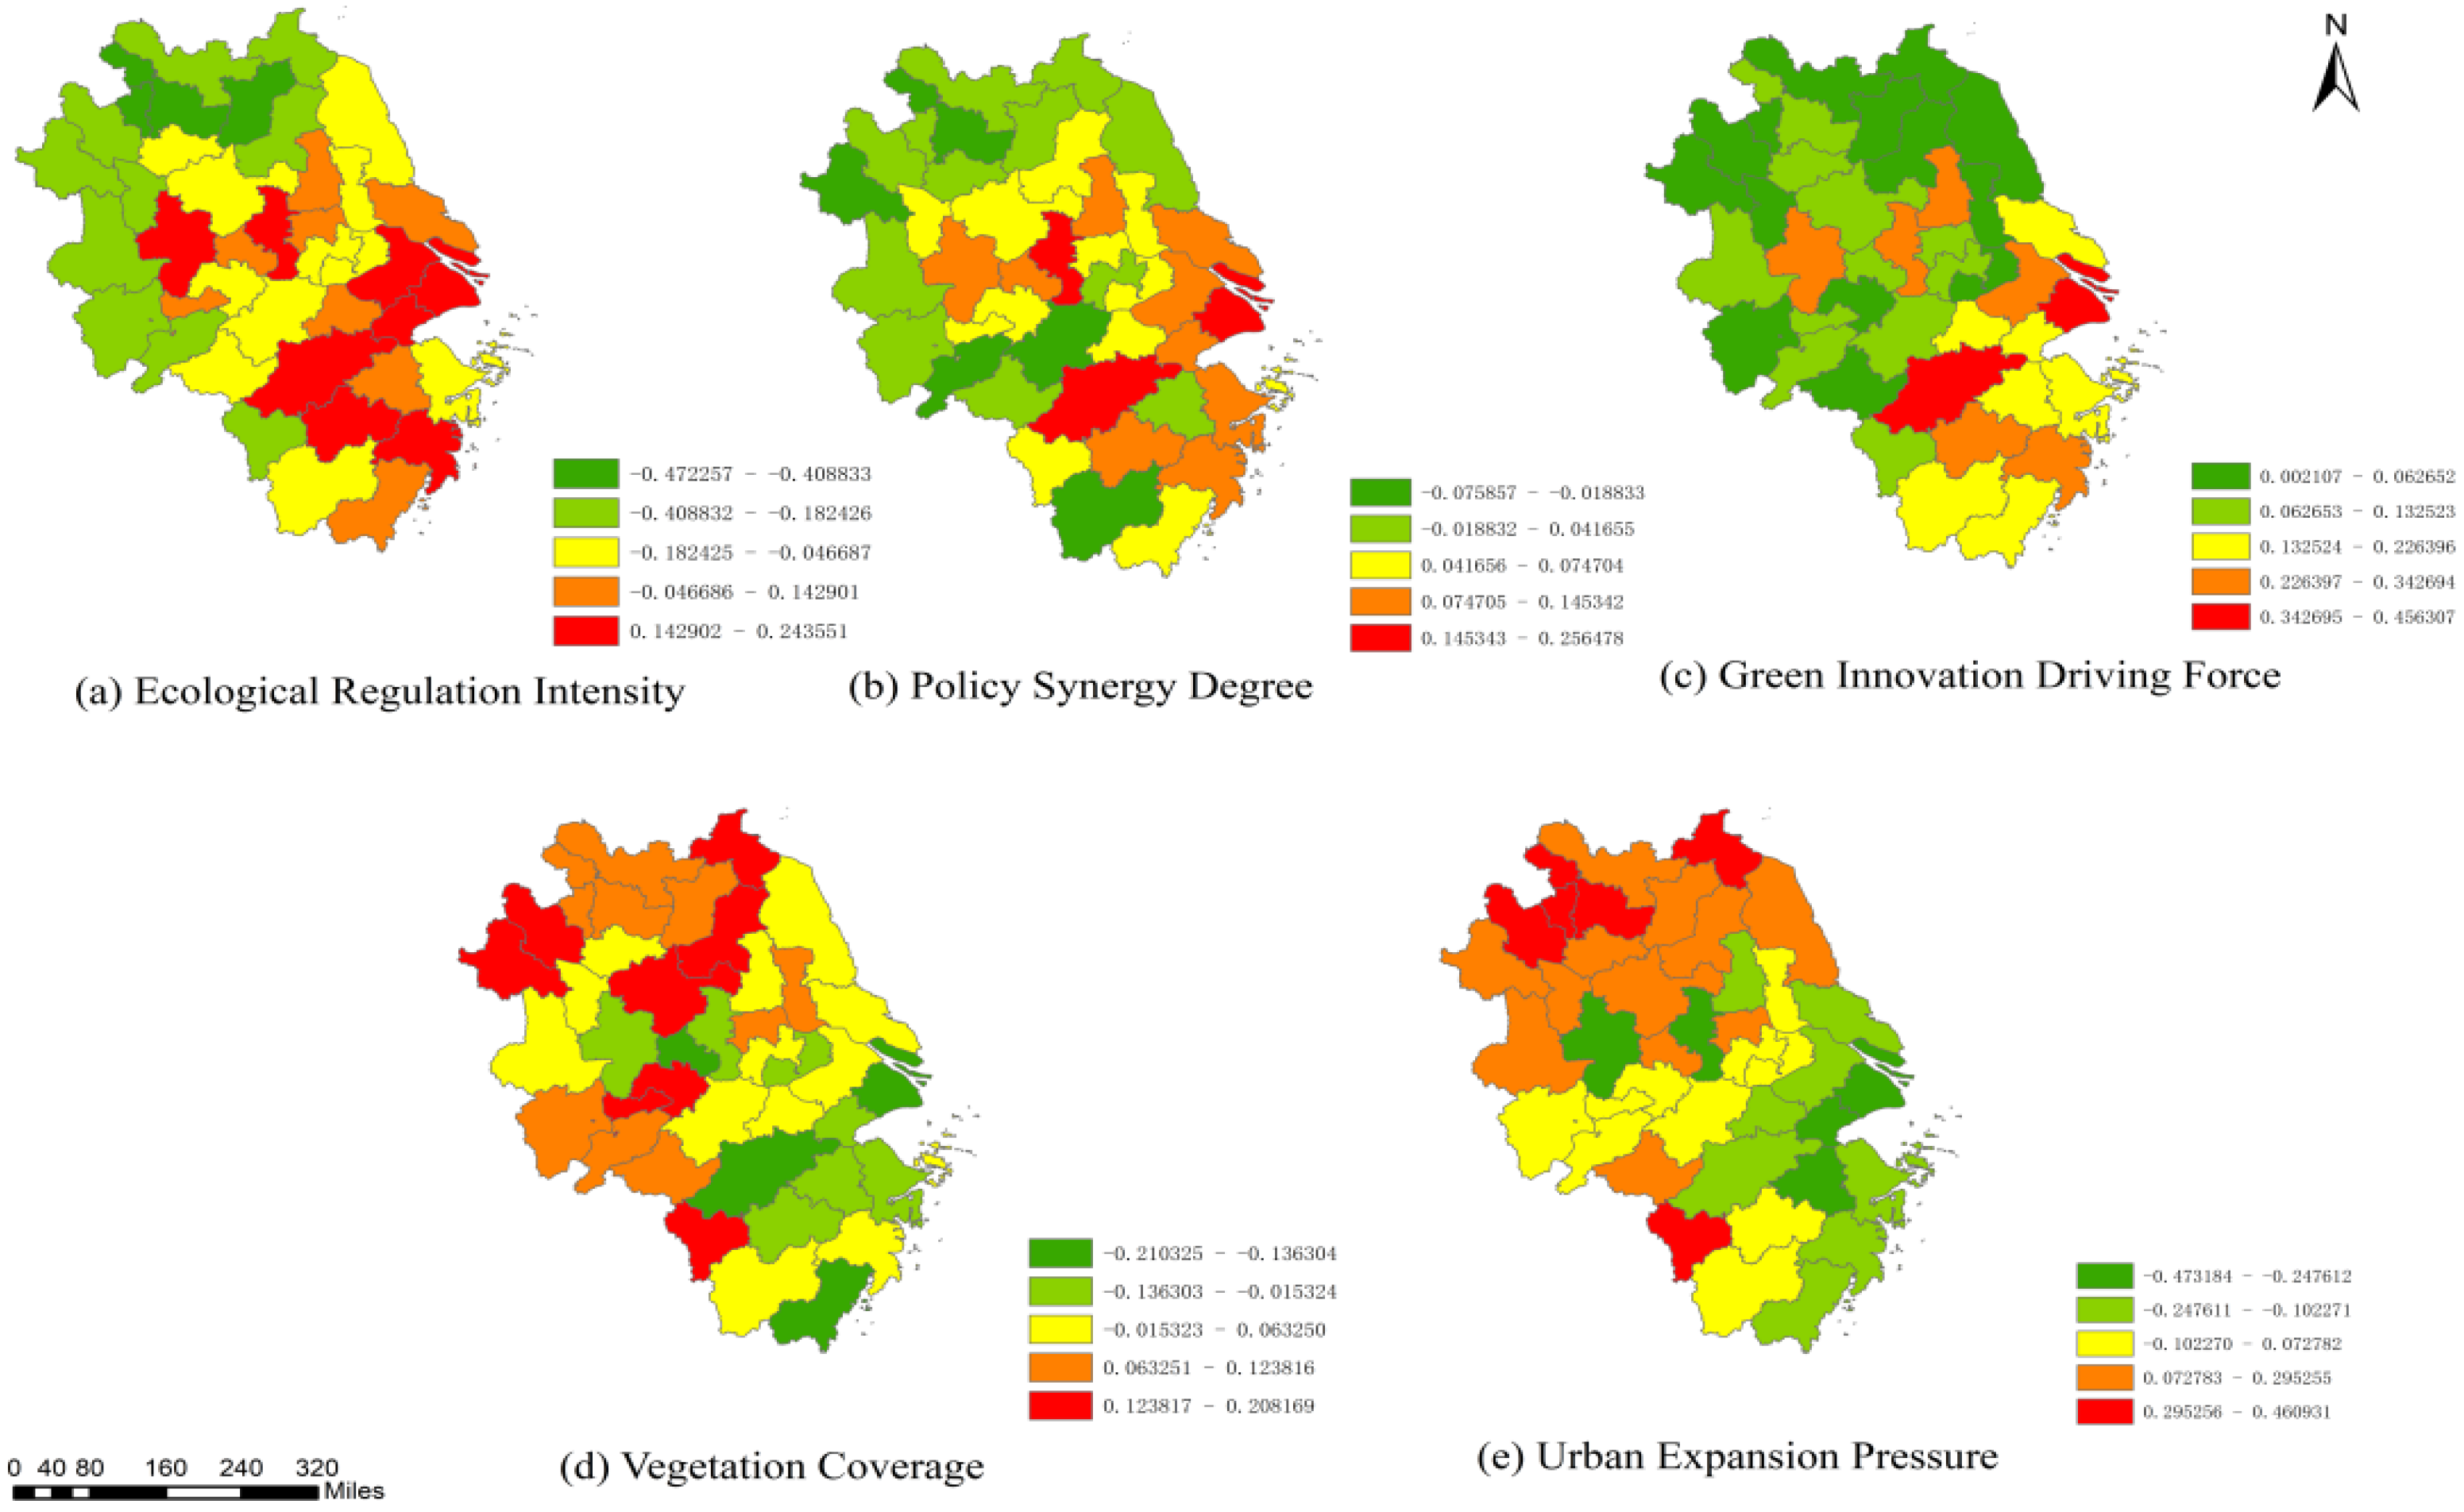
To further analyze the spatial heterogeneity of the CCD between GIE and UER, this study identified key driving factors of the CCD. Specific indicators included ecological regulation intensity (x1), policy synergy degree (x2), green innovation driving force (x3), vegetation coverage (x4), and urban expansion pressure (x5), as detailed in Table 3. The factor detector model of Geodetector was employed to identify the main driving factors influencing the spatial pattern evolution of the CCD.
As illustrated in Table 4, the Geodetector analysis of driving factors from 2010 to 2023 identifies green innovation driving force (x3) as the dominant factor influencing the CCD, with the highest mean q-value of 0.312 and a noticeable rise from 0.249 to 0.322. Policy synergy degree (x2) ranks second, averaging 0.249, and remains relatively stable. Ecological regulation intensity (x1) and vegetation coverage (x4) show fluctuating and overall declining influences, suggesting limited effectiveness of strong intervention or passive conservation. Urban expansion pressure (x5) consistently acts as the strongest inhibitory factor, with its explanatory power dropping to 0.085 by 2023. The overall factor hierarchy confirms x3 > x2 > x1 > x4 > x5 in shaping CCD spatial differentiation.

5.3. Spatiotemporal Non-Stationarity of Coupling Coordination Degree (CCD) via GTWR

Building on the drivers identified through the Geodetector analysis, the GTWR model was employed to elucidate their spatiotemporally heterogeneous effects. The model demonstrates strong explanatory power, with an adjusted R2 of 0.779 and a low AICc of −1346.41, indicating an excellent fit to the data. To evaluate the robustness of the primary GTWR findings, a supplemental global analysis was conducted using a Spatial Lag Model (SLM) with two-way fixed effects (see Supplementary Tables S3 and S4 for full results). The results indicate significant positive spatial spillovers ( ρ = 0.119, p < 0.01) and show statistically significant estimates for key drivers, including green innovation driving force (x3) and ecological regulation intensity (x1). This convergence reinforces the credibility of the identified key drivers. The alignment between these global results and the central tendencies derived from the GTWR model provides strong support for the robustness of our primary findings.
Ecological regulation intensity exerts spatially divergent effects on the CCD, exhibiting a northwest constraint pattern exemplified by Huaibei and a southeast facilitation trend centered on the YRD core. Regression coefficients span from −0.472 to 0.243, as shown in Figure 8. Stringent standards in the southeast compel green innovation and cleaner production, yielding a regulatory dividend that enhances resource efficiency and risk resilience. Conversely, northwestern industrial zones like Suzhou City (in Anhui Province) face regulatory pressures exceeding local adaptive capacity, incurring prohibitive compliance costs that impede coordinated development. This reflects regional divergence in industrial transition stages: the southeast demonstrates innovation compensation post-Environmental Kuznets Curve inflection, while the northwest remains constrained by cost burdens during mid-industrialization. However, the statistical significance of this divergent impact is highly context-specific, with coefficients proving significant in only 56.3% of spatiotemporal units (at the p < 0.10 level).
Policy synergy degree influences the CCD along a core–periphery gradient, with coefficients ranging from –0.076 to 0.256. High-value zones form a Shanghai-centered triangle along the Lower Yangtze Innovation Corridor and Hangzhou–Ningbo Axis. Advanced digital governance and efficient policy transmission help align market entities with green innovation directives. This alignment accelerates technology transfer and resilience co-development, thus promoting the CCD. Conversely, low-value zones (e.g., Chuzhou and Chizhou) show a slight inhibitory effect. This is due to limited policy comprehension and deviations in grassroot implementation. This pattern reveals a fundamental governance disparity: core zones amplify policy dividends through institutional advantages, while peripheral areas are constrained by “last-mile” barriers, which weaken policy synergy’s role. Overall, the positive effect of policy synergy is statistically significant in only 47.3% of cases (p < 0.10), underscoring that its attenuating efficacy from core to periphery highlights the persistent challenge of “last-mile” delivery in coordinated governance.
Green innovation driving force exhibits a “multi-core radiating” spatial pattern, with regression coefficients ranging from 0.002 to 0.456. High-value cores cluster along the Shanghai–Nanjing–Hefei Innovation Corridor and the Southeastern Zhejiang Coastal Belt. Their efficacy stems from three mechanisms: innovation factor agglomeration accelerating technological iteration, green patent conversion boosting resource efficiency, and smart management optimizing ecological risk response. Together, these mechanisms form core regional development engines. Peripheral transition zones like Yancheng and Huainan demonstrate weaker effects, constrained by fragmented innovation chains and industrial path dependence. This core–periphery gradient fundamentally reflects regional innovation ecosystem maturity disparities. This evidence solidifies the variable’s role as the most robust driver and a primary engine for regional coordinated development, with its positive influence being statistically significant in over 61.5% of all observations (p < 0.10).
Vegetation coverage exerts divergent spatial effects on the CCD, with regression coefficients ranging from −0.210 to 0.208. A facilitative effect of vegetation coverage on the CCD is observed in the northwestern (e.g., Bozhou), northeastern (e.g., Lianyungang), and central-southern parts (e.g., Quzhou) of the YRD. In these areas, a sound ecological foundation supports biodiversity, enhances soil conservation, and improves microclimate regulation, thereby promoting synergistic development. Conversely, an inhibitory effect is identified along the highly urbanized southeastern coast and the Yangtze River cities. In these regions, urban expansion has fragmented ecological spaces, leading to significant deficits in ecosystem services relative to socioeconomic demand. The insufficient vegetation coverage constrains both ecological resilience and green innovation synergy, highlighting a fundamental mismatch between ecological carrying capacity and urbanization pressure. This spatial heterogeneity was statistically detectable in approximately 49.9% of the study area (p < 0.10), indicating that the role of vegetation is highly context-dependent and its net effect remains uncertain or negligible in nearly half of the regions, which underscores the nuanced interplay between ecological endowment and urbanization pressure.
Urban expansion pressure exerts a dual spatial effect on the CCD, with regression coefficients spanning from −0.473 to 0.461. A driving effect is observed in inland plains cities, such as Huaibei and Suzhou, where the expansion of built-up areas acts as an initial catalyst for transformation through infrastructure improvement and economic agglomeration. In contrast, inhibitory effects prevail in core coastal cities including Shanghai and Nanjing, where construction land has surpassed ecological carrying capacity. This leads to three interconnected constraints: compression of ecological space, which undermines the structural connectivity of blue–green infrastructures; inefficient land use allocation, which weakens innovation agglomeration economies; and rising environmental governance costs [48]. This spatial divergence reflects fundamental differences in regional urbanization stages: inland regions benefit from scale-driven extensional development, whereas coastal cores require intensive urban renewal and stock optimization. The dual nature of urban expansion pressure was statistically significant in 48.4% of regions (p < 0.10), meaning its impact was unstable in the other half, further confirming that its effect is critically dependent on the local stage of urban development. The spatiotemporal distribution of these statistically significant effects is visually summarized in Supplementary Table S5 and Figure S1.

6. Discussion

6.1. Thematic Comparison with Prior Research

Theme 1: Spatiotemporal Differences and Regional Gradients
This study reveals a distinct east–high, west-–ow spatial pattern in the coupling coordination degree (CCD), with three characteristic regional typologies emerging from the analysis. First, the eastern coastal cluster, which includes cities such as Hangzhou, Ningbo, and Shaoxing, achieves a high level of coupling with an intermediate degree of coordination. Second, the Yangtze River corridor zone, which encompasses Nanjing, Hefei, and Wuhu, maintains high coupling alongside primary coordination. In contrast, cities in northern Anhui, such as Bozhou and Suzhou, exhibit significantly weaker performance, characterized by both low coupling and low coordination. These patterns support prior findings by Hua et al. [11] and Wang et al. [17] on green innovation spillovers and urban ecological resilience gradients. Furthermore, this study advances the field by quantifying their synergistic CCD outcomes. Most notably, the consistent 10–23% CCD gap between inter-provincial borders and hinterlands confirms Wang et al.’s [32] border barrier hypothesis. Beyond conventional single-system approaches, our integrated model successfully identifies critical spatial disjuncture and institutional constraints hindering regional coordination.
Theme 2: Coordinated Evolutionary Pathways and Transformation Logic
This study identifies a nonlinear three-stage evolution of the CCD in the YRD: a technology-driven phase (2010–2015) with low-speed coupling growth, a system consolidation phase (2015–2020) where coordination growth surpassed coupling, and a pandemic adjustment phase (2020–2023) exhibiting divergence. This progression aligns with Folke’s complex adaptive systems theory, indicating that synergy requires transitioning from enhanced factor interaction to synchronized development [5]. Beyond critical thresholds observed in cities like Hefei and Jinhua, institutional innovation exerts a pronounced catalytic effect. This enables stable high coupling and high coordination states, providing empirical support for both Bergek’s theory of resilience-driven innovation reversal and Kates’ transformational adaptation framework [26,27]. Contrary to Ravita’s static analyses [6], our dynamic model reveals how policy interventions (e.g., 2018 regional plans) catalyzed coordination leaps through technology–institution dual-drive transitions, as observed in Shanghai’s transformation and Wuxi’s industrial upgrade cases, addressing literature gaps in synergistic dynamics.
Theme 3: Spatial Heterogeneity of Driving Mechanisms
This study establishes a restructured hierarchy of CCD drivers. Green innovation driving force emerges as the primary driver, followed by policy synergy degree. Ecological regulation intensity is relegated to a tertiary factor. This change in the hierarchy of drivers challenges the conventional emphasis on regulatory measures as the primary tool. Spatial analysis reveals divergent responses: while stringent ecological control enhances the CCD in advanced coastal hubs like Shanghai, it suppresses coordination in transitional inland zones (e.g., Huaibei) where compliance costs strain adaptive capacity, confirming Environmental Kuznets Curve thresholds. Vegetation coverage exhibits a distinct spatial paradox concerning its impact on the CCD. Although beneficial and supportive in northwestern conservation zones (e.g., Bozhou), it transforms into a constraint within southeastern urban cores (e.g., Shanghai). This reversal stems from a severe mismatch: the level of ecosystem services provided by vegetation is insufficient to meet the substantially higher demand in these dense metropolitan areas, ultimately constraining the CCD. The demonstrable 10–23% CCD gap in border regions necessitates spatially tailored governance: innovation–policy synergy mechanisms for coasts versus capacity-building support for inland transitions.

6.2. Policy Implication

6.2.1. Differentiated Governance Strategies for Spatial Mismatch and Typologies

The persistent east–west divergence in coordination levels necessitates spatially differentiated governance within the Yangtze River Delta. For high-performing eastern coastal clusters such as Shanghai and Hangzhou, policies should be designed to catalyze green technology transfer to less developed regions. These cities could also serve as primary buyers in a regional ecological credit scheme, thereby financing conservation efforts elsewhere. Within the Yangtze River corridor, cities like Nanjing and Hefei exhibit a paradox of high coupling but low coordination. Addressing this issue requires interventions aimed at upgrading their innovation ecosystems. Moreover, performance metrics should be adopted that specifically reward improvements in coordination, rather than innovation alone. In chronically low-coordination border zones such as Bozhou, policy interventions should directly tackle administrative fragmentation. This can be achieved through targeted capacity-building programs, prioritized access to ecological compensation funds, and the creation of cross-jurisdictional special zones with integrated governance. These steps are crucial for bridging the identified 10–23% coordination gap.

6.2.2. Targeted Interventions for Driver-Specific Heterogeneity

Policy interventions should be carefully tailored to the spatially heterogeneous impacts of the key drivers identified in this study. Regulatory frameworks should move beyond one-size-fits-all approaches. Stringent ecological regulations remain appropriate for advanced southeastern hubs, where they trigger innovation compensation. In contrast, northwestern transitional regions such as Suzhou City need more flexible, incentive-based standards that accommodate local adaptive capacities without creating undue burdens. Similarly, vegetation coverage management requires a regionally differentiated strategy. In the northwest, policies should focus on valorizing ecological assets through market mechanisms. For the highly urbanized southeast, policymakers should pursue an offensive strategy to reclaim and reconnect fragmented green spaces. This can be achieved by implementing strict urban growth boundaries and initiating high-value greening projects. Concurrently, urban expansion management should account for divergent regional impacts. Inland cities may still benefit from controlled growth to harness agglomeration economies. Coastal core areas, however, should firmly transition from expansion-led development to intensification-oriented urban renewal. Such a shift is essential to mitigate the constraining effects of excessive land consumption on regional coordination.

6.2.3. Adaptive Management for System Vulnerability

To mitigate systemic risks and enhance adaptive governance, a multi-tiered policy framework is essential. Key measures include establishing a real-time CCD diagnostic system for dynamic monitoring and targeted interventions. An ecological transfer mechanism should incentivize high-value urban greening while requiring compensatory investments in fragile zones to prevent net ecological loss. Additionally, a resilience reserve fund could provide rapid support during sudden CCD declines in high-risk areas. Together, these mechanisms address both chronic vulnerabilities and acute shocks, strengthening the overall resilience and coordination stability of the urban agglomeration.

7. Conclusions

This study has analyzed the spatiotemporal evolution and drivers of coupling coordination between green innovation efficiency (GIE) and urban ecological resilience (UER) in the Yangtze River Delta. The findings offer insights relevant to SDG 11. The coupling coordination degree (CCD) improved from mild dissonance to primary coordination, indicating clear though uneven progress in integrating innovation with sustainability. However, significant spatial disparities remain, particularly between eastern and western regions. Inter-provincial border zones show notably lower coordination, highlighting a persistent vulnerability that may hinder equitable and resilient development as envisioned under SDG 11. The green innovation driving force was identified as the most influential factor, exceeding the effects of policy synergy and direct ecological regulation. This suggests a need to rethink conventional governance models that prioritize regulatory interventions over innovation enablement. Other drivers, such as ecological regulation and vegetation coverage, also show spatially varying effects. Their impact can shift from enhancing to inhibiting coordination, reinforcing that context-specific policy approaches are essential. In summary, achieving SDG 11 synergies will require regionally adaptive and differentiated governance strategies. This study provides a transferable framework highlighting that sustainable urban development depends not only on technological and ecological progress, but also on institutional integration to align innovation policies with resilience building. Future research should apply the framework to other regions for comparative studies. Such efforts would validate its transferability and reveal context-specific drivers.

Supplementary Materials

The following supporting information can be downloaded at: https://www.mdpi.com/article/10.3390/su17198528/s1, Table S1: GIE and UER Assessment Index Framework; Table S2: Robustness Check: Comparison of Geodetector Results under Different Discretization Methods Table S3: Estimation Results of the Spatial Lag Model (SLM); Table S4: Moran’s I Test of Spatial Autocorrelation for GTWR Model Residuals (2010–2023); Table S5: Statistical Significance of GTWR Local Coefficient Estimates; Figure S1: Spatiotemporal Significance of Driving Factors on CCD (2010 and 2023).

Funding

This research received no external funding.

Institutional Review Board Statement

Not applicable.

Informed Consent Statement

Not applicable.

Data Availability Statement

Data will be made available upon reasonable request.

Conflicts of Interest

The author declare no conflicts of interest.

Abbreviations

The following abbreviations are used in this manuscript:
GIEGreen innovation efficiency
UERUrban ecological resilience
CCDCoupling coordination degree
YRDYangtze River Delta
GTWRGeographically and Temporally Weighted Regression
UNDRRThe United Nations Office for Disaster Risk Reduction
UNEPUnited Nations Environment Programme
PSRPressure–State–Response
GWRGeographically Weighted Regression
Super-SBM DEASuper-Slack-Based Measure Data Envelopment Analysis

Appendix A. Classification Criteria for Coupling Coordination Degree (CCD)

CCoupling PhaseCoupling SpecificationDCoordination Level
(0.0, 0.3]Low couplingCoupling gradually(0.0, 0.1]Extremely discordant
(0.1, 0.2]Severely discordant
(0.2, 0.3]Moderately discordant
(0.3, 0.6]AntagonismCertain degree of development(0.3, 0.4]Mildly discordant
(0.4, 0.5]Borderline discordant
(0.5, 0.6]Barely coordinated
(0.6, 0.8]Running-inGood coupling development(0.6, 0.7]Primary coordination
(0.7, 0.8]Intermediate coordination
(0.8, 1.0]High couplingMutually reinforcing development(0.8, 0.9]Well-coordinated
(0.9, 1.0]Highly coordinated

References

  1. Jaung, W.; Carrasco, L.; Richards, D.; Ahmad, S.; Tan, P. The role of urban nature experiences in sustainable consumption: A transboundary urban ecosystem service. Environ. Dev. Sustain. 2023, 25, 601–621. [Google Scholar] [CrossRef]
  2. Nina, E.; Pan, H. Policy nexus for urban resilience and nature-based solutions. Nat. Based Solut. Sustain. Dev. Goals 2025, 111–125. [Google Scholar] [CrossRef]
  3. Xu, X.; Wang, M.; Wang, M. The coupling coordination degree of economic, social and ecological resilience of urban agglomerations in China. Int. J. Environ. Res. Public Health 2022, 20, 413. [Google Scholar] [CrossRef]
  4. Meerow, S.; Stults, M. Comparing conceptualizations of urban climate resilience in theory and practice. Sustainability 2016, 8, 701. [Google Scholar] [CrossRef]
  5. Folke, C. Resilience (Republished). Ecol. Soc. 2016, 21, 44. [Google Scholar] [CrossRef]
  6. Ravita, D.; Devesh, A.; Semaan, S.; Rayash, K. Beyond energy access: How renewable energy fosters resilience in island communities. Resources 2025, 14, 20. [Google Scholar] [CrossRef]
  7. Han, X.; Yu, J.; Shi, L.; Zhao, X.; Wang, J. Spatiotemporal evolution of ecosystem service values in an area dominated by vegetation restoration: Quantification and mechanisms. Ecol. Indic. 2021, 131, 108191. [Google Scholar] [CrossRef]
  8. Weber, P.; Kassab, E.; Ruanguttamanun, C. Sustainable development and green innovation: The role of green dynamic capabilities. Int. J. Innov. Res. Sci. Stud. 2025, 8, 1075–1089. [Google Scholar] [CrossRef]
  9. Zhang, X.; Niu, Y.; Si, D.; Xiao, Z. Regulatory greening: The impact of environmental legislation on corporate green innovation. Econ. Anal. Policy 2024, 82, 359–376. [Google Scholar] [CrossRef]
  10. Zeng, J.; Kare, M.; Lafont, J. The co-integration identification of green innovation efficiency in Yangtze River Delta region. J. Bus. Res. 2021, 134, 252–262. [Google Scholar] [CrossRef]
  11. Hua, S.; Li, J.; Pan, Y.; Pan, F. Green technology innovation spillover effect and urban eco-efficiency convergence: Evidence from Chinese cities. Energy Econ. 2022, 114, 106307. [Google Scholar] [CrossRef]
  12. Liu, G. Evaluating the regional green innovation efficiency in China: A DEA-Malmquist productivity index approach. Appl. Mech. Mater. 2015, 733, 355–362. [Google Scholar] [CrossRef]
  13. Li, M.; Lin, S.; Chen, Y. The evaluation, dynamic evolutionary characteristics and influencing factors of green innovation efficiency in China. Pol. J. Environ. Stud. 2025, 34, 1607–1619. [Google Scholar] [CrossRef]
  14. Tone, K. Slacks-based measure of efficiency in data envelopment analysis. Eur. J. Oper. Res. 2001, 130, 498–509. [Google Scholar] [CrossRef]
  15. Yuan, Z.; Lan, Y.; Zhuo, Q.; Hsu, S. Innovating for a greener future: Novelty in green patents and its impact on sustainable development goals in China’s construction sector. Resources 2025, 213, 108025. [Google Scholar] [CrossRef]
  16. Abdildin, Y.; Nurkenov, S.; Kerimray, A. Analysis of green technology development in Kazakhstan. Int. J. Energy Econ. Policy 2021, 11, 269–279. [Google Scholar] [CrossRef]
  17. Wang, C. How does manufacturing agglomeration affect urban ecological resilience? Evidence from the Yangtze River Delta region of China. Front. Environ. Sci. 2024, 12, 1492866. [Google Scholar] [CrossRef]
  18. Liu, J.; Wang, X.; Gao, G. Spatiotemporal evolution and determinants of urban flood resilience: A case study of Yellow River Basin. Sustainability 2025, 17, 1433. [Google Scholar] [CrossRef]
  19. Zhu, Q.; Van, B.; Wang, Z.; Yang, S. Bed-level changes on intertidal wetland in response to waves and tides: A case study from the Yangtze River Delta. Mar. Geol. 2017, 385, 160–172. [Google Scholar] [CrossRef]
  20. Jia, Q.; Jiao, L.; Hu, X. Telecoupling indirect ecological impacts of urban expansion in China from the perspective of the food trade. Land Degrad. Dev. 2023, 34, 4964–4976. [Google Scholar] [CrossRef]
  21. Liao, Z.; Zhang, L. Analyzing and predicting the urbanization and ecological resilience coupling and coordination of Guangdong Province. Palgrave Commun. 2024, 11, 1322. [Google Scholar] [CrossRef]
  22. Lan, C.; Li, X.; Peng, B.; Li, X. Unlocking urban ecological resilience: The dual role of environmental regulation and green technology innovation. Sustain. Cities Soc. 2025, 128, 106466. [Google Scholar] [CrossRef]
  23. Li, F.; Wu, S.; Liu, H.; Yan, D. Biodiversity loss through cropland displacement for urban expansion in China. Sci. Total Environ. 2024, 907, 167988. [Google Scholar] [CrossRef]
  24. Fu, S.; Liu, J.; Wang, J.; Tian, J.; Li, X. Enhancing urban ecological resilience through integrated green technology progress: Evidence from Chinese cities. Environ. Sci. Pollut. 2024, 31, 36349–36366. [Google Scholar] [CrossRef]
  25. Dong, F.; Zhu, J.; Li, Y.; Chen, Y.; Gao, Y.; Hu, M.; Qin, C.; Sun, J. How green technology innovation affects carbon emission efficiency: Evidence from developed countries proposing carbon neutrality targets. Environ. Sci. Pollut. Res. 2022, 29, 35780–35799. [Google Scholar] [CrossRef] [PubMed]
  26. Kates, R.; Travis, W.; Wilbanks, T. Transformational adaptation when incremental adaptations to climate change are insufficient. Proc. Natl. Acad. Sci. USA 2012, 109, 7156–7161. [Google Scholar] [CrossRef] [PubMed]
  27. Bergek, A.; Hekkert, M.; Jacobsson, S. Technological innovation systems in contexts: Conceptualizing contextual structures and interaction dynamics. Environ. Innov. Soc. Transit. 2015, 16, 51–64. [Google Scholar] [CrossRef]
  28. Serra, V.; Defraia, S.; Ledda, A.; Calia, G.; Corona, F.; De, M.; Mulas, M. Ecological network, ecosystem services, and green infrastructure planning: A method for the metropolitan city of Cagliari, Italy. Netw. Spat. Econ. 2025, 25, 95–120. [Google Scholar] [CrossRef]
  29. Shu, C.; Bi, H.; Meng, G.; Cao, J.; Wu, J. Research on spatial-temporal heterogeneity of driving factors of green innovation efficiency in Yangtze River Delta urban agglomeration—Empirical test based on the Geographically Weighted Regression model. Front. Energy Res. 2024, 12, 1308494. [Google Scholar]
  30. Yang, Y.; Rao, H. Coordinated development of the tourism industry and ecological environment: A case study of hubei province in China. Pol. J. Environ. Stud. 2024, 33, 4903–4915. [Google Scholar] [CrossRef]
  31. Zhao, S.; Li, Z.; Deng, H.; You, X.; Tong, J.; Yuan, B.; Zeng, Z. Spatial-temporal evolution characteristics and driving factors of carbon emission prediction in China-research on ARIMA-BP neural network algorithm. Front. Environ. Sci. 2024, 12, 1497941. [Google Scholar] [CrossRef]
  32. Wang, J.; Huang, X.; Sun, D.; Xu, R. Government department merger, perception of administrative barriers, and corporate investment: Evidence from China’s State Administration for Market Regulation. Financ. Res. Lett. 2024, 67, 105788. [Google Scholar] [CrossRef]
  33. Diakoulaki, D.; Mavrotas, G.; Papayan, L. Determining objective weights in multiple criteria problems: The critic method. Comput. Oper. Res. 1995, 22, 763–770. [Google Scholar] [CrossRef]
  34. Yao, Z.; Huang, G. Adaptability comparison of climate downscaling methods and future climate projections in the Pearl River Delta, China. Nat. Hazards 2025, 121, 4703–4729. [Google Scholar] [CrossRef]
  35. Zhang, T.; Li, L. Research on temporal and spatial variations in the degree of coupling coordination of tourism–urbanization–ecological environment: A case study of Heilongjiang, China. Environ. Dev. Sustain. 2021, 23, 8474–8491. [Google Scholar] [CrossRef]
  36. Gai, M.; Qin, B.; Zhen, X. Evolution analysis of the spatial-temporal pattern of coupling and coordination between the transformation of economic growth momentum and green development. Geogr. Res. 2021, 40, 2572–2590. [Google Scholar]
  37. Wang, J.; Xu, C. Geodetector: Principle and prospective. Acta Geogr. Sin. 2017, 72, 116–134. [Google Scholar]
  38. Li, F.; Nan, T.; Zhang, H.; Luo, K.; Xiang, K.; Peng, Y. Evaluating ecological vulnerability and its driving mechanisms in the Dongting Lake region from a multi-method integrated perspective: Based on Geodetector and explainable machine learning. Land 2025, 14, 1435. [Google Scholar] [CrossRef]
  39. Cong, X.; Li, X.; Gong, Y. Spatiotemporal evolution and driving forces of sustainable development of urban human settlements in China for SDGs. Land 2021, 10, 993. [Google Scholar] [CrossRef]
  40. Wang, Y.; Chen, X.; Ibra, R.; Faryan, A. Unveiling the criticality of digitalization, eco-innovation, carbon tax, and environmental regulation in G7 quest for carbon footprint mitigation: Insights for sustainable development. Nat. Resour. Forum 2024, 49, 1284–1307. [Google Scholar] [CrossRef]
  41. He, Q.; Deng, X.; Li, C.; Yan, Z. Can environmental centralization help reduce pollution? Evidence from an empirical study in China. Emerg. Mark. Financ. Trade 2020, 56, 3523–3546. [Google Scholar]
  42. Wang, K.; Yin, H.; Chen, Y. The effect of environmental regulation on air quality: A study of new ambient air quality standards in China. J. Clean. Prod. 2019, 215, 268–279. [Google Scholar] [CrossRef]
  43. Chen, Y.; Jiang, C.; Peng, L.; Zhao, S.; Chen, C. Digital infrastructure construction and urban industrial chain resilience: Evidence from the “Broadband China” strategy. Sustain. Cities Soc. 2025, 121, 106228. [Google Scholar] [CrossRef]
  44. Meerow, S.; Newell, J.; Stults, M. Defining urban resilience: A review. Landsc. Urban Plan. 2016, 147, 38–49. [Google Scholar] [CrossRef]
  45. Cheng, H. The coordinated relationship between urban resilience and tourism development in the urban agglomeration of Yangtze River Delta. J. Shaanxi Norm. Univ. 2023, 51, 59–70. [Google Scholar]
  46. Xu, S.; Li, B.; Shen, Z. Can the digital economy enhance ecological resilience-Based on empirical data from 53 cities in the Yellow River Basin of China. Pol. J. Environ. Stud. 2024, 33, 4851–4859. [Google Scholar] [CrossRef]
  47. Huo, B.; Wang, B.; Li, Z. How to deal with technological turbulence for improving innovation performance. Technol. Anal. Strateg. Manag. 2024, 36, 549–562. [Google Scholar] [CrossRef]
  48. Triyanti, A.; Surtiari, G.; Lassa, J.; Rafliana, I.; Hanifa, N.; Muhidin, M.; Djalante, R. Governing systemic and cascading disaster risk in Indonesia: Where do we stand and future outlook. Disaster Prev. Manag. 2022, 32, 27–48. [Google Scholar] [CrossRef]
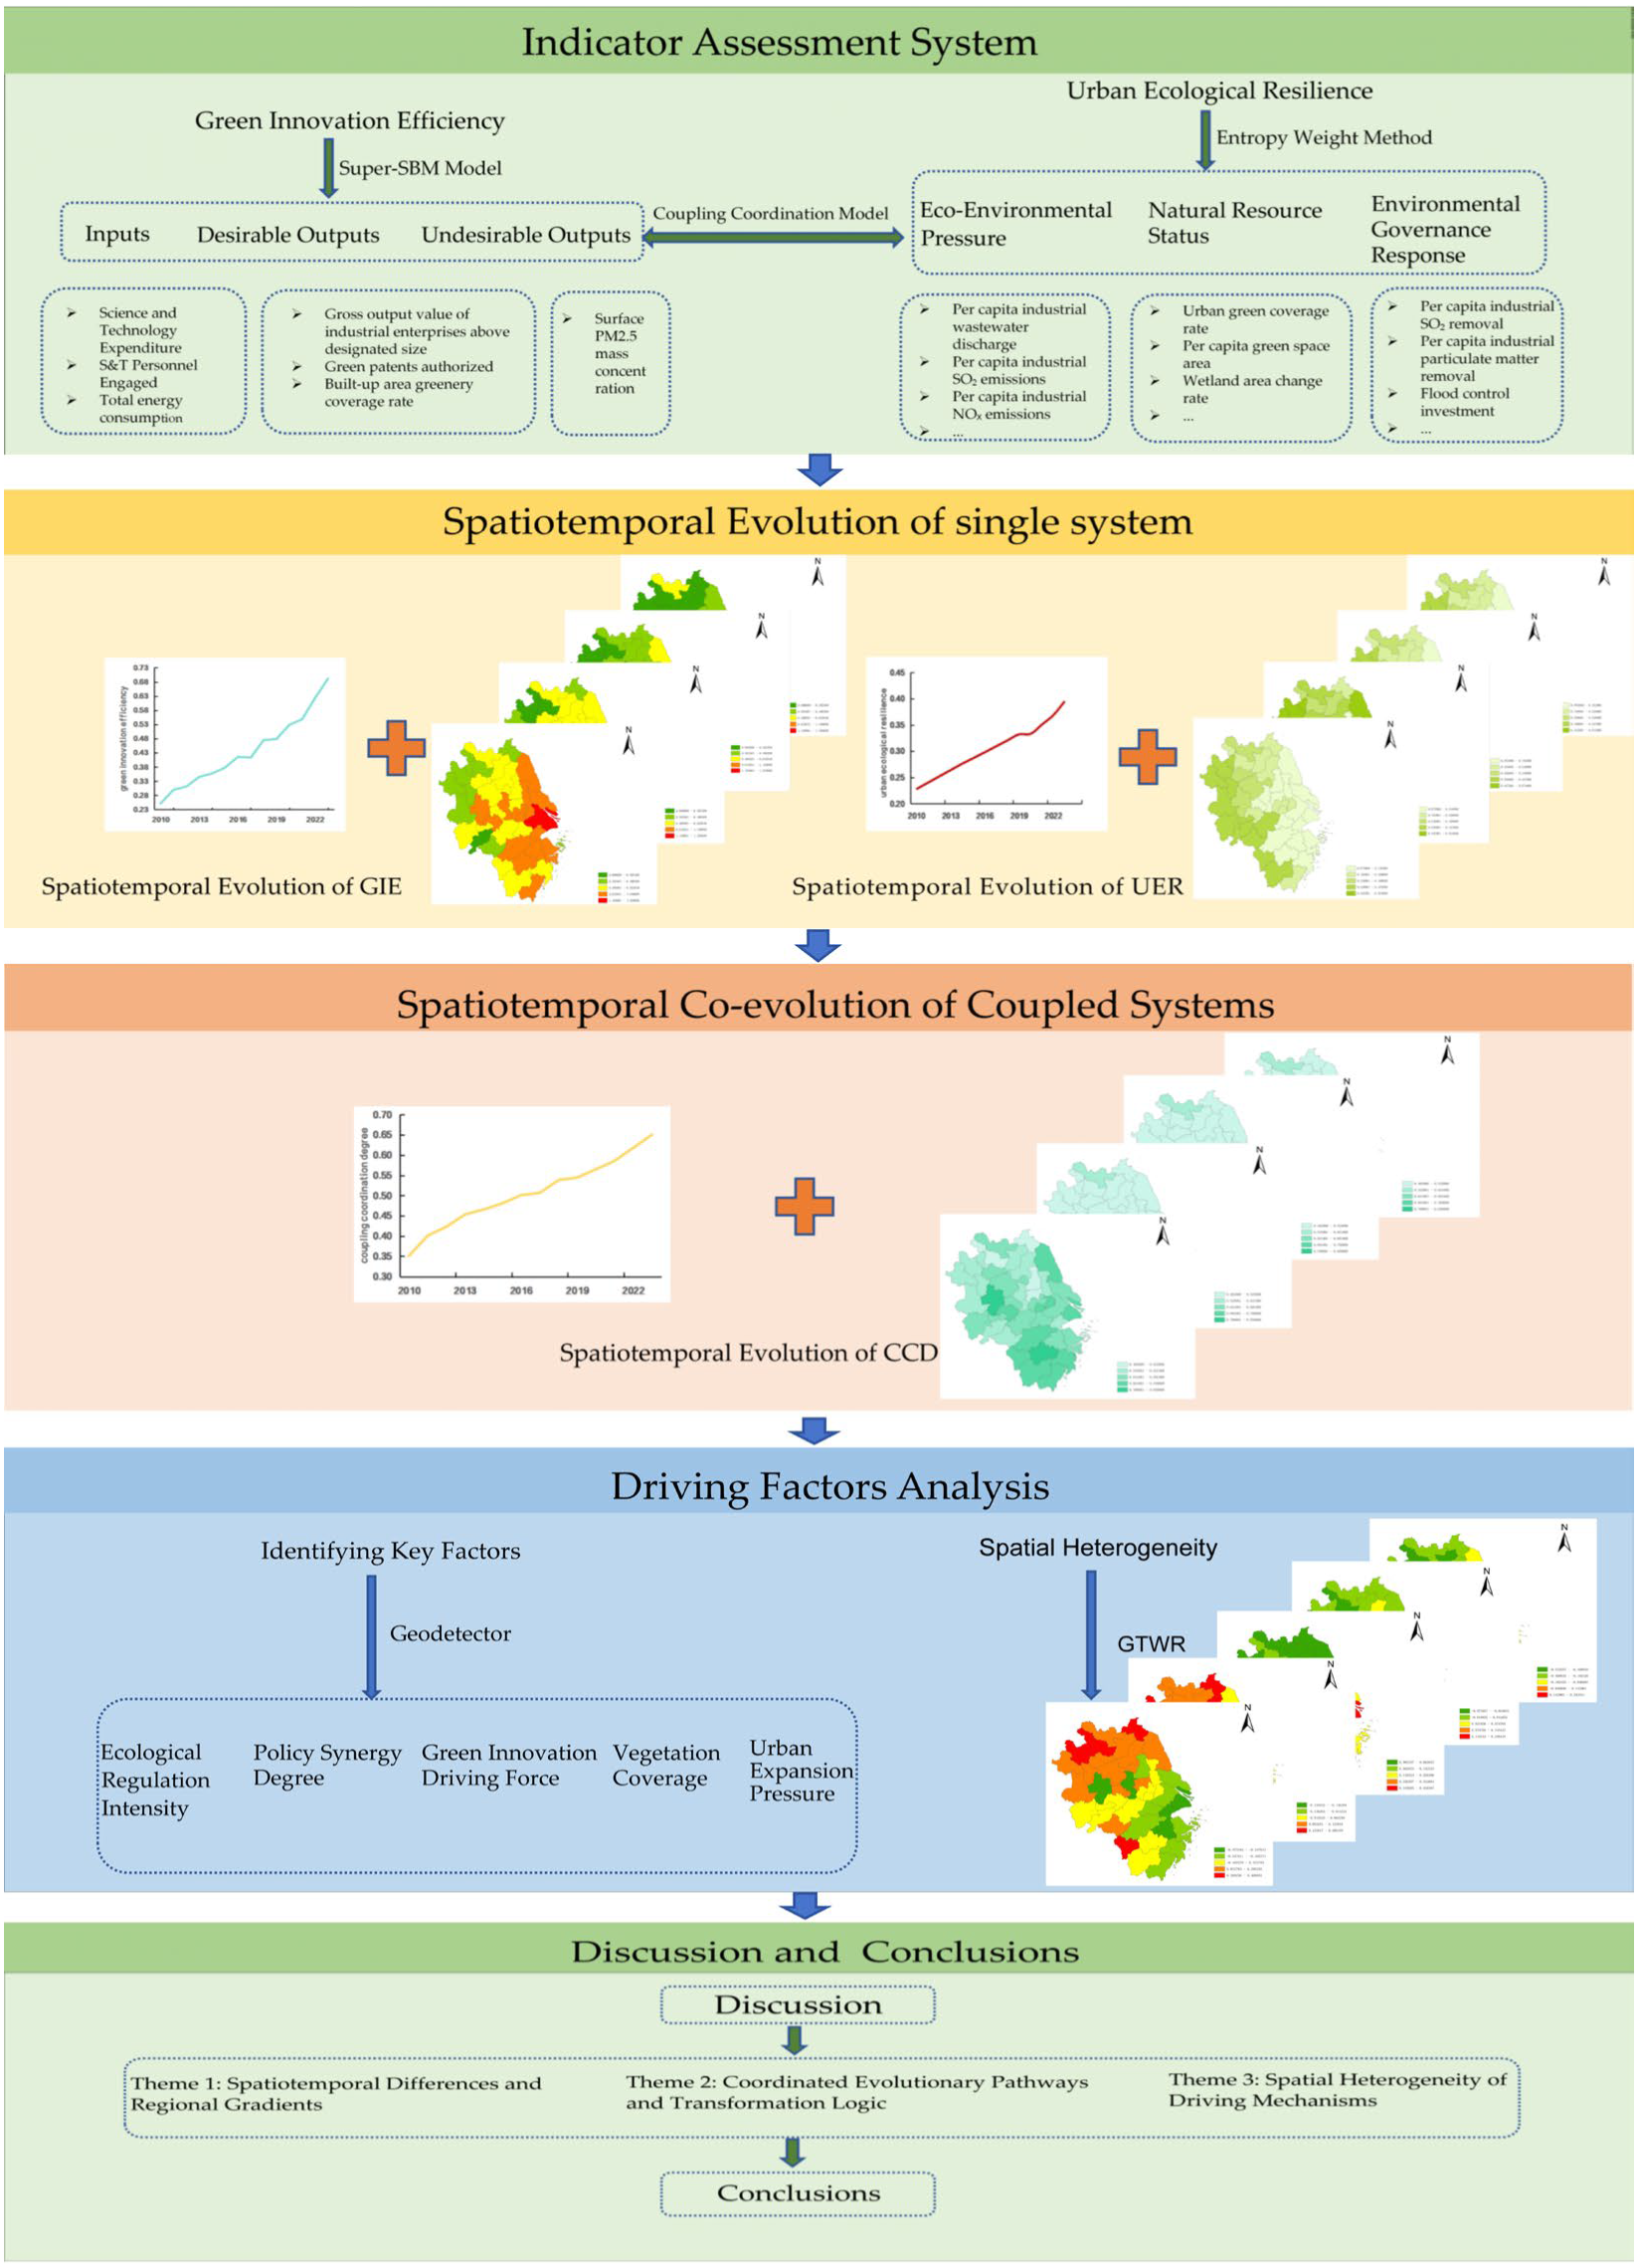
Figure 1. Method application flow.
Sustainability 17 08528 g001
Figure 2. Overview of study area.
Sustainability 17 08528 g002
Figure 3. (a) Temporal changes of green innovation efficiency (GIE); (b) temporal changes of urban ecological resilience (UER); (c) temporal changes of coupling coordination degree (CCD).
Sustainability 17 08528 g003
Figure 4. (ad) Spatial distribution of green innovation efficiency (GIE) in YRD in 2010, 2015, 2020, and 2023, respectively.
Sustainability 17 08528 g004
Figure 5. (ad) Spatial distribution of urban ecological resilience (UER) in YRD in 2010, 2015, 2020, and 2023, respectively.
Sustainability 17 08528 g005
Figure 6. (ad) Spatial distribution of coupling coordination degree (CCD) in YRD in 2010, 2015, 2020, and 2023, respectively.
Sustainability 17 08528 g006
Figure 7. (ad) Scatter plots of global Moran’s I for the coupling coordination degree (CCD) in 2010, 2015, 2020, and 2023, respectively.
Sustainability 17 08528 g007
Figure 8. (ae) Parameter spatial distribution of influencing factors for GIE-UER coupling coordination evolution in YRD, 2010–2023.
Sustainability 17 08528 g008
Table 1. Green innovation efficiency and urban ecological resilience assessment index framework.
SystemPrimary IndexVariables and InterpretationCodePositive/
Negative
Green innovation efficiency (U1)Inputs
(U11)
Science and technology expenditure (CYN 10,000)x11+
Science and technology personnel engaged (10,000 persons)x12+
Total energy consumption (10,000 tons of SCE)x13
Desirable outputs (U12)Gross output value of industrial enterprises above designated size (CYN 10,000)x14+
Green patents authorized (items)x15+
Built-up area greenery coverage rate (%)x16+
Undesirable outputs (U13)Surface PM2.5 mass concentration (μg/m3)x17
Urban ecological resilience (U2)Eco-environmental pressure (U21)Per capita industrial wastewater discharge (10,000 tons/capita)x21
Per capita industrial SO2 emissions (tons/capita)x22
Per capita industrial particulate matter emissions (tons/capita)x23
Per capita industrial NOx emissions (tons/capita)x24
Natural resource status (U22)Urban green coverage rate (%)x25+
Per capita green space area (m2/capita)x26+
Per capita total water resources (m3/capita)x27+
Per capita built-up area (m2/capita)x28
Per capita urban road area (m2/capita)x29+
Wetland area change rate (%)x210+
Environmental governance response (U23)Per capita industrial SO2 removal (tons/capita)x211+
Per capita industrial particulate matter removal (tons/capita)x212+
Comprehensive utilization rate of industrial solid waste (%)x213+
Centralized sewage treatment rate (%)x214+
Flood control investment (%)x215+
A detailed description of each indicator, including its comprehensive definition and precise data source, is provided in Supplementary Table S1.
Table 2. Global Moran’s I index and test of the CCD in the YRD from 2010 to 2023.
20102011201220132014201520162017201820192020202120222023
Moran’s I−0.0170.0040.0160.0380.0420.0370.0270.0100.0530.0590.0510.0450.0490.049
Z0.3861.3011.8712.8843.0442.8292.4431.5963.6253.8443.4933.1673.3543.362
p0.3500.0970.0310.0020.0010.0020.0070.0550.0000.0000.0000.0010.0000.000
Table 3. Key influencing factors and their indicators for CCD evolution.
Influencing FactorIndicator DescriptionUnit
Ecological regulation intensity (x1)Density of environmental regulation policiescases/year
Policy synergy degree (x2)Similarity of policy texts%
Green innovation driving force (x3)Share of green R&D expenditure in GDP%
Vegetation coverage (x4)Vegetation coverage%
Urban expansion pressure (x5)Annual expansion rate of built-up area%
Table 4. Geodetector analysis of driving factors for the spatiotemporal evolution of the coupling coordination degree (CCD) in the YRD from 2010 to 2023.
2010201520202023Mean q-Value Explanatory Power Ranking
Ecological regulation intensity (x1)0.2390.0440.3390.1750.1993
Policy synergy degree (x2)0.2490.2920.2050.2490.2492
Green innovation driving force(x3)0.2490.3360.3410.3220.3121
Vegetation coverage (x4)0.0470.2600.1060.2840.1744
Urban expansion pressure (x5)0.1380.1640.2540.0850.1605
Disclaimer/Publisher’s Note: The statements, opinions and data contained in all publications are solely those of the individual author(s) and contributor(s) and not of MDPI and/or the editor(s). MDPI and/or the editor(s) disclaim responsibility for any injury to people or property resulting from any ideas, methods, instructions or products referred to in the content.