Article

Developing a Comprehensive Survey System for Assessing MaaS Impacts on Travel Behavior: Design, Implementation, and Descriptive Insights

1
Department of Civil for Engineering and Regional Design, School of Regional Design, Yoto Campus, Utsunomiya University, 7-1-2 Yoto, Utsunomiya 321-8585, Japan
2
Masarat Misr, 141 Orouba Axis, New Cairo 4731025, Egypt
*
Author to whom correspondence should be addressed.
Sustainability 2025, 17(18), 8500; https://doi.org/10.3390/su17188500
Submission received: 30 August 2025 / Revised: 18 September 2025 / Accepted: 19 September 2025 / Published: 22 September 2025
(This article belongs to the Special Issue Towards Sustainable Urban Transport System)

Abstract

This study presents the development and implementation of an integrated survey system designed to evaluate the impact of MaaS in the context of Cairo’s rapidly evolving urban landscape. The research employs a dual-survey methodology, combining an RP household travel survey with an innovative, context-aware SP experiment focused on MaaS. The system is tailored to address the complexities of Cairo’s formal and informal transport networks and the transformative potential of new public transit infrastructure associated with Cairo’s urban expansion and the introduction of the New Administrative Capital. The paper outlines the methodological framework, including the design of the survey instruments, drawing upon established guidelines and the integration of real-world transportation data for realistic scenario generation in the SP component. While this paper primarily focuses on the development of the survey system and its design principles, it also incorporates some preliminary findings from a 313-participant full-scale survey to illustrate the potential of this comprehensive approach for understanding current travel behaviour, socio-demographic determinants of mobility, and the prospects of context-aware SP data to assess user preferences for potential MaaS offerings. Results highlight the methodological advances in survey design for developing cities and aim to offer policy-relevant evidence for sustainable mobility interventions.

1. Introduction

Cairo, Egypt’s capital and one of the largest cities in Africa and the Middle East, exemplifies the challenges of megacity mobility. The Greater Cairo Region (GCR) spans nearly 3300 km2, with a population exceeding 26 million and densities reaching over 75,000 inhabitants/km2 in central districts [1]. This dense, mixed-use urban fabric results in a complex interplay between short local trips and long commutes driven by urban sprawl. Despite an extensive road network (36,000 km), the city faces severe congestion primarily due to delays, wasting 15% of per capita GDP. The most recent modal share data dates back to the year 2014, indicating that 63% of trips are made by public transport, while private cars account for 21%. However, car ownership in Cairo is nearly double the national average, intensifying congestion and environmental pressures. Travel speeds in peak periods can drop to 6 km/h on surface streets and 20 km/h on major corridors [2,3].
Cairo has an extensive public transport network, including buses, the metro, and microbuses. However, the quality of service is substandard, access to relevant information is minimal, mixed-mode commuting is very hard, and the system is perceived as unreliable and uncomfortable by travelers. Additionally, the transport network is still limited, leading to severe road congestion [4,5]. Since 2017, along with the expansion of the New Administrative Capital (NAC), Egypt has increased its focus on rail-based transportation lines, which can address several shortcomings of the existing system and improve mobility in Cairo. Recent and ongoing projects include an LRT, two Monorail Lines, Metro Line 4, and a BRT (Figure 1).
However, despite these investments, the integration and accessibility of these modes remain critical challenges. Our previous comprehensive analysis [6] provides extensive empirical evidence of these impacts through a systematic evaluation of 1200 origin points across the Greater Cairo Region to 8 key destination zones. This study quantified how Cairo’s current transport limitations affect daily mobility, demonstrating that large areas remain completely inaccessible via public transport and revealing substantial travel time inefficiencies across the network, with potential savings of 6–24 min (5–21%) through improved infrastructure. The analysis showed that residents in peripheral areas like new satellite cities experience particularly severe connectivity challenges, with limited or no public transport options to central Cairo or other major zones.

1.1. Objective and Motivation

Cairo’s transportation system is characterized by fragmentation, limited-service integration, and quality deficits. The advancement of the New Administrative Capital and its associated transportation infrastructure introduces an opportunity for sustainable mobility as well as additional complexity. This situation provides an unprecedented opportunity to investigate how Mobility as a Service (MaaS) can support the adoption of new transportation modes. Without effective integration, new high-capacity modes may fail to reduce car dependency or achieve intended benefits.
MaaS represents a paradigm shift in urban mobility, with its core capabilities of comprehensive information provision, modal integration, multimodal trip planning, and bundled mobility packages into a unified digital platform, offering potential to reduce cognitive barriers, facilitate modal shift, and enable more sustainable travel behaviour. Understanding how MaaS capabilities might influence travel behaviour and mode choice decisions, given Cairo’s evolving transportation system, characterized by established car-dependent patterns, is crucial. While MaaS has shown promise in developed contexts, its impact in rapidly growing cities like Cairo, with significant informal transport and car dependency, remains largely untested.
The novelty in this study comes in the dual-phase design adopted to tackle the limitations of relying solely on Revealed Preference (RP) or Stated Preference (SP) and aims at providing a holistic understanding of travel behaviour, capturing both current patterns and potential shifts in response to the introduction of MaaS. This addresses a significant research gap and contributes to a growing body of knowledge on the application of MaaS in diverse urban contexts, and provides a foundation for developing sustainable and integrated mobility solutions for Cairo, particularly in the context of the New Administrative Capital. This study tackles this through a comprehensive approach:
  • Developing an RP Household Travel Survey system capable of capturing detailed socio-demographic data and creating a comprehensive baseline of current travel patterns among Cairo commuters.
  • Developing a framework and Context-aware SP Survey system to explore the anticipated MaaS impacts on travel behaviour and modal shifts, focusing on both technological and behavioural dimensions.
This paper details the methodological framework underpinning the development of this survey system, including the rationale for the chosen approach and the design considerations for each survey component. While the full-scale implementation and detailed analysis of survey outcomes are ongoing, this paper includes some insights and initial analysis to demonstrate the potential of this integrated approach.

1.2. Literature Review

1.2.1. Revealed Preference (RP) Surveys

Travel behaviour surveys are essential tools for understanding travel behaviour and informing transportation planning. Traditional methods have included paper-based surveys, phone interviews, or interviewer-assisted surveys. These methods typically involve asking participants to describe their travel behaviour over a limited timeframe (often a single workday) or to recall their travel patterns on specific days. However, these conventional approaches rely heavily on participants’ memory and might place a major burden on respondents, which may negatively affect both the quality and quantity of the data collected.
Travel survey methodologies have evolved significantly over the past twenty years [7,8,9,10,11,12,13,14,15,16,17,18,19]. Advancements in GPS technology, along with improvements in smartphone-based positioning systems, have introduced a more efficient alternative for collecting travel data and helped make the transition from traditional methods to sophisticated smartphone-based approaches [20]. These methods passively collect GPS trajectory data to infer trip information with greater accuracy, greater efficiency, reduce time and labor requirements, and minimize respondent burden, offering transportation planners a powerful tool for data assembly. The systems collect detailed data and travel attributes, such as start and end times, distances traveled, routes taken, stop locations, as well as trip modes and purposes, with higher precision [21]. However, challenges associated with smartphone-based surveys include battery depletion, participant involvement, and privacy concerns. Hybrid approaches that combine web-based diaries with optional smartphone applications have shown promise in addressing both participant burden and data quality concerns. Greaves et al. [22] demonstrated that web-based travel diaries enhanced with smartphone mapping capabilities achieved 76% completion rates over seven days, with participants reporting high satisfaction levels and willingness to participate again.

1.2.2. Stated Preference (SP) Surveys

SP surveys are notably useful when assessing hypothetical scenarios such as new transit services or products that are not yet widely available or even attribute ranges beyond those observed in revealed preference data. The primary goal of these surveys is to capture the complex decision-making processes involved in adopting evolving concepts and products, such as MaaS. By using SP experiments, it is possible to assess the independent influence of various factors on mobility decisions and gain insights into potential behavioural changes in response to emerging mobility options.
MaaS is still a relatively new concept, yet it is gaining traction; therefore, understanding user preferences and potential demand requires careful experimental design through SP surveys, since revealed preference data is largely unavailable [23]. Within MaaS frameworks, cycling, for instance, plays an increasingly important environmental role as a sustainable mobility option, particularly in first/last-mile connectivity and short-distance trips [24]. However, the integration of cycling into MaaS systems varies significantly across urban contexts. While established cycling cities demonstrate successful integration of bike-sharing with public transport, developing cities like Cairo face distinct challenges, including limited cycling infrastructure, safety concerns in mixed traffic environments, and nascent bike-sharing systems. These contextual factors influence both the design of SP experiments and the realistic assessment of cycling’s potential within integrated mobility offerings.
Traditionally, SP surveys have relied on presenting respondents with hypothetical scenarios using tables of information to convey attributes of alternatives that are static among all participants. However, this approach becomes unwieldy when investigating complex new mobility services like MaaS that involve multiple modes and attributes [25]. Furthermore, conventional SP surveys often suffer from limitations related to realism, response bias, validity, and efficiency [26,27]. Context-aware SP surveys have emerged as a promising methodology to address these limitations [28]. For instance, the Future Mobility Survey platform demonstrates how GPS data from smartphones can be used to accurately capture revealed preference travel patterns, which then inform the design of hypothetical SP choice experiments [9]. Context-aware surveys can leverage web services like Google Maps to obtain accurate baseline times and distances for different modes between origins and destinations [25]. This provides a foundation for generating hypothetical scenarios that remain credible to respondents relative to their actual travel patterns.

2. Materials and Methods

2.1. RP Household Travel Survey System

After a considerate review of the literature and recognizing the increasing ubiquity of smartphones and the potential for more accurate and less burdensome data collection, a smartphone-based travel survey that silently collects data in the background of the participants’ mobile phone, the “Itinerum Platform”, was considered as a primary option. This aligns with the growing trend in transportation research towards leveraging mobile technologies for travel surveys. Itinerum is an open-source smartphone-based travel survey system able to facilitate the collection, processing, and analysis of travel behaviour data. The platform has been used in various large-scale studies, including transportation behaviour research, public transit planning, and health geography [29]. The selection of Itinerum followed a systematic evaluation of available smartphone-based travel survey platforms. Several open-source alternatives were assessed, including MEILI [30], TABI [31], and other minor platforms. However, most options presented significant technical barriers, whether system compatibility issues and implementation complexity or outdated dependencies and incomplete documentation, despite their successful deployment in other contexts.
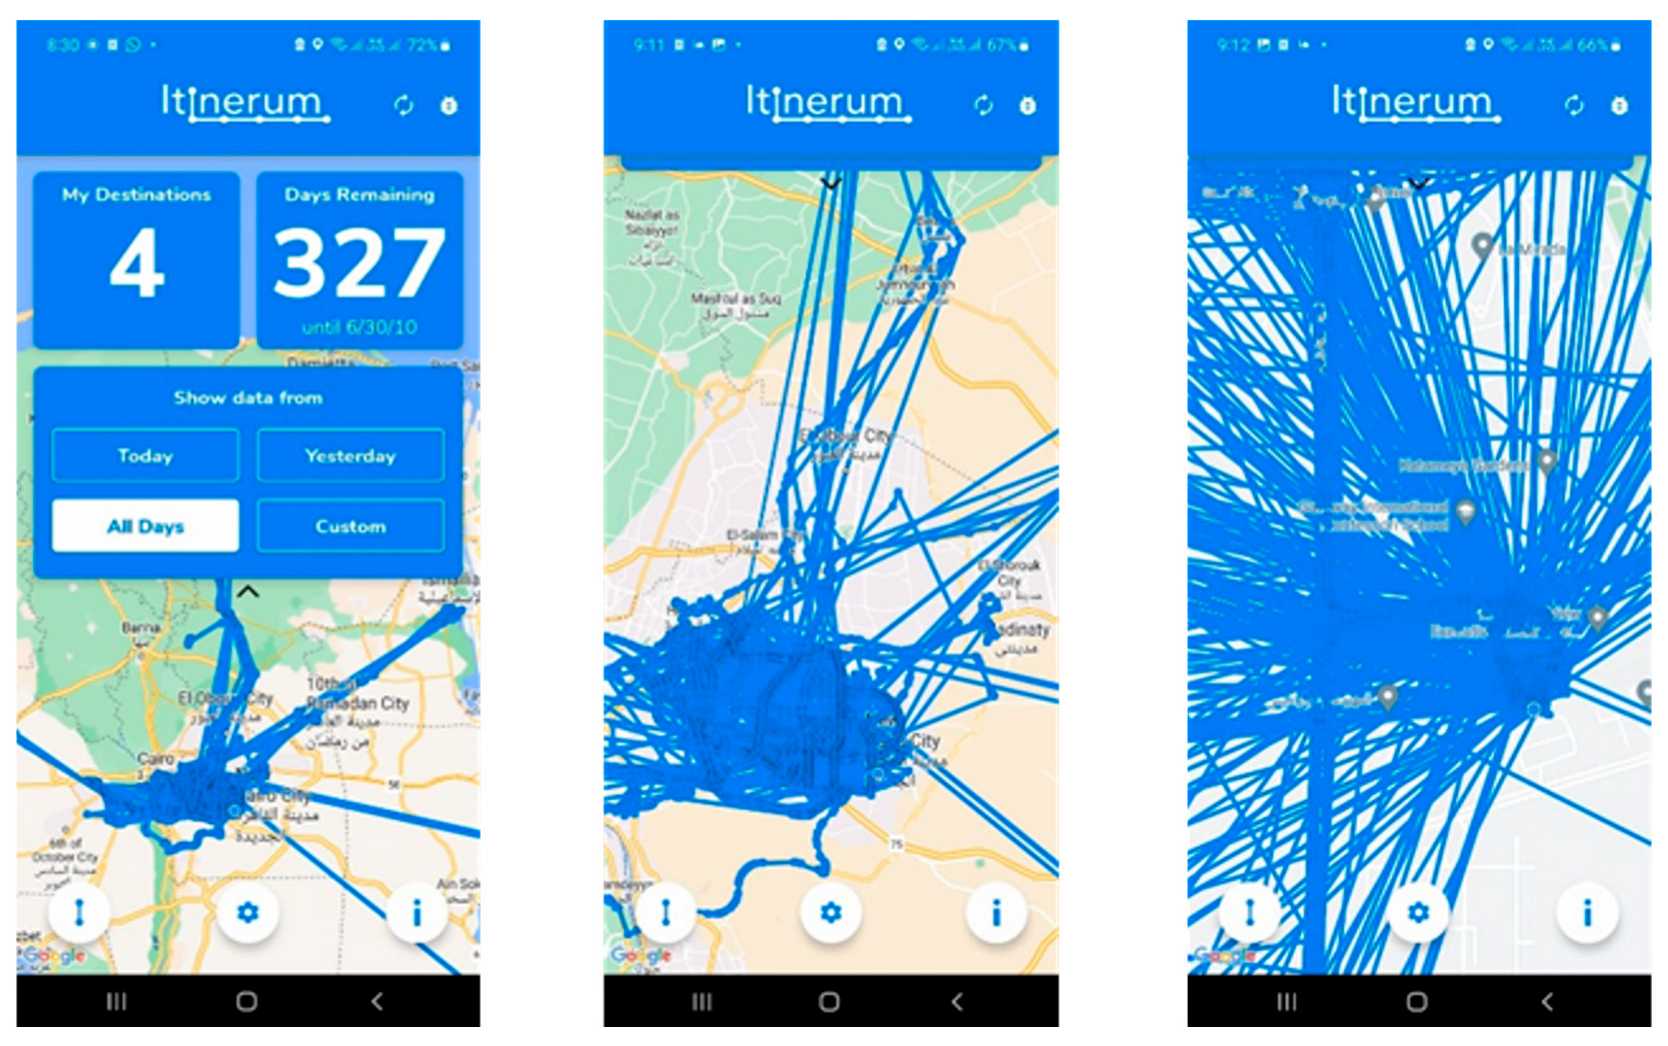
The Itinerum platform consists of two main components: the web platform and the smartphone app, which work in conjunction to enable survey customization, data collection, and real-time monitoring. As part of the system testing, the Android version was configured to point to our server, where the backend was hosted, and the APK was dispatched to focus group participants. A set of survey questions was incorporated into the system that appeared to the users to collect data on personal, household, and employment information. The system passively collects GPS trajectory data and prompts the user upon each stop to answer questions about trip mode and purpose. As seen in Figure 2 below, the data collected provided very detailed information on the users’ travel diaries.
Unfortunately, in reference to the questions about the trips in the travel diary, the focus group response started fading out, leaving a gap in the data. The participants had serious worries regarding the collection of their trajectory and precise follow-up of their travel patterns, meaning they did not accept the consistent passive tracking of their activity to such a great extent, despite the fact that huge emphasis was put on the privacy consideration given to the data collected and the anonymization of the data before analysis.
This feedback coincides with the findings of other researchers. Safi et al. [32] expressed that while these integrated systems streamline the survey process, challenges still persist, specifically in trip identification and travel mode detection. They mentioned privacy concerns of participants as a core limitation, as no one is interested in being tracked during their daily life. Additionally, battery depletion has been considered a serious concern because GPS services consume the battery of mobile devices, which leads to reduced participation rate and non-responsiveness of the study. This situation mandated considering another solution, which could be more convenient to users and aligns with their freedom of choice to declare or hide certain information.
As an alternative to the smartphone-based travel survey system, which was deemed not to be favorable for the survey respondents in the focus group, the web-based travel survey system came as an intermediate option. It is more convenient than paper-based surveys and provides a better approach to privacy from the respondents’ point of view when compared to smartphone-based systems [33,34]. Greaves et al. [22] noted that while smartphone integration can enhance data quality, technical issues and varying device compatibility can create barriers for some participants, supporting the rationale for maintaining web-based alternatives. This approach directly addresses these limitations by eliminating device-specific technical barriers while maintaining cross-platform accessibility. Browser-based implementation circumvents battery drain concerns, device compatibility issues, and app installation resistance, while providing the interactive features demonstrated as crucial for high completion rates.

2.1.1. Survey Design and Structure

Designing an efficient household travel survey requires a careful balance between methodological precision, respondent involvement, and practical execution. The process must ensure accurate and reliable data assembly while minimizing respondent burden and boredom. One of the most comprehensive guidelines available is “The On-Line Travel Survey Manual,” developed by the Transportation Research Board’s (TRB’s) Travel Survey Methods Committee (ABJ40) [35]. The manual incorporates decades of research and experience, providing comprehensive guidance on designing and executing various types of travel surveys, including household surveys, and emphasizes the importance of data quality and sampling methods. In parallel, the 2019 Puget Sound Regional Household Travel Survey, conducted by the Puget Sound Regional Council (PSRC) [36], exemplifies a practical application of household travel survey methodologies. These two authoritative resources served as the basis for the survey’s structure, design, and implementation. Appendix A contains the full set of questions used in the survey.
The survey system is designed with a clear and logical flow to enhance user experience and ensure the completeness of responses, collecting demographic information, travel behaviour data, and location-based data. Questions that required writing and manual input were kept to a minimum, with most questions structured with predefined response values to ensure consistency and facilitate data analysis. Survey development involved a two-phase mixed-methods strategy, initial focus groups with 10 participants to refine questions, followed by pilot testing and revisions. A couple of iterations were needed to fine-tune the overall structure, making sure the language used and the required information are straightforward, and that the overall survey length is within 30 min or less. The user interaction flow is divided into the following stages:
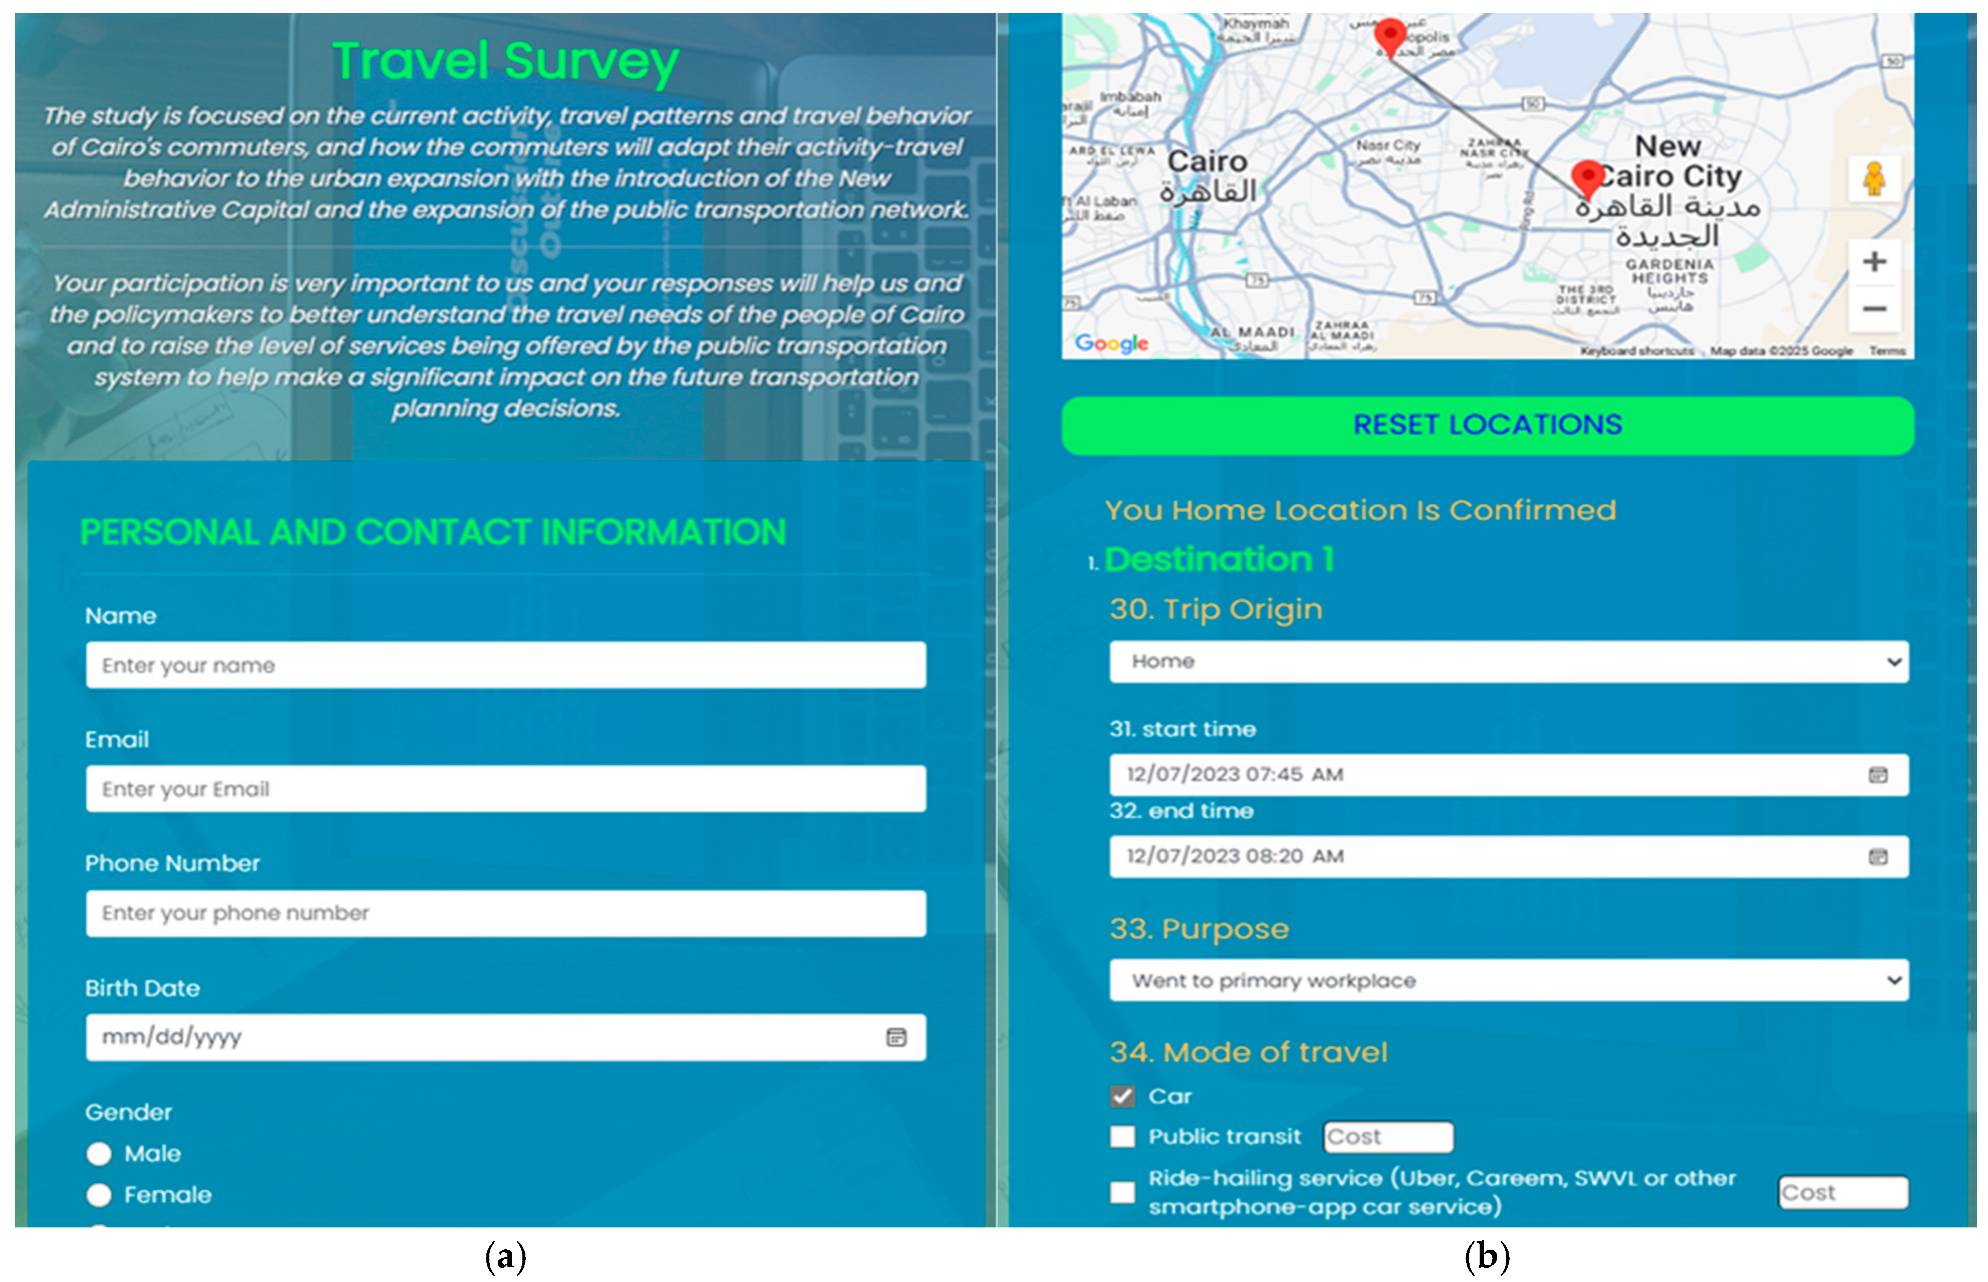
  • Welcome, Demographic and Household-Related Questions (Figure 3a).
    Participants are introduced to the survey’s informational content, purpose, and a call-to-action encouraging participants to proceed. Users then fill out questions distributed in three categories:
    o
    Personal and Household Information
    -
    Basic demographic data collection;
    -
    Household composition and vehicle ownership;
    -
    Socioeconomic indicators.
    o
    Residence, Employment, and Commute Information
    -
    Current residence characteristics;
    -
    Employment status and workplace information;
    -
    Commuting patterns and preferences.
    o
    Shopping or Errand Trip Purpose Locations
    -
    Frequent destination mapping.
  • Travel Diary and Location Mapping (Figure 3b)
Users are asked to log their trips over a specific travel date of their choice. This part needed to be interactive to ensure the data provided is accurate and that respondents did not feel burdened to fill in the required information. The user started by labelling their home as the first origin in their travel day where the system dynamically adds a new trip attribute fields each time the user adds a point to the map, and the user is prompted to enter the trip start and finish times, the mode, purpose, accompanying persons, etc., using assisted means such a drop-down menus with predefined inputs; and even enable the analysis of the outcomes later on. This data collection methodology seemed to work out fine for the focus group respondents, balancing the level of information required with their privacy concerns while keeping the travel diary input interactive, dynamic, and interesting enough to keep them engaged throughout the survey.
  • Feedback and Submission
Participants are given the opportunity to provide feedback on the survey experience before final submission. A “Thank You” page is displayed upon successful completion.

2.1.2. Technical Solution Description and Features

The RP household travel survey system was custom-developed as a web-based system, especially tailored to study the activity and travel behaviour of households within a certain metropolitan area. The system is designed to efficiently collect, store, and process data through an interactive and friendly interface. The system architecture follows a three-tier model consisting of a presentation layer, application logic layer, and data management layer. The modular design and architecture support scalability, allowing for the integration of additional survey modules or datasets as needed and ensuring the system can be adapted to different surveying purposes with minimal configurations. The technical breakdown of the architecture is as follows:
  • Front-End (Presentation Layer)
The front-end interface is developed using HTML5, CSS3, and an Embedded JavaScript (EJS) templating engine for dynamic front-end rendering and responsive user interaction, and Vanilla JavaScript for client-side interactions. The CSS employs a clean and modern design, employing a custom stylesheet. The system has a responsive design that ensures compatibility across devices, including desktops, tablets, and smartphones. To boost user experience, user-friendly forms have been deployed that constitute interactive elements and input forms such as input fields, drop-downs, radio buttons, and checkboxes styled for easy navigation and interaction, while tooltips give additional guidance.
  • Backend (Application Logic Layer)
The backend is built using Node.js for asynchronous processing and scalability. The Express.js framework provides a robust structure for routing and middleware handling. The system has a set of routing modules to manage different survey stages, along with a middleware to ensure data consistency and handle errors gracefully. RESTful API endpoints were implemented for data submission, with unification of the Google Maps API for geolocation and search functionality, and location-grounded inputs.
  • Database (Data Management Layer)
The relational database is implemented using MySQL database, which provides secure and reliable storage of survey responses, with structured tables for storing user profiles, household data, and trip-specific information.

2.2. Context-Aware SP Survey System

As discussed earlier, SP surveys present respondents with hypothetical scenarios, asking them to make choices among different options. In a context-aware design approach, this shall ensure the relevance of the hypothetical scenarios to the respondents’ real-life circumstances and constraints; however, further considerations are primary in the survey design. It should also consider the local context and available transport options. In developing cities where informal transport plays a notable role, the survey design needs to account for these modes and their potential inclusion into MaaS systems. Additionally, the built environment characteristics and spatial configuration of the study field should be considered as they can influence both current travel behaviour and potential MaaS adoption [37]. The experimental design should also consider psychological factors and attitudes toward technology adoption, as these have been shown to influence MaaS acceptance [38]. Survey presentation is another crucial aspect. Traditional table-based presentations could be replaced with more intuitive interfaces that mimic trip-planning software, reducing cognitive burden on respondents [25]. The survey should also encompass clear explanations of the MaaS concept, either through textual descriptions or visual aids such as short videos [39].
The survey utilized in this study is designed to adapt the questions to be contextually relevant to each participant. In the survey, each user selects their trip origin (in most cases, their home location), and the destination for all participants is a specific point in the New Administrative Capital, fixed, and accordingly, the system generates relevant and tailored hypothetical scenarios. This approach enhances the realism and relevance of the survey for each participant by grounding hypothetical choices in real-world behaviour, as the travel time, costs, and available modes are dynamically generated and specific to their chosen origin, providing realistic mode choices that are available from the respondent’s origin based on the actual data of the transportation system in Cairo. This makes the survey more meaningful, and respondents are more likely to engage with the survey and provide thoughtful responses because the scenarios feel directly applicable to their daily travel context. The survey enhances the external validity of SP responses and improves the standard of the data collected because participants can better relate to the choices presented, and helps capture realistic trade-offs people would make in real life, and reduces hypothetical bias, leading to more accurate data.

2.2.1. Survey Design and Structure

As per Matyas & Kamargianni [23], the survey structure should generally consist of multiple components:
  • Pre-survey questionnaire capturing socio-demographic data and current mobility patterns.
  • Introduction to the MaaS concept and features.
  • SP choice experiments with varying bundle compositions and attributes.
  • Attitudinal questions to capture psychological factors.
  • Post-choice questions to understand decision-making processes and potential barriers to adoption.
Following in their footsteps, the pre-survey questionnaire in our case corresponds to the household travel survey discussed earlier, which captures a decent set of information enabling a full understanding of the participant’s background and current travel behaviour. In the current context-aware SP survey for testing people’s perception of MaaS concept implementation, particularly considering the rapid urban development and new transit modes under implementation, the participants were guided through seven sections following a logical user journey. Refer to Appendix A for the full set of questions incorporated.
First, the survey begins with an introduction to the “Cairo MaaS Study”, outlining the purpose and importance of the research. The briefing explains the study’s focus while emphasizing the significance of participants’ input in understanding commuter needs and improving transportation planning. The second section presents key statistics and trivia about Cairo’s extensive public transportation network, educating the participants about the existing and upcoming transportation options and providing context for the subsequent survey questions.
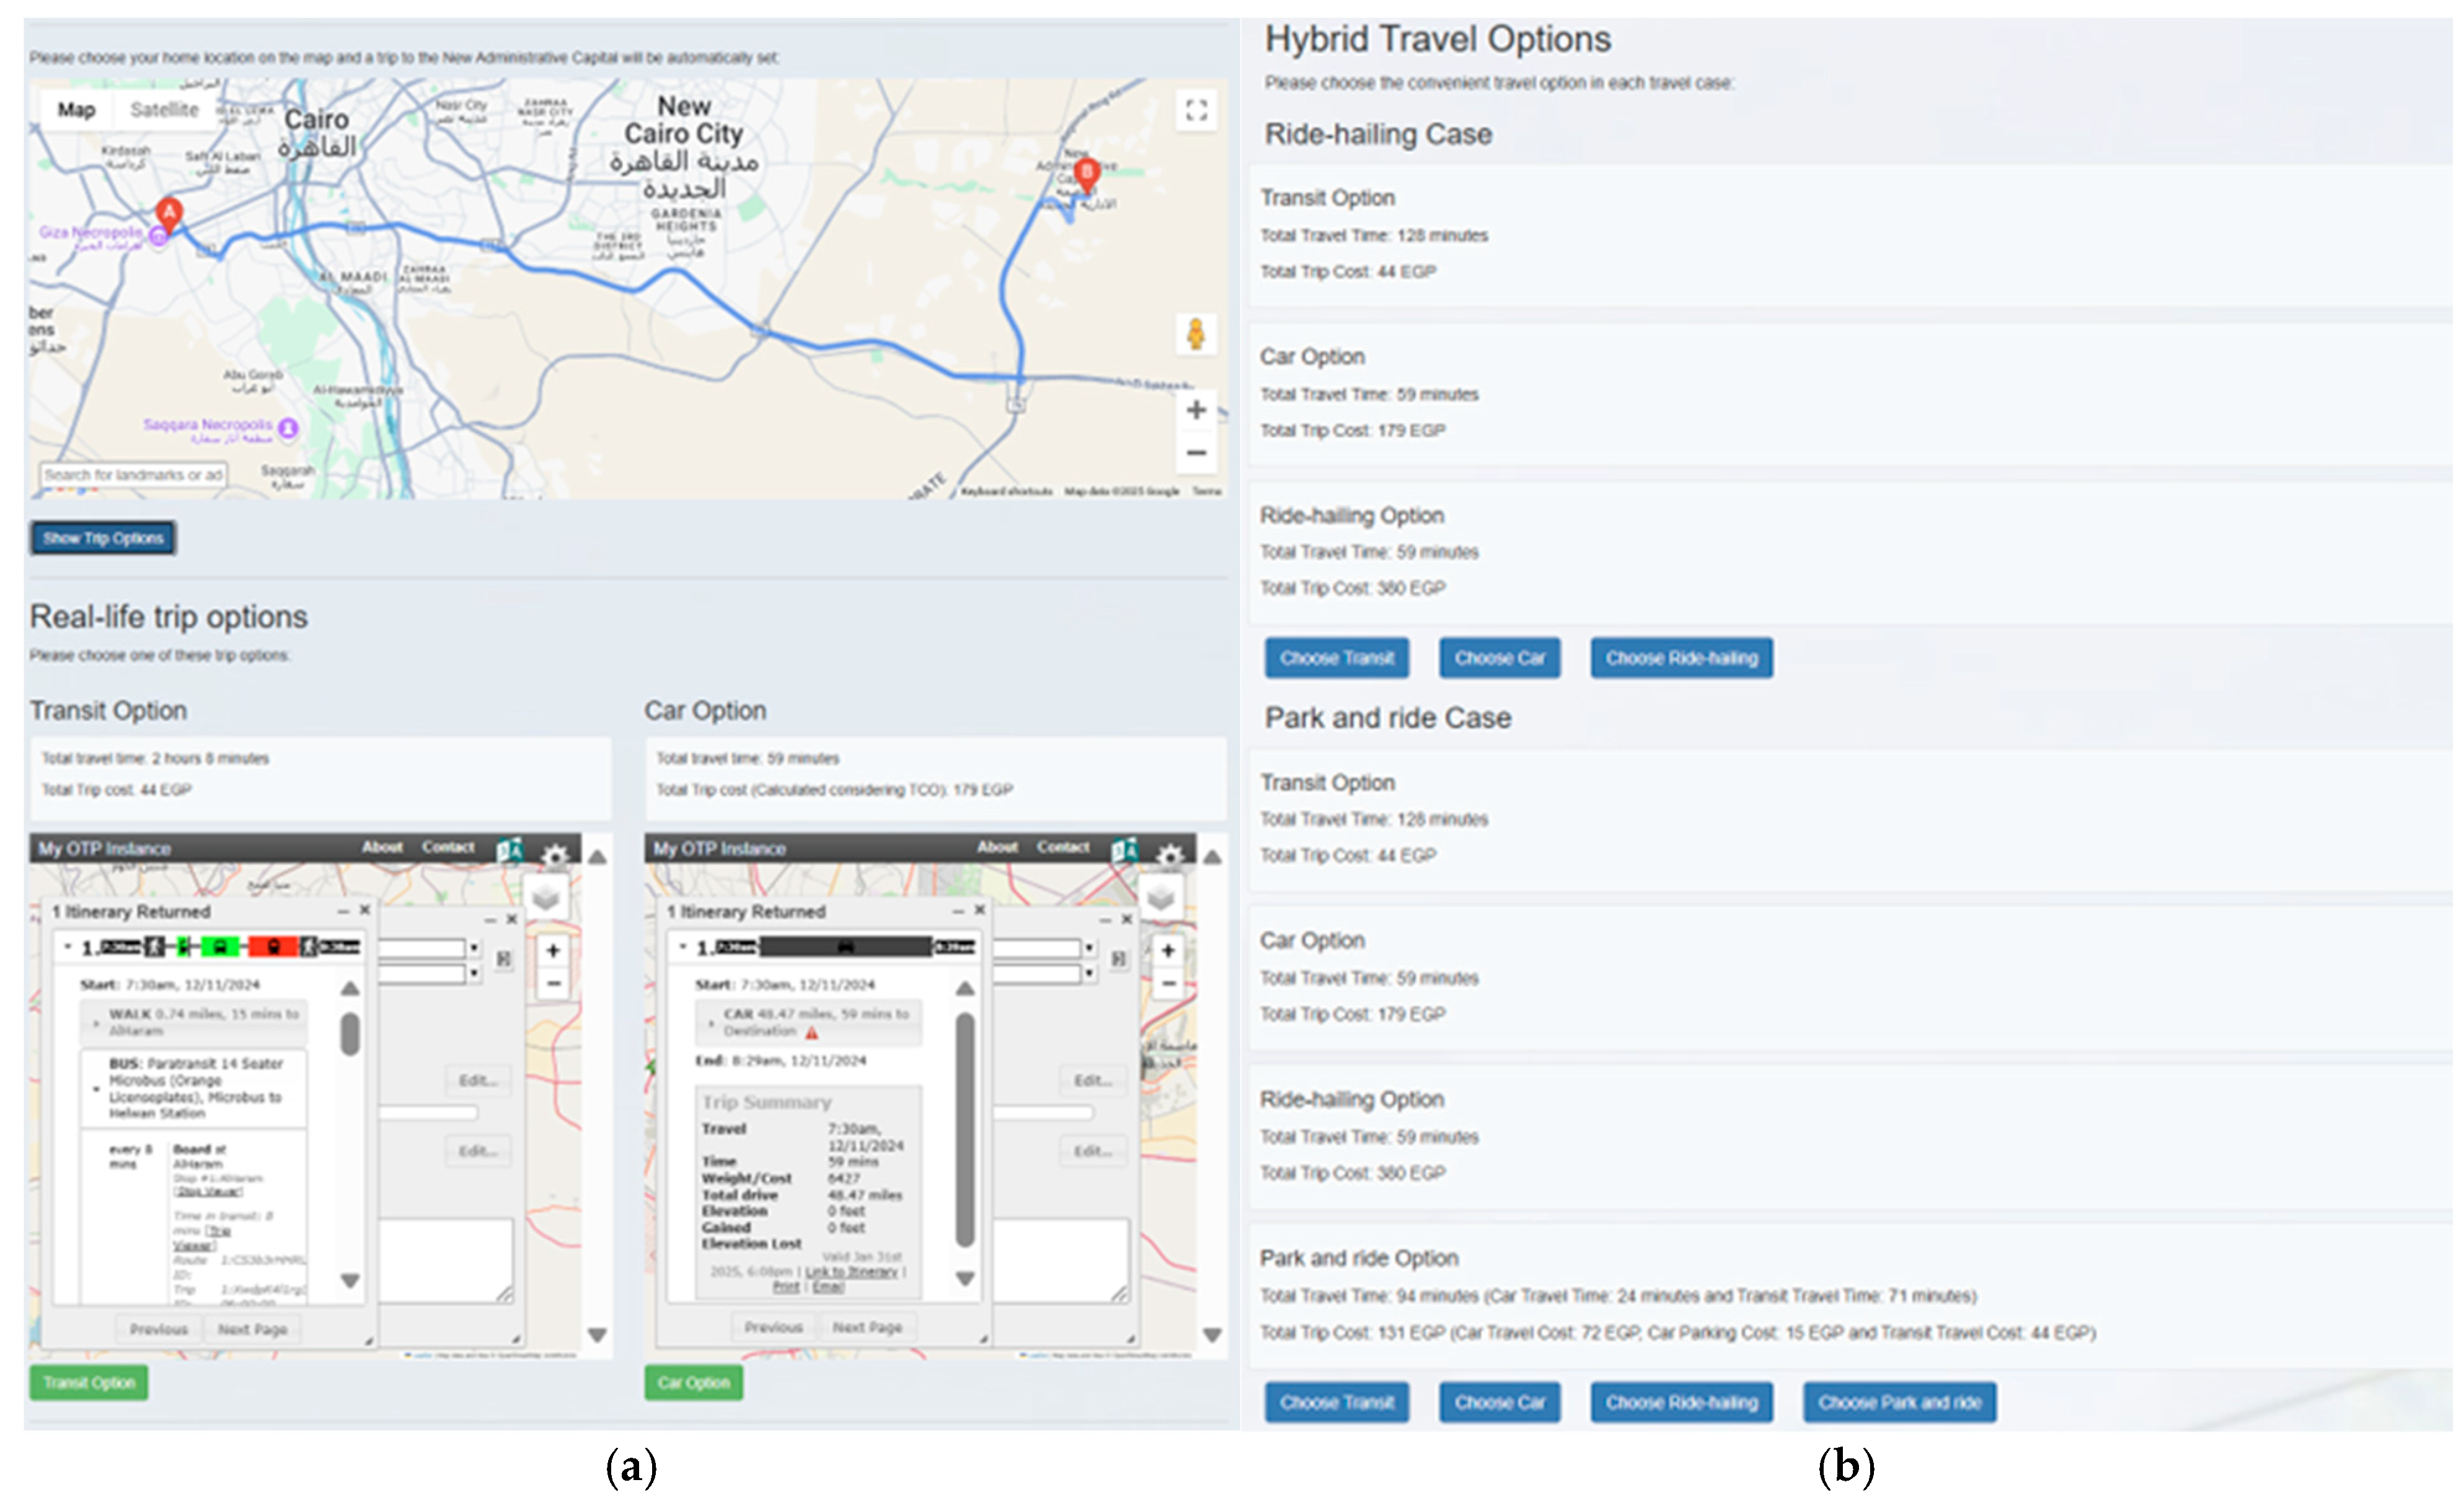
The participant is then guided to select their home location on an interactive map, which dynamically sets a trip to the New Administrative Capital. The map functionality integrates Google Maps API, enabling participants to interact with Cairo’s urban geography. The system does not generate any trip options until the user chooses their home location on the map and clicks the “Show Trip Options” button, as shown in Figure 4a. As said, this feature is critical for simulating real-life trip calculations, as it provides relevant context for the participant, ensuring that the survey captures realistic spatial data for personalized trip simulations and geographic precision for origin-destination analysis.
Thereafter, three sections are dynamically deployed to provide a scenario generation framework that implements a sophisticated choice modeling approach, which systematically varies travel attributes while maintaining realistic constraints based on Cairo’s transportation network characteristics. Each option is displayed with detailed travel information and visual maps. As shown in Figure 4a, participants are asked to select their preferred mode, establishing a baseline for their existing travel preferences from an actual real-life perspective, meaning the information provided for public transportation options, travel time, or fare, is based on the currently available and future transportation projects data, and considering a multimodal trip planning approach. Car travel costs are calculated considering the total cost of ownership at 2.3 EGP/km, which considers fuel consumption and cost, vehicle depreciation, maintenance costs, etc.
The section “Travel Scenarios” introduces a set of hypothetical travel scenarios to assess behaviour under varying conditions. Relevant to the “Real-life trip options”, four cases are presented as variants in the range of ±25%, each adjusting transit and car options in terms of travel time and travel costs based on values. Participants are asked to choose the more convenient option for each case. This evaluates the sensitivity of their mode choice to time and cost changes and helps identify potential policy levers for encouraging behaviour shifts.
The fifth section, “Hybrid Travel Options,” explores participants’ preferences for intermodal (integrated) travel options, progressively combining multiple modes in a single trip. The study implements seven distinct hybrid travel scenarios, five focusing on travel mode selection based on travel only considerations and one travel scenario focuses on participant’s preference when choosing between last mile connectivity options, where each case is presented as a row of options, with detailed information on time and cost for each mode based on attributes defined in Table 1 and as displayed in Figure 4b. The specific logic for hybrid options involves systematic attribute variations to simulate realistic multimodal trade-offs in Cairo’s fragmented network, while incorporating non-travel factors to test broader behavioral drivers like environmental awareness. This scenario generation framework enhances methodological rigor by grounding hypotheticals in participants’ real-world contexts, thereby reducing hypothetical bias and improving external validity, as recommended in context-aware SP literature [26,27,28].
Participants are asked to choose their preferred option for each case. This section is critical for examining the appeal of MaaS solutions and their potential to replace traditional travel modes. Two other travel scenarios focus on testing the influence of other non-travel parameters on travel mode choice:
  • Environmental Impact: Comparing CO2 emissions for transit (36 gm/min) and car options (230 gm/min).
  • Calories Burned: Estimating physical activity contributions from cycling-transit (280 calories) combinations and comparing them to Ride-hailing and transit (50 calories).
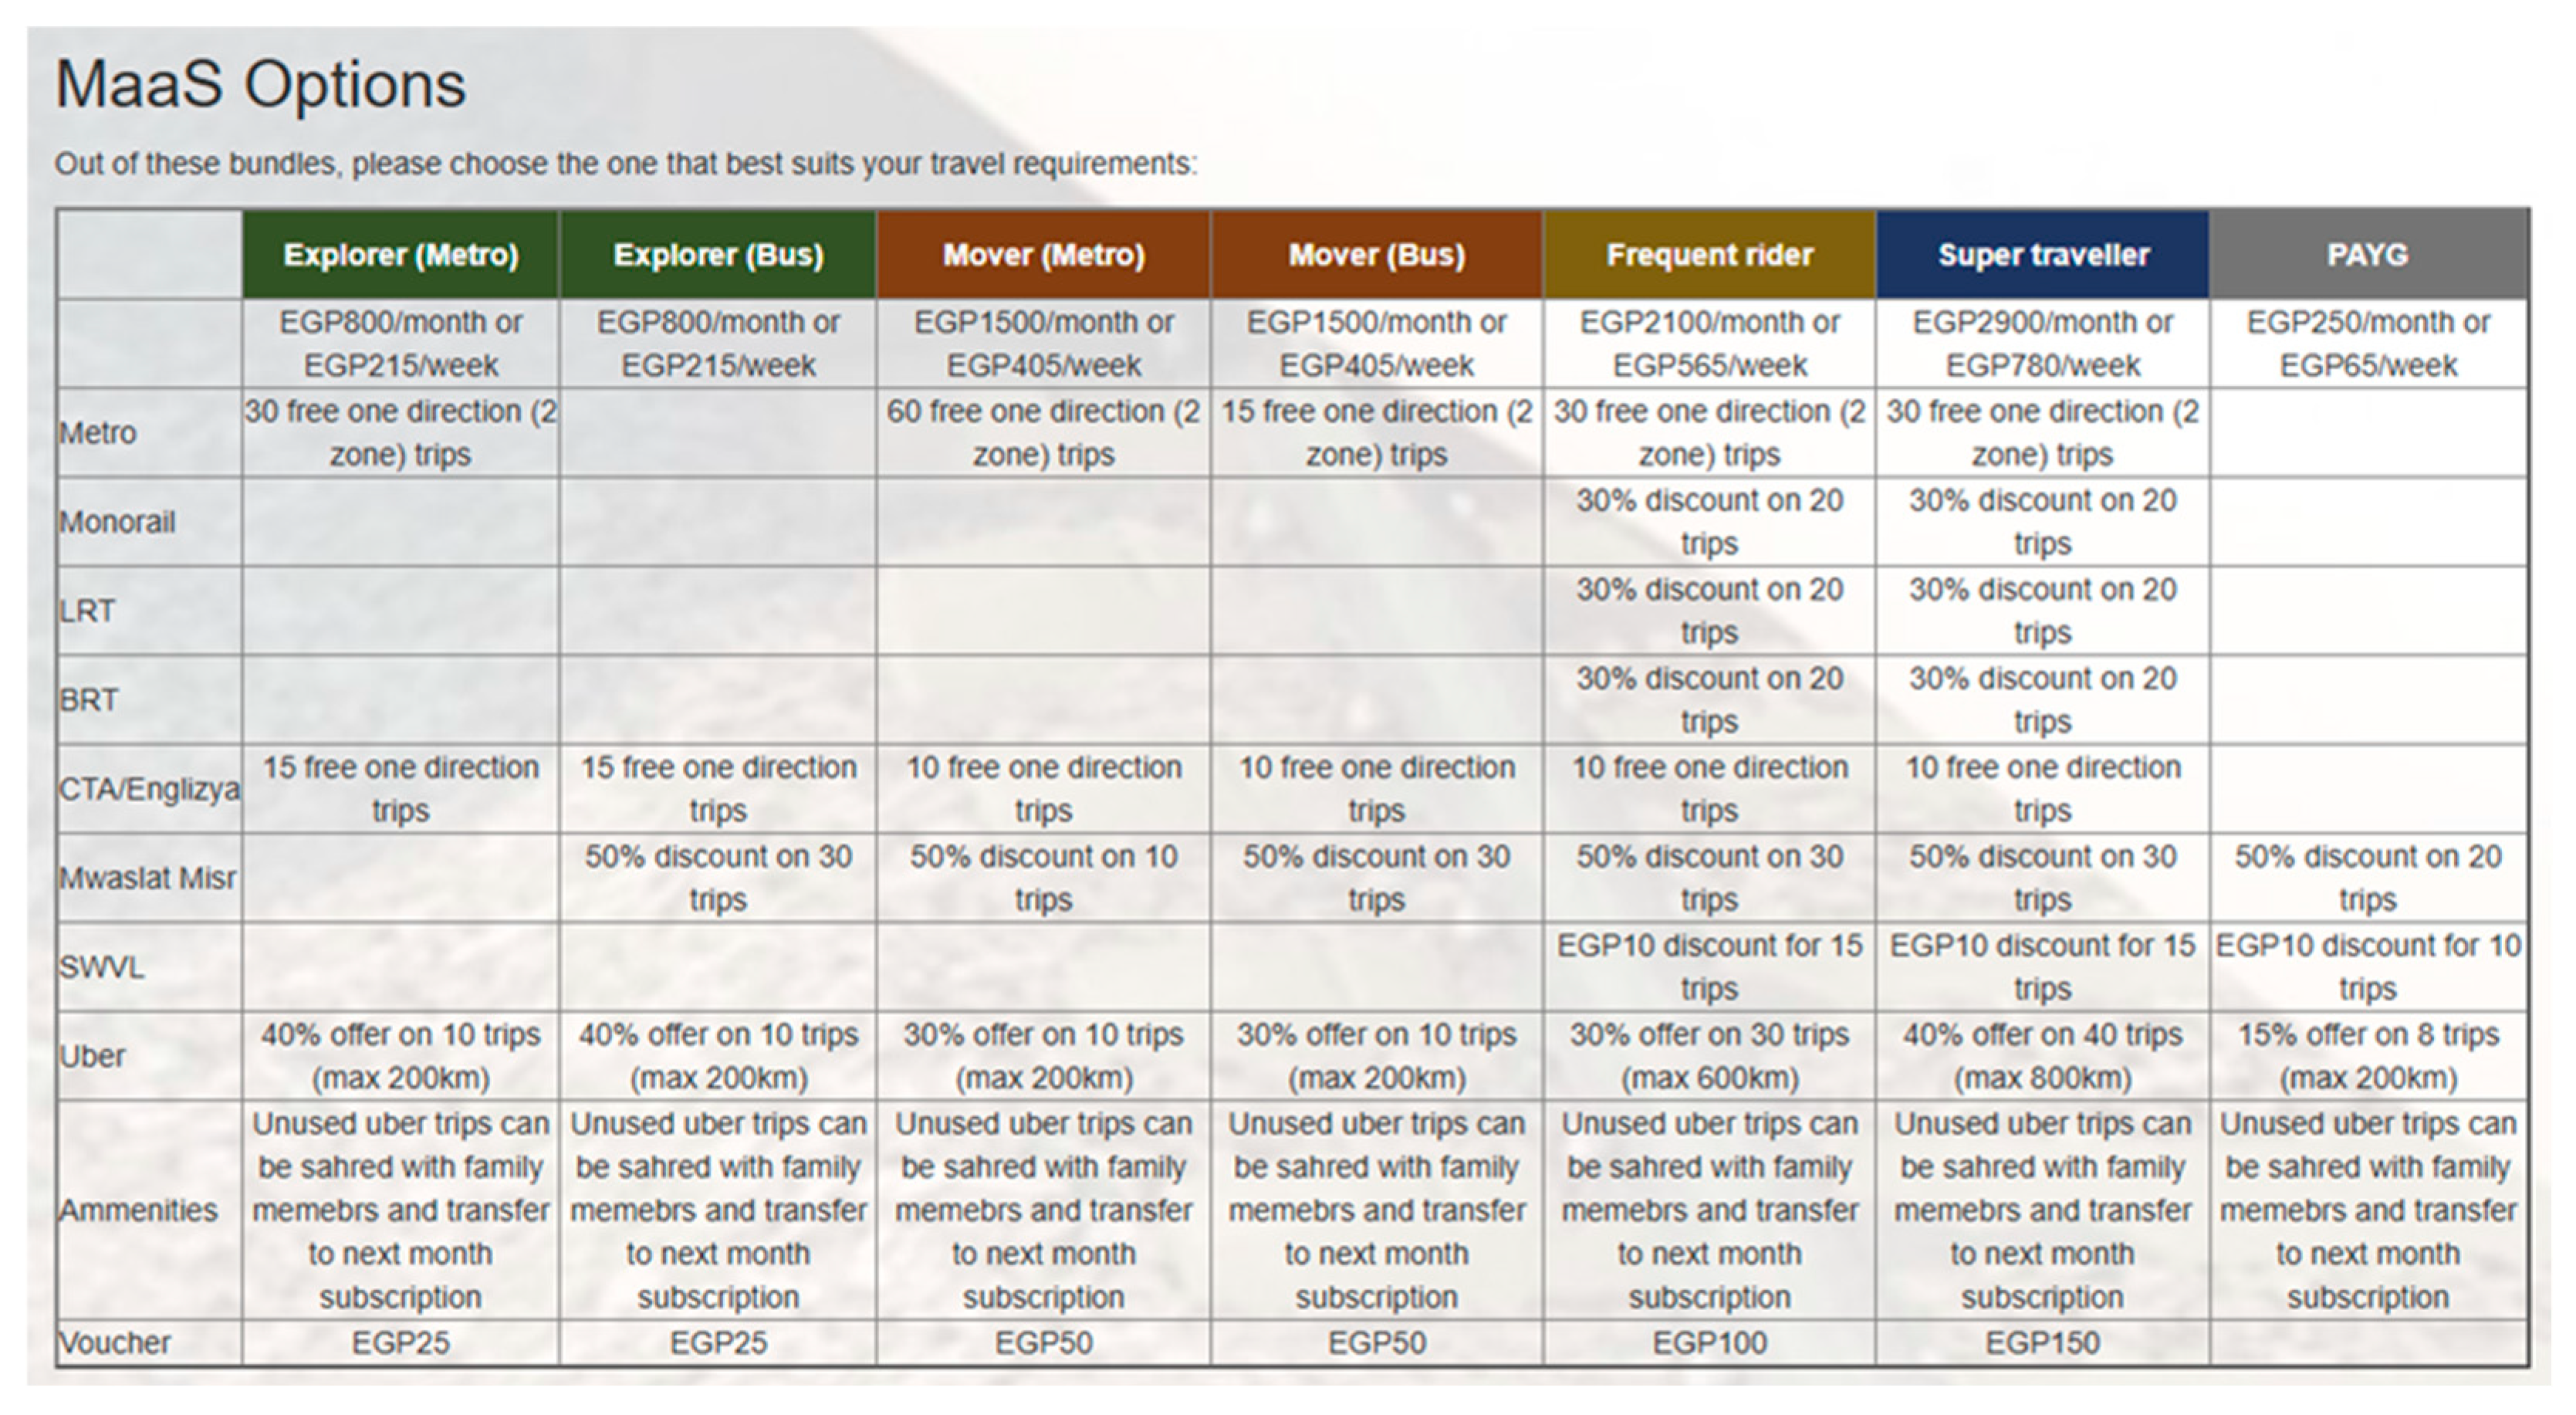
In the context of MaaS, a core part of the concept involves various mobility packages with different attributes, such as included modes, prices, and additional features. The bundles should incorporate public transport as a backbone, supplemented by shared mobility services like car-sharing, bike-sharing, and ride-hailing, with various subscription lengths and pricing models [37]. MaaS bundles offer great potential for MaaS adoption and scalability, especially considering their exceptional ability to offer personalized plans based on learning each user’s travel behaviour patterns. To test people’s acceptance, participants are presented with a detailed table of MaaS subscription bundles, showcasing various packages tailored to different travel needs. Seven bundle packages were carefully designed relevant to the revealed preference data, as detailed in Figure 5. Participants were prompted to select the bundle that best fits their travel requirements, highlighting their willingness to pay for MaaS services.
The bundles were designed to reflect Cairo’s travel needs, drawing from focus group inputs and thoughts on spending patterns and mode usage, with public transport as the core supplemented by shared services. Pricing strategies adapt lessons from the Sydney MaaS trial [40], offering monthly/weekly subscriptions and PAYG models to accommodate economic variability and promote adoption. For example, premium bundles like Super Traveler provide flexible credits and transferability, while Explorer options target budget-conscious users. Bundle design is inherently iterative, necessitating field trials to optimize parameters like personalization and elasticity in Cairo’s context.
The final section includes a comprehensive set of attitudinal and behavioural questions, formatted with clear answer options, including Likert scales and binary choices, ensuring ease of response:
  • Perceptions of Shared Mobility:
    o
    Willingness to use carpooling or bike-sharing systems.
    o
    Importance of reliability, comfort, and freedom in transportation decisions.
  • Public Transportation Attitudes:
    o
    Impact on independence and social image.
    o
    Preference for private vehicles in multi-trip scenarios.
    o
    Willingness to use public transit if availability, reliability, or mobile integration improves.
  • MaaS Adoption Factors:
    o
    Influence of ticket-parking integration on MaaS adoption.
    o
    Sensitivity to fuel cost increases and comprehensive trip planning tools.
  • Relocation to the New Administrative Capital:
    o
    Willingness to relocate and perceptions of transportation developments in the area.
  • Awareness of Cairo’s Transportation System:
    o
    Knowledge of formal/informal systems and new modes being implemented.
The survey concludes with a ‘Submit” button, which saves participant responses to the database. The system provides real-time feedback upon successful submission, ensuring participants are informed about the completion of their input.

2.2.2. Technical Solution Description and Features

The MaaS SP survey application is built on a robust technical architecture that combines modern web technologies and a scalable backend infrastructure, designed to ensure seamless integration of map-based inputs, travel option simulations, and survey logic to capture nuanced travel behaviours. The system provides seamless functionality and real-time responsiveness. Its technical implementation can be broken down into three primary layers:
  • Front-End (Presentation Layer)
The front-end of the application is developed as a web-based system using HTML, CSS, and JavaScript, with a focus on responsiveness and user experience. The application employs the Google Maps JavaScript API to allow users to select their home location on an interactive map, which serves as the origin point for trip scenarios. Additionally, Google Places API is utilized to provide search capabilities for landmarks or addresses, enhancing user convenience. OTP is embedded inside the interface using an iframe to view trip details. Dynamic behaviour on the front-end is enabled through JavaScript event handling, ensuring that user actions, such as selecting trip options or submitting survey responses, are captured and processed efficiently. The front-end also integrates third-party libraries for styling and layout, providing a visually appealing and intuitive user interface.
  • Backend (Application Logic Layer)
The backend of the application is built using Node.js with the Express.js framework. This architecture facilitates efficient request handling and ensures scalability for multiple concurrent users. The backend serves multiple purposes, including delivering static assets (HTML, CSS, and JavaScript files), managing API requests, and handling survey data submissions. The backend processes user responses and stores them in a relational database; it also handles API calls to external services. Upon receiving user inputs, the backend organizes the data into structured formats suitable for database storage. This includes trip attributes (e.g., travel time and cost), user preferences, and survey responses.
  • APIs and External Integrations
    The system leverages multiple external APIs to enhance its functionality:
    o
    Google Maps JavaScript API and Google Directions API: Enable interactive map functionality for origin selection, and display the origin-destination route along the map.
    o
    Google Places API: Facilitates location search and geocoding.
    o
    OTP API: Simulates multimodal trip planning by generating data for transit and car travel comparisons.
This integration of multiple APIs ensures that the system provides real-world trip data, enhancing the realism and reliability of the SP survey.
  • Database (Data Management Layer)
The application uses a MySQL relational database to store structured survey data. The database schema is designed to accommodate a wide range of attributes and is connected to the backend using the MySQL Node.js driver, enabling secure and efficient data insertion. Additionally, SQL queries are optimized to handle large datasets, supporting future scalability for broader survey deployment.

2.2.3. Open Trip Planner (OTP)

To simulate real-world travel scenarios, the MaaS SP survey integrates Open Trip Planner (OTP-V2.3.0), an open-source, multimodal trip planning tool that serves as the backbone for route generation and travel data simulation. It employs a modified routing algorithm that optimizes trips based on multiple criteria, including travel time, transfers, and walking distance, to identify optimal journeys through complex transit networks. OTP utilizes OSM data to create a detailed street network to model car, cycling, and walking routes, and GTFS data to provide accurate routing information, taking into account various modes of transportation. The software has been validated in numerous urban contexts and academic studies [40,41], showing strong correlation with real-world travel times in similar transit environments.
OTP’s REST API endpoints were configured to accept routing requests from the main application. The API was pre-configured with all the trip attributes required by OTP to provide a response. The user selects their home location on the interactive map, which provides coordinates as input. The application generates routing requests for different modes of transportation and computes the optimal route based on the specified parameters, and then returns a detailed JSON response containing the itinerary details and cost estimates. The integration of OTP not only enhances the technical depth of the survey application but also ensures that the travel scenarios presented to users are grounded in realistic and context-specific transportation data. This realism is crucial for eliciting reliable stated preferences and understanding the potential behavioural shifts associated with MaaS adoption.

2.2.4. Cairo Public Transportation System GTFS Data

Developing comprehensive General Transit Feed Specification (GTFS) data for Cairo was a significant undertaking. While some existing GTFS data might be available, it often lacks completeness. For instance, Transport for Cairo [42] has some GTFS files for public buses and metro lines with a decent representation of informal transportation modes, yet incomplete. Multiple GTFS files from different sources were compiled, while cleansing and filling the gaps in all existing data on formal and informal transport. Further, GTFS data for all new public transportation lines undergoing implementation were developed, including Monorail lines, LRT lines, Metro line 4, and Ring Road BRT. Data was collected from different sources, such as maps, schedules, fare structure, or even scraped timetables for existing lines. This process involved digitizing routes and stations, utilizing tools like AutoCAD (2018 V22.0) and Google Earth (V7.3.6), and using GTFS Manager (V3.4.4) to create and validate the necessary GTFS files.

2.3. System’s Robustness and Limitations

The Node.js backend, powered by Express.js, utilizes asynchronous event-driven processing for handling concurrent user and API requests, with built-in middleware providing centralized error handling that logs issues and provides fallback responses, such as retry mechanisms to maintain user session continuity. This setup supports real-time responsiveness for dynamic elements like map-based origin selection and OTP-embedded trip simulations via iframes, while the modular design allows for independent scaling of components such as GTFS data integration. The system minimizes downtime by gracefully managing system crashes from invalid inputs or database failures, while the modular routing allows for isolated updates without affecting the entire system.
For data security, all form submissions are processed over secure connections. No personally identifiable information is stored beyond what’s necessary. Respondents are prompted to optionally enter their personal information, such as names, emails, and phone numbers, complying with basic GDPR-inspired principles for anonymized analysis. Data is encrypted at rest and sanitized using parameterized MySQL queries to prevent injection attacks. Prior to deployment, comprehensive testing was conducted (considering 500 concurrent users), including unit tests for backend routes, integration tests for API chains, and load testing with simulated high-traffic scenarios, and pilot runs with a subset of users to validate GTFS data accuracy and iframe-based OTP displays.
Potential limitations of the technical architecture include Node.js’s single-threaded model, which could lead to performance issues under extreme loads. Moreover, MySQL’s handling of large JSON responses from OTP, iframe integration risks like cross-origin issues, and dependency on third-party APIs (like Google Maps, which could introduce latency, downtime, or APIs’ rate limits, and OTP’s reliance on accurate GTFS/OSM data, which could introduce inconsistencies in Cairo’s informal transport context. No major technical failures were reported during the survey rollout, though future iterations could involve microservices architecture for even greater modularity in handling multimodal simulations and further incorporating containerization for even greater scalability.

3. Results and Discussion

3.1. Descriptive Analysis of Survey Data

The consolidated dataset, derived from the RP household travel survey and the context-aware SP survey, administered to 313 participants, provides a multifaceted view of Cairo commuters’ socio-demographic profiles, current travel behaviors, and prospective preferences under MaaS scenarios, particularly in the context of the New Administrative Capital. Data validation steps included automated checks for logical consistency and exclusion of outlier entries. Descriptive statistics, including means, standard deviations, minima, maxima, and categorical distributions, are derived from the dataset to provide insights into participant profiles and travel patterns (Table 2). Percentages are calculated based on the total sample, facilitating a nuanced reflection on how MaaS might influence commuter behavior in Cairo’s congested transport landscape. This section details some of the results obtained and provides a reflection on the participants’ demographics and their current travel patterns as revealed through the household travel survey. Furthermore, brief insights drawn from the responses to the MaaS SP survey are presented as well.

3.2. Personal, Socio-Demographic, and Household Characteristics

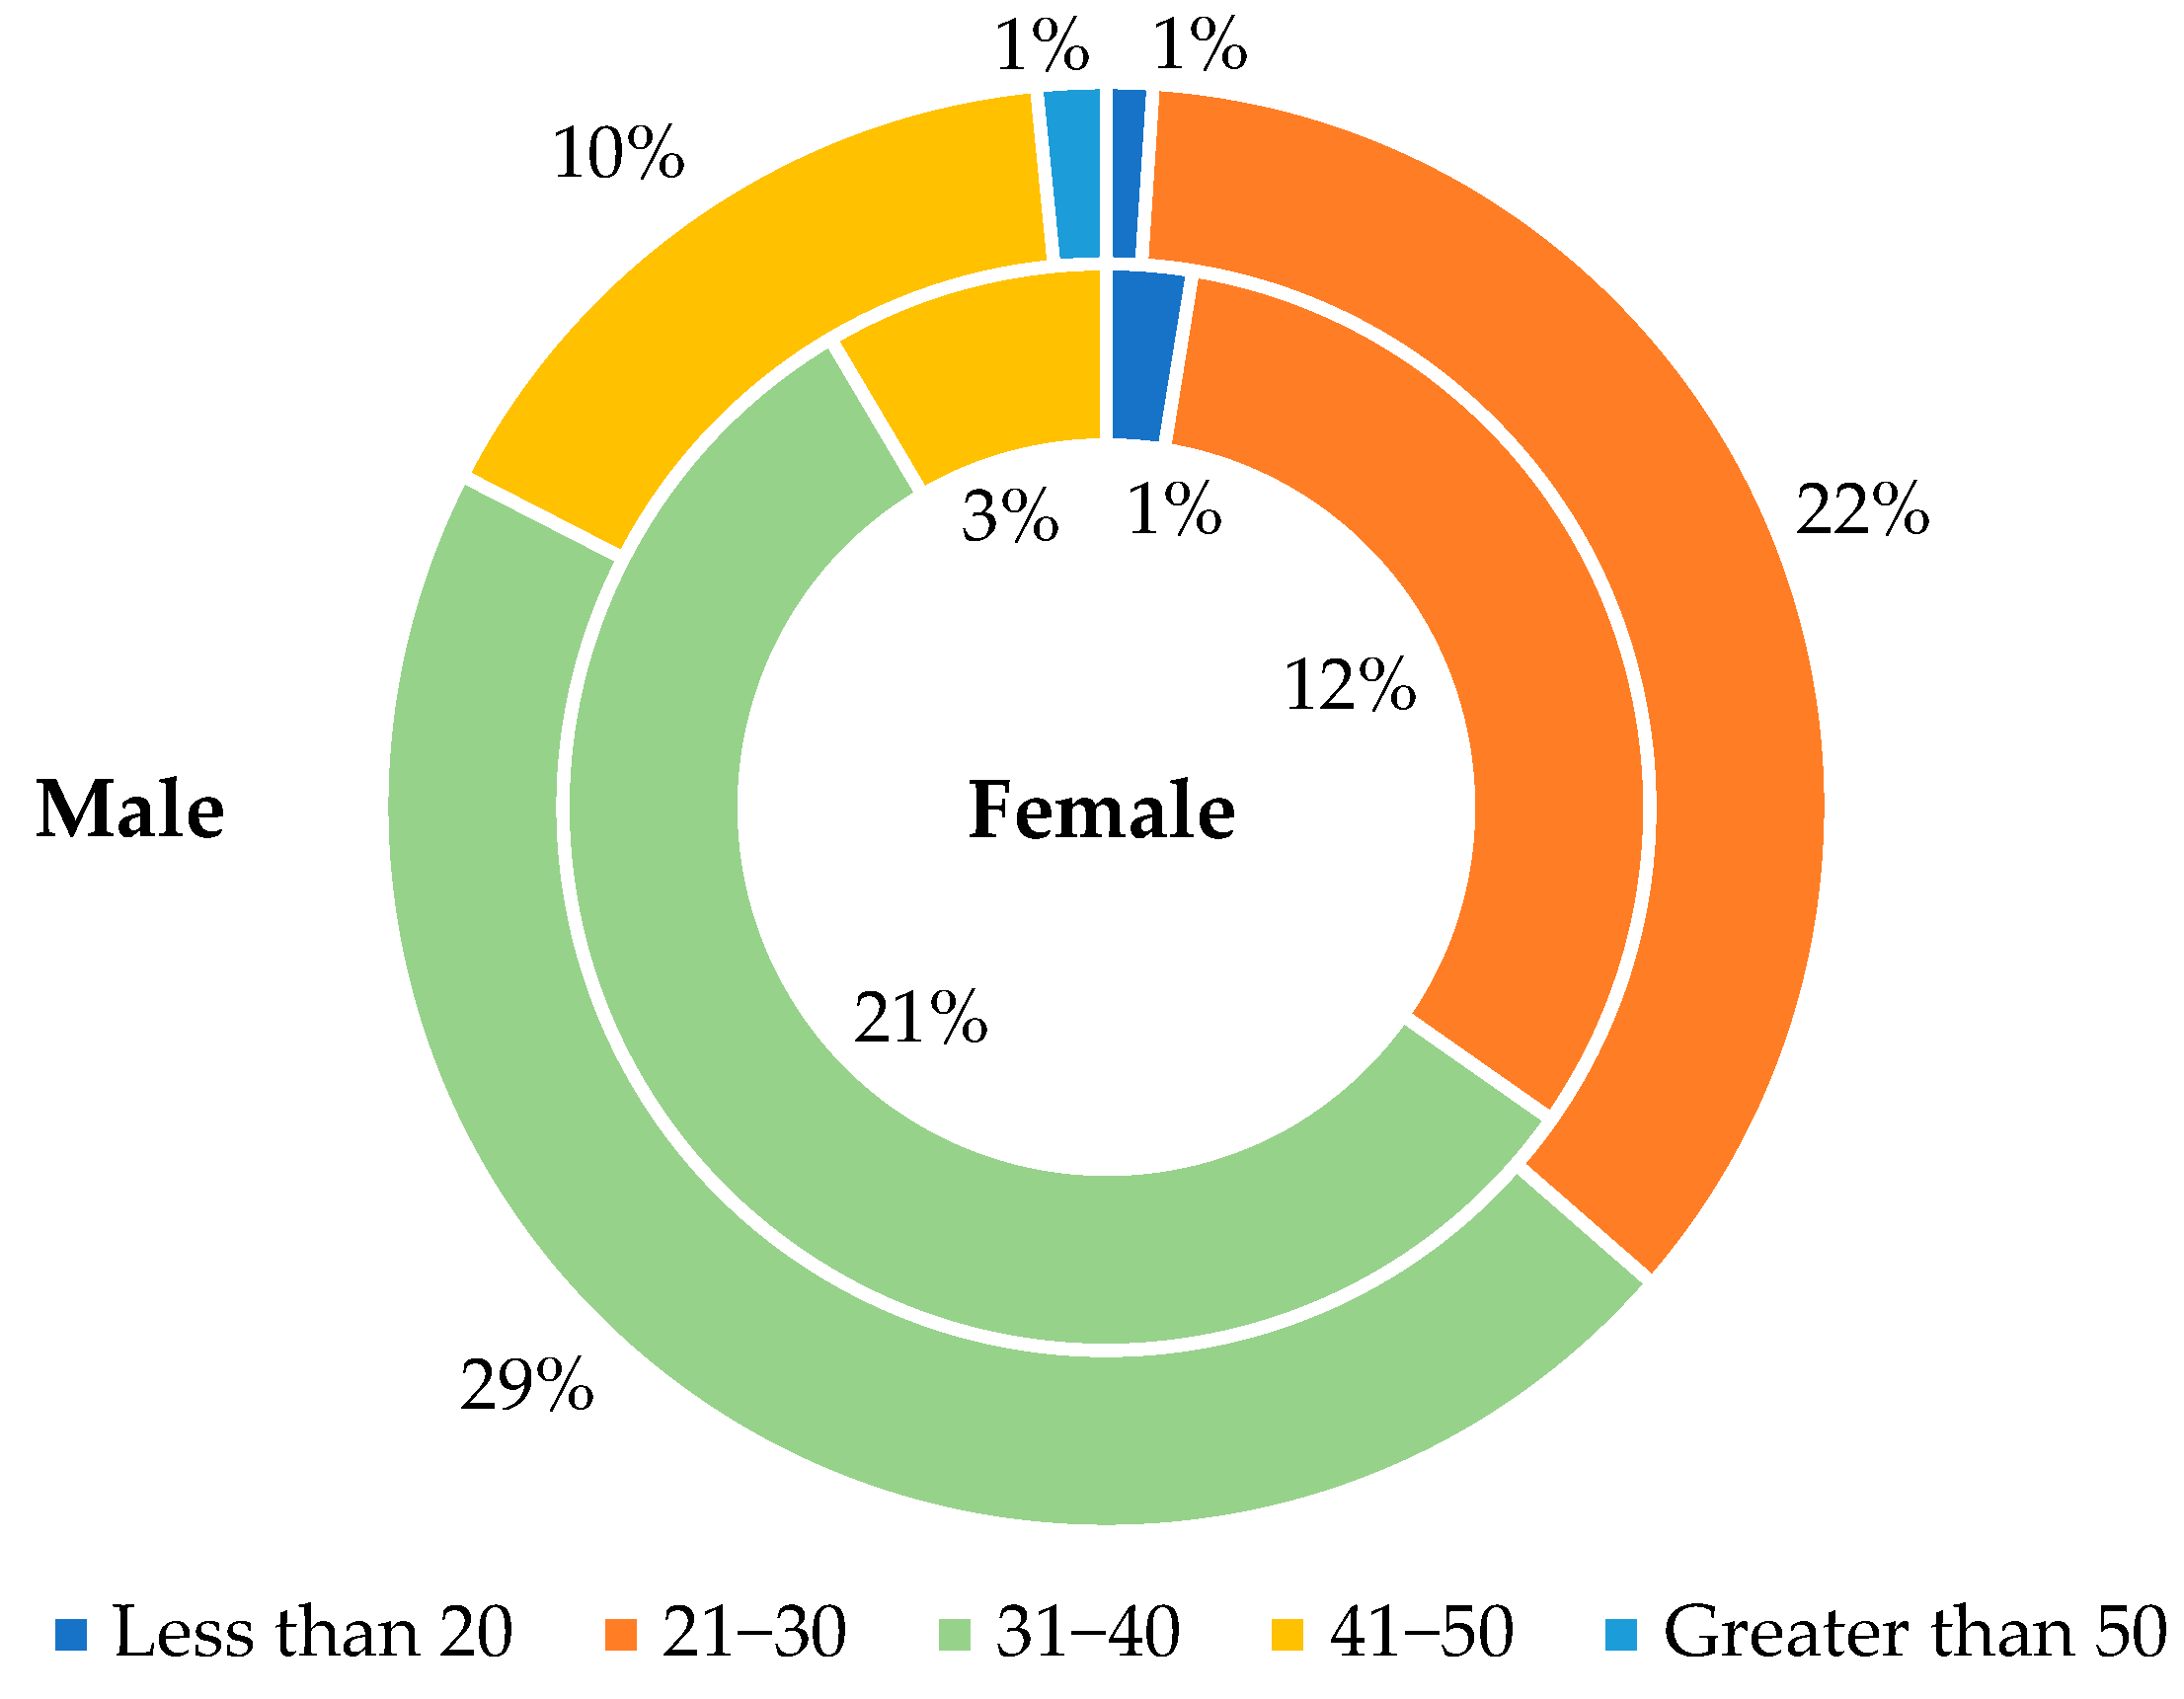
The study encompasses a diverse sample of participants. Key socio-demographic insights reveal a predominantly young, educated, and employed cohort, predominantly representing young to middle-aged professionals in urban environments. The age distribution reveals a concentration in the economically active population (early- to mid-career individuals), with a mean participant age of 31.9 years (SD = 6.9, range = 18–51). Gender distribution skews male, with 195 males (62.3%) and 118 females (37.7%). Figure 6 demonstrates the participants’ gender and age group distribution. The majority of the survey participants were highly educated, more than 74% are university-educated, a higher proportion compared to the general population.
Household dynamics reveal family-oriented structures, with household size averaging three or more persons, with the majority (68%) having one or two children, and 20% report none. Most households have two working partners (52%), with work locations predominantly fixed (80%) and minimal home-based or mobile work (2%), and almost all participants commuted to work 5 times per week (95%). The economic profile of participants reveals significant income variation, with the largest segment (64%) earning between 121 K and 500 K EGP annually, with extremes at <36 K (1%) and >1 M (5%). Housing patterns among participants reflect relative economic stability, with 47% owning their residences and 53% being renters. The predominant housing type is apartments, accounting for 76% of residences, with an average size of 149 square meters. Vehicle ownership patterns demonstrate high automobile dependency, with 94% of households owning at least one vehicle. Driver’s license possession is widespread (89%), mostly dominated by male participants (58%) over females (30%). The sampling strategy deliberately targeted car-dependent residents with higher education levels, income, and digital literacy. As a pilot study with a convenience sample size of 313 participants, while this approach may limit generalizability to the broader Greater Cairo population, it provides adequate representation for preliminary insights into potential mode shifts among high-potential MaaS adopters, consistent with sample sizes in exploratory SP research [23,38].

3.3. Travel Patterns and Behavioral Analysis

3.3.1. Modal Split and Transportation Preferences

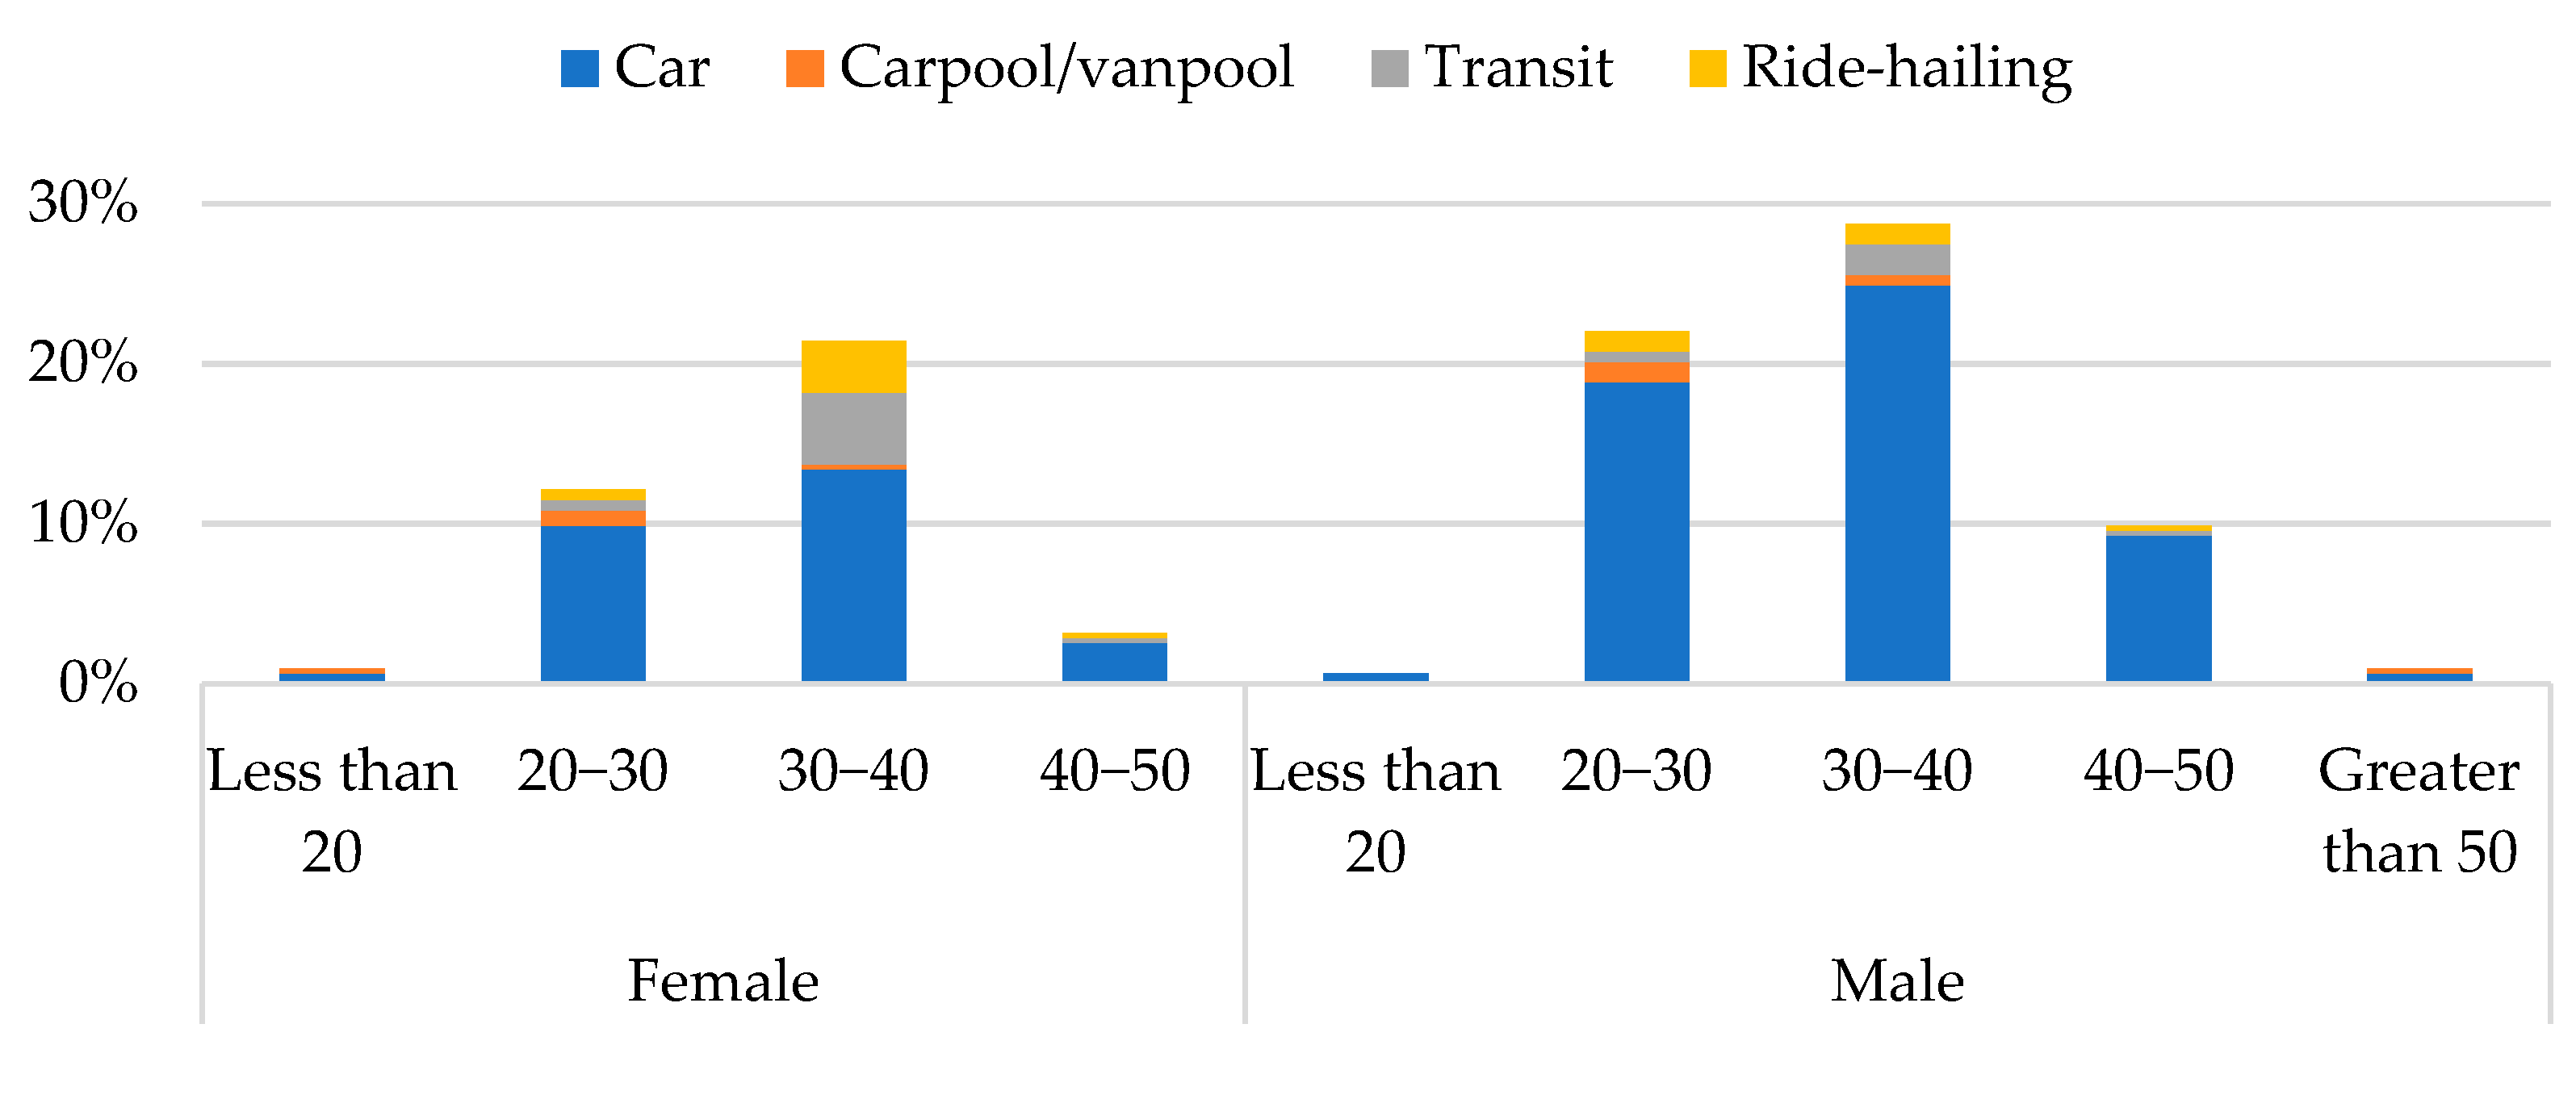
Comprehensive analysis of the survey data suggests a significant preference for private vehicles among Cairo commuters. Private car usage dominates the modal split, particularly among higher-income households, despite key economic and time-related trade-offs. This aligns with the challenges outlined regarding Cairo’s transportation landscape, where, despite an extensive public transport network, car dependency remains embedded. As evident in Figure 7, the modal distribution data indicate that approximately 81% of trips are made by private vehicles, with public transportation accounting for roughly 8% of trips, and ride-hailing services at 7%.

3.3.2. Travel Time and Distance Patterns

Daily travel patterns show great variability by time and distance. The average daily commute to work is 38 min per direction (SD = 23.6, range = 5–165). The largest percentage of commuters (approximately 26%) spend 30–40 min traveling to work in each direction, about 20% have a 20–30 min commute, while 16% spend 40–50 min. Regarding distance traveled, the average work trip distance is 26 km, with a range of 1–102 km per direction. Most commuters live relatively close to their workplace, with 39% of participants in the 10–20 km range and approximately 15% commuting less than 10 km. Total daily travel time averages 91 min, ranging from 10 to 345 min, at an average distance of 59 km (SD = 36.6, range = 1–241). The average distance to shopping locations was 23 km with a median of 18 km (SD = 13.4, range = 5–61); thus, there is a fair reliance on private vehicles for non-work trips, underscoring sprawling urban patterns amenable to MaaS optimization.

3.3.3. Economic Dimensions of Travel Behavior

The average daily transportation expenditure for participants stands at 83 EGP per day (SD = 58.7, range = 0–480), with the bulk of this amount (74 EGP) attributed to direct travel costs. Whereas the average daily commuting cost to the workplace is 59 EGP (SD = 45.5, range = 5–360), around 70% of the total travel cost per day. The maximum daily transportation cost reported by participants reaches 480 EGP; however, a minor % only showed such very high elevated costs. The availability of parking at the workplace significantly influences travel mode choices; 50% of participants have on-street parking. Furthermore, 71% of participants do not pay directly for parking, subsidizing car use and thus potentially discouraging the use of alternative modes. Additional expenses include parking fees averaging 26 EGP and toll charges averaging 19 EGP daily; median values are not much different.

3.4. Predicted Modal Shift Under Variations to Travel Patterns and Modal Integration

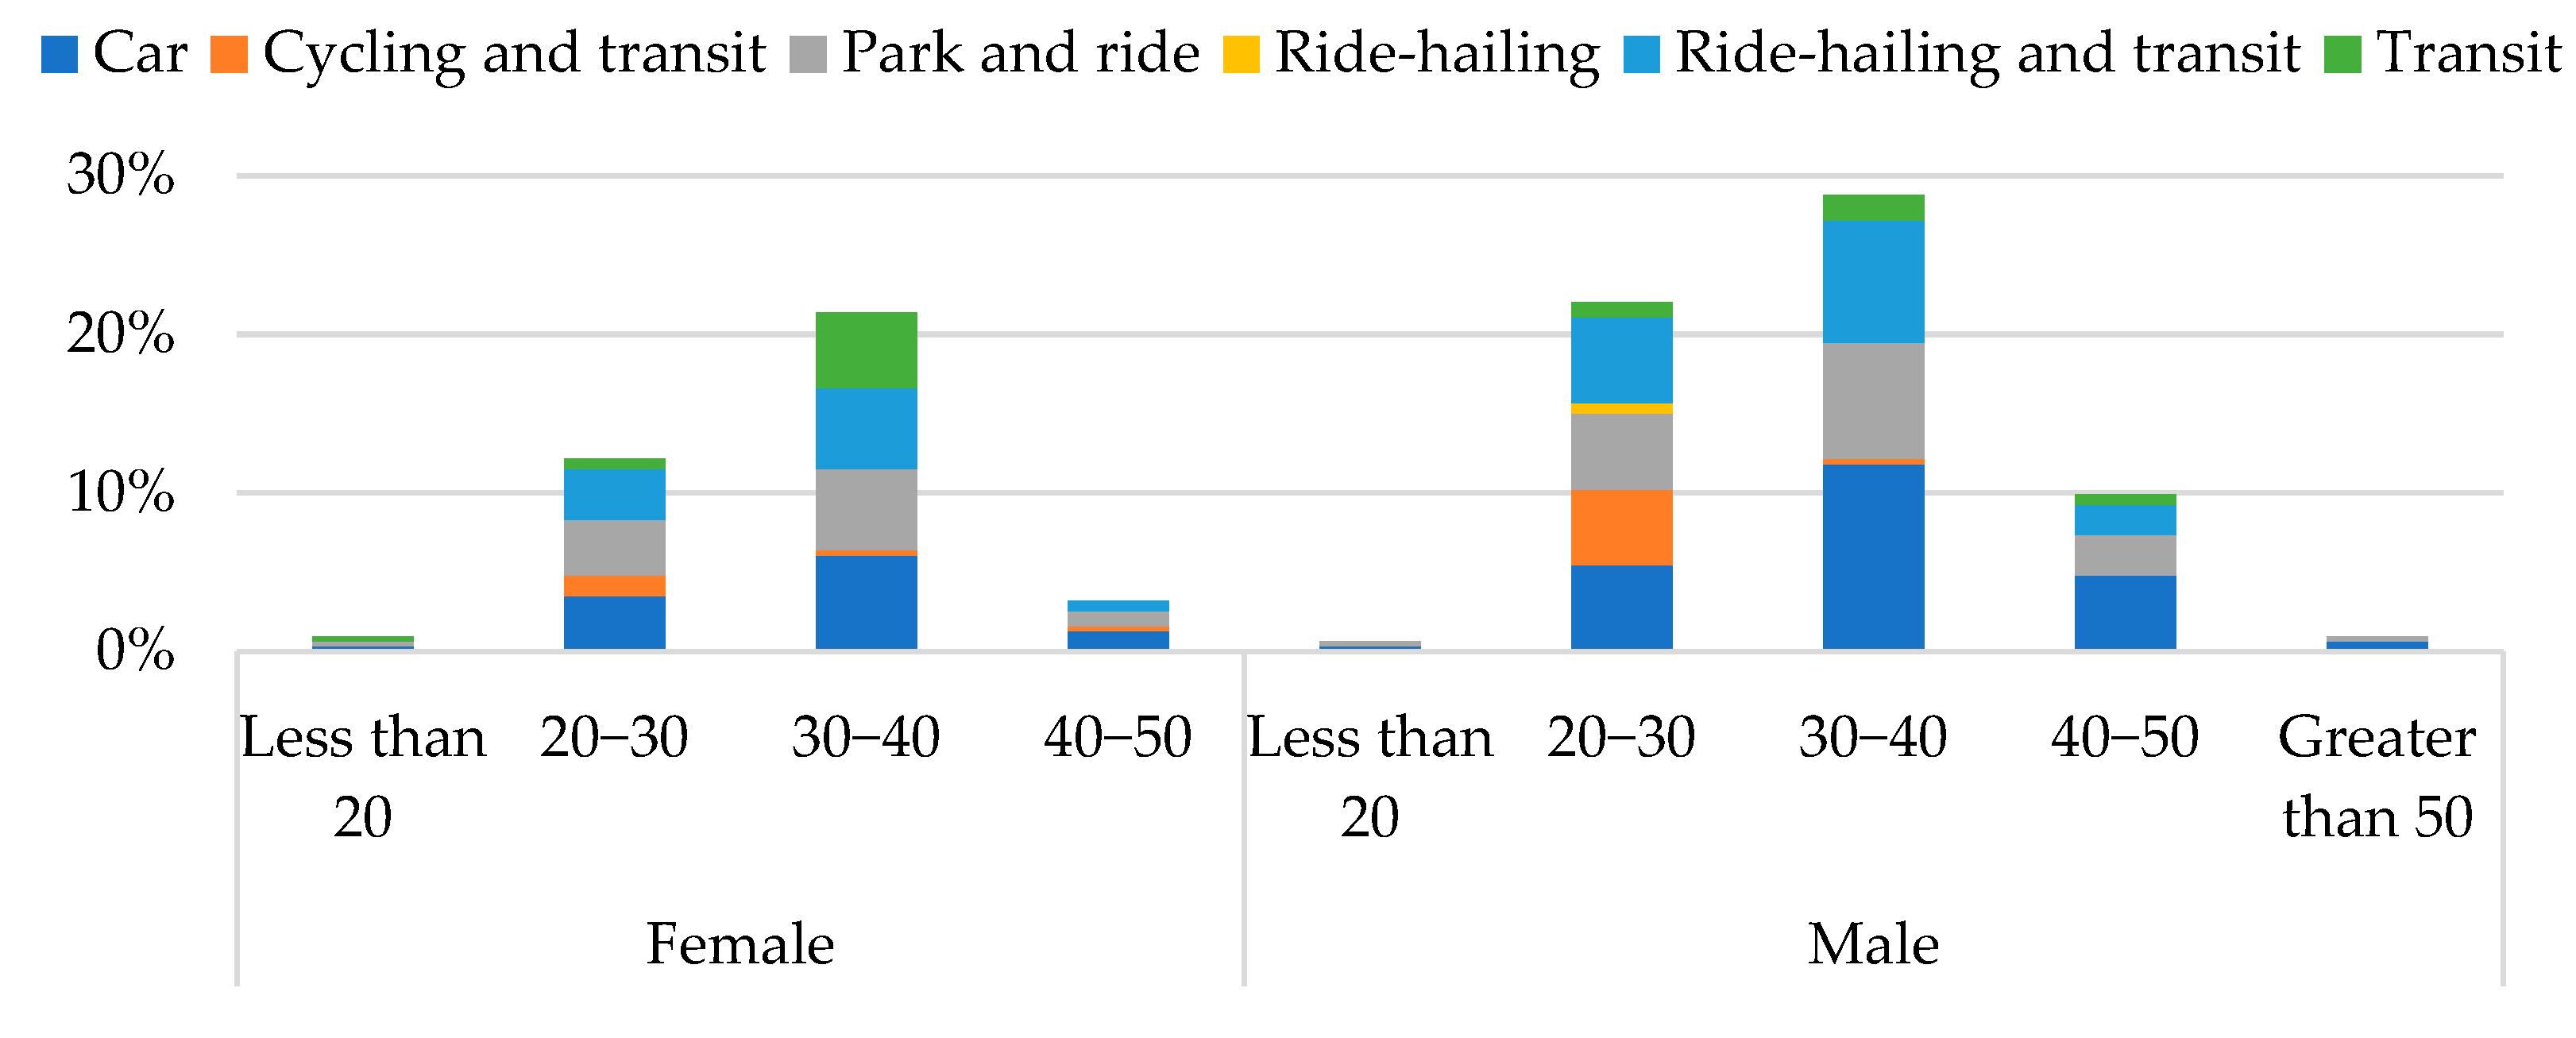
A core part of the parameter of the MaaS travel survey revolves around being relative to participants’ home location and hence providing a personalized mode choice experience, being a context-aware SP survey. Accordingly, a comparison of the travel time, distance, and cost between the existing participants’ situation and the future scenario considering a work location in the New Administrative Capital becomes mandatory. The results demonstrated under the hybrid scenarios section, progressively elaborating to introduce more mode choices, somehow demonstrate an opportunity for balanced mobility solutions. The combination of ride-hailing services with public transit appears to be particularly appealing. Some were interested in combining cycling with transit, thus showing potential for diverse multimodal solutions. Figure 8 presents the distribution of mode choice preferences, revealing a strong preference for private cars (34%) among participants. This dominance is followed by prospective preferences signaling openness to MaaS alternatives, with 25% favoring park-and-ride options and 24% opting for ride-hailing integrated with transit. Traditional transit-only options attract only 9% of commuters, while cycling combined with transit shows limited adoption at 7%. The minimal utilization of ride-hailing alone (less than 1%) suggests it functions primarily as a complementary service rather than a standalone transportation solution, or when people are obliged to accept it since it is the only mode relatively having the same travel time as the car, or whether it being the only mode of choice available or for considerations such as comfort and safety. This distribution highlights a transportation ecosystem where private vehicles remain central, but hybrid approaches that combine the convenience of personal transportation with public transit infrastructure are gaining considerable traction.

4. Conclusions

This paper has presented the development of a comprehensive survey system comprising an RP household travel survey and an innovative context-aware SP survey focused on the MaaS concept. The methodological framework, including the choice of survey platforms, the design of the survey instruments, and the integration of real-world transportation data, has been detailed. Preliminary insights from the 313-participant survey reveal important insights into Cairo’s mobility landscape and MaaS potential. Despite extensive public transport infrastructure, 81% of participants rely on private vehicles for commuting, with 94% household vehicle ownership reinforcing embedded car-oriented patterns. However, the context-aware SP results demonstrate substantial openness to integrated mobility solutions: while private cars remain preferred (34%) for trips to the New Administrative Capital, park-and-ride options attracted 25% of participants, and ride-hailing integrated with transit appealed to 24%. The MaaS bundle analysis shows promising acceptance, with 49% selecting comprehensive “Super Traveler” packages, indicating willingness to pay for integrated services when properly packaged. Such findings on current travel behaviour and preferences for integrated mobility services suggest the feasibility and value of an integrated dual-survey approach that shall provide rich, policy-relevant insights into current mobility patterns and the likely effects of MaaS. The methodological innovations presented here offer a replicable model for other developing cities and rapidly evolving urban environments, like Cairo, seeking to leverage digital tools for sustainable mobility planning.
While this study provides foundational insights into MaaS acceptance factors and user preferences in the Cairo context, future research will focus on further and detailed analysis of the full-scale implementation of the survey system, and the development of behavioural models to predict MaaS adoption. Moreover, it shall provide an extended analysis of how these findings can inform specific transport policy measures and MaaS implementation strategies for Cairo, translating the empirical results into actionable policy guidance for transport authorities and service providers.

Limitations of the Current Study and Future Recommendations

During the study period, the fuel cost increased each quarter, and accordingly, car ownership costs have increased, as well as those of different transportation means. Moreover, during this phase, the car prices and car parts prices have gone a lot higher. All of which would impact the perception of the people taking the survey early compared to those taking it later towards the end of the study period. Regarding OTP’s standard implementation, it does not account for congestion effects on non-segregated transit modes, including cars and buses operating in mixed traffic, potentially underestimating travel times for these services. Moreover, SP scenarios, while context-aware, remain inherently hypothetical and may not fully capture real-world decision-making complexity; pilot MaaS implementations with behavioural monitoring, longitudinal studies, or VR/AR-based simulations are recommended in future research.

Author Contributions

Conceptualization, A.K., N.O. and A.M.; methodology, A.K., N.O. and A.M.; software, A.K.; validation, A.K., N.O. and A.M.; formal analysis, A.K.; investigation, A.K. and N.O.; resources, A.K. and N.O.; data curation, A.K.; writing—original draft preparation, A.K.; writing—review and editing, N.O.; visualization, A.K.; supervision, N.O. and A.M.; project administration, N.O.; funding acquisition, N.O. All authors have read and agreed to the published version of the manuscript.

Funding

This work was supported by the MEXT-Program for Research and Development for Accelerating Local Climate Actions in Partnership of Universities Grant Number JPJ010039.

Institutional Review Board Statement

The study was conducted in accordance with the Declaration of Helsinki, ethical guidelines for social science research, and approved by the Institutional Review Board of Utsunomiya University (protocol code H22-0116—approved on 12 January 2023).

Informed Consent Statement

By beginning the survey or interview, participants automatically consented to participate in the study. No written consent was required as no sensitive information was collected. Participants were clearly informed of the research purpose, scope, and general goals before providing responses. They were advised that participation was entirely voluntary and that their responses would remain anonymous. Participants were assured that all responses would be treated and published in aggregated form for scientific purposes only.

Data Availability Statement

The data presented in this study are available on request from the corresponding author.

Conflicts of Interest

Author Ahmed Mosa is the owner and general manager of the company “Masarat Misr”. The remaining authors declare that the research was conducted in the absence of any commercial or financial relationships that could be construed as a potential conflict of interest.

Appendix A

Table A1. RP Household Travel System Questions.
QuestionPotential Response
ID
Name
Email
Phone Number
Birth Date
GenderMaleFemalePrefer not to answer
How many motor vehicles are there in your household? Please include all motor vehicles that your household regularly uses0 (no vehicles)1 (I am the only one or someone other than me)2345
Is any of these vehicles owned in your household an electric or hybrid vehicleYesNo
Do you have a valid driver’s license or permitYesNo
Does anyone in your household, including yourself, have a public transportation service subscription (Metro, buses, etc.)YesNo
How many total people (including yourself) currently live in your household? Please include yourself, all other adults, all children, all roommates, and any household help who normally reside with you in your home1 (I am the only person)2 People3 People4 People5 People6 People7 People8 People9 People10 People
How many children do you have? Please do not include people who live away at school or college0 (No children)1 Child2 Children3 Children4 Children5 Children6 Children7 Children8 Children9 Children10 Children
How many people (including yourself) in your household are working (full-time/part-time jobs)?1 (I am the only person)2 People3 People4 People5 People6 People7 People8 People9 People10 People
How long have you lived at your current residence?Less than a yearBetween 2 and 3 yearsBetween 3 and 5 yearsBetween 5 and 10 yearsBetween 10 and 20 yearsMore than 20 years
Do you rent or own your current residence?Own/paying mortgageRentProvided by a jobPrefer not to answerOther
What type of place is your current residence?ApartmentTwin-houseStandalone villaDorm or institutional housingOther
Please indicate the area of your current residence (meter square)
How much do you pay monthly for rent in your current residence? (in EGP)
If you have changed your house location in the past 5 years, please indicate the reasonCould no longer afford the previous residence because of an increase in rent or housing costsCould no longer afford the previous residence because of a change in income or financesFriends, family, or cultural community were leaving the area or getting closer to themEstablished own householdMoving from a rented location to a bought locationNeeded more spaceNeeded less spaceEmployment or commuting considerations (e.g., to take a new job or shorten commute)Access to a different schoolGetting closer to the kids’ schoolsConcerns about safety or crimeUpgrade to a better quality homeUpgrade to a better quality neighborhoodForced to move out (e.g., building demolished or renovated, asked to leave by landlord, foreclosure)Other
What is your total annual household income (from all sources)?Less than 36,000 Egyptian pounds per year36,000–60,000 Egyptian pounds per year61,000–120,000 Egyptian pounds per year121,000–240,000 Egyptian pounds per year241,000–500,000 Egyptian pounds per year501,000–1,000,000 Egyptian pounds per yearMore than 1,000,000 Egyptian pounds per year
How much do your household members spend monthly on transportation? (in EGP)
Do you have a smartphone?Yes, Android phoneYes, Apple iPhoneBoth Android phones and Apple iPhonesYes, other smartphone typeNo, do/does not have a smartphone
If you have a smartphone, do you usually have access to the internet on your smartphone?YesNo
Your current job title is
Primary type of EmploymentEmployed full-time (40 h/week, paid)Employed part-time (Fewer than 40 h/week, paid)Self-employedUnpaid volunteer or internRetiredNot currently employedCurrently a student
Highest level of education completed?High schoolTechnical degreeUniversity degreeMaster’s, or PhD.
Please tell us about your usual work locationOnly one work location (outside of home)Work location regularly varies (different offices/jobsites)Work at home only (telework, self-employed)Various work locations (driver, sales agent)
What is your current pay at your job?Less than 36,000 Egyptian pounds per year36,000–60,000 Egyptian pounds per year61,000–120,000 Egyptian pounds per year121,000–240,000 Egyptian pounds per year241,000–500,000 Egyptian pounds per year501,000–1,000,000 Egyptian pounds per yearMore than 1,000,000 Egyptian pounds per year
How frequently do you commute to your workplace?6–7 days a week5 days a week4 days a week3 days a weekfewer than 3 days a week
Usual way of commuting to the workplace?CarPublic transitRide-hailing service (Uber, Careem, SWVL, or other smartphone-app car service)TaxiCarpool/vanpoolWalkingBicycleOther
How long does it often take to commute to the current workplace/office? (in minutes)
How much on average does it cost you daily to commute to your workplace? (in EGP)
If you commute to work using your private car, where do you usually park your vehicle at the workplace? (Usual multiple locations if applicable)At work—driveway/surface lotAt work—garage/parkadeOn the street by workDifferent location—driveway/surface lotDifferent location—garage/parkadeDifferent location—on the streetOther
Do you pay for parking at your workplace? (whether officially or non-officially)Yes, usuallyYes, but unusualNo
Can you please indicate the locations for the five destinations that you go to the most for shopping or leisure trips?
Input your home location
Select trip originHomeShopWorkSchoolUniversityGymClubOther
Trip start time
Trip end time
Select trip purposeWent homeWent to the primary workplaceWent to other work-related place (e.g., meeting, second job, delivery)Went grocery shoppingWent to other shopping (e.g., mall, pet store)Went to school/daycare (e.g., daycare, K-12, college)Went to a medical appointment (e.g., doctor, dentist)Conducted personal business (e.g., bank, post office)Dropped off/picked up someone (e.g., son at a friend’s house, spouse at bus stop)Went to exercise (e.g., gym, walk, jog, bike ride)Went to a restaurant to eat/get take-outAttended social event (e.g., visit with friends, family, co-workers)Attended recreational event (e.g., movies, sporting event)Went to a religious/community/volunteer activityTransferred to another mode of transportation (e.g., change from ferry to bus)Other
Select the trip mode of travelCarPublic transit (with a cost input field)Ride-hailing service (Uber, Careem, SWVL, or other smartphone-app car service) (with a cost input field)Taxi (with a cost input field)Carpool/vanpool (with a cost input field)WalkingBicycleOther (with a text input field for specifying the mode of transportation)
Who accompanied you on the trip?NoneHusband/wifeChildrenParentsSiblingColleague, Colleague (listed twice) (You might want to remove the duplicate “Colleague”)FriendOther (with a text input field for specifying another travel companion)
Paid for parking on a trip?Yes (with a cost input field)No
Paid or toll in trip?Yes (with a cost input field)No
Table A2. Context-aware SP System Questions.
QuestionPotential Response
Travel Scenarios—case 1TransitCar
Travel Scenarios—case 2TransitCar
Travel Scenarios—case 3TransitCar
Travel Scenarios—case 4TransitCar
Hybrid Travel Options—Ride-hailing CaseTransitCarRide-hailing
Hybrid Travel Options—Park and ride CaseTransitCarRide-hailingPark and ride
Hybrid Travel Options—Ride-hailing and transit CaseTransitCarRide-hailingPark and rideRide-hailing and transit
Hybrid Travel Options—Cycling and transit CaseTransitCarRide-hailingPark and rideRide-hailing and transitCycling and transit
Environmental impactTransitCar
Last-mile connectivityRide-hailing and transitCycling and transit
Calories burnedRide-hailing and transitCycling and transit
MaaS OptionsExplorer (Metro)Explorer (Bus)Mover (Metro)Mover (Bus)Frequent riderSuper travelerPAYG
Would you feel comfortable using carpooling with strangers, whether for yourself or your family?12345
Would you feel convenient using bike sharing systems, whether for yourself or your family?12345
How important is the reliability of the transportation mode to you?12345
How important is the comfort of the ride to you?12345
How important is the freedom associated with having your car with you?12345
Does using public transportation make you feel more independent?Yes, it doesNo, it does not
Would you prefer using a private vehicle in case you have multiple trips?Yes preferNo, do not prefer
Would your choice of public transportation be enhanced if the system’s availability and reliability were higher?Yes, I wouldNo, I wouldn’t
Would you feel more convenient about using public transportation if there were a unified mobile application with all the information needed?Yes, I wouldNo, I would not
In case the public transportation ticket counts as part of the parking cost, would this incentivize you to use public transportation more and park at central depots?Yes, I wouldNo, I would not
Do you consider the use of public transportation an affecting factor on your social image?Yes, I doNo, I do not
If fuel costs increase, leading to higher ownership costs of private vehicles, would you prefer using public transportation?Yes, I wouldNo, I would not
How convenient are you with the idea of your work relocating to the New Administrative Capital?ConvenientNot convenient
Do you intend to move to live in the New Administrative Capital in the near future?Yes, I doNo, I do not
If your work location is moved to the New Administrative Capital, would this motivate you to live there?Yes, it wouldNo, it would not
Did you know about all those new modes of transportation being implemented to facilitate the movement to the New Administrative Capital?Yes, I didNo, I did not
Did you know that the transportation system in Cairo (Formal and Informal) is that extensive?Yes, I didNo, I did not
Did the availability of the information regarding the different modes, their stops, and timings make you more willing to use public transportation?Yes, I didNo, I did not
Did the availability of a comprehensive trip planning tool make you more willing to use public transportation?Yes, I didNo, I did not
Would the concept of MaaS bundle constituting different modes make you more willing to use public transportation?Yes, it wouldNo, it would not

References

  1. Egyptian Central Agency for Public Mobilization and Statistics (CAPMAS). Population Density Report (Arabic). Available online: https://www.capmas.gov.eg/Pages/populationClock.aspx (accessed on 26 April 2025).
  2. World Bank Group. Arab Republic of Egypt—Cairo Traffic Congestion Study: Executive Summary; World Bank Group: Washington, DC, USA, 2014. [Google Scholar]
  3. World Bank Group. Arab Republic of Egypt—Cairo Traffic Congestion Study (Vol. 2): Final Report; World Bank Group: Washington, DC, USA, 2013. [Google Scholar]
  4. World Bank Group. Egypt: Greater Cairo Air Pollution Management and Climate Change Project; P172548; World Bank Group: Washington, DC, USA, 2019. [Google Scholar]
  5. Aref, M.-A. Human Behaviour in Spaces Around Metro Stations in Cairo: An Approach Towards Improving the Metro-Catchment Area to Fulfill Users’ Needs. Master’s Thesis, University of Ain Shams, Cairo, Egypt, 2018. [Google Scholar]
  6. Kotaem, A.; Ohmori, N.; Mosa, A. Impact of Public Transportation Infrastructure Development on Network Coverage and Travel Time. Urban Reg. Plan. Rev. 2025, 12, 126–146. [Google Scholar] [CrossRef]
  7. Fan, Y.; Wolfson, J.; Adomavicius, G.; Das, K.; Khandelwal, Y.; Kang, J. SmarTrAC: A Smartphone Solution for Context-Aware Travel and Activity Capturing (Report No. 2015 SmarTrAC); Center for Transportation Studies, University of Minnesota: Minneapolis, MN, USA, 2015. [Google Scholar]
  8. Nitsche, P.; Widhalm, P.; Breuss, S.; Brändle, N.; Maurer, P. Supporting Large-Scale Travel Surveys with Smartphones—A Practical Approach. Transp. Res. Part C Emerg. Technol. 2014, 43, 212–221. [Google Scholar] [CrossRef]
  9. Cottrill, C.D.; Pereira, F.C.; Zhao, F.; Dias, I.F.; Lim, H.B.; Ben-Akiva, M.E.; Zegras, P.C. Future Mobility Survey: Experience in Developing a Smartphone-Based Travel Survey in Singapore. Transp. Res. Rec. 2013, 2354, 59–67. [Google Scholar] [CrossRef]
  10. Gong, H.; Chen, C.; Bialostozky, E.; Lawson, C.T. A GPS/GIS Method for Travel Mode Detection in New York City. Comput. Environ. Urban Syst. 2012, 36, 131–139. [Google Scholar] [CrossRef]
  11. Niu, X.; Zhang, Q.; Li, Y.; Cheng, Y.; Shi, C. Using Inertial Sensors of iPhone 4 for Car Navigation. In Proceedings of the Position Location and Navigation Symposium (PLANS), IEEE/ION, Myrtle Beach, SC, USA, 23–26 April 2012. [Google Scholar] [CrossRef]
  12. Jariyasunant, J.; Carrel, A.; Ekambaram, V.; Gaker, D.; Kote, T.; Sengupta, R.; Walker, J.L. The Quantified Traveler: Using Personal Travel Data to Promote Sustainable Transport Behaviour; University of California Transportation Center: Berkeley, CA, USA, 2011. [Google Scholar]
  13. Gonzalez, P.A.; Weinstein, J.S.; Barbeau, S.J.; Labrador, M.A.; Winters, P.L.; Georggi, N.L.; Perez, R.A. Automating Mode Detection for Travel Behaviour Analysis by Using Global Positioning Systems-Enabled Mobile Phones and Neural Networks. IET Intell. Transp. Syst. 2010, 4, 37–49. [Google Scholar] [CrossRef]
  14. Bohte, W.; Maat, K. Deriving and Validating Trip Purposes and Travel Modes for Multi-Day GPS-Based Travel Surveys: A Large-Scale Application in The Netherlands. Transp. Res. Part C Emerg. Technol. 2009, 17, 285–297. [Google Scholar] [CrossRef]
  15. Srinivasan, S.; Bricka, S.; Bhat, C. Methodology for Converting GPS Navigational Streams to the Travel-Diary Data Format; Department of Civil and Coastal Engineering, University of Florida: Gainesville, FL, USA, 2009. [Google Scholar] [CrossRef]
  16. Doherty, S.T.; Papinski, D.; Lee-Gosselin, M. An Internet-Based Prompted Recall Diary with Automated GPS Activity-Trip Detection: System Design. In Proceedings of the 85th Annual Meeting of the Transportation Research Board, Washington, DC, USA, 22–26 January 2006. [Google Scholar]
  17. Itsubo, S.; Hato, E. Effectiveness of Household Travel Survey Using GPS-Equipped Cell Phones and a Web Diary: Comparative Study with Paper-Based Diary Survey (Paper 06-1843). In Proceedings of the Transportation Research Board 85th Annual Meeting, Washington, DC, USA, 22–26 January 2006. [Google Scholar]
  18. Ohmori, N.; Nakazato, M.; Harata, N. GPS Mobile Phone-Based Activity Diary Survey. In Proceedings of the Eastern Asia Society for Transportation Studies, Bangkok, Thailand, 21–24 September 2005. [Google Scholar] [CrossRef]
  19. Asakura, Y.; Hato, E. Tracking Survey for Individual Travel Behaviour Using Mobile Communication Instruments. Transp. Res. Part C Emerg. Technol. 2004, 12, 273–291. [Google Scholar] [CrossRef]
  20. Chen, C.; Ma, J.; Susilo, Y.; Liu, Y.; Wang, M. The Promises of Big Data and Small Data for Travel Behavior (aka Human Mobility) Analysis. Transp. Res. Part C Emerg. Technol. 2016, 68, 285–299. [Google Scholar] [CrossRef]
  21. Zhou, Y.; Zhang, Y.; Yuan, Q.; Yang, C.; Guo, T.; Wang, Y. The Smartphone-Based Person Travel Survey System: Data Collection, Trip Extraction, and Travel Mode Detection. IEEE Trans. Intell. Transp. Syst. 2022, 23, 23399–23407. [Google Scholar] [CrossRef]
  22. Greaves, S.; Ellison, A.; Ellison, R.; Rance, D.; Standen, C.; Rissel, C.; Crane, M. A Web-Based Diary and Companion Smartphone app for Travel/Activity Surveys. Transp. Res. Procedia 2015, 11, 297–310. [Google Scholar] [CrossRef]
  23. Matyas, M.; Kamargianni, M. Survey Design for Exploring Demand for Mobility as a Service Plans. Transportation 2019, 46, 1525–1558. [Google Scholar] [CrossRef]
  24. Macioszek, E.; Jurdana, I. Bicycle Traffic in the Cities. Sci. J. Silesian Univ. Technol. Ser. Transp. 2022, 117, 115–127. [Google Scholar] [CrossRef]
  25. Cox, N.C.J. Estimating Demand for New Modes of Transportation Using a Context-Aware Stated Preference Survey. Ph.D. Thesis, Massachusetts Institute of Technology, Cambridge, MA, USA, 2015. [Google Scholar]
  26. Atasoy, B.; Azevedo, C.L.; Danaf, M.; Ding-Mastera, J.; Abou-Zeid, M.; Cox, N.; Zhao, F.; Ben-Akiva, M. Context-Aware Stated Preferences Surveys for Smart Mobility. In Proceedings of the 15th International Conference on Travel Behaviour Research (IATBR), Santa Barbara, CA, USA, 15–20 July 2018. [Google Scholar]
  27. Ben-Akiva, M.; McFadden, D.; Train, K. Foundations of Stated Preference Elicitation: Consumer Behavior and Choice-Based Conjoint Analysis. Found. Trends Econom. 2019, 10, 1–144. [Google Scholar] [CrossRef]
  28. Danaf, M.; Atasoy, B.; Lima de Azevedo, C.; Ding-Mastera, J.; Abou-Zeid, M.; Cox, N.; Zhao, F.; Ben-Akiva, M. Context-Aware Stated Preferences with Smartphone-Based Travel Surveys. J. Choice Model. 2019, 31, 35–50. [Google Scholar] [CrossRef]
  29. Patterson, Z.; Fitzsimmons, K.; Jackson, S.; Mukai, T. Itinerum: The Open Smartphone Travel Survey Platform. SoftwareX 2019, 10, 100230. [Google Scholar] [CrossRef]
  30. Prelipcean, A.C.; Gidófalvi, G.; Susilo, Y.O. MEILI: A Travel Diary Collection, Annotation and Automation System. Comput. Environ. Urban Syst. 2018, 70, 24–34. [Google Scholar] [CrossRef]
  31. Lugtig, P.; Schouten, B.; McCool, D.; Roth, K.; Smeets, L.; Mussman, O.; Verstappen, V.; de Groot, J.; Toepoel, V.; Giesen, D.; et al. The TABI Travel App Feasibility of Data Collection via a Smartphone App. In Proceedings of the Future of Online Data Collection in Social Surveys: Challenges for Probability-Based Panels, Southampton, UK, 20–21 June 2019; Available online: https://www.ncrm.ac.uk/research/datacollection/Lugtig%20et%20al%20-%20TABI%20app%20(Southampton).pdf (accessed on 9 October 2022).
  32. Safi, H.; Mesbah, M.; Ferreira, L. ATLAS Project—Developing a Mobile-Based Travel Survey. In Proceedings of the Australasian Transport Research Forum (ATRF), Brisbane, Australia, 2–4 October 2013. [Google Scholar]
  33. Wang, K.; Li, M.; Miller, E.; Habib, K.N. Development of the Online Travel and Activity Internet Survey Interface (TRAISI) Platform. TTS 2.0 Final Phase Report. Available online: https://dmg.utoronto.ca/wp-content/uploads/2023/03/DMG_TRAISI_report_v3.pdf (accessed on 20 August 2023).
  34. Chung, B.; Srikukenthiran, S.; Habib, K.N.; Miller, E.J. The Development of a Web-Survey Builder (STAISI): Designing Household Travel Surveys for Data Accuracy and Reduced Response Burden. In Proceedings of the 11th International Conference on Transport Survey Methods, Esterel, QC, Canada, 24–29 September 2018. [Google Scholar]
  35. Transportation Research Board (TRB) Travel Survey Methods Committee. The On-Line Travel Survey Manual: A Dynamic Document for Transportation Professionals. Available online: https://trbtsm.wiki.zoho.com/ (accessed on 27 April 2025).
  36. Puget Sound Regional Council (PSRC). 2019 Puget Sound Regional Household Travel Survey. Available online: https://www.psrc.org/our-work/household-travel-survey-program (accessed on 27 April 2025).
  37. Kriswardhana, W.; Esztergár-Kiss, D. A Systematic Literature Review of Mobility as a Service: Examining the Socio-Technical Factors in MaaS Adoption and Bundling Packages. Travel Behav. Soc. 2023, 31, 232–243. [Google Scholar] [CrossRef]
  38. Polydoropoulou, A.; Tsouros, I.; Pagoni, I.; Tsirimpa, A. Exploring Individual Preferences and Willingness to Pay for Mobility as a Service. Transp. Res. Rec. 2020, 2674, 152–163. [Google Scholar] [CrossRef]
  39. Asgari, H.; Jin, X.; Corkery, T. A Stated Preference Survey Approach to Understanding Mobility Choices in Light of Shared Mobility Services and Automated Vehicle Technologies in the US. Transp. Res. Rec. 2018, 2672, 12–22. [Google Scholar] [CrossRef]
  40. Ho, C.Q.; Hensher, D.A.; Reck, D.J.; Lorimer, S.; Lu, I. MaaS Bundle Design and Implementation: Lessons from the Sydney MaaS Trial. Transp. Res. Part A Policy Pract. 2021, 149, 339–376. [Google Scholar] [CrossRef]
  41. Morgan, M.; Young, M.; Lovelace, R.; Hama, L. OpenTripPlanner for R. J. Open Source Softw. 2019, 4, 1926. [Google Scholar] [CrossRef]
  42. Hillsman, E.L.; Barbeau, S.J. Enabling Cost-Effective Multimodal Trip Planners Through Open Transit Data, Final Report; Florida Department of Transportation: Tallahassee, FL, USA, 2011.
Figure 1. GRC’s new modes of public transportation under development.
Sustainability 17 08500 g001
Figure 2. Itinerum collected travel diaries.
Sustainability 17 08500 g002
Figure 3. (a) The welcome and socio-demographic questions pages; (b) the travel diary page.
Sustainability 17 08500 g003
Figure 4. (a) Real-life trip options; (b) hybrid travel scenarios: ride-hailing, and park and ride cases.
Sustainability 17 08500 g004
Figure 5. MaaS bundle options.
Sustainability 17 08500 g005
Figure 6. Participants’ gender and age group distribution.
Sustainability 17 08500 g006
Figure 7. Modal share (usual means of commuting to work) by gender and age group.
Sustainability 17 08500 g007
Figure 8. Travel modes choice (hybrid travel options) by gender and age group.
Sustainability 17 08500 g008
Table 1. Hybrid travel scenarios attribute definition.
SectionComponentTime ShareCost StructureAdditional Notes
RIDE-HAILINGRide-hailing1× base car time2.125× base car costPrimary transport mode
PARK-AND-RIDEPrivate Car0.4× base car time1× base car costPart of the main journey and access to the transit hub
Parking-Fixed rate feeFacility charges
Transit0.55× base transit timeRegular transit fareMain journey component
RIDE-HAILING + TRANSITRide-hailing0.4× base car time2.125× base car costSecondary journey component (First/last mile)
Transit0.55× base transit timeRegular transit fareMain journey component
CYCLING + TRANSITCycling20 minBike share feeFirst/last mile access
Transit0.8× base transit timeRegular transit farePrimary transport mode
LAST MILE CONNECTIVITYRIDE-HAILING + TRANSITRide-hailing0.15× base car time2.125× base car costFirst/last mile access
Transit1× base transit timeRegular farePrimary transport mode
CYCLING + TRANSITCycling20 minBike share feeFirst/last mile access
Transit1× base transit timeRegular transit farePrimary transport mode
Table 2. Input features and statistical distribution of survey data.
Categorial FeaturesFeature CodeFeature TypeStatistical Distribution
MeanSDMin.Max.Category Encoding and % Share of Each Category
RP HOUSEHOLD TRAVEL SURVEY
Personal and socio-demographic
Participant ageAScale31.96.91851
Driver licenseDLNominal Yes: 279, No: 34
Education levelEDUOrdinal High school: 21, University degree: 233, Master’s/PhD: 59
Employment typeEMPNominal Full-time: 277, Student: 21, Self-employed: 13, Not employed: 1, Part-time: 1
Participant genderGNominal Male: 195, Female: 118
Personal incomePINCOrdinal <36 k: 4, 36 k–60 k: 5, 121 k–240 k: 98, 241 k–500 k: 100, 501 k–1 M: 48, 61 k–120 k: 42, >1 M: 16 (in EGP/year)
Frequency of commuting to workWCFOrdinal <3 days/week: 5, 4 days/week: 2, 5 days/week: 296, 6–7 days/week: 10
Work locationWLNominal One work location: 251, Various locations: 55, Work at home: 5, Driver/sales: 2
Household and residence
Children in the householdCHHNominal None: 65, 1 Child: 145, 2 Children: 69, 3 Children: 26, 4 Children: 8
Household incomeHHINCOrdinal 36 k–60 k: 6, 61 k–120 k: 38, 121 k–240 k: 101, 241 k–500 k: 100, 501 k–1 M: 50, >1 M: 18 (in EGP/year)
Household sizeHHSNominal 1 Person: 14, 2 People: 53, 3 People: 142, 4 People: 68, 5 People: 28, 6 People: 8
House ownershipHONominal Rent: 166, Own/paying mortgage: 147
Vehicles in the householdVHHNominal No vehicles: 19, 1 Vehicle: 201, 2 Vehicles: 75, 3 Vehicles: 17, 4 Vehicles: 1
People working in a householdWHHNominal 1 Person: 146, 2 People: 164, 3 People: 3
Commute and travel diary
Average distance to shopping locationASDScale22.913.4561
Current average cost of travel to work (EGP)CCWScale59.345.55360
Current average time to work (mins)CTWScale37.923.65165
Monthly transportation spendingMTSScale2915.71633.45009000
Travel diary total trips costTDCScale82.958.70480
Travel diary total trips distanceTDDScale59.336.61241
Travel diary total trips timeTDTScale91.054.410345
Usual mode of commuteMCNominal Car: 253, Public transit: 26, Ride-hailing: 22, Carpool: 12
CONTEXT-AWARE SP MAAS SURVEY
Future preferred mode of commuteFMCNominal Car: 107, Park and ride: 79, Ride-hailing and transit: 75, Transit: 28, Cycling and transit: 22, Ride-hailing: 2
MaaS bundle choiceMBNominal Super traveler: 152, Frequent rider: 78, PAYG: 49, Mover (Metro): 27, Explorer (Bus): 4, Mover (Bus): 2, Explorer (Metro): 1
NAC trip parameters
Cost of travel to work by carNCWCScale137.647.846254
Cost of travel to work by cycling and transitNCWCTScale38.610.91065
Cost of travel to work by park and rideNCWPRScale103.728.539177
Cost of travel to work by public transitNCWPScale33.610.9560
Cost of travel to work by ride-hailingNCWRScale292.4101.798540
Cost of travel to work by ride-hailing and transitNCWRTScale150.649.645276
Time to work by carNTWCScale52.812.23189
Time to work by cycling and transitNTWCTScale107.524.462199
Time to work by park and rideNTWPRScale81.320.444136
Time to work by public transitNTWPScale109.430.552224
Time to work by ride-hailingNTWRScale52.812.23189
Time to work by ride-hailing and transitNTWRTScale81.320.444136
Travel distance (km)TDScale58.922.020108
Attitudinal and psychological factors
Bikesharing convenienceBSCOrdinal Very convenient: 17, Somehow convenient: 122, Neutral: 130, Slightly inconvenient: 30, Not convenient: 14
Car dependabilityCDOrdinal Very convenient: 49, Somehow convenient: 45, Neutral: 52, Slightly inconvenient: 31, Not convenient: 136
Carpooling safetyCPSOrdinal Very convenient: 34, Somehow convenient: 157, Neutral: 109, Slightly inconvenient: 8, Not convenient: 5
Transportation mode comfortTMCOrdinal Very convenient: 93, Somehow convenient: 51, Neutral: 43, Slightly inconvenient: 99, Not convenient: 27
Transportation mode reliabilityTMROrdinal Very convenient: 102, Somehow convenient: 48, Neutral: 54, Slightly inconvenient: 100, Not convenient: 9
Environmentally concernedENVCOrdinal Yes: 11, No: 263, Maybe: 39
Health motivedHEAMOrdinal Yes: 54, No: 259
Information availability motiveIAOrdinal Yes: 207, No: 106
Information on new modes of transportation to NACNTMNACOrdinal Yes: 198, No: 115
Trip planning availability motivePAOrdinal Yes: 132, No: 181
Public transit ticket as a park and ride parking ticketPRPTOrdinal Yes: 241, No: 72
Public transit availability and reliability motivePTAROrdinal Yes: 255, No: 58
Public transit extensibility in CairoPTEXOrdinal Yes: 129, No: 184
Private fuel cost is a motive to use public transitPTFCOrdinal Yes: 192, No: 121
Public transportation independabilityPTIOrdinal Yes: 279, No: 34
Public transit use in the case of MaaS bundlesPTMAASOrdinal Yes: 210, No: 103
Public transportation public imagePTSIOrdinal Yes: 157, No: 156
Private vehicles on multiple tripsPVMTOrdinal Yes: 85, No: 228
Living in NACRHNACOrdinal Yes: 172, No: 141
Living in NAC if working in NACRHWNACOrdinal Yes: 168, No: 145
Relocating work to NACRWNACOrdinal Yes: 166, No: 147
Public transportation use with a unified mobile appUMAOrdinal Yes: 119, No: 194
Note: SD = standard Deviation, Min. = minimum, Max. = maximum.
Disclaimer/Publisher’s Note: The statements, opinions and data contained in all publications are solely those of the individual author(s) and contributor(s) and not of MDPI and/or the editor(s). MDPI and/or the editor(s) disclaim responsibility for any injury to people or property resulting from any ideas, methods, instructions or products referred to in the content.