Abstract
In the context of the digital economy, big data cooperative assets serve as a critical pathway for enterprises to achieve sustainable development by enabling both immediate economic returns and long-term environmental and social value creation. How is sustainable development achieved through big data cooperative assets? This study examines how Chinese listed companies from 2000 to 2023 drive value realization across different time dimensions—including immediate economic value and sustainable value—by aligning with user revenue preferences (short-term profit orientation vs. long-term sustainability orientation) to leverage big data cooperative assets. Using patented indicators to measure innovation value and management-oriented indicators to identify types of return preferences, the study found the following: Firms aligned with short-term revenue preferences primarily enhance immediate economic value through operational data linkages, whereas those aligned with long-term sustainability preferences achieve sustained environmental and social value creation through strategic data insight mechanisms. Furthermore, heterogeneity analysis across industries reveals that construction firms tend to prioritize long-term sustainable value via data mechanisms, relatively deemphasizing short-term optimizations. This research not only elucidates the mechanisms through which big data drives sustainable development from a temporal preference perspective but also provides strategic insights for enterprises across different industries to balance short-term revenue and long-term sustainability goals. It holds significant theoretical and practical implications for the transformation toward sustainable business models.
1. Introduction
A big data cooperative asset refers to a data asset that is jointly created, shared, and governed by two or more participants, such as enterprises, users, partners, etc. Through collaborative mechanisms, it integrates and analyzes decentralized data, transforming it into a strategic asset capable of generating sustainable economic, environmental, and social value for all participants. As a new factor of production in the era of digital transformation, big data cooperative assets have emerged as a critical strategic resource for achieving corporate sustainability. Beyond driving high-quality economic development by optimizing resource allocation efficiency, these assets enable environmentally friendly and socially inclusive growth models through collaborative data sharing. By fostering cross-organizational synergies, big data cooperation not only enhances operational performance but also supports low-carbon transitions and equitable value creation—key pillars of sustainable development. Enterprises that establish a value co-creation relationship with users can enhance brand competitiveness and product marketing capabilities, achieve efficient use of data, and strengthen the real economy. Chinese sportswear brand ANTA engages with its users through initiatives on its official app, mini-programs, and social media platforms, such as product design campaigns, recruitment of new product testers, and outfit-sharing activities. Through these efforts, ANTA’s brand image has evolved from a traditional sports equipment manufacturer to a companion and community builder that “understands me” and “exercises with me.” This emotional connection significantly enhances brand loyalty and reputation, allowing ANTA to establish a differentiated competitive edge against global giants like Nike and Adidas. Conceptually, user preferences can be classified as long-term preferences and short-term revenue preferences. Users with long-term revenue preferences focus on obtaining a stable income and innovative products or services over the long term, whereas those with short-term revenue preferences focus on obtaining immediate benefits from their interactions with enterprises. These two types of revenue preference can interact with the realization of the two types of time value of big data cooperative assets discussed in prior chapters: potential value and immediate value. If enterprises know users’ revenue preferences in advance, they can choose a corresponding value realization mechanism and appropriate production strategies and thus enhance the value of their big data cooperative assets. However, there is a lack of empirical research exploring the impact of matching users’ long-term and short-term revenue preferences on the time value of big data cooperative assets.
Enterprises choosing to match users’ short-term revenue preferences need to use data link mechanisms to realize the immediate value of big data cooperative assets. In enterprise-led interaction scenarios, the enterprise realizes immediate value through the data link mechanism formed by data integration, agile analysis, and a rapid feedback management system. In user-led interaction scenarios, the enterprise realizes immediate value through a content-matching mechanism that forms by community mobilization, supply–demand matching, and an instant interaction management system. In summary, the characteristics of data link mechanisms are the instantaneous access to, analysis of, and feedback on data. As a result, the implementation of a data link mechanism requires a digital infrastructure that can support instantaneous data acquisition and analysis, instantaneous creation capability, and immediate value practical application technology. Accordingly, the presence of these characteristics can be used to indicate the existence of a data link mechanism.
Enterprises choosing to satisfy users’ long-term revenue preferences need to use data insight mechanisms to realize the potential value of big data cooperative assets. In enterprise-led interaction scenarios, enterprises realize potential value through cooperative asset development, which requires a data development mechanism consisting of fusion and innovation and in-depth development. In user-led interaction scenarios, enterprises realize potential value through the content co-creation mechanism, which encompasses user creation, positioning layout, and collaborative co-creation. In summary, the characteristics of data insight mechanisms are the long-term acquisition of data, insights, and value co-creation. As a result, the presence of a digital infrastructure that can support long-term data acquisition and analysis, long-term creation capability, and long-term value practical application technology can be used as an indication of the implementation of a data insights mechanism.
This paper presents an empirical analysis investigating whether matching users’ long- and short-term revenue preferences can enhance the value of firms’ big data cooperative assets. The hypothesis is that enterprises can realize the immediate and potential values of big data cooperative assets by matching user revenue preferences with the appropriate data link and data insight mechanisms. The argument is tested using a sample of 5323 Chinese listed companies from 2000 to 2023. The value of their big data cooperative assets is captured by the types of patents they own, following [1,2]. The firms’ ability to match users’ revenue preferences is measured by management orientation in matching users’ short-term and long-term revenue preferences, following [3]. Enterprises’ choosing mechanisms, specifically the adoption of data link vs. data insight mechanisms, are captured by their digital infrastructures and technology adoption to support the mechanisms, following [4,5,6].
The study finds that both the immediate and potential value of big data cooperative assets increase after firms choose to match users’ long-term or short-term revenue preferences, and the finding is robust to a series of endogeneity and other tests. Further analyses suggest that the data link and data insight mechanism mediate the relationship between firms’ matching of user revenue preferences and the time value of big data cooperative assets. Moreover, the study provides direct evidence that matching user revenue preferences promotes the time value of big data cooperative assets in the construction industry.
Unlike traditional case studies and other qualitative approaches, this study involves an empirical examination of the relationship between matching users’ short-term/long-term preferences and the immediate/potential value of big data cooperative assets using a large sample of firms from different industries (e.g., construction vs. non-construction). The results validate the correlation between the time value of big data cooperative assets and matching users’ revenue preferences. They lay a theoretical foundation for research on the time value of big data cooperative assets. The theoretical framework can be used to understand the mechanisms through which the time value of big data cooperative assets is realized. The findings also provide practical insights for enterprises in various industries seeking to realize and invest in big data cooperative assets.
2. Research Hypothesis
The immediate value of big data cooperative assets is the economic returns generated from the real-time big data, with an emphasis on context-specific precision marketing and transaction conversion [7,8]. Therefore, matching users’ short-term revenue preferences facilitates the realization of the immediate value of an enterprise’s big data cooperative assets. The immediate value of big data cooperative assets can be realized if enterprises correctly choose product development strategies that match users’ short-term revenue preferences. Thus we propose the following Hypothesis 1a.
H1a.
Enterprises that match users’ short-term revenue preferences can increase the immediate value of their big data cooperative assets.
Enterprises that choose to match users’ short-term revenue preferences can realize the immediate value of big data cooperative assets through a data link mechanism. Only by accurately and quickly analyzing in-use information can enterprises anticipate and respond to users’ real-time needs [9]. Although firms can capture and analyze real-time data, it can be difficult to realize the immediate value of big data sets if the firms are unable to make timely adjustments to their products or services and immediately inform users of these adjustments [8]. To quickly match products and services to users’ individual needs, enterprises must deploy digital service processes with closed-loop features [10]. Therefore, to realize the immediate value of big data cooperative assets, enterprises must develop a data link mechanism that can collect and process real-time user data using big data technologies and rapidly match products and services to users’ preferences [11]. Accordingly, Hypothesis 1b is as follows.
H1b.
Firms that match users’ short-term revenue preferences can increase the immediate value of their big data cooperative assets through the implementation of a data link mechanism.
The potential value of big data cooperative assets consists of the long-term benefits achieved from enhancing business operations and the development and optimization of new products. It can be realized by accumulating, storing, and analyzing the accumulating data of firms’ interactions with users [12,13]. Unlike immediate value, potential value emphasizes the long-term benefits, focusing on the use of user digital traces to generate new products and services [14]. Firms that closely follow and choose to match the long-term revenue preferences from users can realize the potential value of big data cooperative assets. Therefore, Hypothesis 2a is as follows.
H2a.
Firms that match users’ long-term revenue preferences increase the potential value of their big data cooperative assets.
The realization of the potential value of an enterprise’s big data cooperative assets relies on efficiently accumulating, analyzing, and exploiting users’ digital traces [15], rather than on short-term strategies that emphasize real-time and scenario-specific features. We label such strategies for the development of big data as data insight mechanisms. First, enterprises need to acquire and manage users’ digital traces from multiple sources [16] by using digital platforms to conduct multi-source data acquisition and manage multi-dimensional data [17]. Second, enterprises need to bring together big data technologies and business experience to achieve new insights into products and services [18]. Finally, companies need to build collaborative R&D platforms to realize the innovations arising from these insights [19,20]. Therefore, data insight mechanisms, which consist of a digital infrastructure for sourcing data, big data technology to mine the data for insights, and corporate innovation capabilities to convert insights into R&D, are the key to realizing the potential value of big data cooperative assets. Accordingly, Hypothesis 2b is as follows.
H2b.
Firms that match users’ long-term revenue preferences increase the potential value of their big data cooperative assets.
Here the research model of conducting the empirical study for immediate value and potential value of big data cooperative assets is as follows shows in Figure 1.
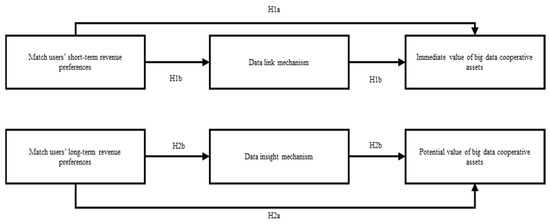
Figure 1.
Empirical study model of immediate and potential value of big data cooperative assets.
3. Research Design
3.1. Model Design
This study examines the effects of matching users’ revenue preferences on the time values of big data cooperative assets. A multi-period difference-in-difference approach is adopted to compare the changes in the time values of big data cooperative assets in firms that match users’ preferences (treatment group) and in firms that do not have matching strategies (control group). The specific regression models used to examine the effects of matching user preferences on the time values of big data cooperative assets (H1a and H2a) are as follows:
where denotes the firm and t denotes the year. The independent variable is the immediate value of big data cooperative assets in firm in year . The independent variable is the potential value of big data cooperative assets in firm i in year t. The explanatory variable is a dummy variable for firms matching users’ short-term revenue preferences in year , and it is equal to 1 if firm chooses to match users’ short-term revenue preference in year and 0 otherwise. The explanatory variable is a dummy variable for firms matching users’ long-term revenue preferences in year , and it is equal to 1 if firm chooses to match users’ long-term revenue preference in year and 0 otherwise. and denotes control variables that can influence enterprises’ realization of the time values of big data cooperative assets. represents firm fixed effects, which are used to control unobservable firm-invariant characteristics. represents year fixed effects, which control for aggregate time trends. is the random perturbation term. The standard errors are clustered at the firm level, as the sample random perturbation terms are potentially correlated within the same firm.
and are the coefficients of interest; they indicate the effect of matching short-term revenue preferences on the immediate value of big data cooperative assets and the effect of matching users’ long-term revenue preferences on the potential value of big data cooperative assets, respectively. If the coefficients are significant and positive, then H1a and H2a will be supported, i.e., matching users’ short-term revenue preferences promotes firms’ immediate value realization, and matching users’ long-term revenue preferences promotes the realization of firms’ potential value.
According to H1b and H2b, firms matching users’ short-term revenue preferences will increase immediate value by implementing data link mechanisms, and firms matching users’ long-term revenue preferences will increase potential value by implementing data insight mechanisms. The mediated effects models to test these hypotheses are as follows:
Equation (3) examines the effect of matching users’ short-term revenue preferences on the mechanism variable , which captures the adoption of data link strategies. The rest of the variables are the same as in Equation (1). Equation (4) investigates how the data link variable mediates the effect of matching users’ short-term revenue preferences on the immediate value of big data cooperative assets. Equation (5) examines the impact of matching users’ long-term revenue preferences on the data insight mechanism variable (). Equation (6) tests the mediating effect of the data insight variable on the impact of matching users’ long-term revenue preferences on the potential value of big data cooperative assets.
3.2. Data and Sample
The data for this study are drawn from four main sources. Data for the firm-level control variables are from the CSMAR (China Stock Market & Accounting Research) database from 2000 to 2022; observations with missing values are excluded. The immediate and potential values of enterprises’ big data cooperative assets are measured using manually collected patent data from the State Patent Office. The independent variables representing firms’ decisions to match users’ short-term or long-term revenue preferences are derived from a count of the frequency of words related to immediate or potential value in the Management Discussion and Analysis section of the annual reports of Chinese listed firms for the 2000 to 2022 period. The mediator variables that capture firms’ strategies for developing big data assets are also derived from the annual reports. The final sample contains 53,630 firm-year observations for listed companies in China from the 2000 to 2022 period.
3.3. Variables
3.3.1. Potential Value (PV) and Immediate Value (IV) of Big Data Cooperative Assets
Utility model patents and design patents refer to new technical solutions and new designs of practical value proposed for the shape or structure of a product, while independent invention patents refer to new technical solutions which are innovative. The former emphasizes the ability to adapt immediately and can be used to measure immediate value of big data cooperative assets, while the latter focuses on potential innovation and can be used to measure potential value big data cooperative assets. Considering the availability of patent types and application numbers, the number of patent applications listed with the State Patent Office from 2000 to 2023 is used. The thesis conducts base-period calibration and continuity correction of raw data, i.e., use of exponential smoothing models to predict and repair missing data and remove outliers and noise from the annual data [6]. The variable IV is the sum of the number of the utility model and design patent applications plus one to create a natural logarithmic value. The variable PV is the number of independent applications for patents for inventions filed in a year, plus one to create a natural logarithmic value. All of the data are from the patent office.
3.3.2. Matching Users’ Short-Term Revenue Preferences (P) Versus Matching Long-Term Revenue Preferences (O)
Enterprises’ decisions to match users’ short-term [21] and long-term revenue preferences are related to the orientation of corporate management [22,23,24]. To create variables to measure enterprises’ decisions of matching users’ revenue preference, this study counts the frequencies of words related to matching users’ short-term and long-term revenue preferences in the Management Analysis and Discussion sections of the annual reports of Chinese listed companies from 2000 to 2023. The variable P represents the frequency of feature words (i.e., digital twins, metaverse, avatars, 3D printing, 5G technology, mobile Internet, industrial Internet, digital technology, nanocomputing, smart planning, smart optimization, smart wear, smart manufacturing, smart customer service, smart marketing, digital marketing, unmanned retailing, unmanned factories, mobile payments, third-party payments, NFC (Near Field Communication) payments, human-computer interaction, and social networking) in the Management Discussion and Analysis section related to enterprises’ decision to match users’ short-term revenue preferences [25,26]. It is a dummy variable equal to 1 if the enterprise matches users’ short-term revenue preferences, and 0 otherwise. The variable O is constructed by the presence of feature words (e.g., intelligent agriculture, intelligent transportation, intelligent healthcare, intelligent home, intelligent investment, intelligent literature and tourism, intelligent environmental protection, intelligent grid, intelligent energy, Internet healthcare, Internet finance, digital finance, fintech, quantitative finance, open banking, Netflix, and Internet+) that reveal enterprises’ decisions to match users’ long-term revenue preferences, following [1,27]. It is a dummy variable equal to 1 if the enterprise matches users’ long-term revenue preferences, and 0 otherwise. One of the oldest and largest comprehensive brokerage firms in China, Guo Tai Jun An Securities Co., Ltd., uses the same word frequency method to measure firms’ strategic choices to match either immediate or potential revenue preferences.
3.3.3. Mediating Variables
The study proposes that enterprises can use data link and data insight mechanisms to realize the time value of big data cooperative assets. The implementation of these mechanisms is related to factors such as infrastructure, digital applications, and digital technology empowerment (leveraging digital technology enables enterprises to move away from single-supply and explore multiple operation scenarios by digging deeper into user needs). Therefore, enterprises’ use of these mechanisms can be measured by the degree of infrastructure improvement, digital application, and digital technology empowerment. This study measures the implementations of big data asset development strategies using the frequencies at which infrastructure improvement, digital applications, and digital technology empowerment are mentioned in annual reports [28,29].
To measure firms use of data link mechanisms, the degree of infrastructure improvement (T1) is captured by the total number of terms related to immediate value-creating technologies for digital infrastructure development (i.e., 3D printing equipment, big data platforms, big data information systems, AI platforms, AI equipment, AI labs, AI systems, digital infrastructure, digital platforms, digital devices, digital terminals, smart information systems, and smart terminal) [28]. The degree of digital application (A1) is measured by the total number of digital-application-related feature words in the annual report after excluding the Management Discussion and Analysis [29]. To measure digital technology empowerment (F1), the study uses the total number of feature words related to technology-enabling features that are also related to immediate value creation (i.e., digital currency, smart manufacturing, smart terminals, digital networks, mobile connectivity, digital marketing, bitcoin, face recognition, voice recognition, identity verification, smart Q&A, and machine translation) [30]. The variable , which measures firms’ use of a data link mechanism, is the weighted average of T1, A1, and F1, where the weights are 40%, 25% and 35%, respectively, following the opinions from experts.
To measure firms’ use of data insight mechanisms, the firms’ infrastructure is measured by the total number of feature words related to potentially value-creating technology-related features of digital infrastructure development (T2) (i.e., digital communities, digital labs, digital networks, digital information systems, cloud platforms, cloud labs, and cloud systems). Digital application (A2) is defined by the total frequency of data-insight-related feature words in the annual report after excluding Management Discussion and Analysis (intelligent agriculture, intelligent transportation, intelligent healthcare, intelligent home, intelligent investment, intelligent culture and tourism, intelligent environmental protection, intelligent grid, intelligent energy, Internet healthcare, Internet finance, digital finance, fintech, quantitative finance, open intelligent energy, open banking, Netflix, and Internet+). Digital technology empowerment (F2) is measured by the total number of words related to technology-enabling features associated with potential value creation (i.e., Internet finance, open banking, cloud computing, Internet healthcare, industrial Internet, smart home, human-computer interaction, smart agriculture, unmanned retail, autonomous driving, Internet of Things, smart wearable, 5G technology, robotics, mobile Internet, smart grid, smart robotics, smart environmental protection, cloud platforms, fintech, smart contracts, distributed computing, decentralization, federation chain, differential privacy technology, consensus mechanism, data mining, text mining, data visualization, heterogeneous data, credit, augmented reality, mixed reality, and virtual reality). The variable , which measures firms’ use of data insight strategies, is the weighted average of T2, A2, and F2, with weights of 40%, 25% and 35%, respectively, after inviting experts to conduct the evaluation.
3.3.4. Control Variables
To exclude the effects of resource endowment on both the immediate and potential value of big data cooperative assets, the paper uses a set of control variables that measure company size, gearing ratio, net profit margin on total assets, operating income growth rate, whether the firm is loss-making, whether it is state-owned, the number of years of listing, and the number of years since the company’s establishment. These control variables are selected based on the literature review and the research aims of this study. The variables are defined in Table 1.

Table 1.
Variable definitions.
3.4. Descriptive Statistics
Table 2 reports the descriptive statistics for the main variables in this analysis. To exclude extreme values, all of the continuous variables are winsorized at 1% and 99%. The mean of P is 0.164, indicating that most firms do not match users’ short-term revenue preferences among Chinese firms. The mean of IV is 1.695, indicating that the immediate value of big data cooperative assets is underdeveloped. The mean of O is 0.2279, indicating that most firms do not match users’ long-term revenue preferences. The mean of PV is 1.4114, suggesting that the potential value of big data cooperative assets is still being developed.
Table 2.
Descriptive statistics of variables associated with the immediate and potential value of big data cooperative assets.
4. Analysis of Experimental Results
4.1. Variance Inflation Factor Test
Variance inflation factors (VIFs) are used to test linear correlations between factors. Generally, if the VIF exceeds 10, the regression model has severe multicollinearity. A VIF of less than 10 is acceptable when the tolerance of the independent variables is greater than 0.1. As shown in Table 3, the VIF values in the analysis of the immediate value of big data co-operative assets are all less than 10, indicating that no covariance problem exists between these independent variables. Similarly, the VIF values in the analysis of the potential value of big data cooperative assets are all less than 10, indicating that there is no covariance problem between the independent variables and control variables in that analysis.
Table 3.
VIF test results.
4.2. Basic Regression Results
Table 4 reports the results of empirical tests of the effects of matching users’ revenue preferences on the immediate and potential value of big data cooperative assets. In the baseline difference-in-difference regression, this study adopts a progressive regression strategy. Column (1) reports the results of the regression using only the explanatory variables and fixed effects. The coefficient of P for firms that match users’ revenue preferences is 0.258 and significant at the 1% level, suggesting that firms that match users’ short-term revenue preferences significantly increase the immediate value of their big data cooperative assets. Column (2) adds the control variables to the regression in column (1), and the coefficient on firms’ matching users’ short-term revenue preferences is 0.181 and remains significant at the 1% level. This suggests that companies that adopt a matching users’ short-term revenue strategy have an 18.1% increase in IV relative to companies that do not, i.e., the number of associated patents increases by 18.1%. Column (3) reports the results of the regression using only the explanatory variables and fixed effects; the coefficient of O is 0.229 and significant at the 1% level, suggesting that matching users’ long-term revenue preferences significantly enhances the immediate value of firms’ big data cooperative assets. Column (4) adds control variables to the regression in column (3), and the coefficient on O is 0.109 and remains significant at the 1% level. This shows that businesses that match users’ long-term revenue preferences have a 10.9% increase in PV compared with businesses that do not match users’ long-term revenue preferences. This small change in the coefficient indicates that the matched user revenue preference regression analysis selected in this chapter is more exogenous and less affected by resource endowment and other unobservable factors. The coefficients on the short-term and long-term revenue preferences for firms’ matching user revenue preferences under different regression model settings are all positive at the 1% significance level, supporting H1a and H2a. Moreover, all r2 values exceed 0.6, indicating satisfactory data.
Table 4.
Baseline regression results.
4.3. Robustness Check
4.3.1. Alternative Measures of Enterprises’ Matching with Users’ Preferences
Unlike a typical manager of an information technology department or information center, a data information officer supports company goals by directing the use of information technology. They focus on improving the efficiency of data flow and analysis. Data information officers manage information, build competitive advantages, and contribute to business success. In contrast, a data analysis officer focuses on managing the entire lifecycle of data and maximizing its potential value. Specifically, a data analysis officer is responsible for data mining, data processing, and analysis based on the organization’s needs and strategically provides valuable recommendations and suggestions for the operation and development of the organization based on the results of the data analysis. Data information officers help organizations realize the immediate value of big data cooperative assets, whereas data analysis officers help organizations realize the potential value of big data cooperative assets.
Thus, to provide a more comprehensive understanding of the value of big data cooperative assets, a dummy variable for the existence of a data information position (iscioset) is introduced as a proxy for a preference for matching users’ short-term revenue preferences, and a dummy variable for the existence of a data analysis position (iscioset1) is introduced as a proxy for the preference for matching users’ long-term revenue preferences [31]. The data are drawn from annual reports, which indicate whether an enterprise has engaged in fast and massive data acquisition.
In the end-to-end (E2E) business process, enterprises achieve value creation along the whole supply chain, from the input of user requirements to the delivery of products and services to the user, allowing them to achieve user satisfaction and realize immediate value. The related processes focus on immediate demand analysis and feedback. The Digital Transformation Index is a metric that measures the digital transformation of an organization’s processes and is introduced as another alternative measure of enterprises’ matching of users’ short-term revenue preferences (DI). Similarly, the Digital Operation Index, which measures the digitization of an enterprise’s operations, is introduced as an alternative measure of enterprises’ matching of users’ long-term revenue preferences (DP). The digital transformation of a business is the degree to which it uses digital technologies and platforms to create new business models and value. Operational digitalization is not only the process of digitizing existing business models; it involves innovating business models, creating digital products and services, and exploring new markets. It focuses on long-term product development and innovation and can therefore be used to measure the strategies that companies use to match users’ long-term revenue preferences.
The DI variable is constructed using the frequency of words related to process digitization (e.g., artificial intelligence technology, big data technology, cloud computing technology, blockchain technology, digital technology application, intelligent data analysis, data visualization, heterogeneous data, streaming computation, EB-level storage, billion-level concurrency, and information physical system) in the enterprises’ annual reports. The DP variable is constructed using the frequency of words related to business digitization (e.g., digital technology application, internet business model, intelligent manufacturing, modern information system, business intelligence, image understanding, investment decision aid system, intelligent robot, machine learning, deep learning, semantic search, biometrics, face recognition, voice recognition, autonomous driving, data mining, and cognitive computing) in the annual reports.
The regressions results shows in Table 5, using alternative measures of matching with users’ preferences, that the estimated coefficients remain positive and significant at the 1% level regardless of which measure of the immediate value of big data cooperative assets is used, consistent with the baseline findings that the immediate value of big data cooperative assets is higher for firms that match users’ short-term revenue preferences. The results also show that the estimated coefficients are significant and positive regardless of which measure of the potential value of cooperative assets is used, which is consistent with the baseline findings that the potential value of big data cooperative assets is higher for firms that match users’ long-term revenue preferences. Moreover, all r2 values exceed 0.6, indicating satisfactory data.
Table 5.
Regressions using alternative measures of matching with users’ preferences.
4.3.2. Alternative Measures of the Immediate Value and Potential Value of Big Data Cooperative Assets
To provide a more comprehensive description of the immediate value of big data cooperative assets, the number of utility models independently obtained in year t (IV1) and the number of designs independently filed in year t (IV2) are introduced as alternative explanatory variables. Similarly, the numbers of inventions independently filed in the year t (PV1) and independently obtained in the year t (PV2) are used as alternative explanatory variables in the analysis of the potential value of big data cooperative assets.
The regression results show in Table 6, using alternative measures of the dependent variables, that the estimated coefficients are significant and positive regardless of the variable used, supporting the finding that the immediate and potential value of big data cooperative assets are higher when enterprises match the short-term and long-term revenue preferences of users, respectively, which is consistent with the baseline findings.
Table 6.
Regression results using alternative measures of the dependent variables.
4.3.3. Alternative Model
As many firms do not apply for patents every year, the original model is replaced with a tobit model and the regressions are rerun. The results are shown in Table 7. Under the tobit model, the regression coefficients of both the short-term revenue preferences and the long-term revenue preference are significant and positive, indicating that there is a positive correlation between matching users’ short-term revenue preferences and the immediate value of big data cooperative assets and a positive correlation between matching users’ long-term preferences and the potential value of big data cooperative assets. This further validates the robustness of the baseline results.
Table 7.
Tobit regression results.
4.3.4. Alternative Sample Period
In 2020, the COVID-19 pandemic provided some degree of shock to most enterprises’ choice of matching users’ short-term revenue preferences and thus their effects on the immediate value and potential value of big data cooperative assets. Therefore, an alternative sample is used that excludes observations from 2020 from the regression analysis. Table 8 shows the results are still significant at the 1% level, validating the baseline findings that matching users’ short-term and long-term revenue preferences can promote the value of big data cooperative assets. Moreover, all r2 values exceed 0.6, indicating satisfactory data.
Table 8.
Regression results using an alternative sample.
4.4. Endogeneity Test
Propensity score matching (PSM) is a class of statistical methods for analyzing intervention effects using non-experimental or observational data. In observational studies, PSM methods reduce the effects of data bias and confounding variables to allow for more accurate comparisons between experimental and control groups. Therefore, PSM is used in endogeneity tests of the models in this study.
The characteristic matching variables identified through covariate screening are firm size, revenue growth, firm age, RD ratio, leverage ratio, ROA, Loss, SOE, and listing age; the study uses 1:4 nearest neighbor matching and a logit regression with treat as the explanatory variable. The matching is well-balanced, with no variable having a bias of more than 10%, and the p-values of the matches are overwhelmingly greater than 0.1. The unsuccessful matched observations are dropped from the PSM-DID regression tests. The results are shown in Table 9. Moreover, all r2 values exceed 0.6, indicating satisfactory data.
Table 9.
Results of the PSM-DID analysis.
4.5. Mediation Effect Test
The above findings in Table 10 demonstrate that matching users’ revenue preferences increases the time value of a firm’s big data cooperative assets. The next analysis explores the transmission mechanism. As the time value of big data cooperative assets is a comprehensive value, it can be decomposed into two aspects: the immediate value of big data cooperative assets, realized through a data link mechanism, and the potential value of big data cooperative assets, realized through a data insight mechanism. As described in the theoretical analysis (Section 3.3), both mechanisms have three components, namely digital infrastructure, digital enablement, and digital application, with weights of 40%, 25%, and 35%, respectively. Moreover, all r2 values exceed 0.6, indicating satisfactory data.
Table 10.
Mediation effect of big data cooperative asset value.
Column (1) shows that P increases M1 at the 1% level of significance, and column (2) shows that both P and M1 increase IV at a 1% level of significance. A SOBER test of this mediating effect yields a p-value of less than 0.01, suggesting that M1 is a significant mediator of the relationship between P and IV. Column (3) shows that O enhances M2 at a 1% level of significance, and column (4) shows that both O and M2 increase PV at a 1% level of significance. The SOBER test of this mediating effect shows that the p-value is less than 0.01, indicating that M2 mediates the relationship between O and PV. However, the inclusion of the mediator does not significantly change the relationship.
4.6. Heterogeneity Analysis
4.6.1. Heterogeneity Analysis of Construction and Non-Construction Industries
Although this chapter demonstrates the effect of matching users’ revenue preferences on the value realization of big data cooperative assets, it is unclear whether this effect varies across industries. Exploring this question can provide a deeper understanding of the mechanisms and boundary conditions of matching users’ revenue preferences.
Over the past two decades, the construction industry has experienced an annual productivity growth rate of less than 1.0%, compared with 2.8% for the economy in China as a whole, and it is less digitized than almost any other sector [32]. Arcadis’s annual report notes that the construction industry is facing several challenges, notably low productivity across the construction supply chain due to a lag in the application of digital technologies and failure to sensibly use digitally enabled assets. Although the adoption of digital technology has had a huge impact on the construction industry, it is not fully digitized [33]. Construction companies need to achieve a closer link between users and companies through efficient information sharing and data mining, which would drive corporate value creation [1,33]. Therefore, it is important to explore how to realize the value of big data cooperative assets in the construction industry and promote its digital transformation and development.
Therefore, this study explores the heterogeneous effects of matching users’ revenue preferences on firms’ big data cooperative assets across construction and non-construction industries. It also conducts a heterogeneity analysis across construction industry segments, such as the real estate and building decoration segments.
Table 11 gives the results of the main regression for the construction and non-construction industry subsamples, where columns (1) and (2) report the relationship between matching users’ short-term revenue preferences and the immediate value of big data cooperative assets for firms in the construction and non-construction subsamples, respectively. Columns (3) and (4) report the relationship between matching users’ long-term revenue preferences and the potential value of big data cooperative assets for firms in the construction and non-construction industries, respectively. The results show that the treatment effects remain generally robust in both subsamples. Firms in the construction industry have higher estimated coefficients than those in the non-construction industry, suggesting that the relationship between matching users’ long-term revenue preferences and realizing the potential value of big data cooperative assets is stronger in the construction industry than in other industries. Furthermore, the relationship between matching users’ short-term revenue preferences and realizing the immediate value of big data cooperative assets is stronger in the construction industry than in non-construction industries. Moreover, all r2 values exceed 0.6, indicating satisfactory data.
Table 11.
Heterogeneity analysis across the construction and non-construction industries.
4.6.2. Heterogeneity Analysis Across Segments of the Construction Industry
Building decoration enterprises engage in the interior decoration and renovation of buildings, encompassing interior design, renovation construction, and material supply [34]. As an important part of the construction industry, building decoration enterprises are closely related to building design and building construction [35,36]. With the progress of science and technology and the demand for upgrades, the building decoration industry has entered a new stage of development. Currently, building decoration enterprises need to satisfy their users’ demands to maintain a competitive advantage [37,38]. Therefore, it is important to explore the impact of matching users’ revenue preferences on the time value of big data cooperative assets in building decoration enterprises, as they seek to maximize the time value of their big data cooperative assets.
Table 12 gives the results of the main regression, using subsamples of building decoration firms and non-building decoration firms; columns (1) and (2) report the regression results of matching users’ short-term revenue preferences with the immediate value of big data cooperative assets for the building decoration and non-building decoration subsamples, respectively. In the construction industry, building decorators have higher estimated coefficients than non-building decorators, with a 90% confidence interval, which suggests that building decorators are more likely than non-building decorators to increase the immediate value of their big data cooperative assets. Columns (3) and (4) report the relationship between matching users’ long-term revenue preferences and the potential value of big data cooperative assets. The confidence intervals and estimated coefficients are higher for non-building decoration firms than for building decoration firms, suggesting that non-building decoration firms are more likely to increase the potential value of big data cooperative assets than building decoration firms. Moreover, all r2 values exceed 0.6, indicating satisfactory data.
Table 12.
Heterogeneity analysis across building decoration and non-building decoration enterprises.
4.6.3. Heterogeneity Analysis of Real Estate and Non-Real-Estate Firms in the Construction Industry
Currently, real estate companies still hold the position of unilateral value providers and have yet to truly explore the potential and value of user co-creation [39]. A deeper look at how to tap into the value of user co-creation, i.e., the value of big data cooperative assets, could lead real estate firms to interact and collaborate more deeply with their users [40] and co-create more competitive products and services [41]. Compared with non-real-estate companies, real estate companies’ use of data analytics focuses on the use of user interaction data analysis to achieve marketing efficiency, with the aim of promoting the effectiveness of the whole chain of marketing. In contrast, non-real-estate companies in the construction industry focus on activities such as building construction and building engineering, with a greater emphasis on long-term revenue. Thus, exploring the differences in the paths used by non-real-estate and real estate firms in the construction industry to realize the time value of big data cooperative assets will help real estate firms to locate their own paths to realize the time value of big data cooperative assets by drawing on and learning from other firms.
Table 13 gives the results of re-running the baseline regression using subsamples of real estate firms and non-real-estate firms in the construction industry. Columns (1) and (2) report the results of matching users’ short-term revenue preferences with the immediate value of big data cooperative assets for the real estate and non-real-estate subsamples, respectively. Real estate firms have higher regression coefficients than the non-real-estate firms, which suggests that real estate firms are more likely than non-real-estate firms to increase the immediate value of their big data cooperative assets. Columns (3) and (4) report the relationship between matching users’ long-term revenue preferences and the potential value of big data cooperative assets. Non-real-estate firms have higher regression coefficients than real estate firms, which suggests that non-real-estate firms are more likely than real estate firms to increase the potential value of their big data cooperative assets. Therefore, in the construction industry, non-real-estate firms focus more on satisfying users’ long-term revenue preferences to capture the potential value of their big data cooperative assets, whereas real estate firms focus on satisfying users’ short-term needs to capture the immediate value of their big data cooperative assets.
Table 13.
Heterogeneity analysis across real estate and non-real-estate firms in the construction industry.
5. Discussion and Conclusions
The effective realization of both immediate operational benefits and long-term sustainable value from big data collaborative assets is critical for creating shared value between enterprises and their stakeholders. However, information asymmetry regarding users’ divergent temporal preferences—short-term revenue versus long-term sustainability gains—presents a significant governance challenge. Given asymmetric information about users’ short-term and long-term preferences, this study examines how enterprises’ choices to match users’ short-term and long-term revenue preferences affect the implementation of data link and data insight mechanisms, which in turn affects the immediate and potential value of big data cooperative assets, thereby shaping the sustainable value creation potential of enterprises. It addresses the deficiency in the literature, specifically a lack of attention to the information asymmetry regarding users’ short-term and long-term revenue preferences, and thus provides a foundation for further research in this field.
Specifically, while the existing literature has sufficiently demonstrated the importance of big data cooperative assets as strategic resources and provided insightful explorations into their value realization mechanisms—such as data linkage and data insight—these studies often adopt a static and homogenized perspective [42,43]. They implicitly assume that users or stakeholders form a unified whole, sharing similar and static expectations regarding user revenue preference. This study challenges that assumption. Empirical findings reveal significant temporal preference heterogeneity within user groups—that is some users pursue short-term economic returns, while others place greater emphasis on long-term sustainable value. This endogenous structure of preference information asymmetry has not been adequately uncovered in previous research. Thus, the core contribution of this study lies in introducing the “temporal” dimension into the analytical framework, elucidating how heterogeneity in user revenue preference dynamically shapes the value realization pathways of big data cooperative assets in enterprises. This not only addresses a gap in the existing literature regarding the complexity of micro-level actor preferences but also opens new avenues for subsequent research, such as investigating the drivers of preference formation or the impact of dynamic preference evolution.
It also provides guidance for enterprises seeking to adopt a matching value realization mechanism that will maximize the value of their big data cooperative assets.
First, enterprises need to match their users’ revenue preferences. Matches between enterprises and users allow the exchange of value and meeting each other’s needs. Enterprises’ value should be consistent with the value of their users’ needs so that the value achieved by the two sides coincides. It is therefore necessary to refine the management and classification of users and to clearly identify the needs of each user group, i.e., accurately determine user revenue preferences.
Second, enterprises need to implement the appropriate data link and data insight mechanisms. Based on the identified revenue preferences of their users, enterprises need to select the appropriate data mechanisms for value realization. The establishment and improvement of digital facilities, the learning and sharing of digital empowerment, and the evaluation and improvement of digital applications all contribute to the realization of both mechanisms.
Finally, this study ultimately demonstrates that enterprises can achieve sustainable development through strategic utilization of big data cooperative assets by dynamically integrating both data linkage and insight mechanisms. The finding reveals that aligning these mechanisms with differentiated user revenue preferences enables organizations to simultaneously realize immediate operational benefits and long-term transformational value, thereby creating a comprehensive sustainability value proposition. Specifically, implementing data linkage mechanisms allows enterprises to optimize short-term resource efficiency and reduce environmental footprints, while adopting data insight mechanisms facilitates the development of circular business models and inclusive growth strategies.
The present study also has several limitations. First, since the dataset only includes Chinese listed companies, the applicability of our findings to other institutional environments may be limited. For example, Chinese listed companies often adopt a “concentrated ownership structure” and exhibit “government-involved governance,” whereas European and American firms tend toward “dispersed ownership” and “market-driven governance.” Furthermore, systematic differences exist across countries in board structures, executive incentive mechanisms, and information disclosure regulations, all of which may influence the construction and value realization pathways of big data cooperative assets. China possesses a highly centralized data platform ecosystem (e.g., Alibaba and Tencent), and the government is actively promoting the development of data factor markets. In contrast, Europe and the United States place greater emphasis on data privacy protection (e.g., GDPR), decentralized technological architectures, and enterprise-owned data alliances. These differences in infrastructure and regulatory environments directly shape the formation mechanisms and operational boundaries of big data cooperative assets. Second, while using patents as a proxy for both immediate and potential value is innovative, it may not fully capture sustainability-driven innovation. Many sustainable practices and digital innovations are not patented.
Author Contributions
Conceptualization, X.B. and Y.Z.; methodology, X.B.; software, Y.Z.; formal analysis, X.B.; writing—original draft preparation, Y.Z.; writing—review and editing, P.S.F.; visualization, X.B.; supervision, P.S.F. All authors have read and agreed to the published version of the manuscript.
Funding
This research received no external funding.
Institutional Review Board Statement
Not applicable.
Informed Consent Statement
Not applicable.
Data Availability Statement
The raw data supporting the conclusions of this article will be made available by the authors on request.
Acknowledgments
The author acknowledges Jeff Shen for his kindly help with data analysis. Also, the author acknowledges Shao Bo Ren for his proofreading.
Conflicts of Interest
The authors declare no conflicts of interest.
References
- Li, Y.; Sun, H.; Li, D.; Song, J.; Ding, R. Effects of digital technology adoption on sustainability performance in construction projects: The mediating role of stakeholder collaboration. J. Manag. Eng. 2022, 38, 04022016. [Google Scholar] [CrossRef]
- Bekkerman, R.; Cohen, M.C.; Kung, E.; Maiden, J.; Proserpio, D. The effect of short-term rentals on residential investment. Mark. Sci. 2023, 42, 819–834. [Google Scholar] [CrossRef]
- Ren, S.; Fong, P.S.; Zhang, Y. Enriching Value of Big Data Cooperative Assets from a Time-Horizon Perspective. Sustainability 2024, 16, 10961. [Google Scholar] [CrossRef]
- Klievink, B.; Neuroni, A.; Fraefel, M.; Zuiderwijk, A. Digital strategies in action: A comparative analysis of national data infrastructure development. In Proceedings of the 18th Annual International Conference on Digital Government Research, Staten Island, NY, USA, 7–9 June 2017; pp. 129–138. [Google Scholar]
- Jabbour, C.; Rey-Valette, H.; Maurel, P.; Salles, J.-M. Spatial data infrastructure management: A two-sided market approach for strategic reflections. Int. J. Inf. Manag. 2019, 45, 69–82. [Google Scholar] [CrossRef]
- Wu, W.; Wang, S.; Jiang, X.; Zhou, J. Regional digital infrastructure, enterprise digital transformation and entrepreneurial orientation: Empirical evidence based on the broadband China strategy. Inf. Process. Manag. 2023, 60, 103419. [Google Scholar] [CrossRef]
- Kaplan, A.; Haenlein, M. Rulers of the world, unite! The challenges and opportunities of artificial intelligence. Bus. Horiz. 2020, 63, 37–50. [Google Scholar] [CrossRef]
- Kopalle, P.K.; Kumar, V.; Subramaniam, M. How legacy firms can embrace the digital ecosystem via digital customer orientation. J. Acad. Mark. Sci. 2020, 48, 114–131. [Google Scholar] [CrossRef]
- Meyer, D.; Dunphy, S. The role of knowledge-based psychological climates in human resource management systems. Manag. Decis. 2016, 54, 1222–1246. [Google Scholar] [CrossRef]
- van Zanten, B.T.; Zasada, I.; Koetse, M.J.; Ungaro, F.; Häfner, K.; Verburg, P.H. A comparative approach to assess the contribution of landscape features to aesthetic and recreational values in agricultural landscapes. Ecosyst. Serv. 2016, 17, 87–98. [Google Scholar] [CrossRef]
- Ghasemaghaei, M.; Calic, G. Assessing the impact of big data on firm innovation performance: Big data is not always better data. J. Bus. Res. 2020, 108, 147–162. [Google Scholar] [CrossRef]
- Bradlow, E.T.; Gangwar, M.; Kopalle, P.; Voleti, S. The role of big data and predictive analytics in retailing. J. Retail. 2017, 93, 79–95. [Google Scholar] [CrossRef]
- Lee, S.M.; Lee, D. Healthcare wearable devices: An analysis of key factors for continuous use intention. Serv. Bus. 2020, 14, 503–531. [Google Scholar] [CrossRef]
- Sivarajah, U.; Irani, Z.; Gupta, S.; Mahroof, K. Role of big data and social media analytics for business to business sustainability: A participatory web context. Ind. Mark. Manag. 2020, 86, 163–179. [Google Scholar] [CrossRef]
- Günther, W.A.; Mehrizi, M.H.R.; Huysman, M.; Feldberg, F. Debating big data: A literature review on realizing value from big data. J. Strateg. Inf. Syst. 2017, 26, 191–209. [Google Scholar] [CrossRef]
- Zhu, L.; Li, H.; Wang, F.-K.; He, W.; Tian, Z. How online reviews affect purchase intention: A new model based on the stimulus-organism-response (S-O-R) framework. Aslib J. Inf. Manag. 2020, 72, 463–488. [Google Scholar] [CrossRef]
- Roh, T.; Lee, K.; Yang, J.Y. How do intellectual property rights and government support drive a firm’s green innovation? The mediating role of open innovation. J. Clean. Prod. 2021, 317, 128422. [Google Scholar] [CrossRef]
- Bogers, M.; Hadar, R.; Bilberg, A. Additive manufacturing for consumer-centric business models: Implications for supply chains in consumer goods manufacturing. Technol. Forecast. Soc. Change 2016, 102, 225–239. [Google Scholar] [CrossRef]
- Testa, F.; Iovino, R.; Iraldo, F. The circular economy and consumer behaviour: The mediating role of information seeking in buying circular packaging. Bus. Strategy Environ. 2020, 29, 3435–3448. [Google Scholar] [CrossRef]
- Zahoor, N.; Al-Tabbaa, O.; Khan, Z.; Wood, G. Collaboration and internationalization of SMEs: Insights and recommendations from a systematic review. Int. J. Manag. Rev. 2020, 22, 427–456. [Google Scholar] [CrossRef]
- Ahlstrom, D.; Wang, L.C. Temporal strategies and firms’ speedy responses to COVID-19. J. Manag. Stud. 2021, 58, 592–596. [Google Scholar] [CrossRef]
- Ben-Oz, C.; Greve, H.R. Short-and long-term performance feedback and absorptive capacity. J. Manag. 2015, 41, 1827–1853. [Google Scholar] [CrossRef]
- Lin, X.; Germain, R. Organizational structure, context, customer orientation, and performance: Lessons from Chinese state-owned enterprises. Strateg. Manag. J. 2003, 24, 1131–1151. [Google Scholar] [CrossRef]
- Sarwar, H.; Aftab, J.; Ishaq, M.I.; Atif, M. Achieving business competitiveness through corporate social responsibility and dynamic capabilities: An empirical evidence from emerging economy. J. Clean. Prod. 2023, 386, 135820. [Google Scholar] [CrossRef]
- Petri, I.; Rezgui, Y.; Ghoroghi, A.; Alzahrani, A. Digital twins for performance management in the built environment. J. Ind. Inf. Integr. 2023, 33, 100445. [Google Scholar] [CrossRef]
- Chauhan, V.; Joshi, R.; Choudhary, V. Understanding intention to adopt telematics-based automobile insurance in an emerging economy: A mixed-method approach. J. Financ. Serv. Mark. 2024, 29, 1017–1036. [Google Scholar] [CrossRef]
- Huang, X. The roles of competition on innovation efficiency and firm performance: Evidence from the Chinese manufacturing industry. Eur. Res. Manag. Bus. Econ. 2023, 29, 100201. [Google Scholar] [CrossRef]
- Huang, X.; Yang, F.; Zheng, J.; Feng, C.; Zhang, L. Personalized human resource management via HR analytics and artificial intelligence: Theory and implications. Asia Pac. Manag. Rev. 2023, 28, 598–610. [Google Scholar] [CrossRef]
- Widajanti, E.; Ratnawati, T. Information technology infrastructure optimization for achieving innovation-based company performance. Int. J. Bus. Econ. Law 2020, 22, 180–187. [Google Scholar]
- Park, C.S.; Kaye, B.K. The tweet goes on: Interconnection of Twitter opinion leadership, network size, and civic engagement. Comput. Hum. Behav. 2017, 69, 174–180. [Google Scholar] [CrossRef]
- Pan, H.; Zhou, H. Study on convolutional neural network and its application in data mining and sales forecasting for E-commerce. Electron. Commer. Res. 2020, 20, 297–320. [Google Scholar] [CrossRef]
- McNamara, A.J.; Sepasgozar, S.M. Intelligent contract adoption in the construction industry: Concept development. Autom. Constr. 2021, 122, 103452. [Google Scholar] [CrossRef]
- Lu, Y.; Li, Y.; Skibniewski, M.; Wu, Z.; Wang, R.; Le, Y. Information and communication technology applications in architecture, engineering, and construction organizations: A 15-year review. J. Manag. Eng. 2015, 31, A4014010. [Google Scholar] [CrossRef]
- Bao, Z.; Laovisutthichai, V.; Tan, T.; Wang, Q.; Lu, W. Design for manufacture and assembly (DfMA) enablers for offsite interior design and construction. Build. Res. Inf. 2022, 50, 325–338. [Google Scholar] [CrossRef]
- Li, Y.; Ren, S. Building Decorative Materials; Elsevier: Amsterdam, The Netherlands, 2011. [Google Scholar]
- Riisberg, V.; Munch, A.V. Decoration and Durability: Ornaments and their “appropriateness” from fashion and design to architecture. Artifact J. Des. Pract. 2014, 3, 5.1–5.13. [Google Scholar]
- Brettel, M.; Friederichsen, N.; Keller, M.; Rosenberg, M. How virtualization, decentralization and network building change the manufacturing landscape: An industry 4.0 perspective. FormaMente 2017, 12, 47. [Google Scholar]
- Wind, J.; Rangaswamy, A. Customerization: The next revolution in mass customization. J. Interact. Mark. 2001, 15, 13–32. [Google Scholar] [CrossRef]
- Torfing, J.; Sørensen, E.; Røiseland, A. Transforming the public sector into an arena for co-creation: Barriers, drivers, benefits, and ways forward. Adm. Soc. 2019, 51, 795–825. [Google Scholar] [CrossRef]
- Nardelli, G.; Broumels, M. Managing innovation processes through value co-creation: A process case from business-to-business service practise. Int. J. Innov. Manag. 2018, 22, 1850030. [Google Scholar] [CrossRef]
- Popescul, D.; Murariu, L.; Radu, L.-D.; Georgescu, M.-R. Digital co-creation in socially sustainable smart city projects: Lessons from the European Union and Canada. IEEE Access 2024, 12, 71088–71108. [Google Scholar] [CrossRef]
- Zheng, M.; Li, T.; Ye, J. The confluence of AI and big data analytics in Industry 4.0: Fostering sustainable strategic development. J. Knowl. Econ. 2025, 16, 5479–5515. [Google Scholar]
- Singh, R.K.; Mathiyazhagan, K.; Scuotto, V.; Pironti, M. Green open innovation and circular economy: Investigating the role of big data management and sustainable supply chain. IEEE Trans. Eng. Manag. 2024, 71, 8417–8429. [Google Scholar] [CrossRef]
Disclaimer/Publisher’s Note: The statements, opinions and data contained in all publications are solely those of the individual author(s) and contributor(s) and not of MDPI and/or the editor(s). MDPI and/or the editor(s) disclaim responsibility for any injury to people or property resulting from any ideas, methods, instructions or products referred to in the content. |
© 2025 by the authors. Licensee MDPI, Basel, Switzerland. This article is an open access article distributed under the terms and conditions of the Creative Commons Attribution (CC BY) license (https://creativecommons.org/licenses/by/4.0/).