Article

Biodiversity Resilience in Terms of Evolutionary Mass, Velocity and Force

by
Richard H. Zander
Missouri Botanical Garden, 4344 Shaw Blvd., St. Louis, MO 63110, USA
Sustainability 2025, 17(18), 8272; https://doi.org/10.3390/su17188272
Submission received: 2 August 2025 / Revised: 8 September 2025 / Accepted: 9 September 2025 / Published: 15 September 2025
(This article belongs to the Section Sustainability, Biodiversity and Conservation)

Abstract

Evolutionary processes involving sustainability are here expressed in units of classical mechanics, where newly evolved traits are distance, segments of evolutionary trees are time, and species as entire character sets are mass. Data arranged on a morphological evolutionary tree (caulogram) allow precise calculations of evolutionary velocity, acceleration, momentum and force, with force interpretable as resistance to environmental change. Stem-taxon trees of species of the moss family Streptotrichaceae and Pottiaceae tribe Pleuroweisieae were developed as sets of minimally monophyletic genera, and annotated with numbers of newly evolved traits per species. Calculations provided evidence that precise and comparative measures of the results of sustainable evolutionary processes may be calculated, and, as directly derived from expressed traits, are also accurate and informative about processes leading to resilience across multiple extinction events. The two groups evidenced similar, gradual evolutionary rates, implying that similar evolutionary processes occur across 110 my for Streptotrichaceae and 66 my for Pleuroweisieae, although habitats differ. Extension of sets of new traits per species into the past imply origination of the oldest extinct recognizable progenitors near the Permian–Triassic extinction event, when a cut-off in all data imply a complete over-haul of the character set for both groups, i.e., a major change in evolutionary mass. Speciation occurs in bursts. Extinction is gradual, the negative of acceleration. The rates of origination of genera over time for both groups are nearly the same as those previously proposed for genera of extinct horses. Plateaus in graphs of species per genus imply ancient quadratic patterns of speciation. The combination of process-governed stability through stasis of morphological traits, and of resilience as the ability to survive multiple extinction events has apparently little changed, and both contribute to sustainability over geologic time.

1. Introduction

The mechanisms underlying sustainable biodiversity patterns have been studied in various contexts [1,2,3,4,5] but most commonly using phylogenetic methods; these are now generally cladistic and molecular (reviewed [6,7]). The present study returns to morphological data and uses a new method, structural monophyly [8], to infer evolutionary relationships, the traits involved, and the rate of evolutionary diversification at family, genus and species levels over the past 110 million years. High-resolution phylogenetics is the elucidation of structural monophyly as internally concatenated minimally monophyletic groups (microgenera) using morphology, the rule of four, and, in the present paper, concepts of classical mechanics. The results are easily integrated with molecular phylogenetics if apophyly and paraphyly are used to identify ancestral species [9]. Trait-count dynamics adds insight because it directly models adaptations rather than performing lineage splitting.
There have always been problems with definitions of the term genus [10,11,12], usually centered about how shared traits are used to group species at the taxonomic level just higher than species (reviewed [12]). A genus is defined [8] as a minimally monophyletic group, having one identifiable ancestor species and a few descendant species, with each descendant sharing a set of the most recently evolved ancestral traits. A species is here defined as a well-fitted element of a minimally monophyletic group. The minimally monophyletic group, in short known as the microgenus, is the fundamental mechanism of evolution and operates with the species as the basic unit of evolution. This may be termed the Component Species Concept, which defines the species in terms of the genus rather than the other way around.
Occasionally, the traits of an apparently extinct ancestral species must be inferred by the otherwise standard technique of identifying traits shared with an outgroup and generalist to an ingroup, but most progenitors are apparently extant because they fit well within a few traits of species nearby on an evolutionary tree. Evolutionary rates [13,14,15,16,17,18,19,20] characterize changes in genetics or morphological traits over time for a population or a lineage. Rates have been reported to vary significantly among taxa, although conceptual reduction of the genera to minimally monophyletic groups [8] removes much bias and informational noise due to the conflation of separately evolving taxa. Factors influencing rates of evolution are known to include life history, population dynamics, and ecological influences. Different scales may be used to establish metrics for evolutionary rates, such as gene frequencies, morphological trait changes, and relative composition of taxa. It is the relative composition of taxa [18,21] that concerns this paper, as addressed using both classical taxonomic techniques and modeling with formulae from classical mechanics.
Sustainable rates of change in evolution [22] may be influenced by short or long generation times, size of population and genetic drift, rapid climate shifts, and pressure for rapid adaptation. Various measurement units have been used in the past. Focusing on organismal morphology as opposed to molecular data, a simple, taxon-based measure was introduced by Simpson [23] as the number of (fossil and extant) genera of a group arising per million years. Eight horse genera were generated over about 45 million years, thus a rate of 0.18 genera per million years.
The darwin, following Haldane [14], is the natural logarithm of the ratio of the change in the value of a trait, divided by the time interval in millions of years. The haldane [13] is similar to the darwin, and is the rate of evolutionary change in standard deviations per generation, which is the standardized difference in a trait’s average value for some time interval divided by the number of passed generations. It measures evolutionary change at a shorter time scale than does the darwin. Both measures focus on the change in one trait. Most modeling of evolution treats both microevolution and macroevolution as changes in and at the species level (e.g., [24]). The present paper integrates all evolutionarily informative trait changes in species and genera to derive measures of evolution similar to those of classical mechanics, particularly evolutionary equivalents of mass, momentum and force.
Previous studies on minimally monophyletic groups (MMGs), also known as microgenera, provided information relevant to rates of change in evolution. The primary group studied was Streptotrichaceae [25], a moss family of 10 extant genera and 3 inferred extinct genera (IEG). One inferred extinct genus was intercalated in the lineage and conceived because of an unusually large jump in numbers of changed traits (11 new traits) between two progenitors. In addition, there are two IEG at the base, one as origin of the Trachyodontium lineage, and the other as inferred ancestor shared by that and Streptotrichum. The insertion of an IEG is triggered by more than twice the expected number of inter-nodal trait changes.
The Streptotrichaceae is compared with the similar-sized Pottiaceae tribe Pleuroweisieae. Both groups have been resolved as structurally monophyletic, that is, composed of concatenated minimally monophyletic groups of one ancestral species and a few descendant species. The method [25] identifies the extant ancestral morpho-species by its similarity to an outgroup and in being generalist to an ingroup. High-resolution phylogenetics computes evolutionary features in terms of classical mechanics and compares two moss lineages as a demonstration.

2. Materials and Methods

2.1. The Relationship of Characters and Their Evolutionary Vehicles

A total of ca. 74 morphological characters are available in the Pottiaceae [26] and about as many for its structurally monophyletic segregate, the Streptotrichaceae. Given about 2 character states per trait, about 160 states are available. At any one time, about 40 character states are in play in the Pottiaceae tribe Pleuroweisieae and Streptotrichaceae, which provide this paper’s detailed models of evolution, of both speciation and extinction.
Certain new variables require definitions for performing high-resolution phylogenetic analysis of structural monophyly using descent with modification and morphology rather than clades and the standard shared ancestry and molecular traits. Structured monophyly means the identification and characterization of minimally monophyletic groups (MMG) of one ancestral species (rarely such must be inferred) and a few descendant species using outgroup and ingroup criteria. These MMGs are termed microgenera. Nomenclaturally, these are treated as formal taxonomic genera, and are distinguished from generally larger mesogenera that may include more than one ancestral species. Descent with modification means modeling evolution by construction of a caulogram, a branching tree with extant species (or rarely extinct but with inferable traits) at the nodes. Table 1 and Table 2 are examples of caulograms in spreadsheet format. A single track from the base of the caulogram to any terminus or node is a caulon, essentially a series of progenitors ending in a species at a named node or terminal descendant species.
An evolutionary actor (e.a.) is one newly evolved trait in a new species. It is one of a set of new traits in a descendant species, and that set is the novon. The ancestron is all the other traits of a descendant species. (All species are descendants, about half are also progenitors.) The novon set of new traits of the ancestral species in a microgenus is inherited completely by each of its descendants, and that ancestral novon is termed the descendant’s immediate ancestron. The immediate ancestron is the working set of evolutionarily important traits in a microgenus, and it makes the microgenus monothetic; all species in the genus share a single set of traits (the novon of the progenitor).
The caulon is split into caulon units (c.u.) of seriate microgenera, each caulon track running through or into a microgenus. Caulon units are measured from the base of the cladogram, thus the extant terminal group of any branch is about the age of the most distant caulon unit. See the discussion of evolutionary time below.
Previous papers [8,25] have demonstrated that each microgenus has initially about four descendant species, the number restricted as selective hoarding by some shared and general constraint, perhaps competition and crowding. The microgenus is fractal in composition, where one originator species generates four species with the same immediate ancestron ending up with five species with much the same basic set of recent adaptive traits (the immediate ancestron) in a microgenus; the fractal dimension is then ln5/ln4 or 1.161, which may be stable across scales, i.e., traits per species, species per genus, and general per families [8]. This “rule of four” is evident in the numbers of new traits in descendant species, with four being most common in recent genera.

2.2. The Models

The first lineage model is the caulogram of Streptotrichaceae (Table 1), the only complete family to date that has clarified structural monophyly by being fully reduced to minimally monophyletic groups. The caulogram is somewhat modified from previous papers in that there are now inferred to be three extinct genera. An extinct genus (Inferred Extinct Genus 3) or IEG 3 is intercalated between Williamsiella and Streptotrichum because the number of character state changes between these two genera are twice that expected for the other genera of the family, and so they are split, 6 for Williamsiella and 5 for IEG 3. Also, the base of the caulogram is interpreted as two genera, Streptotrichum with one species, S. ramicola, and an inferred extinct genus, IEG 2, each the progenitor of separate lineages in the family. The second basal genus IEG 2 is inferred as necessary to avoid ad hoc inferences of trait reversals to explain the Trachyodontium–Crassileptodontium branch. Streptotrichum and IEG 2 are inferred as jointly descendant from a third unknown genus, IEG 1, which is most deep in the caulogram and at the limits on practical inference. The extant genus Streptotrichum has one species with 4 traits in the novon, and IEG 1 and 2 are most parsimoniously modeled as identical, one species and four traits, by assigning minimum necessary explanatory information.
Detailed explanation of the generation of the caulogram is given in various papers (particularly [25]). The justification for the concatenation of extant species as progenitors of minimally monophyletic groups is also explained there, involving most importantly second-order Markov chains to determine order of evolution, and Shannon informational bits with Turing sequential Bayesian analysis for statistical support. When available, paraphyly–apophyly pairs imply ancestor–descendant relationships in molecular studies and can be useful supportive data [9]. Overall, this method models evolutionary descent with modification rather than cladistic shared ancestry, and has somewhat greater accuracy and resolution of evolutionary relationships.
The second lineage model is the caulogram of Pottiaceae tribe Pleuroweisieae, the only other large group, other than the above family, to be resolved as structurally monophyletic on a caulogram [27]. In other genera of the Pottiaceae of moderate to large number of species, the peristome is lost gradually, and eperistomate species generally retain the morphology of the genus. In Pleuroweisieae, only the genus Molendoa seems to have a close relationship with species outside the Pleuroweisieae, namely Didymodon, which have similar gametophytes but different laminal papillae. Molendoa, however, is also pleurocarpous (sporophytes borne laterally on the stem, an uncommon and advanced trait), and is eperistomate in all species. In other tribes of the Pottiaceae, only one genus that is pleurocarpous also has eperistomate capsules: Ganguleea, which is quite distinctive, monoicous, with a single stereid band, and not related to any of the Pleuroweisieae. Its single species is probably a pleurocarpous descendant of Weisiopsis. The pleurocarpous Pleurochaete has a well-developed twisted set of peristome teeth, and the “acropleurocarpous” peristomate species Triquetrella papillata has variously acrocarpous and pleurocarpous perichaetia [26].
The fact that all genera of this tribe lack peristomes except the rather basal Tuerckheimia guatemalensis (and there is only incomplete evidence of this) indicates that either the genera are quite heterogeneous in relationships, or that the tribe is monophyletic and very old, with peristomate ancestral genera now extinct. The latter is supported in molecular studies where associated genera of Pleuroweisieae, including Anoectangium, Eobryum, Gymnostomum, Molendoa, Reimersia, and Tuerckheimia, are grouped apart from genera of other tribes [28,29,30,31]. This justifies treatment of the group as evolutionarily coherent and at least molecularly monophyletic.

3. Results

A previous paper [32] suggested that sustaining evolutionary processes as integrated into classifications developed through taxonomic research might be represented or modeled with formulae developed in classical mechanics. Taxonomic concepts do, in fact, represent unitary processes in nature, but treating changes in natural groups as heuristically analogic or in some manner parallel to displacement of mass through time is conceptually challenging.

3.1. Units of Measurement

The establishment of what units to use in calculations required considerable innovation and testing before settling on measurement criteria equivalent to mass, distance, time, velocity, acceleration, and force in classical mechanics. That which does not change is the set of all characters that defines a taxon. There are about 75 characters [26] each for Streptotrichaceae and also for Pleuroweisieae. That which changes are the traits of a taxon, that is, the states of each of the characters genetically available to the taxon. There are usually two to three and occasionally four distinct states available for each character. About 170 different traits are possible, and, of these, about 120 are in play at any one time [33]. Often the occasional smoothly variable character can be divided into reasonably discrete states based on actual measurements.

3.1.1. Process

A minimally monophyletic group is one ancestral species and a few descendant species, here termed a microgenus. As a vehicle of the distribution of balance in preserving the latest proven traits (the immediate ancestron) along with the set of newly evolved traits (the novon), the microgenus is considered here the fundamental arbiter of evolutionary survival across time.

3.1.2. Mass

Evolutionary mass may be defined in units as species (spp.), each of which represent the total potential variation in traits of some larger taxon, in this paper, the family Streptotrichaceae or Pottiaceae tribe Pleuroweisieae. In physics, M is the unit for mass; here, M = spp. Associated concepts in the literature are evolutionary potential, robustness, and genetic diversity. It is the capacity to evolve and adapt to changing conditions genetically. Like mass in physics, the total set of characters does not change, and may be treated as a constant through time. The word trait is a synonym for character state. The Streptotrichaceae and the Pleuroweisieae are both segregates or portions of the Pottiaceae, thus their available character set is identical. Clearly, evolutionary mass is best measured as the number of species, each multiplying the effect of their shared identical sets of characters (but not character states, which vary per species).

3.1.3. Distance

Adaptive radiation can be ascribed to new traits [34] as well as fossil traits [35]. A character state change preserved in a lineage by incorporation into a descendant species is here identified as an evolutionary actor (e.a.), a basic unit of evolutionary action. This is a restricted sense for the concept of an evolutionary agent [36,37], this being any factor that causes a change in gene frequencies. There are usually 2 to 4 (rarely up to 8) evolutionary actors as newly evolved traits (state changes) in any one species, and these changed characters accumulate linearly along a caulon from ancestral species to descendant species. The summing of action, as ∑ e.a., measures evolutionary distance from a taxon to the caulogram base.
Evolutionary distance in molecular studies refers to the number of nucleotide or amino acid substitutions per site separating two homologous sequences [38]. Here the term is a measure of how far a taxon (species, genus or family) has come in evolutionary change, which is the sum of all trait changes over time. These changes do not happen all at once, but are separated into sets during time periods such as speciation events. The path of distance is the caulon, or a line connecting a species with the base of the caulogram.

3.1.4. Time

Evolutionary diversity is to a significant extent dependent on time [39]. Lovejoy and Spiridonov [40] have suggested that macroevolutionary effects depend on the environment during the past 40 million years and on intrinsic features of the organism prior to that.
Various measures of evolutionary time are possible: Evolutionary time as opposed to geologic time equivalents (c.u.) is measured as the number of speciation events in a series on a caulon, or in caulon units, the number of microgenera in a caulon (which may have more than one speciation event in a caulon unit due to secondary speciation). A speciation event (s.e.), or one set of newly evolved traits (evolutionary actors), is the unit used for evolutionary time between descendant species on a caulon. A speciation event in time is the generation of a new species, usually a descendant of an extant progenitor, and different in a few new and apparently evolutionarily important traits.
A caulon unit (c.u.) can compare aggregations of new traits on a caulogram between microgenera, being the distance on a caulon (a line linking one species with the base of the caulogram) between progenitors of microgenera. It is a good measure of geologic time.
Evolutionary time is here scaled to geologic time in three ways:
(1)
Microgenera are inferred as originating in a burst of speciation, on the order of 22 million years (my) in extent from data on the recent West Indies diversification [8], but there are also arguments for 27 my evolution-modifying intervals [41] and 32 my cycles [42]. In a massive molecular phylogenetic analysis of the bryophytes [43], with 29 fossil calibrations, the crown age of the Pottiaceae (77 genera, ca. 1209 species) was estimated at 133.3 (115–150) mya, while the majority of bryophyte families diversified during the Cretaceous terrestrial revolution. There would then be an estimated 133/(22–32) or 4 to 5 caulon units for Pottiaceae in that time. Timewise anchorage is also provided by a study of the pottiaceous genus Syntrichia by [44] who used the late Cretaceous fossil Cynodontium luthii for calibration.
According to a review by Rensing et al. [45], the oldest fossil mosses are from the Permian, about 270 mya, while fossils of modern mosses are from the Jurassic and Cretaceous. Most European Miocene mosses, ca. 24 mya, are of extant European genera and even species, while those of Caribbean amber (20–45 mya) are largely extant genera and species. The authors conclude that some moss species might be 40–80 my in age, and some genera as old as 80–100 my.
The caulon units that reflect bursts of speciation are then a kind of standard evolutionary clock for morphology, similar to the molecular clocks of molecular studies.
(2)
Two microgenera of extant Pottiaceae, Chionoloma and Tainoa are largely restricted to the West Indies where their estimated age of origination is 22 mya [8], about halfway through the existence of this area. One has a species of secondary ancestry. This period here is assigned to each caulon unit (caulogram distance between serial microgenus progenitors) as a morphological clock.
(3)
Ignatov and Maslova [46] described fossils of mosses prior to late Cretaceous as having a quite different morphology from that of modern species, implying a vastly different set of morphological characters—a set different than that in the present study serving as evolutionary mass. The earliest fossils of modern genera (Campylopodium and Cynodontium) are, according to Ignatov and Maslova, from the late Cretaceous. Thus, the species and genera in the present study (Pottiaceae and its segregate Streptotrichaceae) are estimated to be between 22 and 110 my in age. The results of this study found 5 caulon units in Streptotrichaceae and 3 in Pleuroweisieae, each unit considered circa 22 my in duration, which fit the above scales.
Given that there may be secondary ancestry (descendants of descendants) the number of speciation events does not scale exactly to caulon units. There are 7 levels of speciation events in Streptotrichaceae (Table 1), and thus 16.6 my per speciation event. For the 5 levels of speciation events in Pleuroweisieae, each speciation event is of 13.2 my. Of course, precision is not accuracy, but it good theory can start with sparse data [47], and one hopes future study will produce better estimates.
If one caulon unit comprises the estimated age of the caulogram divided by the number of caulon units, then one caulon can be used as a unit of time anchored by a molecular or morphological clock This implies that the more progenitors there are in a series lower in the caulon, the relatively shorter time the extant species or genus higher in the caulogram has survived as such. If a morphological clock is invoked, then the age of the lineage in years is the number of caulon units times estimated years between caulon units. Assuming the morphological clock and a generally equal rate of evolution in terms of units of evolutionary action, each extant species is as old genetically as the number of caulon units from the base of the caulogram. A caulon unit is one of a series of microgenera on a caulon. Geologic time begins at the base of a caulogram, a position shared by all caulons, and restricts evaluation of the effect of evolution to extant taxa or extinct taxa with inferable traits.

3.1.5. Velocity

Evolutionary velocity is the number of evolutionary actors as newly evolved traits in any one new species, equivalent to evolutionary speed per species. Velocity is evolutionary actors per speciation event, or V = e.a./s.e. Evolutionary position is simply the species whose velocity is zero relative to the taxon or group studied. Position is important in that classical mechanics deals with displacement of a mass from one place. The progenitor of a genus is the position against which the descendants have velocity equal to their respective novons (number of new evolutionary actors). For a major group, it is the point at the base of the caulogram against which all species’ velocities are measured, i.e., the hypothetical unknown ancestor of the last known ancestor. We are measuring the amount and rate of displacement of mass from some one position to another.

3.1.6. Equilibrium

Evolutionary equilibrium [48,49,50,51] is any one taxon ascribed as having no change in velocity, that is, without a relative measurement. A terminal descendant is in evolutionary equilibrium. A multi-species genus, however, is naturally in evolutionary disequilibrium because the descendant species are accelerating away with differential velocities contributed by their various new traits; it is actually a classic dissipative structure [52,53,54].

3.1.7. Momentum

For one species, mass times velocity is evolutionary momentum, or Mo = spp. × V (p is used in physics for momentum to distinguish from M for mass; we will use Mo). Since there is only one species involved, mass is 1 spp. and time is 1 s.e., so instantaneous momentum is simply the number of new traits (this is the same value as velocity but different units give it a different meaning); for several species, their momentum is number of species times average momentum or, more accurately, simply add the number of new traits of all these species together.

3.1.8. Acceleration

In physics, acceleration is the change in velocity over time. The instantaneous acceleration of a species is the difference in velocities between one species (Vfinal) and its immediate ancestor (Vinitial), which can be positive or negative; A = (ΔVf − ΔVi)/s.e. Increasing distance in the caulogram, however, results in constant addition of the velocities, resulting in some final large velocity. Consider evolutionary acceleration on a caulogram like a several-stage rocket that increases it velocity with the burning of each stage. The final velocity, compared to the initial velocity (zero), is the sum of its multiple changes in velocity over time.
Given that the evolutionary actors (the novon set) of one species are equivalent to momentum, then adding all evolutionary actors along the caulon from the species to the base of the caulogram provides the evolutionary acceleration for the known genetic existence of that one species, that is, the difference in number of new traits in any one species against the number of new traits at the base of the caulogram (zero). (The most basal species has an acceleration equal to the value of its e.a.) This is more accurate than simply taking the average of this measure and multiplying by the number of concatenated evolutionary events (species serial on the caulon).

3.1.9. Force

Force is mass times acceleration, and in physics the unit is the Newton. For one species, acceleration, as change in velocity between ancestor and descendant, is the same as its momentum (mass × velocity), that is, the increase in speed measured by numbers of new traits of one species (a species without a known ancestor has no measurable acceleration.) Evolutionary force is summed momenta for two or more species, or for the whole caulogram, as F = Mo × e.a. s.e.−2. Because mass for each species is 1 spp., then simply summing the momenta of each and every species, 1 × ∑ e.a., gives total mass times acceleration. Because each species is an evolutionary event surviving to the present, there is no redundancy in adding for each species all novon traits (e.a.) along the entire caulon from that species to caulon base—each species has used all its traits through time for survival. Evolutionary force is also treatable as evolutionary resilience, being the accumulated adaptions of a group adding up to an increased survival potential at the present time. It is probably the most important measure for biodiversity analysis and is here considered the force behind evolutionary stability and resilience. Evolutionary force is simply the summed evolutionary actors over time for any one taxon.
Rates of extinction [55,56] are the inverse of apparent rates of speciation. The fact that the most recent microgenera are commonly well speciated and that numbers of species fall off gradually indicates that immediate descendants occur in a recent burst, within an estimated 22 million years [8], followed by some secondary speciation as descendants of the immediate descendants. A taxonomic unit higher than species may be defined as a burst or dissilience of species all with the same monothetic set of traits (the immediate ancestron), with one ancestral species inferred as most similar to an outgroup and also generalist in respect to the ingroup. If gradual, then the rate of extinction would be a linear loss of species over time. The more exact and perhaps meaningful measure of extinction is rate of loss of evolutionary traits over time, simply the reverse of the increase in evolutionary actors associated with evolutionary acceleration.

3.2. Simplification of Calculations

Taxonomists and other non-physicists may find a sufficient introduction to classical mechanics in various books intended for an educated popular audience. The explication by Carroll [57] is particularly recommended. There are shortcuts used in the present paper that allow non-physicists ease in comprehension. Basically, for a single species during one speciation event, the numeric values for velocity, acceleration, momentum and force are the same, and only the units of these values differ.
Consider a species with three newly evolved traits. Evolutionary distance is 3 e.a. (evolutionary actors). Velocity is 3 e.a. s.e.−1 (evolutionary actors per speciation event). Acceleration is 3 e.a. s.e.−2 (evolutionary actors per speciation event per speciation event). Momentum adds mass to the formula, which is 1 × 3 spp. e.a. s.e.−1 (species times evolutionary actors peer speciation event). Force is 1 × 3 spp. e.a. s.e.−2 (species times evolutionary actors per speciation event per speciation event).
When increasing mass, say to four species concatenated on a caulon, then the units of the value change to mass times the average velocity or acceleration (average comes in by the “per” unit of s.e.−1 or s.e.−2). Thus, a group of four descendant species with an average of three new traits each has a total momentum of 12 spp. s.e.−1. The simplification, here, is that the step of multiplying by an average can be avoided by simply adding the e.a. s.e.−1 values to obtain total momentum for all four species, that is, 3 + 3 + 3 + 3 = 12. This is because each value of momentum already incorporates mass as a unit. Thus, evolutionary force simply adds the e.a. s.e.−1 values of each species on a caulon to obtain the difference in velocity between the species in the caulogram and the base of the caulogram. This yields mass times acceleration, or evolutionary force.

3.3. The Streptotrichaceae Caulogram

The spreadsheet-based annotated caulogram or evolutionary tree of the moss family Streptotrichaceae (Table 1) is in part based on dendrograms in previous publications [25,33,58]. Measurements given include the following: (1) genus name (actually a microgenus or minimally monophyletic group of one ancestral species and a few descendant species), (2) numbers of species in the microgenus, (3) a minimum resilience for that genus is the measure being the sum of all evolutionary actors (new traits) of each species from (and including) the base of the genus to the base of the caulogram, (4) the number of caulon units (microgenera, here each unit estimated as lasting about 22 my), (5) the species (epithet), (6) a series of columns showing speciation events with number of evolutionary actors (new traits) per event, and lastly, (7) labeled F (for evolutionary force) in the Table, the summed evolutionary actors reaching from the species down to the base of the caulogram, with force as a measure of resilience.
The base of the evolutionary tree is at the fifth caulon unit (distance in time marked by microgenera from the present, given as “Cu” in Table 1) and also at the number 1 species event (speciation), which is the earliest with information on descent in both evolutionary and geologic time. Color coded microgenera include their progenitor species and often have secondary speciation events (descendants generating descendants). Secondary speciation events are included in the same microgenus with the progenitor because they do not fit the definition of a genus as a burst of descendants from one progenitor all sharing a monothetic set of traits. It is possible to infer extinct genera (IEG) and some species (“unknown”) from traits of extant species.
Extinction in terms of the loss of species, as evident in the caulogram (Table 1), is gradual. The most advanced genera in terms of accumulation of evolutionary actors (distance), which are closest to the present in numbers of caulon units of distance in time, have the greatest number of species. The three genera in caulon unit 1, the most recently evolved genera, average four species each, but one of these is Rubroleptodontium, an isolated taxon evidently newly originated. Three genera in caulon unit 2 average 4.33 species; those three in caulon unit 3 (one extinct) average 1 species each; those three in caulon unit 4 (one extinct) average 1.3 species; and the basal most genus has 1 species (arbitrarily assigned). Clearly, the older genera have fewer species, even ignoring the arbitrary assignment of only one species to two inferred extinct basalmost genera.
Of some importance is the gradual extinction of evolutionary actors, which is the negative of evolutionary acceleration (F), an inference from present-day distributions. If speciation is by bursts, as evidenced by more speciose genera in the most recent caulon units (1 and 2) and fewer species in more ancient caulon units (4 and 5), then changes in velocity, total units of action per caulon unit, must be due to extinction. Although the evolutionary velocity of all genera is similar, between 4 and 6 e.a c.u.−1, the clear differential in velocity of their species means that the species are moving apart, in evolution space, from each other. Differences in numbers of novon traits indicates that genera are also separating.
A balancing of evolutionary force through time is, apparently, a feature of the fundamental source of biodiversity. As a source of fixed genetic diversity, the newly evolved traits of the ancestral species (its novon) are shared with its descendant species entire (becoming their immediate ancestron), which provides a kind of evolutionary lubricant to enhance resistance to competition sympatrically while constraining the breadth of successful mutations in descendants. By enfolding descendant species in a sabot of proven successful traits, descendant species have a competitive advantage in both stable environments and during major ecological change. Given that lessened ability to survive concentrated environmental insult is considered a cause of extinction, it may be possible to now provide an exact measure of relative genetic exposure to extinction for a genus or species.

3.4. The Pottiaceae Tribe Pleuroweisieae Caulogram

The caulogram detailing the microgenera of the Pleuroweisieae (Table 2) was originally created in spreadsheet format [17] and was then enhanced with additional data [59,60]. There are only three caulon units of depth in time in Pleuroweisieae, two less than in Streptotrichaceae. Given that all genera are extant, one begins counting back in time from the present. If the same morphological clock obtains as inferred for Streptotrichaceae [58], then the Pleuroweisieae stretches back 66 my, about half of the time of the 110 my of Streptotrichaceae. Given morphological reduction common to all genera of the Pleuroweisieae, most evolution (e.g., peristome expression) probably took place before that time, during early and mid Cretaceous.
In Pleuroweisieae, the progenitors of Anoectangium may involve peristomate genera like Barbula. Molecular analyses suggest an immediate relationship among the eparistomate genera Ardeuma, Gymnostomum, and Tuerckheimia [31,61], and other yet unstudied genera of tribe Pleuroweisieae of Pottiaceae. Given the propinquity in molecular cladograms that include genera of Pleuroweisieae, and in sum their molecular distance from less-reduced possible ancestral genera, the group is monophyletic. The morphological caulogram of Pleuroweisieae indicates Eobryum as an immediate progenitor or at least a locum tenens for a set of ancient progenitors.
The number of basal and near-basal branches is not four as expected from fractal self-similarity [32] but eight (required to derive the branches without reversals) at the basal caulon unit 3, i.e., all eight originating about the same time. If origination of these ancient genera involves a single process, then it may follow a power law in the sense of two powers of two, 2 × 2 × 2. One might look for supraspecific groups that range in branching of descendants from 4 to 8 to 16, depending on ecological opportunities that may increase with age of the group of genera. That increase may come from the more localized distribution of spores due to the lack of a peristome control of rate of dispersal resulting in precinctiveness and less competition.

3.5. Comparison of Caulograms

Summaries of Table 1 and Table 2 are given in Table 3. The measure of evolutionary resilience—evolutionary force, which sums momentum over all genera in a suprageneric group—reveals that Streptotrichaceae of 13 extant and inferred genera has a summed momentum of 756 units, averaging 22.9 per genus, versus Pleuroweisieae with 11 genera and with 869 summed momentum units, averaging 24.1 per genus. Although the family Streptotrichaceae offers extant genera through five caulon units (or 110 my), and Pleuroweisieae has extant genera from only the past three caulon units (66 my), the latter is more resilient than the former with 869 summed e.a. compared to 765 summed e.a. and has a higher average summed e.a. per species. (Remember that the summed e.a. is not only the new traits in some one species but the new traits summed in all ancestral species down to base of caulon). Pleuroweisieae averages 3.3 species per genus while Streptotrichaceae averages 2.5. It may well be that the increased trimming of genera by species extinction in the Pleuroweisieae, which is subject to much morphological reduction, has left only the most evolutionarily robust species.
If speciation in extant species of Pleuroweisieae began about the same time as speciation event 3 for Streptotrichaceae (colored green in Table 3), then we can add evolutionary actors per speciation event. The total numbers of evolutionary actors in both groups representing sets of species’ traits were rather low during Streptotrichaceae species events 1 and 2, reaching 33 and 34 e.a. total in middle years, with a high of 66 to 70 just before the present, and then dropping to 53 in most recent times. This may be explained by gradual extinction throughout and enlarged extinction in late middle years by considerably secondary ancestry (descendants generating descendants) reaching a maximum, but lowering in recent times with little extinction but also little secondary ancestry. The Excel trendline best fit is a polynomial (y = –1.9x2 + 26x − 27). It is a parabola that may be explained as the result of two processes, speciation and extinction, strongly interacting. The minus sign makes the curve downward-facing, the –1.9x2 term reflects evolutionary acceleration, and the 26x term fits linear extinction, while –27 orients the curve on the y-axis (Figure 1).
Simpson [23] judged the evolution rate in eight horse genera to be 0.18 genera per million years. For Steptotrichaceae, 13 genera were generated in about 110 million years, or 0.12/my. For 11 genera of Pleuroweisieae generated across 66 million years, the measure is 0.17/my. These rates of evolution are generalist and simple, but quite similar. It is possible that the horse genera are likewise minimally monophyletic groups.
There is also similarity in the resilience of the genera in the different suprageneric groups, with Streptotrichaceae averaging 16.3 e.a./genus, and Pleuroweisieae averaging 19.5. This is true even when the Streptotrichaceae is almost three times as old—measured in caulon units—as the extant Pleuroweisieae, averaging 3.3 caulon units versus the latter’s 1.3 caulon units, assuming a morphological clock. One must assume much extinction of Pleuroweisieae genera during caulon unit equivalents greater than 66 mya; yet, in spite of such extinction, the Pleuroweisieae is about equally robust in survival potential as a group. It may be that the evidence of much morphological reduction and habitat specialization implies the rapid extinction of more morphologically complex and more highly adapted progenitors that would have contributed to additional, earlier caulon units.

3.6. Comparison of Species per Genus and Traits per Species

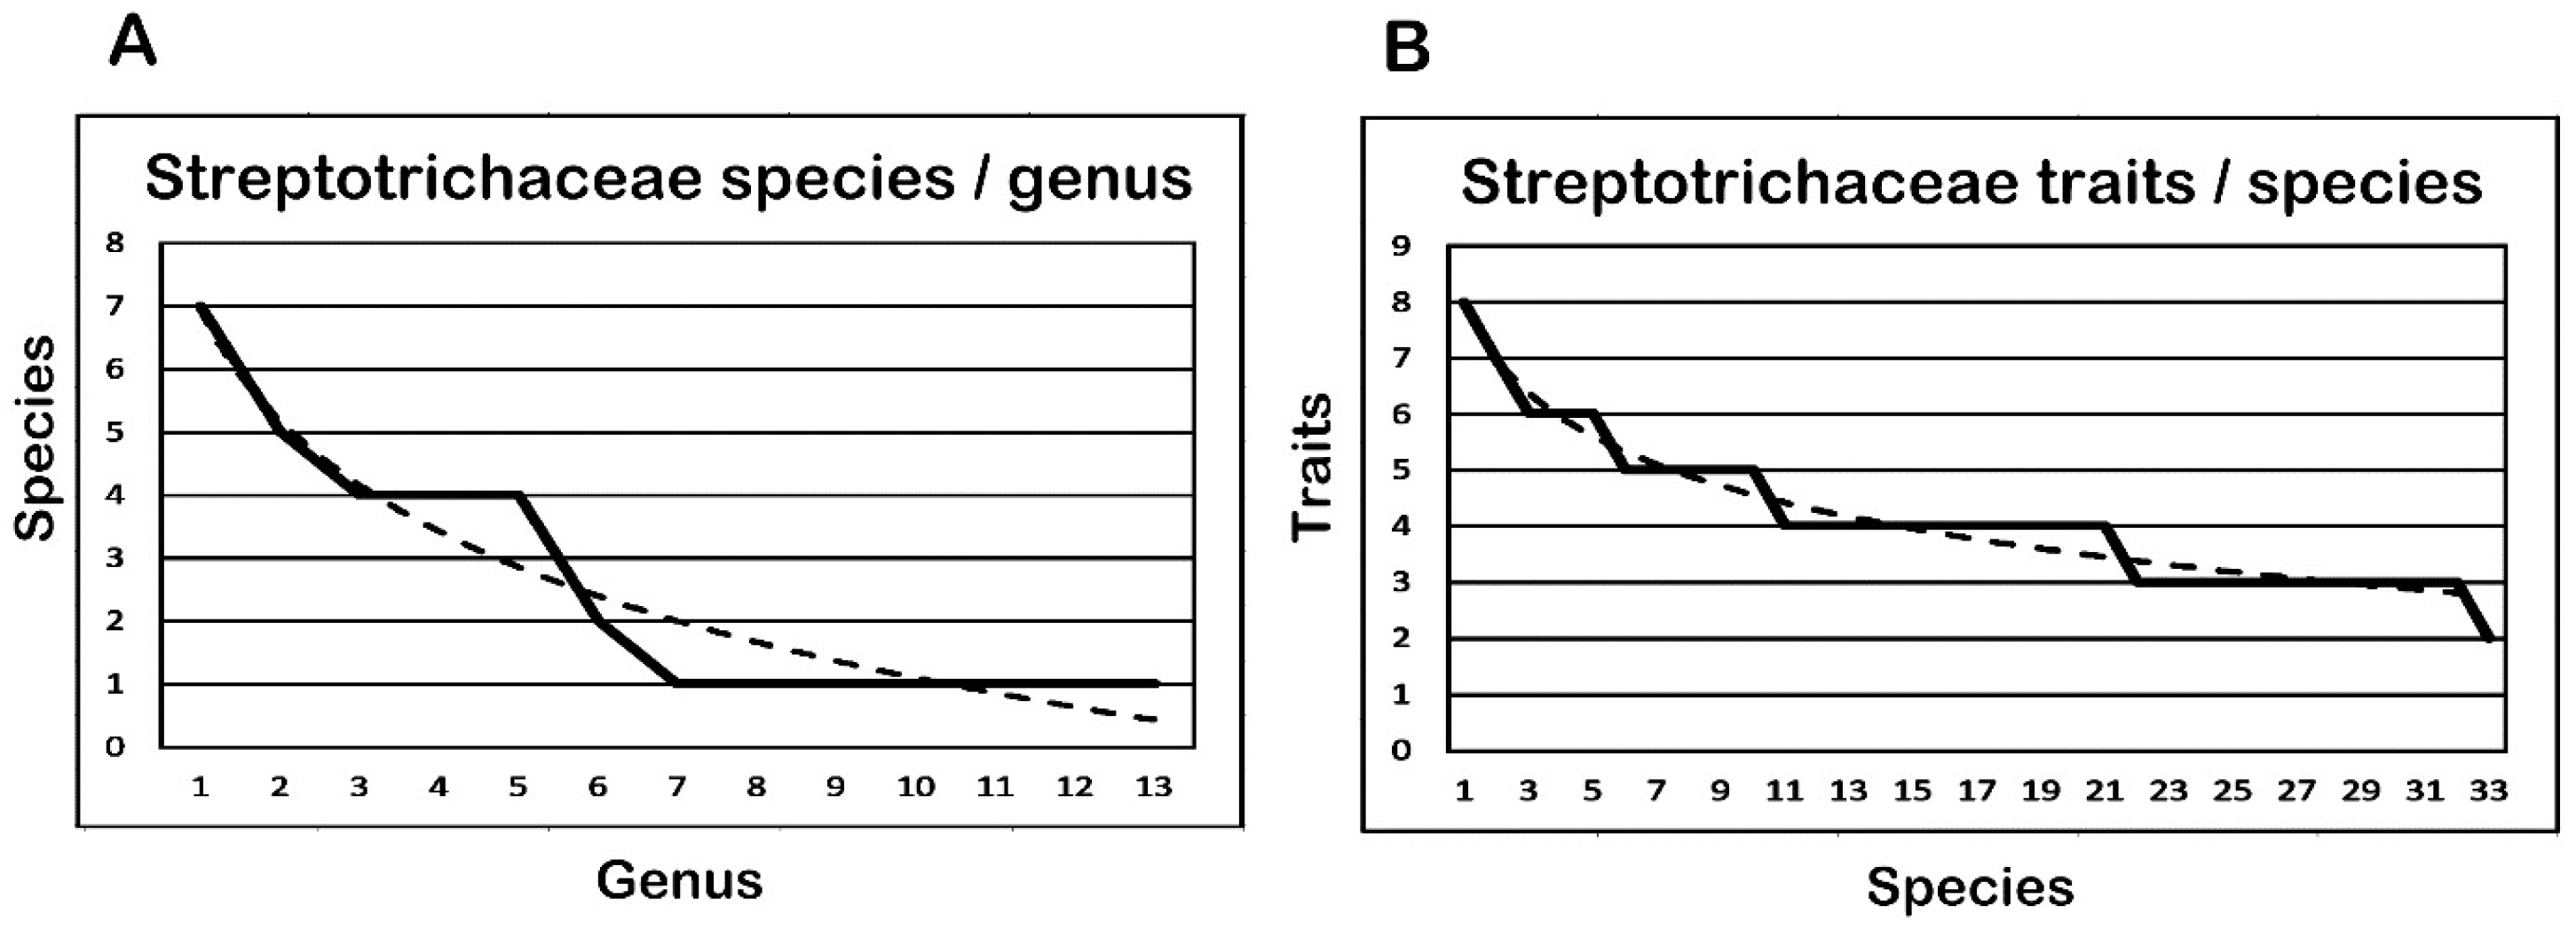
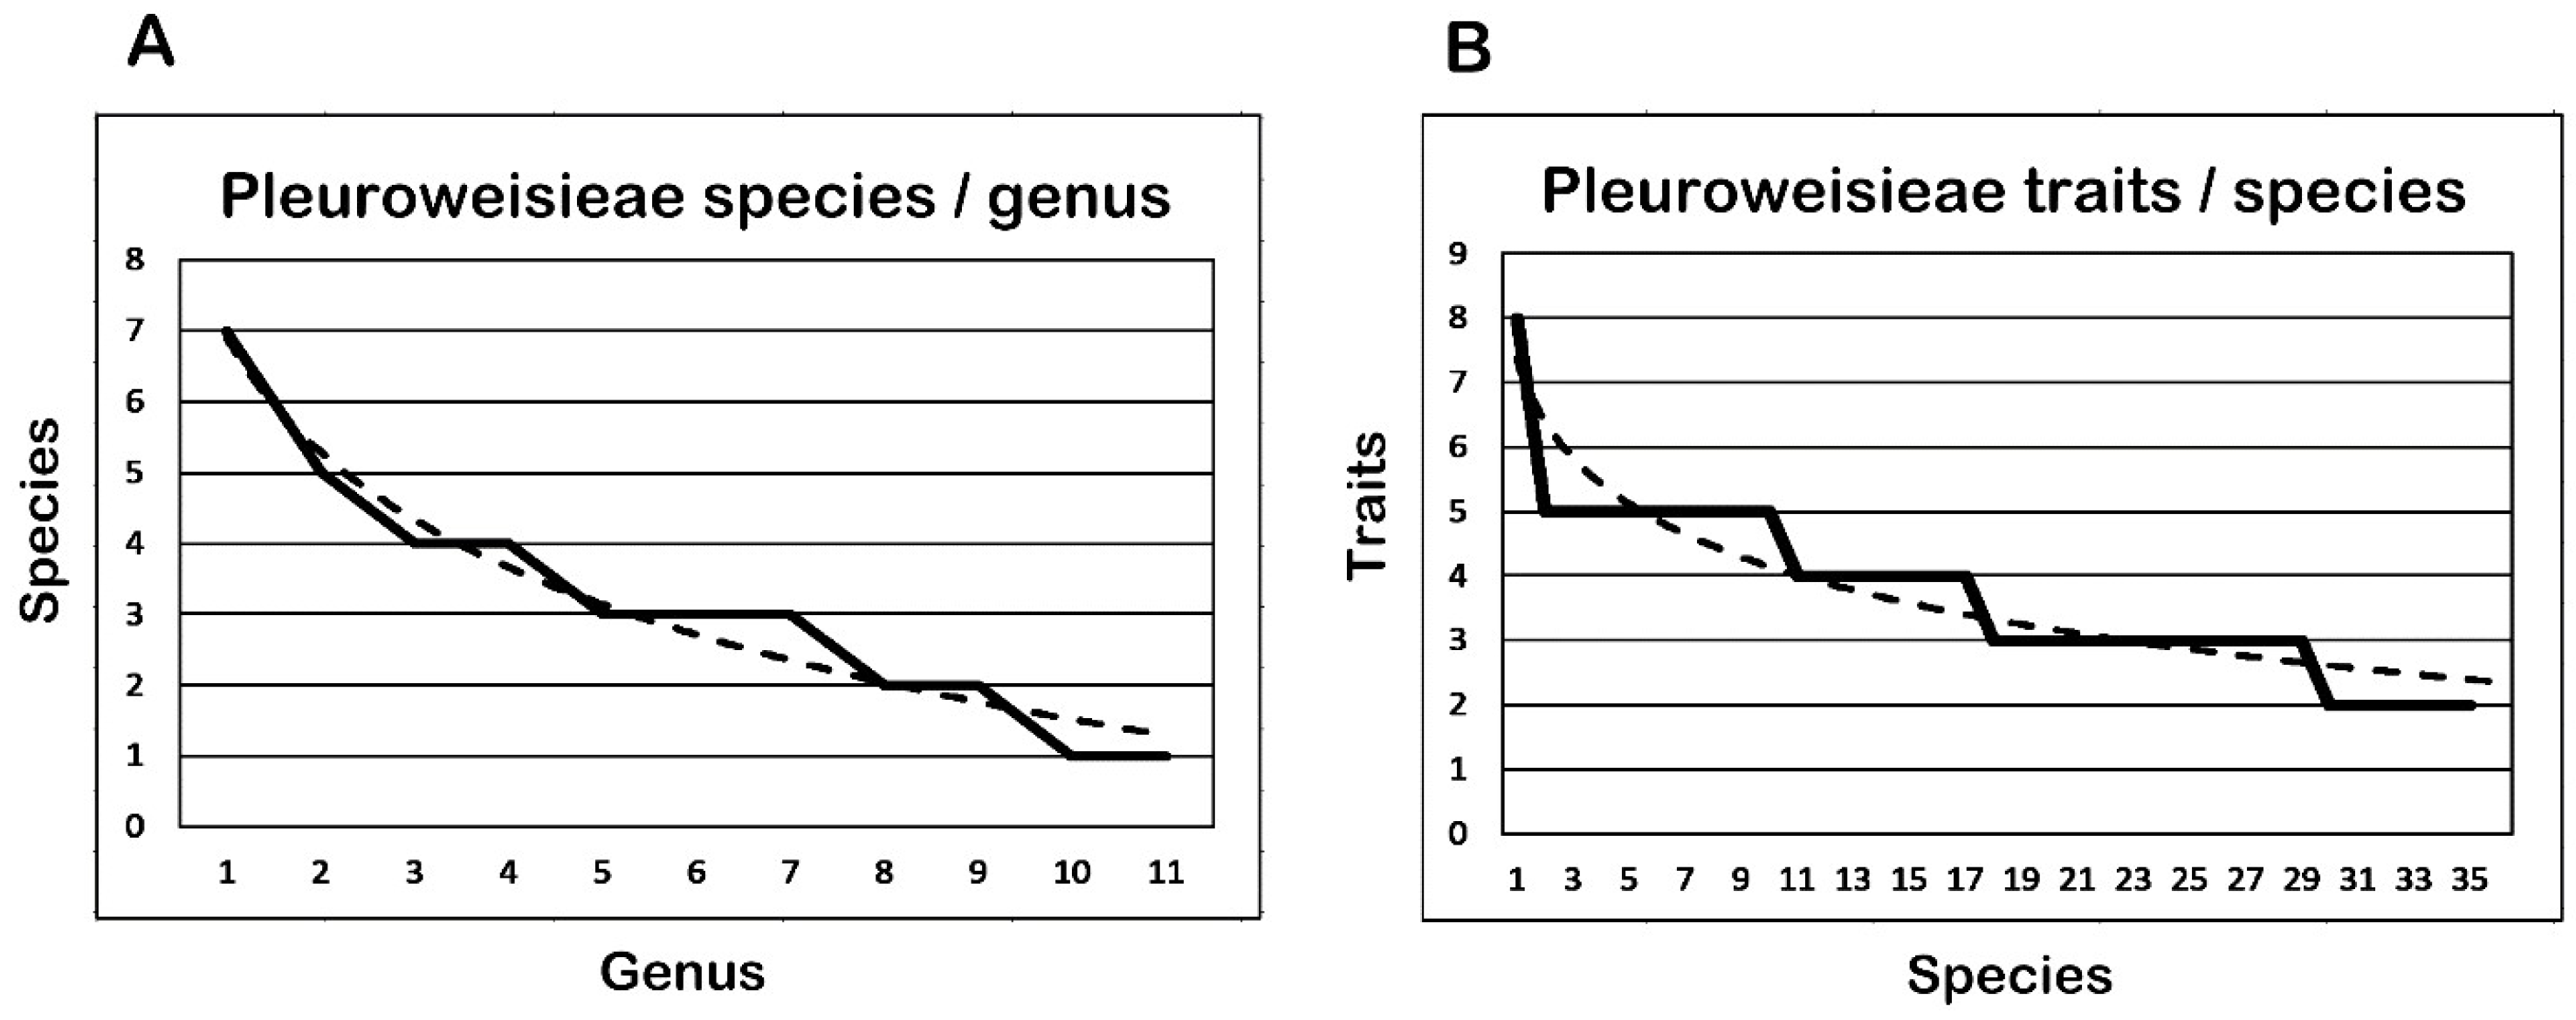
The number of species per genus and newly evolved traits per species are compared in Figure 2 and Figure 3. The two groups show similar logarithmic hollow curves. The bulge in species per genus for Streptotrichaceae (Figure 2A) is due to much secondary speciation in middle of the graph. Graphing without the secondary speciation, scoring only the numbers of immediate descendants, results in a linear trendline. Because no such bulge is present in the Pleuroweisieae genus/species graph (Figure 3A), perhaps extinction (or survival) of immediate descendants is indeed linear but extinction in sum is affected by somewhat better adapted secondary descendants? Extinction seems to provide the overall hollow curve, acting on all descendants, immediate or secondary, while speciation is a burst followed by occasional, secondarily generated descendant species. The graphs of Pleuroweisieae (Figure 3A,B) of the same variables are similar.
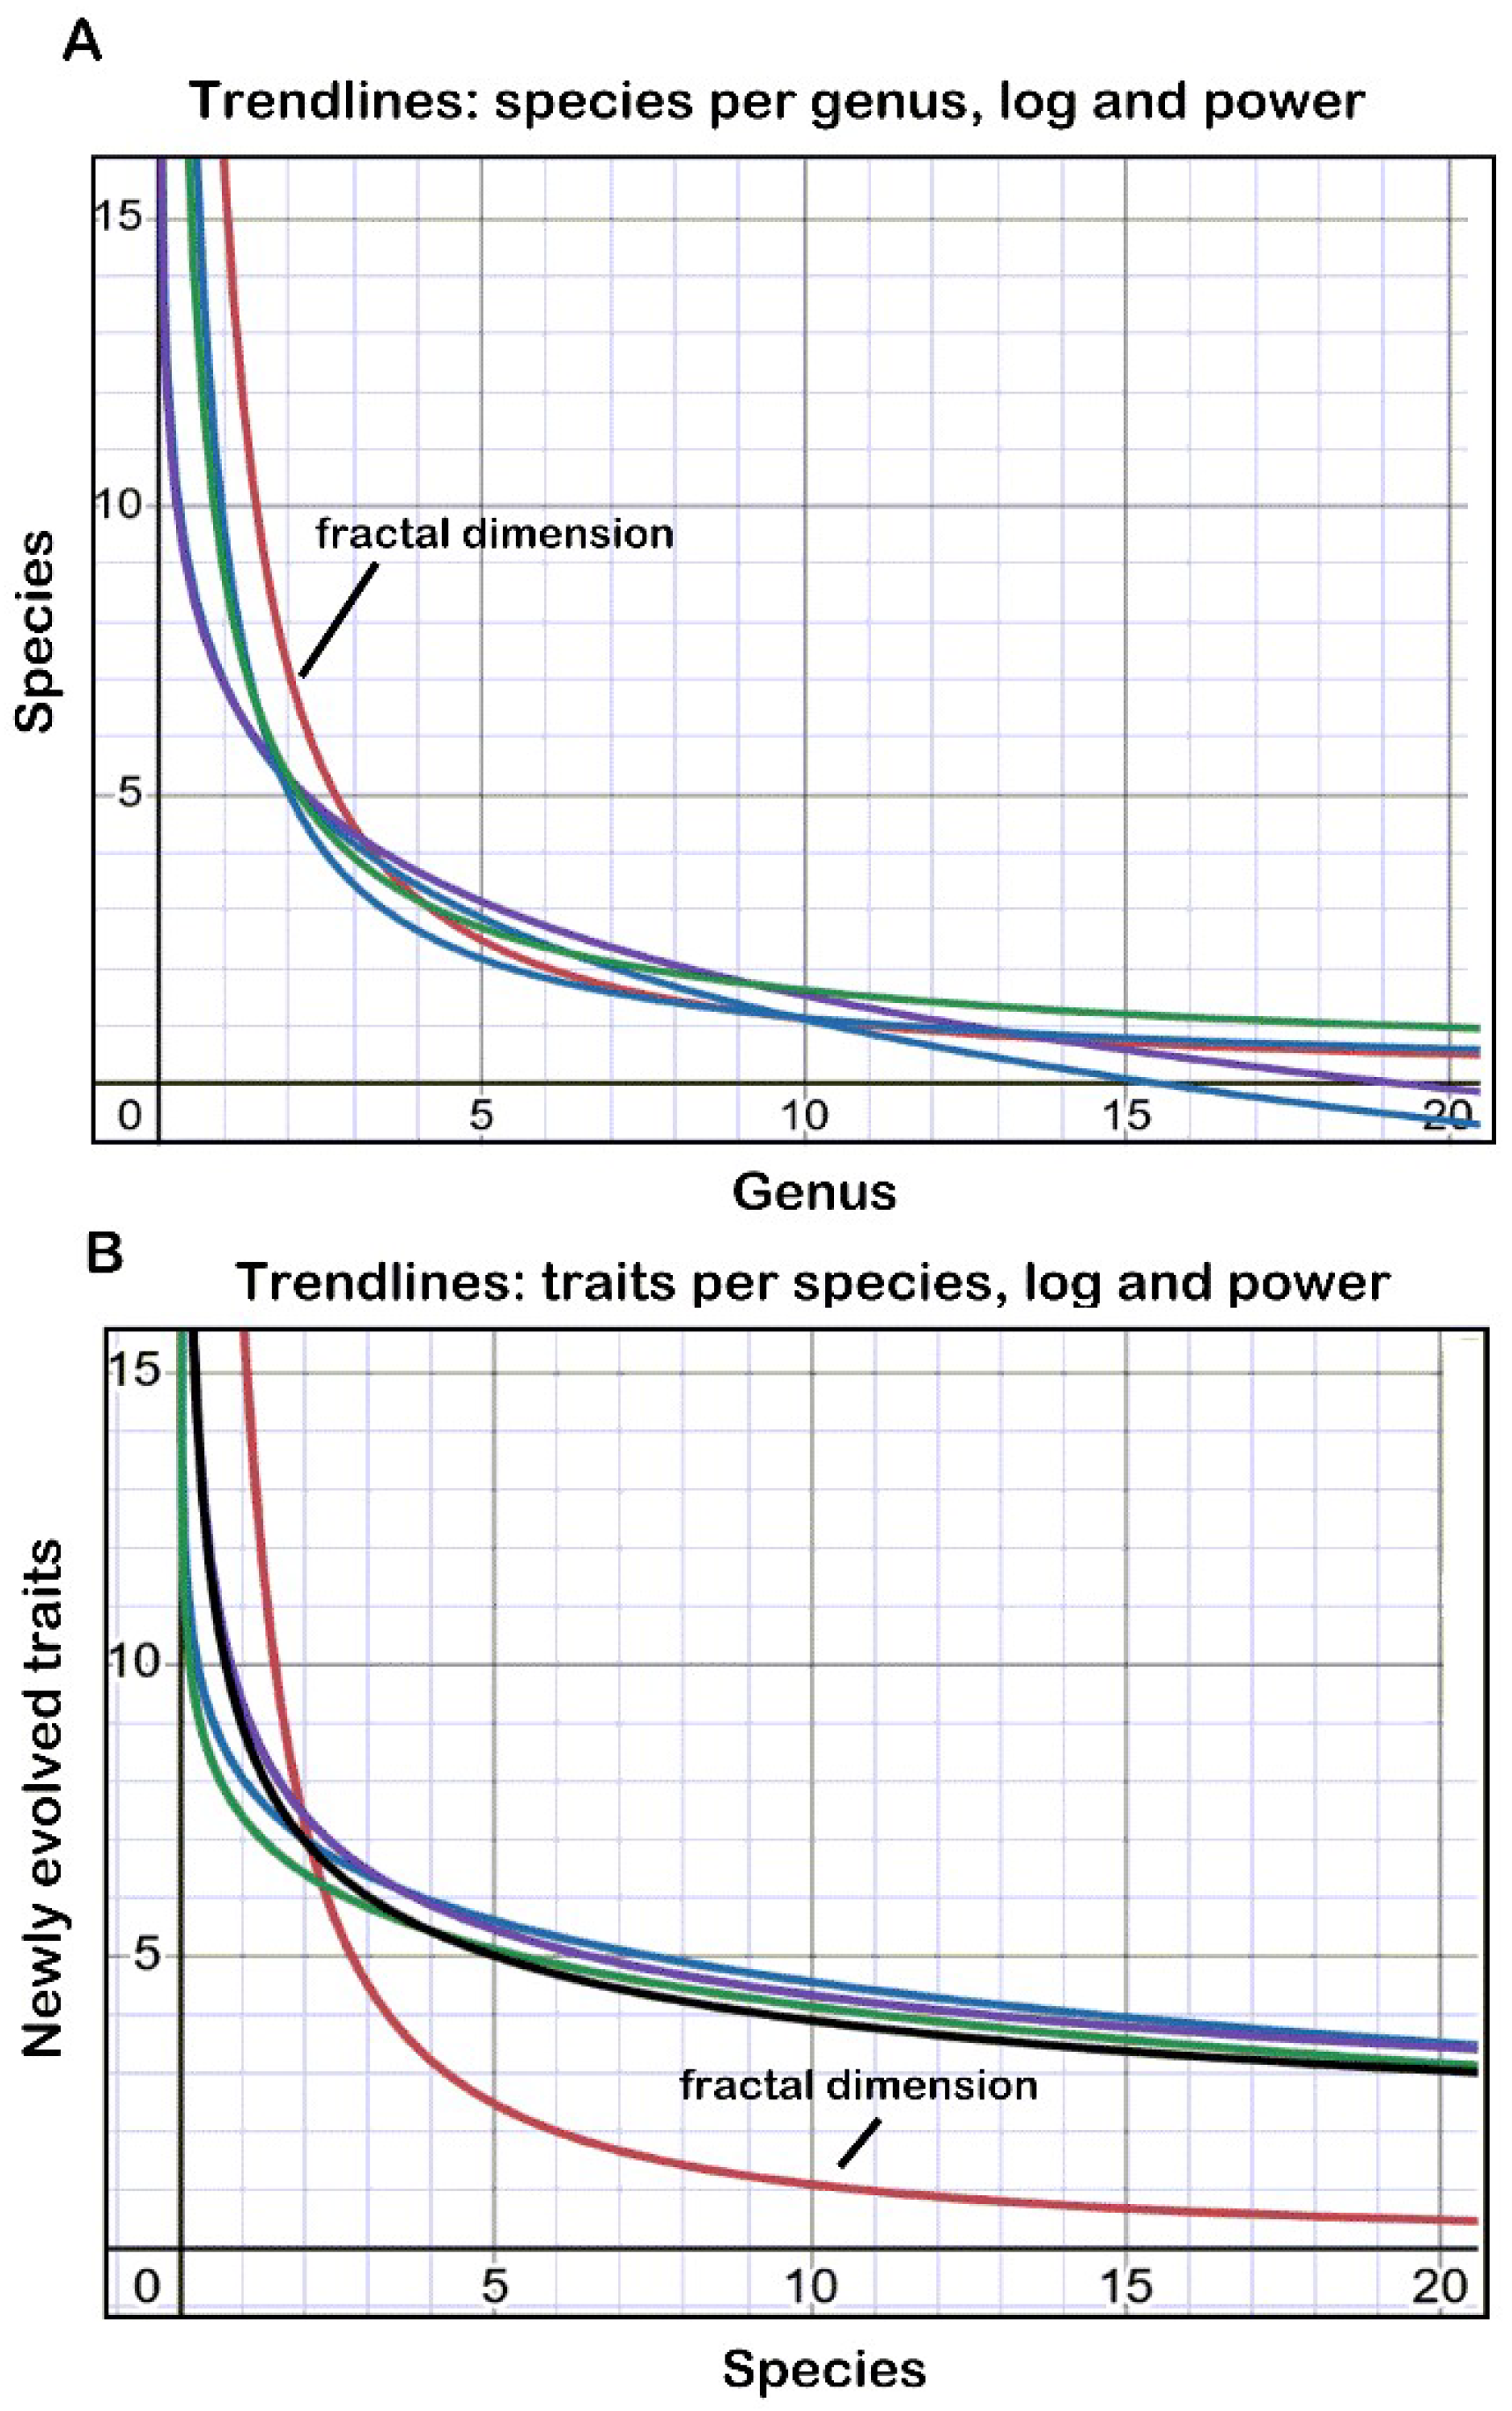
The trendlines (curves of best fit to data) (Figure 2 and Figure 3) given by Excel for both logarithmic and power curve interpretations (Table 4) have similar curves, but the analyses of species per genus and traits per species differ. In Figure 4A, the logarithmic and power curves for species per genus in both groups (Figure 2 and Figure 3) are nearly identical, and are close to the fractal dimension curve for the Pareto ratio, which is formulated as y = 16x−1−161, as attributed to fractal genera [8].
The fractal dimension is inferred [8] to extend from species per genus, where it operates to limit descendant species to about four, to traits per species (an optimal four traits per species) as self-similarity. Both species per genus and traits per species have, indeed, similar values across taxonomic groups, averaging 2.5 species per genus for Streptotrichaceae and 3.3 for Pleuroweisieae. Traits per species averages the numbers in Table 3, giving 4.3 for Streptotrichaceae and 4.54 for Pleuroweisieae. Both species per genus and traits per species are governed by a rule of four, meaning there is some limit (optimally ca. four) on the numbers of species in a genus and traits in a genus, but only species per genus is affected by extinction. Numbers of traits per genus is not affected in the same way. The fractal dimension of 1.161 generating the rule of four is further affected by the extinction of species to show a secondary fractal dimension of 1.161. Extinction of species affects traits per species only in reducing the number of sets of traits per species—a species extinction eliminates its set of traits, although these traits remain as potential character states in the full set of characters for the larger group (the evolutionary mass). It has been pointed out [62] that species that are more similar overall or which have more similar optimal ecological similarity increase the time required to drive species extinction.
In Figure 2 and Figure 3, the graphs show species per genus largely ranging from 1 to 7 but are cut off at about 11 genera, while traits per species are limited to about 2 to 8 and cut off at 33 to 35 species. The curves are similar but because the traits per species are in packets of sets of traits in each genus, extinction acts on the species not the individual traits. In Figure 4B, the difference between the curve of fractal dimension and the skein of curves for traits per species represents the isolation from extinction of some natural control of numbers of traits per species.

3.7. Graphs Limited to Immediate Descendants

Table 1 and Table 2 show considerable secondary speciation, namely a descendant species arising from another descendant species, but not (yet) becoming a microgenus defined as generating a burst of descendants sharing its newly evolved traits. These secondary descendants may or may not have the exact novon set as their immediate ancestor. If we focus only on the immediate descendants of the microgenus progenitor, however, the rule of four again appears.
Figure 5 shows the number of immediate branches coming off microgenera progenitors for Streptotrichaceae and Pleuroweisieae. For Streptotrichaceae (Figure 5A), there are four 3-branch nodes, three 2-branch, four 1-branch, and two branchless nodes. For Pleuroweisieae (Figure 5B), there is one 10-branch node, one 3-branch, four 2-branch, four 1 branch, and one branchless node. The Streptotrichaceae shows a linear trendline, while the Pleuroweisieae is logarithmic.
If we assume that the 10-branch node is an artifact of rapid extinction about the time of the Paleocene–Eocene thermal maximum and re-graph the data without the 10-branch node, then the trend line is linear (Figure 5C) like that of Streptotrichaceae. The number of immediate descendants in Streptotrichaceae show a linear extinction from three to zero branches on a shared background of four branches, that is, plateaus of three or four genera. The number of immediate descendants in Pleuroweisieae shows the same linear set of plateaus on a shared background of a multiple of four branches (ca. 8). One might infer that ancient quadratic patterns remain evident as relicts of at the pre-K-Pg (Cretaceous-Paleogene) boundary macroevolution at the genus level.
It may be pointed out that none of the nodes have four immediate descendants, which argues against a rule of four. That rule is in part derived from actual 4-branch nodes in studies of the apparently more recently evolved Pottiaceae tribe Trichostomeae in the West Indies (and from evaluations of species per genus curves made by other researchers in many taxonomic groups [8]. The two groups investigated here are fundamentally ancient and much eroded by extinction, which reduces the number of descendants, four, regarded as optimum for a burst of evolution.
One might argue that, with only one to four possible descendant species, the numbers of descendant species over time might fill up randomly in four nearly equal groups. This is exactly as hypothesized. The rule of four may be explained by random occupation of descendant niches that are limited in number by some environmental restriction such as crowding or competition. This will impress on a large taxon a fundamental quadratic pattern at every level, given time, and is apparently also true in some way for the number of taxonomic trait changes allowable by natural selection per speciation event.
In sum, the effect of extinction is gradual on immediate descendants, but the addition of secondary descendants changes a graph of extinction to logarithmic.

3.8. Comparison of Summed Evolutionary Actors per Species

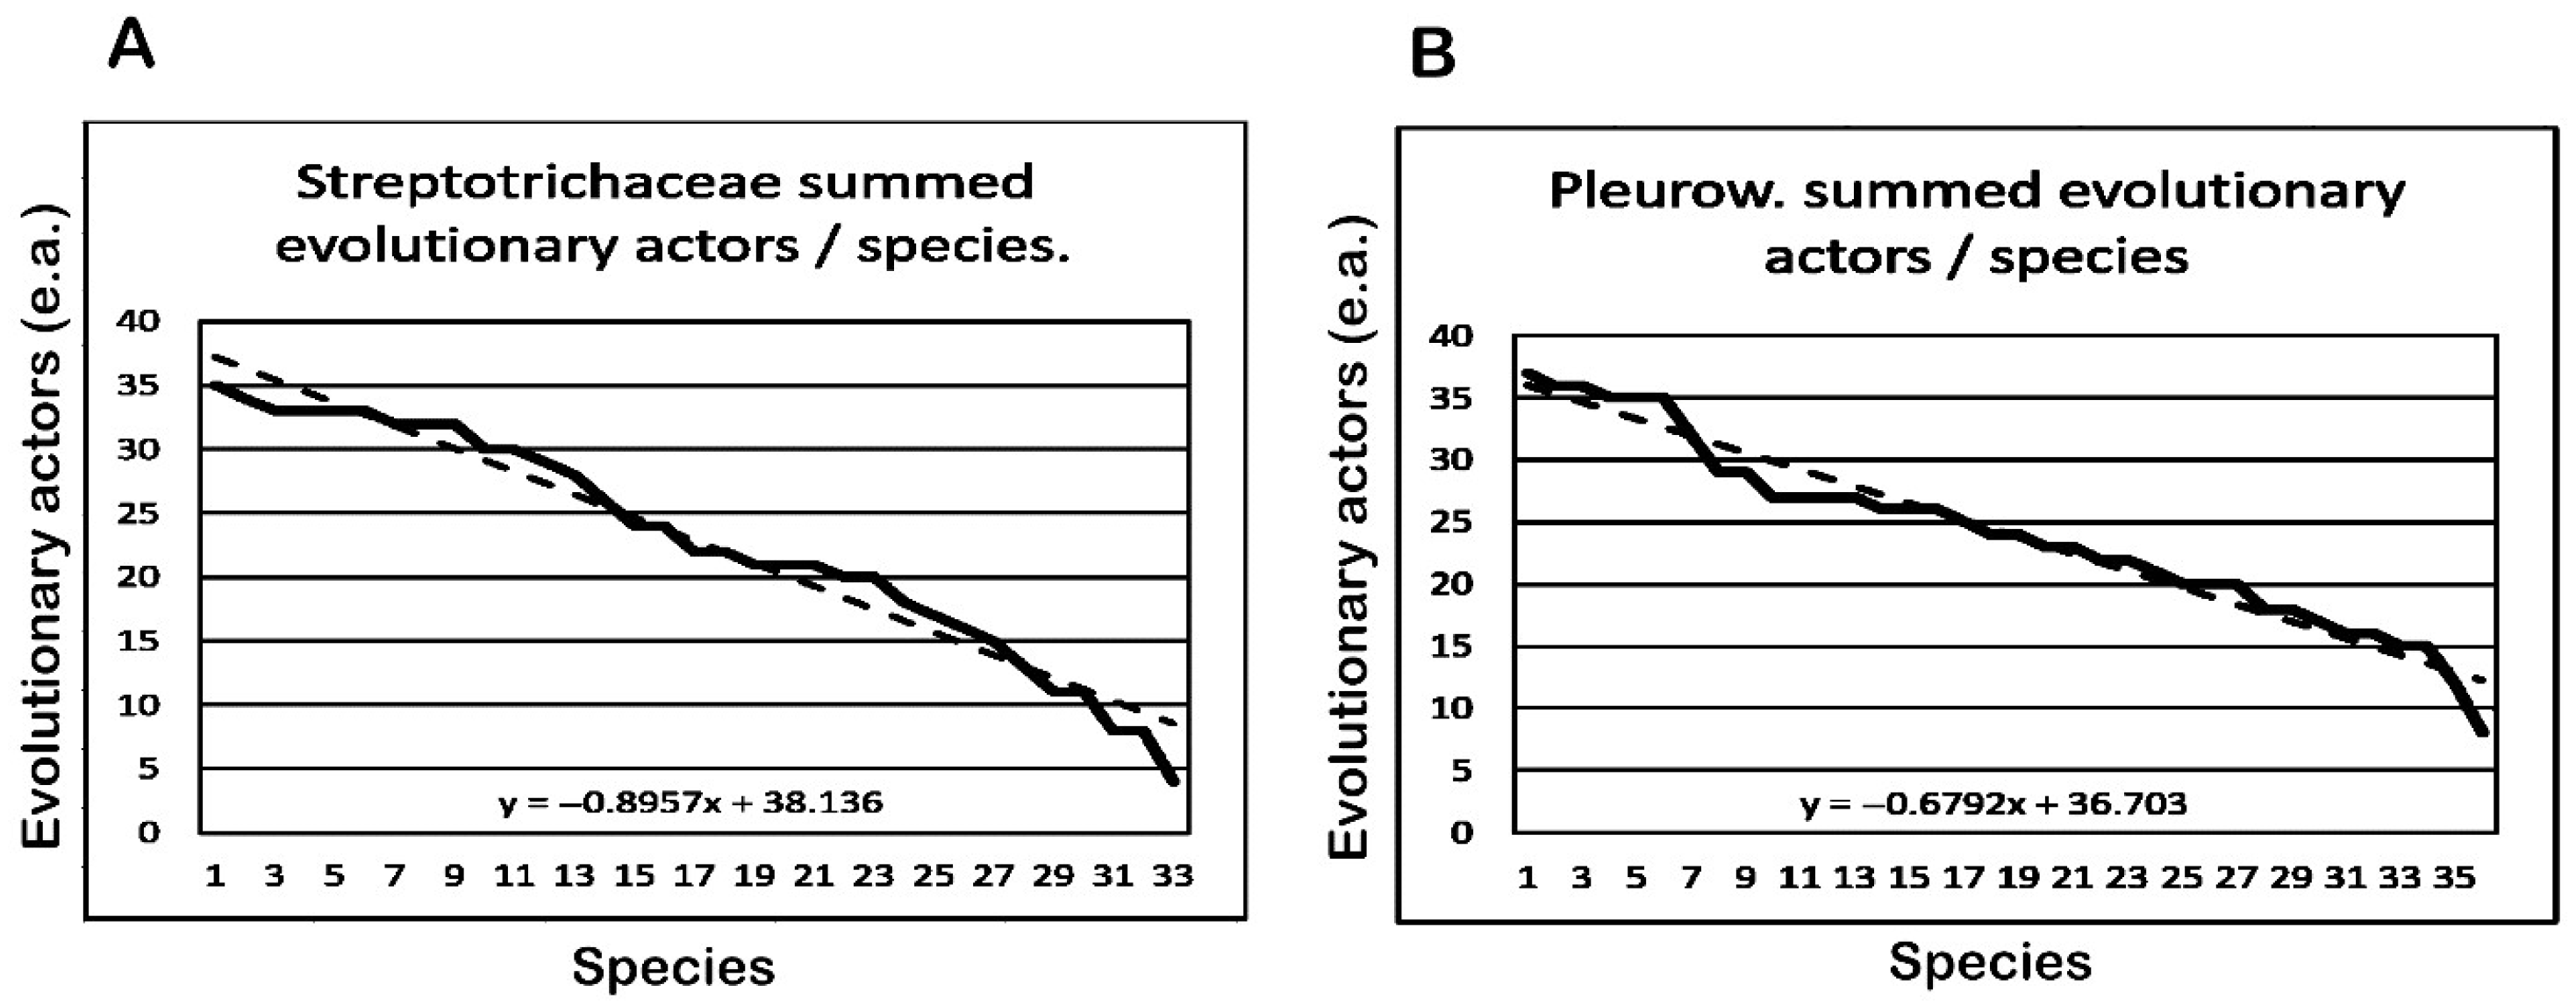
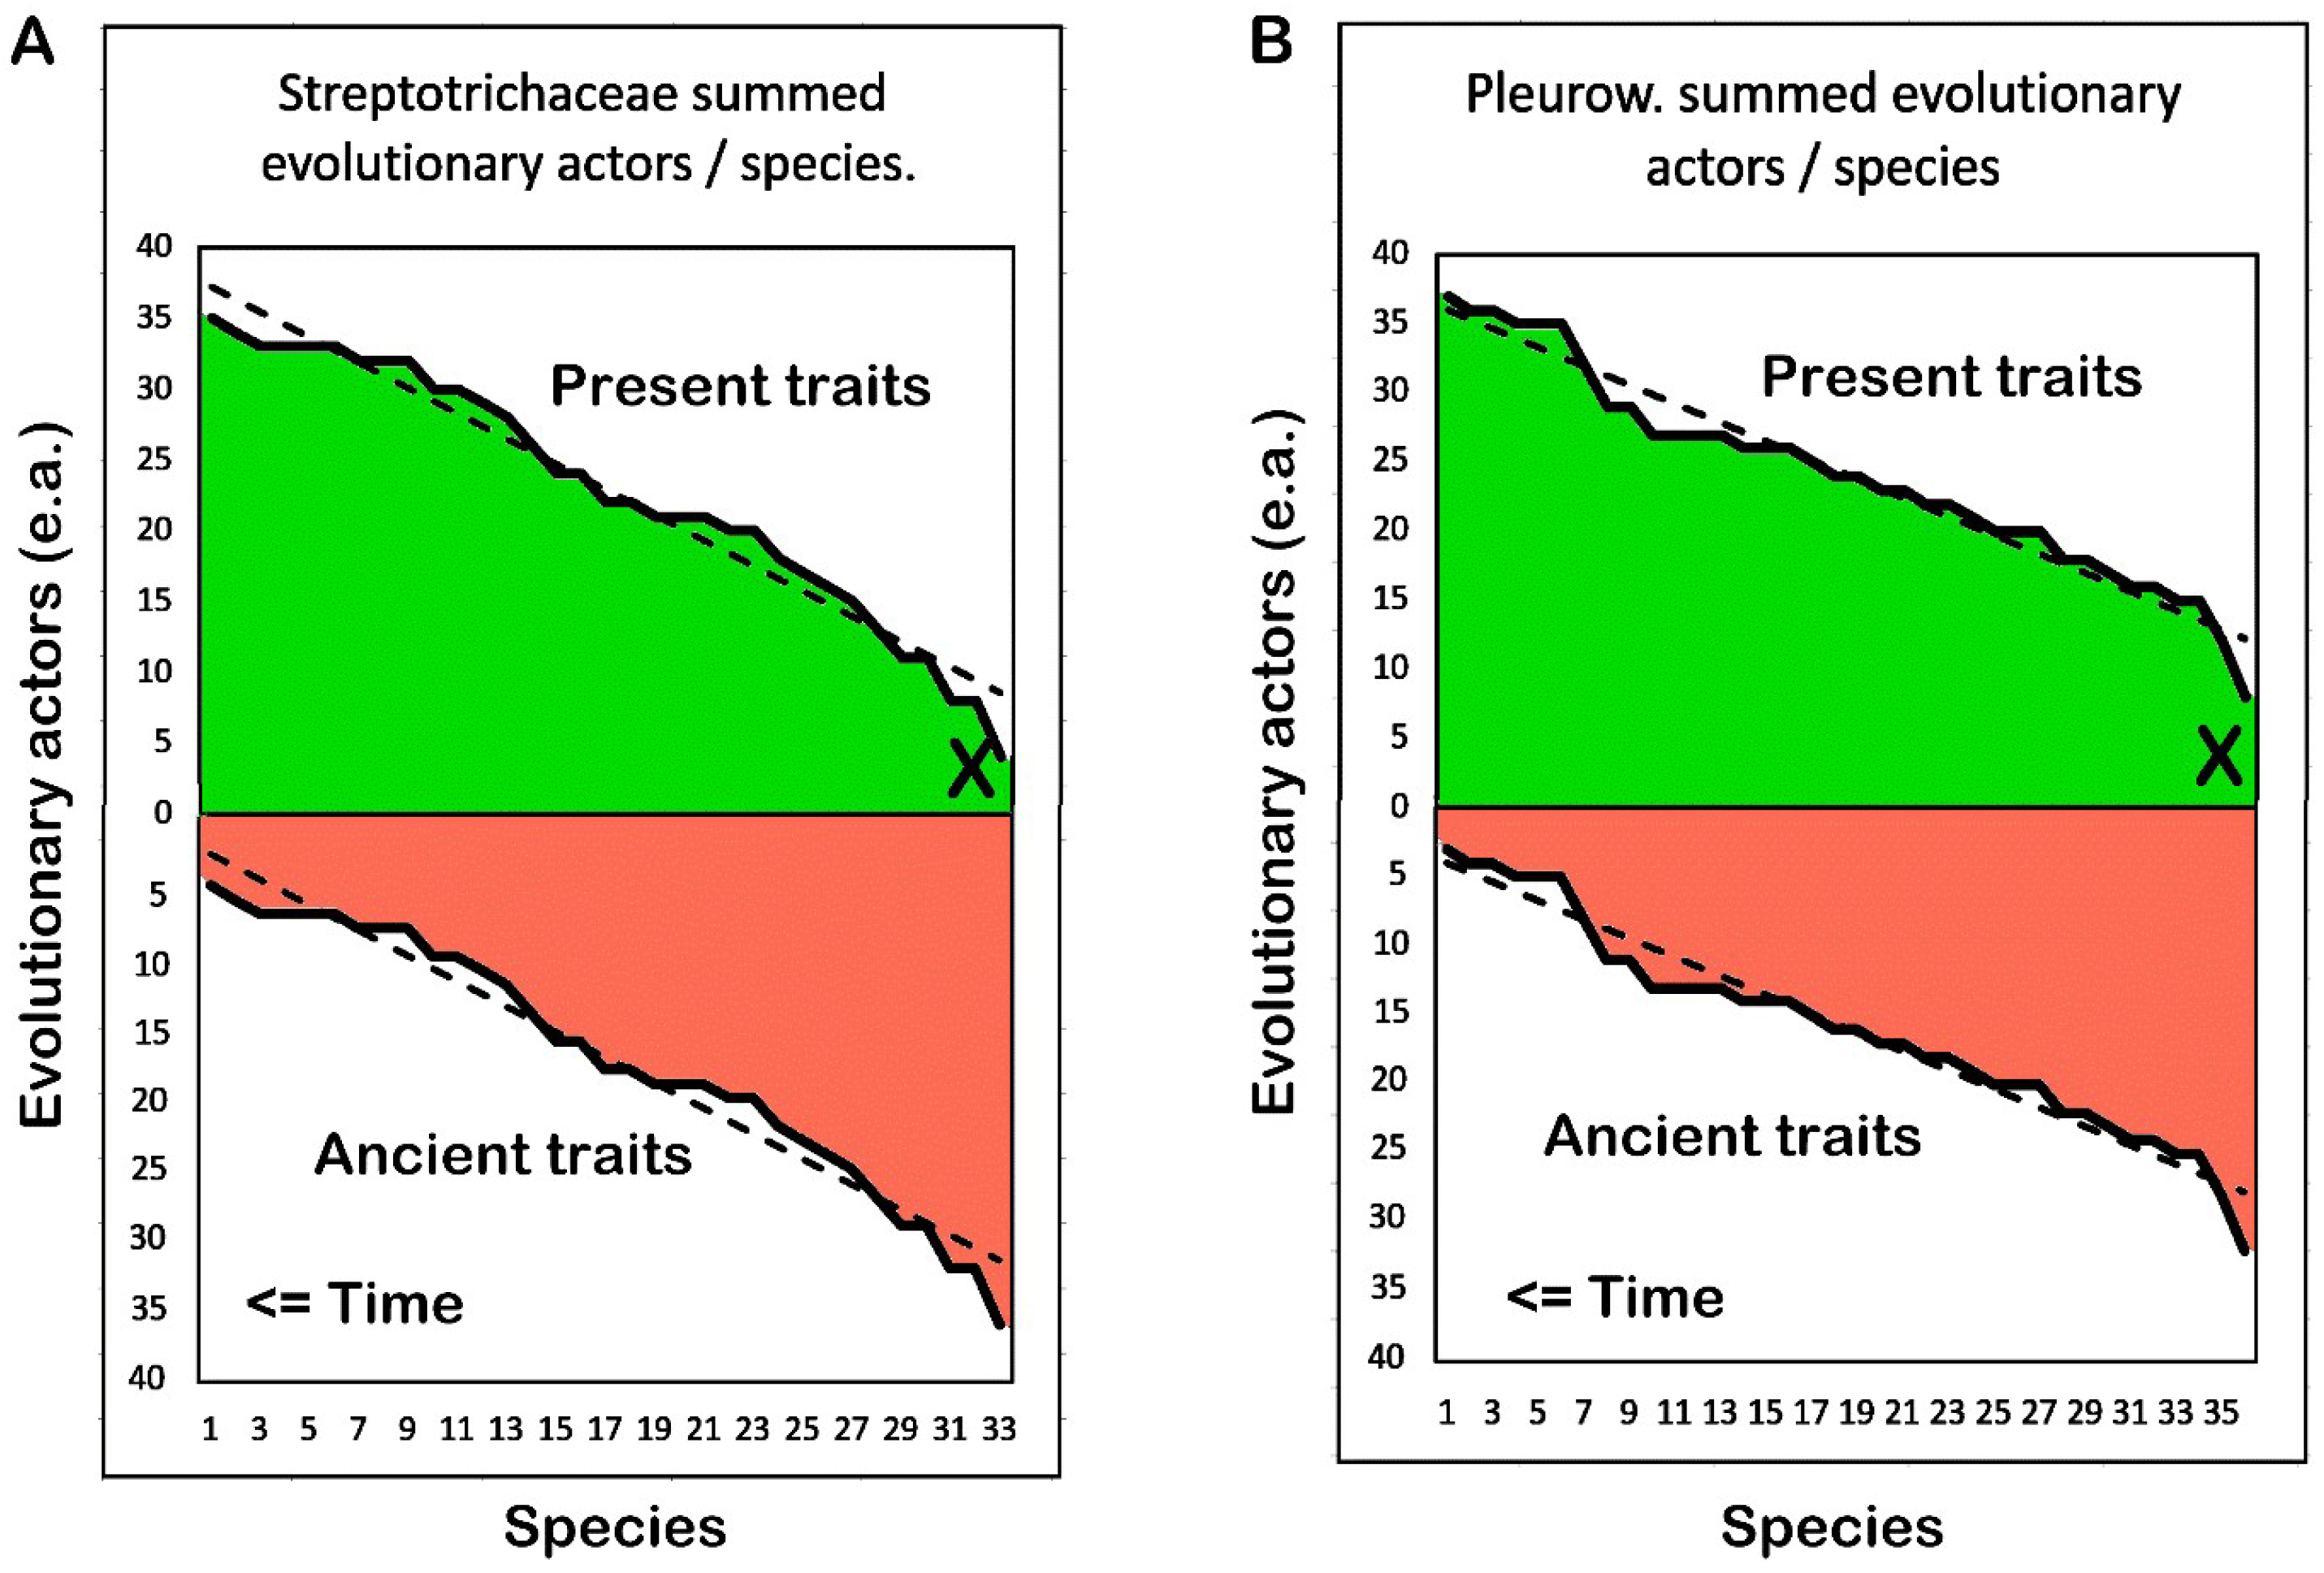
The summed evolutionary actors per species give totalized momentum, a measure that is equivalent to evolutionary force, mass times acceleration. These values are compared for the two groups in Figure 6. The trendlines inserted by the Excel spreadsheet are linear, not logarithmic. The Excel spreadsheet offered an equation for the Streptotrichaceae trendline (Figure 6A), which was integrated using Desmos graphing software, ver. 7.37.0:
f x =   0.8957 x + 38.136
1 33 f x d x   =   773.0912
The integral of the trendline, 733, well matches the actual summed traits, 756, and therefore is an approximation of total evolutionary force F of the Streptotrichaceae. The sharp downturn at the lower end of both graphs is where too low an estimate was made of the number of species in the inferred basal extinct genera.
The Pleuroweisieae trendline was integrated, yielding 884, which likewise nearly matched the summed e.a. of 869 for total evolutionary force of the Pleuroweisieae:
f x =   0.6792 x + 36.703
1 36 f x   d x   =   884.823
The graphs (Figure 6) are devised with species on the x-axis and evolutionary actors on the y-axis. The evolutionary force of all the species in a caulogram, or mass times acceleration, is the sum of all evolutionary actors in the caulogram. The linear slope for summed evolutionary actors per species for both Streptotrichaceae and Pleuroweisieae implies that a morphological clock is at work, such that the numbers of evolutionary actors generated in different branches of the caulogram are apparently of about the same number per speciation event and this balance is preserved by gradual extinction over time.
The steeper slope of Streptotrichaceae is due to the fewer traits involved in extinction over the time of the caulogram. Likewise, the less steep slope of the graph of Pleuroweisieae implies that this group is losing numbers of evolutionary actors less rapidly than Streptotrichaceae, perhaps because the former taxon is more settled in ideal and long-lasting niches than the latter. These Pleuroweisieae-friendly niches are associated with moisture-laden air and waterfalls, and would certainly be refuges for this ancient group during the temperature maximum of the Paleocene–Eocene boundary of ca. 55 mya, which followed the bolide catastrophe at the end of the Cretaceous (the K-Pg or Cretaceous–Paleogene boundary) about 66 mya.

3.9. Combined Streptotrichaceae and Pleuroweisieae Data

The combined and sorted data sets (Figure 7A,B) for Streptotrichaceae and Pleuroweisieae of species per genus and traits per species are simply elongate versions of the separate graphs (Figure 6). The hollow curves are preserved. The combined data set of summed evolutionary actors (Figure 7C) is instructive. The slope is, understandably, less steep than those of the groups separately, and the integral for the trendline slope is about double that of either group, namely about 1601, or doubling the resilience measure of either group separately. What this demonstrates is that groups adaptively act synergistically to promote the survival of the biosphere. The Desmos graphing software calculations are as follows:
f x =   0.3944 x + 37.356  
1 69 f x d x   =   1601.536
The restriction on the number of new traits in any one descendant results in a flattening of the slope of evolutionary force for a large number of families, and perhaps is a source of homeostasis [63] for the biosphere. Simulating larger data sets, the combined set was duplicated twice and added to make a set three times as big. The slope was y = –0.1315x + 37.222, or ca. –0.13. Additional duplication made an even larger set nine times as big, which had a slope of y = –0.0438x + 37.178, or ca. –0.05. The slopes were shallower in larger data sets because while the x-axis elongated by numbers of species, the y-axis stays much the same, particularly in maximum values at around 35 summed e.a. per species. The accumulated evolutionary actors of many families together with the constraint of numbers of new traits per new species, then, increases evolutionary force rapidly and the slope tends to zero. This implies that evolutionary resilience becomes stronger [64] over time by dint of the whole biosphere generating a broadly distributed stability active at the supra-generic level. (Shades of Gaia!) The graphs of Figure 7 reveal how the biosphere increases in diversity of species and their traits over time, species by a logarithmic curve and traits linearly. Informationally, both the species as an integral morphological set and an instruction set of character states are required to clarify the press of their evolutionary footprint.

3.10. Streptotrichaceae and Pleuroweisieae Through 220 MY

The graphs of Figure 6 have the area of summed evolutionary actors duplicated in green color in Figure 8. On the projection, this area is extended back through time fairly equally for every species, and is graphed in red color. This hypothesizes that all species have about the same numbers of summed e.a. for as long as there is no change in the substance of evolutionary mass, that is, the number and kind of characters that are variable in the group.
As classical mechanics deals with changes in position, the position of the character set undergoing change is equivalent to one progenitor species with divergent descendants, or, more fundamentally, the species at the base of the caulogram shared by all descendant species against which their velocity is calculated. That evolutionary position is restricted to known or inferable species and is marked as an X at the right end of the graph slope colored green in Figure 8. There is another important position, namely the base of the inferred evolutionary actors colored red contributing to the older extant species, representing an unknown taxon far in the past that underwent a major change in the set of characters represented in the caulogram and equivalent to evolutionary mass as an unchanging constant for the caulogram.
Both graphs (Figure 8) show the extant groups as green triangles lying on their sides. This is reminiscent of the “tadpole” diagrams of caulogram shape discussed and illustrated by Zander [9,33]. The similarity of the two figures implies that similar processes are acting on these two taxonomically and ecologically different groups related by sharing similar character sets each of about the same numbers and kinds of characters. It is unknown whether these processes are part of the biological/genetic make-up of the taxa or are imposed by some world-wide control, or are a combination of the two. Although many biological processes have chaotic results, one can suggest that this is an emergent phenomenon associated with complexity theory. Evolution seems to have a shape when graphed [65]. The graphs in Figure 8 are similar to the plot of simulated neutralist originations and extinctions through geologic time based on clade shape by [66], which indicate no effect of major extinctions due to stochastic variation. If there is no stochastic effect on evolutionary diversity and none in my empirical data by environmental pressures, then innate evolutionary force may be that which provides coherence and stability over time.
In Figure 9, the proportion of traits apparently useful for survival increases for more recent extant ancient species. These traits are preserved throughout the evolutionary tree by having been gifted intact to perhaps four descendant species, and thence to all or most new descendant species in the caulogram. Fewer inferred ancient, unused traits show up as red higher (left) in the caulogram (e.a. are summed along the caulon for each species, thus, the green slope reaches highest when most distant in the caulogram from the origination (marked with an X). Of significance is that the two groups combine evenly, with no evidence of incompatibility of the data or processes generating the data. This scenario is similar to the graphic exploration of multiple-burst models in biological diversification [67].

4. Discussion

With comparison of Table 1, Table 2 and Table 3, one is immediately struck by the similarity of data and the sustainability processes implied in their generation across two major groups of mosses of much the same size. There are 13 genera and 33 species, extant and inferred, in Streptotrichaceae, and 11 genera and 35 species in Pleuroweisieae. In spite of the shallowness of the time interval of the latter group, only three caulon units deep, compared to the five-caulon depth of Streptotrichaceae, the two groups have similar resilience measures (F). Streptotrichaceae has a total set of 213 evolutionary actors at the genus level, and 756 at the species level (Table 3). Pleuroweisieae has a total set of 214 evolutionary actors at the genus level and 869 at the species level. Both groups, the family Streptotrichaceae and Pottiaceae tribe Pleuroweisieae, are widely distributed in the world, and are adapted to different habitats; Streptotrichaceae is generally found in tropical arboreal and high elevation soil and rock habitats, while Pleuroweisieae is hygrophytic on rock and soil in temperate areas. If it is generally found that groups of similar size have similar F values, then the result of evolutionary forces, e.g., natural selection, minimax solutions or Nash equilibria, is probably globally much the same whatever ecological situations are addressed by natural processes.
Inferred extinction rates are also similar. The graphs in Figure 6 portray the number of evolutionary actors (e.a.) for each species summed along their caulons in the two models, listed in order from greatest to least number of new traits. The data are taken from the spreadsheets of Table 1 and Table 2. Both demonstrate a linear fall-off of numbers of apparently adaptive traits (e.a.) among all species. Extinction, as exhibited by the moss groups Streptotrichaceae and Pottiaceae tribe Pleuroweisieae, is not affected by major extinction events across 110 my. There is no major change in e.a. per species that may be attributed to events at the boundary at the end of the Cretaceous 66 mya or the massive increase in biological diversity 10 to 100 mya [67]. In other words, the evolutionary pressures on each group are about equally effective or non-effective at least to the Paleocene–Eocene temperature maximum of 55 mya.
Using Excel trendlines as best-fitting curves to interpret data is a valuable technique. For the uninitiated, the formulae generated by Excel are at first opaque. Natural processes can produce hollow curves that can be described as logarithmic or power (or linear) in Excel trendline analysis. A dotted line is generated alongside your data curve, and you chose which kind of curve best fits. A logarithmic formula such as Equation (7) describes a curve where a value on the x-axis is an exponent of some number (e in natural logarithms), and where −a is a constant that increases value on the y-axis, and c increases equally on x- and y-axes. The minus sign flips the standard logarithmic increase to a decreasing curve to the right. In other words, ln(x) is the shape of the curve, and the constants move the curve around.
y = a ln x + c
For power law formulae, such as Equation (8), the shape of the curve is determined by b, the exponent of x, while a, a constant in the numerator, moves the curve upwards along both the y- and x-axis. Comparing curves generated with an Excel spreadsheet can be achieved with Desmos graphing software. Power law curves characteristically rise higher along the y-axis for low values of x than do exponential curves, and are said to have fatter asymptotes. Some curves are apparently a mixture of the two curve characterizations, however.
y = a x b
What sustaining processes may drive the similarity of analytic results given here? One might hypothesize some internal governor, but it is quite possible that complexity-based processes of the environment operate akin to a computer using genetic algorithms to solve mathematical proofs resistant to standard formulaic attack. For instance, an environmental minimax solution [68] is the restriction to about four descendant species per microgenus (minimally monophyletic group) that fits genus size to available habitat with least cost in competition. Or, there may be a Nash equilibrium solution [69,70] encouraging fitting descendant species into specialized niches that succeed in preservation of the entire family or tribe over environmental change across geologic time while discouraging concentration of all genetic potential in one robust generalist species that may fail totally with some catastrophe. Natural selection is fundamentally not an orthogenetic canalizing guide but operates decisively by generating the natural rules for evolutionary GARP (genetic algorithms for rule production [71]).
The driver of macroevolutionary biodiversity [72] has been reduced to a dichotomy between life processes and environmental effects, hence the metaphor of Red Queen versus Court Jester [73,74]. The present paper suggests the former operates at the genus level and the latter at the species level.

4.1. Inferred Speciation over 220 MY

The Permian–Triassic extinction [75,76] was about 252 mya, and was the largest such event. There is evidence that plant life was much affected [77]. The present model of speciation and extinction, based on extant and a few inferred extinct progenitors that can be characterized, extends back into mid-Cretaceous, 110 mya. Given that the rates of speciation and extinction appear much the same across taxonomic units, it is quite possible that the same model is valid for the ancestral lineages. These may date back an equal amount of time based on the fairly constant length of estimated summed evolutionary actors in each extant species (Figure 8). It might be that the Permian–Triassic extinction event that significantly impacted plant life [77,78] greatly modified the character set of the progenitor(s) of the present-day Streptotrichaceae and Pleuroweisieae, and that for the past 252 mya, these large taxa moved their species through time in some integrated fashion but quite different in appearance and perhaps ecology from that of progenitors in pre-Permian/Triassic times. It may be that a caulogram is a convex polygon in a simplex problem in linear programming. Given no large discontinuities in the caulograms above, they may be considered simplex–convex, and thus are part of a similarly coherent tree of life at least back to the Permian–Triassic event. The use of this method in applied mathematics in evolutionary study needs detailed examination.

4.2. Heuristic Parallels

The formulae in physics used for processes in nature certainly have parallels with evolutionary processes, but, of course, the analogies are not exact or entirely apposite. Mass as a physical characteristic is not the same as evolutionary mass as a stable set of characters. Physical velocity as distance over time is not the same as newly evolved traits per speciation event. Physical force is not resilience. Yet, at least for comparison purposes, these elements of classical mechanics treated as evolutionary units allow the results of similar process to be measured, compared and hypotheses of causality made. There are further leaps of analogy possible. For instance, the different evolutionary accelerations of most species that seem to tear taxa apart are analogic to the expansion of the universe, yet such biological forces ensure exploration of specialized niches that contribute to survival. The conservation of characters and of traits (states of characters) is somewhat reminiscent of conservation of momentum and energy in physics. Such conservation may contribute to the survival of the larger group; characters (as vehicles of state changes) are added or abandoned only with major changes at high taxonomic level, while characters states, given duplication of the new traits of the ancestral species in every descendant, are seldom lost but survive somewhere in the greater caulogram [79]. Processes may differ, but emergent results are significantly parallel.

4.3. Why Not Use Molecular Techniques?

There are several reasons that the present analytic method is called “high-resolution phylogenetics.” (1) It uses a descent with modification model rather than shared ancestry, making use of extant ancestral species at nodes in a multiple-branching tree demonstrated to be closely related by a small number of traits by second-order Markov chain modeling. Cladistic analysis models evolutionary trees without designating any extant species as ancestral, even though Van Valen [73] long ago pointed out that there are many such. My own analysis based on outgroup and ingroup comparisons indicates that about half the species involved in a study are progenitors of at least one other species [8]. Molecular analyses do poorly in identifying extant shared ancestors. Clades and structural monophyly are entirely different concepts and are difficult to compare, but evolution is such a powerfully effective process that molecular trees at least approximate reasonable clustering of taxa, and are plausible, but here considered of low-resolution.
(2) Because there may be extant molecular strains of an ancestral species with phylogenetically informative sequences identical to each descendant species, sampling only one of these molecular doppelgangers gives any clade only 20% chance of being monophyletic. When sampling is sufficient to identify such doppelgangers, the apophyly–paraphyly pair actually helps identify descendant–ancestral species pairs, but adequate data are rare in sparsely populated molecular cladograms. The distance between doppelgangers on a molecular cladogram [80] is in line with and supportive of the estimate of an optimal four morpho-descendants per morpho-progenitor.
(3) Using descent with modification as an analytical method led to recognition of minimally monophyletic groups and more exact modeling of shared ancestry. Taxonomic categories of species and genus are paramount in evolutionary analysis, while cladistics has no defensible concept of genus [81,82] or even species [83].
(4) Total evidence requires comparison of models from both morphological and molecular data. Simply mapping morphological traits to a molecular tree ducks the fact that morphological data can produce well-supported Bayesian trees that may differ from the molecular trees. Although morphological data has been deprecated [84,85] for rampant homoplasy and poor homology assessment, the accuracy of second-order Markov chain analysis in determining extant ancestral species in most cases resolves monophyly well. Modeling evolution with morphological traits produces an informationally direct and accurate tree. To achieve such, one must do actual taxonomy using standard techniques with as many samples to establish variability of data. This is opposed to running sparse molecular data through a black box of deeply complex statistical modeling, with a dichotomous tree concept dating back to phenotypic cluster analysis that ignores the presence of extant ancestral species.
(5) The present study has postulated a few extinct taxa, genera and species, that serve to most parsimoniously connect lineages and account for overmuch (twice) the number of traits between two species. Cladists either cannot or will not make such hypotheses, even as they postulate an unknown extinct shared ancestor for most species. The most egregious example is continued refusal to entertain the existence of an orangutan-like extinct immediate shared ancestor of hominins and chimpanzees-gorillas, which would explain (a) Schwartz’s [86] finding of strong evidence for an orangutan morphotype as immediate ancestor to the hominins, and (b) the isolation of the East Indian population of orangutans as representing an ancient molecular strain basal to the rest of the great apes. By any codification of logic, one must seriously consider the necessary existence of an extinct African orangutan.

5. Conclusions

This paper presents evolutionary processes in terms of classical mechanics. Physical mass = kilograms; evolutionary mass = a widely applicable (constant) character set represented by any one species (spp). Velocity = distance per unit time; evolutionary velocity = e.a. per speciation event. Acceleration = change in velocity per unit time; evolutionary acceleration is summed e.a. on a caulon per unit time. Momentum = mass × velocity; or evolutionary momentum = total numbers of species × e.a. per unit time. Force = mass × acceleration; or evolutionary force = total numbers of species × average e.a. per unit time, or simply summed e.a. for all species on a caulon or caulogram. There are other basic concepts in classical mechanics that may have value in future studies: kinetic and potential energy, impetus, power, work, or even presentation as a metric in phase space [87,88]. A major finding of this analysis is that rates of evolution are similar across at least structurally monophyletic groups, as opposed to the rather disparate rates advanced by other authors in the past (see arguments [89,90]). The present empirical data show that evolution is probably anagenetic, so at least not entirely random walk (neutralist) [91,92,93].
Although the common ancestor of mosses and liverworts occurred ca. 42–447 mya [43], a jump in diversification happened near mid-Cretaceous. The average crown age of orders is 150 mya, and of families is 98 mya. The crown age of the Pottiaceae is 115–150 mya. The present paper is in consonance with these estimates and further suggests that the Streptotrichaceae (a segregate of the Pottiaceae) arose with the collapse and reorganization of its central character set after the Permian–Triassic catastrophe ca. 250 mya, and the Pleuroweisieae arose with the collapse and reorganization of its central character set but with additional truncation near the Paleocene–Eocene thermal maximum ca. 55 mya.
Evolutionary stability is the extent to which a taxon remains much the same over geological time, while resilience is the extent to which it recovers from environmental distresses; both contribute to sustainability. Unless secondary speciation in microgenera is a symptom of robust recovery, the linear expression of extinction indicates that resilience is as strong as stability over time for these two groups. The only exception is the fact that both groups have origins associated with different global environmental upheavals. For the Pleuroweisieae, there probably was an ancestral Pottiaceae tribe of its origin, thus it has proven resilient. For the Streptotrichaceae, some earlier element in the Pottiaceae, which originated earlier in geological time, doubtless was its ancestor. The ancient taxon Timmiella might represent that earlier group. This assumes that “stability” follows a total make-over of the basic character set, while that which is mostly expected from taxonomic resilience is a phoenix-like rebirth of the same taxon following a curtailment.
The closest to this curtailment in the present groups would be surviving the crushing together of species by areal environmental restrictions associated with the Paleocene–Eocene thermal maximum (cool hydrological refugia) and Pleistocene glaciations (ice-free areas) that exacerbated competition. Such are, in areal effect, quite unlike the global effect on atmosphere of bolide or volcanic catastrophes. An aggregate number of periodic pulsations in an available habitat might explain the gradual extinction of immediate descendants. The word “resilience” is thus chosen for this paper to stand for the robust survival of these two groups over millions of years.
It is impressive to note the extent of the evolutionary force (summed evolutionary actors) of the Streptotrichaceae and Pleuroweisieae, developed over millions of years. Translated into physical energy, such force easily transforms the Earth. Darwinian evolution is a central contributor to the processes associated with the Gaia hypothesis [94,95] that attributes self-regulation and homeostasis in sustaining an integrated, long-lasting unity to the biosphere. Assuming a weak Gaia hypothesis (non-teleological), one can envision a planet-level natural selection. The anthropic principle, that such is just luck, is less convincing in that chance of total collapse has been avoided for at least 250 million years since the Permian–Triassic catastrophe. What better example of synergy and co-evolution with the environment is the naturally originated existence of minimally monophyletic groups that contribute descendants with a modicum of wholly new traits balanced by retention of the ancestral species’ new traits, all through a Darwinian process? The biosphere-level homeostatic mechanism of differential persistence in fractal genera (one ancestor generates optimally four descendants that add up to a group of five monothetic species) may be a complexity-based emergent process acting effectively at a higher scale than more standard processes of natural selection or neutralist fixation at the gene level [96].
The theory of self-replicating machines is a foundational problem in mathematics [97]. Von Neumann [98] demonstrated that for a machine to create another one of itself, two acts of creation are needed, one to make the new copy and a second to make the description or instructions for making a new copy, the last because the description is always informationally larger than the object described (as per Gödel). For the biological replicative basis of caulograms, the instructions that are copied are the genetic code for species duplication and the immediate ancestron (new traits of the progenitor) for genus duplication. Mutation and natural selection by competition and environmental variation keep both self-replicating robots and living organisms from over-whelming a place with a single type. The mathematical details may be fully applicable at the genus level.
I encourage those with expertise in morphologically based taxonomy to consider using the techniques of high-resolution phylogenetics on their groups of specialization. Genes are optional, and the math is easy to do and understand. Is your larger taxon amenable to restructuring as a set of minimally monophyletic groups? Do the progenitors concatenated on caulons reveal the taxon’s depth in geological time? Do the numbers of new traits per speciation event summed on the caulon reach back to the K-Pg or the Paleocene-Eocene boundary or even that of the Permian–Triassic? Is there evidence of a deep quadratic structure in the record of extinction of species per genus? Are the microgenus progenitors that are identifiable with second-order Markov analysis (they being similar to outgroup and generalist to ingroup) the same as those indicated by molecular apophyly–paraphyly data, if available from molecular study?

Funding

This research received no external funding.

Data Availability Statement

All data are either in the manuscript or in the cited references.

Acknowledgments

The Missouri Botanical Garden is saluted for its continued support of bryophyte systematics.

Conflicts of Interest

The author declares no conflicts of interest.

References

  1. Currie, D.J. Energy and large-scale patterns of animal- and plant-species richness. Am. Nat. 1991, 137, 27–49. [Google Scholar] [CrossRef]
  2. Fagenblat, M.; De Meester, L.; Urban, M.C. Dispersal evolution alters evolution-mediated priority effects in a metacommunity. Philos. Trans. R. Soc. B Biol. Sci. 2024, 379, 20230129. [Google Scholar] [CrossRef]
  3. Lynch, M. Methods for the analysis of comparative data in evolutionary biology. Evolution 1991, 45, 1065–1080. [Google Scholar] [CrossRef] [PubMed]
  4. Watts, A.A.; Birks, H.J.B.; Willis, K.J.; Birks, H.H. What drives biodiversity patterns? Using long-term environmental datasets to understand recent biodiversity trends. J. Ecol. 2020, 108, 1365–2745. [Google Scholar]
  5. Willig, M.R.; Kaufman, D.M.; Stevens, R.D. Latitudinal gradients of biodiversity: Pattern, process, scale, and synthesis. Ann. Rev. Ecol. Evol. Syst. 2003, 34, 273–309. [Google Scholar] [CrossRef]
  6. Lai, J.; Ye, M.; Hou, M.; Zhang, A.; Wang, G.; Mao, L. Evaluating the relative importance of phylogeny and predictors in phylogenetic generalized linear models using the phylolm.hp R package. Plant Divers. 2025; in press. [Google Scholar] [CrossRef]
  7. Uyeda, J.C.; Zenil-Ferguson, R.; Pennell, M.W. Rethinking phylogenetic comparative methods. Syst. Biol. 2018, 67, 1091–1109. [Google Scholar] [CrossRef]
  8. Zander, R.H. Fractal Evolution, Complexity and Systematics; Zetetic Publications: St. Louis, MO, USA, 2023. [Google Scholar]
  9. Zander, R.H. Integrative systematics with structural monophyly and ancestral signatures: Chionoloma (Bryophyta). Acad. Biol. 2024, 2, 1–14. [Google Scholar] [CrossRef]
  10. Camp, W.H. The concept of genus: V. Our changing generic concepts. Bull. Torrey Bot. Club 1940, 67, 381–389. [Google Scholar] [CrossRef]
  11. Humphreys, A.; Linder, H.P. Concept versus data in delimitation of plant genera. Taxon 2009, 58, 1054–1074. [Google Scholar] [CrossRef]
  12. Malik, V. The genus: A natural or arbitrary entity. Plant Arch. 2017, 17, 251–257. [Google Scholar]
  13. Gingerich, P.D. Rates of evolution on the time scale of the evolutionary process. Genetica 2001, 112–113, 127–144. [Google Scholar] [CrossRef]
  14. Haldane, J.B.S. Suggestions as to quantitative measurement of rates of evolution. Evolution 1949, 3, 51–56. [Google Scholar] [CrossRef] [PubMed]
  15. Lynch, M.; Lande, R. Evolution and extinction in response to environmental change. Evol. Ecol. 1993, 7, 318–339. [Google Scholar]
  16. Moutinho, M.; Amorim, M.; Campos, P. Gene expression and the rate of adaptive and nonadaptive evolution. Genome Biol. Evol. 2019, 11, 522–532. [Google Scholar]
  17. Ogburn, N.D.; Edwards, E.J. Rates of morphological evolution are heterogeneous in Early Cretaceous angiosperms. Proc. Roy. Soc. B Biol. Sci. 2016, 283, 20160214. [Google Scholar]
  18. Rabosky, D.L.; Santini, F.; Eastman, J.; Smith, S.A.; Sidlauskas, B.; Chang, J.; Alfaro, M.E. Rates of speciation and morphological evolution are correlated across the largest vertebrate radiation. Nat. Comm. 2013, 4, 1958. [Google Scholar] [CrossRef] [PubMed]
  19. Sanderson, M.J. Estimating absolute rates of molecular evolution and divergence times: A penalized likelihood approach. Mol. Biol. Evol. 2002, 19, 101–109. [Google Scholar] [CrossRef]
  20. Wicke, S.; Müller, K.F.; de Pamphilis, C.W.; Quandt, D.; Bellot, S.; Schneeweiss, G.M. Mechanistic model of evolutionary rate variation en route to a nonphotosynthetic lifestyle in plants. Proc. Nat. Acad. Sci. USA 2016, 113, 9045–9050. [Google Scholar] [CrossRef]
  21. Evans, K.L.; Gaston, K.J. Can the evolutionary-rates hypothesis explain species–energy relationships? J. Biogeogr. 2005, 19, 899–915. [Google Scholar] [CrossRef]
  22. García-Pintos, L.P. Limits on the evolutionary rates of biological traits. Nat. Sci. Rep. 2024, 14, 11314. [Google Scholar] [CrossRef]
  23. Simpson, G.G. Tempo and Mode in Evolution; Columbia University Press: New York, NY, USA, 1944. [Google Scholar]
  24. Niklas, K. Theoretical evolutionary rates in plant groups and the fossil record. Brittonia 1977, 29, 241–254. [Google Scholar] [CrossRef]
  25. Zander, R.H. Macroevolutionary Systematics of Streptotrichaceae of the Bryophyta and Application to Ecosystem Thermodynamic Stability, 2nd ed.; Zetetic Publications: St. Louis, MO, USA, 2018. [Google Scholar]
  26. Zander, R.H. Genera of the Pottiaceae: Mosses of harsh environments. Bull. Buffalo Soc. Nat. Sci. 1993, 32, 216. [Google Scholar]
  27. Zander, R.H. Evolutionary leverage of dissilient genera of Pleuroweisieae (Pottiaceae) evaluated with Shannon-Turing analysis. Hattoria 2021, 12, 9–25. [Google Scholar]
  28. Alonso, M.; Jiménez, J.A.; Cano, M.J. Taxonomic revision of Chionoloma (Pottiaceae, Bryophyta). Ann. Mo. Bot. Gard. 2019, 104, 563–632. [Google Scholar] [CrossRef]
  29. Köckinger, H.; Kučera, J. Hymenostylium xerophilum, sp. nov., and H. gracillimum, comb. nov., two neglected European mosses and their molecular affinities. J. Bryol. 2011, 33, 195–209. [Google Scholar]
  30. Kučera, J.; Košnar, J.; Werner, O. Partial generic revision of Barbula (Musci: Pottiaceae): Re-establishment of Hydrogonium and Streblotrichum, and the new genus Gymnobarbula. Taxon 2013, 62, 21–39. [Google Scholar] [CrossRef]
  31. Werner, O.; Ros, R.M.; Grundmann, M. Molecular phylogeny of Trichostomoideae (Pottiaceae, Bryophyta) based on nrITS sequence data. Taxon 2005, 54, 361–368. [Google Scholar] [CrossRef]
  32. Zander, R.H. On the origin of taxa. J. Theor. Phys. Math. Res. 2025, 3, 1–20. [Google Scholar] [CrossRef]
  33. Zander, R.H. Lineages of fractal genera comprise the 88-million-year steel evolutionary spine of the Ecosphere. Plants 2024, 13, 1559. [Google Scholar] [CrossRef]
  34. Gavrilets, S.; Losos, J.B. Adaptive radiation: Contrasting theory with data. Science 2009, 323, 732–737. [Google Scholar] [CrossRef]
  35. Quental, L.B.; Marshall, C.R. Diversity dynamics: Molecular and fossil data reveal contrasting patterns of diversification. Philos. Trans. R. Soc. B Biol. Sci. Biol. Sci. 2010, 365, 2537–2545. [Google Scholar]
  36. Hanisch, S.; Eirdosh, D.; González Galli, L.; Hartelt, T.; Pérez, G.; Cupo, B. Understanding agency in evolutionary explanations: An assessment tool for biology education. J. Biol. Educ. 2025, 1–30. [Google Scholar] [CrossRef]
  37. Rosslenbroich, B.; Kümmell, S.; Bembé, B. Agency as an inherent property of living organisms. Biol. Theory 2024, 19, 224–236. [Google Scholar] [CrossRef]
  38. Nei, M.; Kumar, S. Molecular Evolution and Phylogenetics; Oxford University Press: New York, NY, USA, 2000. [Google Scholar]
  39. Diaz, L.F.H.; Harmon, L.J.; Sugawara, M.T.C.; Miller, E.T.; Pennell, M.W. Macroevolutionary diversiication rates show time dependency. Proc. Natl. Acad. Sci. USA 2019, 116, 7403–7408. [Google Scholar] [CrossRef]
  40. Lovejoy, S.; Spiridonov, A. The Fractional MacroEvolution Model: A simple quantitative scaling macroevolution model. Paleobiology 2024, 50, 376–400. [Google Scholar] [CrossRef]
  41. Melott, A.L.; Bambach, R.K. Analysis of periodicity of extinction using the 2012 geological timescale. Paleobiology 2014, 40, 177–196. [Google Scholar] [CrossRef] [PubMed]
  42. Rampino, M.R.; Caldeira, K. A 32-million year cycle detected in sea-level fluctuations over the last 545 Myr. Geosci. Front. 2020, 11, 2061–2065. [Google Scholar] [CrossRef]
  43. Bechteler, J.; Peñaloza-Bojacá, G.; Bell, D.; Burleigh, J.G.; McDaniel, S.F.; Davis, E.C.; Sessa, E.B.; Bippus, A.; Cargill, D.C.; Chantanoarrapint, S.; et al. Comprehensive phylogenomic time tree of bryophytes reveals deep relationships and uncovers gene incongruences in the last 500 million years of diversification. Am. J. Bot. 2023, 110, e16249. [Google Scholar] [CrossRef] [PubMed]
  44. Jauregui-Lazo, J.; Brinda, J.C.; GoFlag Consortium; Mishler, B.D. The phylogeny of Syntrichia, an ecologically diverse clade of mosses with an origin in South America. Am. J. Bot. 2023, 110, e16103. [Google Scholar] [CrossRef]
  45. A Rensing, S.; Ick, J.; A Fawcett, J.; Lang, D.; Zimmer, A.; Van de Peer, Y.; Reski, R. An ancient genome duplication contributed to the abundance of metabolic genes in the moss Physcomitrella patens. BMC Evol. Biol. 2007, 7, 130. [Google Scholar] [CrossRef]
  46. Ignatov, M.S.; Maslova, E.V. Fossil mosses, what do they tell us about moss evolution? Bryophyt. Divers. Evol. 2021, 43, 72–97. [Google Scholar] [CrossRef]
  47. Wigner, E.P. The unreasonable effectiveness of mathematics in the natural sciences. Commun. Pure Appl. Math. 1960, 13, 1–14. [Google Scholar] [CrossRef]
  48. Rabosky, D.L.; Adams, D.C. Rates of morphological evolution are correlated with species richness in salamanders. Evolution 2012, 66, 384–398. [Google Scholar] [CrossRef]
  49. Eldredge, N.; Thompson, J.N.; Brakefield, P.M.; Cavrilets, S.; Jablonski, D.; Jackson, J.B.C.; Lenski, R.E.; Lieberman, B.S.; McPeek, M.A.; Miller, W., III. The dynamics of evolutionary stasis. Paleobiology 2005, 31, 133–145. [Google Scholar] [CrossRef]
  50. Hardy, G.H. Mendelian proportions in a mixed population. Science 1908, 28, 49–50. [Google Scholar] [CrossRef] [PubMed]
  51. Rominger, A.J.; Overcast, I.; Krehenwinkel, H.; Gillespie, R.G.; Harte, J.; Hickerson, M.J. Linking evolutionary and ecological theory illuminates non-equilibrium biodiversity. arXiv 2017, arXiv:1705.04725. [Google Scholar] [CrossRef]
  52. Goldbeter, A. Dissipative structures in biological systems: Bistability, oscillations, spatial patterns and waves. Philos. Trans. R. Soc. A Math. Phys. Eng. Sci. 2018, 376, 20170376. [Google Scholar] [CrossRef] [PubMed]
  53. Kondepudi, D.K.; De Bari, B.; Dixon, J.A. Dissipative structures, organisms and evolution. Entropy 2020, 22, 1305. [Google Scholar] [CrossRef]
  54. Nicolis, G.; Prigogine, I. Exploring Complexity: An Introduction; W.H. Freeman and Company: New York, NY, USA, 1989. [Google Scholar]
  55. Erwin, D.H. Extinction as the loss of evolutionary history. Proc. Natl. Acad. Sci. USA 2008, 105, 11453–11457. [Google Scholar] [CrossRef]
  56. Raup, D.M. Extinction: Bad Genes or Bad Luck? WW Norton & Company: New York, NY, USA, 1991. [Google Scholar]
  57. Carroll, S. The Biggest Ideas in the Universe: Space, Time, and Motion; Dutton Press: New York, NY, USA, 2022. [Google Scholar]
  58. Zander, R.H. Minimally monophyletic genera are the cast-iron building blocks of evolution. Ukr. Bot. J. 2024, 81, 87–99. [Google Scholar] [CrossRef]
  59. Zander, R.H. A new rugose-leaved Anoectangium (Pottiaceae) from Mexico. Bryologist 2023, 126, 457–460. [Google Scholar] [CrossRef]
  60. Zander, R.H. Synopsis of Ozobryum (Pottiaceae, Bryophyta), and sequential Bayes evaluation of genus integrity. Ann. Mo. Bot. Gard. 2021, 106, 458–468. [Google Scholar] [CrossRef]
  61. Zander, R.H.; Toren, D.; Eckel, P.M. Gymnostomum aeruginosum, G. calcareum and G. viridulum (Pottiaceae, Bryopsida) in California. J. Bryol. 2007, 29, 27–32. [Google Scholar] [CrossRef]
  62. McPeek, M.A. The macroevolutionary consequences of ecological differences among species. Palaeontaology 2007, 50, 111–129. [Google Scholar] [CrossRef]
  63. Pearse, I.S.; McIntyre, P.; Cacho, N.I.; Strause, S.Y. Fitness homeostasis across an experimental water gradient predicts species’ geographic range and climatic breadth. Ecology 2022, 103, e3827. [Google Scholar] [CrossRef]
  64. Pimm, S.L. The complexity and stability of ecosystems. Nature 1984, 307, 321–326. [Google Scholar] [CrossRef]
  65. Huss, J. The Shape of Evolution: The MBL Model and Clade Shape. In The Paleobiological Revolution: Essays on the Growth of Modern Paleontology; Sepkoski, D., Ruse, M., Eds.; University of Chicago Press: Chicago, IL, USA, 2009; pp. 326–345. [Google Scholar] [CrossRef]
  66. Raup, D.M.; Gould, S.J.; Schopf, T.J.M.; Simberloff, D. Stochastic models of phylogeny and the evolution of diversity. J. Geol. 1973, 81, 525–542. [Google Scholar] [CrossRef]
  67. Uyeda, J.C.; Hansen, T.F.; Arnold, S.J.; Pienaar, J. The million-year wait for macroevolutionary bursts. Proc. Nat. Acad. Sci. USA 2011, 108, 15908–15913. [Google Scholar] [CrossRef] [PubMed]
  68. Grunert, K.; Holden, H.; Jakobsen, E.R.; Stenseth, N.C. Evolutionarily stable strategies in stable and periodically fluctuating populations: The Rosenzweig-MacArthur predator-prey model. Proc. Nat. Acad. Sci. USA 2021, 118, e2017463118. [Google Scholar] [CrossRef] [PubMed]
  69. McKelvey, B. Self-organization, complexity catastrophe, and microstate models at the edge of chaos. In Variations in Organization Science: In Honor of Donald T. Campbell; Baum, J.A.C., McKelvey, B., Eds.; SAGE: Thousand Oaks, CA, USA, 1999; pp. 279–307. [Google Scholar]
  70. Weibull, J.W. Evolutionary Game Theory; MIT Press: Cambridge, MA, USA, 1995. [Google Scholar]
  71. Stockwell, D.R.B.; Peters, D.P. The GARP modelling strategy for species distribution prediction. Ecol. Model. 1999, 114, 1–15. [Google Scholar]
  72. Stauffer, D. Evolutionary ecology in silico: Does mathematical modeling help in understanding ‘generic’ trends? J. Biosci. 2005, 30, 277–287. [Google Scholar] [CrossRef]
  73. Van Valen, L. A new evolutionary law. Evol. Theory 1973, 1, 1–30. [Google Scholar]
  74. Barnosky, A.D. Distinguishing the effects of the Red Queen and Court Jester on Miocene mammal evolution in the northern Rocky Mountains. J. Vertebr. Paleontol. 2001, 21, 172–185. [Google Scholar] [CrossRef]
  75. Bowring, S.A.; Erwin, D.H.; Sozaki, Y. The tempo of mass extinction and recovery: The end-Permian example. Proc. Nat. Acad. Sci. USA 1999, 96, 8827–8828. [Google Scholar] [CrossRef] [PubMed]
  76. Shen, S. The Permian-Triassic extinction event: Causes, consequences and contemporary relevance. Trans. Mater. Biotechnol. Life Sci. 2024, 4, 242–248. [Google Scholar] [CrossRef]
  77. Xu, Z.; Yu, J.; Yin, H.; Merdith, A.S.; Hilton, J.; Allen, B.J.; Gurung, K.; Wignall, P.B.; Dunhill, A.M.; Shen, J.; et al. Early Triassic super-greenhouse climate driven by vegetation collapse. Nat. Commun. 2025, 16, 5400. [Google Scholar] [CrossRef]
  78. Fitz-Palacios, O.; Schneider, H.; Heinrichs, J.; Savolainen, V. Diversification of land plants: Insights from a family-level phylogenetic analysis. BMC Evol. Biol. 2011, 11, 341. [Google Scholar] [CrossRef] [PubMed]
  79. Zander, R.H. Structural monophyly analysis allows estimation of self-sustainability at the supraspecific level over 88 million years in mosses. Sustainability 2025, 17, 3657. [Google Scholar] [CrossRef]
  80. Zander, R.H. Infraspecific molecular trees are associated with serial macroevolution in Pottiaceae (Bryophyta). Ukr. Bot. J. 2019, 76, 390–405. [Google Scholar] [CrossRef]
  81. Stevens, P.F. The genus concept in practice: But for what practice? Kew Bull. 1985, 40, 457–465. [Google Scholar] [CrossRef]
  82. Stevens, P.F. Why do we name organisms? Some reminders from the past. Taxon 2002, 51, 11–26. [Google Scholar] [CrossRef]
  83. Mishler, B.D. What, If Anything, Are Species? CRC Press: Boca Raton, FL, USA, 2021. [Google Scholar]
  84. Flores, J.R.; Suárez, G.M.; Hyvönen, J. Reassessing the role of morphology in bryophyte phylogenetics: Combined data improves phylogenetic inference despite character conflict. Mol. Phyl. Evol. 2020, 143, 10662. [Google Scholar] [CrossRef] [PubMed]
  85. Scotland, R.W.; Olmstead, R.G.; Bennett, J.R. Phylogeny reconstruction: The role of morphology. Syst. Biol. 2003, 52, 539–548. [Google Scholar] [CrossRef]
  86. Schwartz, J.H. Barking up the wrong ape—Austalopiths and the quest for chimpanzee characters in hominid fossils. Colllegium Antropol. 2004, 28 (Suppl. S2), 87–101. [Google Scholar]
  87. Ford, I.J.; Spinney, R.E. Entropy production from stochastic dynamics in discrete full phase space. arXiv 2012, arXiv:1204.4822. [Google Scholar] [CrossRef]
  88. Tomé, T.; de Oliveira, M.J. Stochastic motion in phase space on a surface of constant energy. Phys. Rev. E 2022, 106, 034129. [Google Scholar] [CrossRef]
  89. Gould, S.J. Smooth curve of evolutionary rate: A psychological and mathematical artifact. Science 1984, 226, 994–995. [Google Scholar] [CrossRef] [PubMed]
  90. Gingerich, P.D. Smooth curve of evolutionary rate: A psychological and mathematical artifact—Reply to Gould. Science 1984, 226, 994–996. [Google Scholar] [CrossRef]
  91. Huang, S. The maximum genetic diversity theory: A comprehensive framework for understanding evolutionary processes. BioCosmos 2025, 1, 41–61. [Google Scholar] [CrossRef]
  92. Kopp, M. Speciation and the neutral theory of biodiversity. Bioessays 2010, 32, 564–570. [Google Scholar] [CrossRef] [PubMed]
  93. Roopnarine, P.D. Analysis of rates of evolution. Ann. Rev. Ecol. Syst. 2003, 34, 605–632. [Google Scholar] [CrossRef]
  94. Lenton, T. Gaia Hypothesis. In Encyclopedia of Atmospheric Sciences; Holton, J.R., Ed.; Academic Press: Cambridge, MA, USA, 2003; pp. 815–820. [Google Scholar] [CrossRef]
  95. Lovelock, J.E.; Margulis, L. Atmospheric homeostasis by and for the biosphere: The Gaia Hypothesis. Tellus 1974, 26, 2–10. [Google Scholar] [CrossRef]
  96. Doolittle, W.F. Darwinizing Gaia. J. Theor. Biol. 2017, 434, 11–19. [Google Scholar] [CrossRef] [PubMed]
  97. Odifreddi, P. The Mathematical Century: The 30 Greatest Problems of the Last 100 Years; Princeton University Press: Princeton, NY, USA; Oxford, UK, 2000. [Google Scholar]
  98. Von Neumann, J. Theory of Self-Reproducing Automata; Burke, A.W., Ed.; University of Illinois Press: Urbana, IL, USA; London, UK, 1966. [Google Scholar]
Figure 1. Total evolutionary actors per speciation event from Table 3, with events about same geologic time. Most recent events are to the right of the graph. Species events are lined up such that Pleuroweisieae event 1 starts at same time as event 3 of Streptotrichaceae; then, e.a. summed (green in Table 3). Equation provided by Excel spreadsheet for the polynomial trendline.
Sustainability 17 08272 g001
Figure 2. Streptotrichaceae: Graphs of species per genus and traits per species. The Excel-inserted dashed trendline is logarithmic. (A) Species per genus. (B) Traits per species.
Sustainability 17 08272 g002
Figure 3. Pleuroweisieae: Graphs of species per genus and traits per species. The Excel-inserted dashed trendline is logarithmic. (A) Species per genus. (B) Traits per species.
Sustainability 17 08272 g003
Figure 4. Excel trendlines (curves of best fit) for species per genus and traits per species. (A) Trendlines for logarithmic and power curves of species per genus fit curve of fractal dimension fairly well and form a skein. (B) Trendlines for traits per species differ widely from fractal dimension 1.161 in both taxonomic groups for both logarithmic and power curves. Species per genus and traits per species, however, are similar across taxonomic groups. Secondary speciation is the probable cause for the matching of species per genus to the curve of fractal dimension.
Sustainability 17 08272 g004
Figure 5. Graphs of number of immediate descendants of genera of Streptotrichaceae and Pleuroweisieae. (A) Streptotrichaceae, a linear (dashed) trendline. (B) Pleuroweisieae, the trendline is logarithmic. (C) Pleuroweisieae, genus with 10 immediate descendants eliminated; the trendline is linear. (D) Combined Streptotrichaceae and Pleuroweisieae, genera with less than 10 immediate descendants; the trendline is linear.
Sustainability 17 08272 g005
Figure 6. Streptotrichaceae and Pleuroweisieae: Graphs of summed evolutionary actors (e.a.). The Excel-inserted dashed trendline is linear, and slope formula is given. All species sorted by values of summed evolutionary actors. The gradual decrease in evolutionary force as summed e.a.—no major plateaus—implies no interruption of gradual extinction by catastrophe. (A) Streptotrichaceae. (B) Pleuroweisieae.
Sustainability 17 08272 g006
Figure 7. Data from Streptotrichaceae and Pleuroweisieae combined, sorted by y axis data. (A,B) Species per genus and new traits per species are logarithmically distributed as shown by Excel-inserted dashed trendline. (C) Summed evolutionary actors are linearly distributed following trendline.
Sustainability 17 08272 g007
Figure 8. Estimation of ancient traits in Streptotrichaceae and Pleuroweisieae. (A,B). Top rectangle: In green, accumulated evolutionary actors (evolutionary force) from extant species plus a few inferred progenitor species. Bottom rectangle: In red, extrapolated estimation of accumulated evolutionary actors of species of extant or inferred ancestral species. Assumptions are equal rates of speciation and extinction through time. The X indicates shared evolutionary position of origination of the model evolutionary tree. Dashed line is a linear trendline.
Sustainability 17 08272 g008
Figure 9. Combined data sets of Streptotrichaceae and Pleuroweisieae. In green, accumulated evolutionary actors (evolutionary force) from extant species plus a few inferred progenitor species. In red, estimated accumulated evolutionary actors of species of extant or inferred ancestral species. X indicates shared evolutionary position of origination of the model evolutionary tree. Dashed line is a linear trendline.
Sustainability 17 08272 g009
Table 1. Annotated caulogram of Streptotrichaceae. S/G is species per genus. Fm is minimum force or evolutionary resilience as summed evolutionary actors for the progenitor of that genus. Cu is caulon units or genera along the caulon, counting back in time from the present. Speciation events lists total evolutionary actors per speciation event. F or force is total sum e.a. along the caulon for that species. Background colors indicate different genera; arrows indicate evolutionary paths.
GenusS/GFmCuSpeciesSpeciation Events (e.a./s.e.)F
1234567
IEG 1145unknown4 4
IEG 2184unknown╠>4 8
Trachyodontium2113unknown╠>3 11
zanderi╚>4 15
Crassileptodontium4172pungens╚>6 17
wallisii ╚>3 20
erythroneuron ╠>4 21
subintegrifolium ╚>3 20
Streptotrichum184ramicola╚>4 8
Austroleptodontium1163interruptum ╠>8 16
Leptodontiella1113apiculata ╠>3 11
Microleptodontium5182unknown ╚>7 18
flexifolium ╠>3 21
gemmascens ╠>4 22
umbrosum ╠>4 22
stellaticuspis ╚>3 21
Rubroleptodontium1241stellatifolium ╚>5 24
IEG 31133unknown ╚>5 13
Williamsiella4242araucarieti ╚>6 24
tricolor ╠>4 28
aggregata ╠>6 30
lutea ╠>2 26
Leptodontium4301unknown ╚>5 30
excelsum ╠>333
viticulosoides ╠>333
scaberrimum ╚>535
Stephanoleptodontium7291longicaule ╚>4 29
syntrichioides ╠>4 33
brachyphyllum ╠>3 32
filicola ╚>534
capituligerum ╚>3 32
latifolium ╠>332
stoloniferum ╚>433
Total3321326 482520292823756
Average2.516.33.3 4.04.05.05.04.03.53.822.9
Table 2. Annotated caulogram of Pottiaceae tribe Pleuroweisieae. S/G is species per genus. Fm is minimum force or evolutionary resilience as summed evolutionary actors for the progenitor of that genus. Cu is caulon units or genera along the caulon. Speciation events lists total e.a. per event. F or force is total sum e.a. along the caulon for that species. Background colors indicate different genera; arrows indicate evolutionary paths.
GenusS/GFmCuSpeciesSpeciation Events (e.a./s.e.)F
12345
IEG183unknown8 8
Tuerckheimia3162guatemalensis╠>4 16
svihlae╠>2 18
valeriana╚>2 18
Eobryum3242anoectangioides╚>5 15
hildebrantii ╠>3 21
xeerophilum ╠>2 20
Anoectangium7321aestivum ╠>5 32
euchloron ╠>5 37
radulans ╚>335
clarum ╠>4 36
incrassatum ╚>436
stracheyanum ╚>3 35
sikkimense ╚>335
Ardeuma5231gracillimum ╠>4 23
recurvirostum ╚>2 25
crassinervium ╠>326
annotinum ╠>326
aurantiacum ╚>326
Gymnostomum4201aeruginosum ╠>5 20
viridulum ╠>2 22
calcareum ╚>3 23
mosis ╚>222
Hymenostyliella2151llanosii ╠>5 15
alata ╚>2 17
Hymenostylium2161xanthocarpum ╠>4 16
townsendii ╚>4 20
Molendoa4241sendtneriana ╠>5 24
hornschuchiana ╠>5 29
peruviana ╚>3 27
handelii ╚>327
Ozobryum4241warburgii ╠>5 24
missing link ╚>5 29
ogalalense ╠>327
mexicanum ╚>327
Reimersia1121inconspicua ╚>4 12
Total3621412 89463830869
Average3.319.51.3 8.04.53.83.43.024.1
Table 3. Comparison of measurement totals for Streptotrichaceae and Pleuroweisieae. See Table 1 and Table 2 for captions. Evolutionary actors per individual speciation events are added (in green), and inferred extinct genera are included.
Streptotrichaceae
13 Genera
S/GFmCuSpeciation Events (e.a./s.e.)F
1234567
Total3321326482525242823756
Average2.516.33.34.04.05.05.04.03.53.822.9
Pleuroweisieae
11 Genera
S/GFmCuSpeciation Events (e.a./s.e.)F
12345
Total3621412 89463830869
Average3.319.51.3 8.04.53.83.43.024.1
Total combined e.a. 483334706653
Table 4. Trendlines for Streptotrichaceae and Pleuroweisieae, showing the best fit for curves of species per genus and traits per species, expressed in logarithmic and power law formulae.
TaxonSpecies per GenusTraits per Species
LogarithmicPower LawLogarithmicPower Law
Streptotrichaceaey = −2.539 ln(x) + 6.9424y = 9.6142 x−0.932y = −1.504 ln(x) + 8.0292y = 9.2839 x−0.33
Pleuroweisieaey = −2.340 ln(x) + 6.9042y = 8.859 x−0.742y = −1.4 ln(x) + 7.3699y = 8.8937 x−0.357
Disclaimer/Publisher’s Note: The statements, opinions and data contained in all publications are solely those of the individual author(s) and contributor(s) and not of MDPI and/or the editor(s). MDPI and/or the editor(s) disclaim responsibility for any injury to people or property resulting from any ideas, methods, instructions or products referred to in the content.