Article

Study on Influencing Factors of Industrial Design Agglomeration on Manufacturing Innovation Performance

School of Design and Architecture, Zhejiang University of Technology, Hangzhou 310023, China
*
Author to whom correspondence should be addressed.
Sustainability 2025, 17(18), 8269; https://doi.org/10.3390/su17188269
Submission received: 25 July 2025 / Revised: 28 August 2025 / Accepted: 10 September 2025 / Published: 15 September 2025

Abstract

Context: As a pivotal productive service industry, industrial design is increasingly recognized for its enabling role in manufacturing innovation through industrial agglomeration. Objectives: This study examines the factors influencing regional manufacturing innovation performance driven by industrial design agglomeration, identifying differential effects of agglomeration elements on innovation input versus output. Methods: Utilizing panel data from 10 prefecture-level cities in Zhejiang Province, China (2015–2022), we constructed an industrial design agglomeration index system spanning four dimensions—industrial agglomeration, industrial scale, human resources, and development environment—alongside manufacturing innovation performance metrics covering both input and output. A two-way fixed-effects model was employed for empirical analysis, with robustness checks conducted to ensure methodological rigor. Results: The findings demonstrate a statistically significant positive correlation between industrial design agglomeration and manufacturing innovation performance. Notably, industrial scale and developmental environment emerged as the most influential factors for innovation output enhancement, while human capital exhibited limited supportive capacity. The agglomeration effect was particularly pronounced in technologically advanced regions. Conclusions: Industrial design agglomeration can underpin the sustainable advancement of manufacturing innovation capabilities. We propose context-specific strategies to refine service platforms, accelerate design-manufacturing integration and digital transformation, and foster sustainable high-quality development in manufacturing.

1. Introduction

Against the backdrop of the global manufacturing sector’s shift toward high-end and intelligent development, industrial design—as a key productive service industry that integrates creativity with technology—is reshaping the logic of value creation in manufacturing. At the same time, China’s manufacturing industry faces the challenge of the “dual squeeze” phenomenon [1], constrained by structural inefficiencies, insufficient innovation capacity, severe resource waste, and environmental pollution [2], which further limit its sustainable development potential. By systematically integrating functionality, aesthetics, and production processes, industrial design not only optimizes product form and user experience but also drives profound transformations in manufacturing models and business pathways through design thinking. In recent years, the industrial design industry has experienced rapid global growth, evolving from a subsidiary support role into a core innovation-driven resource. Its agglomeration trend has become increasingly evident, serving as a vital engine for enhancing regional industrial competitiveness.
In contrast to the broader notion of “creative industry agglomeration,” which typically encompasses diverse fields such as culture, arts, and media, industrial design agglomeration is characterized by a distinct manufacturing orientation and technological practice. Such clusters often build upon established manufacturing foundations, forming innovation ecosystems centered on industrial design enterprises while linking manufacturers, material suppliers, and user research institutions. This configuration demonstrates higher knowledge spillover efficiency and stronger industrial embeddedness [3]. Accordingly, it is necessary to distinguish industrial design agglomeration from the broader category of creative industries in both theoretical and empirical research, conducting targeted analyses.
Existing studies have shown that industrial agglomeration can enhance regional innovation capacity by reducing transaction costs, facilitating factor mobility, and promoting knowledge diffusion. However, current research on manufacturing innovation performance has largely focused on the impact of internal resource inputs or macro-level policy environments on innovation efficiency, while systematic quantitative evidence regarding the specific mechanisms through which industrial design—as a primary source of innovation—affects manufacturing performance under agglomeration remains scarce [4,5,6,7]. In particular, amid the deepening integration of design and manufacturing [8], the extent to which different elements within the industrial design industry, respectively, influence innovation input and output in manufacturing, as well as the pathways through which they operate, warrants further in-depth analysis.
Moreover, the existing literature lacks contextualized analysis within the framework of China’s local governance and regional development policies. Given China’s comprehensive manufacturing system and urgent demand for innovation, alongside the rapid advancement of its industrial design sector, it is necessary to conduct empirical studies based on specific regional samples. Zhejiang Province, as a representative region of high industrial design agglomeration in China, possesses a solid manufacturing foundation and a well-developed design policy system, providing fertile ground for analyzing the coupling between industrial agglomeration and manufacturing innovation.
Accordingly, this study utilizes panel data from 10 prefecture-level cities in Zhejiang Province from 2015 to 2022 to construct an industrial design agglomeration index system across four dimensions—industrial agglomeration, industrial scale, human resources, and development environment. Combined with input and output indicators of manufacturing innovation performance, a two-way fixed-effects model is employed for empirical testing, with robustness checks conducted to enhance research reliability. The study aims to clarify the differential impacts of industrial design agglomeration components on manufacturing innovation performance, address the research gap regarding the “identification of effect intensity” of industrial design in the manufacturing innovation process, and provide theoretical reference and policy recommendations for strengthening regional manufacturing innovation capacity.

2. Literature Review

This study encompasses three core research domains: (1) design industry agglomeration, (2) manufacturing innovation performance, and (3) the impact of industrial design on manufacturing innovation.
First, the role of industrial agglomeration in enhancing investment efficiency and national competitiveness has been widely recognized in international academia [9,10]. As the founding theorist of industrial agglomeration, Marshall introduced the concept of “external economies” in Principles of Economics (1890), arguing that the geographic concentration of firms contributes to improved operational efficiency [11,12], while spatial proximity reduces the costs of knowledge acquisition and fosters cumulative advantages through knowledge spillovers [13,14]. In recent years, design industry agglomeration has attracted increasing attention as an important extension of this theory. For example, Qian et al. [15], based on the case of Berlin’s Charlottenburg district, explored the dynamic mechanisms and spatial patterns of design industry agglomeration. Qin [16] constructed an analytical framework for industrial design development from industrial, spatial, and policy dimensions. Laakso et al. [17] highlighted that creative activities rely heavily on the exchange of tacit knowledge, which is inherently constrained by geography, thereby leading to significant agglomeration characteristics in design industries and related patents. O’Connor [18] further demonstrated that although design serves manufacturing, its agglomeration tends to concentrate in metropolitan areas as diversified producer service clusters. This not only enhances urban innovation density but also provides sustainable innovation resources to support manufacturing.
Manufacturing innovation performance is a key metric for evaluating outcomes of innovation activities. Early studies primarily relied on subjective measures such as questionnaires [19,20]. With improved data accessibility, recent research emphasizes objective and comparable indicators, including patent counts, new product sales revenue, and research and development (R&D) expenditure. Chen et al. [21] used invention patents to measure exploratory innovation and utility/design patents for exploitative innovation. Jiang et al. [22] analyzed the Yangtze River Delta high-tech industries using new product sales ratios. Common evaluation methods include Data Envelopment Analysis (DEA), regression models (RM), fixed-effects models (FEM), and spatial Durbin models (SDM). Shao et al. [23] applied a three-stage DEA model to assess textile firms’ innovation efficiency based on input-output metrics. Song et al. [24] employed regression analysis to validate the positive impact of digital transformation on manufacturing innovation performance.
The interactive mechanisms between industrial design and manufacturing innovation have become a research focal point. Scholars have explored their synergistic relationships through lenses such as industrial collaboration, value co-creation, and innovation drivers. Hu [25] characterized industrial design and manufacturing as mutually reinforcing: manufacturing provides the implementation platform for design, while design enhances product-market fit and user value. Huang [26] highlighted multidimensional influences on design competitiveness, including policy support, talent systems, supply-chain coordination, and innovation mechanisms. Bai [27] advocated industrial design as a lever to transition Hebei’s manufacturing from production-led to innovation-driven. Qiu [28] proposed a quadruple-helix pathway (government, education, service agencies, and firms) to deepen design-manufacturing integration. Wang and Su [29] identified internal organizational and external environmental constraints on design innovation capability using Gansu manufacturers as cases. Notably, Xu et al. [30] applied a DEA model and found that industrial design factors significantly enhance the pure technical efficiency of manufacturing innovation, indicating that design is not merely superficial appearance optimization but is embedded in manufacturing processes at the efficiency level. While the above studies provide important references in terms of pathway construction and empirical analysis, they remain insufficient in elucidating how industrial design agglomeration influences manufacturing innovation performance through specific mechanisms, with a lack of systematic quantitative research at the regional level.
Despite evidence linking design agglomeration to regional innovation and manufacturing upgrading, systematic analyses of its mechanistic pathways remain scarce. Existing studies often focus on isolated variables like spatial proximity or knowledge spillovers, neglecting the integrated “agglomeration structure → mechanism → performance” framework. Moreover, while technological innovation dominates manufacturing performance metrics, design innovation dimensions are underrepresented. Theoretical discussions on design’s positive impacts outweigh empirical quantifications of its effect size.
To address these gaps, this study empirically examines how design industry agglomeration influences manufacturing innovation performance by integrating spatial agglomeration metrics with innovation output data. Our findings aim to provide both theoretical and empirical foundations for sustainable design-manufacturing integration.

3. Methodology and Data Processing

3.1. Research Design and Modeling Methods

This study adopts a non-experimental panel data empirical approach to examine the effects of various dimensions of industrial design agglomeration on manufacturing innovation performance. Based on data samples from 10 prefecture-level cities in Zhejiang Province from 2015 to 2022, the research constructs manufacturing innovation performance indicators with innovation input and innovation output as the core dimensions, while categorizing industrial design agglomeration into four dimensions: agglomeration degree, industrial scale, human resources, and regional development environment.
In terms of indicator construction, to mitigate estimation errors arising from multicollinearity, Pearson correlation coefficients were employed for preprocessing the relationships among indicators, and the Location Quotient (LQ) method was introduced to measure interregional differences in industrial agglomeration levels. To standardize data scales and improve model convergence, all variables were log-transformed before being entered into the model.
Regarding methodological choice, this study applies the two-way fixed-effects model (FE) for regression analysis, with robustness checks conducted to validate the reliability of the model. The two-way fixed-effects specification effectively controls for unobservable heterogeneity across regions and time-specific shocks across years, thereby mitigating systematic impacts from sudden events such as the COVID-19 pandemic and reducing potential estimation bias in the relationship between agglomeration and innovation performance.
The preference for a static panel model rather than a dynamic one is justified on two grounds. First, the research focus lies in identifying average effects, for which the two-way fixed-effects model can robustly control for regional and temporal heterogeneity. Second, given the study’s time span of 2015–2022, the relatively limited temporal dimension may lead to weak instrumental variables and estimation bias in dynamic panel models, thereby undermining explanatory power. Accordingly, the static model is better suited to the current sample conditions.
It should be acknowledged, however, that this specification cannot fully capture the dynamic evolution of agglomeration effects. Future studies could extend the analysis by applying dynamic panel models with longer time series or finer-grained data to explore such dynamics in greater depth. It should also be noted that this study aims to examine the statistical correlations between variables, without conducting causal inference, and the policy recommendations are proposed on the basis of correlation analysis.

3.2. Research Hypotheses

Building upon the established indicator system for industrial design agglomeration and the academic consensus regarding the design industry’s catalytic effect on manufacturing innovation, this study proposes the following four hypotheses:
Hypothesis 1 (H1). 
Industrial design agglomeration demonstrates a statistically significant positive correlation with manufacturing innovation performance.
Hypothesis 2 (H2). 
The scale of the industrial design industry exhibits a significant positive relationship with manufacturing innovation performance.
Hypothesis 3 (H3). 
Human capital in the industrial design industry positively influences manufacturing innovation performance at a statistically significant level.
Hypothesis 4 (H4). 
Regional development environment serves as a moderating variable in the relationship between the industrial design industry and manufacturing innovation performance.

3.3. Model Specification and Variable Processing

3.3.1. Logarithmic Transformation

This study decomposes industrial design agglomeration into multi-dimensional indicators characterized by varying units and orders of magnitude. Direct computation using raw data would disproportionately emphasize indicators with larger numerical values while diminishing the influence of those with smaller values. To mitigate this bias, we apply a logarithmic transformation to the original indicators. This process preserves the inherent properties and correlations of the data while normalizing scale differences. To address potential missing values, we add 1 to each raw data point before taking the natural logarithm, as formalized in Equation (1):
Y = InX + 1
where X is the original indicator data for industrial design agglomeration, and Y is the logarithmically transformed data of X .

3.3.2. Location Quotient (LQ)

The Location Quotient (LQ), initially proposed by P. Haggett for locational analysis and also known as the specialization index, serves as a widely adopted analytical method for assessing regionally advantageous industries. This metric primarily evaluates the spatial distribution of regional factors, effectively revealing both the strengths and weaknesses of specific industrial sectors while illustrating a region’s relative position and role within hierarchical regional systems. By computing the LQ of a particular industry in a given region, researchers can identify industries that hold comparative advantages at the national level. The magnitude of the LQ value directly indicates the degree of industrial specialization (specialization rate). As a prevalent indicator for measuring industrial agglomeration, the LQ’s primary advantage lies in its ability to demonstrate regional disparities in industrial specialization levels using minimal data inputs, making it particularly effective for comparative analyses of industrial distribution across regions. The LQ index is calculated as follows:
LQ ij = x ij / i x ij j x ij / j i x ij
where LQ ij represents the location quotient of industry i in region j, x ij denotes the relevant indicator value (e.g., output value, employment) of industry i in region j, i x ij indicates the sum of relevant indicators for all industries in region j, and j x ij represents the sum of relevant indicators for industry i across all regions. The LQ value directly reflects the degree of industrial concentration in a given region. When LQ > 1, the industry demonstrates higher specialization in the region than the overall level, indicating a regionally specialized sector. When LQ < 1, the industry shows lower specialization than the overall level, representing a non-specialized sector in the region. When LQ = 1, the industry’s specialization level matches the overall benchmark [31].

3.3.3. Pearson Correlation Analysis

To assess potential multicollinearity among the multiple indicators designed to measure industrial design agglomeration, we conducted correlation analysis using the Pearson Correlation Coefficient (PCC). This parametric measure quantifies the linear relationship between two continuous variables through vector similarity analysis [32], where higher absolute values indicate stronger linear associations [33]. For two sample sets X = { x 1 , x 2 , , x n } and Y = { y 1 , y 2 , , y n } , the PCC r ( X , Y ) is calculated as:
r ( X , Y ) = i = 1 n ( x i   x - ) ( y i   y - ) i = 1 n ( x i   x - ) 2 i = 1 n ( y i   y - ) 2   , ( i = 1 , 2 , , n )
where r ( X , Y ) ∈ [−1, 1], and the sign denotes positive/negative linear relationships. The larger its absolute value, the stronger the correlation. X is the set of sample 1, Y is the set of sample 2, and x i ¯ and   y - are the average values of X and Y , respectively.

3.3.4. Panel Data Regression Models

Panel data models can be categorized into three primary types, each with distinct characteristics [34]:
(1)
Pooled Regression Model
This model assumes no significant heterogeneity across either cross-sectional units or time periods. It represents a constant-coefficient specification that captures neither structural differences between entities nor dynamic temporal variations. The specification is:
Y it = α + β X it + ε it   i = 1 , 2 , , N , t = 1 , 2 , , T
where Y it is the dependent variable, X it the explanatory variable, α the time-invariant intercept, β the coefficient vector, and ε it the random error term. The random error terms are mutually independent and satisfy the assumptions of zero mean and equal variance [35]. The parameters α and β in the pooled regression model remain unchanged.
(2)
Fixed-Effects Regression Models
These models account for unobserved heterogeneity by incorporating intercept terms that vary across cross-sectional units (i) or time periods (j). Three primary specifications exist:
① Entity-Specific Fixed-Effects Model
The intercept varies across entities i but remains constant over time t :
Y it = α i + β X it + ε it   i = 1 , 2 , , N , t = 1 , 2 , , T
② Time-Specific Fixed-Effects Model
The intercept varies over time t but remains constant across entities i :
Y it = γ t + β X it + ε it   i = 1 , 2 , , N , t = 1 , 2 , , T
③ Two-Way Fixed-Effects Model
The intercept varies by both entity i and time t :
Y it = α 0 + α i + γ t + β X it + ε it   i = 1 , 2 , , N , t = 1 , 2 , , T
(3)
Random Effects Regression Model
This model is appropriate when sampled units represent random draws from a population, with the following specification:
Y it = α 0 + β X it + u i + v t + ε it   i = 1 , 2 , , N , t = 1 , 2 , , T
where α 0 denotes a random variable, u i is the cross-section specific random effect, capturing unobserved heterogeneity across entities, v t is the time-specific random effect, accounting for temporal variations, and ε it is the idiosyncratic error term representing combined entity-time specific shocks. All random components are mutually orthogonal.

3.4. Research Subjects and Data Sources

Currently, Zhejiang Province lacks comprehensive statistics and monitoring of the industrial design industry data from government departments or authoritative social institutions. To enhance the representativeness and quality of industrial design industry data, this study selects data from 16 provincial-level characteristic design parks across 10 prefecture-level cities in Zhejiang Province as representative samples of regional industrial design industry characteristics. Considering data representativeness and influence, manufacturing listed companies from various cities in Zhejiang Province were chosen as the research sample for manufacturing enterprises. Notably, Zhoushan City was excluded from the final analysis sample due to its relatively weak manufacturing foundation, limited number of relevant listed companies, and long-term lack of accumulated design industry-related data.
Regarding data sources, the industrial design industry data were obtained from monthly reports of 16 design parks in Zhejiang Province from 2015 to 2022. For manufacturing data, this study selected A-share listed manufacturing companies in Zhejiang Province during 2015–2022 as research samples, with the following processing rules: ST companies and insolvent samples were removed, and samples with missing variables were excluded. Patent authorization data for various cities in Zhejiang Province from 2015 to 2022 were collected from the Zhejiang Provincial Department of Science and Technology and the Zhejiang Provincial Market Supervision Administration. Data on manufacturing listed companies were sourced from the China Stock Market & Accounting Research (CSMAR)database and China Research Data Service Platform (CNRDS). Other data were obtained from the statistical bureaus and finance bureaus of various cities in Zhejiang Province. The patent data for manufacturing enterprises in this study were collected from Patent Hub.
It should be noted that although this study focuses on Zhejiang Province, China, which may introduce certain regional limitations, Zhejiang represents a typical region where manufacturing and the design industry are highly integrated, with its industrial structure and development level serving as a benchmark and driver nationwide. Therefore, the findings hold referential value for other regions at similar stages of development. While the research sample is concentrated on provincial-level design parks and listed manufacturing companies, listed firms generally possess higher market value, concentrated resources, and technological advantages. According to publicly available data, listed enterprises account for approximately 77.7% of national R&D investment and occupy a significant share of fiscal science and technology expenditures. Moreover, numerous studies have highlighted the dominant role of listed companies in driving regional innovation, advancing industrial technological capabilities, and providing market leadership [36]. Consequently, despite the limited sample coverage, the conclusions of this study remain reflective of the innovation dynamics of key actors under the industrial design–manufacturing agglomeration context in Zhejiang Province.

4. Indicator System Construction and Hypothesis Development

4.1. Evaluation Indicators for Industrial Design Agglomeration

4.1.1. Indicator Selection and Preliminary Adjustment

Existing research on the constituent elements of industrial design agglomeration primarily draws from findings in the creative industry agglomeration domain. This is justified for two key reasons. First, the creative industry inherently integrates service and trade functions characteristic of the tertiary sector with the R&D and production roles typical of the secondary sector [37]. As a core component of the creative industry, industrial design serves not only as a pivotal driver of corporate innovation but also as a catalyst for industrial structural transformation. Consequently, the agglomeration mechanisms observed in creative industries largely reflect the clustering patterns of industrial design. Second, industrial design agglomeration exhibits distinct characteristics that differentiate it from traditional manufacturing clusters, most notably through its high concentration of innovation, tight industrial chain coordination, and intensive external environmental interactions.
Current evaluations of industrial design agglomeration predominantly focus on two dimensions: (1) the geographic concentration of spatial distribution, and (2) the specialized development level of the industry itself. For instance, Zhou [38] conducted preliminary assessments using indicators such as industrial scale, development level, and profitability, while Xiang [39] established a more systematic evaluation framework encompassing industrial development environment, economic benefits, and innovation outputs. These studies provide both theoretical and empirical foundations for constructing more explanatory agglomeration evaluation models. At the same time, international research also provides important references for the construction of evaluation dimensions. For example, Guo et al. [40], from the perspective of ESG (environmental, social, and governance), empirically revealed the multidimensional mechanisms through which industrial agglomeration affects firm performance, emphasizing the measurement of agglomeration effects within the framework of sustainable development. Torbacki et al. [41] applied the multi-criteria decision analysis (MCDA) method to systematically model industrial agglomeration within the framework of technological, organizational, and sustainability synergies. Such multidimensional approaches to indicator design help enrich the structural robustness and adaptability of China’s industrial design agglomeration evaluation system.
Building upon a comprehensive synthesis of prior research findings and incorporating the distinctive developmental characteristics of the industrial design sector, this study establishes a primary indicator system for assessing industrial design agglomeration components across four fundamental dimensions: agglomeration intensity, industrial scale, human capital, and developmental environment. The framework is subsequently operationalized through 20 secondary indicators, including but not limited to: commercialized output value of industrial achievements, transaction volume of design outcomes, and regional financial service capacity. This multi-tiered measurement system enables a more holistic characterization and evaluation of the multidimensional composition of agglomeration features. The complete taxonomy of indicators, along with their precise definitions and distributional properties, is presented in Table 1.
Considering the identified limitations regarding adaptability and representativeness in certain original indicators, this study has systematically refined the evaluation framework through the following evidence-based modifications:
The Herfindahl Index (G2) was eliminated from the agglomeration dimension as it primarily measures market concentration rather than effectively capturing regional industrial specialization advantages. Within the industrial scale dimension, three indicators were removed: Patent Applications (G3) due to its inability to distinguish patent quality and susceptibility to strategic low-value patent filings; Design Service Revenue (G6) owing to significant variations caused by regional and international pricing disparities; and Serviced Enterprises (G8) because of inherent biases stemming from different enterprise lifecycle stages between startups and mature firms.
The human capital dimension saw the removal of Industrial Designer Growth Rate (G10), as the widespread adoption of AI-assisted design tools has fundamentally transformed labor productivity measurement in the industry. In the development environment dimension, Economic Development Level (G17) was excluded due to a temporal mismatch with design industry characteristics, particularly the sector’s distinct investment cycles compared to conventional economic indicators.
To enhance methodological rigor, we implemented a one-year lag adjustment for the Patents Granted (G3) indicator. This modification accounts for administrative processing delays and better aligns with the actual innovation output timeline, particularly given the predominance of utility model and design patents in this sector. The final optimized indicator system, incorporating these scientifically justified modifications while maintaining core measurement validity, is presented in Table 2 with complete operational definitions. This refined framework provides a more accurate and robust basis for assessing industrial design agglomeration components.

4.1.2. Correlation Analysis of Evaluation Indicators

To mitigate potential multicollinearity issues arising from strong correlations among secondary indicators, which could compromise the scientific validity of model construction, this study conducted systematic correlation tests and eliminated highly correlated variables. Using industrial data from provincial characteristic design parks across 11 prefecture-level cities in Zhejiang Province, we performed category-specific correlation analyses for secondary indicators under each primary indicator classification. After initially removing strongly correlated indicators, we conducted additional comprehensive correlation tests on the retained variables to ensure minimal internal correlations within the final indicator system, thereby enhancing the reliability of analytical results.
Given varying measurement units across indicators, all data underwent logarithmic transformation using Equation (1). For cross-year economic indicators including G2 (Commercialized Output Value), G11 (Financial Service Capacity), and G12 (Government Intervention), we applied price index adjustments with the year 2000 as the base period prior to logarithmic transformation, eliminating inflationary effects and improving data comparability. The agglomeration level of industrial design industries was quantified using location quotient (LQ) metrics through Equation (2), with provincial characteristic design parks across 11 Zhejiang cities as analytical units.
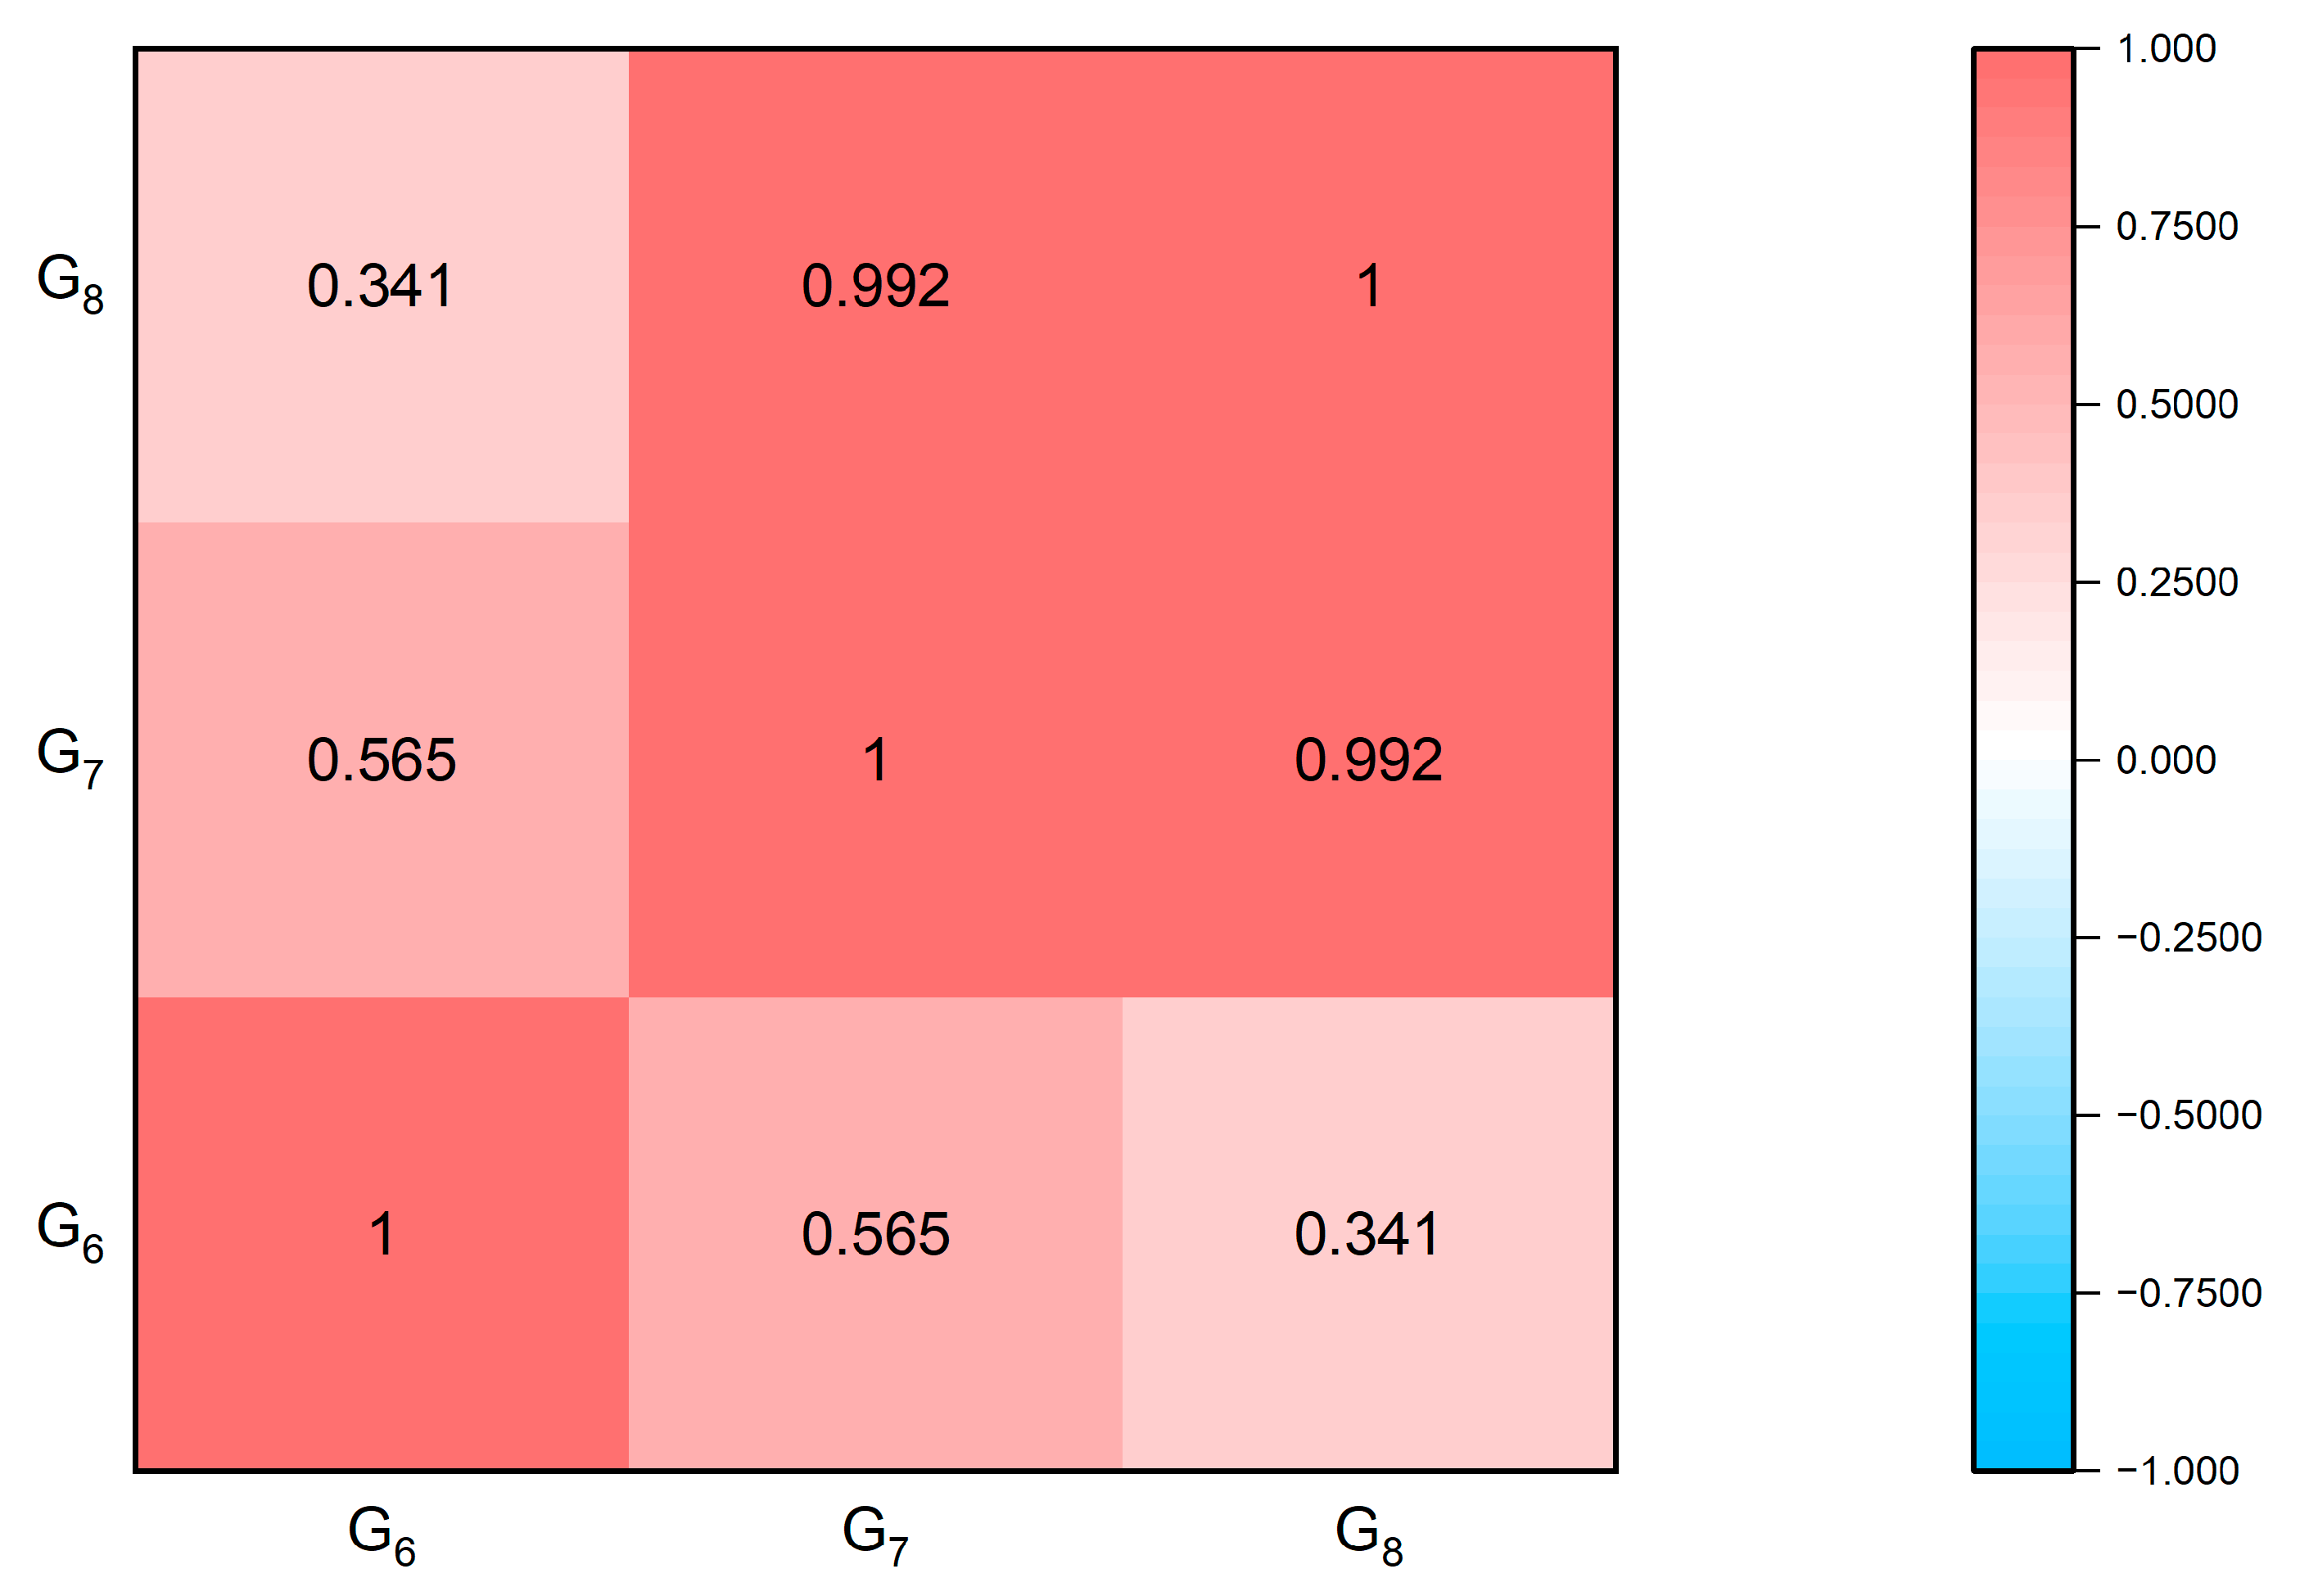
After preliminary indicator adjustment, the primary indicator “Agglomeration Degree (GA)” retained only G1 (Location Quotient), which demonstrated sufficient independence within this dimension and thus required no correlation testing. For other primary categories containing multiple secondary indicators—“Industrial Scale (GB)”, “Human Resources (GC)”, and “Development Environment (GD)”—we conducted additional Pearson correlation analyses. Equation (3) was employed to test four logarithmically transformed secondary indicators under “Industrial Scale (GB)”, with results visualized via a heatmap (Figure 1).
According to the definition of the Pearson correlation coefficient, values approaching |1| indicate stronger linear relationships between variables, with coefficients exceeding 0.8 typically considered highly correlated. To prevent multicollinearity from compromising model stability and explanatory power, it is necessary to eliminate strongly correlated indicators, thereby ensuring the final indicator system maintains robust independence and validity.
The heatmap reveals that G2 (Commercialized Output Value) exhibits correlation coefficients exceeding 0.8 with both G3 (Patents Granted) and G5 (Design Firms), indicating highly linear relationships. Comparatively, G3 and G5 more specifically reflect the innovation output and industrial scale characteristics resulting from industrial design agglomeration, thus possessing greater explanatory power in examining the impact mechanisms of industrial agglomeration on manufacturing innovation performance. As an indicator of economic conversion, G2 is constrained by time lags and structural limitations in data composition, resulting in certain restrictions in explaining the conversion pathways of agglomeration effects. In this context, removing G2 enhances the evaluation system’s sensitivity to the direct “scale-innovation” pathway and improves the model’s adaptability and explanatory power.
The heatmap further demonstrates a high correlation between G4 (Design Transactions) and G5. While G5 reflects the enterprise foundation of agglomeration zones from a quantitative perspective, its representation of corporate innovation output and market performance remains relatively indirect, potentially leading to an oversimplified understanding of agglomeration benefits. In contrast, G4 measures the actual transaction volume of design outcomes in the market, more directly reflecting the economic vitality and commercialized output capacity of agglomeration zones. Therefore, retaining G4 while removing G5 enables the evaluation system to more comprehensively and authentically represent the actual economic benefits and innovation-driven potential generated by industrial design agglomeration. Particularly when analyzed in conjunction with G3, this approach facilitates in-depth characterization of industrial agglomeration impact pathways from the “innovation output-market conversion” dimension.
Building on this analysis, we further applied Equation (2) to perform a logarithmic transformation on the remaining three secondary indicators in the Industrial Scale (GC) dimension and conducted Pearson correlation tests. The resulting correlation coefficients are presented in the subsequent Figure 2.
The analysis reveals a strong correlation (r > 0.8) between G7 (Certified Mid-to-Senior Level Professionals (%)) and G8 (Certification Rate (%)). While G7 specifically measures the proportion of mid-to-senior-level certified professionals, its narrow focus limits a comprehensive assessment of the overall workforce quality. In contrast, G8 provides a more holistic evaluation by quantifying the percentage of all certified professionals within the workforce, thereby better representing the human capital characteristics of industrial agglomeration zones. Consequently, G7 was eliminated from the indicator system.
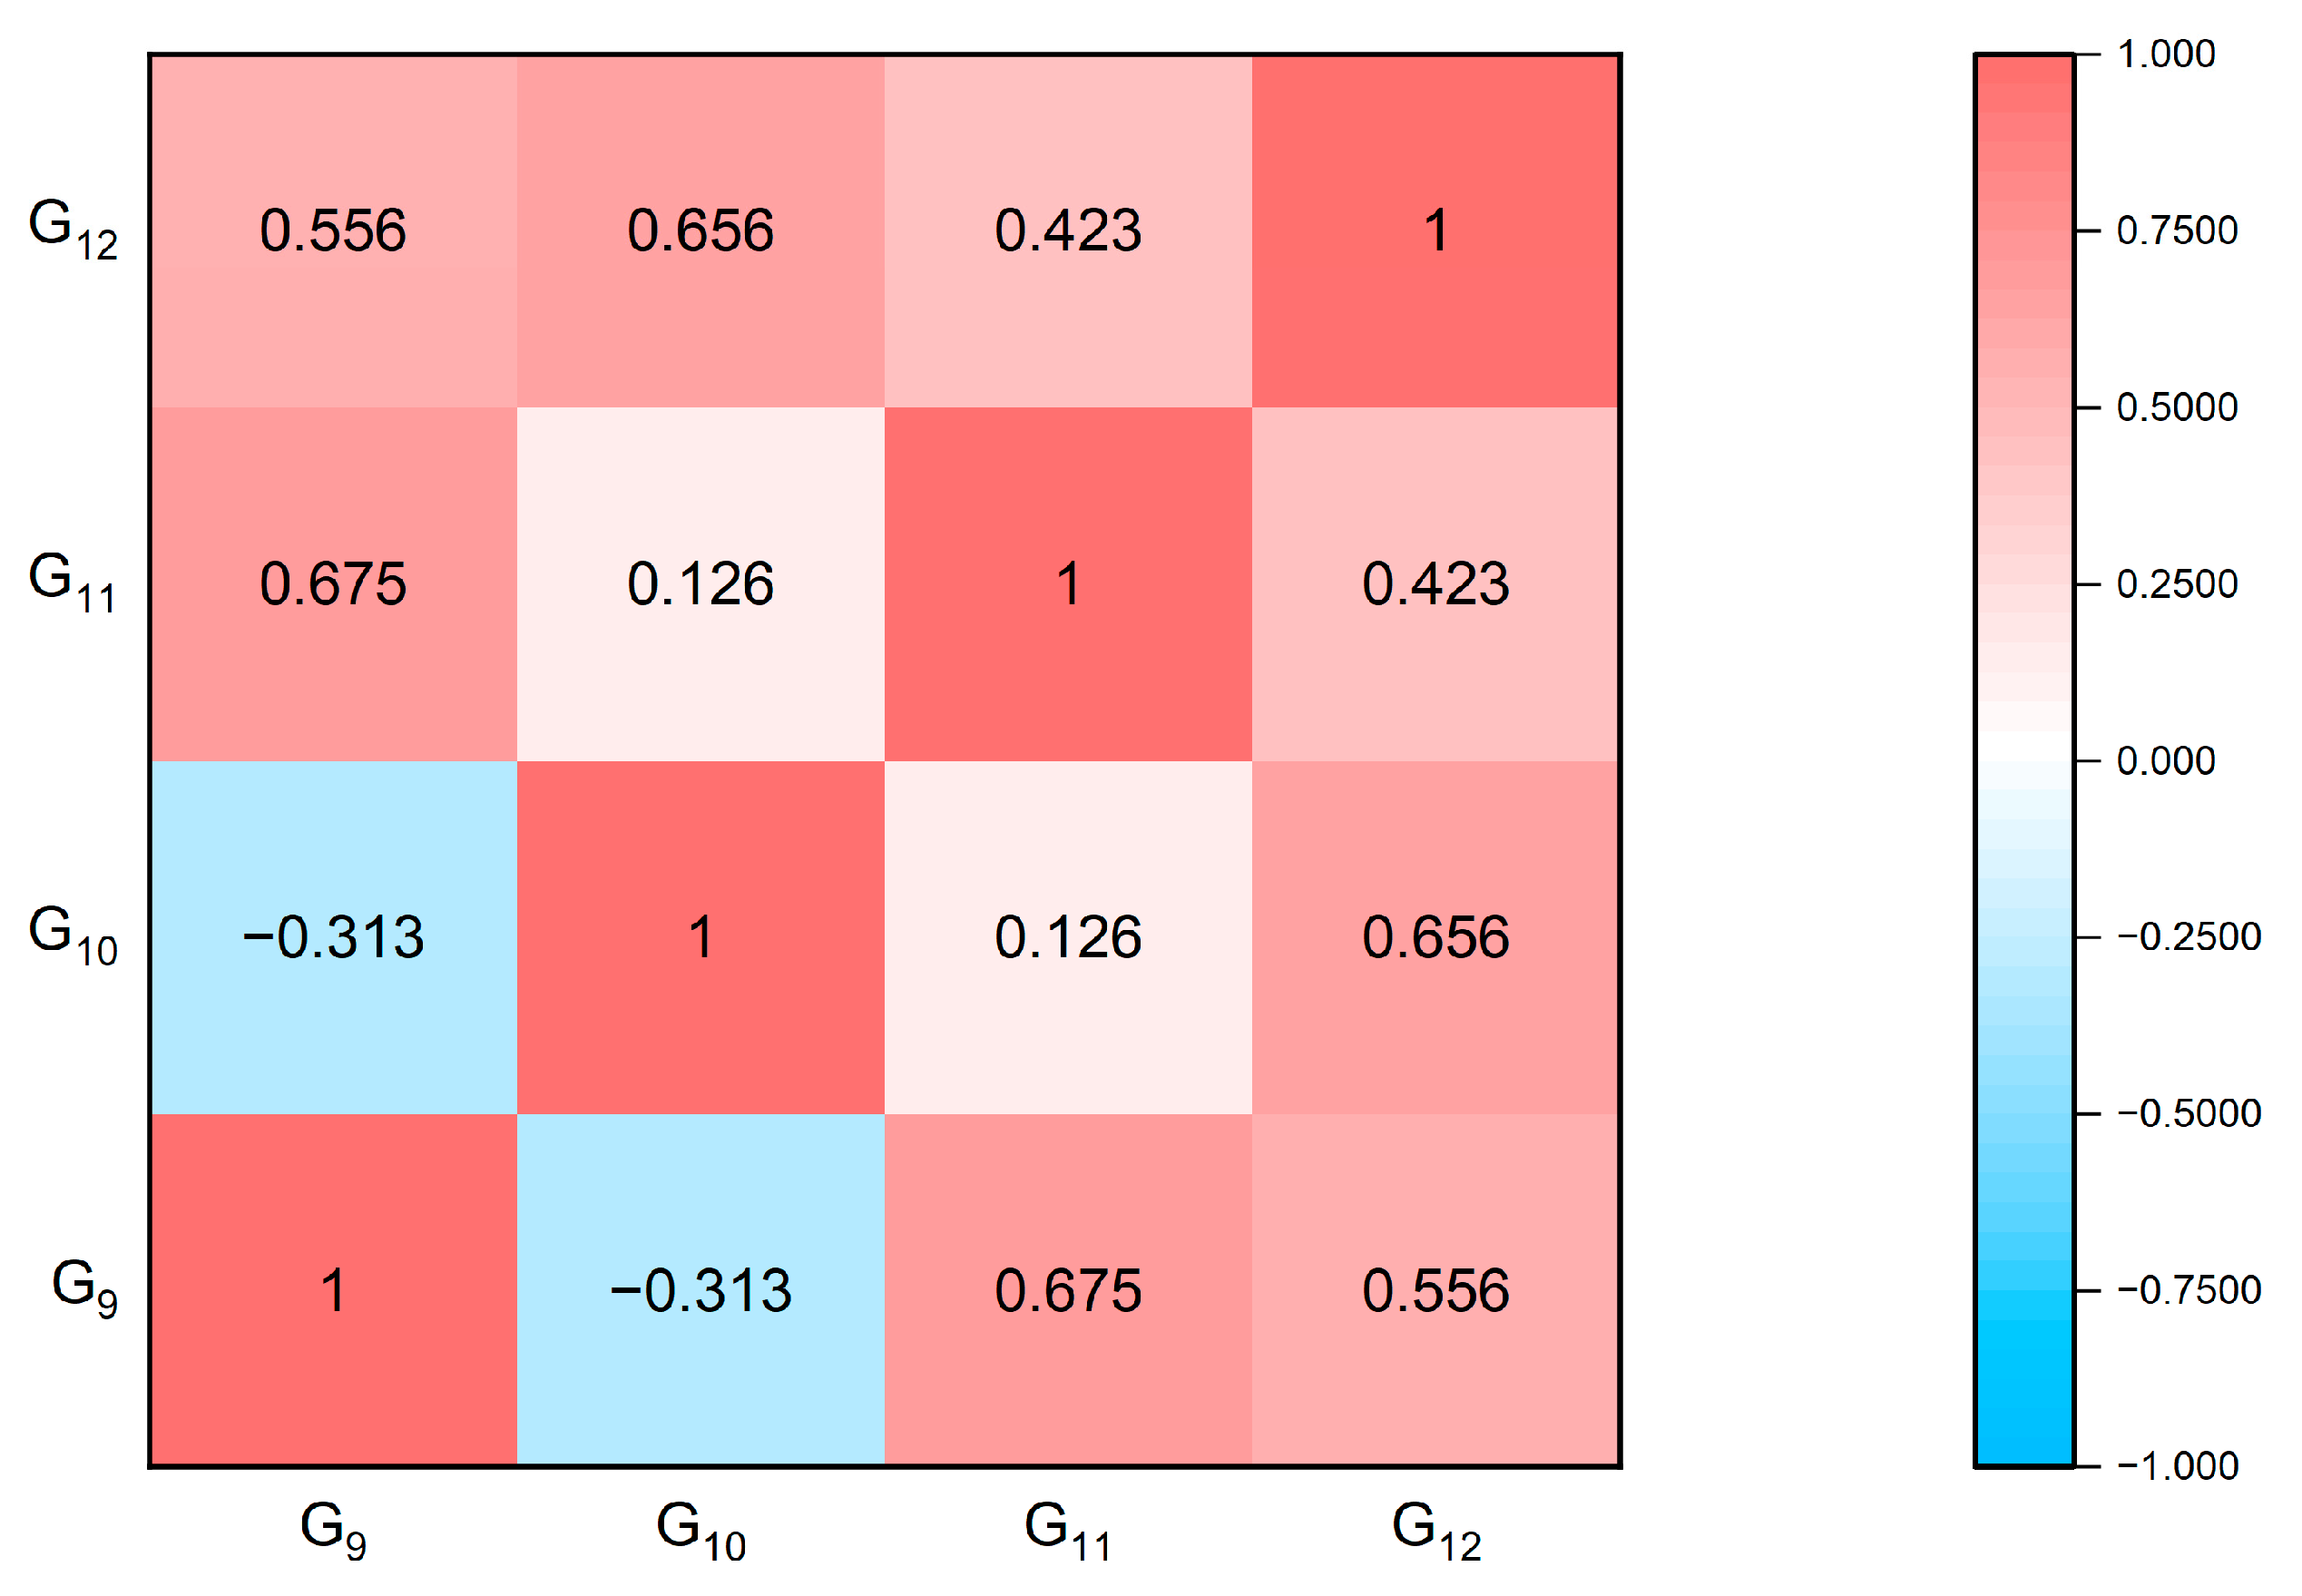
Subsequent analysis applied Equation (2) to perform a logarithmic transformation on the four secondary indicators within the Development Environment (GD) dimension, followed by Pearson correlation testing. The resulting correlation coefficients are presented in Figure 3.
All observed correlation coefficients maintain absolute values below 0.8, indicating no instances of high correlation. This demonstrates satisfactory independence among secondary indicators, effectively mitigating multicollinearity concerns. Notably, the correlation between G9 (Innovation Vitality) and G11 (Financial Service Capacity) registers at 0.675—approaching but remaining below the high correlation threshold—and thus falls within acceptable parameters. Collectively, these results confirm that the selected indicators within the Development Environment (GD) dimension exhibit appropriate independence, providing a reliable foundation for model construction.
Following this comprehensive analysis, we finalized the elimination of highly correlated secondary indicators across all primary indicator categories. Table 3 presents the refined indicator system:
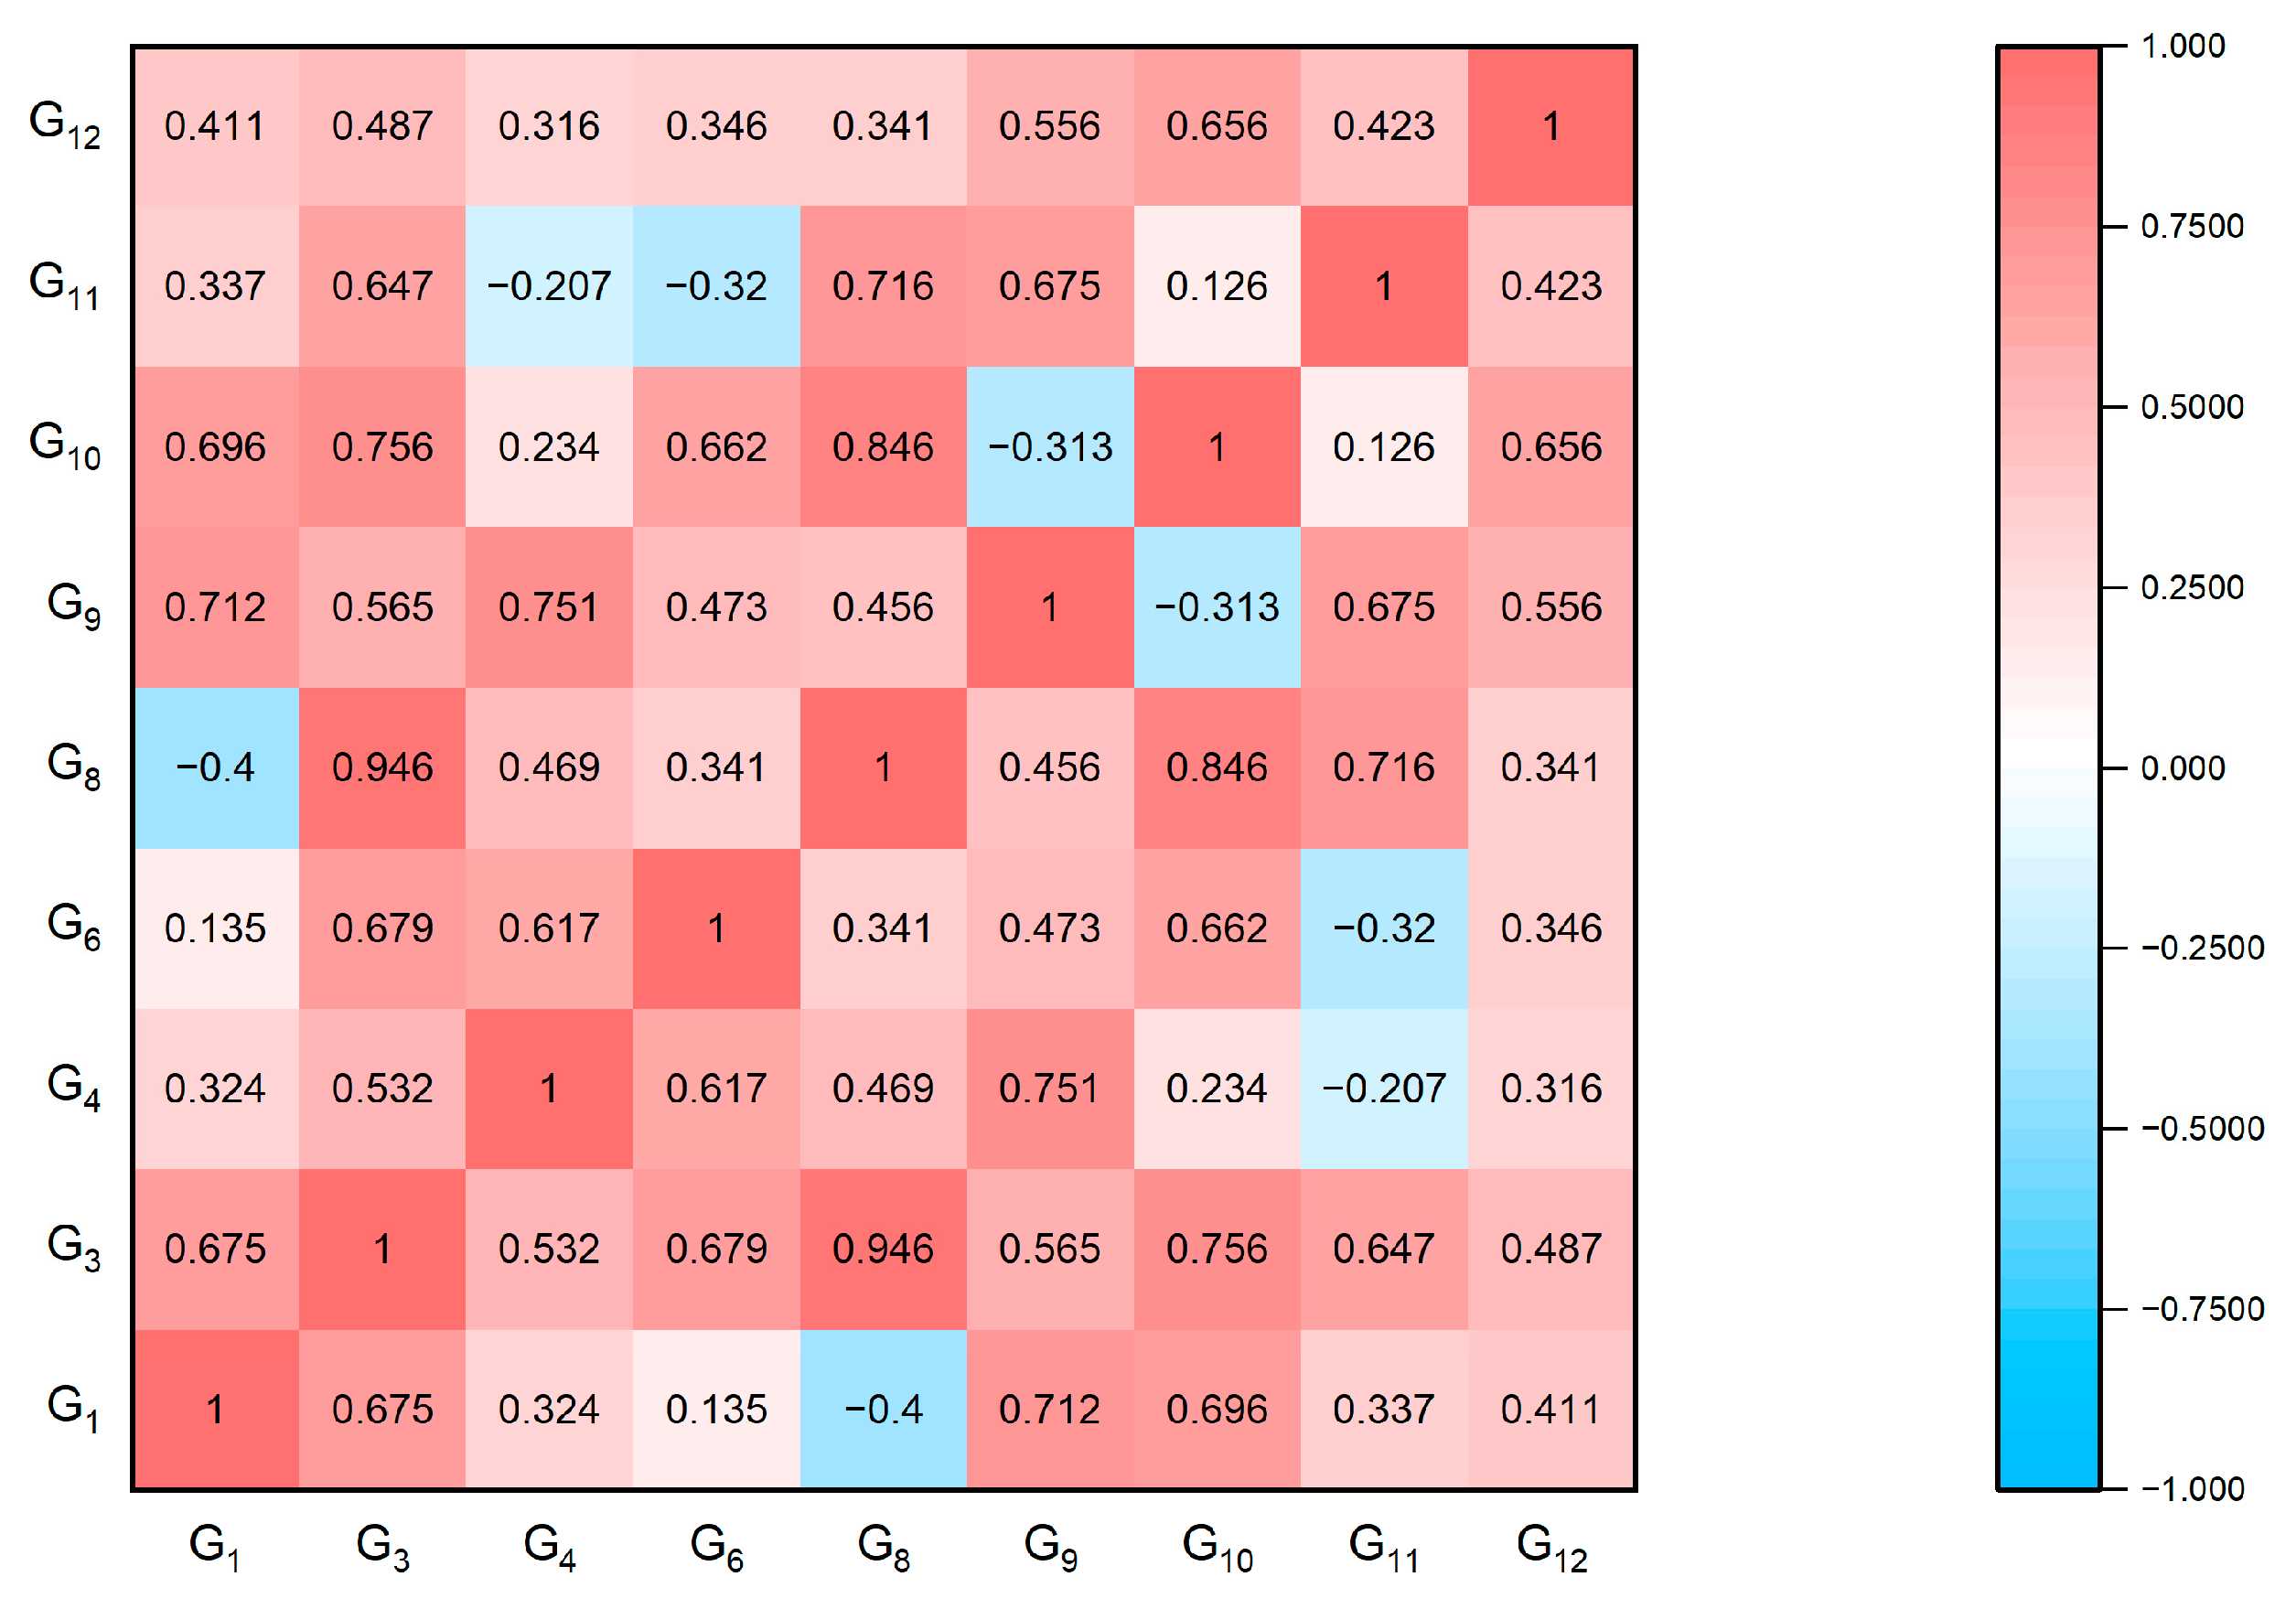
Figure 4 presents the results of the Pearson correlation analysis conducted on the indicator data from Table 3 using Equation (2).
As illustrated in Figure 4, G8 (Certification Rate) demonstrates strong correlations with both G3 (Patents Granted) and G10 (Innovation Talent Pool). These correlations carry important implications for understanding industrial design agglomeration dynamics. G3 serves as a direct measure of innovation output through patented inventions, while G10 quantifies the regional concentration of qualified design professionals—both representing fundamental components of innovation capacity within industrial clusters. In comparison, G8’s focus on certification rates among practitioners, while valuable for assessing workforce qualifications, offers relatively limited explanatory power regarding the core innovation mechanisms driving industrial agglomeration. Given G8’s narrower focus and secondary role in explaining innovation dynamics, we elected to remove this indicator from the final evaluation system.
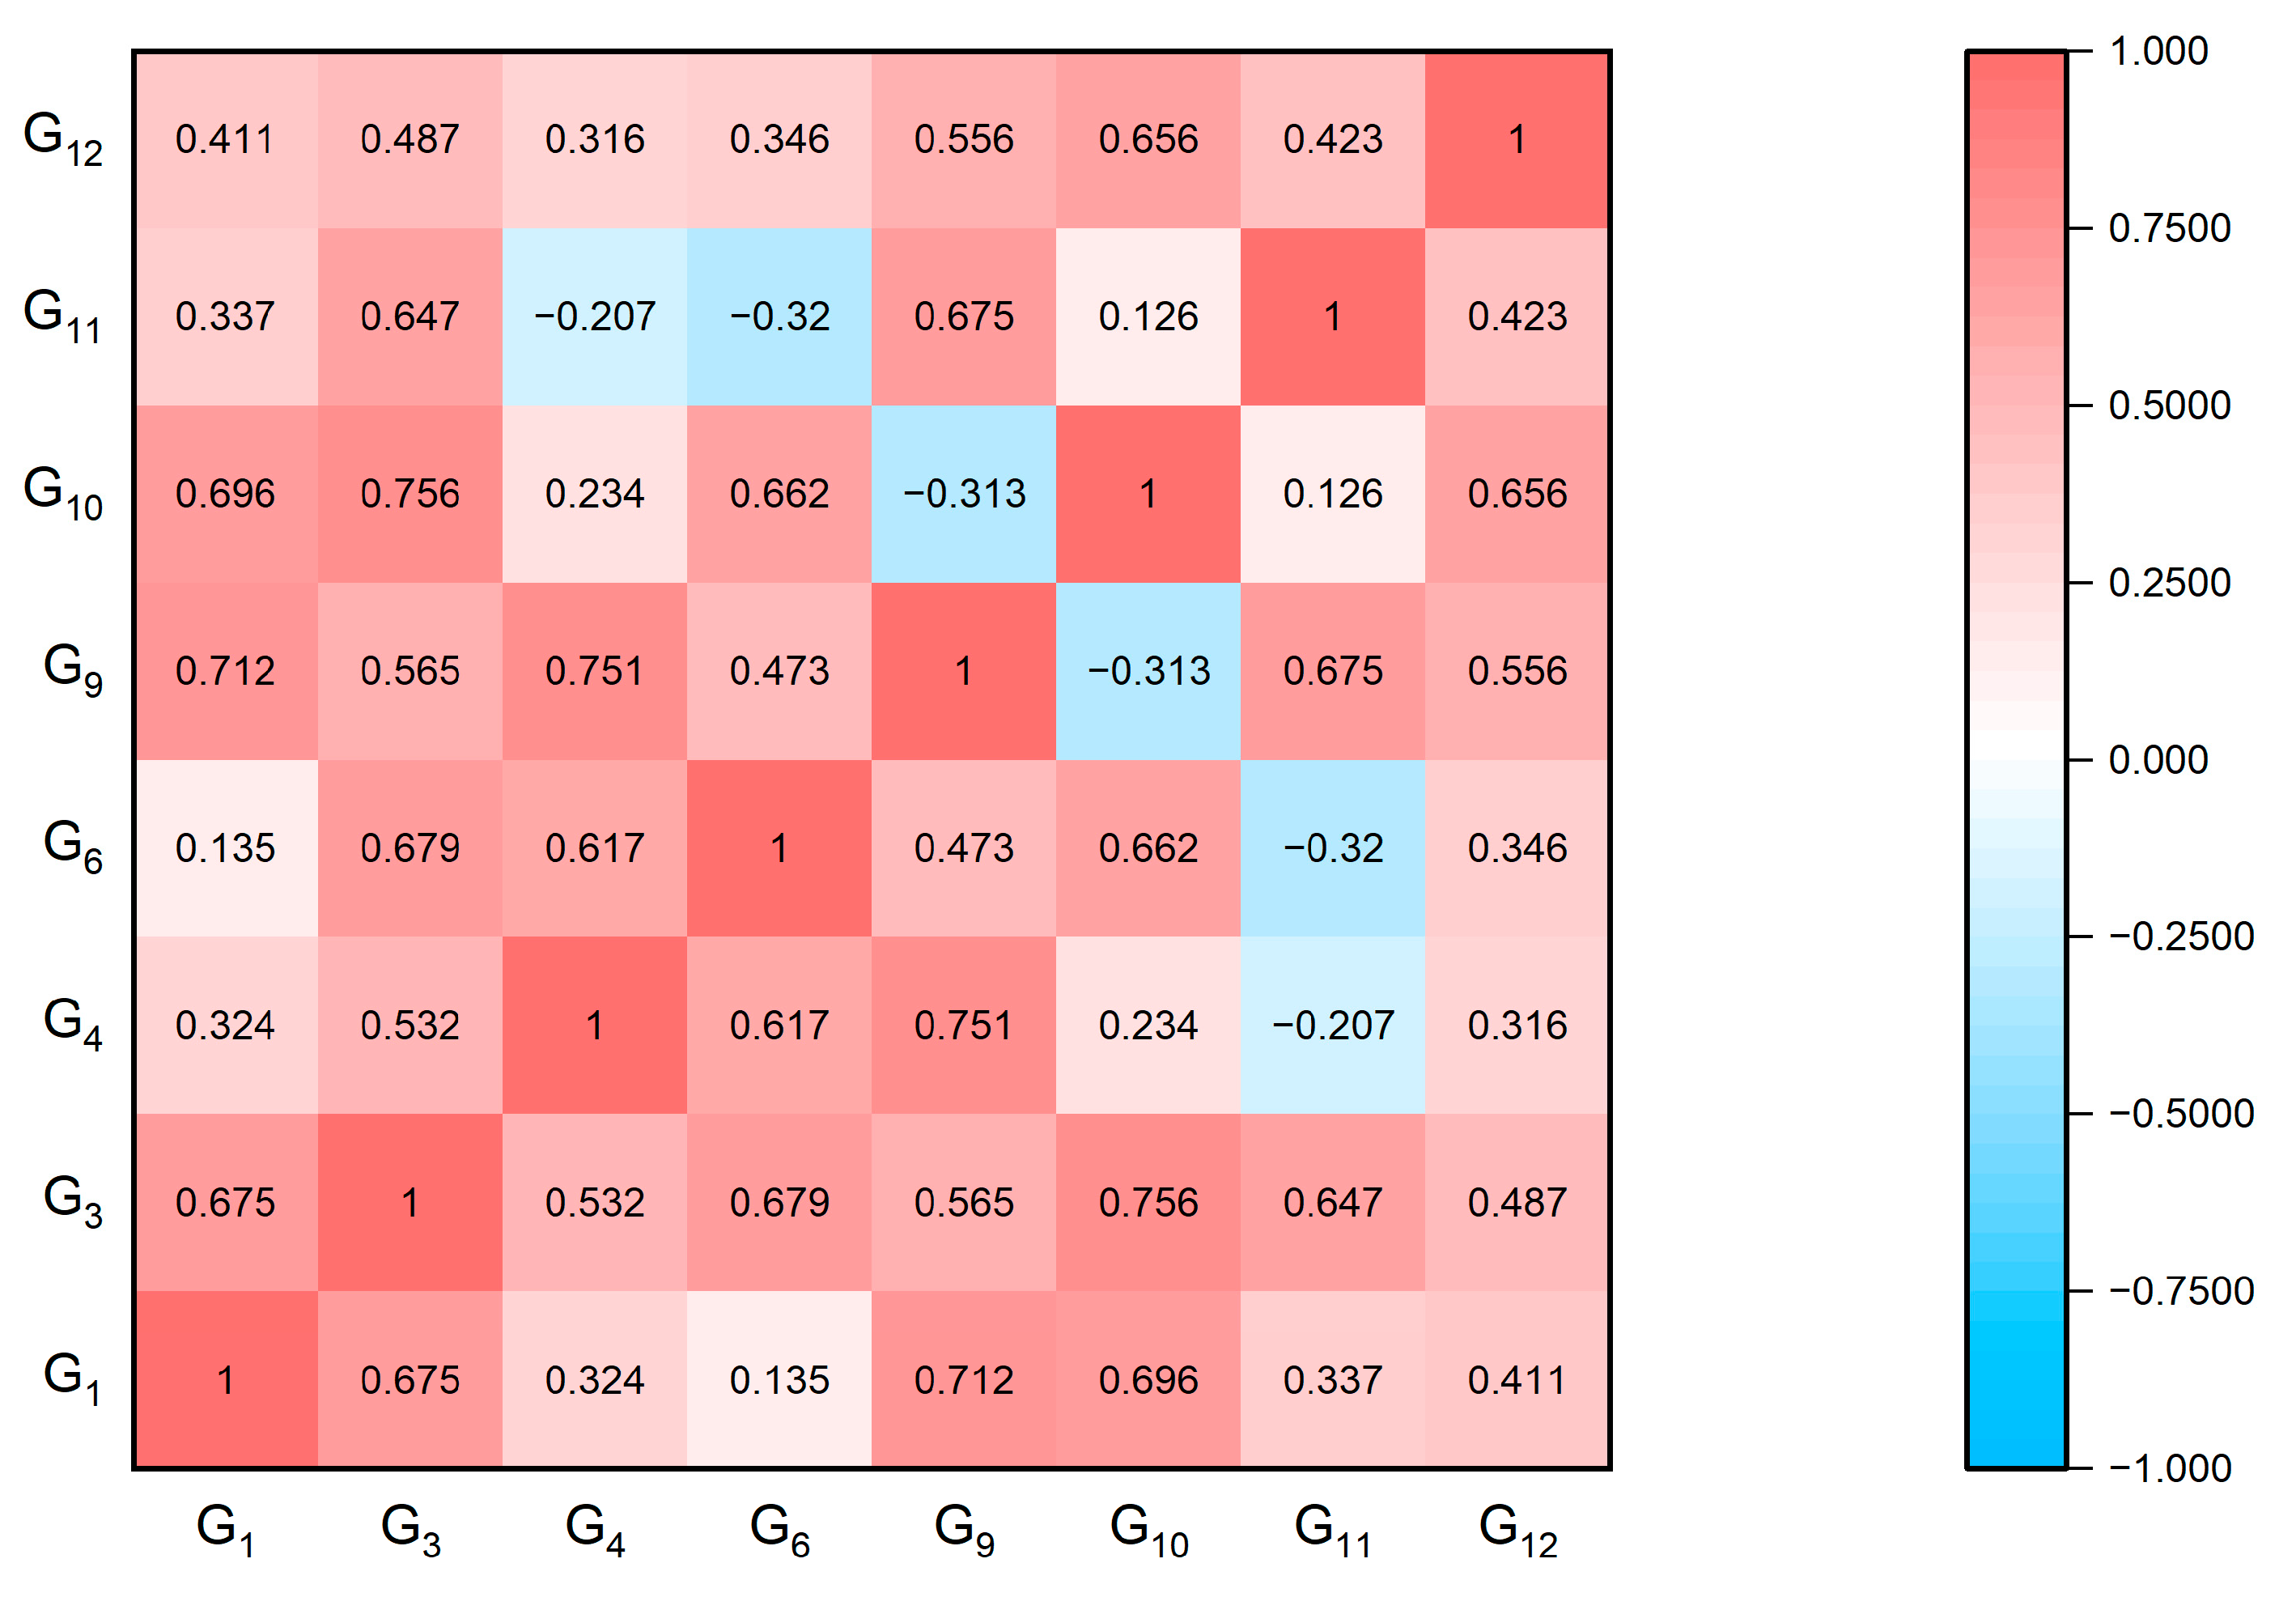
Subsequent analysis following G8’s elimination, as shown in Figure 5, confirms the improved properties of the refined measurement framework.
Figure 5 presents the Pearson correlation heatmap of the constituent elements for industrial design agglomeration, demonstrating that after eliminating highly correlated indicators, the refined system retains eight secondary indicators. The absolute values of correlation coefficients between all indicators remain below 0.8, effectively addressing potential multicollinearity issues. Consequently, this study has systematically reorganized and recoded the adjusted indicators, ultimately establishing a comprehensive evaluation framework comprising four primary indicators and eight secondary indicators for assessing industrial design agglomeration components. The detailed composition and specifications of this finalized indicator system are presented in Table 4.

4.2. Construction of Innovation Performance Metrics in Manufacturing

The concept of “innovation” was first introduced by Joseph Alois Schumpeter, emphasizing its inherent originality and transformative characteristics. Within the manufacturing sector, innovation performance typically encompasses the entire process from conceptualizing novel ideas and developing technologies to commercializing innovative products that generate economic returns. While scholarly consensus has been achieved regarding the conceptual dimensions of innovation performance, substantial divergence persists in operational measurement methodologies, with no universally accepted standards currently established [42]. Consequently, developing a scientifically rigorous, systematically structured, and practically applicable evaluation framework has emerged as a pivotal research focus for assessing manufacturing innovation capabilities, prompting continued methodological refinements. Early investigations into corporate innovation performance predominantly relied on subjective metrics, including perceptual measures of innovativeness and managerial assessments of innovation activities [19,20,21]. However, enhanced data accessibility and measurement precision have driven a paradigm shift toward objective quantitative indicators in recent years, exemplified by patent application volumes, grant rates, and new product sales revenues [43,44,45,46].
Building upon extant research, this study constructs an innovation performance evaluation system for manufacturing enterprises through two fundamental dimensions: “innovation input” and “innovation output.” Regarding innovation inputs, the allocation of R&D expenditures and high-caliber research personnel constitutes the material foundation for corporate innovation activities. Particularly within the context of deepening big data applications and digital transformation, the manufacturing sector is undergoing an evolutionary shift from labor-intensive to capital-intensive paradigms, wherein the proportion of capitalized R&D expenditures has become a critical metric for evaluating the efficiency of innovation resource utilization [47]. Accordingly, this study adopts “enterprise R&D investment intensity” as the primary indicator for innovation input measurement.
For innovation outputs, patents serve as legally codified manifestations of technological achievements, offering both quantifiable measurement advantages and objective reflections of corporate innovation capabilities. The progressive strengthening of China’s intellectual property protection regime has significantly enhanced the statistical reliability and legal enforceability of patent data, which has improved its comparative validity in academic research [48]. This study consequently employs both “Patent Applications (count)” and “Patents Granted (count)” as dual core indicators for assessing innovation outputs.
In existing research, scholars generally adopt the number of patent applications or grants as the core indicator for measuring innovation output, as patent data are considered to have strong objectivity, accessibility, and comparability [49,50]. Accordingly, patent counts have become the predominant proxy variable in numerous empirical studies on innovation performance. However, it is also widely acknowledged that innovation output is not limited to patentable technological achievements, but also encompasses outcomes with more qualitative characteristics—such as design creativity, improvements in user experience, and business model innovation—which are often difficult to directly capture in quantitative research, potentially resulting in indicator omissions. This study follows the mainstream approach of using patent counts in constructing the indicator system, while recognizing its limited coverage of qualitative innovation outcomes. Future research should introduce more diverse indicators to enhance the comprehensiveness of the evaluation.
Through this analytical framework, the study establishes a preliminary evaluation index system for manufacturing innovation performance, with detailed specifications presented in Table 5.
However, while Y2 (Patent Applications (count)) may serve as a preliminary indicator of R&D activity intensity, it does not inherently correlate with successful technology commercialization or tangible market impact. Some enterprises engage in strategic patent proliferation—submitting excessive applications primarily to qualify for government incentives or policy benefits—without subsequent development of commercially viable products or process innovations. This measurement distortion could artificially inflate perceived innovation capacity while failing to reflect genuine technological advancement. Consequently, we have excluded Y2 from our final evaluation framework. To address the inherent time lag between patent filing and grant approval—which often spans multiple examination cycles—our study employs a one-year delayed patent grant count as the operative metric for Innovation Performance Output.
After adjustment, this study establishes an evaluation index system for the innovation performance of manufacturing enterprises, as shown in Table 6.

5. Data Analysis

5.1. Analysis of Industrial Design Agglomeration Characteristics

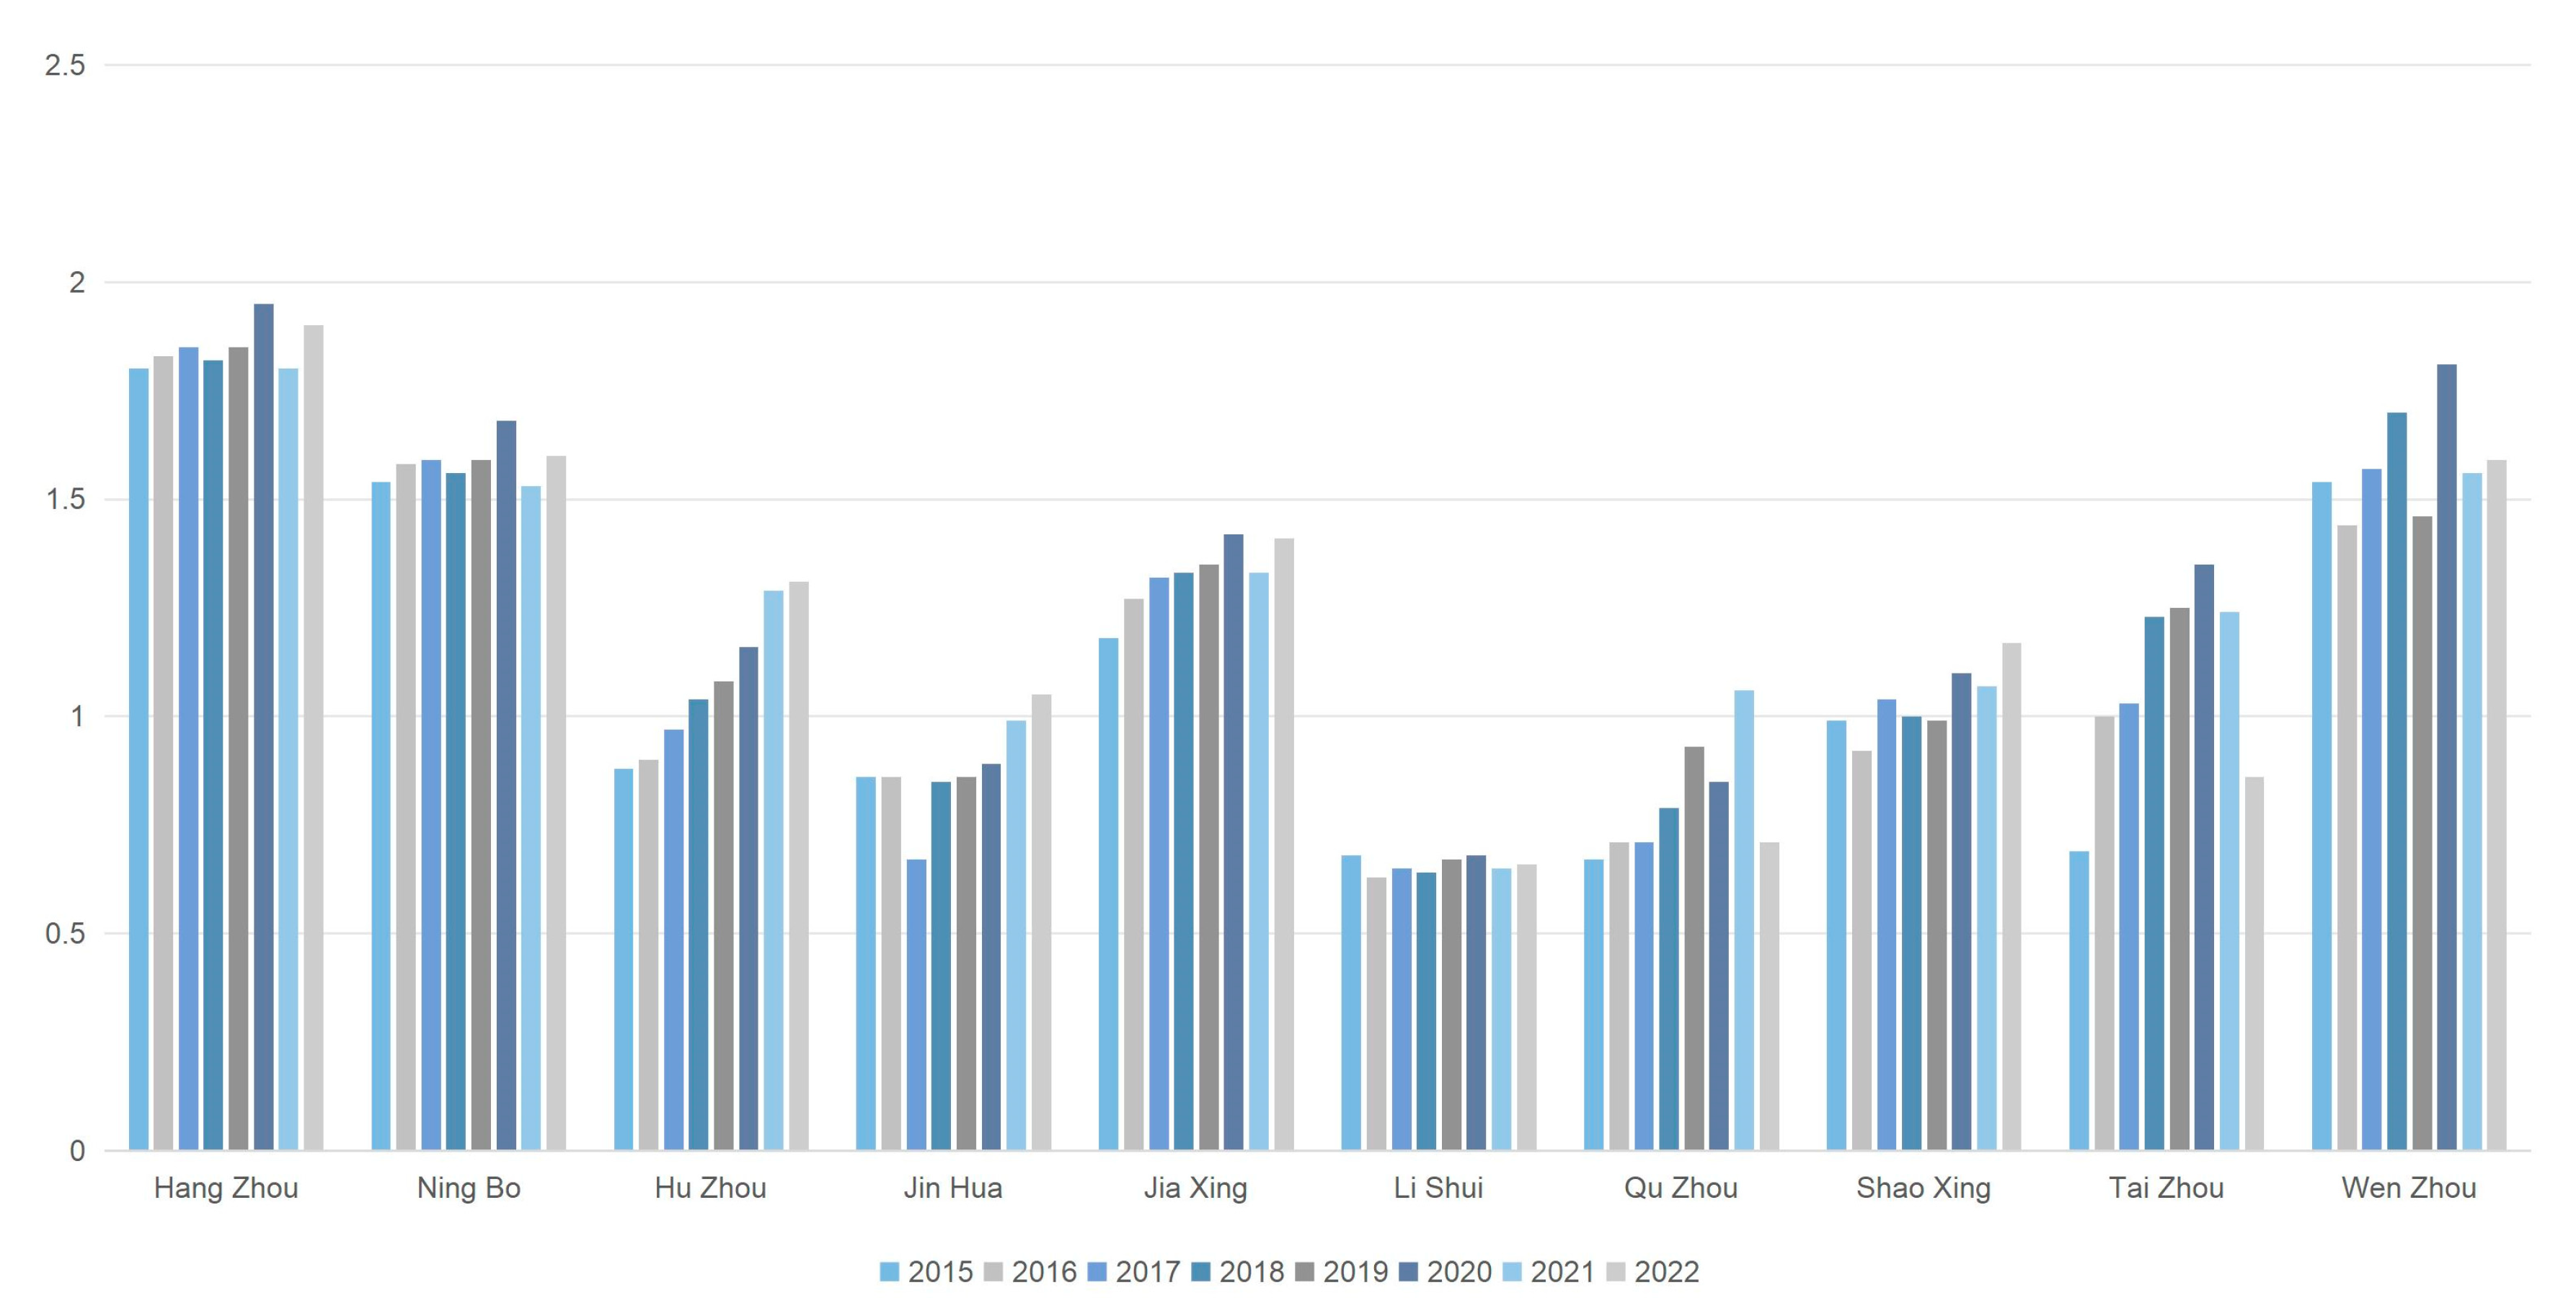
In recent years, Zhejiang Province has witnessed a sustained trend toward high agglomeration and high output in its industrial design sector, establishing it as a pivotal driver of manufacturing innovation. Spatially, the ten prefecture-level cities exhibit marked hierarchical disparities in industrial design agglomeration intensity (Figure 6). Hangzhou consistently dominates the location quotient rankings, demonstrating a “leading cluster” pattern attributable to its economic strength, talent concentration, and policy support. Coastal cities like Ningbo and Wenzhou follow with secondary agglomeration effects, fueled by their robust manufacturing foundations. In contrast, underdeveloped regions such as Lishui and Quzhou display relatively lower agglomeration levels due to weaker industrial bases and resource constraints. The province has thus evolved a characteristic spatial pattern: “Hangzhou-Ningbo leadership, Wenzhou-Taizhou support, and Jinhua-Yiwu collaboration”.
Sectoral analysis reveals a positive correlation between agglomeration intensity and innovation output metrics. Trend analysis of Commercialized Output Value (G2), Patents Granted (G3), and Design Transactions (G4) confirms Hangzhou and Ningbo’s sustained dominance in output performance, indicating successful translation of agglomeration advantages into innovation capacity. Meanwhile, although policy interventions have improved outcomes in Lishui and Zhoushan, their overall contributions remain marginal, reflecting a “clustering without strengthening” phenomenon.
The findings collectively demonstrate Zhejiang’s multi-tiered industrial design agglomeration landscape across spatial distribution, innovation output, and policy environments. However, persistent regional imbalances necessitate targeted policy interventions and resource allocation to elevate the design capabilities of central and western cities.

5.2. Analysis of Manufacturing Innovation Performance Characteristics

The assessment of manufacturing innovation performance extends beyond sustained growth in R&D investment to encompass technology commercialization capabilities. Zhejiang’s manufacturing sector has demonstrated marked innovative capacity enhancement in recent years, significantly influenced by synergistic development with the industrial design industry. To systematically examine regional disparities and evolutionary trajectories, this analysis evaluates two critical dimensions: R&D investment intensity and innovation output performance.
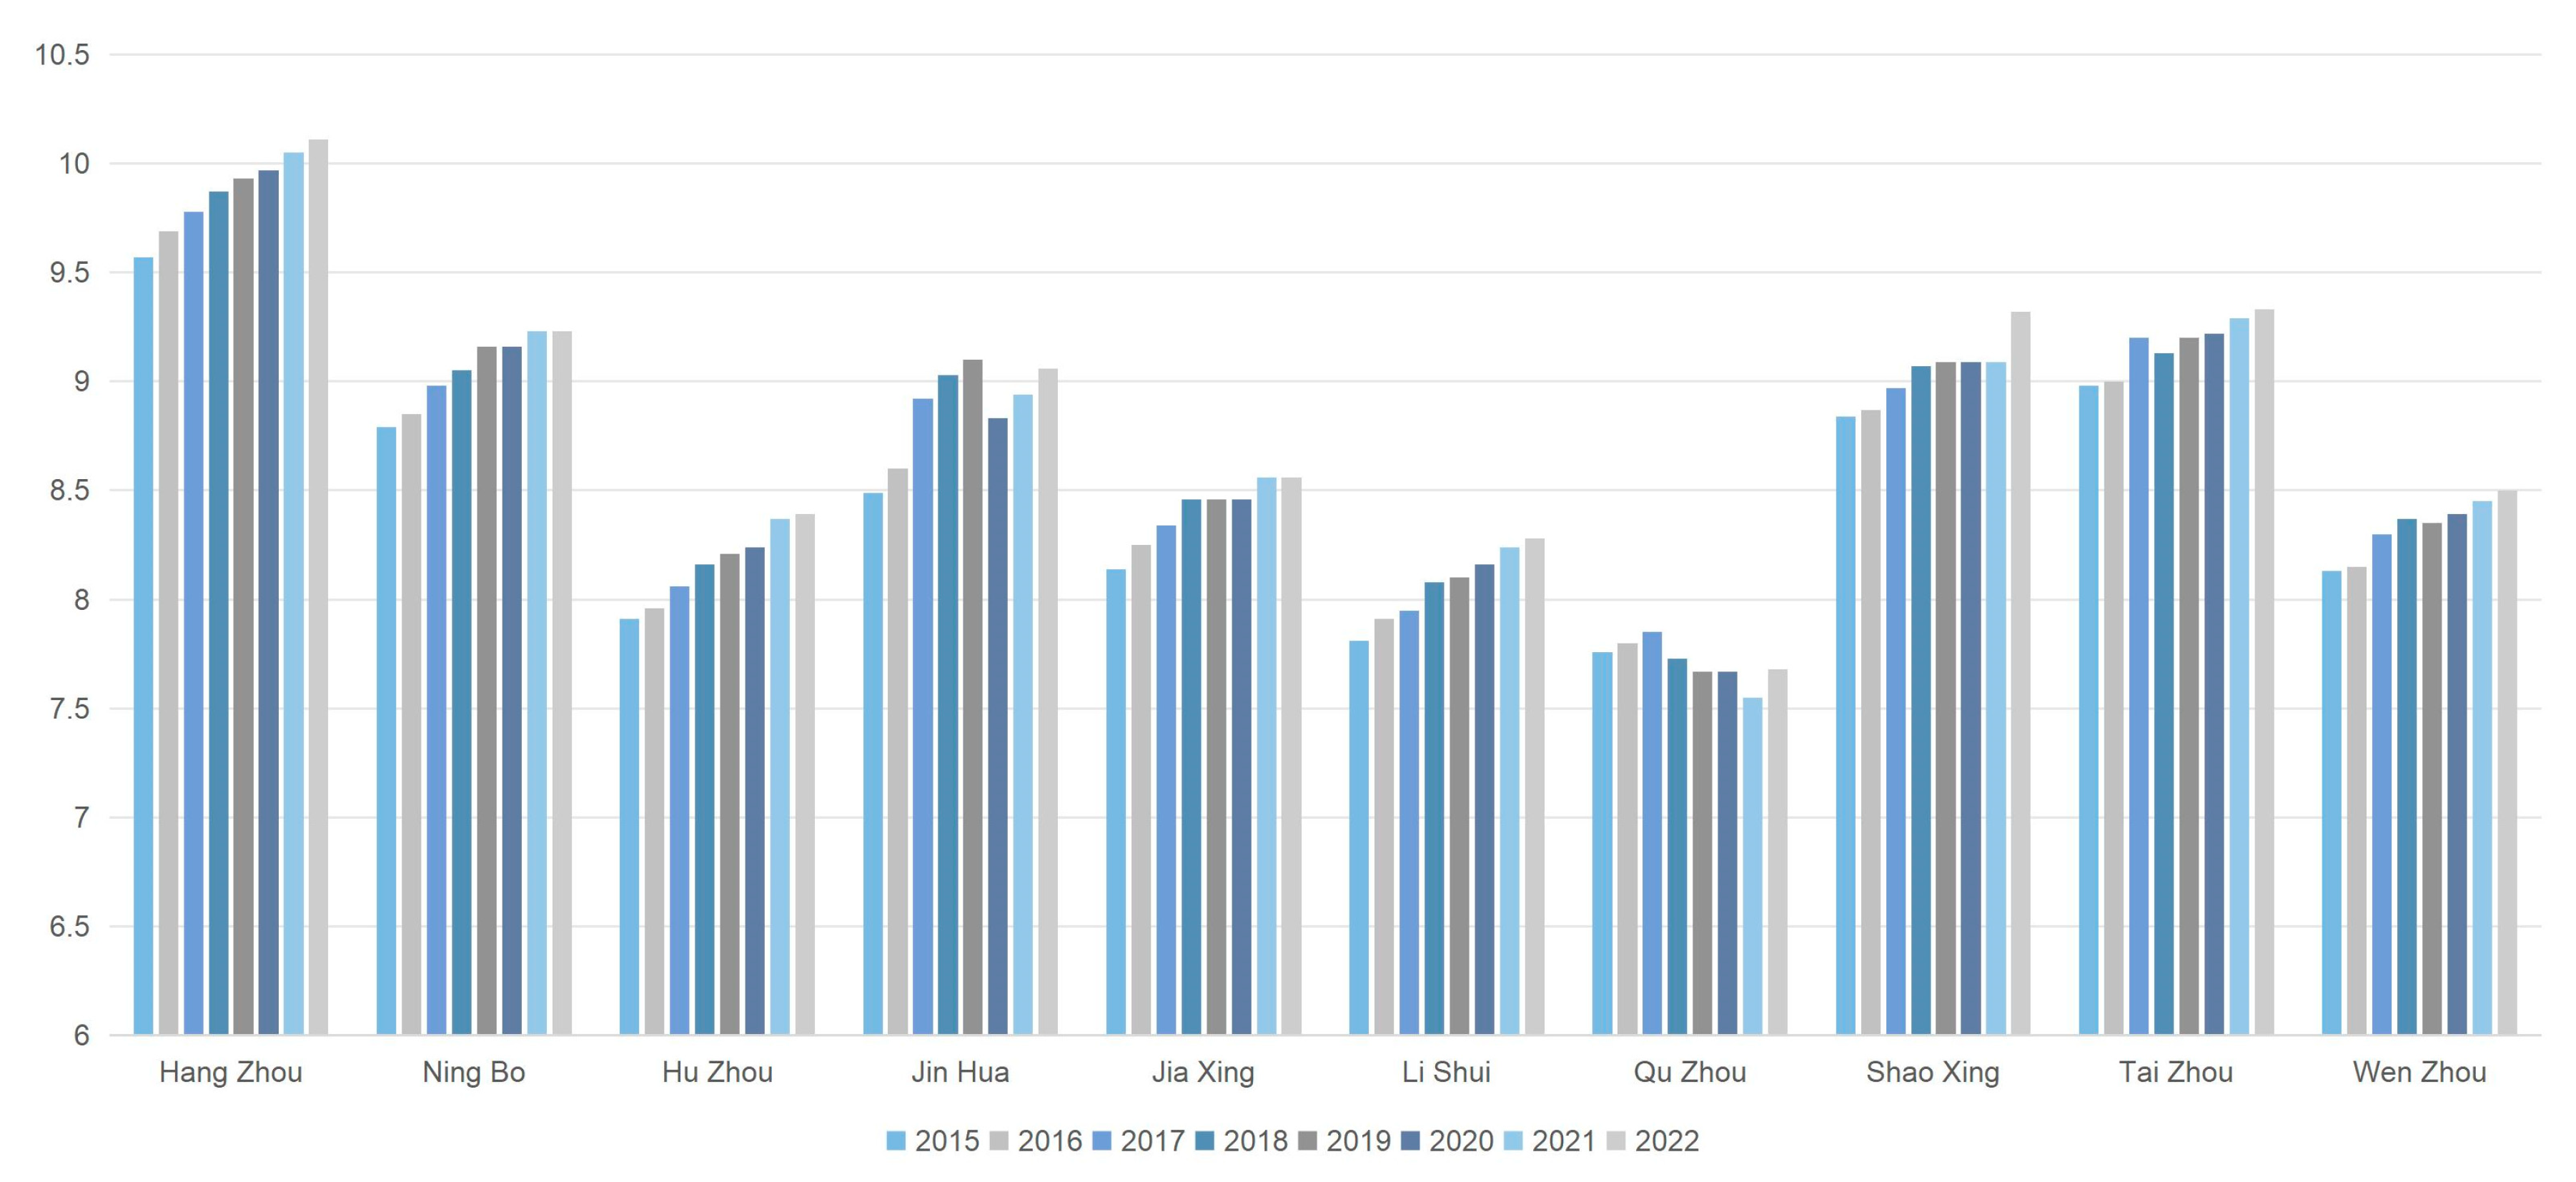
As illustrated in Figure 7, municipal-level R&D expenditures across Zhejiang’s 11 cities maintained consistent growth from 2015 to 2022. Hangzhou and Ningbo sustained superior investment intensity, attributable to their concentration of innovation platforms, research institutions, and premium design resources. Emerging regions like Jinhua and Taizhou exhibited accelerated growth rates, signaling the awakening of innovation potential in central Zhejiang.
Regarding output metrics, patent applications displayed progressive annual growth, with Hangzhou and Ningbo demonstrating particular prominence. Notably, while cities such as Huzhou and Shaoxing have not established input advantages, their accelerated patent grant growth rates indicate improving commercialization efficiency. This phenomenon likely correlates with local initiatives promoting “design-manufacturing integration” and enhanced technical service platforms.
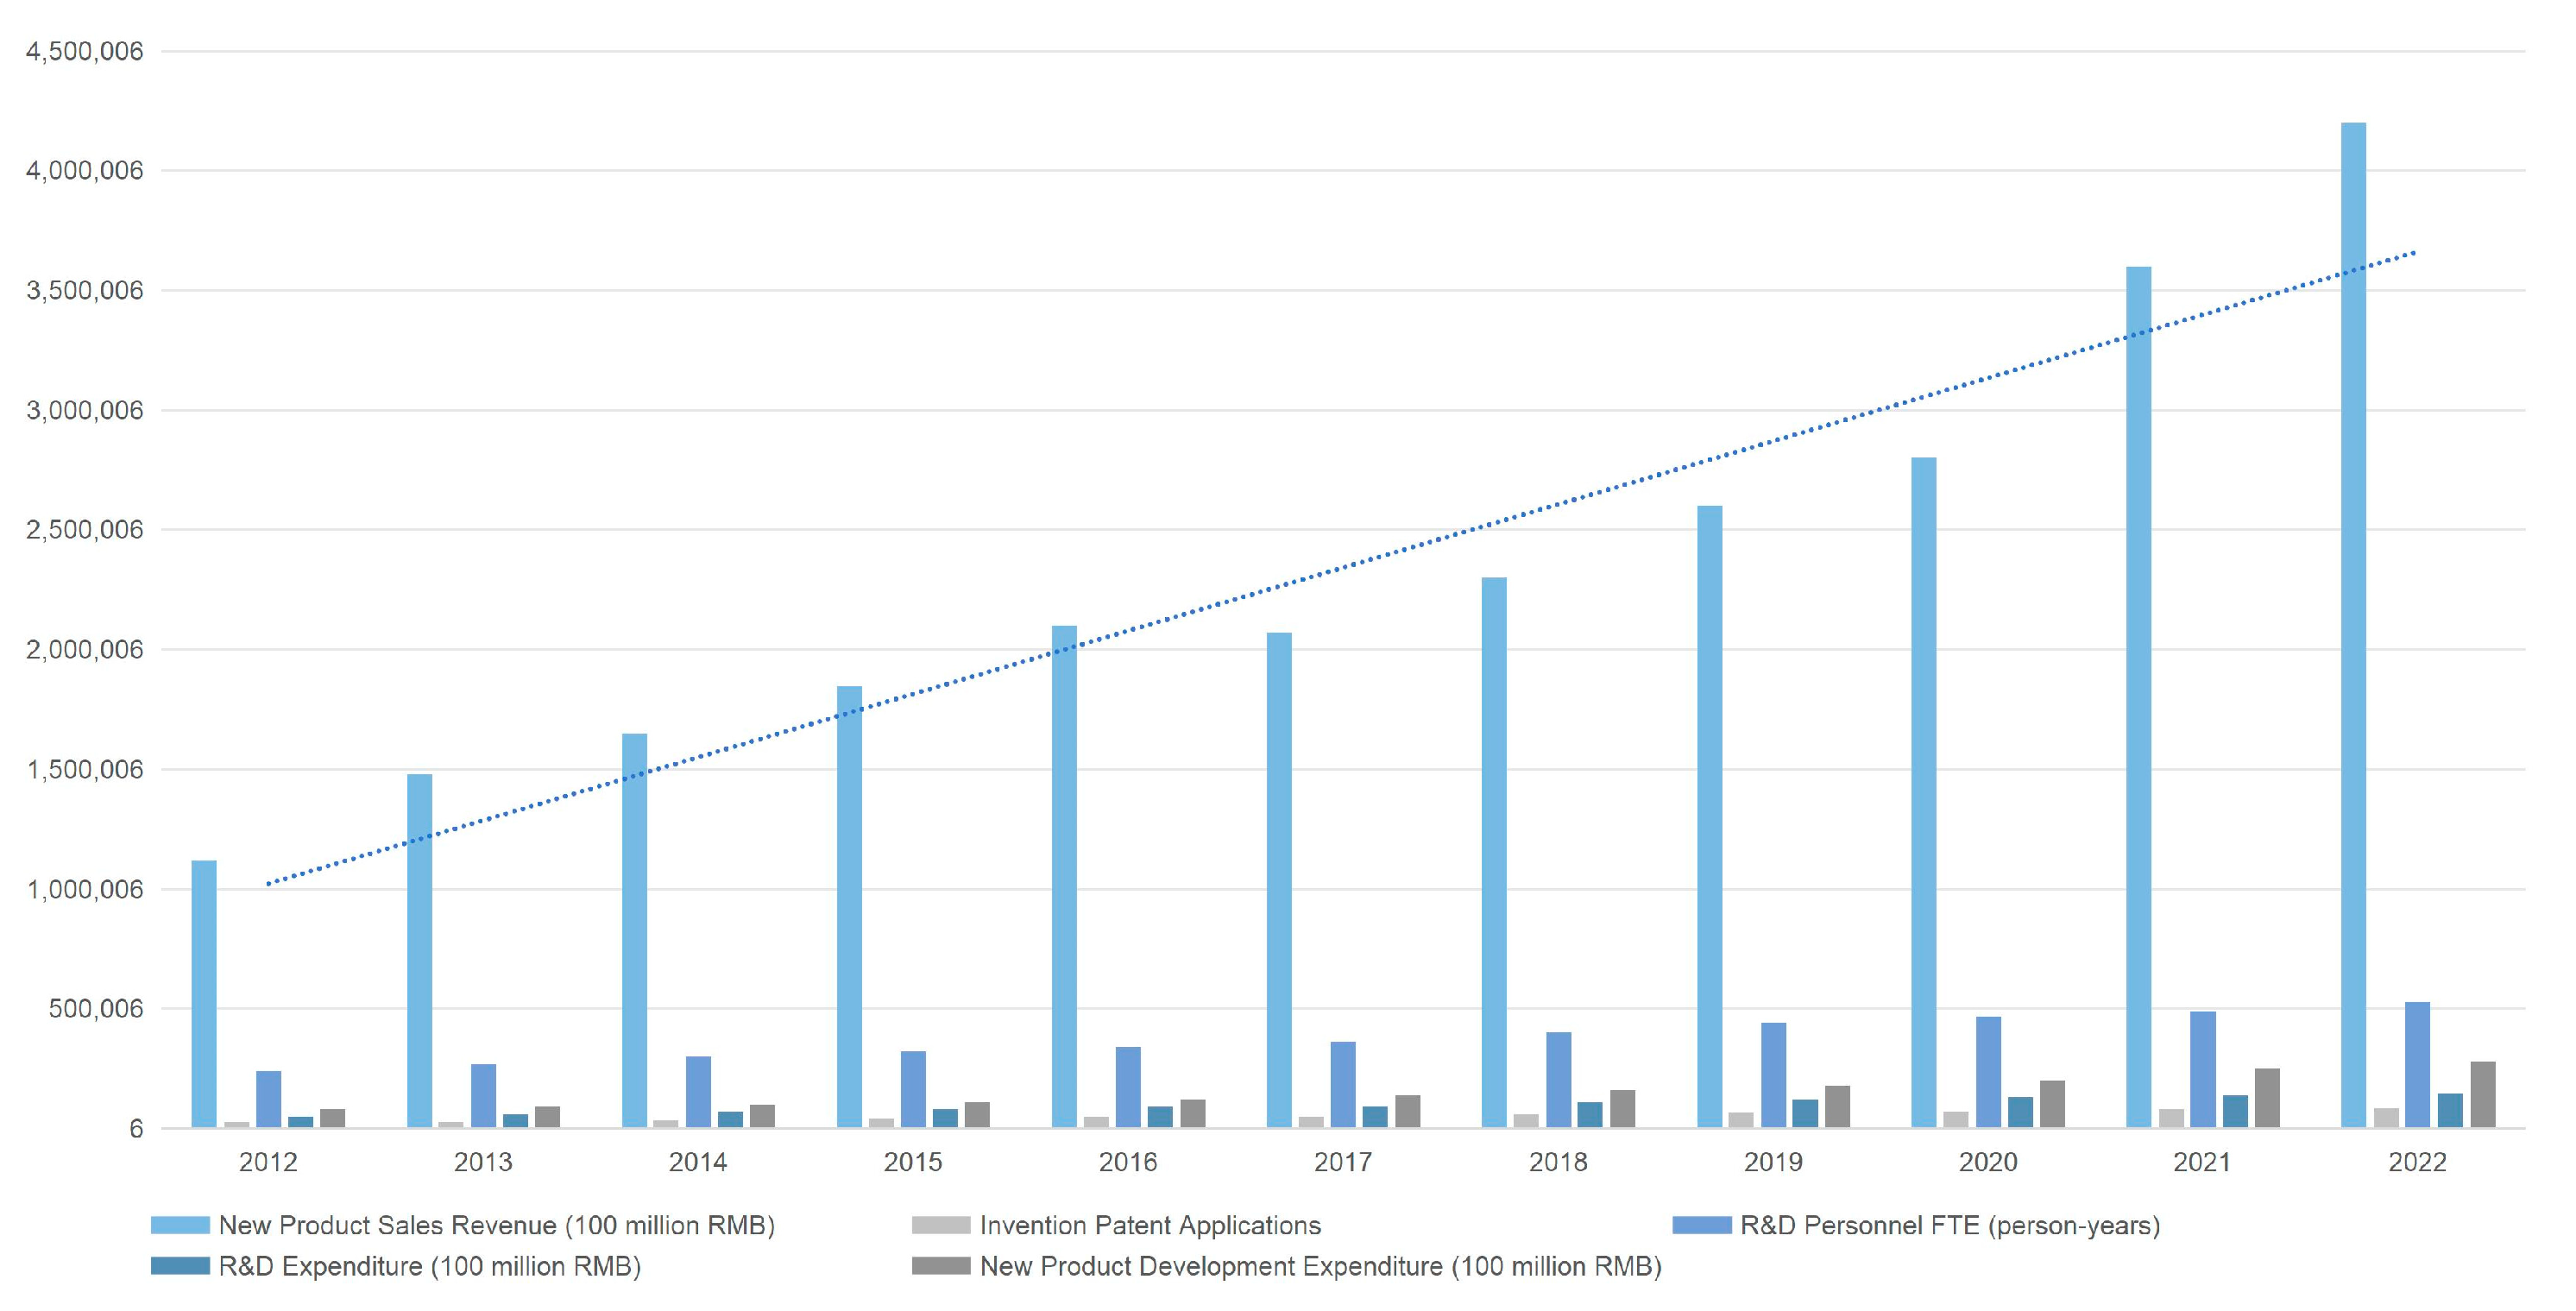
As shown in Figure 8, during the period 2012–2021, Zhejiang’s manufacturing sector exhibited an overall upward trend in R&D expenditure, full-time equivalent (FTE) R&D personnel, and outputs related to new products, reflecting the continuous strengthening of innovation activities. At the same time, however, stage-specific fluctuations and structural divergences can also be observed, suggesting that there remains room for improvement in innovation quality and value chain positioning. This set of trend evidence from official statistics provides contextual background for the subsequent empirical test on whether “industrial design agglomeration can reinforce innovation input and output,” and resonates with the policy recommendations on “design–manufacturing collaboration and digital transformation” discussed later.
The comprehensive analysis reveals a “core-driven, gradient progression” spatial pattern in Zhejiang’s manufacturing innovation. Leading cities leverage design resource agglomeration to generate demonstration effects in both input and output dimensions, while central-western cities display growing innovation vitality through policy support and industrial transformation. Future development should intensify design-manufacturing integration to accelerate technology industrialization and elevate overall innovation performance.

5.3. Model Specification

The study employs panel data analysis, which necessitates selection among three potential model specifications: the pooled estimation model (POOL), fixed-effects model (FE), and random effects model (RE). Prior to model determination, we conducted comprehensive diagnostic testing—including F-tests, Breusch-Pagan tests, and Hausman tests—for both dependent variables Y1 and Y2. The test outcomes, presented in Table 7, inform our modeling strategy.
The diagnostic framework follows established econometric principles: (1) F-tests compare FE versus POOL specifications, with p < 0.05 favoring FE; (2) Breusch-Pagan tests evaluate RE against POOL, where p < 0.05 suggests RE superiority; (3) Hausman tests discriminate between FE and RE, with p < 0.05 indicating FE preference. The results demonstrate that for both Y1 (Enterprise R&D Investment Intensity) and Y2 (Patents Granted), the F-tests achieved statistical significance at the 5% level (p = 0.000 < 0.05), indicating the FE model’s superiority over the POOL specification. Similarly, the Breusch-Pagan tests showed significant results (p = 0.000 < 0.05), suggesting the RE model outperforms the POOL approach. Most critically, the Hausman tests yielded strongly significant outcomes (p = 0.000 < 0.05), establishing the FE model as preferable to the RE alternative.
The diagnostic outcomes collectively support adopting a fixed-effects specification. This decision is further justified by two methodological considerations: (1) mitigation of potential endogeneity concerns, and (2) accommodation of both individual and time fixed effects present in our panel data structure. Consequently, we implement the two-way fixed-effects model specified in Equation (7) for subsequent analysis, which appropriately controls for unobserved heterogeneity while maintaining estimation efficiency.

5.4. Model Estimation Results

To systematically examine the relationship between industrial design agglomeration components and manufacturing innovation performance, we employ a two-way fixed-effects model for empirical analysis. The study utilizes panel data from 2015 to 2022, incorporating innovation performance metrics of manufacturing firms listed in Zhejiang Province and agglomeration indicators from 16 major design industrial parks. The econometric specification treats municipal-level manufacturing innovation performance as the dependent variable, with corresponding annual design industry agglomeration metrics as independent variables. Three critical dimensions—design industry scale, human capital, and regional development environment—are incorporated as control variables. The estimation follows Equation (4), with detailed regression outputs presented in Appendix A Table A1.

5.5. Robustness Checks

To ensure the reliability and validity of our findings, we conduct rigorous robustness checks, building upon our baseline regression model. Following the methodological approach of Liu et al. [51], we employ Gaussian Mixture Models (GMM) to verify the consistency of our initial results. As demonstrated in Appendix A Table A2, the GMM estimates maintain remarkable consistency with our original Ordinary Least Squares (OLS) results across all core explanatory and control variables, thereby confirming the robustness of our primary regression findings.

5.6. Interpretation of Regression Results and Hypothesis Testing

Before proceeding to the specific hypothesis testing, it should be noted that although this study focuses on provincial-level design parks and listed manufacturing companies in Zhejiang Province—thus not fully covering all small- and medium-sized enterprises or non-park firms—this sample may entail a degree of selection bias. Nevertheless, this group holds high representativeness and leadership within the regional economy. Listed firms typically dominate in terms of economic scale, industrial influence, and R&D investment, while design parks concentrate the most innovative and spillover-intensive resources in the region. Therefore, the dataset used in this study provides a focused reflection of the key trends and mechanisms linking industrial design agglomeration with manufacturing innovation performance. Caution should be exercised when generalizing the findings to broader industries and regions, but the results offer strong explanatory power in interpreting the characteristics of core enterprises and cluster development at the regional level.

5.6.1. H1: The Relationship Between Industrial Design Agglomeration and Manufacturing Innovation Performance

The regression results show that the coefficient of industrial design agglomeration on manufacturing innovation input is 0.084, and on innovation output is 0.107, both significant at the 1% level. This indicates that an increase in design agglomeration is associated with an 8.4% improvement in manufacturing R&D intensity and a 10.7% increase in patent output, thereby confirming H1: industrial design agglomeration has a significant positive effect on manufacturing innovation performance. This pathway aligns with the knowledge spillover mechanisms of industrial agglomeration and further provides empirical evidence of the critical supporting role of producer service agglomeration within the innovation-driven chain [52,53,54].
As a specialized productive service, industrial design agglomeration may enhance manufacturing R&D investment and patent grants through two primary mechanisms: improved access to professional services and intensified competitive innovation incentives. The geographic concentration of design firms can provide manufacturers with immediate access to high-quality design expertise, reducing uncertainty and transaction costs in innovation processes while increasing R&D willingness. Furthermore, the competitive environment fostered by agglomeration tends to create strong innovation incentives—manufacturers facing concentrated competition increase R&D investments to maintain market position, while the innovation-oriented ecosystem could promote technological advancement through patent production, collectively elevating regional innovation capacity.

5.6.2. H2: The Relationship Between Industrial Design Industry Scale and Manufacturing Innovation Performance

The regression results show that the coefficients of design achievement transaction volume with manufacturing R&D investment and patent grants are 0.038 and 0.076, respectively, while the regression coefficients of patent quantity are 0.059 and 0.137. All are significant at the 5% level, thereby confirming Hypothesis H2 and indicating that the scale of the industrial design industry has a significant positive effect on manufacturing innovation performance. This finding echoes the empirical results of Yang et al. [55], which suggest that “specialized agglomeration, compared with diversified agglomeration, more significantly enhances innovation output.” It implies that when the design industry expands its scale to achieve higher specialization and transactional density, its capacity to stimulate manufacturing innovation becomes more pronounced.
Design patents can represent technological accumulation that may provide manufacturing with innovative solutions, whereas design transactions offer market-validated innovations that help accelerate product development cycles. This dual mechanism creates a virtuous cycle: design patents tend to strengthen manufacturers’ technical confidence and R&D commitment, while design transactions provide immediate market feedback that may help reaffirm innovation strategies. The expanded design industry scale thus appears to delivers both technological support and commercial validation, potentially incentivizing sustained manufacturing innovation investment and efficient commercialization.

5.6.3. H3: The Role of Industrial Design Human Resources in Manufacturing Innovation Performance

The coefficients of industrial design human resources on manufacturing innovation input and output are 0.014 and 0.062, respectively, neither of which is significant at the 5% level. This indicates that an increase in the number of design personnel has not yet led to a significant improvement in manufacturing innovation performance, thereby rejecting Hypothesis H3. This result contrasts with some literature that highlights the positive impact of human capital on innovation performance—for example, Asif et al. [56], based on samples of technology-driven firms, found that human capital exerts a significant positive effect on innovation. By contrast, the subjects of this study are primarily regional manufacturing enterprises that have not yet established design-driven strategic mechanisms. Insufficient organizational integration and lack of strategic recognition may reflect deeper issues concerning the quality and structure of current industrial design human resources.
First, the transformation and upgrading of manufacturing, driven by demand for high-value-added products and complex technological solutions, requires design talent not only to possess creativity but also to understand manufacturing processes, user experience, and market trends. However, the increase in the number of industrial designers has often been accompanied by an influx of inexperienced and less-skilled junior designers, leading to a “skills mismatch” between talent supply and job requirements. Second, systematic training and multidisciplinary capability development are insufficient within design career pathways, resulting in a shortage of senior designers. This undermines the potential for mentoring mechanisms to raise overall capacity. Moreover, some manufacturing firms still confine the role of design to product appearance or promotional packaging, rather than embedding it throughout the product development process. This prevents design professionals from playing a strategic role and limits the effective transformation of their innovative contributions.
In summary, the “quantitative expansion” of design human resources has not translated into “qualitative enhancement,” thereby weakening their support for manufacturing innovation performance. In the long term, however, as talent reserves mature, education quality improves, and firms deepen their strategic recognition of design, industrial design human resources are expected to play a stronger role in driving manufacturing innovation through multidimensional capacity building, fostering cross-domain collaboration and industrial upgrading.

5.6.4. H4: The Moderating Effect of Regional Development Environment on Manufacturing Innovation Performance

Government intervention exerts a significant negative moderating effect on the relationship between regional development environment, design industry agglomeration, and manufacturing innovation performance (the interaction term coefficient is negative and significant at the 1% level). This indicates that in regions with stronger government intervention, the positive impact of design agglomeration on manufacturing innovation performance is weakened. Such an outcome may reflect an institutional constraint whereby “policy over-coverage weakens the incentives for independent innovation,” which is consistent with the logic in innovation cluster theory that emphasizes institutional provision over direct intervention.
Specifically, different types of intervention measures may generate differentiated effects. On the one hand, excessive direct subsidies and tax incentives can foster reliance on external support, thereby undermining firms’ motivation to enhance their core competitiveness through design-driven innovation. On the other hand, directive planning often restricts firms’ autonomy in R&D investment and design application, leading to homogeneous innovation pathways that hinder the full realization of design agglomeration effects.
Conversely, regional innovation vitality, talent pool, and financial service capacity show significant positive associations (1% level) with manufacturing innovation. These factors collectively contribute to an ecosystem where design innovation flourishes: vibrant innovation cultures can stimulate design-manufacturing collaboration, skilled talent pools may provide technical support, and developed financial systems mitigate funding constraints—enabling design to fulfill its potential as a manufacturing innovation catalyst.

6. Policy Recommendations and Validation Refinement

6.1. Formulation of Preliminary Policy Recommendations

The empirical findings substantiate the significant catalytic effect of industrial design agglomeration on manufacturing innovation performance. Grounded in this evidence, we propose a dual-tier policy framework integrating macro-level governance with micro-level support mechanisms. This systematic guidance architecture addresses regional developmental disparities through four strategic dimensions: spatial optimization, digital transformation, talent ecosystem cultivation, and governmental function reorientation. The framework advocates gradient development strategies for spatial planning, implementing differentiated guidance based on regional agglomeration levels, intelligent design infrastructure construction and AI-assisted design technology adoption, enhanced industry-academia-research collaboration for multidisciplinary talent development, and governmental transition from direct intervention to institutional provisioning.
(1) Establishing Differentiated Agglomeration Strategies Based on Regional Foundations
The agglomeration development of the industrial design sector must be grounded in rigorous analysis of regional characteristics and industrial foundations. Given the current regional development disparities, differentiated agglomeration guidance strategies should be implemented.
At the macro level, low-agglomeration regions typically exhibit three distinctive characteristics: scarcity of design firms, deficiency in innovation resources, and underdeveloped industrial chain support. For these regions, fundamental capacity-building strategies should be prioritized, including:
  • Strategic planning and development of specialized design industrial parks, supported by fiscal incentives such as land concession fee reductions and corporate income tax exemptions (three-year full exemption followed by three-year 50% reduction) to attract design institutions.
  • Concurrent development of professional infrastructure systems encompassing rapid prototyping laboratories, material libraries, and user experience testing centers.
  • Implementation of “Design+” industrial integration programs to foster long-term collaborative partnerships between local manufacturers and newly introduced design organizations.
For medium-to-high agglomeration regions with established industrial scale, policy focus should shift toward enhancing cluster quality and innovation efficiency through:
  • Establishment of design innovation alliances to facilitate specialized division of labor and collaboration among enterprises.
  • Targeted cultivation of industry leaders capable of providing comprehensive system solutions, supported by the development of provincial-level industrial design centers.
  • Formation of integrated “R&D-Design-Manufacturing” innovation chains with design as the driving force.
  • Complementary measures should include:
  • Development of design achievement trading platforms to facilitate intellectual property circulation
  • Formulation of industry standards to regulate market competition
  • Implementation of regional coordination mechanisms to encourage technology spillover and talent exchange from high-agglomeration to low-agglomeration areas
This multi-dimensional approach will ultimately establish a clearly stratified yet complementary regional industrial design ecosystem, achieving optimal resource allocation efficiency and comprehensive enhancement of industrial competitiveness.
(2) Advancing Digital Transformation in Industrial Design to Achieve Dual Expansion in Scale and Intelligence
The digital transformation of industrial design represents a critical pathway for enhancing industrial sophistication and competitive advantage. This transformation requires coordinated advancement across four key dimensions: infrastructure development, technology application, business model innovation, and ecosystem construction.
At the infrastructure level, regional authorities should accelerate the establishment of cloud-based industrial design service platforms. These platforms should integrate computing resources, design tool libraries, and industry-specific databases, with particular emphasis on deploying GPU cluster-based real-time rendering systems, high-performance computing nodes capable of multi-physics simulations, and design resource repositories accommodating millions of 3D models. In technology application, enterprises should be guided to deeply implement generative AI design systems trained on industry-specific large language models for intelligent product form generation and optimization, digital twin technology for design verification so as to establish closed-loop feedback mechanisms from virtual prototypes to physical samples, and blockchain-based collaborative platforms to ensure secure cloud-based cooperation among distributed teams. For business model innovation, the focus should shift from traditional design services to platform-based solutions, including subscription-based design tools, modular design component marketplaces, crowdsourced design innovation platforms, and third-party service platforms with intelligent design resource matching capabilities. Ecosystem development requires market-oriented circulation of design data elements, construction of design knowledge graphs covering entire product lifecycles, and establishment of “design-manufacturing-user” data feedback loops. This comprehensive digital transformation will facilitate three fundamental transitions: (1) from isolated tool applications to fully digitized workflows; (2) from individual creativity to collective intelligence, and (3) from closed operations to open innovation. Ultimately, the industrial design sector will emerge as a core driver of high-quality manufacturing development. By enhancing its own scale efficiency while upgrading manufacturing value chains through design data flows, a virtuous cycle between design innovation and industrial advancement can be achieved.
(3) Establishing an Industry-Academia-Research Integrated Talent Development System to Enhance Design-Manufacturing Compatibility
The prevalent structural disconnect between creative design and engineering implementation necessitates a comprehensive industry-academia-research integration mechanism throughout the entire talent cultivation cycle. At the institutional level, we recommend that local governments establish regional industrial design education-industry alliances, consolidating resources from university design schools, manufacturing innovation centers, key laboratories, and industry leaders. These alliances should jointly develop dual-track “design + engineering” curricula, incorporating engineering modules such as materials science, mechanical principles, and smart manufacturing into design programs. Concurrently, an “industry mentor database” should be created to implement a dual-supervisor system, pairing senior engineers with over a decade of product development experience with design professors to jointly guide graduate projects. For practical training platforms, three key facilities should be prioritized. First, design workshop-style training centers equipped with advanced manufacturing tools including 5-axis machining systems and 3D printing clusters, enabling students to participate in complete product development cycles from concept sketching to prototyping; Second, industry-proposed project repositories where manufacturers annually submit authentic product improvement challenges as thesis topics, with outstanding solutions directly entering production pipelines; Third, technology transfer pilot platforms facilitating the application of university-developed materials and processes in design practice.
At the evaluation mechanism level, reforms should be enforced through an industry-participatory certification system incorporating engineering criteria like CMF (Color-Material-Finish) application competence and DFM (Design for Manufacturing) compliance, as well as the establishment of joint industry-academia innovation funds to prioritize research projects with commercialization potential. This tripartite approach—curriculum restructuring, platform co-development, and evaluation innovation—will fundamentally transform design education from its current overemphasis on artistic expression to balanced engineering implementation capabilities. The ultimate outcome will be a new generation of multidisciplinary designers proficient in both aesthetic conceptualization and manufacturing constraints, achieving seamless design-engineering integration and positioning industrial design as a central driver of product innovation.
(4) Enhancing the Institutional Innovation Support System and Transforming the Government Role
The industrial design sector requires fundamental reforms in institutional innovation support systems, necessitating a transformation of government roles from traditional regulators to ecosystem facilitators. This shift calls for replacing fragmented policy interventions with comprehensive institutional arrangements across multiple dimensions. In fiscal policy innovation, the conventional subsidy model should transition to market-oriented mechanisms. This includes implementing design innovation vouchers that allow manufacturing enterprises to claim tax deductions when purchasing design services, establishing risk compensation funds to mitigate innovation risks in design achievement industrialization, and introducing interest subsidy policies for design patent collateral financing to reduce intellectual property monetization costs. Platform development should focus on creating regional industrial design innovation centers that consolidate professional services including technology transfer, intellectual property valuation, and investment financing. These centers need supporting infrastructure such as design achievement valuation systems for transaction pricing references and design-manufacturing matchmaking databases to facilitate precise demand alignment. The institutional environment requires optimization through several measures: establishing comprehensive design service standards and quality certification systems, developing model contract templates to standardize transactions, implementing efficient dispute resolution mechanisms, and incorporating design achievements into high-tech enterprise evaluation criteria. To strengthen collaborative innovation networks, policymakers should encourage forming cross-sector industrial design alliances, launch interdisciplinary “Design+” research initiatives, organize regular demand-supply matching events, and create shared talent platforms. Such an integrated policy framework creates an innovation ecosystem characterized by market-driven mechanisms, government guidance, enterprise leadership, and multi-stakeholder participation. By maintaining policy consistency while preserving market vitality, this approach facilitates the sector’s transition from policy-driven to endogenous growth, ultimately providing sustainable support for high-quality manufacturing development through enhanced industrial design capabilities.

6.2. Feasibility Assessment and Analytical Findings

To evaluate the scientific validity and implementation potential of the proposed policy recommendations, this study employed a dual-method approach combining expert surveys with structural equation modeling. The questionnaire utilized a 7-point Likert scale to assess three policy categories across four dimensions: feasibility, innovation promotion, regional compatibility, and sustainability. Valid responses were collected from 15 experts representing academia, research institutions, and industrial parks (see Table 8).
Key findings from the expert evaluations reveal distinct patterns:
The initiative of “Establishing Differentiated Agglomeration Strategies Based on Regional Foundations” demonstrated mixed results. While scoring well in innovation promotion (mean = 5.60, SD = 0.76), it received comparatively lower and more variable ratings for regional compatibility and feasibility (means = 5.13 and 5.27, respectively). Several experts noted that spatial policies alone may prove insufficient in low-agglomeration areas without complementary fiscal investments and public platform development. Conversely, in established clusters, concerns were raised about potential resource duplication and diminishing returns.
The initiative of “Advancing Digital Transformation in Industrial Design to Achieve Dual Expansion in Scale and Intelligence” achieved above-average scores overall, particularly in feasibility (5.80) and innovation promotion (5.67), reflecting expert consensus on its multiplier effects for design-manufacturing integration. However, its regional compatibility score (5.20) suggests reservations about implementation in areas with underdeveloped digital infrastructure. Experts recommended parallel development of edge computing nodes and cloud platform capabilities to prevent digital divides across regions.
The initiative of “Establishing an Industry-Academia-Research Integrated Talent Development System to Enhance Design-Manufacturing Compatibility” emerged as the highest-rated recommendation, with consistently strong scores across all dimensions (feasibility = 6.00, innovation promotion = 6.13, regional compatibility = 5.80, sustainability = 6.07) and low standard deviations (<0.8). Experts particularly emphasized its effectiveness in bridging the education-industry gap through real-world project experience, making it a cornerstone strategy for manufacturing innovation.
The initiative of “Enhancing Institutional Innovation Support System and Transforming Government Role” received more conservative evaluations, with notably divergent opinions on regional compatibility (mean = 4.93, SD = 1.12). While acknowledging its long-term strategic value, many experts expressed concerns about immediate implementation challenges, especially in regions with weaker governance capacity or immature market mechanisms. Gradual, context-sensitive adoption with risk mitigation measures was widely recommended, avoiding a “one-size-fits-all” approach, and risk warning and supporting mechanisms should be established to enhance policy resilience.
In conclusion, the expert evaluations demonstrate clear consensus regarding the initiative of “Establishing an Industry-Academia-Research Integrated Talent Development System to Enhance Design-Manufacturing Compatibility”, which received consistently positive assessments as the most actionable and outcome-driven strategy. The initiative of “Advancing Digital Transformation in Industrial Design to Achieve Dual Expansion in Scale and Intelligence” ranked second in expert preference, presenting viable implementation prospects, particularly in regions with established technological infrastructure. The initiative of “Establishing Differentiated Agglomeration Strategies Based on Regional Foundations” yielded more divergent feasibility assessments, reflecting the necessity for careful consideration of local resource disparities. While the initiative of “Enhancing Institutional Innovation Support System and Transforming Government Role” holds strategic importance, experts emphasized the need for context-specific, phased implementation to ensure practical effectiveness.
Given the limited number of items measuring each dimension across individual policy recommendations, we consolidated items sharing common latent constructs for comprehensive reliability testing. As shown in Table 9, Cronbach’s alpha coefficients were calculated to assess internal consistency. The results indicate high reliability across all four dimensions. All alpha values (α) exceeded 0.84, with the highest reaching 0.958, demonstrating excellent measurement consistency for the Feasibility, Innovation Promotion, Regional Compatibility, and Sustainability dimensions. These robust reliability statistics provide a solid foundation for subsequent statistical analyses and empirical validation of the policy recommendations.
The confirmatory factor analysis (CFA) validated the structural validity and model fit of the proposed four-dimensional measurement framework. Using AMOS 28.0, all standardized factor loadings for the latent variables (Feasibility, Innovation Promotion, Regional Compatibility, and Sustainability) exceeded 0.80, confirming the strong explanatory power of the observed indicators. Notably, the “Reduced Intervention” indicator demonstrated the highest factor loading (0.91–0.93), indicating exceptional representativeness. Inter-factor correlations among latent variables were consistently high (0.83–0.92), reflecting robust internal consistency and structural stability (see Figure 9).
Figure 9. The Path Coefficient Analysis Model of Policy Recommendations. Note: The curved arrows represent the correlations among the four latent variables, while the straight arrows indicate the standardized factor loadings between each latent variable and its observed indicators.The model fit indices, as detailed in Table 10, all meet recommended thresholds: χ2/df = 1.925 < 3, RMSEA (Root Mean Square Error of Approximation) = 0.046 < 0.08, GFI (Goodness-of-Fit Index) = 0.942, TLI (Tucker–Lewis Index) = 0.955, CFI (Comparative Fit Index) = 0.961, NFI (Normed Fit Index) = 0.930, all exceeding the 0.90 benchmark for satisfactory model fit. These results confirm strong overall model fit, supporting both the theoretical soundness and empirical feasibility of the measurement structure. This validation establishes a solid theoretical foundation for subsequent strategy evaluation and comparative analysis.
Sustainability 17 08269 g009
Table 10. Fitting Coefficients.
χ 2 d f χ 2 / d f   R M S E A G F I T L I C F I N F I
92.357481.9250.0460.9420.9550.9610.930

6.3. Policy Refinement and Implementation Pathways

To effectively promote positive coupling between industrial design agglomeration and manufacturing innovation performance, this study systematically refines four core policy recommendations based on empirical analysis and expert evaluation. The enhanced framework specifies policy objectives, critical pathways, and implementation mechanisms to achieve precision, effectiveness, and adaptability.
It should be noted that the above policy recommendations are primarily grounded in the practical foundation of the deep integration between industrial design and manufacturing in Zhejiang Province, and thus exhibit strong regional adaptability. Although specific policy instruments need to be flexibly adjusted according to the industrial structures and development stages of different regions, the experience in mechanism design and pathway planning also provides valuable insights for other regions in China with potential for industrial agglomeration.
It should also be acknowledged that potential endogeneity concerns—such as reverse causality, whereby highly innovative manufacturing firms may attract greater industrial design agglomeration—cannot be fully ruled out within the current framework. Although the fixed-effects model helps mitigate unobservable heterogeneity, future research could employ instrumental variables, quasi-experimental approaches, or longitudinal case-tracking to more rigorously identify causal pathways. From a policy perspective, recognizing these possible bidirectional dynamics highlights the need for adaptive implementation and continuous evaluation mechanisms.
(1) Deepening Industry-Design Collaboration Mechanisms: Building Cross-Sector Innovation Ecosystems
The integration of industrial design and manufacturing serves dual purposes: driving product sophistication (smart, green, high-end manufacturing) and transforming design value from aesthetic enhancement to systemic innovation. We propose establishing an integrated “R&D-Design-Production” collaborative mechanism with three core processes: joint problem identification, cooperative development, and achievement transformation. The government can take the lead in establishing a “joint industrial design innovation project database” to encourage leading enterprises and design institutions to jointly publish their needs in areas such as key technological bottlenecks and new material applications. Universities and small and medium-sized enterprises can then form joint ventures to conduct research and development, while introducing third-party platform institutions to provide results assessment and resource integration services, so as to enhance collaborative efficiency. However, attention should be paid to risks such as resource misallocation and redundant construction.
In the design of collaborative mechanisms, it may be advisable to promote the “mixed ownership + diversified income distribution” model, clarify the technical inputs, equity distribution, and outcome attribution mechanism of all parties in joint research and development, explore the establishment of a “intellectual property pool” management mechanism, share patent achievements for authorized use, and ensure the transparency and controllability of technology transfer process through technologies such as blockchain. Additionally, it is essential to promote the construction of a “collaborative performance evaluation system”, set milestone nodes for collaborative projects, conduct comprehensive evaluations based on dimensions such as product development cycle, design conversion rate, and market application performance, and directly link performance outcomes with the intensity of financial support to enhance the quality and efficiency of project implementation. Through co-building mechanisms and innovative rules, the transformation from “point-to-point cooperation” to “systematic co-creation” can be achieved, truly establishing a collaborative path that integrates industrial design into the entire manufacturing process, and propelling the manufacturing industry towards a new stage of high-quality development, but full consideration should be given to differences in industrial foundation, organizational capacity, and other aspects across regions, so as to avoid the efficiency losses caused by a “one-size-fits-all” promotion approach.
(2) Optimizing Industrial Structure and Supply Mechanisms: Implementing Region-Specific Policy Matching
Given the varying agglomeration levels of industrial design across different regions, a three-tier spatial development framework may be considered, characterized by “policy differentiation–gradient guidance–dynamic upgrading”. This framework could aim to create an interconnected spatial pattern consisting of “agglomeration hubs—growth echelons—cultivation bases”. In regions with high design resource concentration and complete industrial chains, the focus might be placed on deep integration between design and advanced manufacturing. The establishment of “Advanced Design Pilot Zones” is advisable to explore pioneering integrated innovation in cross-disciplinary fields such as intelligent manufacturing, green design, and service-oriented manufacturing. These initiatives will propel industrial design towards the medium-high end of the value chain while generating positive spillover effects. For regions with medium-low agglomeration levels and underdeveloped industrial systems, the strategy should center on building public service capabilities and industrial incubation foundations. This can be achieved by facilitating deep collaboration between incubators and local manufacturers within industrial parks, implementing “design-in-park” mechanisms to enhance regional innovation vitality. Concurrently, resource transfer mechanisms might be established between high- and low-agglomeration regions to encourage cross-regional flow of talent and technology, thereby improving coordinated development of design capabilities across all regions, but full consideration should be given to differences in industrial foundation, organizational capacity, and other regional conditions so as to avoid the efficiency losses caused by a “one-size-fits-all” promotion approach.
Regarding talent supply mechanisms, emphasis should be placed on developing a “design + engineering” interdisciplinary talent system to address the structural imbalance between strong creative capabilities and weak implementation. Local governments could take the lead in encouraging joint talent development programs between universities and manufacturers. These programs might incorporate design curriculum modules covering material processing, manufacturing logic, and smart equipment applications into existing design education systems. Manufacturing enterprises should be encouraged to establish “design engineer training positions” that provide hands-on experience in product co-creation and manufacturing validation. Joint training bases and industry-education integration laboratories equipped with processing equipment and simulated production lines could be established through university-enterprise collaboration to validate academic outcomes through engineering applications. A competency-based design talent evaluation system incorporating DFM compliance, engineering communication skills, and commercialization performance should be implemented to enhance industry recognition and utilization of design professionals.
For financial support mechanisms, a diversified financial service package oriented towards “design-driven manufacturing innovation” should be developed. This includes establishing joint loan programs for startup design firms and small–medium-sized manufacturers, with government and financial institutions co-funding a “Design Innovation Development Fund” to provide interest subsidies, risk-sharing, and performance-based incentives for qualifying projects, but such initiatives should be advanced prudently in line with the realities of regional financial resources. The implementation of intellectual property pledge financing should be advanced by incorporating design patents, appearance innovations, and platform services into intellectual asset valuation systems. Local governments could guide industrial investment institutions to establish “Achievement Conversion Special Funds” that facilitate the application of design innovations through equity investments and technology transactions. A dual-driven investment mechanism combining policy support and market forces may be gradually refined and perfected to construct a full-cycle financial support chain covering “creative incubation—prototype development—mass production application”, thereby comprehensively enhancing factor supply capacity and industrial support effectiveness.
(3) Accelerating Digital Transformation in the Design Industry: Building Future-Oriented Intelligent Collaborative Infrastructure
As manufacturing rapidly advances toward intelligent and green development, design services—positioned at the forefront of innovation chains—increasingly need to undergo digital transformation to enhance their responsiveness to manufacturing scenarios and service scalability. We propose a tripartite approach integrating infrastructure development, platform services, and institutional safeguards to systematically advance digital capabilities in industrial design [57].
Regarding infrastructure development, local governments could facilitate, where conditions permit, the establishment of intelligent design infrastructure clusters within industrial design agglomeration zones. These clusters might incorporate high-performance design cloud platforms, 3D modeling and rendering centers, and virtual collaborative workspaces to provide enterprises with standardized, accessible design computing resources and tools. To address digital capability gaps among small and medium enterprises, pilot “Design SaaS Service Marketplaces” could be explored, offering modular, subscription-based services to lower digital adoption barriers, while ensuring continuous attention to SMEs’ cognitive acceptance and sustained usage capacity so as to safeguard policy effectiveness.
For platform services, we recommend creating industrial design data resource platforms that consolidate diverse datasets including material libraries, case repositories, user research reports, and technical parameters. These platforms could integrate with manufacturers’ Enterprise Resource Planning (ERP) and Manufacturing Execution Systems (MES) systems to enable seamless online collaboration throughout the entire “concept-design-verification-production” workflow. The establishment of “Regional Industrial Design Middle Platforms” would facilitate data aggregation and behavioral insights from local design activities, providing real-time support for government policy evaluation and industry trend monitoring.
In terms of institutional safeguards, pilot programs for design data standardization can be introduced to develop unified formats, interface protocols, and outcome evaluation metrics. This would address current information silos between design and manufacturing digital systems. At the same time, it may also be worth exploring differentiated implementation across regions, incorporating digital capabilities into enterprise design competency assessments and government policy support criteria would incentivize proactive digital capacity building. These measures collectively could contribute to fostering a new generation of design innovation ecosystems characterized by intelligent collaboration.
(4) Implementing Differentiated Policy Orientation: Establishing a Multi-tier Governance Framework with Dynamic Adjustment Mechanisms
To address regional disparities in industrial foundations, governance capacity, and policy responsiveness, a differentiated policy implementation mechanism should be developed, characterized by hierarchical coordination, task delegation, and collaborative execution. This approach establishes a multi-level implementation network spanning provincial guidance, municipal coordination, and industrial park execution.
At the provincial level, governments might consider formulating Industrial Design Industry Support Guidelines that delineate region-specific policy directions, support parameters, and regulatory boundaries based on local industrial chains and resource endowments. The establishment of inter-departmental joint conference mechanisms would further enhance horizontal coordination efficiency. Municipal governments, while adhering to provincial directives, may develop tailored policy packages incorporating measures such as tax incentives, specialized subsidies, financial interest discounts, land-use priorities, and industrial chain support to potentially improve policy relevance and implementation effectiveness. Industrial parks, as frontline policy implementers, might focus on integrated “design-manufacturing” services by consolidating administrative windows and industrial service platforms. The exploration of park-level Industrial Design Promotion Centers could provide centralized, one-stop services encompassing enterprise consultation, resource allocation, and service coordination.
To ensure policy flexibility and adaptability, a comprehensive feedback and iteration mechanism is advisable to establish. This includes implementing a closed-loop adjustment system featuring pilot releases, phased evaluations, and rolling optimizations. Initial policy pilots might incorporate multi-stage assessment checkpoints, with third-party experts conducting quantitative monitoring and qualitative field interviews to evaluate policy effectiveness and enterprise responses. Furthermore, regional digital governance platforms may be leveraged to develop policy performance information systems that regularly generate Policy Effectiveness Evaluation Reports. These reports would track key indicators including policy coverage, implementation progress, and support outcomes. Identified issues such as inadequate supporting measures, implementation deviations, or coverage gaps should trigger careful considerations of dynamic policy revisions and enhancements. Through this data-driven, intelligently iterative, and cross-level responsive adjustment system, the policy framework could gradually gain both resilience and extensibility. This would help ensure precise support for the strategic objectives of industrial design agglomeration and manufacturing innovation integration across various development stages and regional contexts, while also leaving sufficient room for future evolution and adaptive refinement.
(5) Reconstructing Innovation Incentive Mechanisms and Institutional Support Systems: Cultivating a Design-Driven Growth Ecosystem
To facilitate the transition from policy-driven to endogenous innovation-driven development, it is imperative to establish a comprehensive lifecycle incentive and support framework that fosters an inclusive design innovation ecosystem. Addressing potential transformation challenges during policy phase-out periods, an Innovation Transition Facilitation Mechanism could be considered, incorporating three key elements: a gradually tapered subsidy scheme, technical diagnostics and transformation advisory services, and joint technology development funding. This integrated approach mitigates resource gaps during initial R&D and organizational restructuring, ensuring smoother transition periods, although the effectiveness of such fiscal adjustment and enterprise qualification criteria may vary depending on local financial capacity and firm-level conditions. Concurrently, a “Design Enterprise Growth Support Registry” could be explored to provide stage-specific assistance. For startups, “innovation vouchers + design consulting subsidies” would facilitate concept validation and market access. Growth-stage enterprises would benefit from a “Brand Enhancement Program” offering visual identity design grants and market expansion support. Mature firms may be connected to a “Capital Matching Platform” connecting them with multi-level capital markets to strengthen independent R&D and industrial expansion capabilities.
At the institutional level, we recommend accelerating the development of a design achievement management framework centered on “outcome registration—IP confirmation—transaction facilitation”. To enhance the institutional framework, a dual-track approach may be introduced. The primary track involves establishing an “expedited patent review channel for industrial design” coupled with a “design achievement registration platform” to streamline intellectual property confirmation processes and improve market liquidity, thereby accelerating the transformation of design value into industrial value. The secondary track focuses on strengthening regional legal support systems through the creation of a fast-track intellectual property arbitration mechanism. This system would provide specialized mediation services for design-related infringement disputes and collaborative ownership conflicts, helping to reducing rights protection costs and shortening resolution periods to bolster corporate confidence in intellectual property protection.
Complementing these measures, a “Design Maturity Evaluation Model” could be developed, incorporating three core assessment dimensions: technological accumulation, market performance, and organizational capabilities. This model would serve as a reference for precise allocation of public resources and policy instrument selection, marking a strategic shift from universal support to targeted assistance. The implementation of this comprehensive institutional safeguard system might extend across the entire innovation lifecycle—from initial incubation and prototype testing to commercial scale-up—ultimately fostering a stable and sustainable collaborative ecosystem where design and manufacturing capabilities mutually reinforce each other’s development, though the specific models and standards for long-term institutionalization would still require iterative validation and refinement based on local practices.
(6) Enhancing Industry-Specific Policy Design: Targeted Support for Strategic Sectors’ Design Needs
The manufacturing sector exhibits significant variations across subsectors in terms of design service penetration, innovation pathways, and value chain distribution. To improve policy precision, we recommend conducting systematic “industry-design” compatibility analyses to identify strategic sectors with high design-driven potential. For key industries such as intelligent manufacturing, high-end equipment, advanced materials, and green manufacturing, governments could consider collaborating with industry associations, academic institutions, and third-party organizations to conduct specialized research. These efforts might lead to the development of “Industrial Design Empowerment Maps” that document typical pain points, potential breakthroughs, and value realization pathways, ultimately providing reference for actionable industry-specific design support guidelines for policy formulation and project planning.
Mechanistically, local governments may explore developing “White Papers on Deep Integration of Industrial Design and Manufacturing” that systematically analyze regional industrial structures and design resource endowments. These documents should identify priority integration sectors and directions while outlining phased implementation roadmaps. Concurrently, “Design Demand Response Platforms” should be established through local manufacturing innovation centers and high-tech zone administrations to coordinate resource allocation among manufacturers, designers, and service providers. These platforms should incorporate standardized demand templates, project solicitation mechanisms, and intelligent matching engines, enabling real-time updates and potentially facilitating the dissemination of design challenges, manufacturing needs, policy support, and technology transfer opportunities through API-driven data exchange.
To strengthen policy synergy, sector-specific design guidance catalogs may be developed alongside dedicated funding mechanisms that allocate design resources to critical industrial nodes. This approach enhances horizontal coordination between industrial and innovation policies, creating a closed-loop system for “design + industry chain” integration. Such institutional arrangements will facilitate the large-scale application and demonstration of design-driven manufacturing innovation across diverse industrial segments, contributing to broader sectoral adoption.
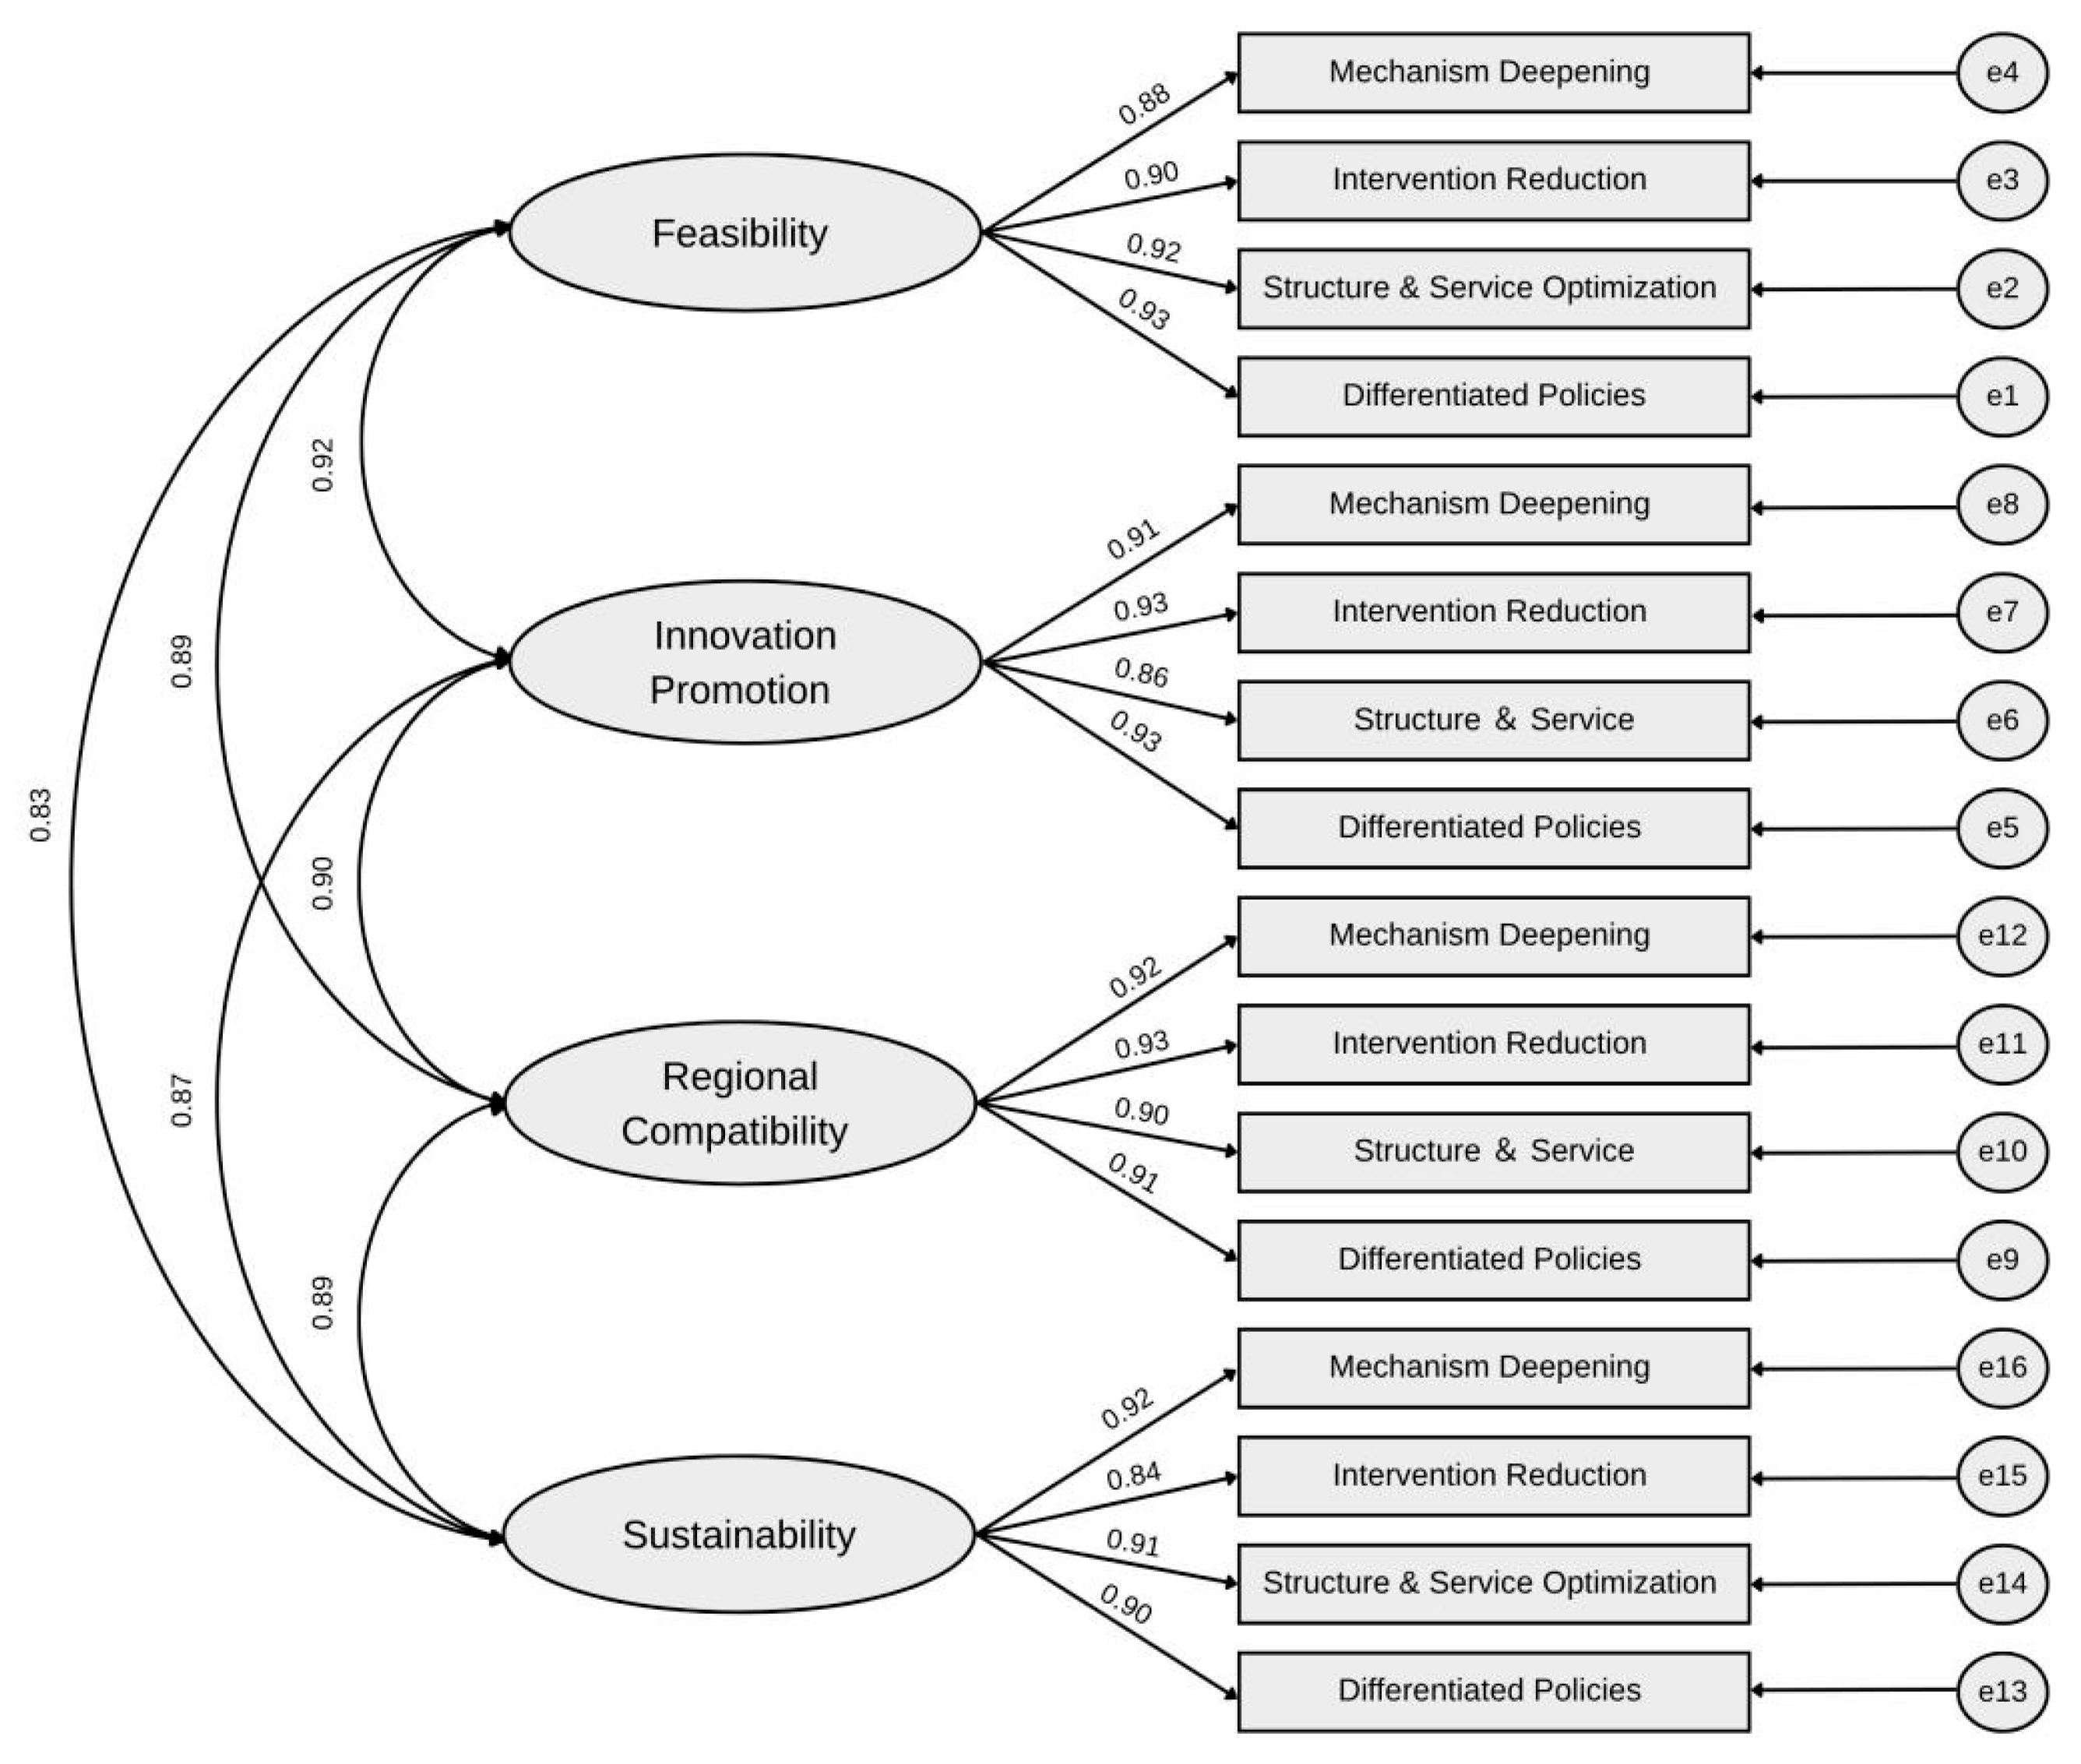
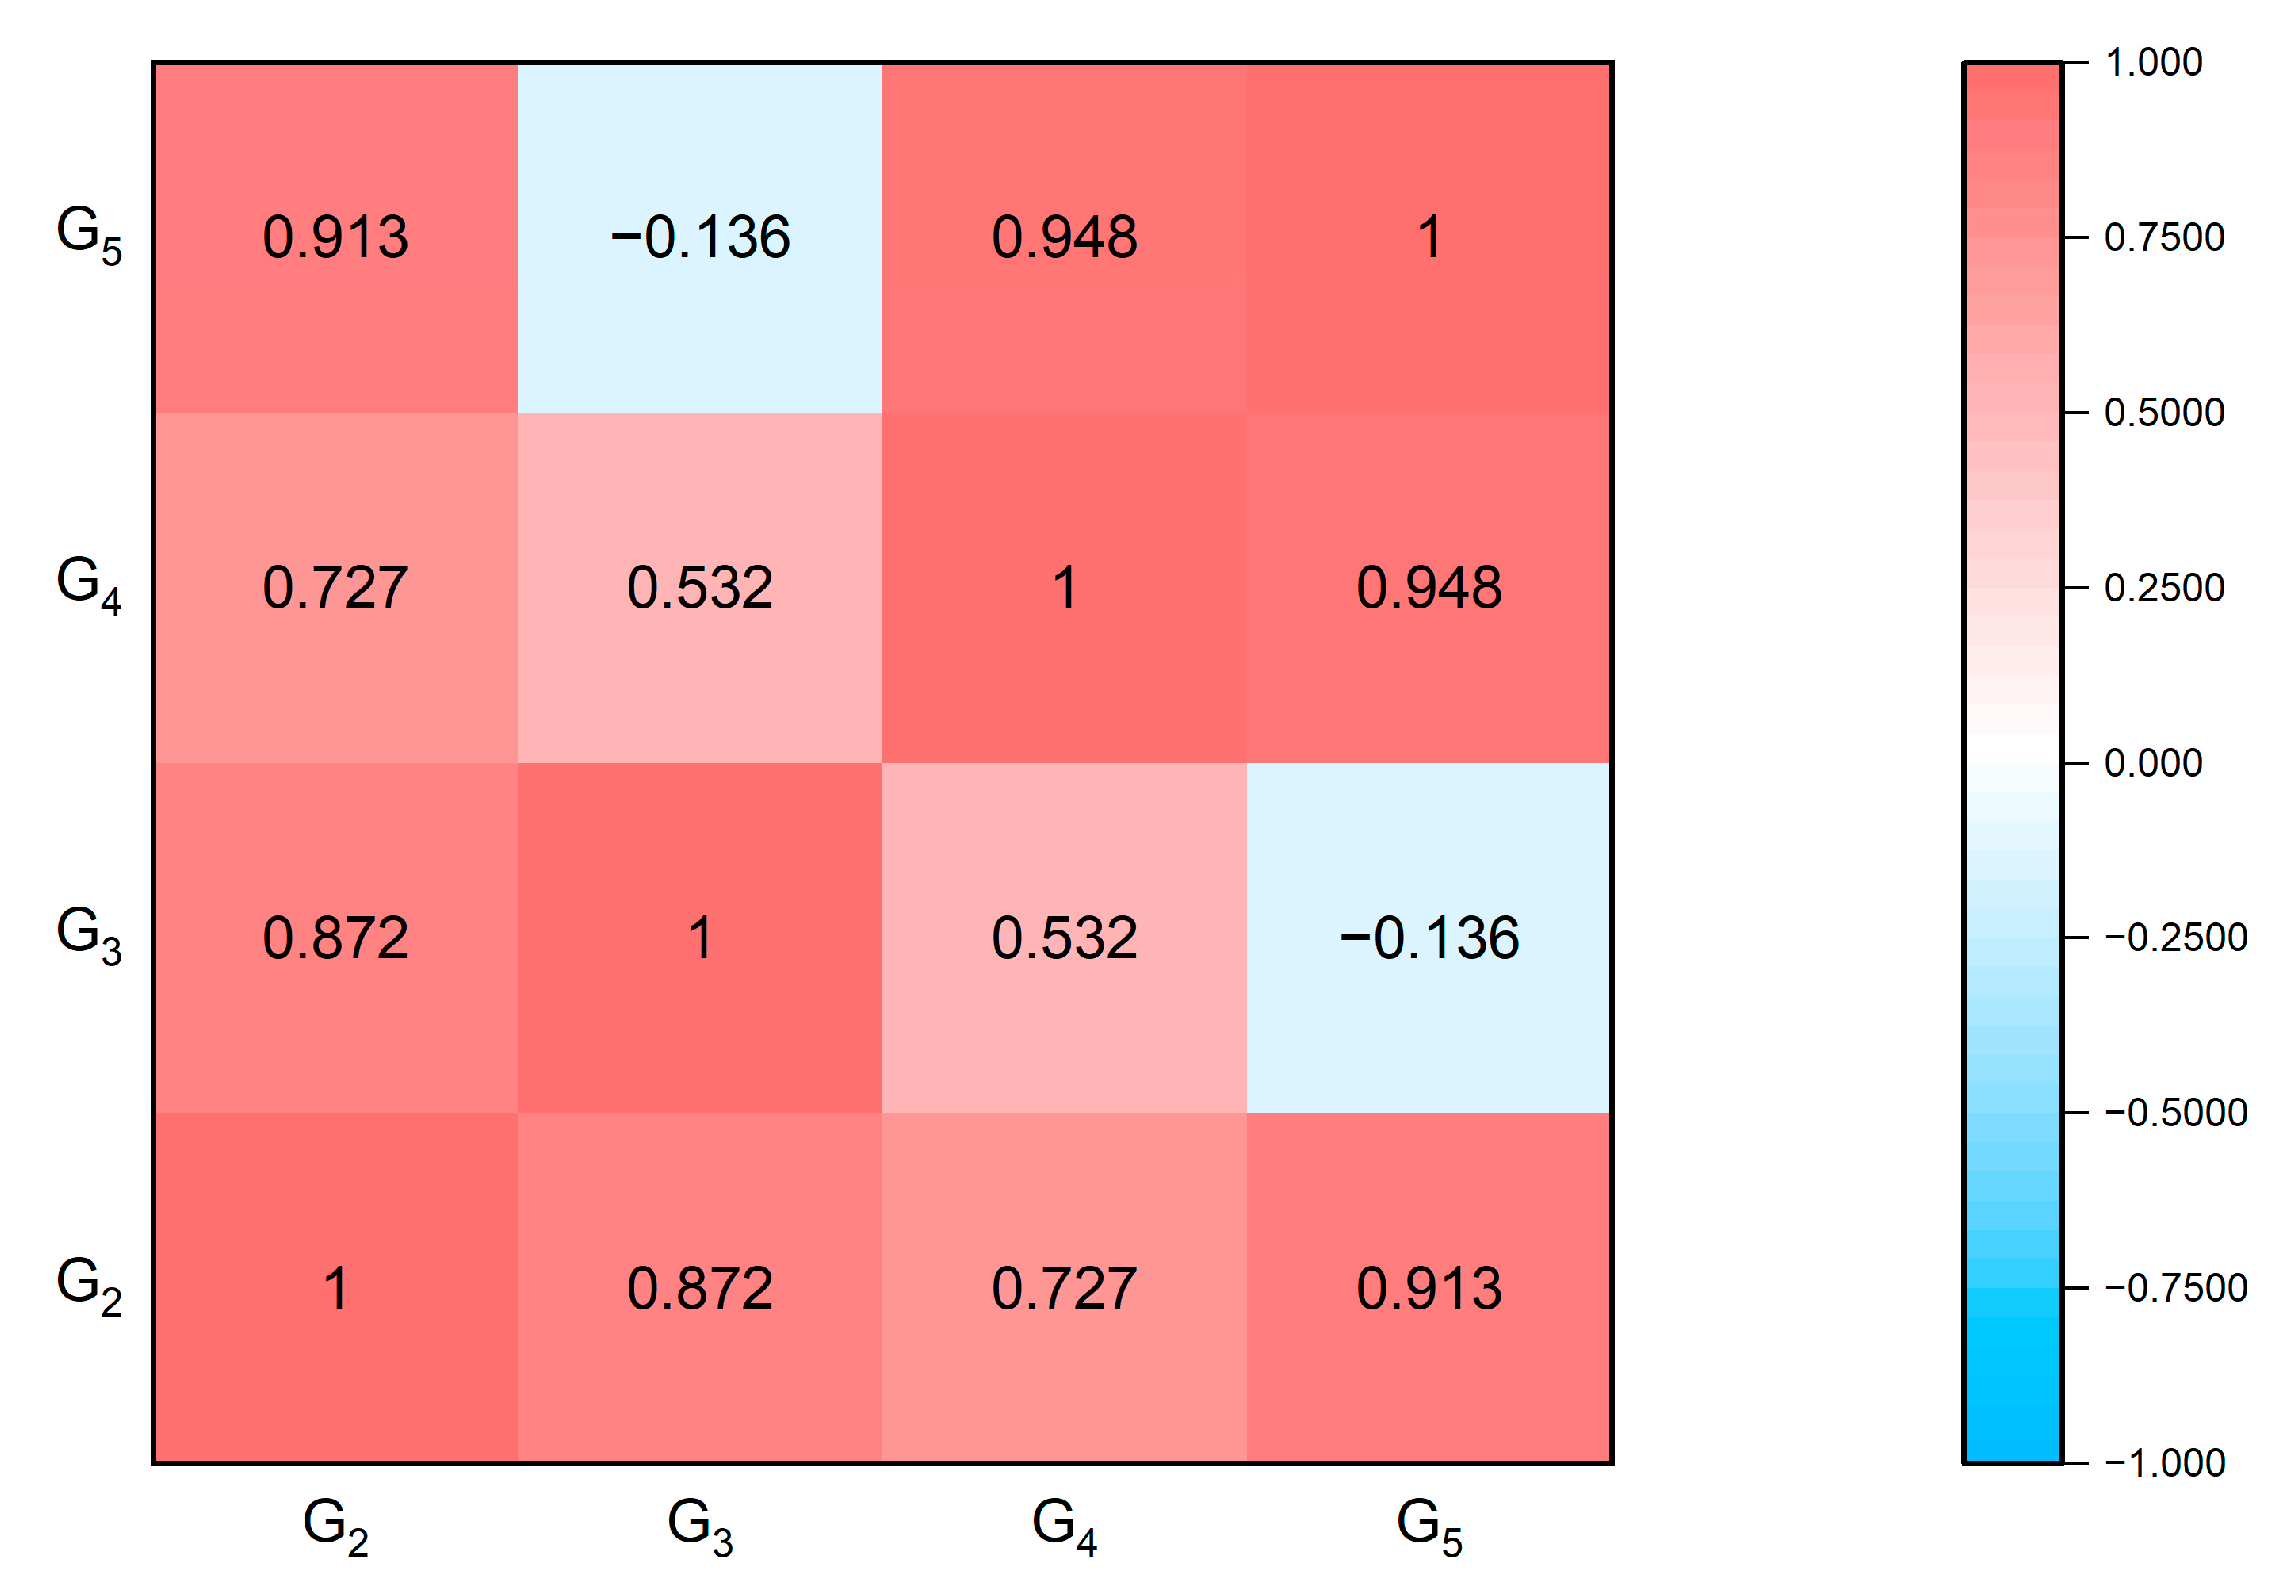
7. Conclusions

This study investigates the impact of industrial design agglomeration on manufacturing innovation performance from a design-driven perspective, aiming to elucidate its interactive mechanisms within regional innovation systems. Through empirical analysis of prefecture-level data in Zhejiang Province, we systematically examine how design industry agglomeration factors influence manufacturing innovation inputs and outputs. By constructing a multidimensional indicator system encompassing agglomeration degree, industrial scale, human resources, and institutional environment, and employing two-way fixed-effects models with structural equation validation, we reveal the structural pathways through which design agglomeration enhances manufacturing innovation capabilities.
The findings demonstrate that industrial design agglomeration exerts significant positive effects on manufacturing innovation performance, particularly in innovation output dimensions. Industrial scale indicators such as design transaction volume and enterprise patent output show sustained effects in promoting manufacturing R&D investment and patent grants, confirming design’s pivotal role as high-end producer services in manufacturing value chain restructuring. Regional financial service capacity, innovation vitality, and innovation talent pool are crucial mechanisms facilitating the transformation of agglomeration effects into innovation performance, highlighting the indispensable role of institutional and ecological factors in unleashing design agglomeration potential.
Theoretically, this study extends the research paradigm on how producer service agglomeration influences manufacturing innovation, and it enriches empirical evidence for design-driven innovation pathways. Unlike previous studies focusing primarily on design innovation outputs, we emphasize design’s embeddedness and synergies within manufacturing systems, revealing the systemic value of “design-manufacturing integration.” Our methodology, combining multi-source data integration with quantitative modeling, enhances both logical consistency and external validity. Furthermore, the structural measurement system incorporating expert evaluation and factor analysis strengthens the empirical feasibility of policy recommendations, providing quantitative foundations for policy formulation and implementation.
Several limitations warrant acknowledgment. The geographical focus on Zhejiang Province, while representative of advanced design-manufacturing integration, necessitates consideration of regional variations for nationwide applicability. The predominantly quantitative indicators could be complemented with emerging metrics reflecting innovation quality, market feedback, and user experience to enhance evaluation comprehensiveness. Additionally, as the design’s role in manufacturing evolves dynamically, future research could employ dynamic panel models or longitudinal tracking to capture long-term impact pathways.
In summary, this study advances theoretical and methodological understanding of design-manufacturing integration while providing empirical evidence for regional industrial policy optimization. Future research should expand to multi-regional, cross-industrial comparative studies to deepen understanding of design agglomeration’s effects on manufacturing innovation, ultimately supporting the strategic objective of design-driven manufacturing upgrading and agglomeration-enabled high-quality development.

Author Contributions

Conceptualization, B.X. and J.C.; methodology, S.Z. and W.C.; software, W.C.; validation, J.C. and S.Z.; formal analysis, S.Z. and J.C.; investigation, X.W. and Z.Y.; resources, S.Z.; data curation, W.C.; writing—original draft preparation, J.C. and S.Z.; writing—review and editing, J.C. and B.X.; visualization, J.C.; supervision, B.X.; project administration, B.X.; funding acquisition, B.X. All authors have read and agreed to the published version of the manuscript.

Funding

This research received no external funding.

Data Availability Statement

All data used in this study were obtained from publicly available sources, including monthly reports of 16 design parks in Zhejiang Province (2015–2022), A-share listed manufacturing company data from CSMAR/CNRDS, and patent data from provincial authorities and the Patent Hub database. No new data were generated.

Conflicts of Interest

The authors declare no conflict of interest.

Appendix A

Table A1. Fixed-Effects (FE) Model Regression Results.
(1)(2)(3)(4)
VariableY1Y1Y2Y2
G10.091 **0.084 **0.121 **0.107 **
(0.035)(0.032)(0.047)(0.044)
G2 0.059 * 0.137 *
(0.313) (1.640)
G3 0.038 ** 0.076 **
(0.223) (0.316)
G4 0.014 0.062
(0.255) (0.439)
G5 2.213 ** 3.452 **
(2.516) (2.603)
G6 0.037 * 0.116 *
(0.412) (0.671)
G7 0.656 ** 0.703 **
(2.753) (3.692)
G8 −0.359 ** −0.887 **
(−0.731) (−1.047)
_cons7.547 **1.388 **9.571 **1.455 **
(7.520)(2.737)(9.761)(2.827)
R20.5750.5730.6840.685
Time-specificYESYESYESYES
City-specificYESYESYESYES
(Note: *: p < 0.05, **: p < 0.01, t-statistics in parentheses).
Table A2. Robustness Test Results.
Y1Y2
G10.113 **0.162 **
(2.562)(1.843)
G20.029 *0.076 *
(5.128)(4.087)
G30.077 *0.184 *
(1.511)(3.039)
G40.2610.174
(0.484)(0.353)
G54.653 **5.842 **
(7.715)(10.184)
G60.159 *0.173 *
(0.235)(0.750)
G70.771 **0.167 **
(1.323)(1.007)
G8−0.274 *−0.421 *
(−3.817)(−3.494)
L.Y10.622 **
(13.707)
L.Y2 0.537 **
(18.334)
_cons0.6672.671
(1.337)(0.105)
(Note: *: p < 0.05, **: p < 0.01, t-statistics in parentheses).

References

  1. Zhao, Y.; Pei, C. Technological innovation, industrial integration and manufacturing transformation and upgrading. Sci. Technol. Prog. Policy 2019, 36, 70–76. (In Chinese) [Google Scholar]
  2. Institute of Industrial Economics; Chinese Academy of Social Sciences. China Industrial Development Report 2021; Economic Management Publishing House: Beijing China, 2021. (In Chinese) [Google Scholar]
  3. Xu, J.; Li, W. Comparison and countermeasures of industrial design industry development: Based on research in Guangdong and Jiangsu provinces. Packag. Eng. 2023, 44, 21–31. (In Chinese) [Google Scholar]
  4. Sun, Z.; Song, W. The impact of enterprise R&D investment on industrial innovation performance: Empirical evidence from China’s manufacturing industry. J. Quant. Tech. Econ. 2012, 29, 49–63+122. (In Chinese) [Google Scholar]
  5. Cheng, Z.; Liu, J. Industrial agglomeration, spatial spillover and manufacturing innovation: A spatial econometric analysis based on Chinese city data. J. Shanxi Univ. Financ. Econ. 2015, 37, 34–44. (In Chinese) [Google Scholar]
  6. Fan, Q.; Shao, Y.; Tang, X.; Wang, J. An empirical study on the impact of structural embeddedness on cluster enterprises’ innovation performance. Stud. Sci. Sci. 2010, 28, 1891–1900. (In Chinese) [Google Scholar]
  7. Xu, J.; Xu, Y. Enterprise synergy capability, network position and technological innovation performance: An empirical analysis of manufacturing enterprises in Bohai Rim region. Manag. Rev. 2015, 27, 114–125. (In Chinese) [Google Scholar]
  8. Xu, B.; Sun, X.; Zhou, C.; Tang, Z. Influencing factors and empirical research on the integration of industrial design industry and manufacturing industry. Mod. Manag. Sci. 2019, 11, 39–41. (In Chinese) [Google Scholar]
  9. Porter, M.E. The Competitive Advantage of Nations, 2nd ed.; Free Press: New York, NY, USA, 2002. [Google Scholar]
  10. Fujita, M.; Krugman, P.; Venables, A.J. Spatial Economy: Cities, Regions and International Trade; China Renmin University Press: Beijing, China, 2013. (In Chinese) [Google Scholar]
  11. Baptista, R.; Swann, P. Do firms in clusters innovate more? Res. Policy 1998, 27, 525–540. [Google Scholar] [CrossRef]
  12. Rotemberg, J.J.; Saloner, G. Competition and human capital accumulation: A theory of interregional specialization and trade. Reg. Sci. Urban. Econ. 2000, 30, 373–404. [Google Scholar] [CrossRef]
  13. Gertler, M.S. Tacit knowledge in production systems: How important is geography. In The Economic Geography of Innovation; Polenske, K.R., Ed.; Cambridge University Press: Cambridge, UK, 2007; pp. 87–111. [Google Scholar]
  14. Howells, J.R. Tacit knowledge, innovation and economic geography. Urban. Stud. 2002, 39, 871–884. [Google Scholar] [CrossRef]
  15. Qian, C.; Duan, Y. Research on the agglomeration mode of creative design industry in Charlottenburg District of Berlin. Urban. Plan. Int. 2016, 31, 63–70. (In Chinese) [Google Scholar]
  16. Qin, B. Research on the cluster model of Shanghai industrial design industry. Shanghai Econ. 2017, 4, 48–57. (In Chinese) [Google Scholar]
  17. Laakso, S.; Kostiainen, E. Design in the local economy: Location factors and externalities of design. Knowl. Technol. Policy 2009, 22, 227–239. [Google Scholar] [CrossRef]
  18. O’Connor, K. Industrial design as a producer service: A framework for analysis in regional science. Ann. Reg. Sci. 1996, 75, 237–252. [Google Scholar] [CrossRef]
  19. Poorkavoos, M.; Duan, Y.; Edwards, J.S. Identifying the configurational paths to innovation in SMEs: A fuzzy-set qualitative comparative analysis. J. Bus. Res. 2016, 69, 5843–5854. [Google Scholar] [CrossRef]
  20. Zhang, F.; Wang, R. Government regulation and ambidextrous innovation. Stud. Sci. Sci. 2016, 34, 938–950. (In Chinese) [Google Scholar]
  21. Chen, H.; Zhang, Y.; Liu, D. Government subsidies, tax incentives and corporate innovation performance: An empirical study at different life cycle stages. Nankai Bus. Rev. 2019, 22, 187–200. (In Chinese) [Google Scholar]
  22. Jiang, N.; Xi, C.; Dong, C. Analysis of the promotion effect of regional cooperation and competition on innovation performance: An empirical study based on high-tech industries. J. Bus. Econ. 2012, 5, 64–71. (In Chinese) [Google Scholar]
  23. Shao, Z.; Zhao, Y. Three-stage DEA innovation performance evaluation and countermeasures research for textile and apparel enterprises. J. Beijing Inst. Fash. Technol. (Nat. Sci. Ed.) 2022, 42, 74–80. (In Chinese) [Google Scholar]
  24. Song, J.; Song, Z. Digital transformation, technology spillover and manufacturing enterprise innovation performance. Reform. Econ. Syst. 2023, 4, 114–122. (In Chinese) [Google Scholar]
  25. Hu, H. The symbiotic relationship between China’s industrial design and manufacturing industry. In Proceedings of the International Conference on History of Mechanical Technology and Mechanical Design between China and Japan, Beijing, China, 1 November 2004. (In Chinese). [Google Scholar]
  26. Huang, X. The basic connotation, characteristics and theoretical framework of industrial design industry competitiveness. Creat. Des. 2016, 2, 42–50. (In Chinese) [Google Scholar]
  27. Bai, Y. Research on the model and path of promoting Hebei manufacturing industry through industrial design. Econ. Forum 2020, 6, 28–35. (In Chinese) [Google Scholar]
  28. Qiu, Z. Approaches to enhance innovation capability of manufacturing enterprises through industrial design. Art Des. (Theory) 2018, 2, 26–28. (In Chinese) [Google Scholar]
  29. Wang, P.; Su, J. Research on industrial design innovation mechanism and system construction of regional traditional manufacturing enterprises: Taking Gansu manufacturing industry as an example. Product. Res. 2014, 11, 79–82. (In Chinese) [Google Scholar]
  30. Xu, B.; Kong, S.; Ying, Z.; Chen, J.; Zhang, S.; Yan, Y.; Xu, J. Research on impact of design innovation factors on pure technical efficiency of manufacturing innovation. Sustainability 2024, 16, 7230. [Google Scholar] [CrossRef]
  31. Bao, F. Research on the Development of China’s Cultural and Creative Industry Clusters. Ph.D. Thesis, Jilin University, Changchun, China, 2013. (In Chinese). [Google Scholar]
  32. Chen, G.; Wang, H. Personalized recommendation algorithm based on improved Pearson correlation coefficient. J. Shandong Agric. Univ. (Nat. Sci. Ed.) 2016, 47, 940–944. (In Chinese) [Google Scholar]
  33. Yin, H.; Wen, Z.; Ma, Z. An improved KNN algorithm based on Pearson similarity and distance weight. Comput. Knowl. Technol. 2019, 15, 208–210. (In Chinese) [Google Scholar]
  34. Zhou, L. The Impact of Green Credit on Profitability of Chinese Commercial Banks. Master’s Thesis, Jilin University, Changchun, China, 2014. (In Chinese). [Google Scholar]
  35. Gao, T. Econometric Analysis Methods and Modeling; Tsinghua University Press: Beijing, China, 2006. (In Chinese) [Google Scholar]
  36. Chen, H.; Qiao, S.; Zhang, K. Equity structure and corporate innovation performance: Evidence from Chinese high-tech companies. Heliyon 2024, 10, e39470. [Google Scholar] [CrossRef]
  37. Zhao, K. On the role orientation of industrial design in the context of manufacturing industry upgrading. Packag. Eng. 2014, 35, 130–133. (In Chinese) [Google Scholar]
  38. Zhou, C. Research on the Interactive Integration Between Industrial Design Industry and Manufacturing Industry. Master’s Thesis, Zhejiang University of Technology, Hangzhou, China, 2018. (In Chinese). [Google Scholar]
  39. Xiang, Y. Research on the Coupling Relationship Between Industrial Design Industry and Regional Economic Development. Master’s Thesis, Zhejiang University of Technology, Hangzhou, China, 2022. (In Chinese). [Google Scholar]
  40. Guo, X.M.; Guo, K.; Kong, L.P. Industrial agglomeration and corporate ESG performance: Empirical evidence from manufacturing and producer services. Sustainability 2023, 15, 12445. [Google Scholar] [CrossRef]
  41. Torbacki, W. Towards sustainable Industry 4.0: An MCDA-based assessment framework for manufacturing and logistics. Sustainability 2025, 17, 5082. [Google Scholar] [CrossRef]
  42. Huang, H.; Zhou, M.; Ji, B. Research on equity incentive models and corporate innovation performance: Taking Sunway Communication as an example. Commun. Financ. Account 2021, 22, 167–172. (In Chinese) [Google Scholar]
  43. Liu, F.; Mo, J.; Ma, R. The impact of executive team overseas background on corporate innovation performance. Manag. Rev. 2017, 29, 135–147. (In Chinese) [Google Scholar]
  44. Zeng, C.; Guo, B. Ownership nature, organizational form and technological innovation performance: Empirical evidence from Shanghai micro-enterprise data. Sci. Sci. Manag. 2014, 35, 128–139. (In Chinese) [Google Scholar]
  45. Li, Z.; Lu, Y. Are state-owned enterprises really lacking innovation capability? Empirical analysis and comparison based on ownership nature of listed companies. Econ. Theory Bus. Manag. 2014, 34, 27–38. (In Chinese) [Google Scholar]
  46. Li, H.; Cao, H. Human capital expansion and innovation performance of China’s manufacturing industry. Theory Pract. Financ. Econ. 2023, 44, 130–138. (In Chinese) [Google Scholar]
  47. Jin, X.; Sun, Q.; Jin, R. Digital transformation, new quality productive forces and corporate innovation performance. J. Hainan Univ. (Humanit. Soc. Sci.) 2014, 1–11. (In Chinese) [Google Scholar]
  48. Li, X.; Song, R.; Wang, J. Shared ownership and corporate innovation performance: Empirical evidence from manufacturing enterprises. Ind. Technol. Econ. 2024, 43, 62–72. (In Chinese) [Google Scholar]
  49. Feng, M.; Wang, Y. More government subsidies, more innovation of new energy firms? Evidence from China. Sustainability 2023, 15, 8819. [Google Scholar] [CrossRef]
  50. Li, H.C.; Wang, J.; Zhang, R.Z.; Duan, M.R. Research on the impact of corporate ESG performance on sustained innovation in the VUCA context: Evidence from China. Sustainability 2025, 17, 5304. [Google Scholar] [CrossRef]
  51. Liu, J.; Wang, J.; Zhang, X. The impact of producer services agglomeration on manufacturing innovation efficiency: An empirical analysis based on spatial Durbin model. Technoecon. Manag. Res. 2024, 4, 120–126. (In Chinese) [Google Scholar]
  52. Bao, X. Producer services agglomeration and manufacturing innovation efficiency improvement: Empirical evidence from Zhejiang Province. Future Dev. 2021, 45, 53–60. (In Chinese) [Google Scholar]
  53. Yu, B.; Wu, D. How does producer services agglomeration improve manufacturing innovation efficiency? Theoretical analysis and empirical test based on agglomeration externalities. Sci. Decis. Mak. 2021, 3, 18–35. (In Chinese) [Google Scholar]
  54. Tang, W.; Wu, F. Research on the impact of producer services agglomeration on manufacturing innovation efficiency in Anhui Province: Based on Stata panel data analysis. Bus. Econ. 2024, 10, 55–58. (In Chinese) [Google Scholar]
  55. Yang, Y.; Zhu, Y.; Zhang, L.; Du, J. Is digital industry agglomeration a new engine for firms’ green innovation? A new micro-evidence from China. Systems 2025, 13, 627. [Google Scholar] [CrossRef]
  56. Asif, M.; Yang, L.; Hashim, M. The role of digital transformation, corporate culture, and leadership in enhancing corporate sustainable performance in the manufacturing sector of China. Sustainability 2024, 16, 2651. [Google Scholar] [CrossRef]
  57. Luo, S.; Zhang, D. Research on digital innovation models of design industry. Art. Des. 2022, 1, 17–21. (In Chinese) [Google Scholar]
Figure 1. Heatmap of Pearson Correlation Coefficients for Secondary Indicators in Industrial Scale (GB) Dimension.
Sustainability 17 08269 g001
Figure 2. Heatmap of Pearson Correlation Coefficients for Secondary Indicators in Human Capital (GC) Dimension.
Sustainability 17 08269 g002
Figure 3. Heatmap of Pearson Correlation Coefficients for Secondary Indicators in Development Environment (GD) Dimension.
Sustainability 17 08269 g003
Figure 4. Heatmap of Pearson Correlation Coefficients for the Refined Industrial Design Agglomeration Indicator System (Second Adjustment).
Sustainability 17 08269 g004
Figure 5. Heatmap of Pearson Correlation Coefficients for the Refined Industrial Design Agglomeration Indicator System (Third Adjustment).
Sustainability 17 08269 g005
Figure 6. Location Quotient of Industrial Design Agglomeration Across Zhejiang’s Prefecture-Level Cities (2016–2022).
Sustainability 17 08269 g006
Figure 7. R&D Investment Intensity of Shenzhen A-share Listed Enterprises Across Zhejiang Cities (2016–2022).
Sustainability 17 08269 g007
Figure 8. Trends in innovation input and output of manufacturing enterprises in Zhejiang Province, 2012–2022. The dotted line represents the overall trend of new product sales revenue. Note: Compiled from data in the Zhejiang Statistical Yearbook (various years), annual statistical reports of the Zhejiang Provincial Department of Science and Technology, and statistical compilations of the China National Intellectual Property Administration.
Sustainability 17 08269 g008
Table 1. Preliminary Indicator System for Industrial Design Agglomeration Components (Preliminary).
Primary IndicatorsSecondary IndicatorsOperational Definition
Agglomeration Degree (GA)G1 Location Quotient (%)Regional industrial specialization level
G2 Herfindahl IndexIndustrial concentration degree within region
Industrial Scale (GB)G2 Commercialized Output Value (10K CNY)Industrialized output value of design achievements
G3 Patent Applications (count)Annual patent applications
G4 Patents Granted (count)Annual patents granted
G5 Design Transactions (count)Annual design service contracts signed
G6 Design Service Revenue (10K CNY)Annual design service income
G7 Design Firms (count)Number of design enterprises
G8 Serviced Enterprises (count)Number of enterprises receiving design services
Human Capital (GC)G9 Full-time Industrial Designers (persons)Number of dedicated industrial designers
G10 Industrial Designer Growth Rate (%)Annual growth rate of industrial designers
G11 Certified Mid-to-Senior Level Professionals (%)Proportion of certified mid-to-senior level designers
G12 Certification Rate (%)Percentage of designers with professional qualifications
Development Environment (GD)G13 Innovation Vitality (count)Annual regional patent applications
G14 Innovation Talent Pool (persons)Number of certified professionals in region
G15 Financial Service Capacity (10K CNY)Total regional deposits and loans (local/foreign currency)
G16 Government Intervention (%)Ratio of fiscal expenditure to regional GDP
G17 Economic Development LevelPer capita GDP
Table 2. Preliminary Indicator System for Industrial Design Agglomeration Components (First Adjustment).
Primary IndicatorsSecondary IndicatorsOperational Definition
Agglomeration Degree (GA)G1 Location Quotient (%)Regional industrial specialization level
Industrial Scale (GB)G2 Commercialized Output Value (10K CNY)Industrialized output value of design achievements
G3 Patents Granted (count)Annual number of patents granted
G4 Design Transactions (count)Annual number of design service contracts signed
G5 Design Firms (count)Number of design enterprises
Human Capital (GC)G6 Full-time Industrial Designers (persons)Number of dedicated industrial designers
G7 Certified Mid-to-Senior Level Professionals (%)Proportion of certified mid-to-senior level designers
G8 Certification Rate (%)Percentage of designers with professional qualifications
Development Environment (GD)G9 Innovation Vitality (count)Annual regional patent applications
G10 Innovation Talent Pool (persons)Number of certified professionals in the region
G11 Financial Service Capacity (10,000 CNY)Total regional deposits and loans (local/foreign currency)
G12 Government Intervention (%)Ratio of fiscal expenditure to regional GDP
Table 3. Refined Indicator System for Industrial Design Agglomeration Components (Second Adjustment).
Primary IndicatorsSecondary IndicatorsOperational Definition
Agglomeration Degree (GA)G1 Location Quotient (%)Regional industrial specialization level
Industrial Scale (GB)G3 Patents Granted (count)Annual number of patents granted
G4 Design Transactions (count)Annual number of design service contracts signed
Human Capital (GC)G6 Full-time Industrial Designers (persons)Number of dedicated industrial designers
G8 Certification Rate (%)Percentage of designers with professional qualifications
Development Environment (GD)G9 Innovation Vitality (count)Annual regional patent applications
G10 Innovation Talent Pool (persons)Number of certified professionals in the region
G11 Financial Service Capacity (10,000 CNY)Total regional deposits and loans (local/foreign currency)
G12 Government Intervention (%)Ratio of fiscal expenditure to regional GDP
Table 4. Final Indicator System for Industrial Design Agglomeration Components.
Primary IndicatorsSecondary IndicatorsOperational Definition
Agglomeration Degree (GA)G1 Location Quotient (%)Regional industrial specialization level
Industrial Scale (GB)G2 Commercialized Output Value (10K CNY)Industrialized output value of design achievements
G3 Design Transactions (count)Annual design service contracts signed
Human Capital (GC)G4 Full-time Industrial Designers (persons)Number of dedicated industrial designers
Development Environment (GD)G5 Innovation Vitality (count)Annual regional patent applications
G6 Innovation Talent Pool (persons)Number of certified professionals in region
G7 Financial Service Capacity (10K CNY)Total regional deposits and loans (local/foreign currency)
G8 Government Intervention (%)Ratio of fiscal expenditure to regional GDP
Table 5. Preliminary Evaluation Index System for Manufacturing Enterprise Innovation Performance (Preliminary).
Primary IndicatorsSecondary IndicatorsOperational Definition
Innovation Performance Input (YA)Y1 Enterprise R&D Investment Intensity (%)Cumulative R&D expenditure by year-end
Innovation Performance Output (YB)Y2 Patents Granted (count)Annual patents granted
Y2 Patent Applications (count)Annual patent applications
Table 6. Refined Evaluation Index System for Manufacturing Enterprise Innovation Performance.
Primary IndicatorsSecondary IndicatorsOperational Definition
Innovation Performance Input (YA)Y1 Enterprise R&D Investment Intensity (%)Cumulative R&D expenditure by year-end
Innovation Performance Output (YB)Y2 Patents Granted (count)Annual patents granted
Table 7. Panel Model Specification Test Results.
Test TypeY1 ResultsY2 Results
F-testsF (9,65) = 87.011, p = 0.000F (8.32) = 75.341, p = 0.000
Breusch–Pagan testsχ2(1) = 181.336, p = 0.000χ2(1) = 143.727, p = 0.000
Hausman testsχ2(4) = 60.680, p = 0.000χ2(4) = 71.115, p = 0.000
Table 8. Expert Evaluation Summary of Policy Recommendations Across Four Dimensions.
Policy RecommendationDimensionMeanSDPercentiles (P50/P70)
Establishing Differentiated Agglomeration Strategies Based on Regional FoundationsFeasibility5.270.985/6
Innovation Promotion5.600.765/6
Regional Compatibility5.131.075/6
Sustainability5.470.906/6
Advancing Digital Transformation in Industrial Design to Achieve Dual Expansion in Scale and IntelligenceFeasibility5.800.856/6
Innovation Promotion5.670.776/6
Regional Compatibility5.201.025/6
Sustainability5.550.885/6
Establishing an Industry-Academia-Research Integrated Talent Development System to Enhance Design-Manufacturing CompatibilityFeasibility6.000.756/7
Innovation Promotion6.130.646/6
Regional Compatibility5.800.796/6
Sustainability6.070.706/7
Enhancing the Institutional Innovation Support System and Transforming the Government RoleFeasibility5.071.055/6
Innovation Promotion5.330.945/6
Regional Compatibility4.931.125/6
Sustainability5.200.905/6
Table 9. Reliability Analysis Results of Questionnaire Dimensions (Cronbach’s α).
DimensionsCronbach’s AlphaItems
Feasibility0.9584
Innovation Promotion0.9034
Regional Compatibility0.8494
Sustainability0.9234
Disclaimer/Publisher’s Note: The statements, opinions and data contained in all publications are solely those of the individual author(s) and contributor(s) and not of MDPI and/or the editor(s). MDPI and/or the editor(s) disclaim responsibility for any injury to people or property resulting from any ideas, methods, instructions or products referred to in the content.