Article

Integrating Species Richness, Distribution and Human Pressures to Assess Conservation Priorities in High Andean Salares

by
Marcelo Hernández-Rojas
1,2,
Rodrigo A. Estévez
3,4,5,
Cristian Romero
6,
Sebastián Pérez
6 and
Fabio A. Labra
3,*
1
Doctorado en Conservación y Gestión de la Biodiversidad, Facultad de Ciencias, Universidad Santo Tomás, Santiago 8370003, Chile
2
Primer Tribunal Ambiental, Avenida General José Miguel Carrera1579, Antofagasta 1270037, Chile
3
Centro de Investigación e Innovación para el Cambio Climático, Facultad de Ciencias, Universidad Santo Tomás, Santiago 8370003, Chile
4
Institute of Ecology and Biodiversity (IEB), Casilla 653, Santiago 7800003, Chile
5
Instituto Milenio en Socio-Ecología Costera (SECOS), Santiago 8320000, Chile
6
CSW Consultores Ambientales, Nueva de Lyon 96, Providencia, Santiago, 7510078, Chile
*
Author to whom correspondence should be addressed.
Sustainability 2025, 17(18), 8139; https://doi.org/10.3390/su17188139
Submission received: 18 July 2025 / Revised: 31 August 2025 / Accepted: 4 September 2025 / Published: 10 September 2025
(This article belongs to the Section Sustainability, Biodiversity and Conservation)

Abstract

High Andean salares and their surrounding basins host unique ecosystems and rich biodiversity. Increasing global demand for lithium and brines in these environments have attracted significant international investment, raising both economic expectations and socio-environmental concerns. This poses major challenges for biodiversity conservation, governance models, and the management of socio-environmental conflicts. One of the main challenges for effective conservation is the lack of systematic biodiversity inventories and an integrated conservation diagnosis. In this study, we leverage range–diversity plot analysis to describe the patterns of biological diversity and species distribution in High Andean salares. We then integrate this information with estimates of available suitable habitat area and degree of human pressure, to categorize the priorities for the salt flats. Our results show that many salt flats serve as biodiversity hotspots, dominated by species with wide distribution ranges. A significant number of salt flats host rare species, indicating the necessity for focused conservation initiatives. The studied salt flats warrant prioritisation for restoration, protection, and the enhancement of public policies and social awareness initiatives. Current conservation strategies should be consistent with the Network of Protected Salt Flats as outlined in the National Lithium Strategy, thereby enhancing socio-environmental governance in these delicate socio-ecosystems.

1. Introduction

Biodiversity is declining globally at unprecedented rates, threatening economies, livelihoods, food security, health, and overall human well-being [1]. The Intergovernmental Science-Policy Platform on Biodiversity and Ecosystem Services estimates that nearly one million species are at risk of extinction within decades unless transformative changes in land use and resource management are implemented [2]. At the same time, the accelerating climate crisis, driven by anthropogenic greenhouse gas emissions, is altering global climatic systems through more frequent extreme events, sea level rise, and altered ocean chemistry. These interconnected crises have prompted calls to better align biodiversity and climate agendas to address their synergistic threats [3,4]. A central strategy to mitigate climate change is the transition from fossil fuel-based energy systems toward renewable energy and electromotive transport [5,6,7]. However, this transition depends heavily on lithium-based batteries for large-scale energy storage, and lithium is predominantly extracted from salt flats and saline lakes [5,6,8,9,10]. This highlights an emerging trade-off: achieving decarbonization while safeguarding ecosystems that host critical biodiversity. Although global strategies for biodiversity and climate are often pursued separately under the United Nations Framework Convention on Climate Change (UNFCCC) and the Convention on Biological Diversity (CBD), these challenges are deeply interconnected [4,11]. Addressing this emerging tension requires integrative approaches and robust information to guide conservation and land-use planning in regions facing rapid expansion of resource extraction.
The Altiplano–Puna plateau of the Central Andes, spanning northwestern Argentina, southern Bolivia, and northern Chile, hosts numerous high-Andean salares (in Spanish salares), which are among the largest of their kind worldwide [8,12,13,14,15,16]. These endorheic basins are shaped by high salinity and limited drainage in hyper-arid environments, and sustain fragile but highly distinctive ecosystems which are critical habitats for conservation given their high endemism, unique ecological functions, and vulnerability to anthropogenic pressures [9,10,17,18,19,20]. Through interconnected aquifers and shallow water tables [15,16], these basins support lagoons, meadows, and peatlands that together form high-Andean wetlands, providing habitat for diverse communities of microorganisms, aquatic microalgae and invertebrates, amphibians, birds, mammals, and plants, including migratory threatened species such as Andean flamingos and endemic amphibians, which depend on the shallow lagoons and peatlands fed by salar hydrology [10,18,19,20,21,22,23,24,25,26,27,28,29,30,31,32,33,34,35,36,37,38,39]. Many of these species are endemic to this region [25,27,31,32,33].
Beyond their biodiversity value, high Andean salares also provide essential ecosystem services that sustain both local communities and broader ecological functions. Their interconnected aquifers regulate water availability in arid basins, buffering variability in precipitation and maintaining baseflows that support wetlands, pastures, and agriculture in surrounding area. In addition, cultural and provisioning services, such as water for traditional pastoralism and ecotourism, contribute directly to local livelihoods and regional economies [40]. Recognizing these ecosystem services underscores the importance of conserving salt flats not only as reservoirs of biodiversity but also as socio-ecological systems that sustain human well-being. The conservation importance of many of these socio-ecological systems is recognized internationally through Ramsar site designations and nationally through their protections as national parks and reserves [16,41,42]. Their ecological vulnerability, however, is heightened by water scarcity, climatic variability, and intensifying human pressures. As mentioned earlier, in addition to their biodiversity features, these salt flats are also major reservoirs of lithium and other strategic minerals, placing them at the centre of global energy transition debates [8,9,12,13,14,15,16,43].
Recent studies have shown that extraction of lithium or other minerals, and the associated water withdrawals are already affecting highly endemic species in salt flats. For example, population declines of Andean flamingos (Phoenicoparrus spp.) have been linked to reduced surface water availability in the Salar de Atacama, where desiccation of brine ponds alters critical breeding and foraging habitats [10]. Similarly, threatened aquatic frogs of the genus Telmatobius, many of them microendemic to single basins, are experiencing severe range contractions across the Lithium Triangle. In Argentina, Telmatobius rubigo has more than 60% of its suitable distribution area overlapping with active or planned mining operations, placing populations at high risk of decline [44]. In Chile, species such as T. chusmisensis (Tarapacá) and T. philippii (at Ascotán salt flat) show small, fragmented populations confined to isolated springs adjacent to salt flats, where water extraction for mining poses a major threat to their persistence [31,32,33]. New genomic studies further underscore this vulnerability. Recently, Fibla et al. [31] demonstrated that Telmatobius philippii, previously known from a single locality, also occurs in the Ascotán and Carcote salt flats, where populations are confined to springs as small as 0.01–0.02 km2. Although these populations belong to the same species, they represent distinct evolutionarily significant units with extremely low genetic diversity, confirming their heightened extinction risk in the face of hydrological alteration [31]. These cases illustrate how even low-diversity systems can host narrow-range endemics whose survival is tightly coupled to fragile hydrological conditions, and that expanding lithium development could accelerate local extirpations. Recognizing these risks reinforces the need for conservation prioritization frameworks that account not only for species richness but also for endemism and habitat vulnerability.
Chile is currently a leading producer of lithium [17,45] and aims to expand extraction across multiple salt flats included under its recently announced National Lithium Strategy, which encompasses 26 high Andean salares and several lower-elevation systems [46]. As a result, conservation planning in these ecosystems faces unprecedented challenges in balancing ecological integrity with economic development. Yet, despite their ecological and socio-economic importance, few studies have explicitly integrated biodiversity data with mining concessions or climate variables (but see [10,44]), leaving major gaps in our understanding of how extractive pressures and environmental or climate change may jointly shape conservation priorities in these ecosystems. These knowledge gaps are particularly relevant considering international commitments under the Escazú Agreement [47], which emphasizes access to environmental information and participation in decision-making, and the Global Biodiversity Framework, which sets clear targets for halting biodiversity loss and safeguarding ecosystems of high endemism [48]. At the national level, aligning conservation strategies for salt flats with these frameworks can strengthen Chile’s capacity to balance lithium development with biodiversity protection [46].
In this regard, geographic biodiversity patterns are a cornerstone of spatial conservation planning and are commonly used to identify areas of ecological importance [49,50,51,52,53,54,55]. Effective prioritization, however, depends on geographically detailed and taxonomically representative data, which remain incomplete for most taxa in many regions. Beyond the challenge of filling data gaps, biodiversity quantification itself presents conceptual and methodological challenges, including the choice of metrics, such as species richness, diversity indices, or abundance, as well as how to address incomplete or uneven sampling efforts across diverse geographic regions [56,57,58,59]. Despite these complexities, many assessments continue to rely primarily on species richness as a proxy for biodiversity, guiding the designation of global “hotspots” [60,61]. While this approach has proven useful, it carries important limitations. Areas of high richness may be dominated by widespread taxa, while regions of lower richness can harbour endemic, rare or range-restricted species that are disproportionately vulnerable to extinction [53,62,63,64,65,66,67]. Consequently, prioritizations based solely on richness risk overlooking cold spots or low-richness areas that nonetheless hold critical conservation value. Increasingly, integrative approaches that combine richness with measures of rarity and endemism are being advanced to capture the multidimensional nature of biodiversity and to reduce biases in conservation prioritization, especially in data-scarce ecosystems facing rapid environmental change such as the high Andes [53,54,55,68,69,70].
To overcome the limitations of richness-only approaches, recent frameworks emphasize the integration of complementary biodiversity dimensions into conservation assessments. Presence–absence matrices provide a basis for summarizing species distributions across sites [68,69,71]. Range–Diversity (RD) plots build on this by jointly considering species richness and geographic range size, allowing sites to be distinguished not only by the number of species they host but also by whether these species are widespread or range-restricted [53,54,55,71]. This dual perspective helps identify areas that are rich in rare species as distinct from those dominated by common taxa, offering a more nuanced view of conservation value. The related concept of dispersion fields further captures the degree of overlap among species ranges at a given site, providing insights into biotic similarity, turnover, and the geographic structure of assemblages [72,73,74]. When combined with socio-ecological indicators, these integral approaches to biodiversity metrics may gain further strength. The Conservation Priorities Method (CPM), for example, integrates biodiversity metrics such as species richness with habitat availability and human pressures, providing a multidimensional framework to identify sites that simultaneously hold high ecological value and face intense anthropogenic threats [51,52]. This explicitly relates ecological patterns with their socio-ecological context. Together, RD plots and CPM approaches provide a robust and spatially explicit framework to identify conservation priorities, particularly in fragile ecosystems where ecological vulnerability and extractive pressures converge.
In this study, we apply an integrative framework to assess conservation priorities across 33 high-Andean salares in northern Chile. By combining biodiversity metrics (species richness), spatial range information (RD plots and dispersion fields), and socio-ecological indicators (habitat availability, human pressure), we aim to generate a holistic diagnostic of conservation needs in ecosystems increasingly exposed to lithium extraction and climate variability. From a practical point of view, RD plots classify sites according to both richness and the range size of their species, distinguishing those dominated by rare taxa from those dominated by widespread species [68,69,75]. This allows the classification of sites into categories such as: (i) rich-rare: sites with high species richness dominated by range-restricted species; (ii) poor-rare: sites with low species richness and few geographically restricted species; (iii) rich-common: sites with high species richness dominated by widespread species. These categories facilitate rapid identification of conservation priority areas, particularly those simultaneously supporting high species numbers and rare taxa and which may face increased anthropogenic pressures [51,52,68,69,75]. Building on this integrated framework, we address four questions: (1) Which salt flats exhibit the highest richness of plant and animal species? (2) Which sites harbour the greatest proportion of rare or range-restricted species? (3) How do patterns of biodiversity intersect with human pressures and habitat availability? and (4) To what extent do priority areas overlap with existing protected areas? Based on macroecological theory, we predict that sites with higher proportional species richness will also tend to show larger average dispersion fields, reflecting assemblages dominated by widespread taxa. This provides a benchmark for detecting exceptional sites where richness coincides with rarity, thereby identifying salt flats of disproportionate conservation value. To address these questions, we curated and analysed species occurrence data for terrestrial plants and vertebrates across 33 sub-subbasins (SSBs) encompassing high Andean salares along a latitudinal gradient spanning approximately 990 km in northern Chile. Using linear range–diversity plots and an integrated conservation prioritization approach, we identified areas of high conservation importance and evaluated the overlap of these areas with the current network of protected areas. Finally, we discuss the potential implications of expanded lithium development under the National Lithium Strategy for biodiversity conservation across Chile’s High Andean salares.

2. Materials and Methods

2.1. Study Area

Location, Topography and Climate

The Andean Altiplano is characterized by multiple high-altitude endorheic basins, with topography dominated by snow-covered mountains of primarily volcanic origin, showing also presence of ridges and high elevation plateaux [8,20,76,77,78]. This region corresponds to the Dry Puna ecoregion, spanning southwestern Bolivia, northeastern Argentina, and northern Chile between 17° S and 27° S [8,78]. Our study focused on 33 high Andean salares distributed across 10 administrative communes and 4 regions of northern Chile (Arica and Parinacota, Tarapacá, Antofagasta and Atacama). These salares are located between 18.84° S and 27.46° S along the western Andes in northern Chile, and span more than 900 km along the western Andes between 67°17′ W and 69°07′ W. (Figure 1). These systems include hydrographic basins with adjacent high Andean peatlands (in Spanish, bofedales), wetlands and water bodies and creeks [79,80]. To characterize the geophysical setting, we relied on the following spatial datasets: Elevation, Climate, Hydrographic units, salt flat spatial extent and land cover. A summary of all data sources, including their resolution and access links, is provided in Table 1.
Elevation data were obtained from the ETOPO 2022 Global Relief Model, which provides a 30-arcsecond resolution global digital elevation model (DEM) [81]. Local climate was characterized using data from weather stations located within the study region. However, given the limited spatial coverage of weather stations across all the studied salt flats, mean annual temperature and mean annual precipitation were extracted from WorldClim v2.1 database at 30-arcsecond resolution [82]. WorldClim estimates were validated against available station data to ensure consistency and reliability (Supplementary Figure S1).
In addition, the area of analysis for each of the 33 salt flats was defined based on the extent of the corresponding sub-subbasin (SSB), as delineated by the DGA) [84,85,86]. Sub-subbasins represent hydrographic units characterized by the flow of water into a subbasin, encompassing all surface and subsurface inflows, including streams, estuaries, lakes, and lagoons, whether continuous or intermittent [84,85,86]. This hydrological unit was used as a proxy for the spatial extent of the salt flat’s ecological and hydrological catchment area. In addition, we also collected available estimates of saline system area, as documented by existing technical reports by the Mining Ministry. Thus, SSB Area and saline system area provide complementary estimates of the spatial extent of each Salar. Finally, land cover composition across our study area was mapped using a national land cover dataset based on FAO standards, developed by Zhao et al. by integrating multitemporal Landsat data [83,87].
To determine the drivers underlying abiotic gradients across the study area, we analysed the relationships between elevation, latitude, mean annual temperature, and mean annual precipitation using regression techniques. Temperature was modelled with a linear regression including both latitude and elevation as predictors, with only elevation showing a significant effect. Precipitation was modelled using linear and quadratic terms of latitude and elevation to account for non-linear trends, with latitude emerging as the only significant predictor. All regressions were fitted using ordinary least squares (OLS) with the lm function in the stats package in R [88], and the resulting relationships with 95% confidence intervals were visualized with ggplot2 [88,89]. Salt flat ID numbers as shown in Table 2 and Figure 2 were annotated in Figure 1c,d to facilitate site-level comparisons. These models form the basis of Figure 1c,d, which illustrate the general climatic patterns across the latitudinal and elevational gradients of the high-Andean salares.

2.2. Analysing Species Diversity and Distribution Across High Andean Salares

2.2.1. Analytical Framework

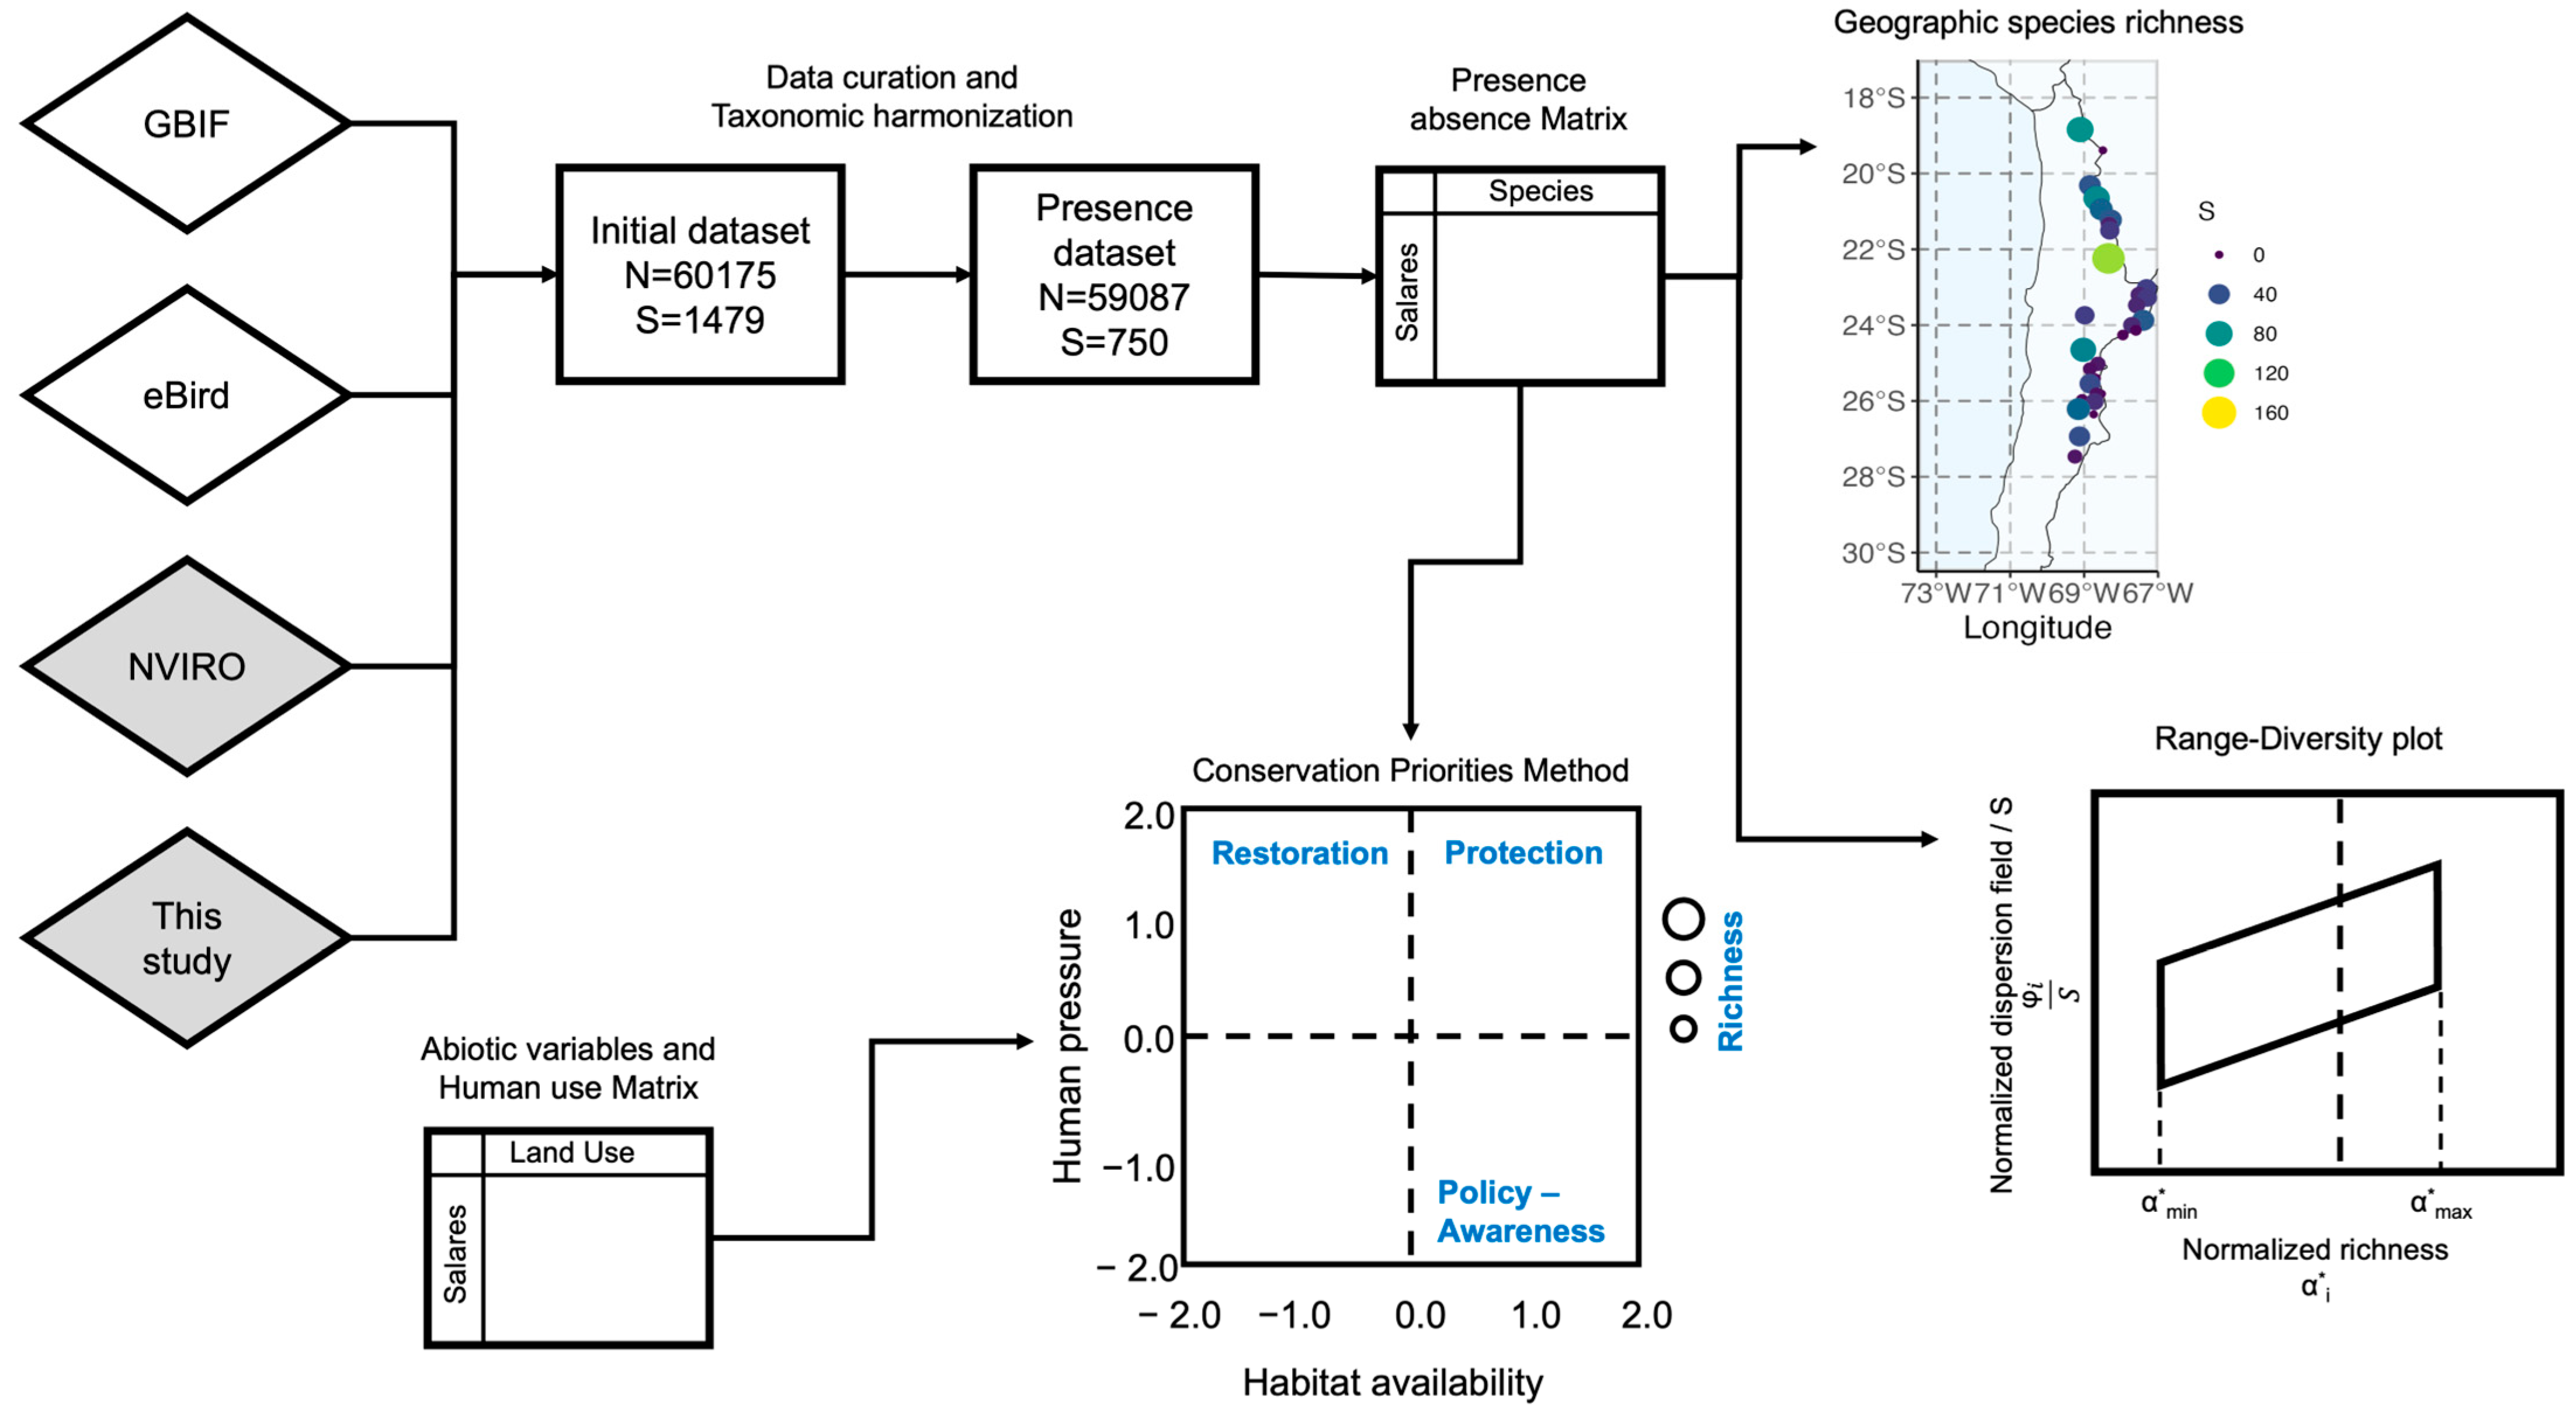
The analytical workflow applied in this study is summarized in Figure 2. It comprises four sequential stages: (i) data compilation and curation, (ii) construction of a presence–absence matrix (PAM), (iii) biodiversity pattern analysis via linear range–diversity plots, (iv) conservation prioritization integrating biodiversity metrics, habitat availability, and human pressure. We now detail each of these.

2.2.2. Biodiversity Geodatabase Curation and Processing

Georeferenced species occurrence records were gathered from three primary sources: (i) the Global Biodiversity Information Facility (GBIF) [90,91], (ii) eBird database [92,93], and (iii) technical documentation and of Environmental Impact Assessment (EIA) studies and monitoring reports, as reported in Chile’s centralized Environmental Assessment Service portal (https://www.sea.gob.cl, accessed on 23 February 2025). To do so, we compiled biodiversity information by mapping the spatial extent of Environmental Impact Assessment (EIA) projects in Chile, which allowed us to identify those located within each sub-subbasin (SSB). For the selected projects, we systematically reviewed and standardized species records, extracting presence or abundance data for vertebrates and plants. Additionally, we conducted a thorough review of technical literature associated with EIA processes on Chile’s high Andean salares [94].
All records were spatially filtered to the extent of the study area (Figure 1), and checked for coordinate accuracy, removing points with low spatial precision and duplicated presence points. We then verified the reported species names, ensuring the taxonomic details of all presence records were harmonized. Taxonomic harmonization followed standardized protocols [95]. For plants, taxonomic validation used World Checklist of Vascular Plants, accessed through the Royal Botanical Gardens Kew Plants of the World Online (POWO) [96] and the Catalogue of Vascular Plants of Chile [97]. For mammals, taxonomic references followed the updated Chilean mammal list [98] (Figure 2).

2.2.3. Construction of Presence–Absence Matrix (PAM)

From the curated geodatabase, a binary presence–absence matrix (PAM) was generated, with rows representing high Andean salares and columns represent plant or vertebrate species. Each PAM cell was coded as 1 (presence) or 0 (absence) [68,69,75]. PAMs serve as fundamental analytical tools in biogeography and macroecology, and allow the simultaneous assessment of two fundamental biodiversity attributes: species richness (estimated as the column sums per site) and species geographic range size (estimated as the row sums across sites), thus summarizing species’ distributional ranges and site-specific diversity [99,100,101]. Once estimated, PAM served as the input for both biodiversity pattern analysis (via RD plots; Section 2.2.4) and conservation prioritization frameworks. By combining richness and range-size information, PAMs provide a compact but powerful representation of biodiversity, especially suited to data-scarce environments such as the high Andean salares.

2.2.4. Analysis of Biodiversity Patterns: Range–Diversity Plots

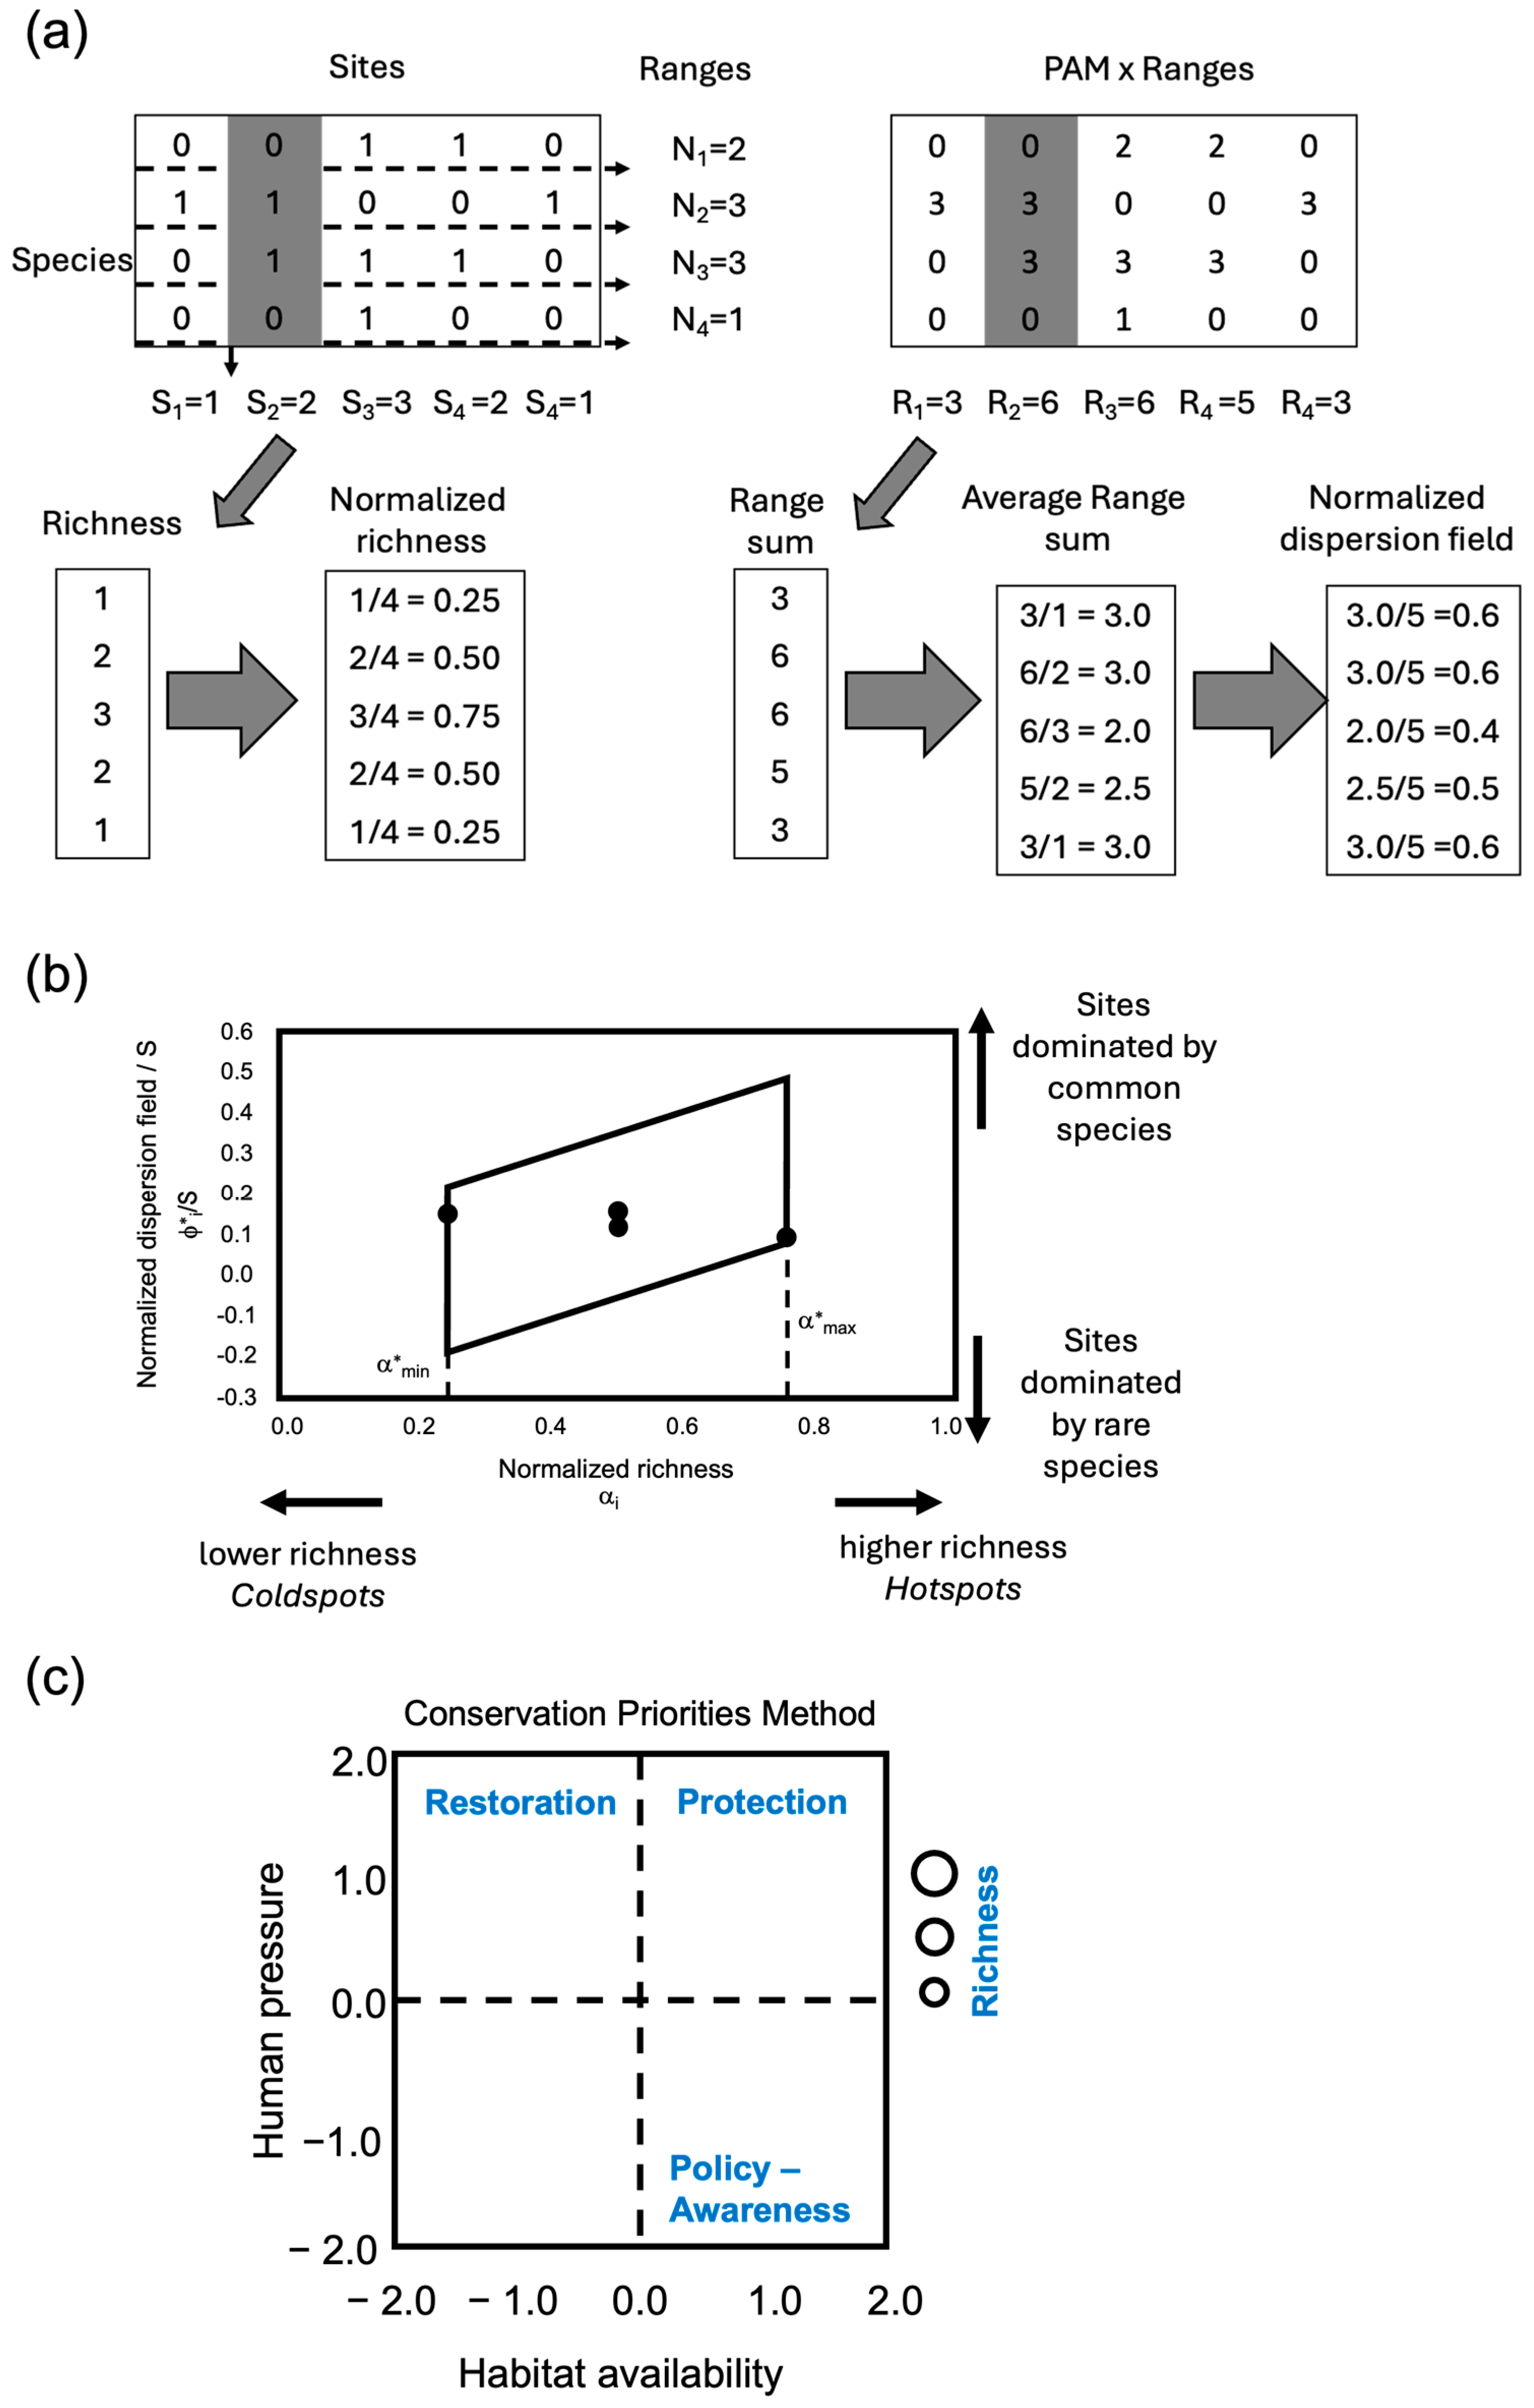
Species diversity and distributional patterns were jointly analysed using range–diversity (RD) plots, following the framework proposed in [68] and modified by [75], as illustrated in Figure 3.
Briefly, the construction of the modified Range–Diversity (RD) plot begins with the compilation of species presence–absence matrices (PAMs), where rows represent spatial sites (here, high Andean salares) and columns represent species. In the first step, species richness (the number of species present at each site) and the dispersion field (the number of sites occupied by each species) are calculated from the PAM by calculating the row and column sums, respectively. The species richness values are then normalized, where species richness in each site is divided by the total species pool (S). The species range sizes are used to calculate a dispersion field matrix, multiplying the PAM by the species ranges. This dispersion field matrix is then used to calculate the average geographic range per site, which is then normalized by dividing them by both the total number of sites and S [75]. Thus, for each site i, this yields the normalized species richness (α*i) and the normalized dispersion field divided by richness (ϕ*i/S) (where the * denotes the normalisation) which are subsequently plotted, with normalized richness on the x-axis and normalized dispersion field per species on the y-axis (Figure 3b). This process enables the simultaneous visualization of how species are distributed across sites in terms of richness and geographic commonness or rarity.
The resulting Range–Diversity plot (Figure 3b) provides a compact and interpretable view of biodiversity patterns across the study area. Each point represents a site or salt flat, positioned according to its normalized species richness (x axis) and normalized mean dispersion field (y axis). Sites located toward the lower right of the plot are characterized by high richness but composed primarily of geographically rare species (“rich-rare” sites), while those toward the upper right are rich in species that are widely distributed (“rich-common” sites). Conversely, points on the lower left represent “poor-rare” sites—species-poor assemblages dominated by rare species. This spatial arrangement facilitates the identification of sites that combine high species richness and high conservation value (due to species rarity), thereby supporting more informed prioritization of conservation efforts across socio-ecological landscapes [75]. Given the number of non-zero entries in the PAM, and the observed covariance structure it can be shown that the data points are constrained by parallelogram bounded by vertical lines at the minimum and maximum values of normalized richness (α), and diagonal lines with slope 1/β, corresponding to the minimum and maximum values of dispersion field covariances (τ) [75]. Unlike the standard RD plot, where the mean dispersion field is normalized by local species richness (α*), here it is averaged across all species in the regional pool [68,69,75]. Following previous studies, the rich and poor sites are identified by using the 25th and 75th percentiles of normalised richness [53,54,55,71].
To evaluate the statistical significance of the observed dispersion fields, a randomization procedure was applied. The PAM was randomized using the “independentswap” algorithm [102] while preserving the row and column totals (i.e., maintaining site richness and species incidence). For each randomized matrix, normalized dispersion field values were recalculated. Repeating this process across 500 iterations generated a null distribution of dispersion fields. Observed values were then compared to this null distribution: sites with dispersion fields significantly lower than expected (below the 2.5th percentile) indicate assemblages composed of particularly rare and geographically restricted species, while sites with significantly higher dispersion fields (above the 97.5th percentile) reflect assemblages dominated by widespread, common species. Sites within the 95% confidence interval were considered statistically indistinguishable from random expectations. Thus, the RD plot not only visualizes biodiversity patterns but also highlights which sites deviate significantly from random assembly patterns, reinforcing their conservation relevance [75].
The linearised RD plotting method was implemented using R version 4.3.2 and the package biosurvey version 1.0.0. [75,88,103].

2.3. Assessing the Role of Anthropic Pressures: Conservation Priorities Methods (CPM)

To complement the biodiversity-centred prioritization obtained from the RD plot approach, we applied the Conservation Priorities Method (CPM) proposed in [51]. This approach integrates three indicators: (i) Biodiversity Value (BV), (ii) Habitat Availability (HA) and (iii) Human Pressure (HP). Each of these three metrics was standardized to their corresponding z-scores, by subtracting the mean and dividing by the standard deviation. In addition, HP values were inverted to maintain interpretative consistency (higher HP = more negative impact). Sites were then positioned in a three-dimensional conservation priority space, where recommended conservation actions (e.g., land protection, habitat restoration, species recovery, education/policy interventions) were assigned based on metric combinations. This dual framework enabled a robust, spatially explicit conservation prioritization of the high Andean salares, combining biodiversity metrics and socio-environmental indicators. Biodiversity Value was estimated as the proportion of species richness at each site, using the normalized species richness (α*). In what follows, we detail the estimation procedures for Habitat Availability and Human Pressures

2.3.1. Habitat Availability

Land cover influences hydrological dynamics by affecting runoff patterns and aquifer recharge [8]. Vegetated areas, such as grasslands, slow down runoff and favour infiltration, whereas barren or rocky areas accelerate surface flow and promote concentration processes in salares. As shown in Figure 1 and Supplementary Table S1, the region is predominantly barren (80%), followed by arid grasslands and shrublands (11%), salt flats (6%), water bodies (1.5%), and natural grasslands (0.6%). Land cover data for each salt flat, extracted from the national land cover dataset, were used to quantify habitat composition and availability. A Principal Component Analysis (PCA) was applied to the proportional cover of each land cover class to derive a multivariate indicator of habitat availability across the 33 salt flats. It may be noted that an alternative strategy to estimate habitat availability was to use the SSB area as a proxy variable. The results of both were examined and compared to determine if the overall emerging pattern was affected by the actual measure chosen.

2.3.2. Assessment of Human Pressure Indicators

To characterize human pressure across the 33 high Andean salt flat basins, we conducted a systematic review of publicly accessible environmental oversight and regulatory data. Human pressure indicators were grouped into four main categories. First, data from the Environmental Impact Assessment System (in Spanish Sistema de Evaluación Ambiental, SEIA) were used to identify all Environmental Qualification Resolutions (EQRs) issued for projects and activities within the study area [94,104]. Additionally, the surface area of active mining exploration and exploitation concessions was calculated at the sub-subbasin level. Second, records from the Environmental Superintendence (in Spanish Superintendencia del Medio Ambiente, SMA) [104] were reviewed to quantify the number of auditable units, as well as the number of environmental monitoring and inspection actions conducted in the study area. Third, information from the General Water Directorate (DGA) [84,85,86] was used to assess the extent of Protected Aquifers and the presence of water management instruments, including restrictions, prohibitions, scarcity decrees, and depletion declarations. Fourth, the number of cases filed before the Environmental Courts was compiled as an indicator of environmental conflict and judicialization at the sub-subbasin level. A composite indicator of human pressure was then derived by integrating these variables using Principal Component Analysis (PCA), allowing for the identification of spatial patterns and gradients of anthropogenic pressure across basins. The coordinate value for the first principal component was then used as our estimated value for human pressure. As an alternative estimated value to describe the magnitude of human pressures, we also examined the number of Environmental Qualification Resolutions (EQR), assessing its effect on the emerging salt flat classification.

2.4. Comparative Assessment of Conservation Prioritization Schemes

To evaluate the alignment and divergence among conservation prioritization strategies for high Andean salares, we compared rankings derived from two ecological frameworks—Range–Diversity (RD) plots and the Conservation Priorities Method (CPM)—with existing classifications from Chile’s National Lithium Strategy [46]. The RD plot approach classified salt flats into four biodiversity-based categories: “Hotspot, rare”, “Hotspot, common”, “Coldspot, rare”, and “Coldspot, common”, reflecting patterns in species richness and range size, as shown in Figure 3. The CPM assigned salt flats to the categories “Protection”, “Restoration”, “Policy/Awareness”, or “Production”, based on a multivariate integration of habitat availability, human pressure, and biodiversity value, as shown in the previous section. The third classification scheme corresponds to the strategic prioritization of salt flats as defined in Chile’s National Lithium Strategy [17,46,105], which aims to balance lithium extraction with environmental and social sustainability [46]. This policy defines a national framework for the state-led development of the lithium industry and includes the creation of a Protected Salt Flat Network to safeguard sensitive ecosystems. For comparative purposes, lithium policy designations were grouped into three categories: “Protection”, “Production” and “Mixed”, where a given salt flat is designated for a mixture of protection and production.
We evaluated the degree of correspondence between these schemes using pairwise two-way contingency table and applied Pearson’s Chi-square tests to assess independence or association across the different schemes. To visualize overlaps and discrepancies in classifications, we generated alluvial plots that illustrate the flow of sites between categories in each prioritization scheme. Alluvial plots were generated using ggalluvial r package [105,106]. Contingency tables and Pearson’s Chi-square tests were conducted in r using base and stats r packages [88].

3. Results

3.1. Geographic and Environmental Characteristics

As stated before, our study considers 33 high Andean salares distributed across four administrative regions of northern Chile (Arica y Parinacota, Tarapacá, Antofagasta, and Atacama). Their elevation ranges between 2305 and 4500 m above sea level, with an average elevation of 3721 ± 93 m (mean ± s.e.) (Table 2, Figure 1). Climatically, the region experiences arid and semi-arid conditions with marked orographic influences: annual precipitation decreases north to south and with decreasing altitude, while extreme temperature variations occur daily. Average temperature is inversely related to elevation, as shown by a significant linear relationship (F(1, 31) = 142.02, p < 0.001, adj. R2 = 0.82), while annual precipitation shows a significant nonlinear quadratic relationship with latitude (F(2, 30) = 20.37, p < 0.001, adj. R2 = 0.55) (Figure 1). Topographic and climatic parameters are summarized in Table 2.

3.2. Patterns of Species Diversity and Distribution Across High Andean Salares

The final curated geodatabase of biodiversity records included 59,087 presence records for 750 species of terrestrial plants and vertebrates across the 33 studied salares (Figure 2). Most of the terrestrial plant and vertebrate species in our database are native (90% and 93%, respectively). Our database included 461 terrestrial plant species, which include 24 endemic and 24 exotic species, predominantly found within the most dominant classes Equisetopsida and Magnoliopsida, which comprise 58% and 23% of all observed plants, respectively (Table 3).
The Animalia kingdom includes 289 species, with birds (Aves) as the most diverse class, followed by mammals, reptiles, and amphibians, which comprise 72%, 14%, 11% and 7%, respectively, of all observed terrestrial vertebrates. Endemism is relatively low (n = 9 or 3% in terrestrial vertebrates and n = 24 or 5% in terrestrial plants). Exotic and errant species were also relatively low (n = 10 or 4% in terrestrial vertebrates and n = 24 or 5% in terrestrial plants) (Table 3). Thus, our data set provides an important baseline to study species richness patterns in high Andean salares.
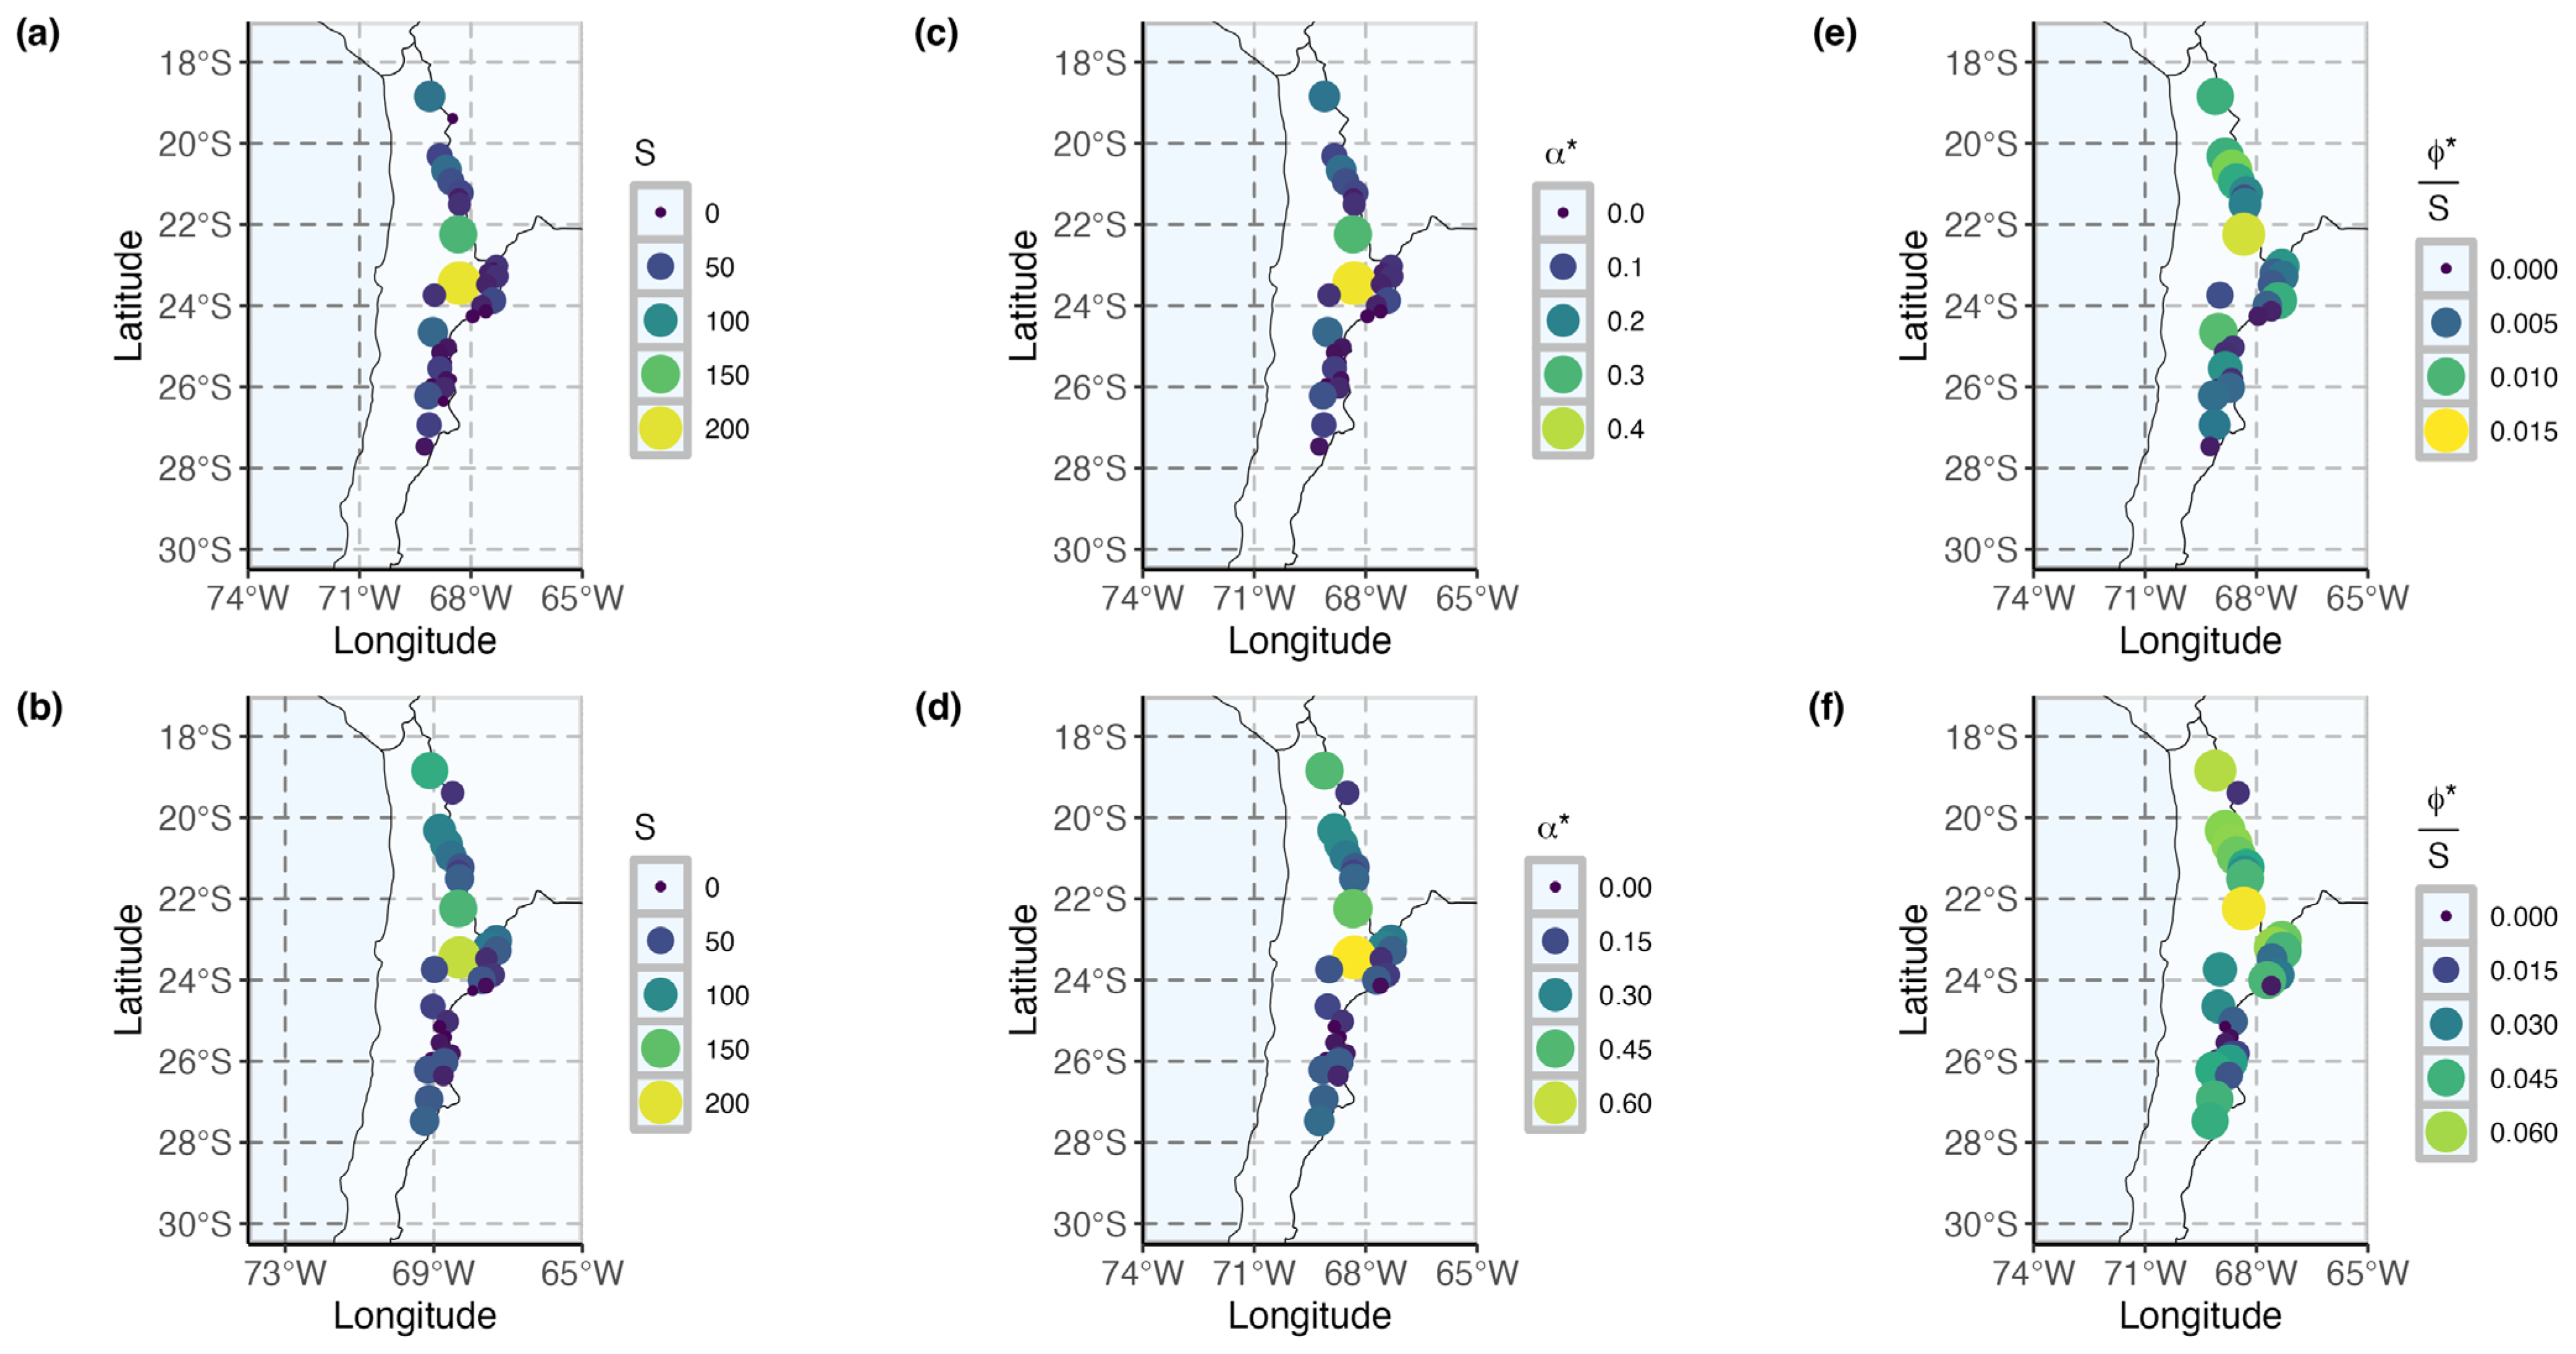
Regarding the spatial pattern of species richness and average range size, the highest species richness was found at Salar de Atacama (SPlantae = 203, SAnimalia = 190) and Río Salado (Salar de Turi) (SPlantae = 140, SAnimalia = 140) (Figure 4). Observed species richness in plants and animals were found to be significantly correlated (F(1, 31) = 30.67, p < 0.001, adj. R2 = 0.48) (Supplementary Figure S2). Regarding the potential drivers underlying the observed patterns of species richness, a stepwise linear regression model indicated that species richness responds significantly to both Latitude and SSC Area both in plants (F(2, 27) = 39.12, p < 0.001, adj. R2 = 0.72) and in animals (F(2, 29) = 16.69, p < 0.001, adj. R2 = 0.50) (Supplementary Figure S3). These correlations highlight the disproportionate contribution of the Salar de Atacama basin—the largest in the study area—to overall species richness, suggesting that its extensive area is a key driver of biodiversity patterns. This finding is particularly significant given that Salar de Atacama also hosts the largest lithium extraction operations in Chile, underscoring a critical spatial overlap between biodiversity hotspots and zones of intensive resource extraction.
Regarding the patterns of normalised average geographic range size, we observe that most salt flats are dominated by species with broad distributions (Figure 4).
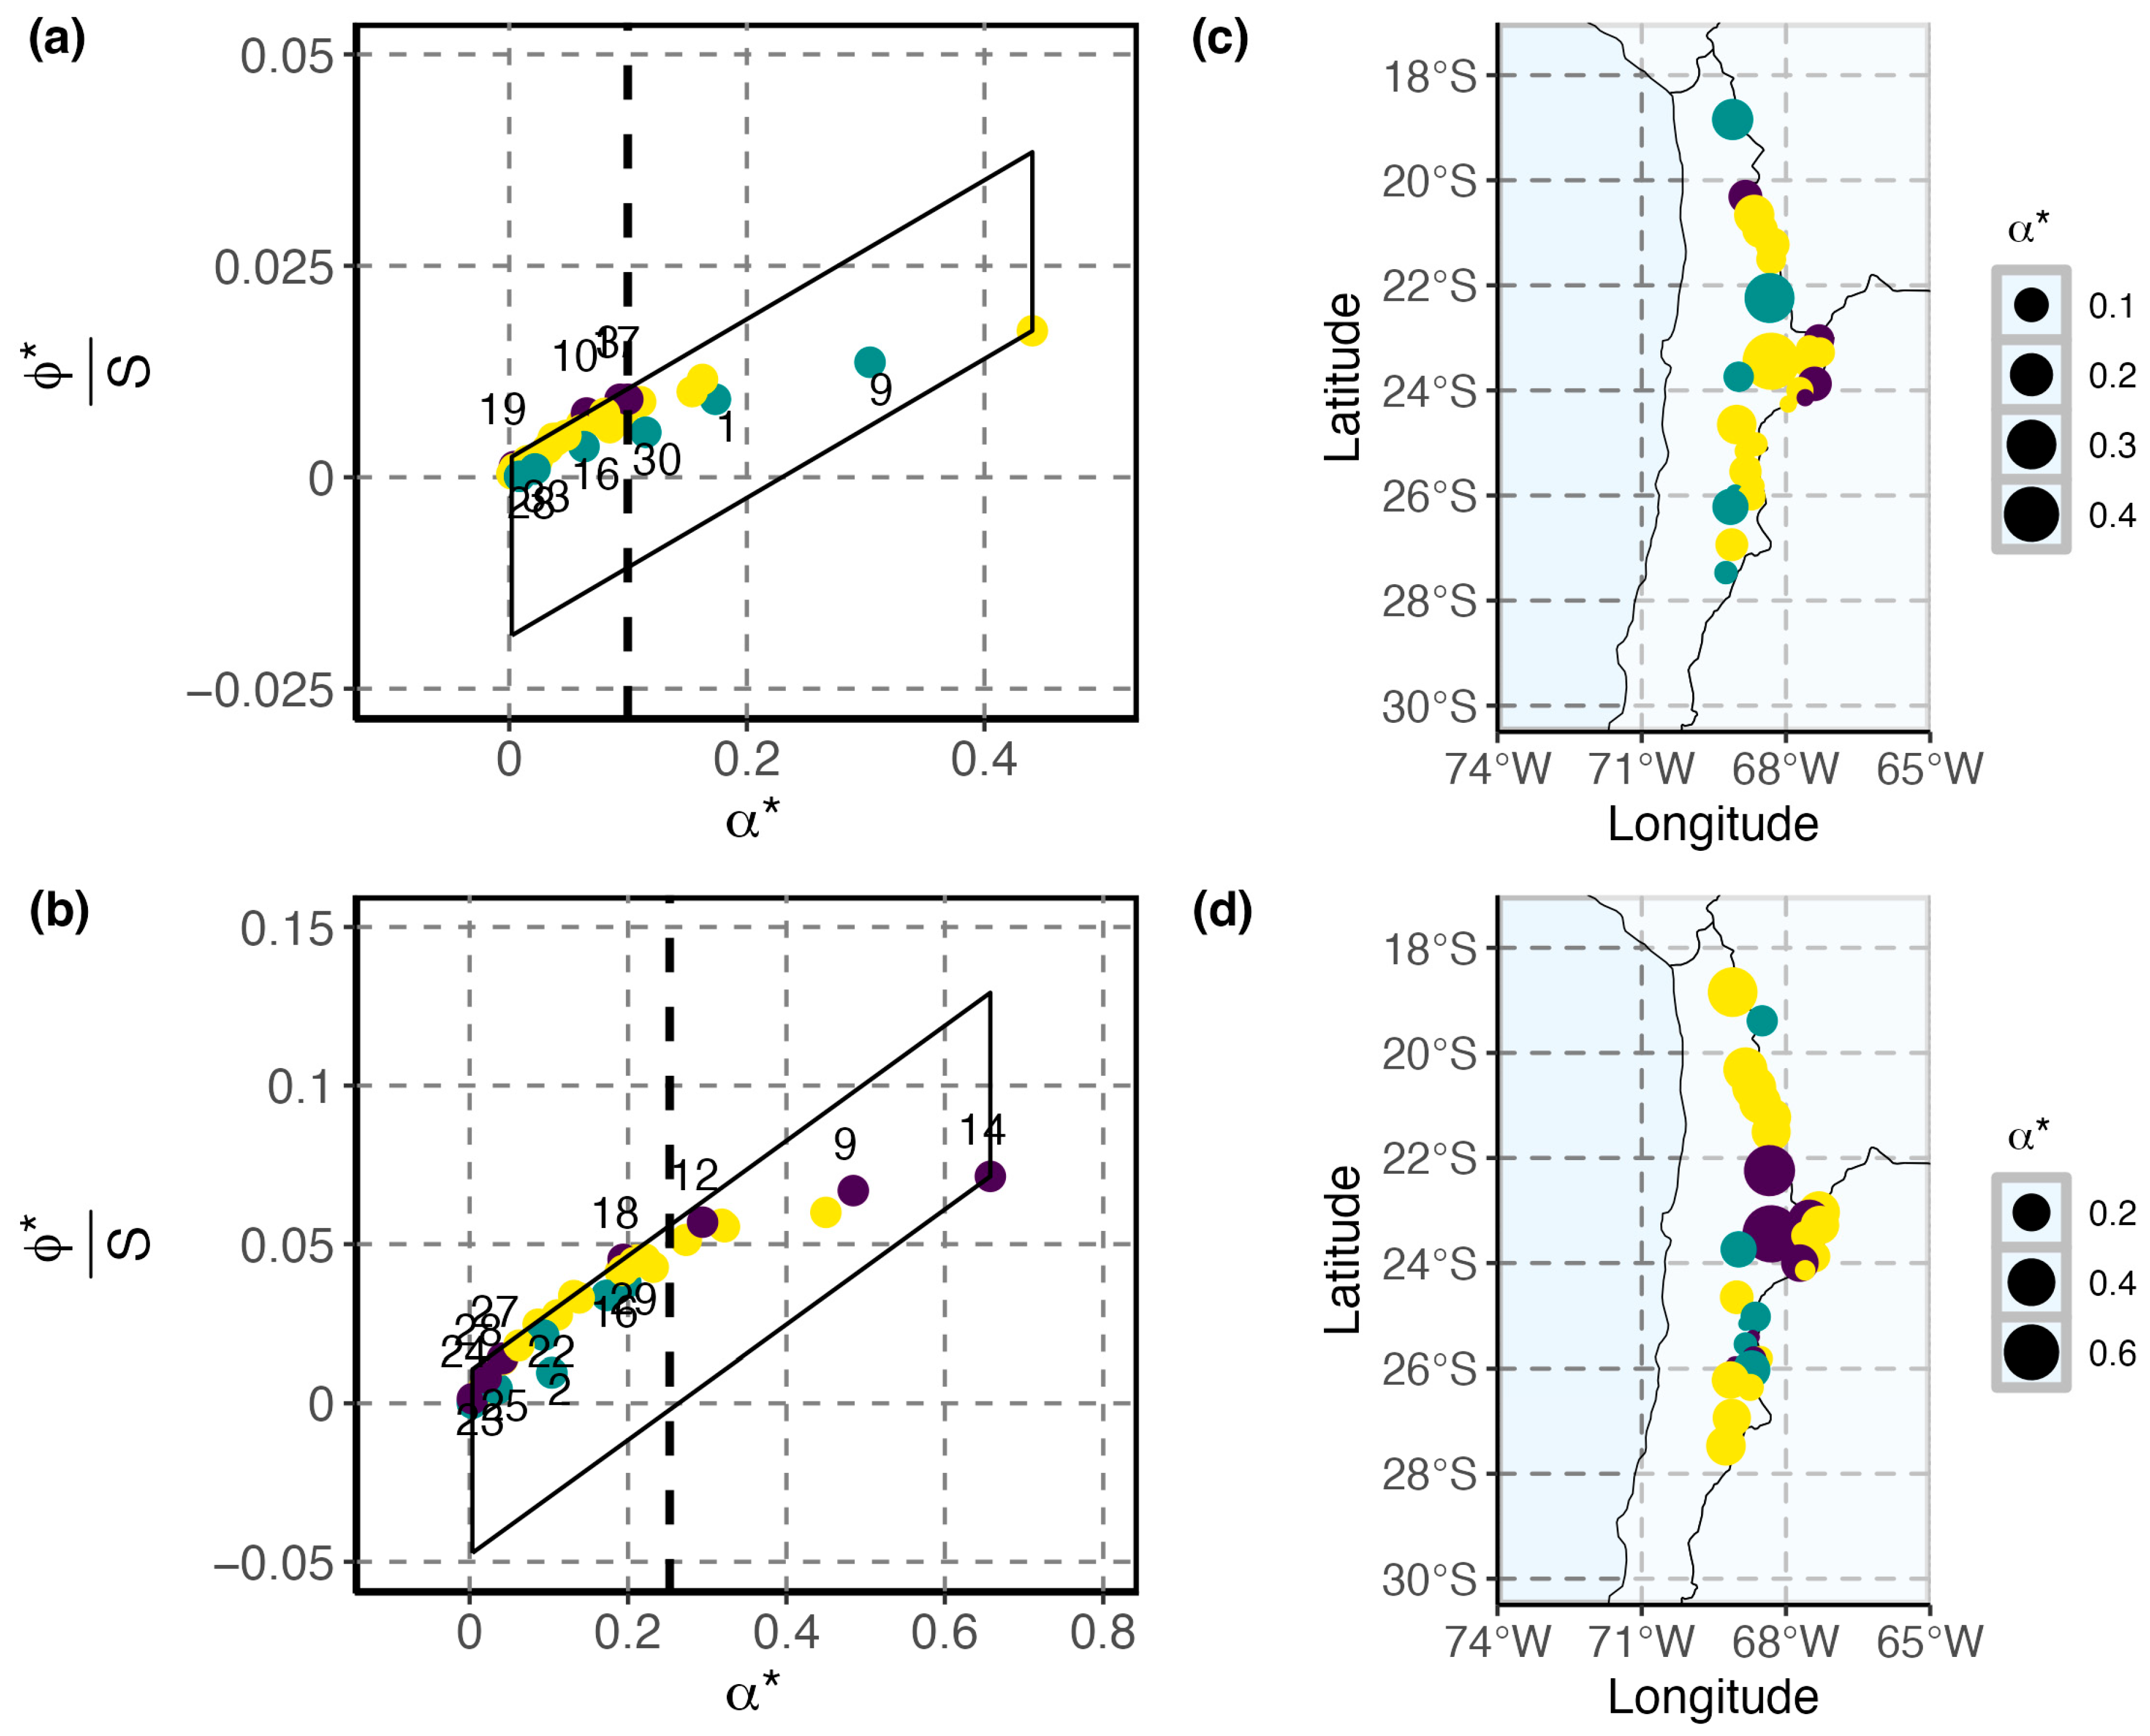
We observed a significant correlation between normalised species richness and normalised average geographic range size (Plantae: Spearman’s rho = 0.95, S = 243.72, p < 0.001; Animalia: Spearman’s rho = 0.98, S = 97.54, p < 0.001). As a result, normalised average geographic range size also shows significant linear association with Latitude and log-transformed Sub-subbasin Area (Plantae: R2 = 0.60, F(2, 27) = 20.37, p < 0.001, adj. R2 = 0.57); Animalia: R2 = 0.36, F(2, 29) = 8.20, p = 0.002, adj. R2 = 0.32). The examination of the range–diversity plots shows that several salt flats can be identified with either higher species richness (species richness hotspots), or with dominance of rare species (rare species sites).
In the case of terrestrial plants, we found that 8 salt flats have high species richness or hotspots (Salar de Surire, Coposa, Michincha, Turi, Atacama, El Laco, Punta Negra and Pedernales) with only 3 of them being dominated by rare species (Surire, Turi and Pedernales. On the other hand, only 3 salares were found to be coldspots dominated by rare species (Salar de los Morros, de los Infieles and Laguna del Negro Francisco) (Figure 5, Table 4). On the other hand, for terrestrial vertebrates we found 8 salares were hotspots, all being dominated by common broadly distributed species: Salar de Surire, Huasco, Coposa, Michincha, Turi, Tara, Pujsa and Salar de Atacama. As for coldspots dominated by rare species of terrestrial vertebrates, only 6 salares were found in this category: Salar de Pisiga, de los Morros, Aguas Calientes IV (Sur Sur), Pajonales, Agua Amarga and Salar Grande (Figure 5, Table 4).
These results highlight that in addition top well studied hotspot areas such as Salar de Atacama, there are other salt flats that may be important because they are dominated by rare species regardless of whether they are coldspots or hotspots.

3.3. Conservation Priorities Assessment

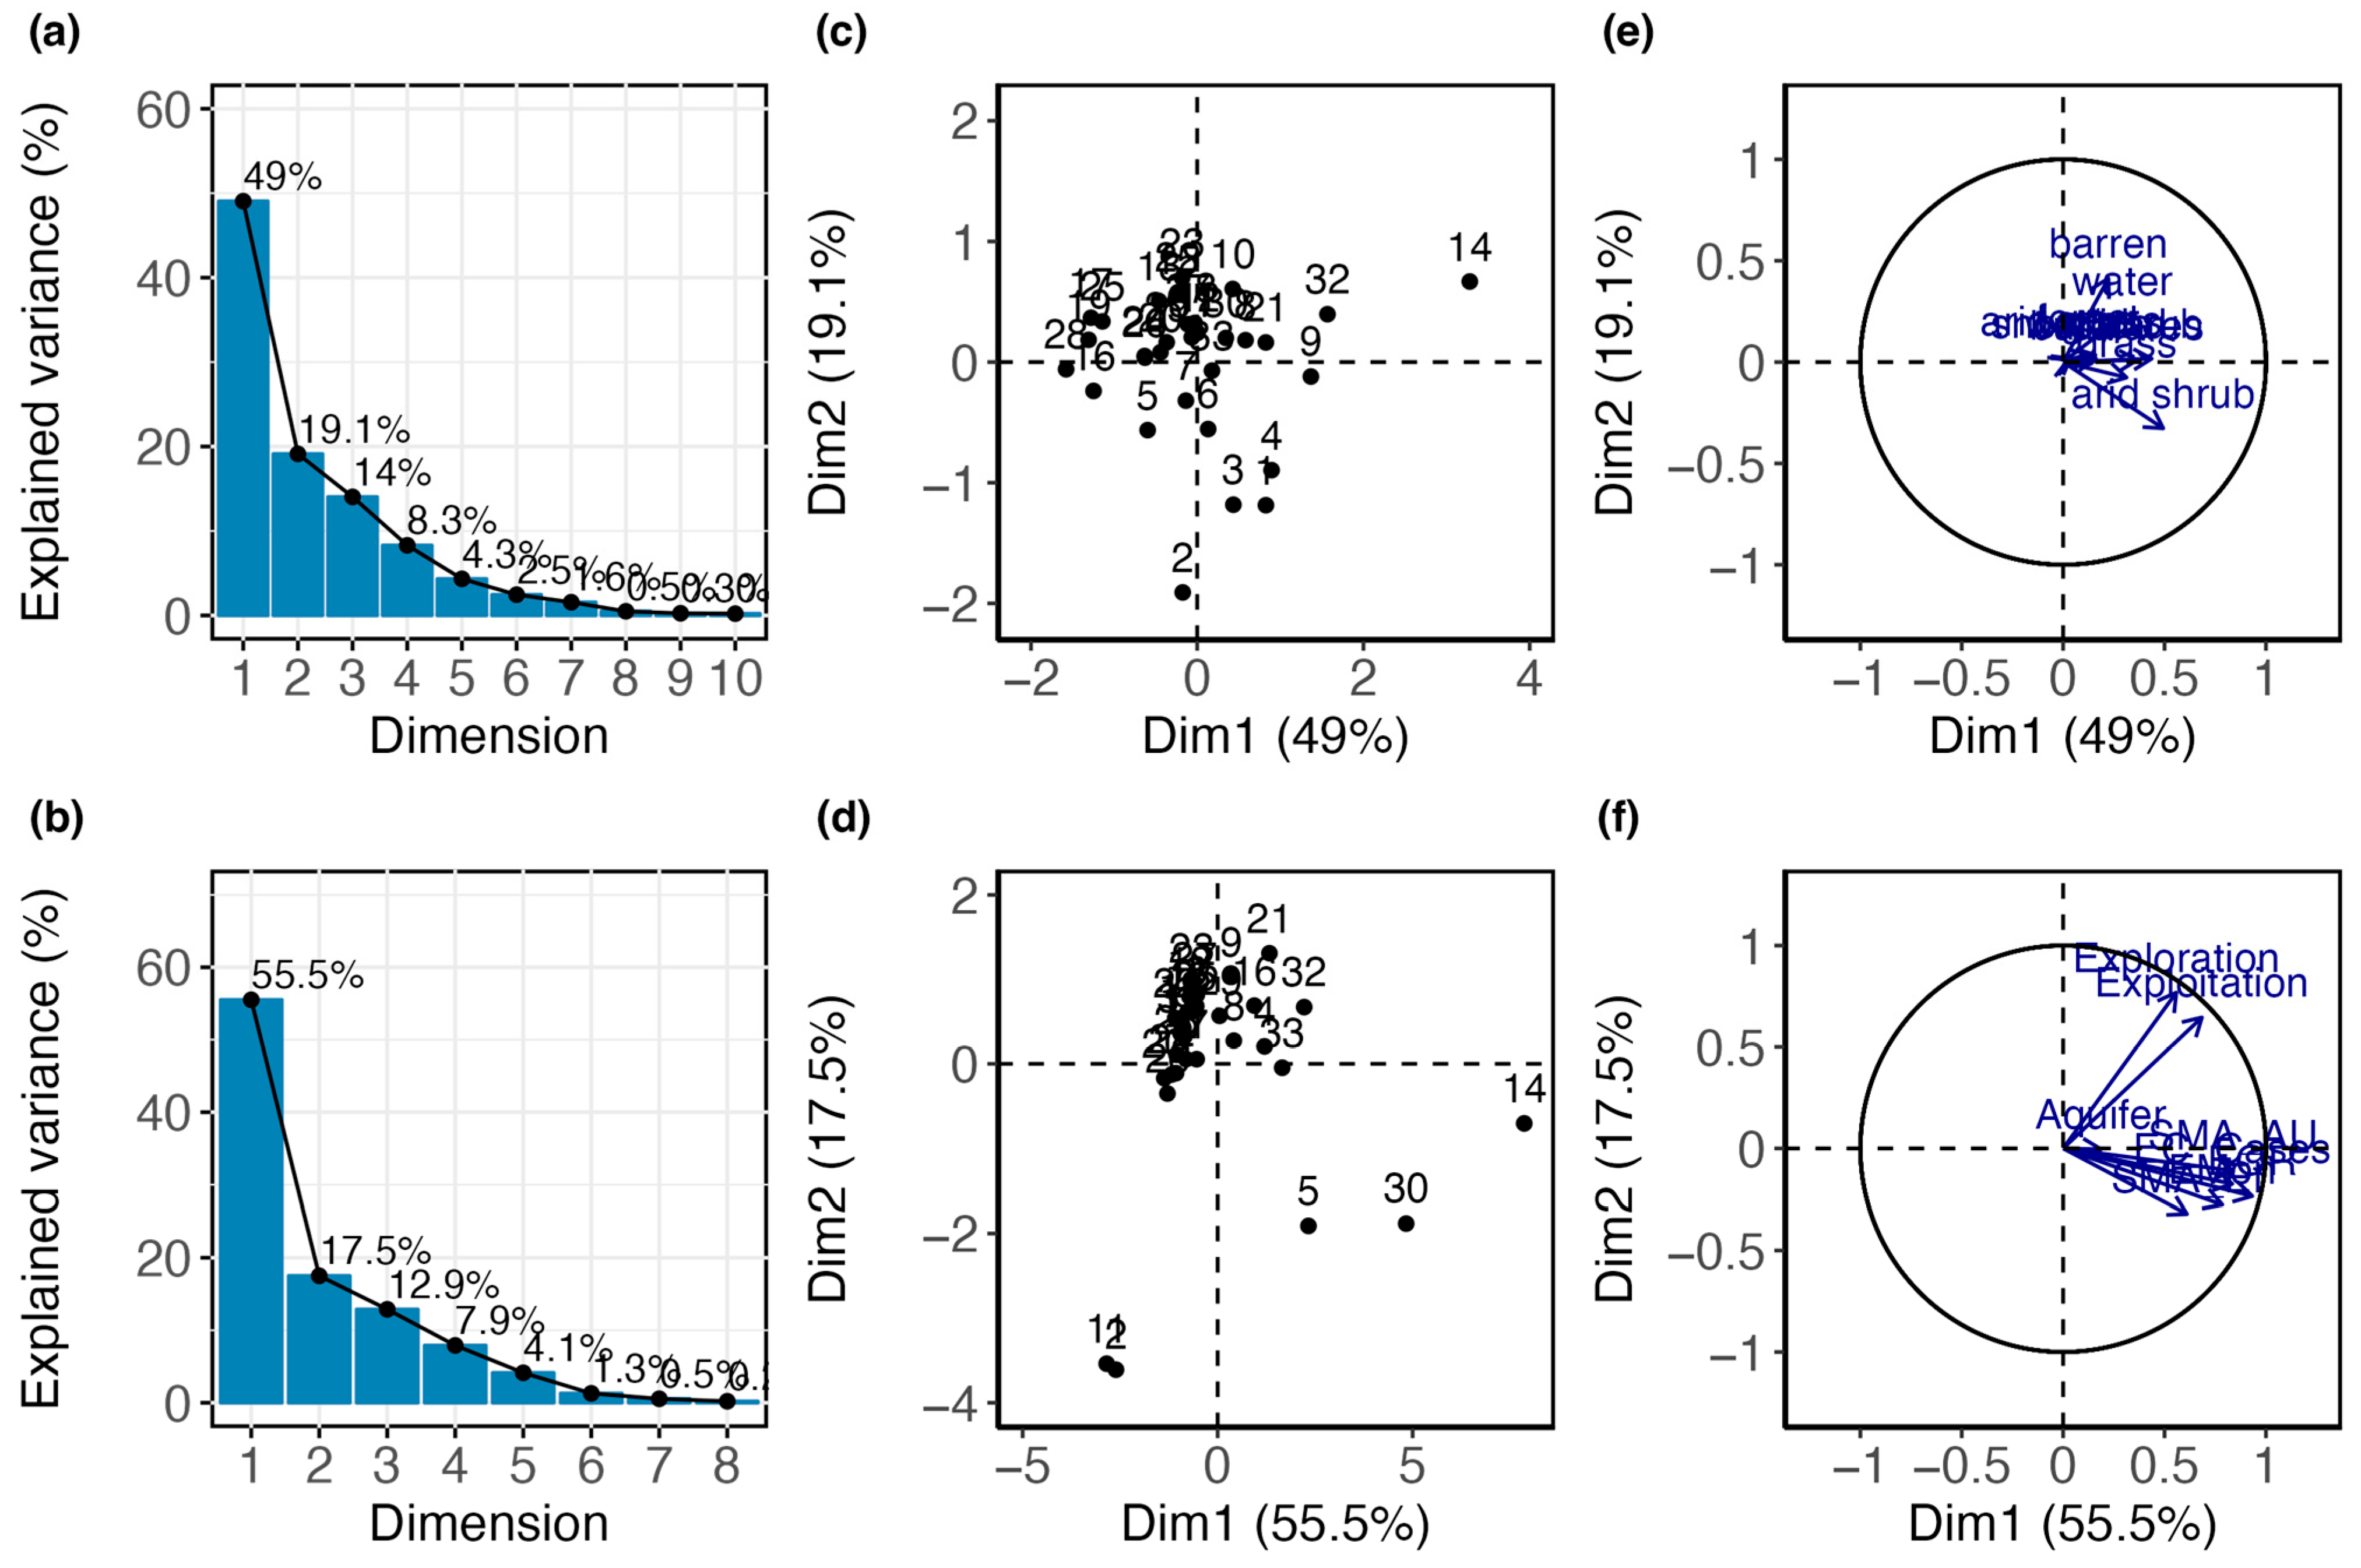
The multivariate assessment of conservation priorities in high Andean salares indicates clear patterns in habitat availability and human pressure among different salares. Principal Component Analysis (PCA) of habitat availability (Figure 6, top row) reveals that the first two components account for 68% of the variance.
The first dimension, accounts for 49% of observed variability, and distinguishes sites mainly along gradients of vegetation cover (e.g., barren, shrubland, grass) and water availability, as evidenced by the clustering of variable vectors. The PCA for human pressure (bottom row) explains 73% of the variance, with the first principal component accounting for 55.5% of observed variability. This dimension differentiates sites characterised by high levels of aquifer exploitation, exploration activities, and productive uses. Both analyses reveal that the first dimensions allow us to distinguish the differences in both habitat availability and human pressures across the different salt flats.
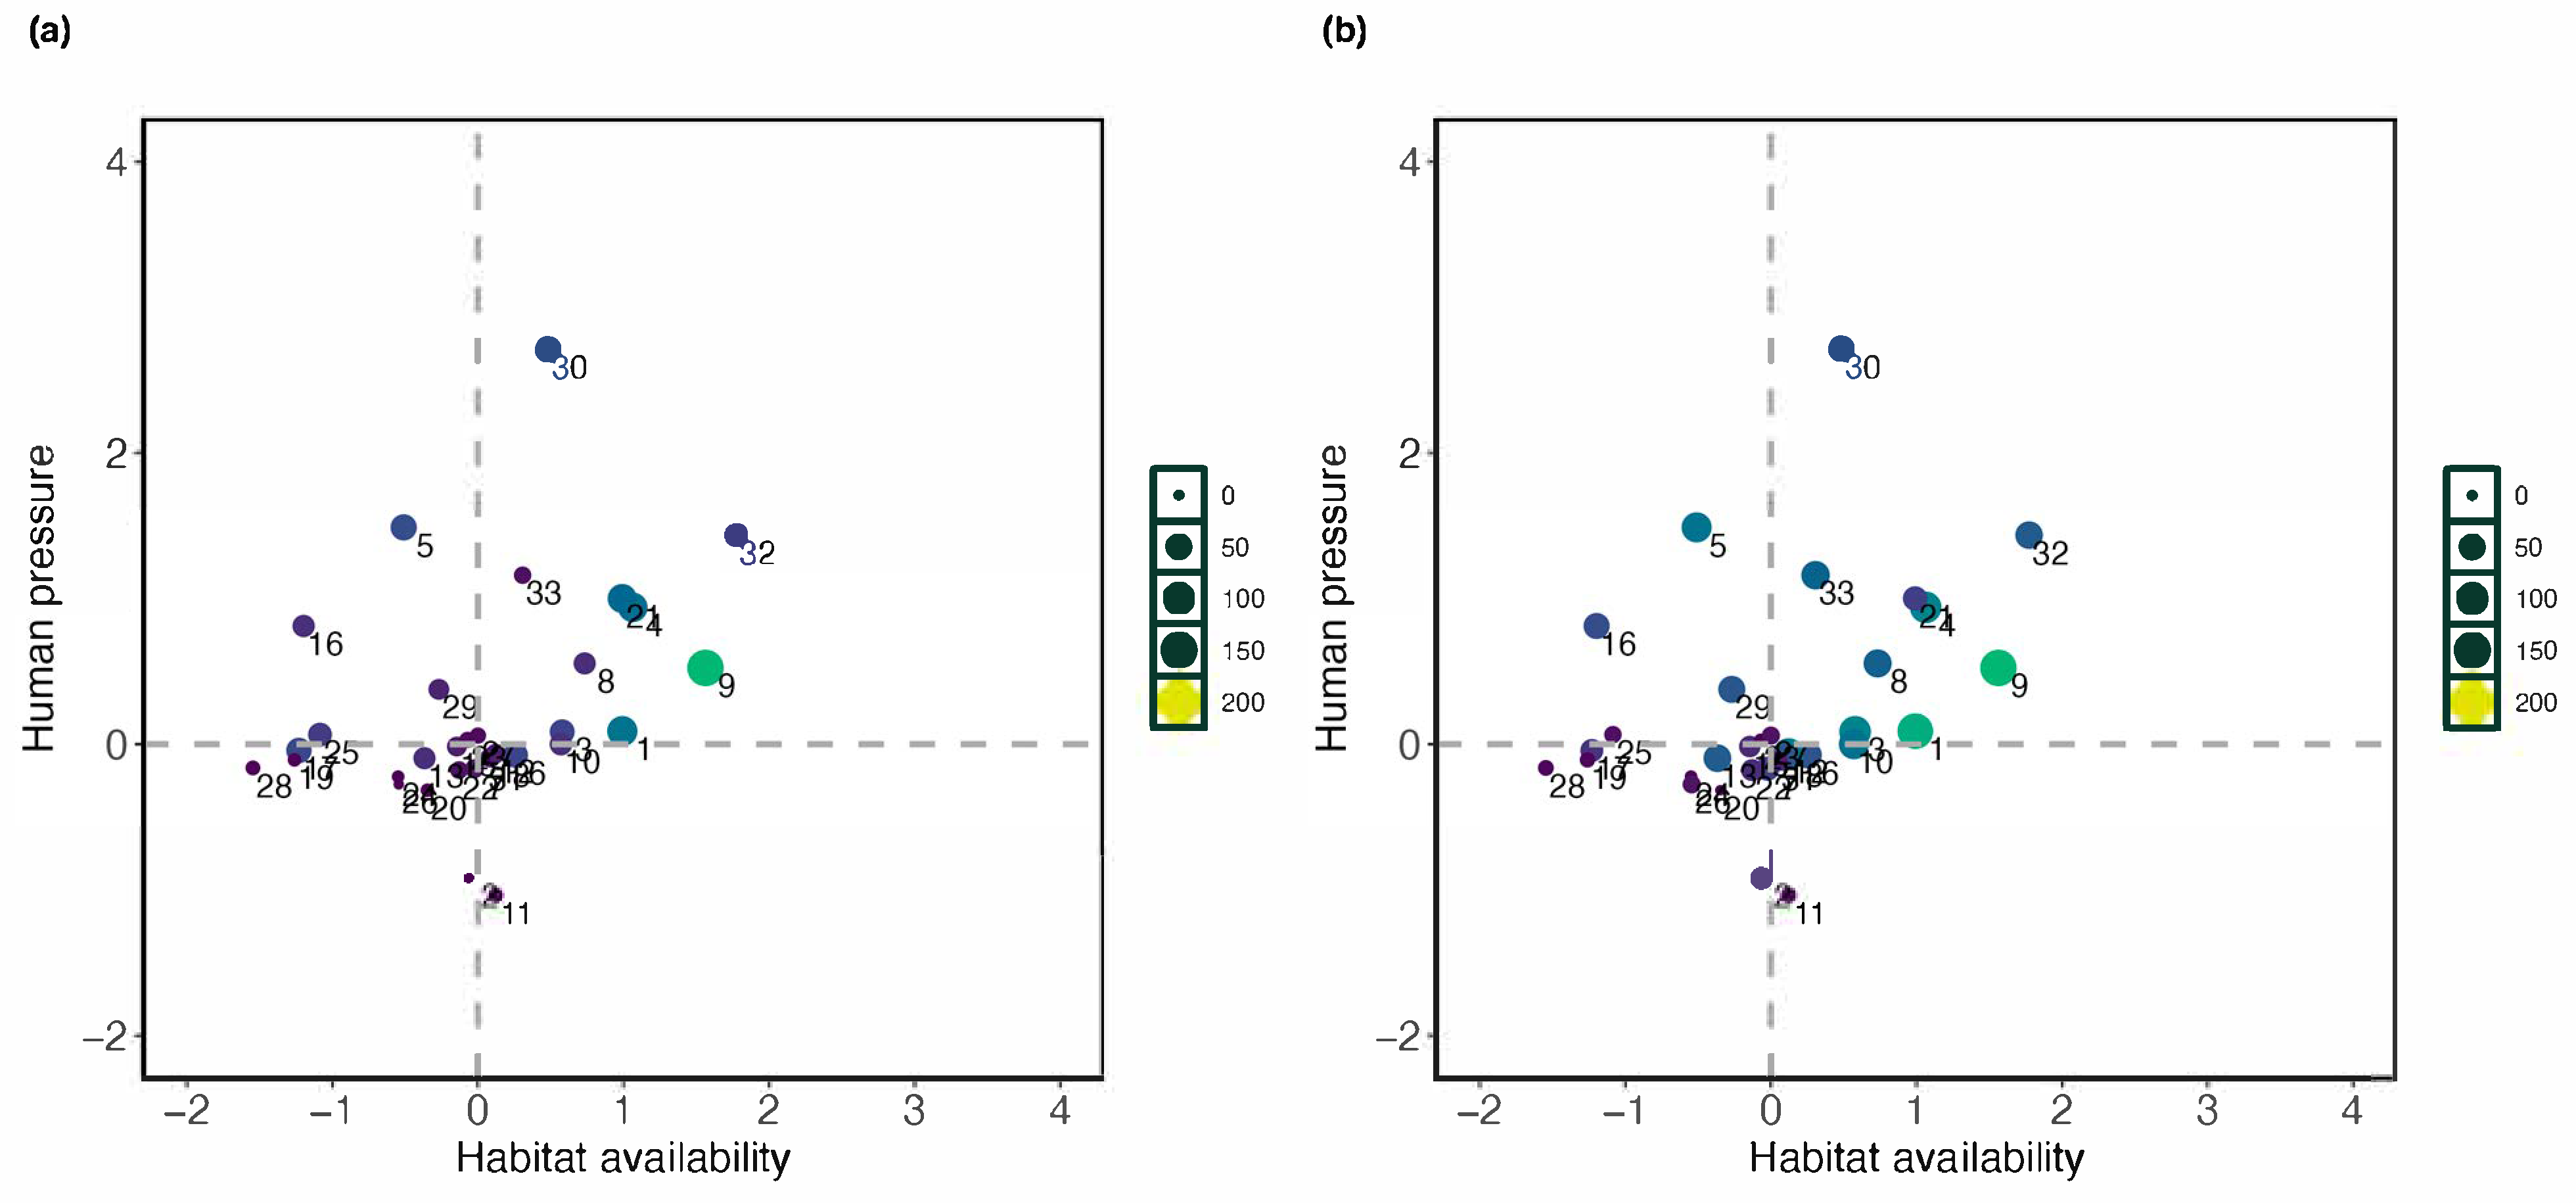
The application of the Conservation Priorities Method to 33 high Andean salares is illustrated in Figure 7, showing that the Conservation Priorities Method successfully links human pressure and biodiversity value in relation to habitat availability, allowing the identification of different conservation priorities.
In this scheme, the four emerging quadrats reflect a variety of conservation scenarios. Locations in the upper right quadrant demonstrate significant habitat availability alongside elevated human pressure, indicating potential focal points for land protection efforts (e.g., Salar de Atacama). Conversely, locations in the higher left quadrant demonstrate low habitat availability and elevated human pressure and thus may be best addressed through focused restoration or mitigation strategies. The bottom right quadrant illustrates sites with relatively high habitat availability and low human pressure and may be suitable for development of different management policies or public awareness to avoid increased human pressures. The lower left quadrant corresponds to sites that may be eventually developed for production, given the decreased habitat availability.
Interestingly, for both plants and animals—a set of 10 salt flats are identified in the upper right quadrant of the conservation space, corresponding to areas that could be singled out for protection. These include several of the salt flats identified by the range–diversity plot, but also some salt flats which are not identified by this previous method: Salar de Surire, Huasco, Coposa, Ascotan, Turi, Salar de Atacama, Punta Negra, Pedernales, Maricunga and Laguna del Negro Francisco are identified for plants, while for animals the method identifies Salar del Huasco, Coposa, Ascotan, Turi, Salar de Atacama, Punta Negra, Pedernales, Piedra Parada, Maricunga and Laguna del Negro Francisco. Regarding the salt flats prioritized for restoration, the method singles out 9 salt flats for plants (Salar de Michincha, Salar de Tara, Salar de Aguas Calientes II (Centro), Salar de los Morros, Salar El Laco, Salar de Pajonales, Salar Agua Amarga, Salar de La Isla and Salar Grande) and 6 salt flats for animals (Salar de Michincha, Salar de Aguas Calientes II (Centro), Salar de los Morros, Salar Agua Amarga, Salar de La Isla and Salar Grande).
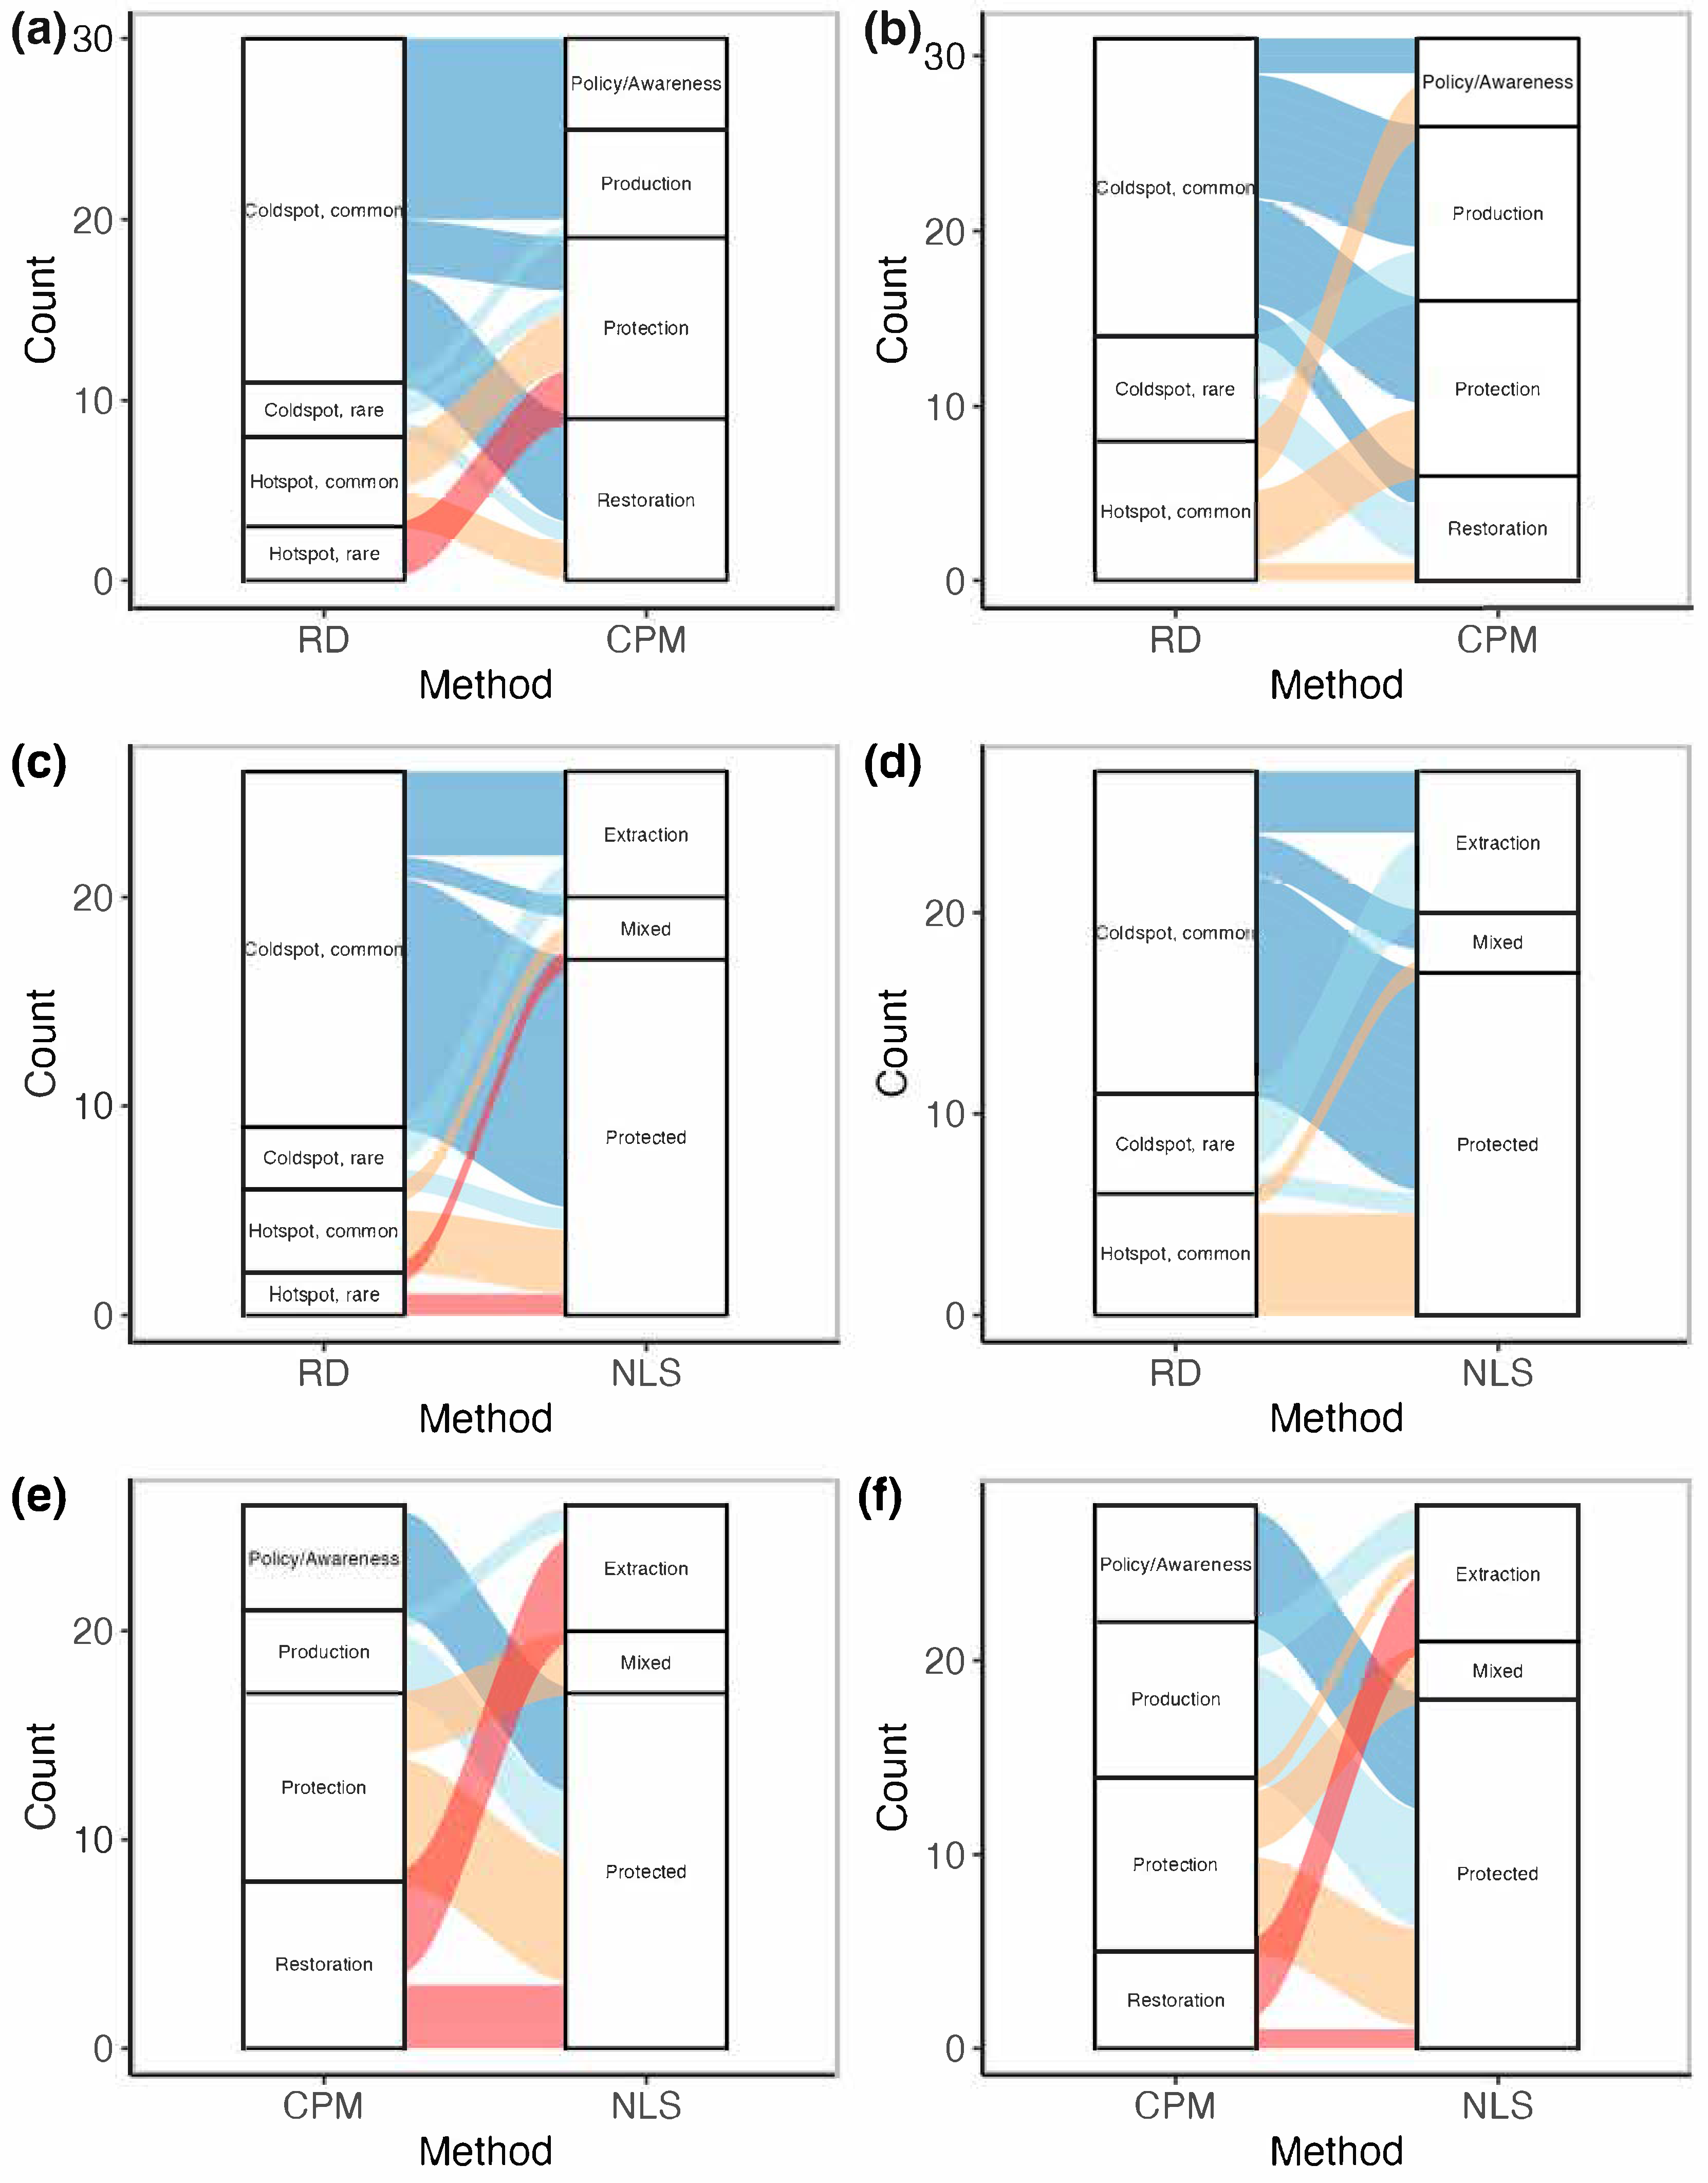
Regarding the degree of agreement between the different conservation priorisation schemes, Figure 8 shows the alluvial plots depicting the associations between conservation prioritization methods and lithium governance frameworks for plants (a, c, e) and animals (b, d, f) across the high Andean salares.
The left column presents the relationship between Range–Diversity (RD) categories and the Conservation Priorities Method (CPM). The central column compares RD classifications with the designations of the National Lithium Strategy (NLS). The right column shows the association between CPM and NLS categories. When we carried out pairwise comparisons among conservation frameworks, results revealed varying levels of alignment across taxa. For both plants and animals, RD showed a statistically significant and very large association with CPM (Plantae: χ2 = 16.22, p = 0.013, V = 0.46; Animalia: χ2 = 17.54, p = 0.007, V = 0.47), reflecting strong internal coherence among ecological assessments. This alignment is visually apparent in Figure 8a,b, with dominant RD categories showing consistent association with corresponding CPM categories. In contrast, for plants, neither RD nor CPM classifications were significantly associated with salt flat categories under the NLS (both comparisons: χ2 = 8.54, p = 0.201, V = 0.22), as shown in Figure 8c,e, where flows appear more dispersed and less structured. This suggests a disconnect between ecological value and national policy designation in the case of plant-based conservation. For animals, however, both ecological methods (RD and CPM) showed significant and large-to-very-large associations with NLS categories (RD vs. NLS: χ2 = 10.21, p = 0.037, V = 0.35; CPM vs. NLS: χ2 = 17.54, p = 0.007, V = 0.47), illustrated in Figure 8d,f by more concentrated and directed flows. This suggests greater alignment between biodiversity-based prioritization and state policy when considering animal conservation.
These findings underscore the need for taxon-inclusive planning frameworks that reconcile ecological assessments with policy instruments such as the NLS. The lack of integration for plant conservation priorities signals a critical governance gap, where key dimensions of biodiversity risk being overlooked in favour of development agendas. In contrast, the stronger correspondence for animals may reflect greater public visibility or legal protection but also risks biasing policy implementation. As the high Andean salares face increasing pressure from lithium extraction, governance strategies must evolve to incorporate multiple dimensions of biodiversity and ensure that conservation priorities—particularly those grounded in robust ecological data—are effectively translated into policy action. Integrating RD and CPM assessments into formal land-use planning, and expanding their influence within instruments like the NLS, could support more equitable and ecologically sound conservation outcomes in these vulnerable ecosystems.

4. Discussion

4.1. Drivers of Species Richness and Distribution

Our findings confirm that species richness in high Andean salares is strongly structured by geographic and environmental gradients. Specifically, latitude and sub-subbasin area emerged as key predictors of biodiversity, aligning with ecological theory that links species accumulation to spatial extent, climatic heterogeneity, and environmental productivity [99,101]. Beyond these effects, we found that the Salar de Atacama, the largest and hydrologically most complex salt flat system in our study area, showed disproportionately high species richness for both plants and animals (See Supplementary Figure S3). This highlights the role of habitat heterogeneity and spatial scale in sustaining biodiversity. These finding show that hydrologically diverse systems may function as regional biodiversity reservoirs, with potential implications for conservation prioritization. As a result, their use for industrial resource extraction entails important trade-offs between economic and conservation goals. However, the potential biases that may exist in existing information because of differences in sampling effort across different High Andean salt flat systems highlights the need for increased efforts to document biodiversity across different taxa and different sites. In addition to better and more biodiversity data, systematic monitoring of environmental conditions are important to gain further insights on the climatic drivers for biodiversity.
In comparative terms, our results are broadly consistent with patterns reported for other high-altitude arid ecosystems such as Bolivian salt flats. For example, in a study of islands within the Uyuni and Coipasa salt lakes, Coca-Salazar et al. [107] recorded 71 plant species distributed across 26 families and 58 genera. This level of richness falls within the 95% confidence interval observed in our dataset (2–158 species at the 2.5 and 97.5 percentiles), although it exceeds our overall mean (34 species) and median (22 species). Even when excluding the exceptionally rich Atacama, nearby Chilean salares such as Surire (80 species) and Huasco (43 species) exhibit richness levels comparable to those reported in [107]. These contrasts highlight that Chilean salares encompass a broader spectrum of environmental conditions and associated plant richness values, which range from extremely species-poor and very arid systems to highly diverse sub-subbasins. While Bolivian island communities appear relatively homogeneous and moderately rich, Chilean salt flats reveal a coexistence of richness-dominated hotspots (e.g., Atacama, Surire) and rarity-dominated coldspots (e.g., Morros, Infieles, Negro Francisco). This underscores the diversity of Chilean high Andean salares and reinforces the need to integrate both richness and rarity when assessing conservation priorities.
Previous studies assessing conservation priorities based on the Range–Diversity (RD) approach have focused on various groups such as bats, anurans and estuarine fish, usually at broad geographic scales in Mexico, South America, or the Neotropics [53,54,55,70,71]. Ffor South American bats and anurans, these studies have shown that the High Andean altiplano habitats harbors species with restricted geographic ranges [54,70,71]. Most of these studied have relied on compilations of geographic range polygons aggregated into large grid cells of about one degree [54,55,68,69,71,73]. In contrast, our analysis is based on observed presences within hydrological units that differ in surface area according to local topography and orography. Although presence records may not fully capture patterns of habitat use, we curated an extensive dataset and followed recent efforts to leverage citizen science and environmental records for robust conservation analyses [92,93,108]. The positive correlation observed between species richness and average geographic range size suggests that these ecosystems are dominated by widespread taxa—a pattern often found in environmentally extreme or geographically connected systems [72]. However, the identification of both richness-dominated (hotspots) and rarity-dominated (coldspots) salares—such as Surire, Pedernales, and Turi—reveals distinct biodiversity value types that must be considered simultaneously. This reinforces the conceptual framework underpinning the Range–Diversity (RD) approach, which advocates for integrating richness and range-based metrics to capture multidimensional patterns of biodiversity [68,75].

4.2. Conservation Prioritization Frameworks

The dual application of RD plots and the Conservation Priorities Method (CPM) allowed for a comprehensive and spatially explicit assessment of conservation priorities. While RD plots revealed the distribution of biodiversity hotspots and coldspots based on richness and rarity, CPM integrated this ecological information with habitat availability and human pressure indicators, operationalizing conservation scenarios into four categories: protection, restoration, production, and policy awareness [51]. Notably, the strong concordance between the two frameworks—especially in identifying salares such as Atacama, Surire, Turi, and Punta Negra as high-priority areas—demonstrates the analytical robustness and ecological validity of integrating both approaches. Moreover, CPM’s ability to detect salares with elevated ecological value under significant human pressure (particularly for plants) highlights its capacity to address conservation blind spots not captured by biodiversity metrics alone. These results support the growing consensus that multidimensional conservation tools are essential in socio-ecological systems exposed to extractive development [53,70].

4.3. Misalignment Between Ecological Conservation Priorities and Current Governance and Policy Instruments

Despite the diagnostic strength of RD and CPM, our comparative analysis reveals a partial misalignment between ecological conservation priorities and the policy categories defined under Chile’s National Lithium Strategy (NLS). For terrestrial vertebrates, a statistically significant association between ecological prioritizations and NLS categories suggests some responsiveness of current governance frameworks to faunal biodiversity data. In contrast, the lack of significant association for plant-based priorities indicates a concerning governance gap. This discrepancy may stem from the institutional invisibility of plant taxa or limited incorporation of floristic data in policy decision-making processes. Yet, given the foundational role of plant communities in ecosystem functioning, their systematic underrepresentation threatens the long-term resilience of these socio-ecosystems [38,65]. These results underscore the need for policy instruments to explicitly include multidimensional biodiversity criteria and taxa-specific assessments to avoid biased or incomplete conservation outcomes.

4.4. Policy and Governance Implications

The findings of this study have direct implications for environmental governance in the context of lithium expansion across the high Andean salares. First, they validate the importance of integrating ecological prioritization frameworks such as RD and CPM into territorial planning tools, ensuring that conservation decisions are grounded in data-rich, taxon-inclusive, and spatially explicit diagnostics [68,75]. Second, our methodological approach demonstrates how formal environmental instruments, such as Environmental Qualification Resolutions (SEA) [94], aquifer protection declarations (DGA) [84,85,86], and environmental inspections by the Superintendence of the Environment (SMA) [109] may be used not only for compliance monitoring but also as proxies for institutionalized anthropogenic pressure. The inclusion of mining concessions as a spatial information layer adds a further dimension to anticipate cumulative impacts on biodiversity. All these highlight the importance of using a holistic approach to understand and manage these complex socio ecosystems [5,6,109,110,111,112]. Third, the tiered conservation strategy proposed by CPM offers a flexible yet structured governance model that aligns conservation objectives with varying ecological conditions and degrees of human intervention. High priority salares identified by both frameworks (such as Atacama and Surire) should be prioritized for legal protection and mitigation actions, while salares with low current pressure but high ecological value may benefit from anticipatory governance through research, education and public engagement. Lastly, effective implementation requires coordinated action across institutional sectors. Bridging environmental, mining, and water governance under a shared conservation framework is essential to reconcile resource extraction with ecosystem protection. Embedding scientific diagnostics into national instruments like the NLS would promote governance systems that are both adaptive and ecologically accountable in one of the world’s most vulnerable arid mountain regions.
Although a comprehensive field validation across all 33 salt flats was beyond the scope of this study, several lines of evidence support the robustness of our results. First, the observed relationships between species richness, sub-subbasin area, and latitude are consistent with long-standing ecological and biogeographic expectations. Second, sites prioritized by our analyses, such as Salar de Atacama, Surire, and Huasco, overlap with Ramsar designations and areas already recognized for their biodiversity importance, providing indirect validation. Third, both the Range–Diversity (RD) and Conservation Priorities Method (CPM) frameworks have been applied and validated in other ecological contexts [47,49,50,51,64,71], reinforcing confidence in their transferability. Nonetheless, we acknowledge that systematic field surveys and expert assessments remain essential to further ground-truth these findings and recommend their incorporation as a future step to refine conservation prioritizations in high Andean salares. Strengthening biodiversity baselines through a holistic mixture of lines of evidence, such as eDNA sampling, bioacoustic recorders, and camera traps, could further enhance the identification of priority sites and inform adaptive management [113,114,115].
A central finding of this study is the marked spatial overlap between biodiversity hotspots and areas of active or projected lithium exploitation, including the Atacama, Surire, Turi, and Pedernales salt flats. This highlights the need for governance instruments that explicitly manage the trade-offs between conservation and extraction. Possible approaches include compensation mechanisms, such as biodiversity offsets or directed funding for ecological monitoring and restoration, financed by lithium projects undertaken in ecologically sensitive basins. A second option could be the implementation of zoning schemes that designate exclusion areas, ecological corridors, and ecological flow requirements require robust baseline studies and targeted design. Our focus on multiple taxa provides valuable information to guide these future efforts. It is important to note that these measures should be reinforced through adaptive, threshold-based monitoring and regulation, allowing timely detection of critical ecological limits and adjustment of water or brine extraction in real time. Although some of these instruments have been implemented in the context of existing Environmental Impact Assessment resolutions (RCA), broader incorporation into overarching governance frameworks remains limited. Evidence from other transition-mineral conflicts shows that failing to acknowledge biodiversity-resource extraction trade-offs can erode legitimacy, particularly if governments adopt a stance of “neutralization” by not taking clear positions [116].
In Chile, moving beyond neutrality may be achieved by embedding these adaptive mechanisms into the National Lithium Strategy and aligning them with the Protected Salt Flats Network. However, our comparative analysis indicates that the current designation of the Protected Salt Flats Network is only partially aligned with biodiversity patterns, failing to include several sites dominated by endemic or range-restricted species. This reflects a limitation in the designation criteria, which may emphasize hydrological and productive attributes over multidimensional biodiversity indicators. Revising the criteria to explicitly incorporate endemicity, ecological rarity, and connectivity would reduce this governance gap and ensure that conservation instruments are responsive to the unique biodiversity profiles of high Andean salares.
Equally important to the improvement of basal biodiversity data and the design of mitigation strategies, is the incorporation of participation and transparency mechanisms, such as those outlined in the Escazú Agreement, which guarantee access to environmental information and strengthen public involvement in decision-making [47]. By combining compensation, zoning, adaptive thresholds, and participatory governance aligned with international frameworks, Chile can better reconcile the competing discourses of economic development and biodiversity protection, ensuring that the conservation priorities identified here translate into actionable guidelines and instruments.

5. Conclusions

The high Andean salares of northern Chile harbour distinct and spatially variable patterns of biodiversity shaped by environmental gradients and land-use pressures. Our integrated assessment highlights both congruencies and disconnects between ecological prioritization frameworks and national policy instruments. While tools such as the Conservation Priorities Method and Range–Diversity analysis offer robust pathways for identifying conservation needs, their partial misalignment with current governance strategies—particularly for plant taxa—underscores the need for more inclusive and adaptive policy mechanisms. As lithium extraction intensifies across these fragile ecosystems, conservation planning must be strengthened by science-based frameworks that account for both ecological and socio-political complexity. Embedding these tools into national land-use strategies will be essential to safeguard biodiversity and maintain ecosystem integrity in one of the world’s most threatened arid mountain regions.

Supplementary Materials

The following supporting information can be downloaded at https://www.mdpi.com/article/10.3390/su17188139/s1, Supplementary Figure S1: Validation of WorldClim estimates for (a) mean annual precipitation and (b) mean annual temperature across a sample of weather stations located in our study region; Supplementary Figure S2: Bivariate relationship between plant and animal richness across high Andean Salares in Chile; Supplementary Figure S3: Bivariate relationship between plant and animal richness and (a) Latitude and (b) Salt flat sub-sub basin Area across high Andean Salares in Chile; Supplementary Figure S4: Bivariate relationship between plant and animal normalised average range size and (a) Latitude and (b) Salt flat sub-sub basin Area across high Andean Salares in Chile; Supplementary Figure S5: Conservation Priorities Method ranks for Plants, using either the Number of Environmental Qualification Resolutions (EQR), and the logarithm of SSB area or the first dimensions from the land use and human pressure PCA shown in Figure S1; Supplementary Figure S6: Conservation Priorities Method ranks for Animals, using either the Number of Environmental Qualification Resolutions (EQR), and the logarithm of SSB area or the first dimensions from the land use and human pressure PCA shown in Figure S1; Supplementary Table S1: Surface area (in km2) of land cover types across 33 high Andean salares (salares) in northern Chile; Supplementary Table S2: Species richness per taxonomic group across 33 high Andean salares (salares) in northern Chile; Supplementary Table S3: Presence absence matrices for (a) animals and (b) plants recorded across a set of salt flats; Supplementary Table S4: Environmental, regulatory, and extractive activity indicators across 33 high Andean salares and associated sub-subbasins in northern Chile.

Author Contributions

Conceptualization, M.H.-R. and F.A.L.; Data curation, M.H.-R., C.R., S.P. and F.A.L.; Formal analysis, M.H.-R., R.A.E., C.R. and F.A.L.; Funding acquisition, M.H.-R. and R.A.E.; Investigation, M.H.-R., R.A.E., C.R., S.P. and F.A.L.; Methodology, M.H.-R. and F.A.L.; Project administration, M.H.-R. and F.A.L.; Resources, M.H.-R., R.A.E. and F.A.L.; Software, F.A.L.; Supervision, F.A.L.; Validation, F.A.L.; Visualization, F.A.L.; Writing—original draft, M.H.-R. and F.A.L.; Writing—review and editing, M.H.-R., R.A.E., C.R., S.P. and F.A.L. All authors have read and agreed to the published version of the manuscript.

Funding

This research was supported by the National Fund for Research and Development (ANID FONDECYT), under grant numbers 1221153 and 1221534, to F.A.L. and R.A.E., respectively; R.A.E was supported by grants ANID—Millennium Science Initiative Program—ICN 2019_015 and ANID/BASAL FB210006. M.H.R. was supported by the Internal Research Fund ERP 11500044, PhD Program category, of Universidad Santo Tomás. The APC for this article was supported by the National Fund for Research and Development (ANID FONDECYT), under grant number 1221153 to F.A.L.

Institutional Review Board Statement

The study was conducted in accordance with the Declaration of Helsinki and has been authorized by the Santo Tomas University Ethics Commission, according to CEC UST letter No. 45/2020 dated 29 December 2020; it also has the UST Biosafety Committee Approval Exemption Certificate, code CIB-FORM-01B, dated May 2022, as no laboratory procedures were conducted.

Informed Consent Statement

Informed consent was obtained from all subjects involved in the study.

Data Availability Statement

The original contributions presented in this study are included in the article/Supplementary Materials. Further inquiries can be directed to the corresponding author(s).

Acknowledgments

M.H.R. thanks his supervisor, Fabio A. Labra, for his invaluable teaching and human contributions to the development of the Doctoral thesis “Analysis of governance models and their effects on biodiversity conservation in socioecological systems of the Chilean high Andean salt flat basins”, which led to the publication of this scientific article. We also acknowledge the significant contributions of CSW Environmental Consultants. During the preparation of this manuscript, the authors used the paraphrasing tools Quillbot and PaperPal for language editing and grammatical and syntactical revisions. The authors have reviewed and edited the resulting work and assume full responsibility for the content of this publication.

Conflicts of Interest

The authors declare no conflicts of interest.

Abbreviations

The following abbreviations are used in this manuscript:
BVBiodiversity Value
CPMConservation Priorities Method
DGADirectorate General of Water
DEMDigital Elevation Model
EIAEnvironmental Impact Assessment
EQREnvironmental Qualification Resolution
FAOFood and Agriculture Organization
GBIFGlobal Biodiversity Information Facility
HAHabitat Availability
HPHuman Pressure
IEBInstitute of Ecology and Biodiversity
maslMeters above sea level
NLSNational Lithium Strategy
NVIRONational Biodiversity Geospatial Platform derived from EIAs (defined in the study)
PAMPresence–Absence Matrix
PCAPrincipal Component Analysis
POWOPlants of the World Online
RDRange–Diversity
R2Coefficient of Statistical Determination (R-squared, used in regression)
SEA Environmental Assessment Service
SEIAEnvironmental Impact Assessment System
SMAEnvironmental Superintendency
SSBSub-subbasin

References

  1. IPBES Global Assessment Report on Biodiversity and Ecosystem Services of the Intergovernmental Science-Policy Platform on Biodiversity and Ecosystem Services; Zenodo: Geneva, Switzerland, 2019.
  2. Díaz, S.; Settele, J.; Brondízio, E.S.; Ngo, H.T.; Agard, J.; Arneth, A.; Balvanera, P.; Brauman, K.A.; Butchart, S.H.M.; Chan, K.M.A.; et al. Pervasive Human-Driven Decline of Life on Earth Points to the Need for Transformative Change. Science 2019, 366, eaax3100. [Google Scholar] [CrossRef]
  3. Pörtner, H.-O.; Scholes, R.J.; Arneth, A.; Barnes, D.K.A.; Burrows, M.T.; Diamond, S.E.; Duarte, C.M.; Kiessling, W.; Leadley, P.; Managi, S.; et al. Overcoming the Coupled Climate and Biodiversity Crises and Their Societal Impacts. Science 2023, 380, eabl4881. [Google Scholar] [CrossRef] [PubMed]
  4. Pettorelli, N.; Graham, N.A.J.; Seddon, N.; Maria da Cunha Bustamante, M.; Lowton, M.J.; Sutherland, W.J.; Koldewey, H.J.; Prentice, H.C.; Barlow, J. Time to Integrate Global Climate Change and Biodiversity Science-Policy Agendas. J. Appl. Ecol. 2021, 58, 2384–2393. [Google Scholar] [CrossRef]
  5. Agusdinata, D.B.; Liu, W.; Eakin, H.; Romero, H. Socio-environmental impacts of lithium mineral extraction: Towards a research agenda. Environ. Res. Lett. 2018, 13, 123001. [Google Scholar] [CrossRef]
  6. Liu, W.; Agusdinata, D.B. Interdependencies of lithium mining and communities sustainability in Salar de Atacama, Chile. J. Clean. Prod. 2020, 260, 120838. [Google Scholar] [CrossRef]
  7. Ostapenko, O.; Alina, G.; Serikova, M.; Popp, L.; Kurbatova, T.; Bashu, Z. Towards Overcoming Energy Crisis and Energy Transition Acceleration: Evaluation of Economic and Environmental Perspectives of Renewable Energy Development. In Circular Economy for Renewable Energy; Koval, V., Olczak, P., Eds.; Springer Nature: Cham, Switzerland, 2023; pp. 109–128. ISBN 978-3-031-30800-0. [Google Scholar]
  8. Al-Jawad, J.; Ford, J.; Petavratzi, E.; Hughes, A. Understanding the Spatial Variation in Lithium Concentration of High Andean Salars Using Diagnostic Factors. Sci. Total Environ. 2024, 906, 167647. [Google Scholar] [CrossRef]
  9. Petavratzi, E.; Sanchez-Lopez, D.; Hughes, A.; Stacey, J.; Ford, J.; Butcher, A. The Impacts of Environmental, Social and Governance (ESG) Issues in Achieving Sustainable Lithium Supply in the Lithium Triangle. Miner. Econ. 2022, 35, 673–699. [Google Scholar] [CrossRef]
  10. Gutiérrez, J.S.; Moore, J.N.; Donnelly, J.P.; Dorador, C.; Navedo, J.G.; Senner, N.R. Climate Change and Lithium Mining Influence Flamingo Abundance in the Lithium Triangle. Proc. R. Soc. B 2022, 289, 20212388. [Google Scholar] [CrossRef]
  11. Galaz, V. Global Environmental Governance in Times of Turbulence. One Earth 2022, 5, 582–585. [Google Scholar] [CrossRef]
  12. Warren, J.K. Evaporites through Time: Tectonic, Climatic and Eustatic Controls in Marine and Nonmarine Deposits. Earth-Sci. Rev. 2010, 98, 217–268. [Google Scholar] [CrossRef]
  13. Risacher, F.; Alonso, H.; Salazar, C. The Origin of Brines and Salts in Chilean Salars: A Hydrochemical Review. Earth-Sci. Rev. 2003, 63, 249–293. [Google Scholar] [CrossRef]
  14. Marazuela, M. The Lithium Triangle: A Global Perspective. Miner. Econ. 2019, 32, 1–10. [Google Scholar]
  15. Marazuela, M.A.; Vázquez-Suñé, E.; Ayora, C.; García-Gil, A. Towards More Sustainable Brine Extraction in Salt Flats: Learning from the Salar de Atacama. Sci. Total Environ. 2020, 703, 135605. [Google Scholar] [CrossRef]
  16. Marazuela, M.A.; Vázquez-Suñé, E.; Ayora, C.; García-Gil, A.; Palma, T. Hydrodynamics of salt flat basins: The Salar de Atacama example. Sci. Total Environ. 2019, 651, 668–683. [Google Scholar] [CrossRef]
  17. Flores-Fernández, C.; Alba, R. Water or Mineral Resource? Legal Interpretations and Hydrosocial Configurations of Lithium Mining in Chile. Front. Water 2023, 5, 1075139. [Google Scholar] [CrossRef]
  18. Farías, M.E. Microbial Ecosystems in Central Andes Extreme Environments, Biofilms, Microbial Mats, Microbialites and Endoevaporites; Springer Nature: Berlin/Heidelberg, Germany, 2020. [Google Scholar]
  19. Aguilar, P.; Acosta, E.; Dorador, C.; Sommaruga, R. Large Differences in Bacterial Community Composition among Three Nearby Extreme Waterbodies of the High Andean Plateau. Front. Microbiol. 2016, 7, 976. [Google Scholar] [CrossRef]
  20. Heine-Fuster, I.; López-Allendes, C.; Aránguiz-Acuña, A.; Véliz, D. Differentiation of Diatom Guilds in Extreme Environments in the Andean Altiplano. Front. Environ. Sci. 2021, 9, 701970. [Google Scholar] [CrossRef]
  21. Demergasso, C. Biodiversity in High-Altitude Ecosystems: Importance and Conservation. Biodivers. Conserv. 2008, 17, 1–15. [Google Scholar]
  22. Demergasso, C.; Escudero, L.; Casamayor, E.O.; Chong, G.; Balagué, V.; Pedrós-Alió, C. Novelty and spatio–temporal heterogeneity in the bacterial diversity of hypersaline Lake Tebenquiche (Salar de Atacama). Extremophiles 2008, 12, 491–504. [Google Scholar] [CrossRef]
  23. Dorador, C.; Vila, I.; Witzel, K.-P.; Imhoff, J.F. Bacterial and Archaeal Diversity in High Altitude Wetlands of the Chilean Altiplano. Fundam. Appl. Limnol. Arch. Hydrobiol. 2013, 182, 135–159. [Google Scholar] [CrossRef]
  24. Dorador, C.; Pardo, R.; Vila, I. Variaciones temporales de parmetros fsicos, qumicos y biolgicos de un lago de altura: El caso del lago Chungar. Rev. Chil. Hist. Nat. 2003, 76, 15–22. [Google Scholar] [CrossRef]
  25. Collado, G.A.; Torres-Díaz, C.; Vidal, M.A.; Valladares, M.A. Genetic Diversity, Morphometric Characterization, and Conservation Reassessment of the Critically Endangered Freshwater Snail, Heleobia Atacamensis, in the Atacama Saltpan, Northern Chile. Biology 2023, 12, 791. [Google Scholar] [CrossRef] [PubMed]
  26. Collado, G.A.; Méndez, M.A. Microgeographic Differentiation among Closely Related Species of Biomphalaria (Gastropoda: Planorbidae) from the Andean Altiplano. Zoöl. J. Linn. Soc. 2013, 169, 640–652. [Google Scholar] [CrossRef]
  27. Collado, G.A.; Valladares, M.A.; Méndez, M.A. A new species of Heleobia (Caenogastropoda: Cochliopidae) from the Chilean Altiplano. Zootaxa 2016, 4137, 277–280. [Google Scholar] [CrossRef] [PubMed]
  28. Collado, G.A.; Méndez, M.A. Los taxa nominales de moluscos descritos por Courty del Salar de Ascotn, Altiplano chileno. Rev. Chil. Hist. Nat. 2012, 85, 233–235. [Google Scholar] [CrossRef]
  29. Collado, G.A. A New Freshwater Snail (Caenogastropoda: Cochliopidae) from the Atacama Desert, Northern Chile. Zootaxa 2015, 3925, 445–449. [Google Scholar] [CrossRef]
  30. Campos, J.C.; Rebolledo, N.; Sáez, P.; Fibla, P.; Méndez, M.; Lobos, G. Primeros registros de piscivoría y dermatofagia en Telmatobius philippii (telmatobiidae) desde el salar de ascotán. Norte de Chile. Rev. Latinoam. Herpetol. 2024, 7, 126–131. [Google Scholar] [CrossRef]
  31. Fibla, P.; Sáez, P.A.; Lobos, G.; Rebolledo, N.; Véliz, D.; Pastenes, L.; del Pozo, T.; Méndez, M.A. Delimitation of Endangered Telmatobius Species (Anura: Telmatobiidae) of the Chilean Salt Puna. Animals 2024, 14, 3612. [Google Scholar] [CrossRef]
  32. Lobos, G.; Rebolledo, N.; Sandoval, M.; Canales, C.; Perez-Quezada, J.F. Temporal Gap Between Knowledge and Conservation Needs in High Andean Anurans: The Case of the Ascotn Salt Flat Frog in Chile (Anura: Telmatobiidae: Telmatobius. S. Am. J. Herpetol. 2018, 13, 33–43. [Google Scholar] [CrossRef]
  33. Lobos, G.; Rebolledo, N.; Salinas, H.; Fibla, P.; Saez, P.A.; Mendez, M.A. Ecological Features of Telmatobius chusmisensis (Anura: Telmatobiidae), a Poorly Known Species from Northern Chile. S. Am. J. Herpetol. 2021, 20, 1–7. [Google Scholar] [CrossRef]
  34. Cortés, A.; Miranda, E.; Rosenmann, M.; Rau, J.R. Thermal Biology of the Fossorial Rodent Ctenomys Fulvus from the Atacama Desert, Northern Chile. J. Therm. Biol. 2000, 25, 425–430. [Google Scholar] [CrossRef] [PubMed]
  35. Jaksic, F.M.; Torres-Mura, J.C.; Cornelius, C.; Marquet, P.A. Small mammals of the Atacama Desert (Chile). J. Arid. Environ. 1999, 42, 129–135. [Google Scholar] [CrossRef]
  36. Storz, J.F.; Quiroga-Carmona, M.; Liphardt, S.; Herrera, N.D.; Bautista, N.M.; Opazo, J.C.; Rico-Cernohorska, A.; Salazar-Bravo, J.; Good, J.M.; D’Elía, G. Extreme High-Elevation Mammal Surveys Reveal Unexpectedly High Upper Range Limits of Andean Mice. Am. Nat. 2024, 203, 726–735. [Google Scholar] [CrossRef]
  37. Valladares, P. Mamferos terrestres de la Regin de Atacama, Chile: Comentarios sobre su distribucin y estado de conservacin. Gayana 2012, 76, 22–37. [Google Scholar] [CrossRef]
  38. Carrasco-Puga, G.; Díaz, F.P.; Soto, D.C.; Hernández-Castro, C.; Contreras-López, O.; Maldonado, A.; Latorre, C.; Gutiérrez, R.A. Revealing Hidden Plant Diversity in Arid Environments. Ecography 2021, 44, 98–111. [Google Scholar] [CrossRef]
  39. Revollo-Cadima, S.G.; Salazar-Bravo, J. Identifying Areas of Conservation Importance Based on Spatial Patterns of Evolutionary Diversity for Non-Volant Small Mammals in the Andean Puna. J. Arid. Environ. 2024, 224, 105230. [Google Scholar] [CrossRef]
  40. Broitman, B.; Sproles, E.; Weideman, C.; Salas, S.; Geldes, C.; Zambra, A.; González-Silvestre, L.; Bugueño, L. Building Consensus through Assessment Evidence from San Pedro de Atacama, Chile. In Mainstreaming Natural Capital and Ecosystem Services into Development Policy; Routledge: Oxfordshire, UK, 2019; pp. 121–148. [Google Scholar]
  41. Carrasco-Lagos, P.; Moreno, R.A.; Figueroa, A.; Espoz, C.; Maza, C.L. Sitios Ramsar de Chile; Universidad Santo Tomás: Santiago, Chile, 2015. [Google Scholar]
  42. Cubillos, C.F.; Paredes, A.; Yáñez, C.; Palma, J.; Severino, E.; Vejar, D.; Grágeda, M.; Dorador, C. Insights Into the Microbiology of the Chaotropic Brines of Salar de Atacama, Chile. Front. Microbiol. 2019, 10, 1611. [Google Scholar] [CrossRef]
  43. López-Steinmetz, R.L.; Salvi, S. Brine Grades in Andean Salars: When Basin Size Matters a Review of the Lithium Triangle. Earth-Sci. Rev. 2021, 217, 103615. [Google Scholar] [CrossRef]
  44. Salica, M.J.; Gastón, M.S.; Akmentins, M.S.; Vaira, M. Threatened Aquatic Andean Frogs and Mining Activity in the Lithium Triangle of South America: Can Both Coexist? Aquat. Conserv. Mar. Freshw. Ecosyst. 2024, 34, e4044. [Google Scholar] [CrossRef]
  45. U.S.G.S. Mineral Commodity Summaries 2024; U.S. Geological Survey: Reston, VA, USA, 2024.
  46. Gutiérrez, G.; Ruiz-León, D. Lithium in Chile: Present Status and Future Outlook. Mater. Adv. 2024, 5, 7850–7861. [Google Scholar] [CrossRef]
  47. López-Cubillos, S.; Muñoz-Ávila, L.; Roberson, L.A.; Suárez-Castro, A.F.; Ochoa-Quintero, J.M.; Crouzeilles, R.; Gallo-Cajiao, E.; Rhodes, J.; Dressler, W.; Martinez-Harms, M.J.; et al. The Landmark Escazú Agreement: An Opportunity to Integrate Democracy, Human Rights, and Transboundary Conservation. Conserv. Lett. 2022, 15, e12838. [Google Scholar] [CrossRef]
  48. Xu, H.; Cao, Y.; Yu, D.; Cao, M.; He, Y.; Gill, M.; Pereira, H.M. Ensuring Effective Implementation of the Post-2020 Global Biodiversity Targets. Nat. Ecol. Evol. 2021, 5, 411–418. [Google Scholar] [CrossRef]
  49. Ferrier, S. Mapping Spatial Pattern in Biodiversity for Regional Conservation Planning: Where to from Here? Syst. Biol. 2002, 51, 331–363. [Google Scholar] [CrossRef] [PubMed]
  50. Ferrier, S.; Powell, G.V.N.; Richardson, K.S.; Manion, G.; Overton, J.M.; Allnutt, T.F.; Cameron, S.E.; Mantle, K.; Burgess, N.D.; Faith, D.P.; et al. Mapping More of Terrestrial Biodiversity for Global Conservation Assessment. AIBS Bull. 2004, 54, 1101–1109. [Google Scholar] [CrossRef]
  51. Kacoliris, F.P.; Velasco, M.A.; Berkunsky, I.; Celsi, C.E.; Williams, J.D.; Di-Pietro, D.; Rosset, S. How to Prioritize Allocating Conservation Efforts: An Alternative Method Tested with Imperilled Herpetofauna. Anim. Conserv. 2016, 19, 46–52. [Google Scholar] [CrossRef]
  52. Vera, D.G.; Pietro, D.O.D.; Falasco, C.T.; Tettamanti, G.; Iriarte, L.; Harkes, M.; Kacoliris, F.P.; Berkunsky, I. Identifying Key Conservation Sites for the Reptiles of the Tandilia Mountains in Pampas Highlands. J. Nat. Conserv. 2023, 71, 126321. [Google Scholar] [CrossRef]
  53. Vilar, C.C.; Joyeux, J.-C.; Spach, H.L. Geographic Variation in Species Richness, Rarity, and the Selection of Areas for Conservation: An Integrative Approach with Brazilian Estuarine Fishes. Estuar. Coast. Shelf Sci. 2017, 196, 134–140. [Google Scholar] [CrossRef]
  54. Villalobos, F.; Dobrovolski, R.; Provete, D.B.; Gouveia, S.F. Is Rich and Rare the Common Share? Describing Biodiversity Patterns to Inform Conservation Practices for South American Anurans. PLoS ONE 2013, 8, 56073. [Google Scholar] [CrossRef]
  55. Villalobos, F.; Lira-Noriega, A.; Soberón, J.; Arita, H.T. Range–Diversity Plots for Conservation Assessments: Using Richness and Rarity in Priority Setting. Biol. Conserv. 2013, 158, 313–320. [Google Scholar] [CrossRef]
  56. Chao, A.; Chiu, C.; Hsieh, T.C.; Davis, T.; Nipperess, D.A.; Faith, D.P. Rarefaction and Extrapolation of Phylogenetic Diversity. Methods Ecol. Evol. 2015, 6, 380–388. [Google Scholar] [CrossRef]
  57. Chao, A.; Chiu, C.-H.; Jost, L. Unifying Species Diversity, Phylogenetic Diversity, Functional Diversity and Related Similarity/Differentiation Measures Through Hill Numbers. Annu. Rev. Ecol. Evol. Syst. 2014, 45, 1–28. [Google Scholar] [CrossRef]
  58. Chao, A.; Jost, L. Estimating Diversity and Entropy Profiles via Discovery Rates of New Species. Methods Ecol. Evol. 2015, 6, 873–882. [Google Scholar] [CrossRef]
  59. Roswell, M.; Dushoff, J.; Winfree, R. A Conceptual Guide to Measuring Species Diversity. Oikos 2021, 130, 321–338. [Google Scholar] [CrossRef]
  60. Myers, N. Biodiversity hotspots revisited. BioScience 2003, 53, 916–917. [Google Scholar] [CrossRef]
  61. Myers, N.; Mittermeier, R.A.; Mittermeier, C.G.; da Fonseca, G.A.B.; Kent, J. Biodiversity Hotspots for Conservation Priorities. Nature 2000, 403, 853–858. [Google Scholar] [CrossRef] [PubMed]
  62. Allen, G.R. Conservation Hotspots of Biodiversity and Endemism for Indo-Pacific Coral Reef Fishes. Aquat. Conserv. Mar. Freshw. Ecosyst. 2007, 18, 541–556. [Google Scholar] [CrossRef]
  63. Brooks, T.M.; Mittermeier, R.A.; Da Fonseca, G.A.B.; Gerlach, J.; Hoffmann, M.; Lamoreux, J.F.; Mittermeier, C.G.; Pilgrim, J.D.; Rodrigues, A.S.L. Global Biodiversity Conservation Priorities. Science 2006, 313, 58–61. [Google Scholar] [CrossRef]
  64. Trebilco, R.; Halpern, B.S.; Flemming, J.M.; Field, C.; Blanchard, W.; Worm, B. Mapping Species Richness and Human Impact Drivers to Inform Global Pelagic Conservation Prioritisation. Biol. Conserv. 2011, 144, 1758–1766. [Google Scholar] [CrossRef]
  65. Marchese, C. Biodiversity Hotspots: A Shortcut for a More Complicated Concept. Glob. Ecol. Conserv. 2015, 3, 297–309. [Google Scholar] [CrossRef]
  66. Orme, C.D.L.; Davies, R.G.; Burgess, M.; Eigenbrod, F.; Pickup, N.; Olson, V.A.; Webster, A.J.; Ding, T.-S.; Rasmussen, P.C.; Ridgely, R.S.; et al. Global Hotspots of Species Richness Are Not Congruent with Endemism or Threat. Nature 2005, 436, 1016–1019. [Google Scholar] [CrossRef]
  67. Roberts, C.M.; McClean, C.J.; Veron, J.E.N.; Hawkins, J.P.; Allen, G.R.; McAllister, D.E.; Mittermeier, C.G.; Schueler, F.W.; Spalding, M.; Wells, F.; et al. Marine Biodiversity Hotspots and Conservation Priorities for Tropical Reefs. Science 2002, 295, 1280–1284. [Google Scholar] [CrossRef] [PubMed]
  68. Arita, H.T.; Christen, J.A.; Rodríguez, P.; Soberón, J. Species Diversity and Distribution in Presence-Absence Matrices: Mathematical Relationships and Biological Implications. Am. Nat. 2008, 172, 519–532. [Google Scholar] [CrossRef]
  69. Arita, H.T.; Christen, A.; Rodríguez, P.; Soberón, J. The Presence–Absence Matrix Reloaded: The Use and Interpretation of Range–Diversity Plots. Glob. Ecol. Biogeogr. 2012, 21, 282–292. [Google Scholar] [CrossRef]
  70. Mendoza, A.M.; Arita, H.T. Priority Setting by Sites and by Species Using Rarity, Richness and Phylogenetic Diversity: The Case of Neotropical Glassfrogs (Anura: Centrolenidae). Biodivers. Conserv. 2014, 23, 909–926. [Google Scholar] [CrossRef]
  71. Cú-Vizcarra, J.D.; Villalobos, F.; Sosa, V.J.; Bolívar-Cimé, B. The Agony of Choice: Species Richness and Range Size in the Determination of Hotspots for the Conservation of Phyllostomid Bats. Perspect. Ecol. Conserv. 2022, 20, 360–368. [Google Scholar] [CrossRef]
  72. Borregaard, M.K.; Rahbek, C. Dispersion Fields, Diversity Fields and Null Models: Uniting Range Sizes and Species Richness. Ecography 2010, 33, 402–407. [Google Scholar] [CrossRef]
  73. Borregaard, M.K.; Graves, G.R.; Rahbek, C. Dispersion Fields Reveal the Compositional Structure of South American Vertebrate Assemblages. Nat. Commun. 2020, 11, 491. [Google Scholar] [CrossRef]
  74. Graves, G.R.; Rahbek, C. Source Pool Geometry and the Assembly of Continental Avifaunas. Proc. Natl. Acad. Sci. USA 2005, 102, 7871–7876. [Google Scholar] [CrossRef]
  75. Soberón, J.; Cobos, M.; Nuñez-Penichet, C. Visualizing Species Richness and Site Similarity from Presence-Absence Matrices. Biodivers. Inform. 2021, 16, 20–27. [Google Scholar] [CrossRef]
  76. García-Sanz, I.; Heine-Fuster, I.; Luque, J.A.; Pizarro, H.; Castillo, R.; Pailahual, M.; Prieto, M.; Pérez-Portilla, P.; Aránguiz-Acuña, A. Limnological Response from High-Altitude Wetlands to the Water Supply in the Andean Altiplano. Sci. Rep. 2021, 11, 7681. [Google Scholar] [CrossRef]
  77. Jacobsen, D.; Dangles, O. Ecology of High Altitude Waters; Oxford University Press: Oxford, UK, 2017. [Google Scholar]
  78. Meixner, A.; Alonso, R.N.; Lucassen, F.; Korte, L.; Kasemann, S.A. Lithium and Sr Isotopic Composition of Salar Deposits in the Central Andes across Space and Time: The Salar de Pozuelos, Argentina. Miner. Depos. 2022, 57, 255–278. [Google Scholar] [CrossRef]
  79. Chávez, R.O.; Christie, D.A.; Olea, M.; Anderson, T.G. A Multiscale Productivity Assessment of High Andean Peatlands across the Chilean Altiplano Using 31 Years of Landsat Imagery. Remote Sens. 2019, 11, 2955. [Google Scholar] [CrossRef]
  80. Chávez, R.O.; Meseguer-Ruiz, O.; Olea, M.; Calderón-Seguel, M.; Yager, K.; Meneses, R.I.; Lastra, J.A.; Núñez-Hidalgo, I.; Sarricolea, P.; Serrano-Notivoli, R.; et al. Andean Peatlands at Risk? Spatiotemporal Patterns of Extreme NDVI Anomalies, Water Extraction and Drought Severity in a Large-Scale Mining Area of Atacama, Northern Chile. Int. J. Appl. Earth Obs. Geoinf. 2023, 116, 103138. [Google Scholar] [CrossRef]
  81. NOAA National Centers for Environmental Information. ETOPO 2022 15 Arc-Second Global Relief Model; NOAA National Centers for Environmental Information: Asheville, NC, USA, 2022. [CrossRef]
  82. Fick, S.E.; Hijmans, R.J. WorldClim 2: New 1-Km Spatial Resolution Climate Surfaces for Global Land Areas. Int. J. Climatol. 2017, 37, 4302–4315. [Google Scholar] [CrossRef]
  83. Zhao, Y.; Feng, D.; Yu, L.; Wang, X.; Chen, Y.; Bai, Y.; Hernández, H.J.; Galleguillos, M.; Estades, C.; Biging, G.S.; et al. Detailed Dynamic Land Cover Mapping of Chile: Accuracy Improvement by Integrating Multi-Temporal Data. Remote Sens. Environ. 2016, 183, 170–185. [Google Scholar] [CrossRef]
  84. Tapia, G.; Atán, J.S.A. Análisis Crítico de la Definición de Cuencas del Banco Nacional de Aguas. 2013. Available online: https://bibliotecadigital.ciren.cl/server/api/core/bitstreams/f7867b71-d4ba-43b0-b7af-66ab6a2b1b81/content (accessed on 18 July 2025).
  85. Leiva-Zelada, G.; Zelada-Muñoz, S. Gestión integrada de cuencas hidrográficas en Chile: Brechas y oportunidades en la propuesta constitucional. Sustain. Agri Food Environ. Res.-Discontin. 2024, 12, 1–13. [Google Scholar] [CrossRef]
  86. Budds, J. Gobernanza del agua y desarrollo bajo el mercado: Las relaciones sociales de control del agua en el marco del Código de Aguas de Chile. Investig. Geográficas Una Mirada Desde El Sur 2020, 59, 16–27. [Google Scholar] [CrossRef]
  87. Gregorio, A.D. Land Cover Classification System: Classification Concepts and User Manual; LCCS; Food & Agriculture Organization: Rome, Italy, 2005. [Google Scholar]
  88. R Core Team. R: A Language and Environment for Statistical Computing; R Foundation for Statistical Computing: Vienna, Austria, 2023. [Google Scholar]
  89. Wickham, H.; Chang, W.; Henry, L.; Pedersen, T.L.; Takahashi, K.; Wilke, C.; Woo, K.; Yutani, H.; Dunnington, D.; van den Brand, T.; et al. Ggplot2: Create Elegant Data Visualisations Using the Grammar of Graphics. 2025. Available online: https://cran.r-project.org/web/packages/ggplot2/index.html (accessed on 10 October 2023).
  90. GBIF.Org User Plantae Occurrence Download, Chile. 2023. Available online: https://doi.org/10.15468/dl.gbxkxy (accessed on 10 October 2023).
  91. GBIF.Org User Animalia Occurrence Download, Chile. 2023. Available online: https://doi.org/10.15468/dl.kq25mt (accessed on 10 October 2023).
  92. Kelling, S.; Fink, D.; Sorte, F.A.L.; Johnston, A.; Bruns, N.E.; Hochachka, W.M. Taking a ‘Big Data’ Approach to Data Quality in a Citizen Science Project. Ambio 2015, 44, 601–611. [Google Scholar] [CrossRef]
  93. Sullivan, B.L.; Aycrigg, J.L.; Barry, J.H.; Bonney, R.E.; Bruns, N.; Cooper, C.B.; Damoulas, T.; Dhondt, A.A.; Dietterich, T.; Farnsworth, A.; et al. The eBird Enterprise: An Integrated Approach to Development and Application of Citizen Science. Biol. Conserv. 2014, 169, 31–40. [Google Scholar] [CrossRef]
  94. Rodríguez-Luna, D.; Vela, N.; Alcalá, F.J.; Encina-Montoya, F. The Environmental Impact Assessment in Chile: Overview, Improvements, and Comparisons. Environ. Impact Assess. Rev. 2021, 86, 106502. [Google Scholar] [CrossRef]
  95. Grenié, M.; Berti, E.; Carvajal-Quintero, J.; Dädlow, G.M.L.; Sagouis, A.; Winter, M. Harmonizing Taxon Names in Biodiversity Data: A Review of Tools, Databases and Best Practices. Methods Ecol. Evol. 2023, 14, 12–25. [Google Scholar] [CrossRef]
  96. Govaerts, R. WCVP: World Checklist of Vascular Plants; Royal Botanic Gardens, Kew: Richmond, UK, 2024. [Google Scholar]
  97. Rodriguez, R.; Marticorena, C.; Alarcón, D.; Baeza, C.; Cavieres, L.; Finot, V.L.; Fuentes, N.; Kiessling, A.; Mihoc, M.; Pauchard, A.; et al. Catálogo de las plantas vasculares de Chile. Gayana. Botánica 2018, 75, 1–430. [Google Scholar] [CrossRef]
  98. D’Elía, G.; Canto, J.; Ossa, G.; Verde-Arregoitia, L.D.; Bostelmann, E.; Iriarte, A.; Amador, L.; Quiroga-Carmona, M.; Hurtado, N.; Cadenillas, R.; et al. Lista actualizada de los mamíferos vivientes de Chile. Boletín Mus. Nac. Hist. Nat. 2020, 69, 67–98. [Google Scholar] [CrossRef]
  99. Brown, J.H.; Stevens, G.C.; Kaufman, D.M. The Geographic Range: Size, Shape, Boundaries, and Internal Structure. Annu. Rev. Ecol. Syst. 1996, 27, 597–623. [Google Scholar] [CrossRef]
  100. Diniz-Filho, J.A.F. Structure and Dynamics of Geographic Ranges. In The Macroecological Perspective: Theories, Models and Methods; Springer: Berlin/Heidelberg, Germany, 2023; pp. 125–166. [Google Scholar]
  101. Gaston, K.J. The Structure and Dynamics of Geographic Ranges; Oxford University Press: Oxford, UK, 2003. [Google Scholar]
  102. Gotelli, N.J. Null model analysis of species co-occurrence patterns. Ecology 2000, 81, 2606–2621. [Google Scholar] [CrossRef]
  103. Nuñez-Penichet, C.; Cobos, M.E.; Soberón, J.; Gueta, T.; Barve, N.; Barve, V.; Navarro-Sigüenza, A.G.; Peterson, A.T. Selection of Sampling Sites for Biodiversity Inventory: Effects of Environmental and Geographical Considerations. Methods Ecol. Evol. 2022, 13, 1595–1607. [Google Scholar] [CrossRef]
  104. Poveda Bonilla, R. Ingresos Fiscales por Litio en Chile; Natural Resource Governance Institute (NRGI): Lima, Peru, 2024. [Google Scholar]
  105. Brunson, J.C. Ggalluvial: Layered Grammar for Alluvial Plots. J. Open Source Softw. 2020, 5, 2017. [Google Scholar] [CrossRef] [PubMed]
  106. Brunson, J.C.; Read, Q. ggalluvial ggplot2 Extension. 2023. Available online: https://corybrunson.github.io/ggalluvial/ (accessed on 10 October 2023).
  107. Coca-Salazar, A.; Villca, H.; Torrico, M.; Alfaro, F.D. Plant Communities on the Islands of Two Altiplanic Salt Lakes in the Andean Region of Bolivia. Check List. 2016, 12, 1975. [Google Scholar] [CrossRef]
  108. La Sorte, F.A.; Fink, D.; Hochachka, W.M.; Kelling, S. Convergence of Broad-Scale Migration Strategies in Terrestrial Birds. Proc. R. Soc. B. 2016, 283, 20152588. [Google Scholar] [CrossRef]
  109. Moraga Sariego, P.; Ossandón Rosales, J.; Chahuán, F.; Sameshima, S. Memoria ambiental. La historia de la institucionalidad ambiental, a 50 años del golpe militar. Rev. Derecho Ambient. 2023, 20, 1–29. [Google Scholar] [CrossRef]
  110. Liu, W.; Agusdinata, D.B.; Myint, S.W. Spatiotemporal Patterns of Lithium Mining and Environmental Degradation in the Atacama Salt Flat, Chile. Int. J. Appl. Earth Obs. Geoinf. 2019, 80, 145–156. [Google Scholar] [CrossRef]
  111. Roy, B.A.; Zorrilla, M.; Endara, L.; Thomas, D.C.; Vandegrift, R.; Rubenstein, J.M.; Read, M. New Mining Concessions Could Severely Decrease Biodiversity and Ecosystem Services in Ecuador. Trop. Conserv. Sci. 2018, 11, 1940082918780427. [Google Scholar] [CrossRef]
  112. Seki, H.A.; Thorn, J.P.; Platts, P.J.; Shirima, D.D.; Marchant, R.A.; Abeid, Y.; Marshall, A.R. Indirect Impacts of Commercial Gold Mining on Adjacent Ecosystems. Biol. Conserv. 2022, 275, 109782. [Google Scholar] [CrossRef]
  113. Saenz-Agudelo, P.; Delrieu-Trottin, E.; DiBattista, J.D.; Martínez-Rincon, D.; Morales-González, S.; Pontigo, F.; Ramírez, P.; Silva, A.; Soto, M.; Correa, C. Monitoring Vertebrate Biodiversity of a Protected Coastal Wetland Using eDNA Metabarcoding. Environ. DNA 2022, 4, 77–92. [Google Scholar] [CrossRef]
  114. Wood, C.M.; Champion, J.; Brown, C.; Brommelsiek, W.; Laredo, I.; Rogers, R.; Chaopricha, P. Challenges and Opportunities for Bioacoustics in the Study of Rare Species in Remote Environments. Conserv. Sci. Pract. 2023, 5, e12941. [Google Scholar] [CrossRef]
  115. Mas-Carrió, E.; Schneider, J.; Nasanbat, B.; Ravchig, S.; Buxton, M.; Nyamukondiwa, C.; Stoffel, C.; Augugliaro, C.; Ceacero, F.; Taberlet, P.; et al. Assessing Environmental DNA Metabarcoding and Camera Trap Surveys as Complementary Tools for Biomonitoring of Remote Desert Water Bodies. Environ. DNA 2022, 4, 580–595. [Google Scholar] [CrossRef]
  116. Ritz, S.J.; Delgado, N.A. Discursive Strategies within Sustainability Trade-Offs: A Case on the Controversy over Transition Minerals. J. Clean. Prod. 2024, 469, 143196. [Google Scholar] [CrossRef]
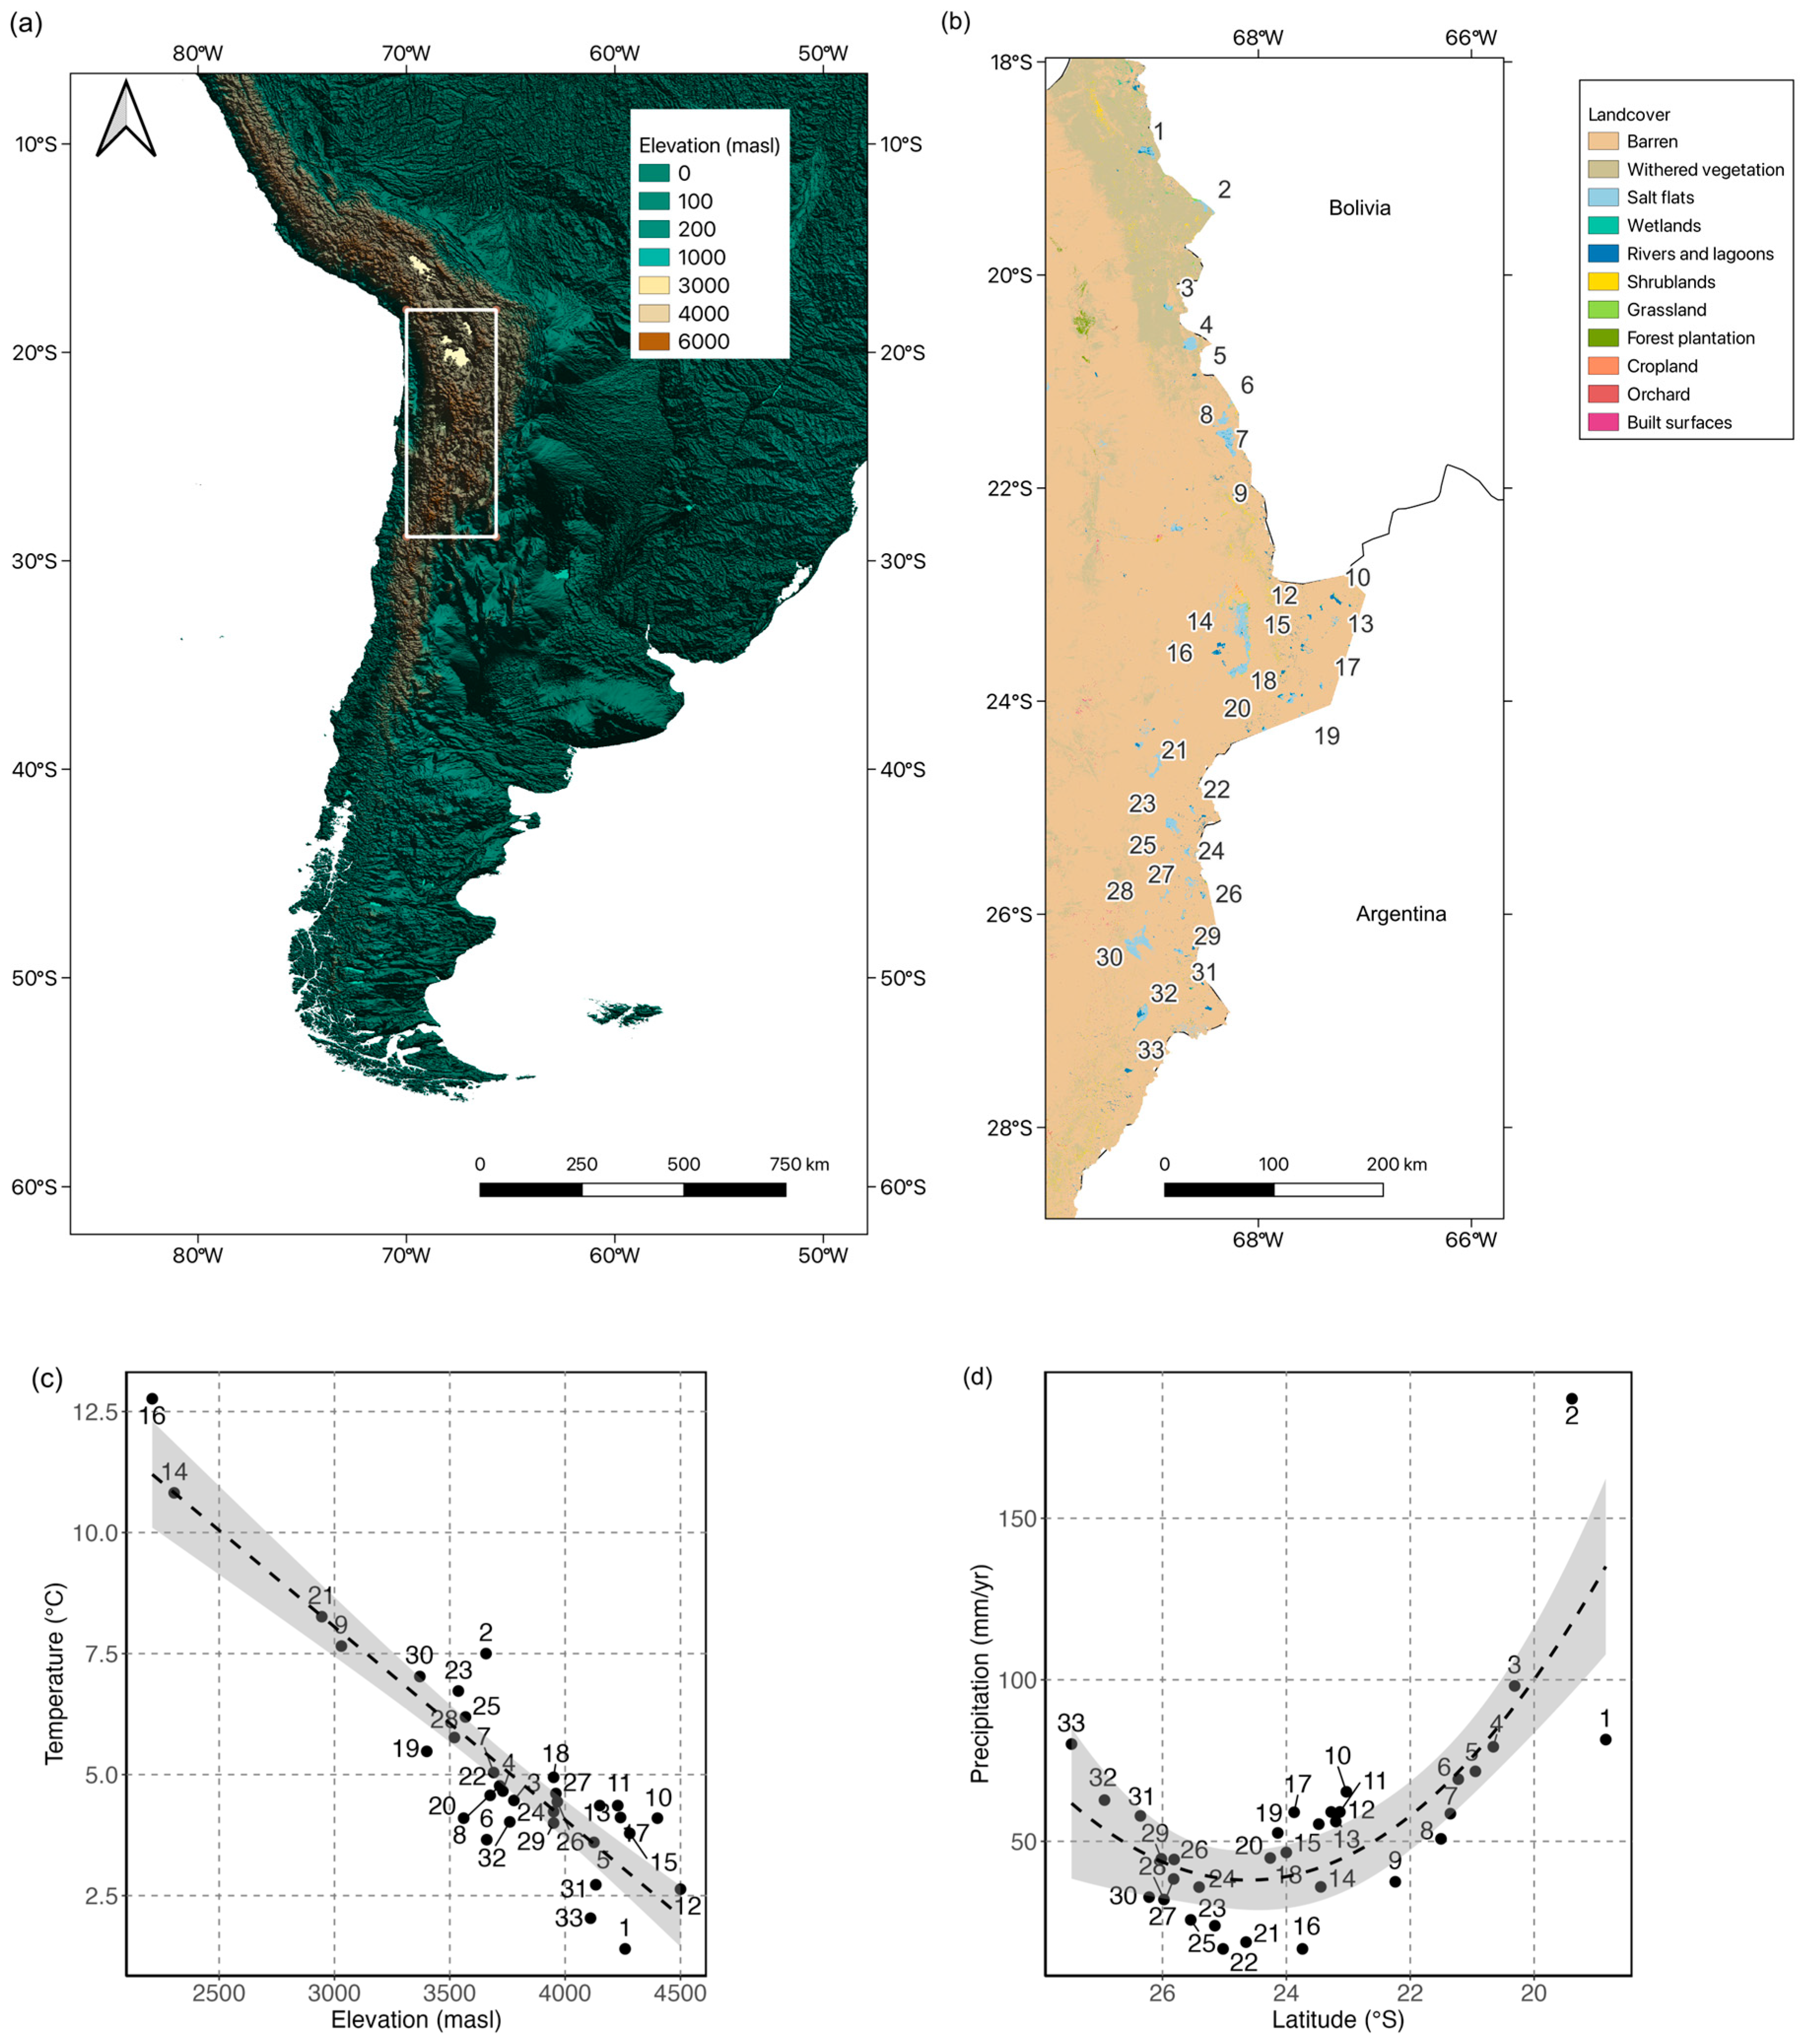
Figure 1. Location, topography and land cover of the study area. The figure shows: (a) Ground elevation [masl] as derived from a 30 arcsecond Digital Elevation Model (DEM) from the ETOPO 2022 Global Relief Model (NOAA 2025) and the location of study area in the High Andes of South America (white rectangle). (b) High-resolution land cover and political administrative regions of northern Chile and the location of studied high Andean salares, as shown by the location of the studied salt flats. (c) Linea relationship between elevation (masl) and average temperature (°C). (d) Non-linear relationship between latitude and annual precipitation across high Andean salares. Salt flats have been sorted by latitude as follows: 1: Salar de Surire; 2: Salar de Pisiga; 3: Salar del Huasco; 4: Salar de Coposa; 5: Salar de Michincha; 6: Salar de Ollague; 7: Salar de San Martín o Carcote; 8: Salar de Ascotan; 9: Salar de Turi; 10: Salar de Tara; 11: Aguas Calientes I (Norte); 12: Salar de Pujsa; 13: Salar de Loyoques o Quisquiro; 14: Salar de Atacama; 15: Salar de Aguas Calientes II (Centro); 16: Salar de los Morros; 17: Salar El Laco; 18: Salar Talar (Aguas Calientes III—Sur); 19: Salar de Incahuasi; 20: Salar de Pular; 21: Salar de Punta Negra; 22: Salar de Aguas Calientes IV (Sur Sur); 23: Salar de Pajonales; 24: Salar de Gorbea; 25: Salar Agua Amarga; 26: Salar de Las Parinas; 27: Salar de La Isla; 28: Salar de los Infieles; 29: Salar Grande; 30: Salar de Pedernales; 31: Salar de Piedra Parada; 32: Salar de Maricunga; and 33: Laguna del Negro Francisco.
Sustainability 17 08139 g001
Figure 2. Analytical workflow of the study. The diagram summarizes four sequential steps: (i) compilation of georeferenced occurrence data from GBIF [90,91], eBird [92,93], NVIRO, and technical literature; (ii) data curation and taxonomic harmonization; (iii) construction of a presence–absence matrix (PAM) for 750 species across 33 salares; (iv) analysis of biodiversity patterns and conservation prioritization using range–diversity plots [53,54,55,68,75] and the Conservation Priorities Method (CPM) [51]. Arrows indicate the sequential flow of information across the different steps of the analytical workflow.
Sustainability 17 08139 g002
Figure 3. Diagrams illustrating conservation priorities method (CPM) and the Range–Diversity plot. The Figure shows (a) The steps to calculate the modified Range–Diversity plot, as described in [75]. Grey block arrows indicate the sequential steps leading to the estimation of normalized richness (x) and normalized dispersion field per species (y), as shown in (b) The Range–Diversity plot. Black arrows indicate the orientation of axes, with the x-axis showing increasing species richness and the y-axis showing the relative dominance of rare versus common species. This allows the ranking of sites based on their normalized species richness and normalized dispersion field per species. This may be complemented by (c) the conservation priorities method (CPM), as described in [51]. This plots for each site the normalized human pressure (HP) as a function of normalised habitat availability (HA), with each site’s normalized biodiversity value (BV) shown as the symbol size.
Sustainability 17 08139 g003
Figure 4. Geographic variation in species richness and dispersion field in high Andean Salares. The left column shows the spatial pattern of observed species richness for (a) all plants and (b) all animals, respectively. The middle column shows the geographic pattern for normalized richness, α* for (c) all plants and (d) all animals, respectively. The right-hand column shows the geographical variation in the species-specific normalized dispersion field ϕ*/S for (e) all plants and (f) all animals, respectively.
Sustainability 17 08139 g004
Figure 5. Range–diversity-based conservation priority assessment for Plants and Animals in high Andean Salares. The left column shows the modified range–diversity plots as described in [75] for (a) plants and (b) animals. The right column shows the geographic pattern for normalized richness, α* for (c) all plants and (d) all animals, respectively. Salares dominated by species with common distribution pattern are shown in dark purple, while those dominated by rare species are shown in sea green. Those Salares with no dominance of significantly common or rare species are shown in yellow. For plant and animals, Salares with α* greater than 0.1 and 0.25 for plants and animals, respectively, should be prioritized for conservation efforts.
Sustainability 17 08139 g005
Figure 6. Multivariate assessment of habitat availability and human pressure indicators. The top row shows the principal component analysis (PCA) for habitat availability, while the bottom row shows the principal component analysis for human pressure. Left column shows the principal component scree plot for (a) Habitat availability and (b) Human pressure, showing that the first two PCA axes account for 68% and 73% of observed variance for Habitat availability and Human pressure, respectively. The middle column shows the PCA plot of individual Salares for (c) habitat availability and (d) human pressure. Right column shows the PCA plot of individual variables for (e) habitat availability and (f) human pressure.
Sustainability 17 08139 g006
Figure 7. Ranking of high Andean Salares according to the conservation priorities method. The figure shows the relationship between human pressure and biodiversity value as a function of habitat availability across all 33 high Andean Salares for (a) all plants and (b) all animals.
Sustainability 17 08139 g007
Figure 8. Alluvial plots showing associations between conservation assessment methods and lithium governance strategies for plant and animal species in high Andean salares. Panels (a,c,e) correspond to Plantae, while panels (b,d,f) correspond to Animalia. The left column displays the relationship between Range–Diversity plots (RD) and Conservation Priorities Method (CPM). The central column shows the relationship between Range–Diversity plots (RD) and the National Lithium Strategy (NLS). The right column illustrates the association between CPM and NLS. Strata represent the frequency of salt flats within different category groupings within each axis, while flows indicate the match between classification methods across the different frameworks. Colors of the flows are used only to distinguish connections between categories and do not represent additional variables.
Sustainability 17 08139 g008
Table 1. Summary of salt flat topographic, climatic and land cover and use variables, information sources, and access links.
VariablesSource [Ref]Layer Resolution/ScaleAccess Link
Elevation (DEM)ETOPO 2022 Global Relief Model) [81]. 30 arc-s raster
(~1 km)
https://www.ncei.noaa.gov/products/etopo-global-relief-model (accessed on 7 August 2025)
Mean annual temperature climatologyWorldClim v2.1 [82]30 arc-s raster
(~1 km)
https://www.worldclim.org/data/worldclim21.html (accessed on 23 February 2025)
Mean annual precipitation climatology
Mean annual temperature weather station dataDirección Meteorológica de Chile (DMC)Point shapefilehttps://climatologia.meteochile.gob.cl (accessed on 23 February 2025)
Mean annual precipitation weather station data
Hydrographic units (SSB boundaries)Dirección General de Aguas (DGA), National Hydrographic DatabasePolygon shapefilehttps://dga.mop.gob.cl/uploads/sites/13/2024/07/Cuencas_BNA.zip (accessed on 23 February 2025)
Saline system areaMinistry of Mining, technical reportsPolygon shapefilehttps://www.minmineria.cl (accessed on 23 February 2025)
Land coverNational Land Cover Dataset [83]30 m Raster
(Landsat-based)
https://www.gep.uchile.cl/Landcover_CHILE.html (accessed on 23 February 2025)
Table 2. Summary of geographical and environmental variables for each salt flat (Salar), including commune and region, sub-subbasin area (km2), saline system surface area (km2), elevation (masl), annual precipitation (mm), and mean annual temperature (°C).
IDSalar Commune (Region)SSB Area (km2)Saline System Surface (km2)Elevation (masl)Prec (mm/yr)Temp (°C)
1Salar de SurirePutre (XV)562.30130.18426081.51.4
2Salar de PisigaColchane (I)179.1198.583657187.07.5
3Salar del HuascoPica (I)600.4552.28377898.14.5
4Salar de CoposaPica (I)1111.0386.85373079.34.7
5Salar de MichinchaPica (I)275.672.91412571.73.6
6Salar de OllagueOllague(II)744.7321.78366069.23.7
7Salar de San Martín o CarcoteOllague(II)524.43110.54369058.65.0
8Salar de AscotanOllague(II)1425.77242.47371650.84.8
9Salar de TuriCalama (II)2287.99 303037.57.7
10Salar de TaraSan Pedro de Atacama (II)1506.8661.54440065.34.1
11Aguas Calientes I (Norte)San Pedro de Atacama (II)908.7615.70422859.14.4
12Salar de PujsaSan Pedro de Atacama (II)275.6716.69450056.12.6
13Salar de Loyoques o QuisquiroSan Pedro de Atacama (II)908.7680.64415059.14.4
14Salar de AtacamaSan Pedro de Atacama (II)12,409.543417.6230535.910.8
15Salar de Aguas Calientes II (Centro)San Pedro de Atacama (II)1252.56129.67428055.33.8
16Salar de los MorrosAntofagasta (II)1158.8759.52221016.712.8
17Salar El LacoSan Pedro de Atacama (II)520.0716.11424059.04.1
18Salar Talar (Aguas Calientes III—Sur)San Pedro de Atacama (II)671.5845.04395046.64.9
19Salar de IncahuasiSan Pedro de Atacama (II)495.4219.69340052.65.5
20Salar de PularSan Pedro de Atacama (II)483.9217.12356044.84.1
21Salar de Punta NegraAntofagasta (II)5230.59242.5294518.88.3
22Salar de Aguas Calientes IV (Sur Sur)Antofagasta (II)1059.8019.22367516.74.6
23Salar de PajonalesAntofagasta (II)1920.92103.1353723.96.7
24Salar de GorbeaDiego de Almagro (III)352.9129.08395035.84.2
25Salar Agua AmargaDiego de Almagro (III)855.0323.21356825.76.2
26Salar de Las ParinasDiego de Almagro (III)385.2741.29396644.44.4
27Salar de La IslaDiego de Almagro (III)871.59158.33396038.44.6
28Salar de los InfielesDiego de Almagro (III)252.226.8352032.05.8
29Salar GrandeDiego de Almagro (III)832.4131.98395044.64.0
30Salar de PedernalesDiego de Almagro (III)2099.10327.71337032.77.0
31Salar de Piedra ParadaDiego de Almagro (III)656.9028.52413357.92.7
32Salar de MaricungaCopiapó (III)2071.23144.03376062.84.0
33Laguna del Negro FranciscoTierra Amarilla (III)636.4325.41411080.12.0
Table 3. Summary of the species richness observed after classifying them as native, endemic, vagrant and exotic..
KingdomPhylumClassNativeEndemicErrantExoticTotal
AnimaliaChordataAmphibia437
AnimaliaChordataAves198254209
AnimaliaChordataMammalia391141
AnimaliaChordataReptilia29332
Total Animal Kingdom270955289
PlantaeBryophytaBryopsida77
PlantaeTracheophytaEquisetopsida2371515267
PlantaeTracheophytaGnetopsida415
PlantaeTracheophytaLiliopsida71677
PlantaeTracheophytaMagnoliopsida9492105
Total Plantae Kingdom41324024461
Total68333529750
Table 4. Classification of 33 high Andean salt flats into biodiversity categories (hotspot vs. coldspot; common vs. rare species) for plants (Plantae) and terrestrial vertebrates (Animalia).
SalarPlantaeAnimalia
ColdspotsHotspotsColdspotsHotspots
CommonRareCommonRareCommonRareCommonRare
Salar de Surire 1 1
Salar de Tara1 1
Aguas Calientes I (Norte)1
Salar de Pujsa1 1
Salar de Loyoques o Quisquiro1 1
Salar de Atacama 1 1
Salar de Aguas Calientes II (Centro)1 1
Salar de los Morros 1 1
Salar El Laco 1 1
Salar Talar (Aguas Calientes III—Sur)1 1
Salar de Pisiga 1
Salar de Incahuasi1 1
Salar de Pular1
Salar de Punta Negra 1 1
Salar de Aguas Calientes IV (Sur Sur)1 1
Salar de Pajonales1 1
Salar de Gorbea1 1
Salar Agua Amarga1 1
Salar de Las Parinas 1
Salar de La Isla1 1
Salar del Huasco1 1
Salar de los Infieles 1 1
Salar Grande1 1
Salar de Pedernales 11
Salar de Piedra Parada 1
Salar de Maricunga1 1
Laguna del Negro Francisco 1 1
Salar de Coposa 1 1
Salar de Michincha 1 1
Salar de Ollague1 1
Salar de San Martín o Carcote1 1
Salar de Ascotan1 1
Salar de Turi 1 1
Total1935317680
Disclaimer/Publisher’s Note: The statements, opinions and data contained in all publications are solely those of the individual author(s) and contributor(s) and not of MDPI and/or the editor(s). MDPI and/or the editor(s) disclaim responsibility for any injury to people or property resulting from any ideas, methods, instructions or products referred to in the content.