1. Introduction
Fatih Birol, Executive Director of the International Energy Agency (IEA), pointed out at the IEA’s 7th Annual Global Conference on Energy Efficiency that improving energy efficiency is a secure and sustainable technological means to ensure the supply of the energy economy. The improvement of oilfield production efficiency is equally important for the sustainable supply of petroleum energy. As an important secondary oil recovery method in oilfields, water injection plays a crucial role in improving crude oil recovery and maintaining reservoir pressure [
1]. The water injection system consists of two parts, the surface part and the underground part. The surface part refers to the surface water injection pipeline network, while the underground part includes water injection wells and oil reservoirs [
2]. Water is pressurized through injection stations, transported through surface pipelines, and injected into injection wells to complete oil recovery [
3]. The energy consumption issue of water injection systems has always been a key focus of energy conservation and consumption reduction in oilfield production. The electricity consumption of the water injection system generally accounts for 33% to 56% of the total electricity consumption of the oilfield [
4], and the energy consumption of the water injection pump station is the highest [
5]. Currently, the operation parameter scheme of the water injection pump adopts manual decision-making, which is easily influenced by subjective experience and leads to high energy consumption. The economic production of oilfields is a key factor in their sustainable development. However, the high energy consumption of the water injection system is an important factor hindering the economic development of oilfields. By conducting energy-saving and optimized operation research on the oilfield water injection system, the energy consumption of the water injection system can be effectively reduced. This not only helps improve the economic production level of the oilfield, but also provides important support for promoting the sustainable development of the oilfield. Therefore, adopting optimization methods to optimize the operation scheme of the water injection system is of great significance for ensuring the normal production of the oilfield and achieving energy-saving, consumption reduction, and sustainable development goals.
The core of optimizing the operation scheme of the water injection system is the optimization model and solution method. The operation optimization model of the water injection system aims to minimize the total energy consumption, considering constraints such as pressure and flow rate. However, in the field of water injection system optimization, due to the complexity of the problem, only a few achievements have been published. Liang et al. [
6] established a mixed integer nonlinear programming (MINLP) model with the objective function of minimizing construction investment, and proposed a mixed solution strategy that combines ant colony optimization, linear approximation, and simplex methods. Zhou et al. [
7] proposed a mixed integer nonlinear programming (MINLP) model with the total revenue of water injection development as the objective function. Zhang et al. [
8] proposed a method for optimizing the operation of oilfield water injection systems based on mixed integer linear programming (MILP). Lan et al. [
9] proposed a non-convex nonlinear model and solved the design problem of regional water supply systems through a branch-and-reduce global optimization approach. Almeida et al. [
10] took intelligent well control as a valve control, considering the uncertainty of processes and reservoirs, and established an optimization model with maximum net present value as the objective function. For large oilfields, the water injection system is usually ring-type pipeline network. The pressure changes within the ring-type system will affect each other, making it a more complex type of system. The published studies focus on tree-type water injection systems, which are simple fluid networks of independent water stations. Existing optimization models and methods cannot be applied to ring-type water injection systems. At present, there are few relevant research results on the ring-type water injection pipeline network. This article studies the ring-type water injection pipeline network. Under the existing equipment and topology structure of the water injection system, a swarm intelligence algorithm is used to optimize the operating parameter scheme of the ring-type water injection pipeline network during daily operation. Their global optimization capability and model universality make swarm intelligence algorithms effective tools for complex optimization problems, especially demonstrating strong practicality in practical engineering scenarios. In the field of oil and gas engineering, commonly used intelligent algorithms include the Particle Swarm Optimization Algorithm, the Ant Colony Optimization Algorithm, the Sparrow Search Algorithm, the Crested Porcupine Optimizer, etc. Among them, the Particle Swarm Optimization (PSO) Algorithm has been applied in various fields, including design optimization of trunk natural gas pipelines [
11], logistics distribution site selection problems [
12], machine learning and deep learning [
13], feature extraction [
14], biological science and technology [
15], power systems [
16], etc. Moreover, solving strongly nonlinear optimization models is more difficult, and conventional intelligent algorithms are prone to getting stuck in local optima. It is necessary to improve the algorithm to optimize the operation scheme of the water injection system. Compared with traditional algorithms, improved algorithms can usually obtain better optimization solutions. For example, the improved Particle Swarm Optimization Algorithm based on hormone regulation (HRPSO) can obtain a natural gas pipeline layout plan with lower total investment [
17]. The improved hybrid arithmetic fireworks optimization algorithm (AFOA) can optimize the layout of oil gathering systems [
18]. The hybrid optimization algorithm (MP/PSO) combining mathematical programming and Particle Swarm Optimization can optimize large-scale crude oil scheduling-integrated production planning [
19]. The optimization workflow combining a genetic algorithm and a polyhedral search method can optimize oil recovery and water injection rates [
20]. The combination of the Monte Carlo simulation method and a genetic algorithm can optimize the water injection strategy [
21]. The hybrid optimization algorithm (PSO-CS) combining the Particle Swarm Optimization (PSO) Algorithm and the Cuckoo Search Algorithm (CS) can optimize the water scheduling of oilfield sewage systems [
22]. The hybrid particle swarm algorithm solved the limitations of the original algorithm and improved computational accuracy, providing a new approach for solving complex optimization problems.
In this article, based on the structural characteristics of the ring-type pipe network of the water injection system, a more refined and practical optimization model is constructed, and a simulation calculation model for the water injection system is established. This article proposes a new intelligent optimization algorithm, namely the Hybrid Particle Swarm–Crested Porcupine Algorithm (PSCPA). This algorithm demonstrates its excellent global solving ability by comparing its solving performance with similar intelligent algorithms. Finally, the Hybrid Particle Swarm–Crested Porcupine Algorithm (PSCPA) was used to solve and optimize the model, and a satisfactory optimization solution was obtained.
2. Model Building
2.1. Optimization Model
Optimization of flow rate parameters of oilfield water injection pumps refers to adjusting the operational parameters (flow rate, pressure) of each water injection pump in the water injection station, under the premise that the on/off status of each water injection pump is known, in order to meet the requirements of system injection and reduce energy loss.
The objective function of this problem is to minimize the energy consumption of water injection, that is
In the equation, denotes the head of the -th water injection pump (unit: m); represents the flow rate of the -th water injection pump (unit: m3/h); is the efficiency of the -th water injection pump at flow rate (unit: %); indicates the efficiency of the motor driving the -th pump (unit: %); stands for the total number of operating water injection pumps; is the fluid density (unit: kg/m3); signifies the gravitational acceleration (unit: m/s2); denotes the operating time of the -th pump (unit: h); and is the unit conversion factor (value: 3.6 × 10⁻⁶).
In order to ensure that the optimization results meet the actual production requirements, it is necessary to require that the design variables and certain node parameters are within the allowable range and meet certain constraints. The following constraints need to be considered.
2.1.1. Local Loss Constraint Within the Station
For water injection stations, due to the presence of internal pipelines and valves, high-pressure water discharged by the water injection pump will experience local losses through the internal pipeline network, and its hydraulic losses should meet the law of pressure energy loss represented by the internal local loss model.
In the formula, and represent the outlet or manifold pressure of the water injection pump and the outlet pressure of the water injection station, respectively; is a local loss unit model within the water injection station, which is related to the friction coefficient of the station’s pipelines and valves, the flow rates of the water injection pump, the inner diameter and length of the pipelines.
2.1.2. Hydraulic Balance Conditions of Pipeline Network
For a water injection pipeline network with
nodes, the equilibrium equation for node
is
In the formula,
and
are, respectively, the input flow rate of node
and the output flow rate of node
,where
; is the pipeline resistance coefficient between node
and
;
and
are the pressures of nodes
and
, respectively;
represents the set of node numbers connected to node
;
is a constant coefficient; and
is a sign function defined as
2.1.3. Water Balance Constraint
The total water supply of each water injection pump should be equal to the sum of the water injection volumes of each water injection well, that is
In the formula, represents the total number of water injection wells in the system.
2.1.4. Water Well Pressure Constraint
The node pressure of each injection well should not be less than its required minimum injection pressure, that is
In the formula, is the minimum injection pressure required for the -th injection well.
2.1.5. Pump Flow Rates Constraints
Each water injection pump needs to operate within the high-efficiency zone, that is
In the formula, and are the minimum and maximum displacements of the -th water injection pump operating in the high-efficiency zone.
2.1.6. Water Injection Volume Constraints at Station Level
For the injection volume of each water injection station, due to constraints such as incoming water volume and sewage reinjection, the injection volume of each water injection station should satisfy Equation (8).
In the formula, is the number of operating water injection pumps in the -th water injection station; and represents the upper and lower limits of the water injection volume for the -th injection station; and is the number of water injection stations.
2.2. Simulation Model
The stations injected into the system are treated as nodes, the pipelines injected into the system are classified as edges, and the water injection pump is represented as a virtual node unit. A schematic diagram of the fluid network of the injection system is drawn as shown in
Figure 1. Taking the water injection pipeline network in
Figure 1 as an example, the establishment and solution process of the simulation model is illustrated.
From the above schematic diagram, it can be seen that in this simple injection system, nodes 1 and 4 are the outlet nodes of the water injection station, nodes 2 and 3 are the water distribution rooms, nodes 5 and 6 are the water injection wells, nodes 7–11 are the water injection pump units, which are also virtual water source node units, and nodes 12 and 13 are the water injection pump manifold nodes. Edges ①~⑦ in the injection system are external pipeline units, ⑧~⑫ in the system correspond to the pipeline units from the outlet of different water injection pumps to the manifold, and ⑬ and ⑭ are internal pipeline units. The arrows in the system indicate the direction of fluid flow in the pipeline, which can be attributed to the actual small-scale fluid network of 5 virtual water source node units transported to two injection wells through the injection station, water distribution room, and internal and external pipelines.
Based on the Hazen–Williams formula, the energy equation for element
is shown in Equation (9).
In the formula, and are the pressures at nodes and ; is the flow rate of the pipeline section (unit: m3/s); is the Hazen–Williams coefficient; is the calculated inner diameter of the pipeline considering the wall thickness (unit: m); and is the length of the pipeline channel (unit: m).
The method of calculating the flow rate based on the pressure loss between the two nodes of application unit
can be obtained, as shown in Equation (10).
If Equation (11) is satisfied, then Equation (10) can be written as
When water flows from node
to node
, the pipeline flow rate is defined as positive, implying that
. Let
represent the flow rate at node
for unit
, and
represent the flow rate at node
for unit
. Assuming that positive flow rates indicate outflow from a node, then
Equation (13) is represented in matrix form as Equation (14).
The flow balance equation for node 3 in
Figure 1 is shown in Equation (15).
Based on the characteristics of the pipeline unit and considering that the flow rate from the node is positive, Equation (16) can be obtained.
By substituting Equation (15) into Equation (16) and organizing it, Equation (17) can be obtained.
This equation is a part of the overall equation system, and the above method can be used to obtain the equilibrium equation for each node in the pipeline network. For the pipeline system shown in
Figure 1, the overall equation system is as shown in Equation (18).
In the formula, are the calculation coefficients for the pipeline units outside the station; is the calculation coefficient from the outlet of the water injection pump to the manifold pipeline unit; and are calculation coefficients for pipeline units from the manifold to the outlet of the water injection station; is the pressure at the injection well and intersection point; the pressure of is the virtual water source node, which is the outlet pressure of the water injection pump; and are the pressure of the station’s manifold; is the sum of the output and input flow rates of the pipeline network nodes; and represent the water injection volume of the water injection well; is the flow rate of the virtual water source point, which is the outlet flow rate of the water injection pump; and and are the flow rates at the station manifold.
Considering that the structure of the injection system is relatively complex and the system equations are of high dimension, the simple iteration method is adopted for solution to ensure the reliability of calculations. The solving process is as follows:
Step (1): Select a reference point, set its pressure value, estimate a set of initial node pressures in advance, give the required calculation accuracy , and make the iteration number .
Step (2): The values of each pipe element are calculated to form the overall equation system.
Step (3): Boundary conditions are introduced to solve the overall system of equations and obtain the pressure values H at each node.
Step (4): The flow rate of each pipe element is calculated, and the accuracy requirement for judgment is if Equation (19) is satisfied.
If satisfied, then proceed to Step (5); otherwise, let and and turn to Step (2).
Step (5): Let to obtain the pressure values of each node, and end the iteration.
4. Multi-Mechanism Threat Response Strategy for Dynamic Parameter Adjustment
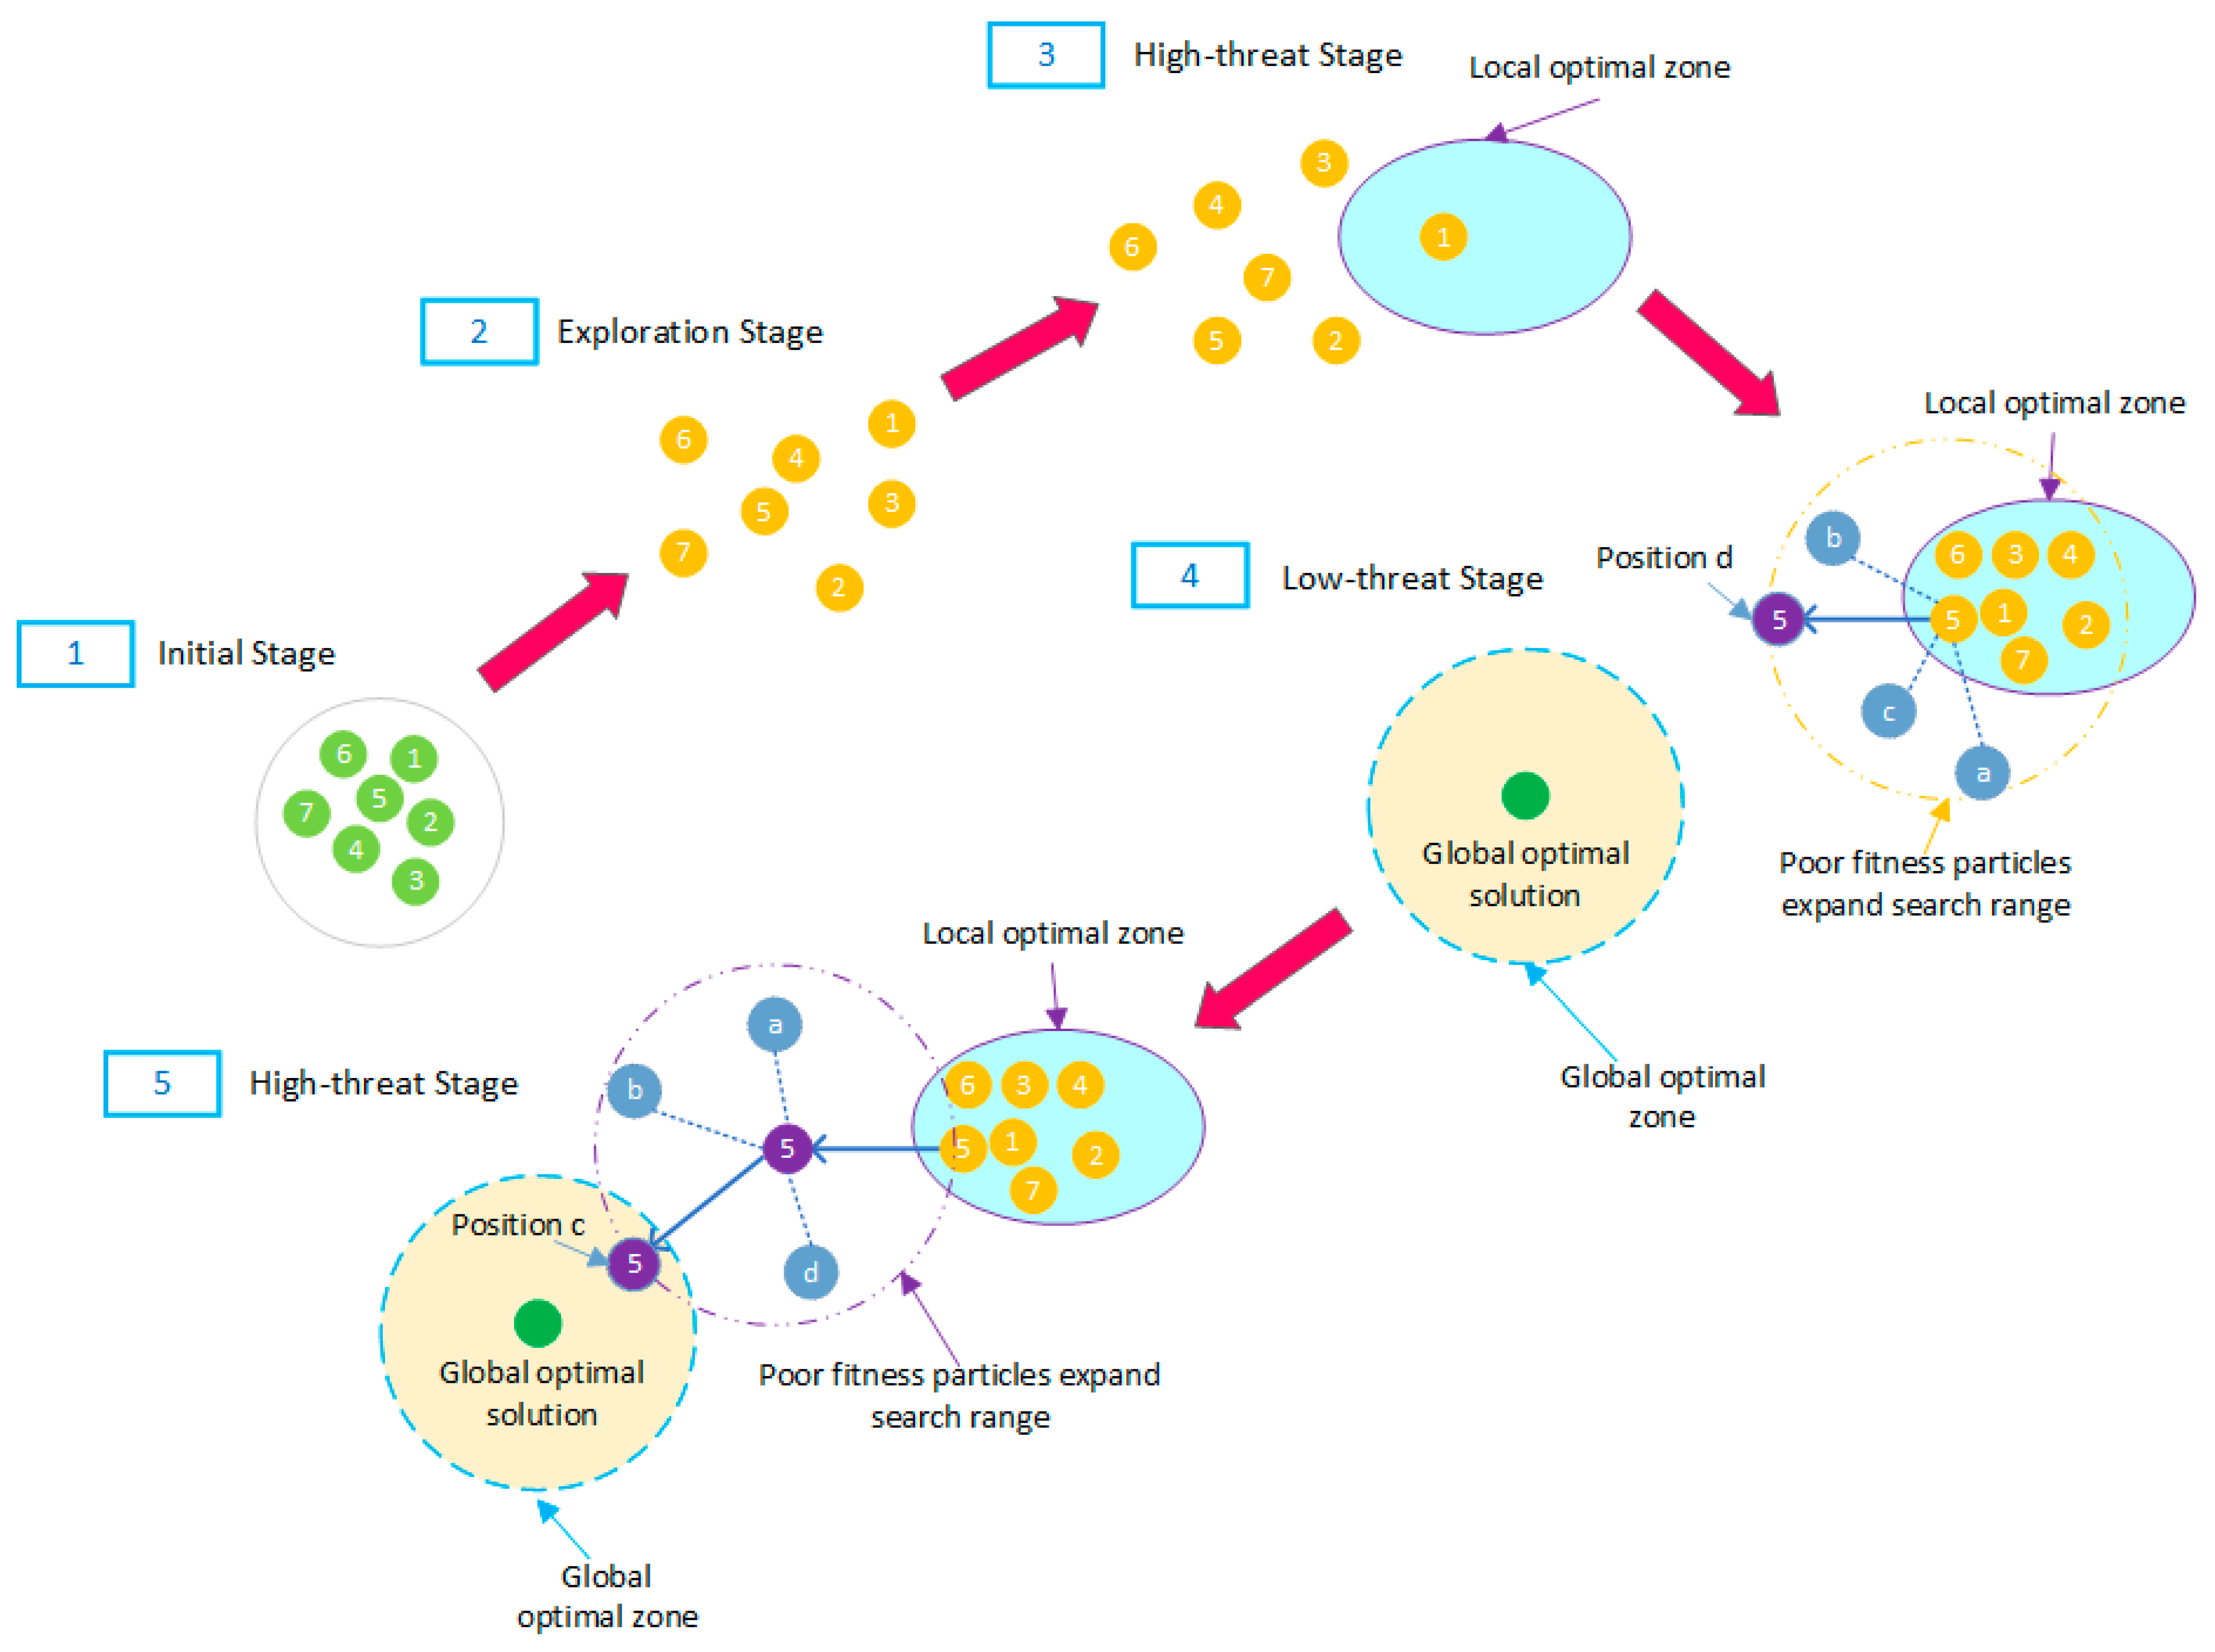
In traditional Particle Swarm Optimization Algorithms, the search process relies on information guidance from individual optima () and global optima (). When there are multiple local optima in the problem (such as multi-modal function optimization), particles will quickly converge to the local optimum range, resulting in the rapid disappearance of population diversity and falling into local optima. The parameter adaptive adjustment strategy is the most effective way to avoid the Particle Swarm Optimization Algorithm falling into local optima. The core parameters of the Particle Swarm Optimization Algorithm (inertia weight , learning factors , ) directly affect the balance between “exploring new regions” and “developing known optimal regions”, and dynamically adjusting parameters can avoid the algorithm falling into local optima. In order to maintain population diversity and increase the algorithm’s ability to escape local optima, the efficient search for global optimal solutions can be achieved. A new Multi-Mechanism Threat Response Strategy for Dynamic Parameter Adjustment is proposed using the Hybrid Particle Swarm–Crested Porcupine Algorithm.
In the Multi-Mechanism Threat Response Strategy for Dynamic Parameter Adjustment, the dynamic adjustment logic of this strategy is the mapping relationship between threat level assessment and defense mechanism. The core behavior of the Crested Porcupine Optimizer (CPO) is based on the “threat perception–defense response” mechanism, including a visual mechanism, sound mechanism, odor mechanism, and physical attack mechanism. Among them, the visual mechanism applies to long-range detection threats (wide range but low accuracy), corresponding to the demand for “global exploration” (finding potential optimal areas), the sound mechanism applies to mid-range recognition threats (balancing range and accuracy), corresponding to the demand for “exploration and development balance” (considering both new and known areas), the odor mechanism applies to short-range positioning threats (narrow range but high accuracy), corresponding to the demand for “local development” (refining search within potential optimal areas), and the physical attack mechanism applies to extremely close range defense (focusing on local fine adjustment), corresponding to the demand for “fine local search” (deep mining near the optimal area). By triggering different defense mechanisms through threat levels, it is mapped to the dynamic adjustment of
(individual cognitive coefficient) and
(social learning coefficient) in PSO. The threat level assessment adopts the calculation of population fitness differences to evaluate the threat level. If the difference is greater than the given threshold, it is considered a high-threat level, and if it is less than the threshold, it is considered a low-threat level. The specific threat level assessment is shown in Equation (20).
where
is the threat level;
is the optimal fitness value in the population (minimum fitness);
is the worst fitness value in the population (maximum fitness); and
is an extremely small positive number (avoid denominator being 0).
The choice of defense mechanism depends on the level of threat. The visual defense mechanism and sound defense mechanism belong to low-threat level defense mechanisms, while the odor defense mechanism and physical attack defense mechanism belong to high-threat level defense mechanisms. When the threat level is higher than the threshold (high-threat), if the iteration rounds are odd, the odor defense mechanism (reducing
and increasing
) is used to accelerate convergence towards the global optimum. If it is even, the “physical attack defense” mechanism (extremely low
, extremely high
) is used to focus on the optimal solution neighborhood. When the threat level is below the threshold (low-threat), if the iteration rounds are odd, the visual defense mechanism (increase
, decrease
) is used to escape the local optimum. If it is even, the sound defense mechanism (medium
,
) is used to maintain search efficiency. An individual fitness influence factor is designed based on individual fitness to perform secondary adjustment on the
and
of individual particles, achieving the effect that particles with poorer fitness have slower attenuation of exploration ability and ensuring population diversity. An individual fitness influence factor is shown in Equations (21) and (22).
In the formula, is the individual fitness; is the individual fitness influence factor; is the individual optimal fitness of the -th particle; is the sum of fitness of all particles in the population; is the threat assessment coefficient ( > 0); and is an extremely small positive number (avoid denominator being 0).
To increase the probability of particles escaping from the local optimal solution, random perturbations were added, and ultimately a dynamic balance between exploration and development capabilities of the PSO algorithm was achieved through the Multi-Mechanism Threat Response Strategy for Dynamic Parameter Adjustment, effectively improving the algorithm performance.
5. Algorithm Solving Process
Based on the improved Multi-Mechanism Threat Response Strategy for Dynamic Parameter Adjustment mentioned above, the solution process of the Particle Swarm Optimization Algorithm is the main framework, and the specific solution process of the hybrid algorithm is as follows:
Step (1): The population size, maximum iteration times, and search space boundaries of the Hybrid Particle Swarm–Crested Porcupine Algorithm are initialized, and the main control parameters of the hybrid algorithm are assigned values, including the defense behavior switching threshold , random disturbance intensity parameter , and threat assessment coefficient , and the objective function and constraint conditions are read and stored, as well as the maximum particle velocity and inertia weight range .
Step (2): According to the PSO algorithm, the initial positions of particles for the Hybrid Particle Swarm–Crested Porcupine Algorithm are randomly generated in the search space, and the fitness function values are calculated to store the best individuals in the population and historical best individuals.
Step (3): The current threat level () is calculated based on Equation (20).
Step (4): According to the threat threshold λ, the defense mechanism has been selected:
- (1)
High threat (): ① When the iteration round is odd (), the odor defense mechanism (enhance global exploration) is activated. ② When the iteration round is even (), the physical attack defense mechanism (fine local search) is activated.
- (2)
Low threat (): ① When the iteration round is odd (), the visual defense mechanism (enhance local development) is activated. ② When the iteration round is even (), the sound defense mechanism (balance exploration and development) is activated.
The value of the basic learning factor (, ) based on the defense mechanism is determined.
Step (5): The learning factor (, ) of each particle in the group is adjusted, and then the process proceeds to Step (6).
Step (6): The individual fitness influence factor () of particles is determined through Equations (21) and (22), the basic learning factor (, ) determined in Step (4) is adjusted twice to enable particles with poor fitness to have better exploration ability, and random perturbations are added. Go to Step (7).
Step (7): Determine whether the adjustment of all particles in the group has been completed. If so, proceed to Step (8); if not, proceed to Step (6) to adjust the next particle.
Step (8): The particle velocity is updated through inertia weight , individual cognition , and social guidance , and the new velocity does not exceed the maximum velocity . The particle movement adopts the new velocity. If the particle exceeds the boundary, it is pulled back into the search space.
Step (9): After the particles move to a new position, the fitness values of all particles at the new position are calculated. If the fitness of the new position is better than the historical optimal fitness, it is replaced. If a better solution is found, the current optimal solution is replaced, and the global optimal fitness for each generation is stored.
Step (10): Determine whether the maximum iteration termination condition is met, if so, proceed to Step (11); if not, proceed to Step (3) for the next iteration.
Step (11): Output the optimal solution.
The solution flowchart is shown in
Figure 3.
6. Performance Analysis of Algorithm Solving
To verify the solving performance of the Hybrid Particle Swarm–Crested Porcupine Algorithm, this paper compares it with the Particle Swarm Optimization (PSO) Algorithm, the Crown Porcupine Optimizer (CPO), and seven cutting-edge intelligent optimization algorithms proposed in recent years. The numerical experiment adopts the International Standard Test Functions to horizontally evaluate the solving ability of the Hybrid Particle Swarm–Crested Porcupine Algorithm. Intelligent optimization algorithms are selected as comparison algorithms, including the GOOSE Algorithm, published in the SCI journal
Evolving Systems in 2024 and inspired by the migration behavior of geese [
23]; the Hippopotamus Optimization (HO) Algorithm, proposed by Iranian scholar Mohammad Hussein Amiri’s team in
Scientific Reports in 2024, simulating the activity characteristics of hippopotamus water bodies [
24]; the Parrot Optimizer (PO) proposed in 2024 and inspired by parrot foraging, staying, communication, and fear of life behaviors [
25]; the Grey Wolf Optimizer (GWO) Algorithm, proposed by Seyedali Mirjalili and Andrew Lewis in 2014, published in
Advances in Engineering Software, and inspired by the social hierarchy division of labor and collaborative hunting behavior of the gray wolf population [
26]; the Golden Jackal Optimization (GJO) Algorithm, published by the Nitish Chopra research team in
Expert Systems with Applications in 2022 and inspired by the unique survival strategy of giraffes in grassland ecosystems [
27]; the Bitterling Fish Optimization (BFO) Algorithm, proposed by Lida Zareian in 2024 and published in
Multimedia Tools and Applications [
28]; and the Newton–Raphson-based Optimizer (NBRO), published in
Engineering Applications of Artificial Intelligence in February 2024, which integrates classical numerical computation methods [
29]. Through systematic horizontal comparison, the performance advantages of the Hybrid Particle Swarm–Crested Porcupine Algorithm over these cutting-edge algorithms will be objectively measured under a unified experimental framework. Comparative analysis of the performance of different algorithms using standard test functions is a general practice for testing the global optimization solving ability of algorithms. In this numerical test function, the 21 standard test benchmark functions from the IEEE CEC 2017 competition [
30] are used to evaluate the performance of algorithms in the continuous search space, including F1 and F2 in the F1–F3 uni-modal function, F4, F5 and F7–F10 in the F4–F10 simple multi-modal function, F11–F16, F18, and F19 in the F11–F20 mixed function, and F21, F25, and F28–F30 in the F21–F30 combination function. The Hybrid Particle Swarm–Crested Porcupine Algorithm (PSCPA), the Crown Porcupine Optimizer (CPO), the Particle Swarm Optimization (PSO) Algorithm, the Hippopotamus Optimization (HO) Algorithm, the Bitterling Fish Optimization (BFO) Algorithm, the GOOSE Algorithm (GOOSE), the Newton–Raphson-based Optimizer (NBRO), the Parrot Optimizer (PO), the Grey Wolf Optimizer (GWO) Algorithm, and the Golden Jackal Optimization (GJO) Algorithm were, respectively, applied to solve 21 standard test functions. The number of iterations for all algorithms is 500, the dimensions of each problem are set to 30 dimensions (30 variables), the population size is 30, the implementation platform of the algorithm is Matlab, and the computer configuration used for calculation is a Core i7, 3.00 GHZ processer with 4G RAM, running on a Windows 10 system. The main control parameters of the Hybrid Particle Swarm–Crested Porcupine Algorithm were set as the defense behavior switching threshold
= 0.7, the random perturbation intensity parameter
= 0.3, the threat assessment coefficient
= 0.2, the maximum particle velocity
, and the inertia weight range
. The main control parameter settings for the other nine intelligent optimization algorithms are shown in
Table 1. The parameter selection for each algorithm comes from the range of values in the literature proposing this algorithm. Each test function is solved 20 times, and the ranking results are summarized in
Table 2. The specific calculation results are shown in
Table A1 of
Appendix A.
Based on the results and rankings in
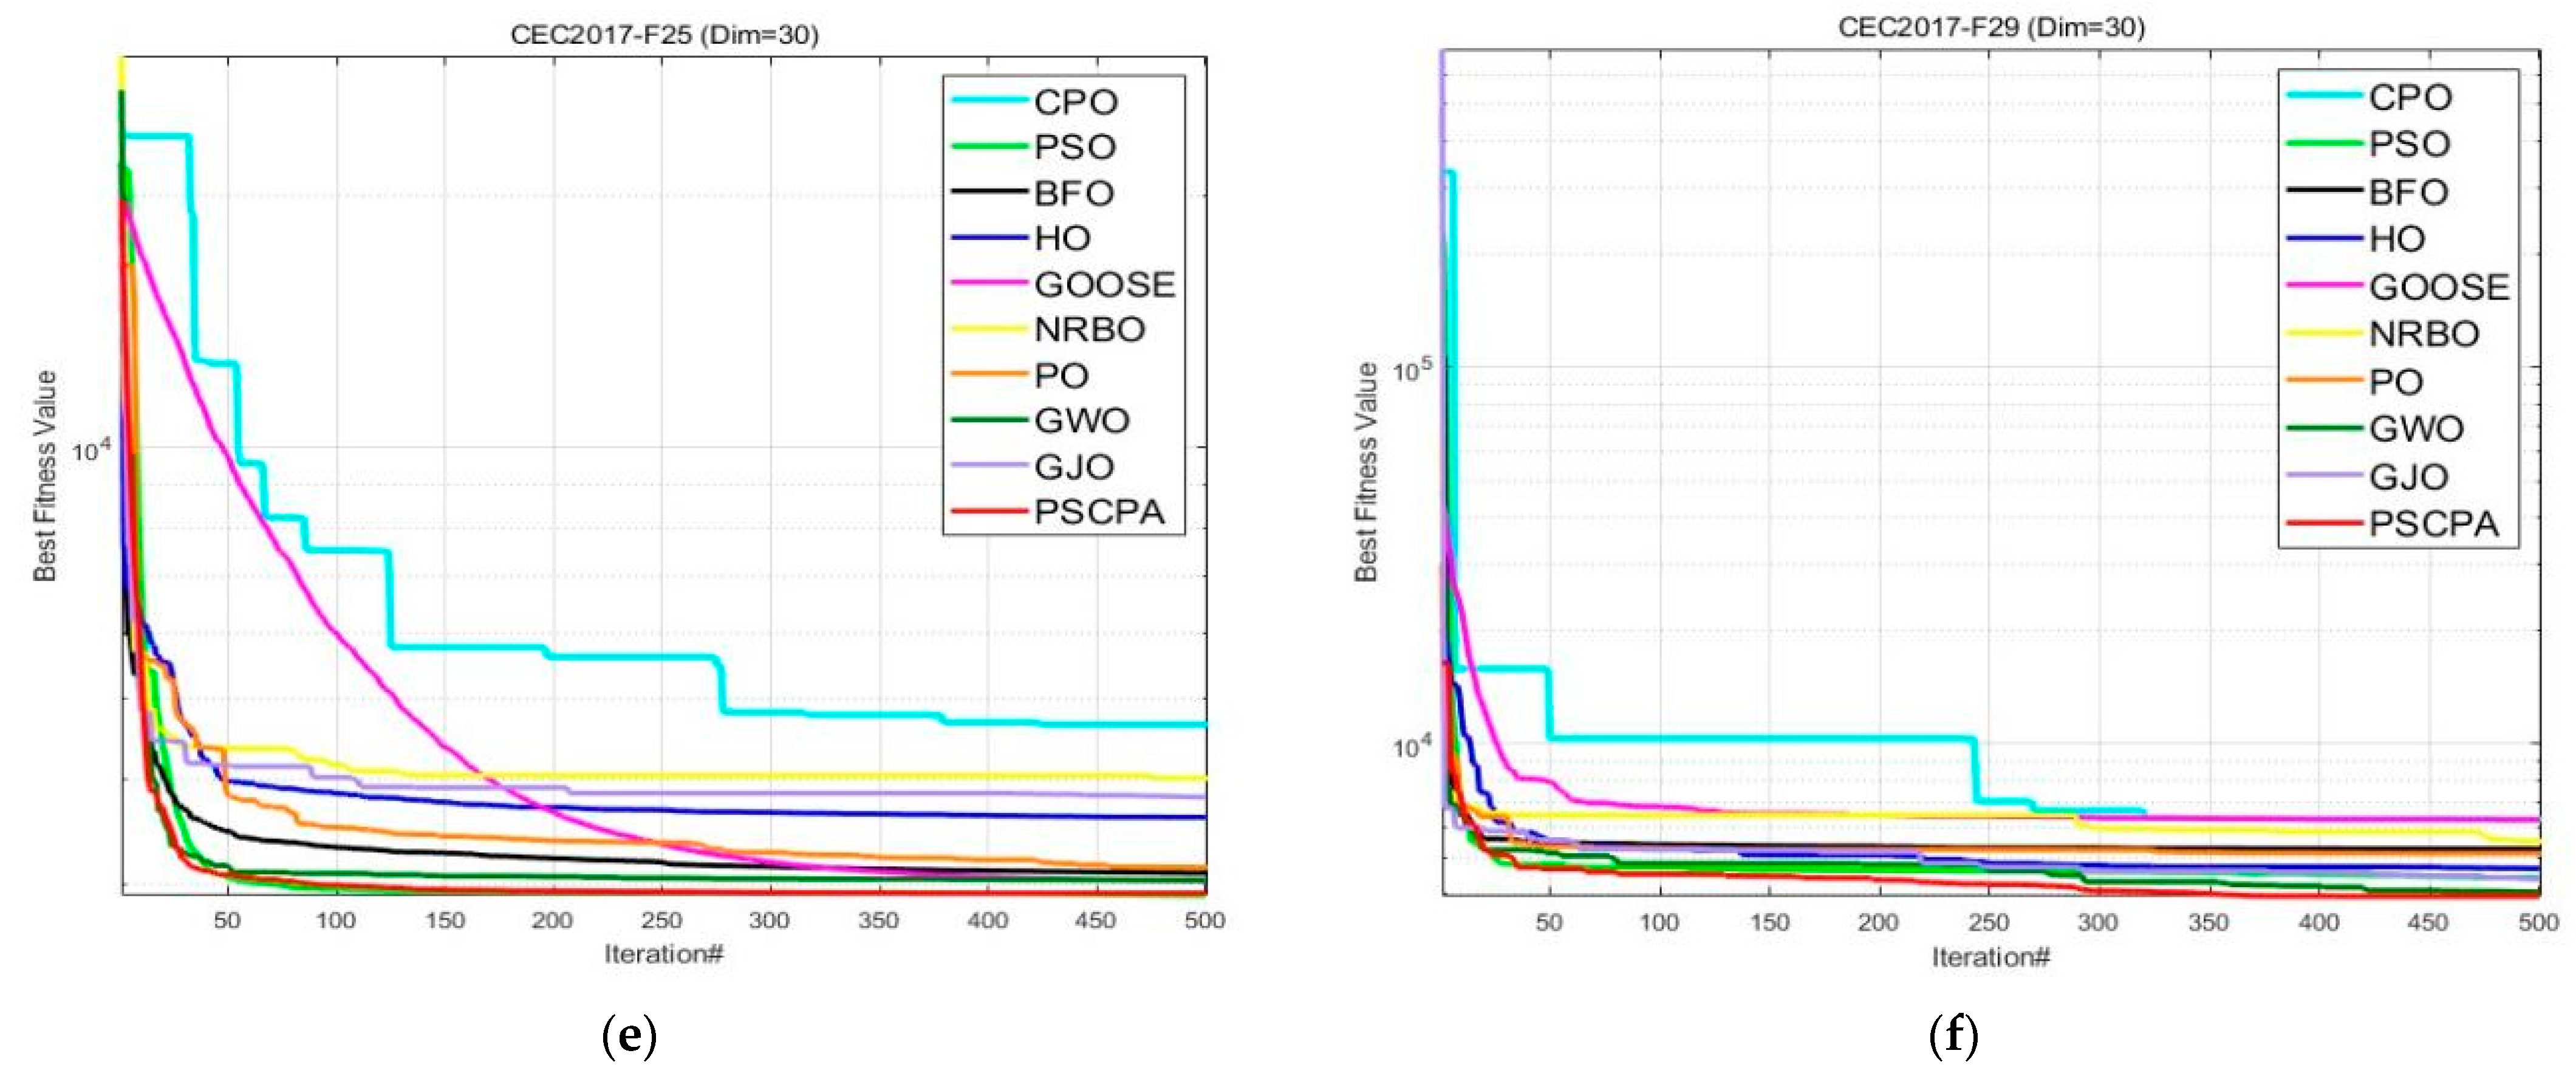
Table 2, it can be seen that compared with the other nine algorithms, the PSCPA proposed in this paper performs the best in numerical solution. Among the 21 standard test functions, the PSCPA obtained the best solution in 17 multi-modal or uni-modal benchmark functions, accounting for more than 4/5 of the total functions. The proportion of obtaining the optimal solution using other algorithms is relatively low. The PSO algorithm and BFO Algorithm obtained, respectively, the optimal solution in three and one standard test functions, accounting for 1/5 of the total functions. The average and standard deviation of the optimal values obtained by the PSCPA are superior to the other nine algorithms. In addition to ranking the PSCPA first based on the average value, the variance of the PSCPA is usually the smallest when the average value is optimal, indicating that the PSCPA has good robustness and can adapt well to different types of optimization problems. It can be used as a solution method for solving the parameters optimization scheme model of oilfield water injection systems. The excellent solution accuracy of the PSCPA can improve the algorithm’s global search ability, effectively jump out of local optima, and enhance the ability to find the global optimal solution. In order to further analyze the convergence speed of the PSCPA, the representative functions from 21 test functions were selected to plot the iterative descent curves of 10 algorithms, forming
Figure 4.
Each sub-graph in
Figure 4 shows the convergence speed of 10 algorithms, where the red solid line represents the iteration curve of the Hybrid Particle Swarm–Crested Porcupine Algorithm, and other algorithms are distinguished by different colored line shapes. Through observation, it can be found that in the experiments for a total of six test functions,
,
,
,
,
and
, the lines marked by the red solid lines are all located below the other nine lines, indicating that the Hybrid Particle Swarm–Crested Porcupine Algorithm can find the optimal solution with the least number of iterations. Among them, the red solid lines in
Figure 4b–f have reached the optimal solution with less than 300 iterations, and their convergence speed is faster than the other 9 algorithms, and the obtained optimal value is also significantly better than other algorithms. In the six figures, the initial iteration descent speed of the Hybrid Particle Swarm–Crested Porcupine Algorithm in
Figure 4b,c is not the fastest. In
Figure 4b, it is slower than the GWO algorithm from 0 to 130 iterations, and after 130 iterations, the descent speed is significantly better than the GWO Algorithm. In
Figure 4c, it is slower than the BFO Algorithm from 0 to 350 iterations, and after 350 iterations, the descent speed is significantly better than the . This is because the algorithm adopts the Multi-Mechanism Threat Response Strategy for Dynamic Parameter Adjustment, which allows the algorithm to jump out of local optima by adjusting the threat level parameters and has better global search ability. From
Figure 4a, it can be seen that the PSCPA has extremely high global search efficiency under uni-modal functions and can quickly approach the optimum. The rapid exploration in the early stage and fine development in the later stage of the PSCPA shown in
Figure 4b–d demonstrate its strong ability to solve multi-modal functions.
Figure 4b,c show that the PSCPA can dynamically balance between “local refinement” (single peak segment) and “global jump out” (multi peak segment) and has outstanding solving ability in composite scenarios. The convergence descent curve in
Figure 4 proves the correctness of the fusion of the Particle Swarm Optimization Algorithm and the Crown Porcupine Optimizer in the Hybrid Particle Swarm–Crested Porcupine Algorithm, and also verifies the effectiveness of the Multi-Mechanism Threat Response Strategy for Dynamic Parameter Adjustment. By combining the advantages of the Particle Swarm Optimization Algorithm and the Crown Porcupine Optimizer, the Hybrid Particle Swarm–Crested Porcupine Algorithm significantly improves the global and local search capabilities of the hybrid intelligent algorithm, enhances the diversity of the population, and accelerates the convergence speed of the algorithm. Through examples, it has been proven that the Hybrid Particle Swarm–Crested Porcupine Algorithm proposed in this paper is an effective algorithm for solving complex optimization problems and can be applied to the subsequent complex nonlinear optimization model solving in this paper.
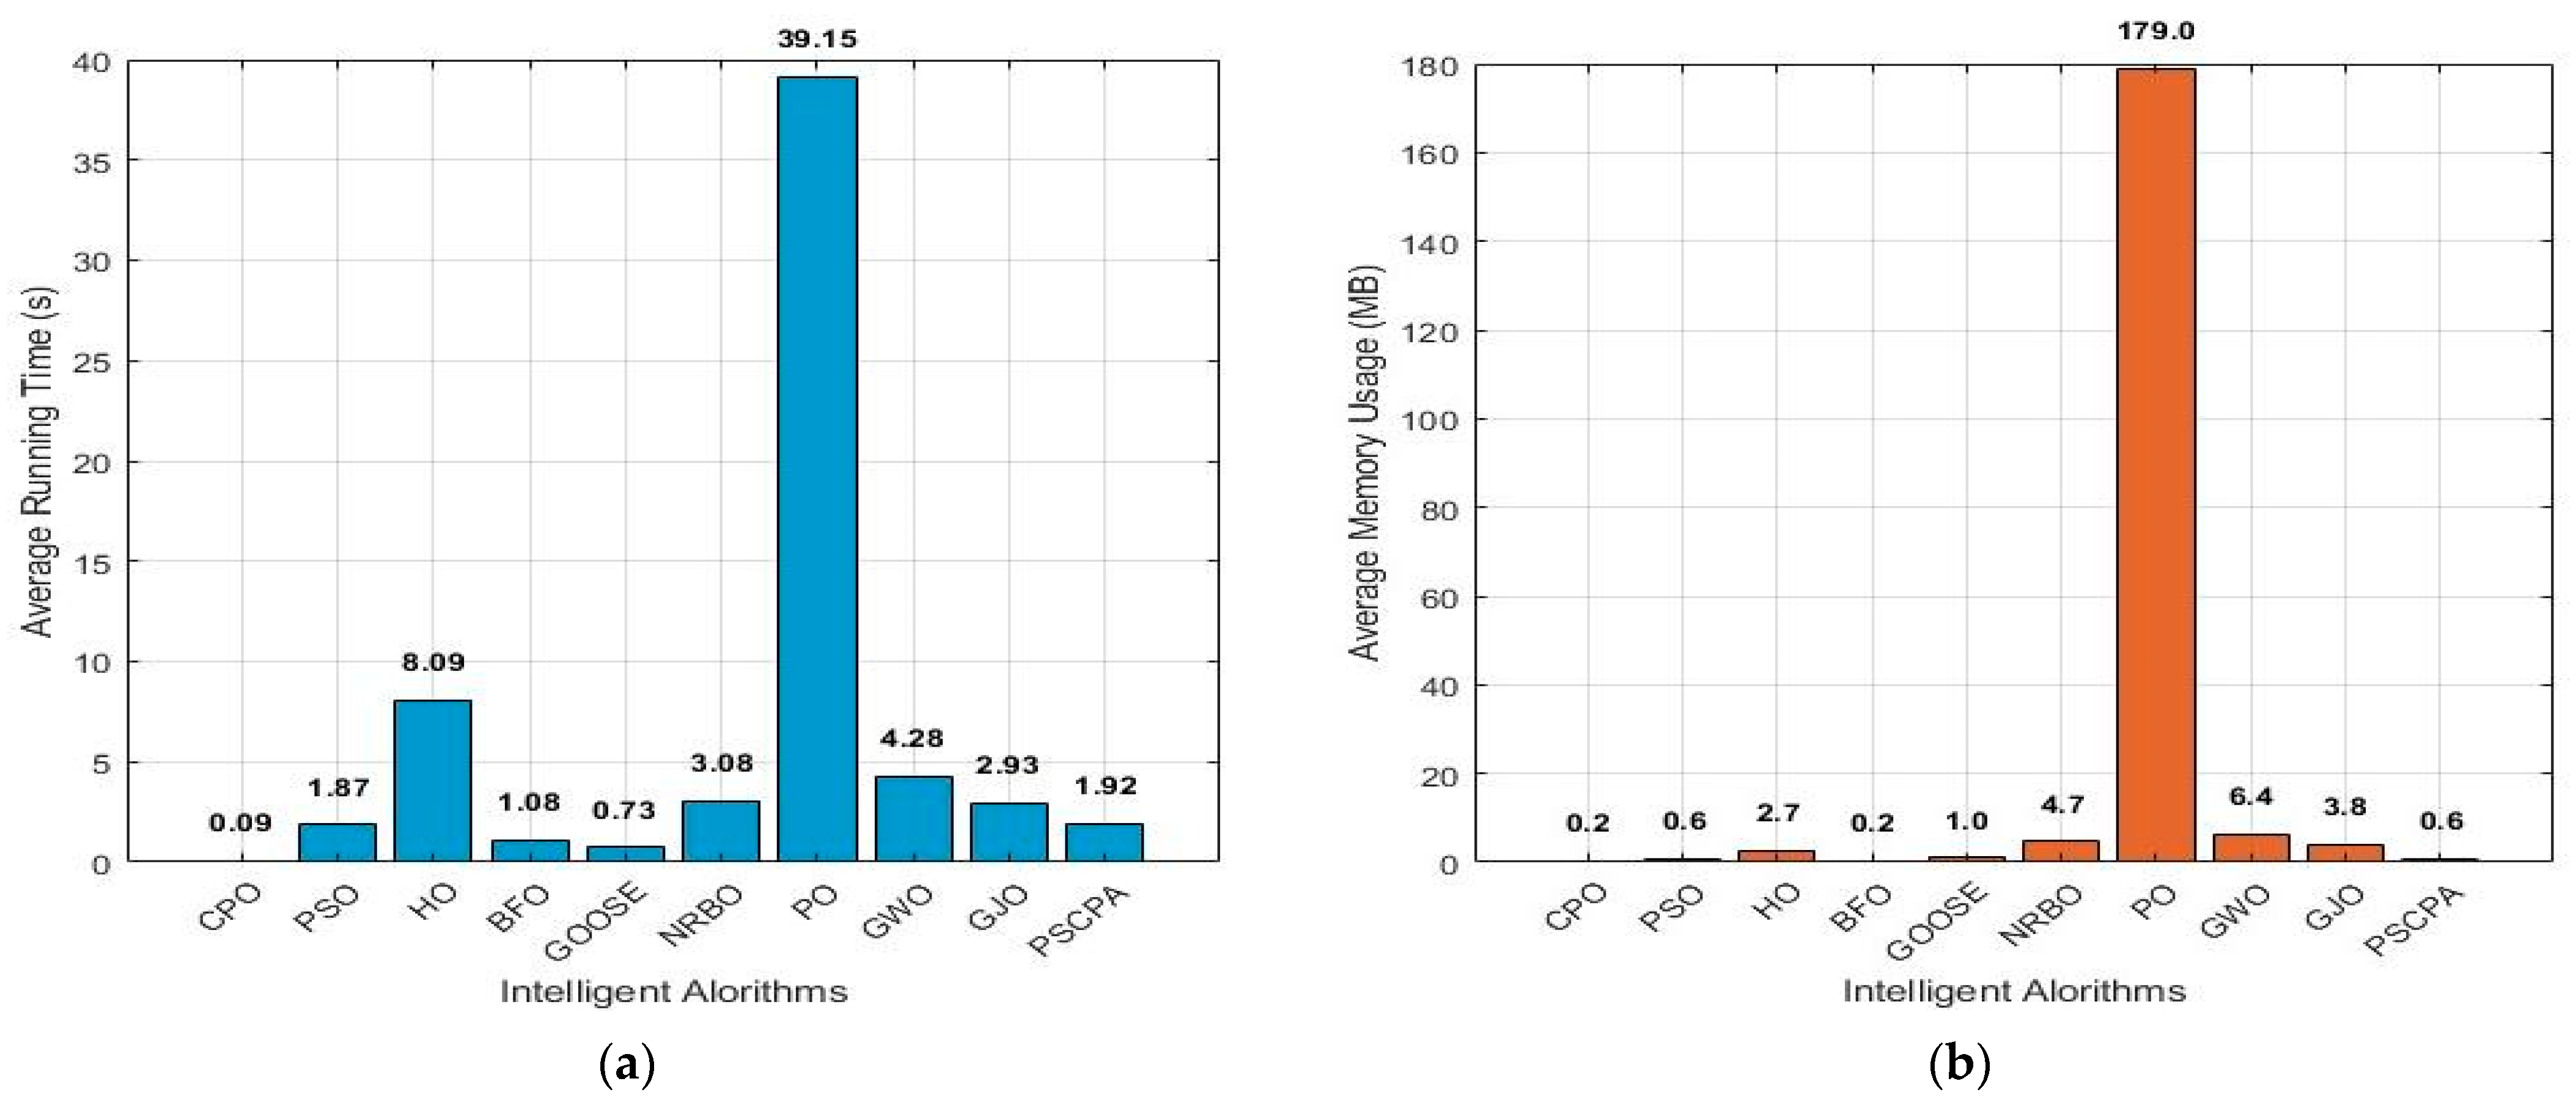
In addition, to further explore the performance of the algorithm, a comparison of the computational cost between PSCPA and nine other algorithms was conducted. The combination function F25 was solved 20 times by 10 algorithms to obtain the average execution time and memory usage. A histogram is plotted as shown in
Figure 5.
According to
Figure 5, the average execution time of the PSCPA is 1.92 s, and the memory overhead of the PSCPA is 0.6 MB. Its execution time and memory usage are both in a moderately reasonable range, and far lower than the extreme memory consumption and high time consumption of the PO Algorithm. Meanwhile, its execution time and memory usage are similar to classic lightweight algorithms such as the PSO Algorithm (1.87 s, 0.6 MB) and BFO Algorithm (1.08 s, 0.2 MB). Therefore, the PSCPA belongs to the category of low-time-consumption and low-memory-consumption algorithms.
In order to further confirm whether there are significant differences between the Hybrid Particle Swarm–Crested Porcupine Algorithm and the other nine algorithms, non-parametric tests were conducted on the rankings obtained by the ten algorithms. Firstly, the mean and standard deviation of the optimal values in
Table A1 of
Appendix A were analyzed based on Friedman’s nonparametric test. This can determine, from the perspective of mathematical statistics, whether the optimization performance of the Hybrid Particle Swarm–Crested Porcupine Algorithm is significantly different from other algorithms. The specific Friedman test results can refer to
Table 3.
According to the test results in
Table 3, the
p-values obtained from Friedman’s test are all below the significance level (<0.05), indicating significant differences between the PSCPA and the other nine algorithms. Furthermore, the test values indicate that the PSCPA has the best performance among the 10 algorithms. The
p-values reached 4.1719 × 10
−26 and 7.8185 × 10
−17, indicating that these results are almost impossible to have been caused by random factors. Moreover, the PSCPA ranked highest in both the mean and variance of Friedman’s test values, indicating that the PSCPA has the best solution accuracy and stability among the nine algorithms.
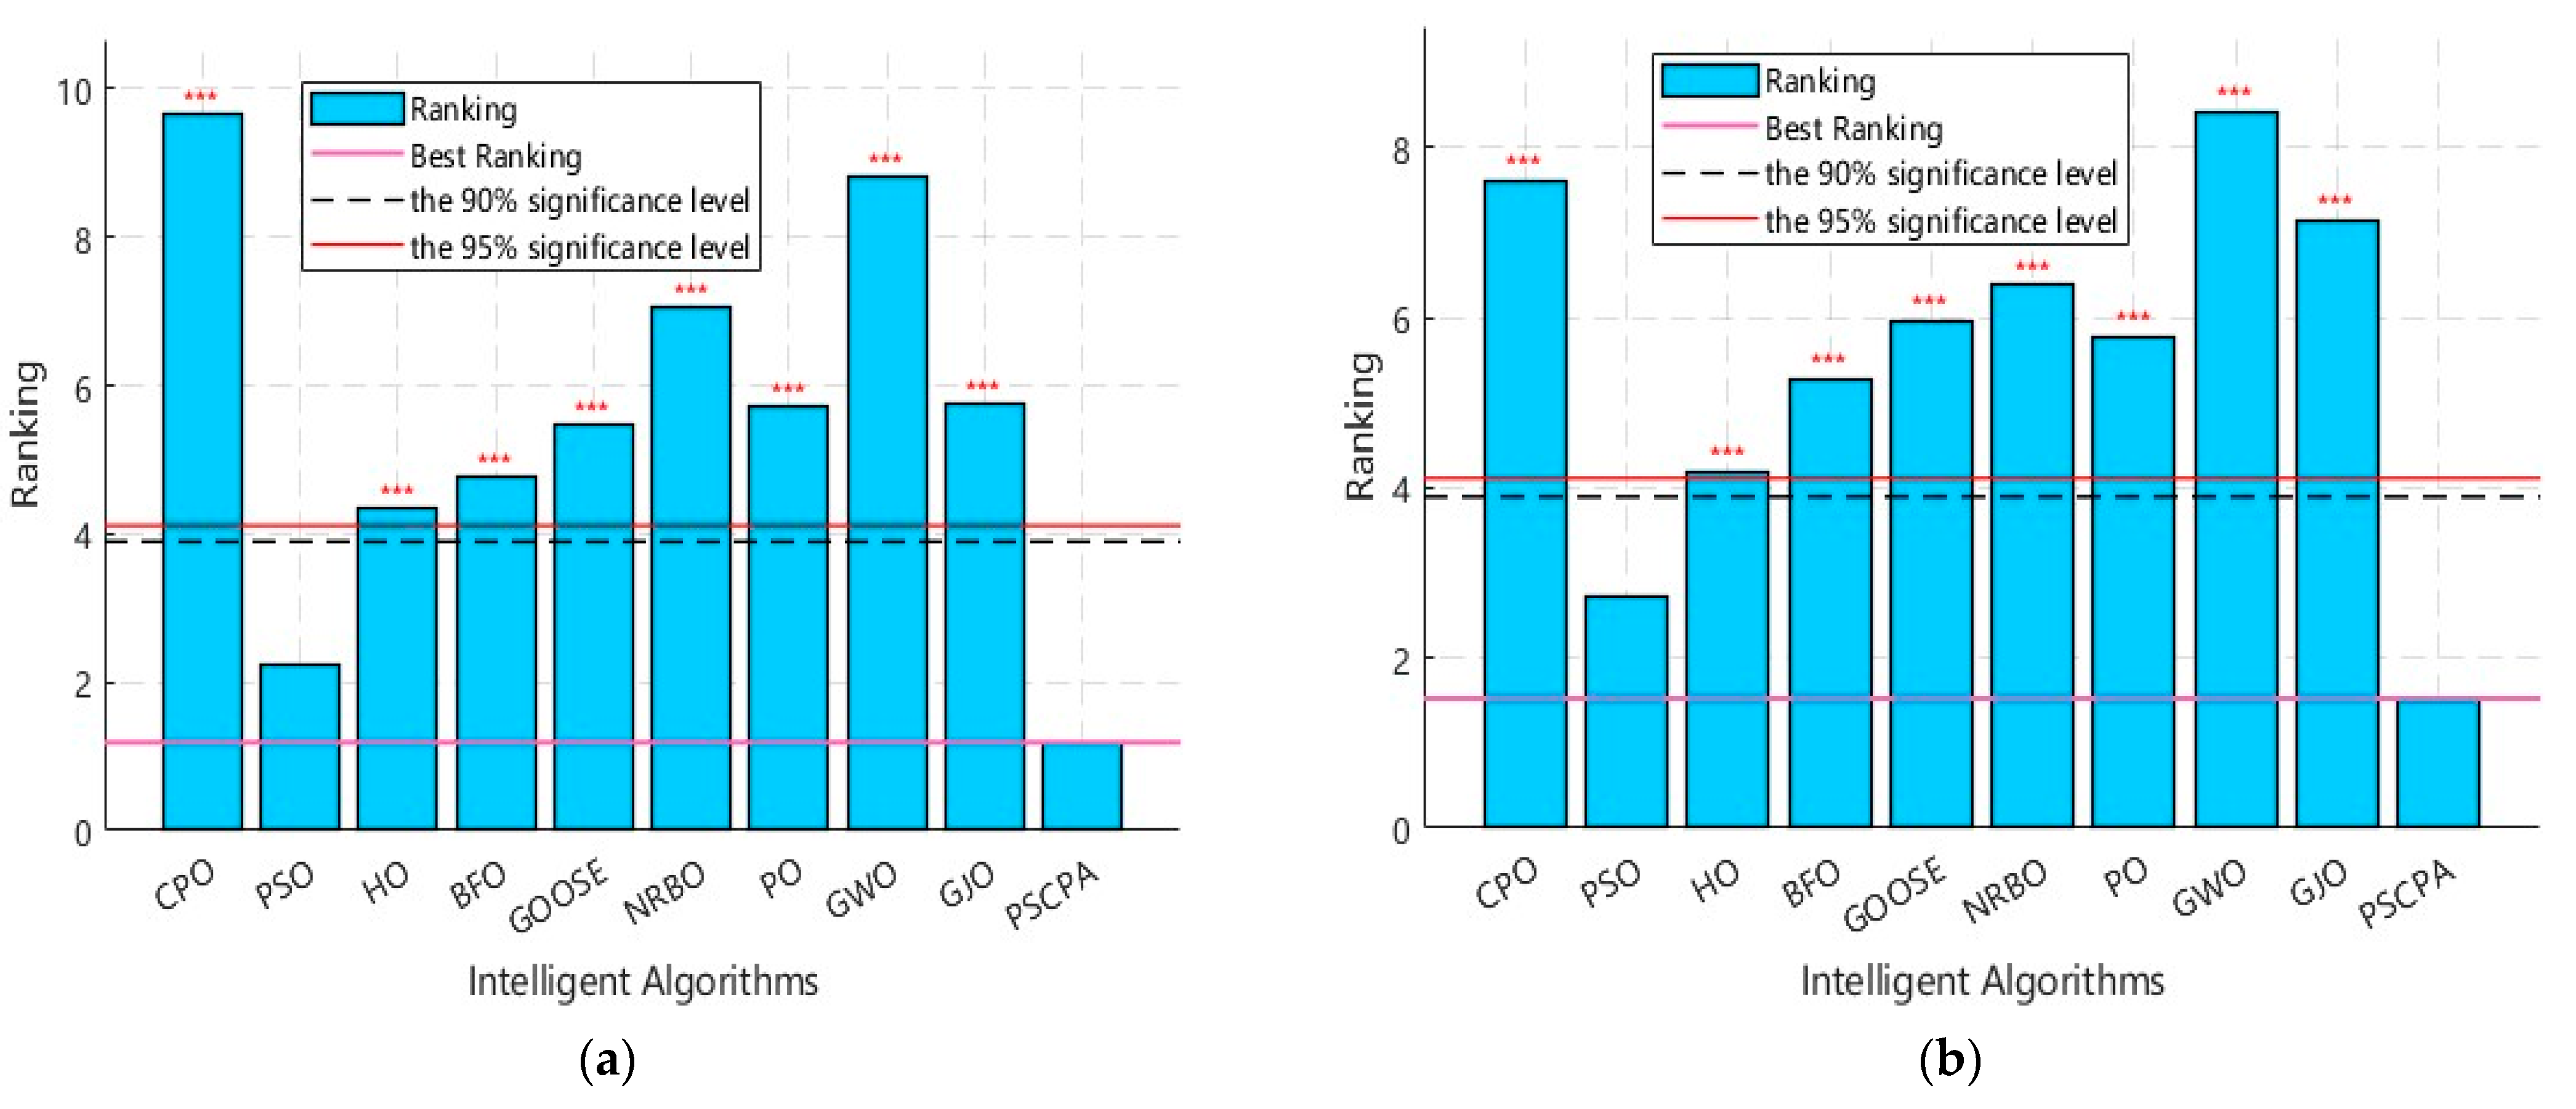
In order to further analyze the performance differences between the 10 algorithms and draw more accurate conclusions, the Bonferroni–Dunn test was conducted based on the results of Friedman’s test. For the Bonferroni–Dunn test, the condition for significant differences between the two algorithms is that their performance ranking is greater than the critical difference. The critical difference calculation result of the Bonferroni–Dunn test is as follows:
Based on the critical difference and Friedman test results obtained above, we drew a histogram of the PSCPA and the other nine algorithms, as shown in
Figure 6. The pink horizontal line represents the Friedman test results of the optimal algorithm, the red horizontal line represents the threshold at the 95% significance level, and the black horizontal dashed line represents the threshold at the 90% significance level.
Based on the results of the Bonferroni–Dunn test for the ranking of average values across 21 test functions in
Figure 6a, the PSCPA significantly outperforms the eight algorithms, namely CPO, HO, BFO, GOOSE, NRBO, PO, GWO, and GJO, at the 95% significance level. This indicates that there are significant differences in solution accuracy for optimization problems between the PSCPA and these eight algorithms, reflecting its excellent performance in global optimization solving ability. According to the analysis of the average standard deviation in
Figure 6b, compared to other improved swarm intelligence optimization algorithms, the PSCPA has better robustness. At 90% and 95% confidence levels, this algorithm outperforms eight algorithms including CPO, HO, BFO, GOOSE, NRBO, PO, GWO, and GJO, indicating that its stability performance in solving optimization problems is significantly better than these eight algorithms. From the figure, it can be seen that this algorithm is superior to the PSO Algorithm, but the PSO Algorithm itself also performs well in terms of solving accuracy and robustness. Therefore, in the test, the PSCPA did not show significant advantages over the PSO Algorithm.
7. Case Study
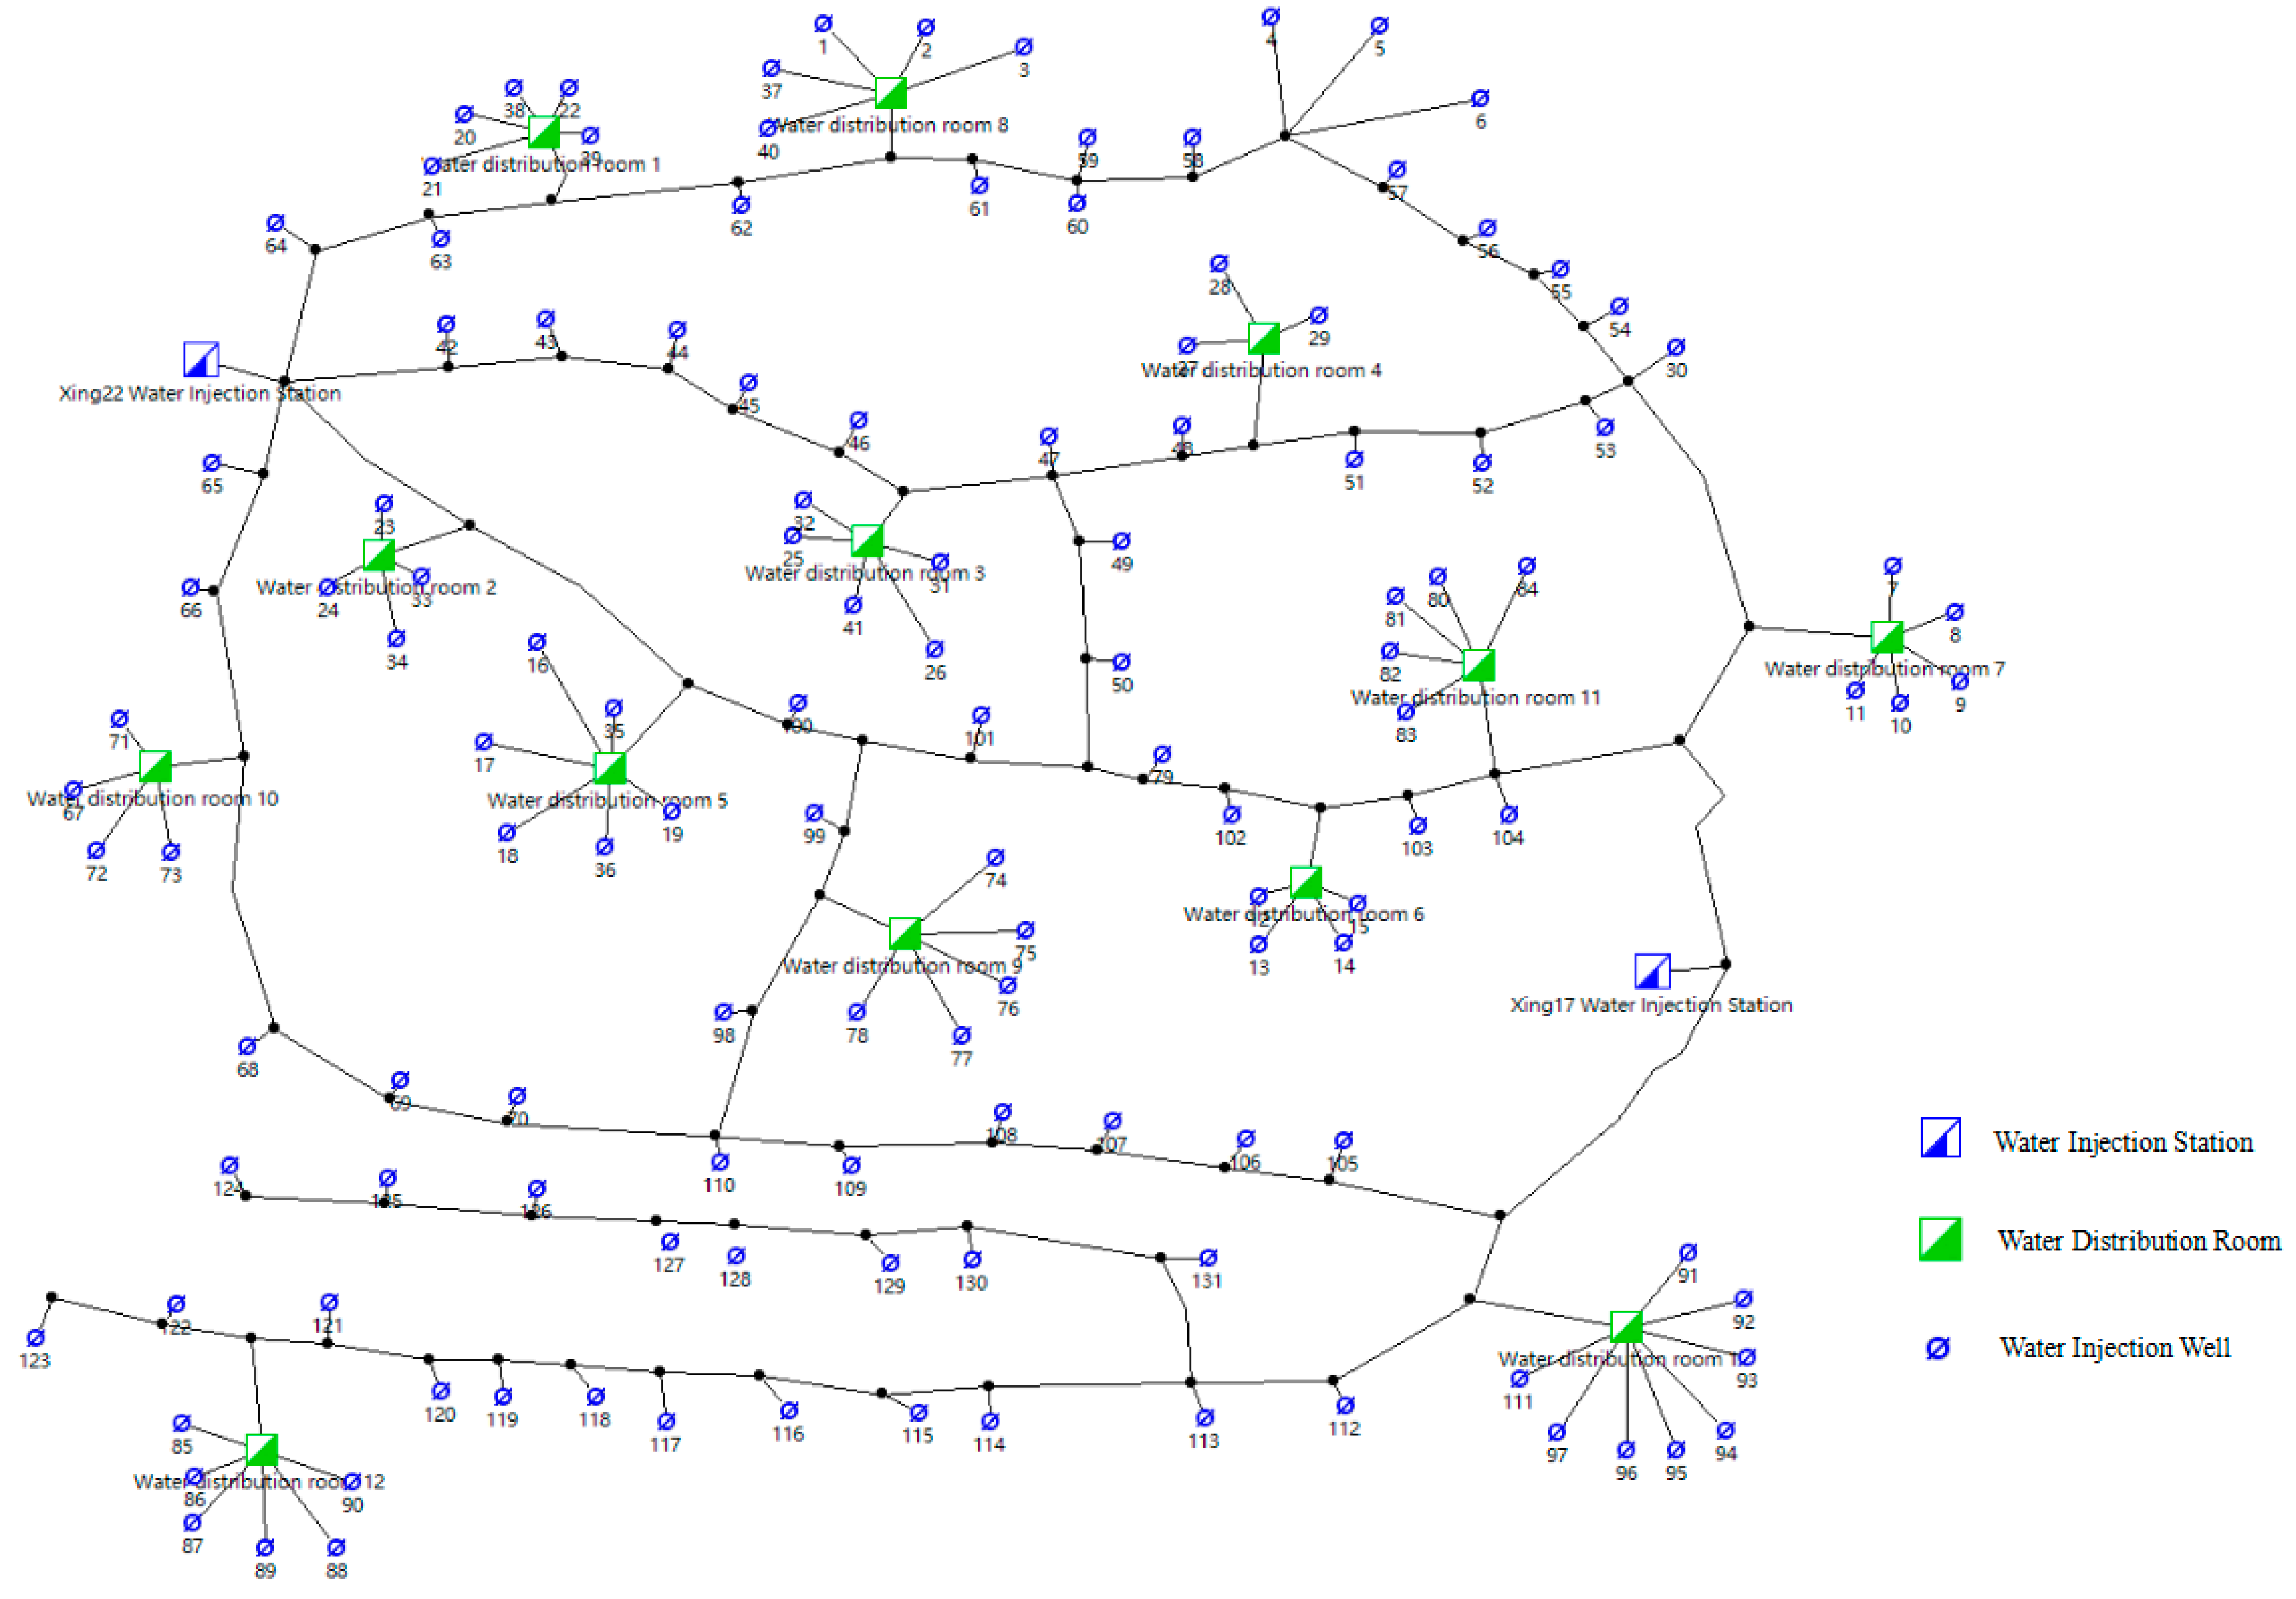
Taking the water injection pipeline network in a certain section of Q oilfield as an example, there are 2 water injection stations, 131 water injection wells, 13 water distribution rooms, and 231 pipelines. The network topology structure is shown in
Figure 7. Two water injection stations are equipped with four water injection pumps, with specifications listed in
Table 4. The total required flow rate of the water injection system is 31,443
.
In order to verify the calculation accuracy, the operating parameters of 131 injection wells under actual working conditions were obtained. The demand wellhead flow rate for 131 wells is between 127 (
/d) and 264 (
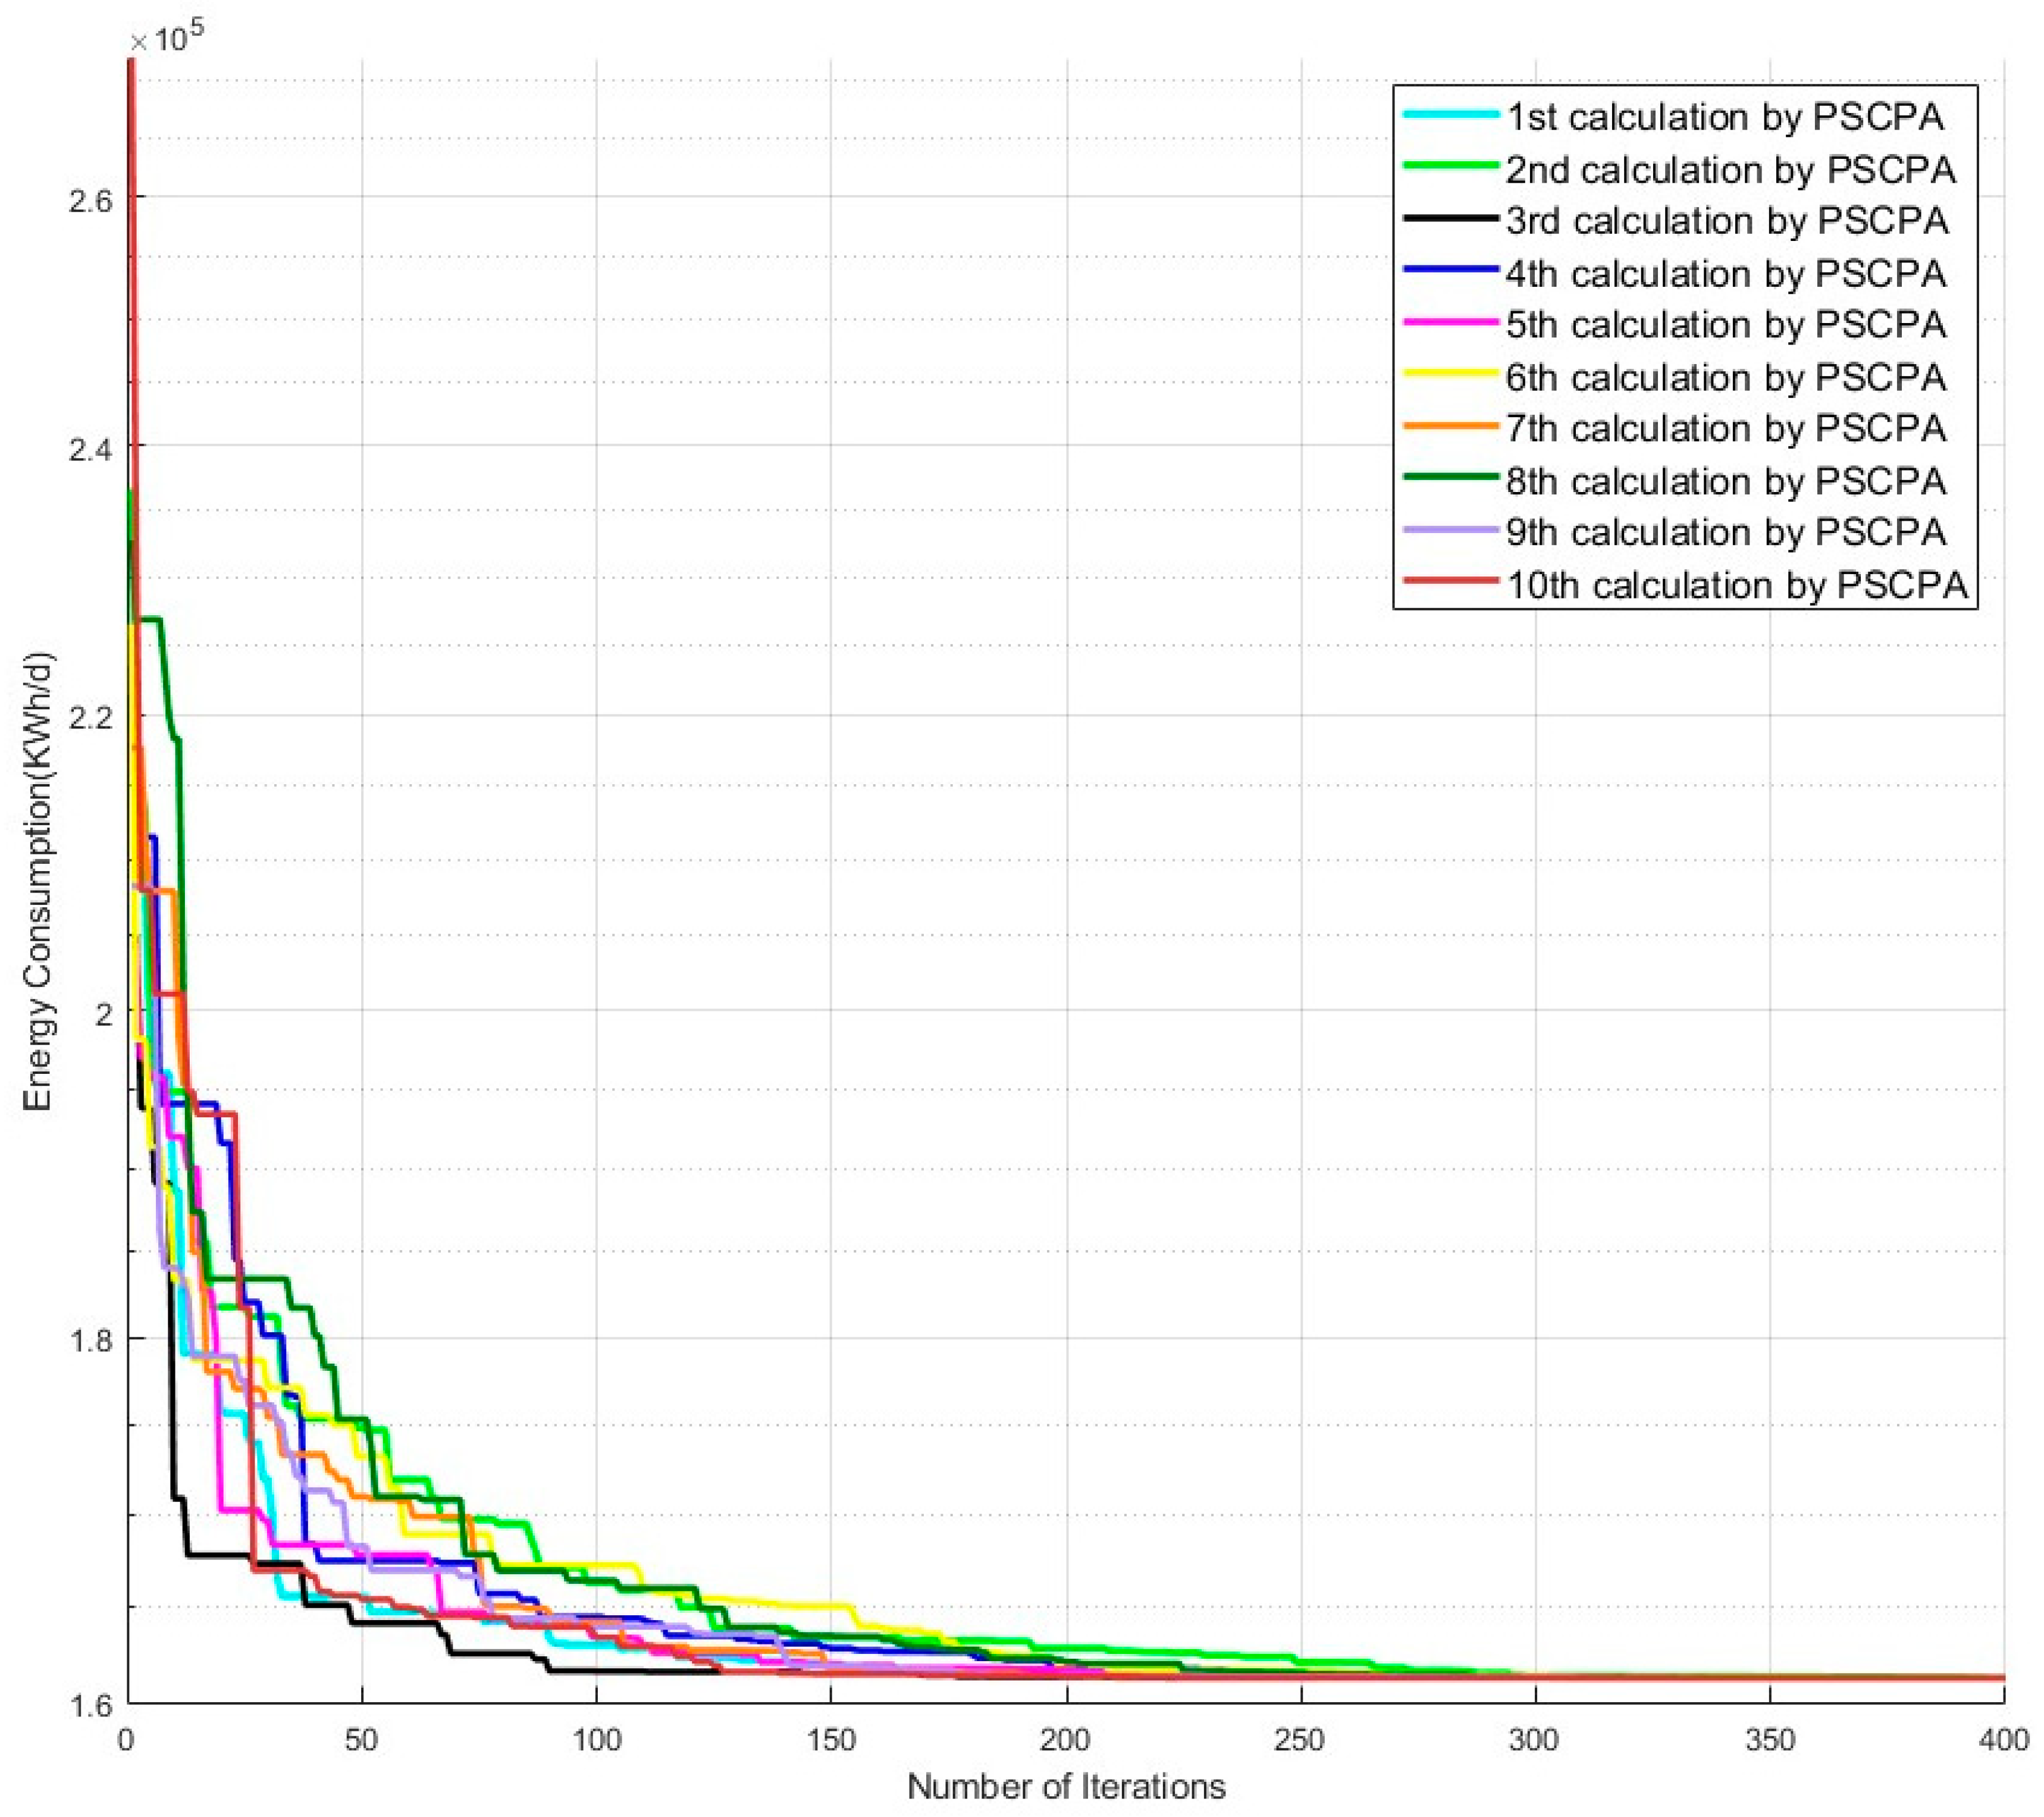
/d), and the demand wellhead pressure range for 131 wells is 12.1 (Mpa) to 13.6 (Mpa). The PSCPA was selected to solve the optimal parameter scheme for the water injection system. The case was solved 10 times by the PSCPA, and the results are shown in
Figure 8. A comparison of the operating parameter schemes for the water injection system before and after optimization is shown in
Table 5. It can be seen from the table that under the same total water volume and number of pumps opened, the optimized water injection system reduces power consumption by 11,719.23 KWh/d, improves the average pump efficiency of the system to 88.89%, and reduces system unit consumption by 0.37 KWh/
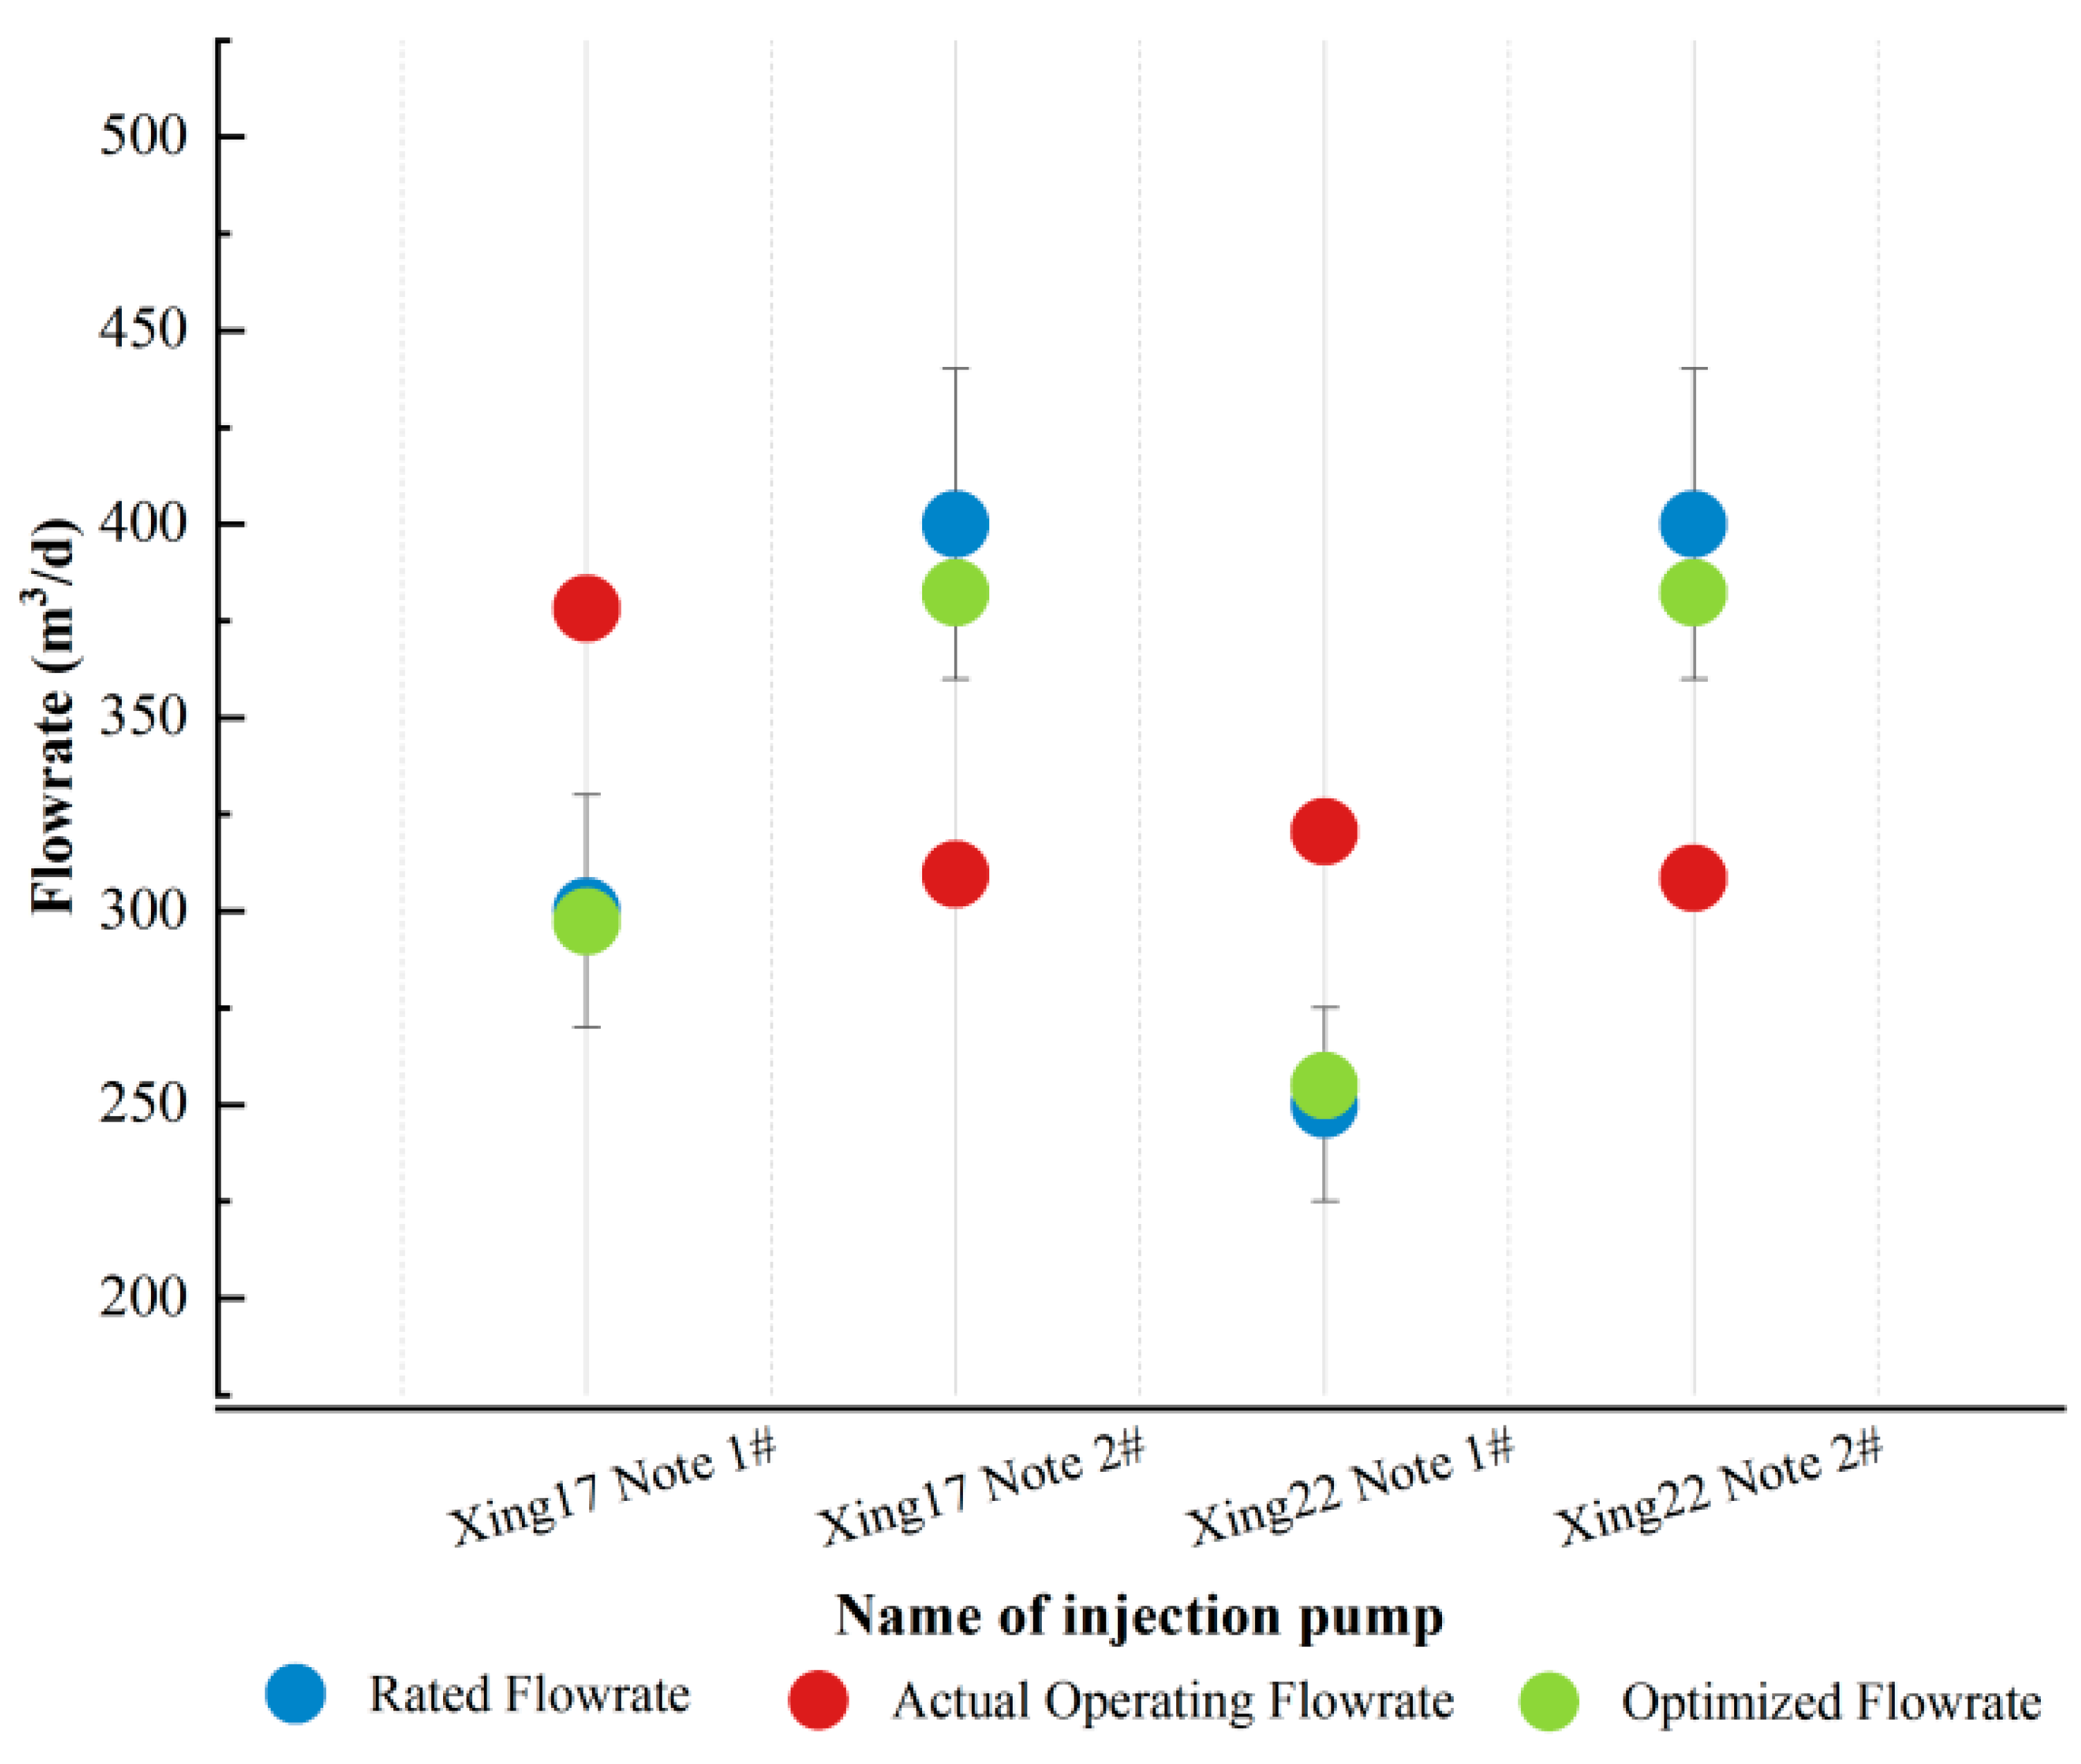
. The optimization results of the water injection pump flow rate are shown in
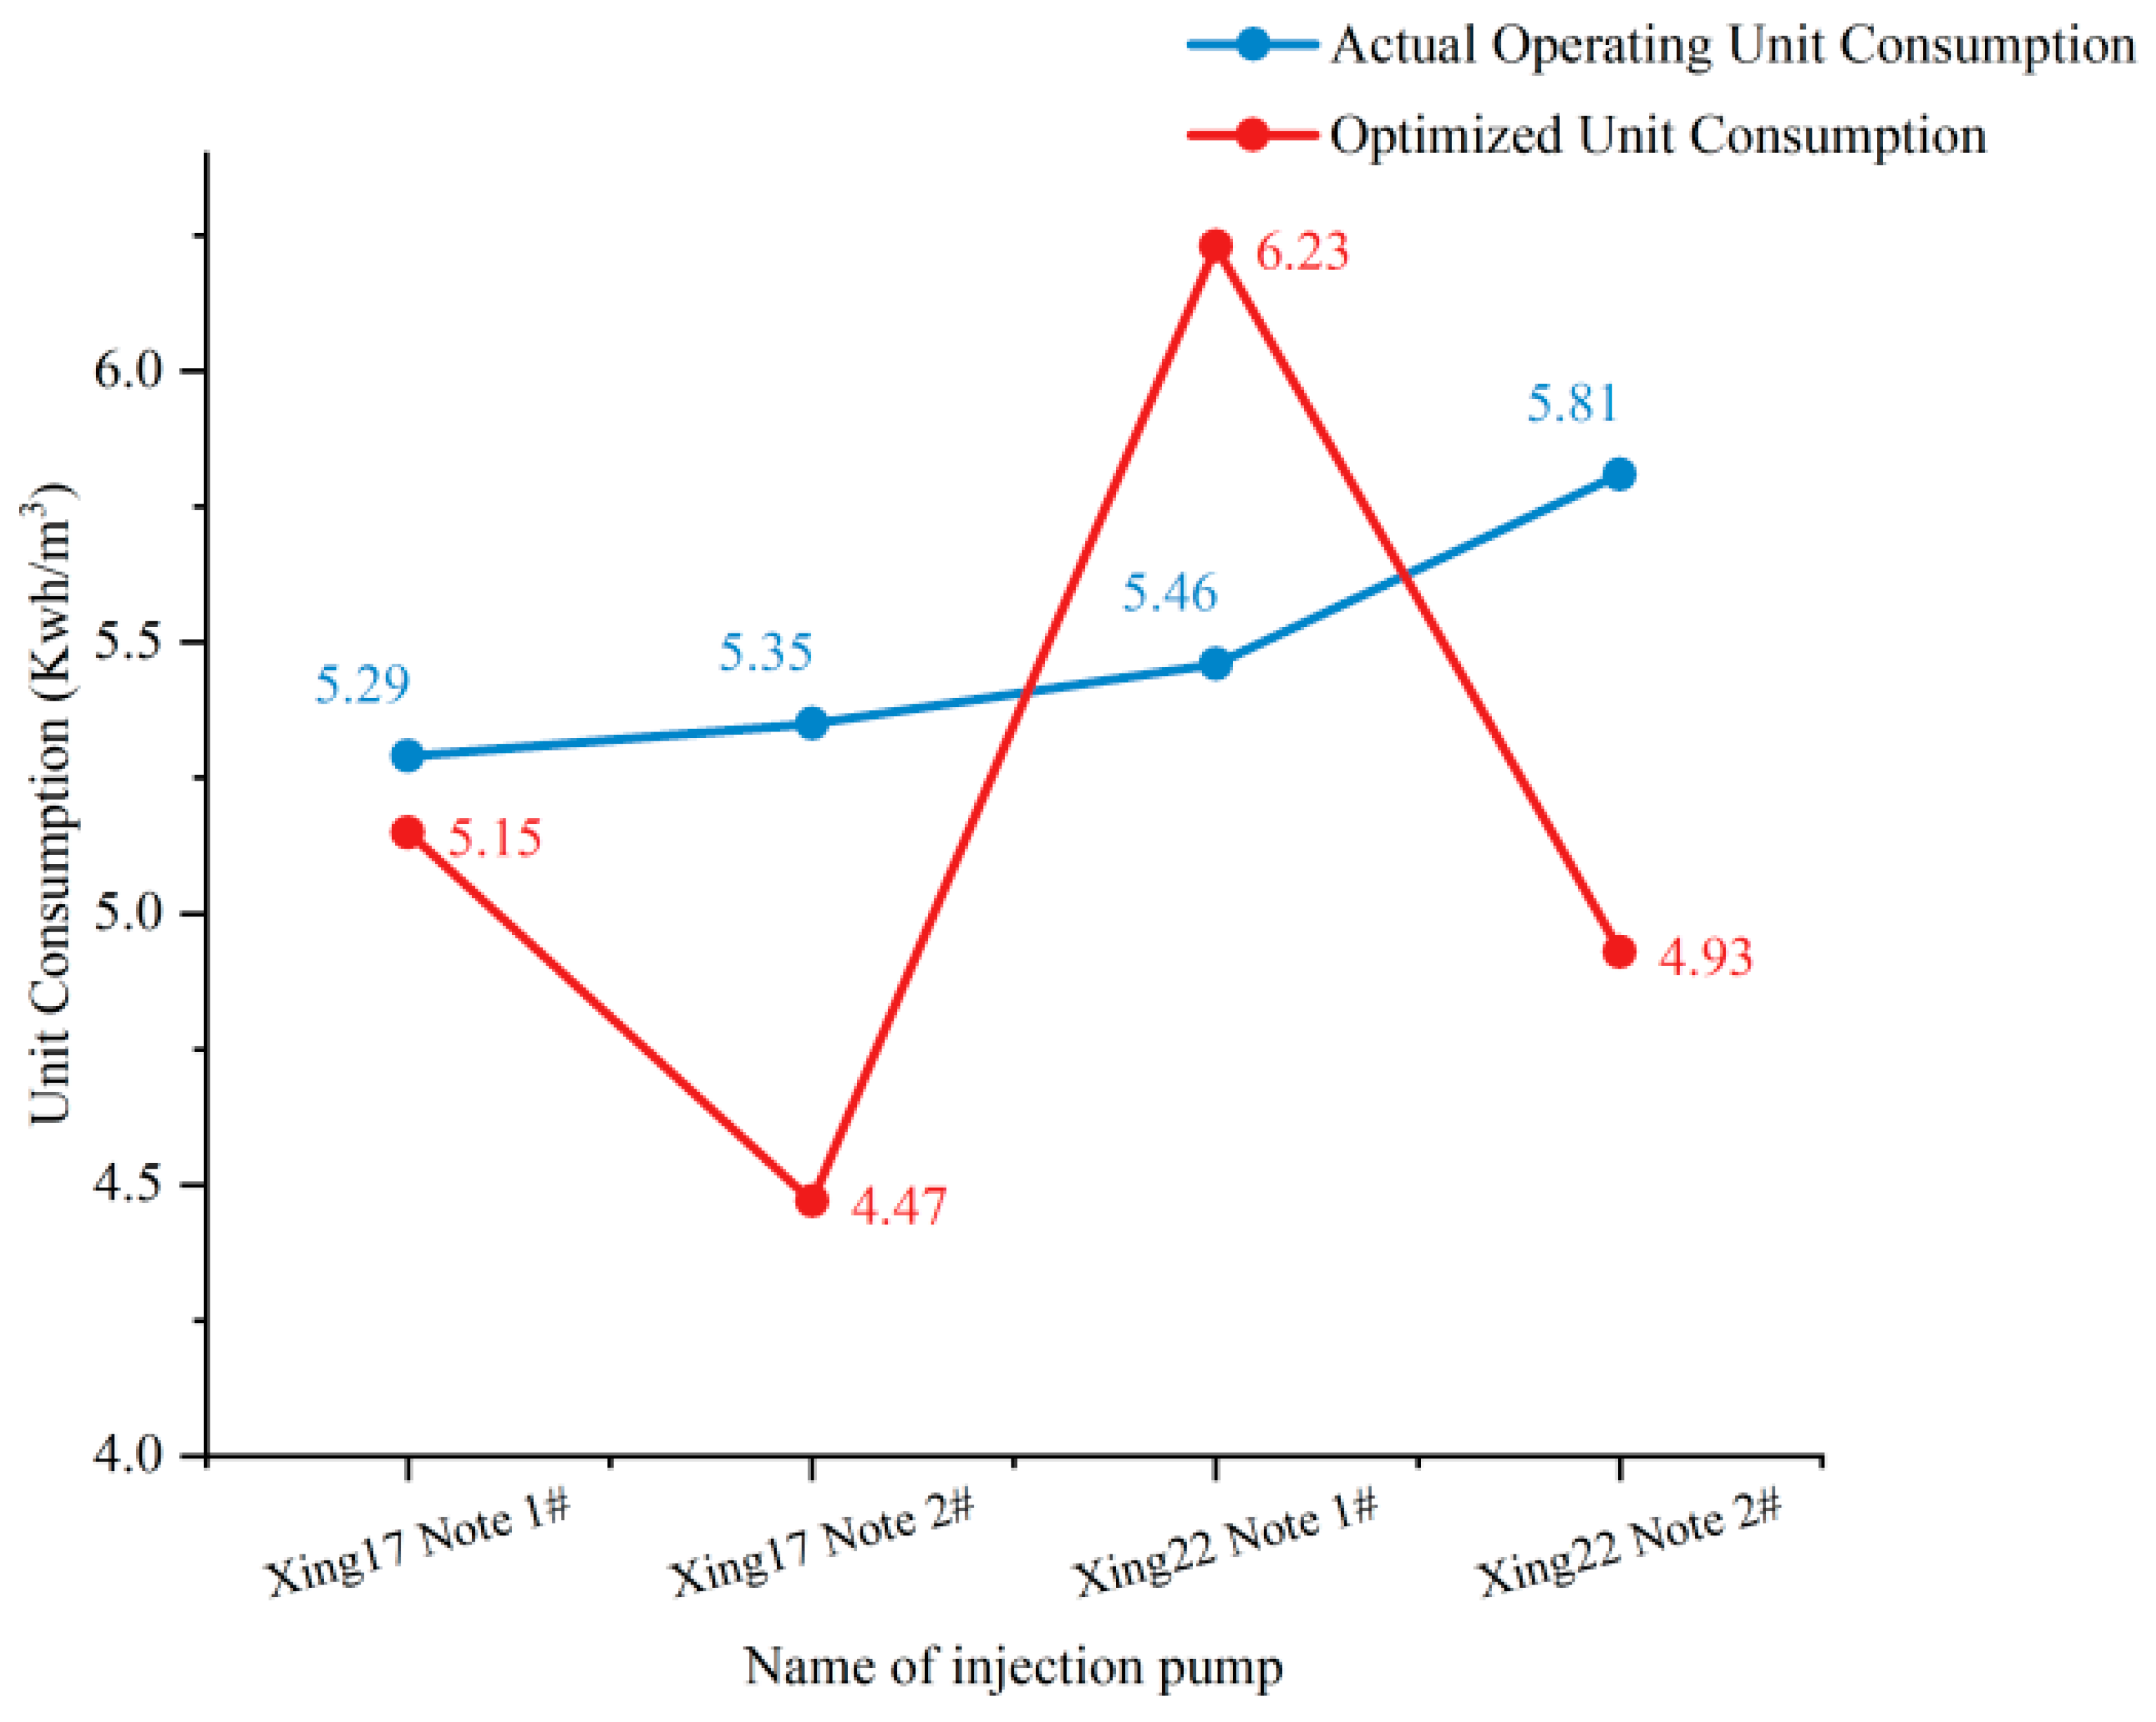
Figure 9. It can be seen from the figure that the deviation between the actual operating flow rate and the rated flow rate of the pump is greater than 10%, and the deviation between the optimized flow rate and the rated flow rate is less than 5%. The optimized accuracy is higher and meets the on-site hydraulic requirements. The optimized water injection pump unit consumption is shown in
Figure 10. From the graph, it can be seen that the optimized pump unit consumption of three pumps is lower than the actual operating pump unit consumption. Due to the algorithm selecting the situation with the lowest energy consumption under the current connection, there may be individual water injection pumps with higher unit consumption than before optimization. Based on this situation, the optimized unit consumption of Xing22 Note 1 # is 0.77 KWh/
higher than the actual operating unit consumption, but the final optimized total unit consumption of water injection pumps (20.78 KWh/
) is still better than the actual operating unit consumption of water injection pumps (21.91 KWh/
), which proves that the fluctuation is reasonable and reduces energy consumption while minimizing flow rate deviation. By adjusting and optimizing the pressure of the injection well, as shown in
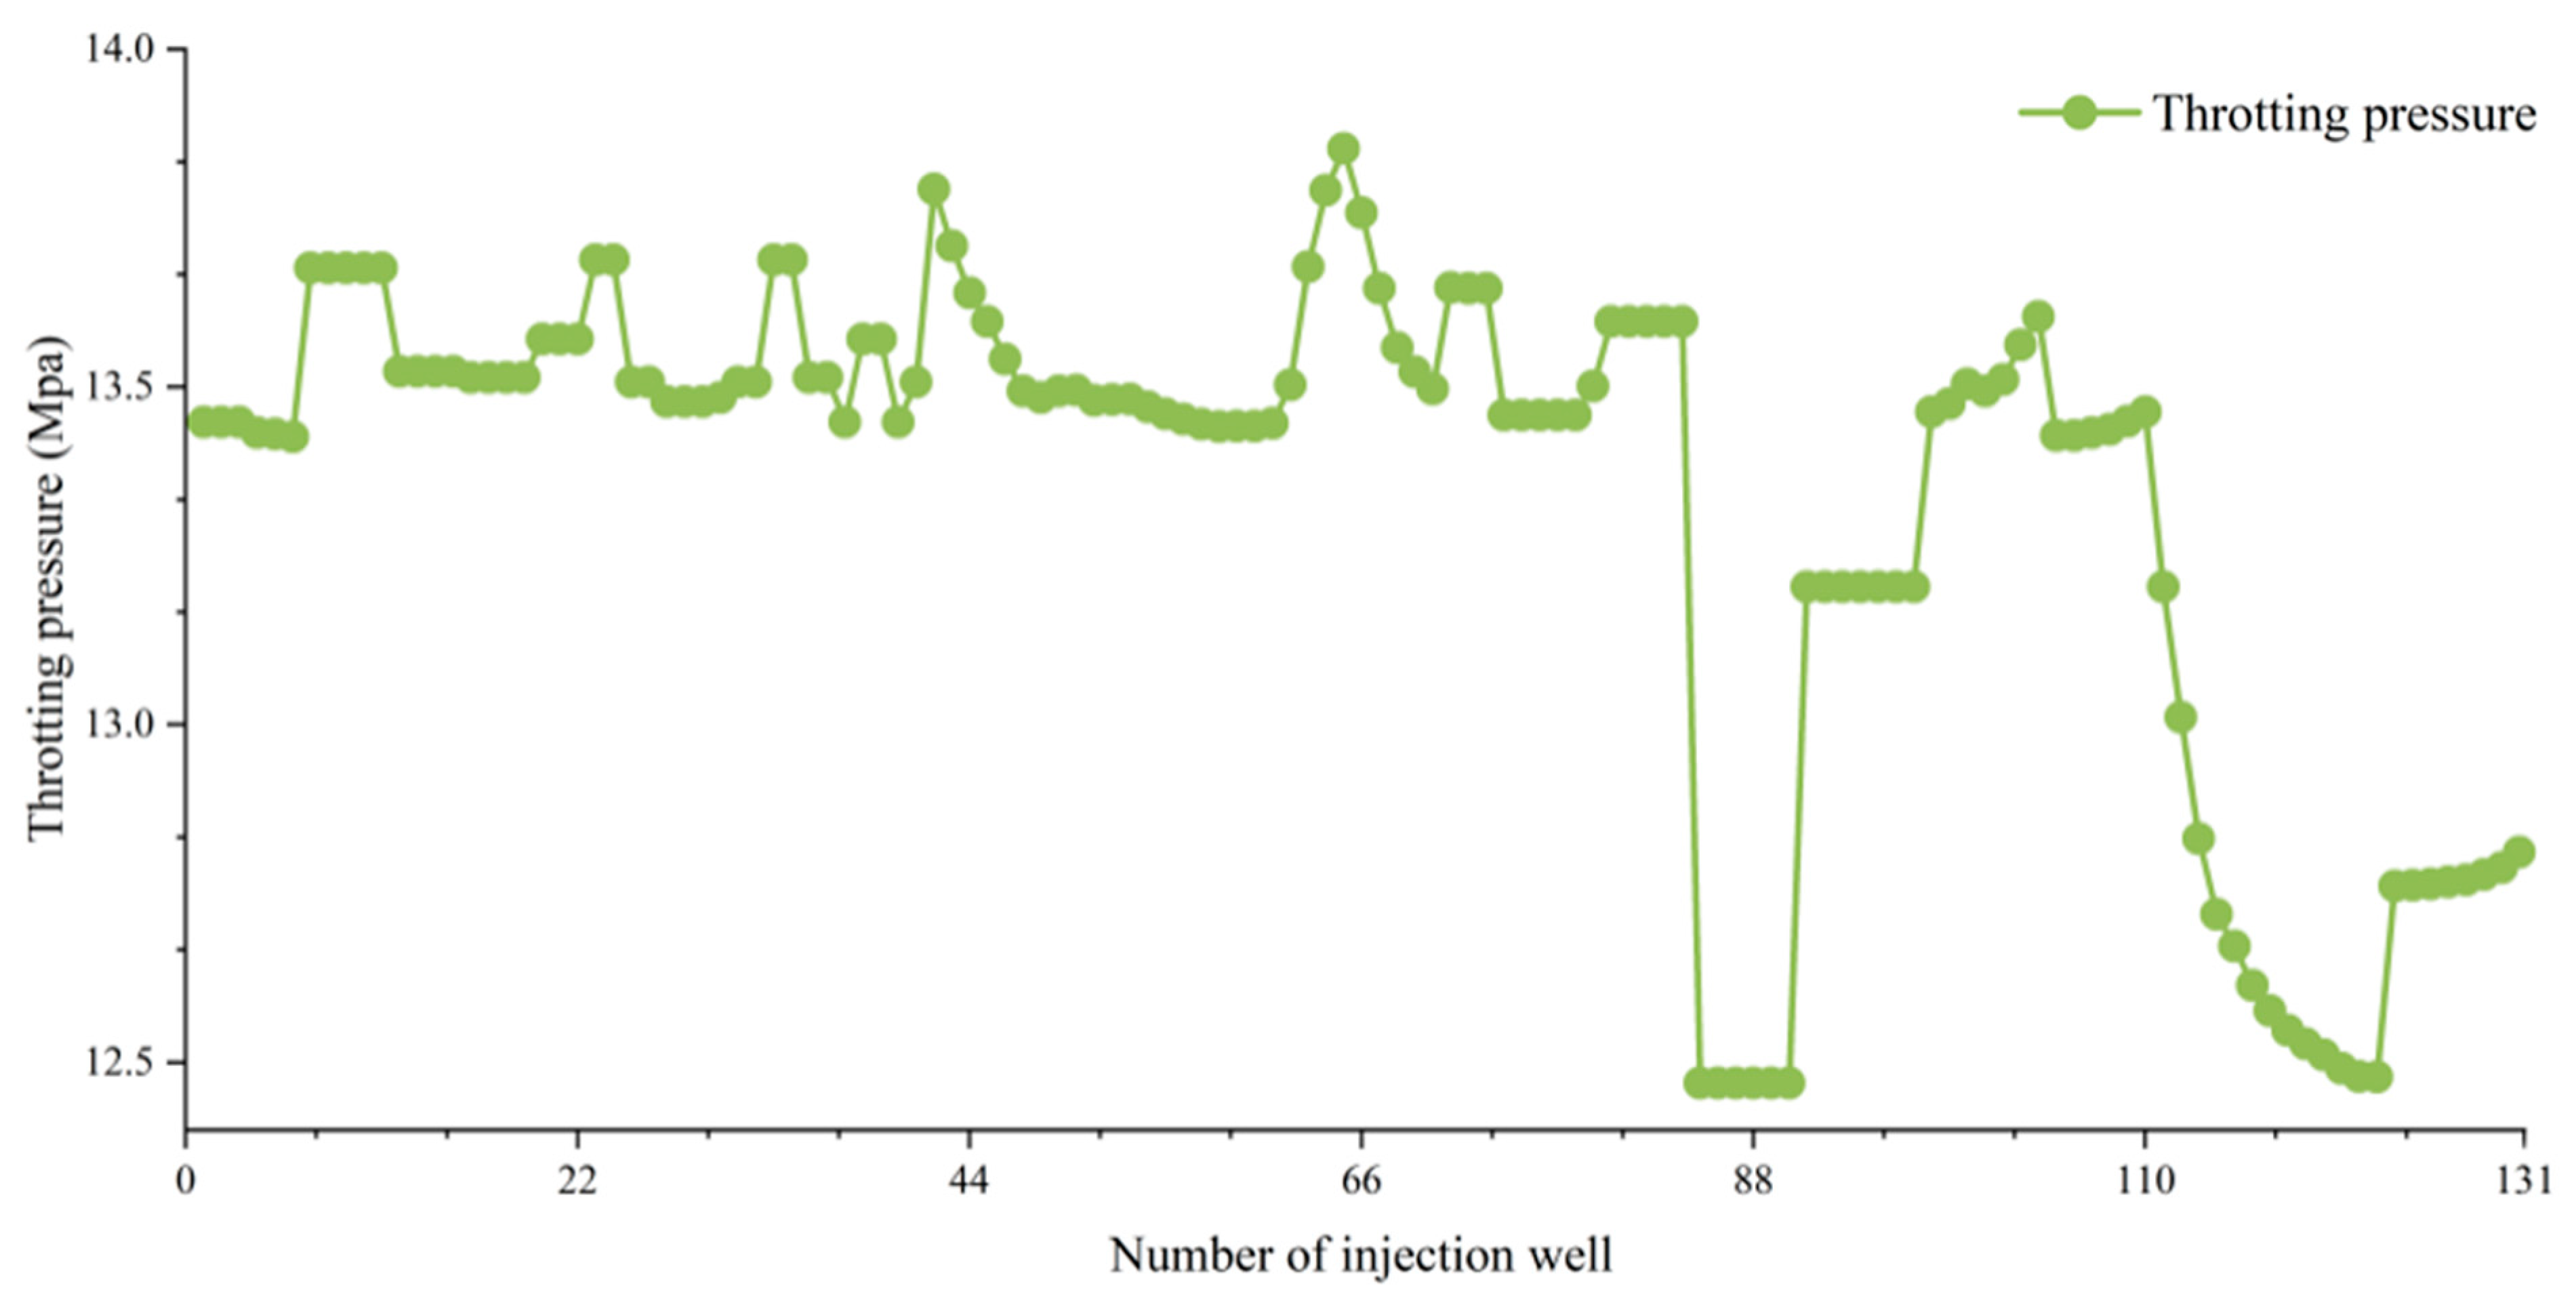
Figure 11, it can be seen that the deviation between the optimized wellhead pressure and the actual wellhead pressure (13 Mpa) is less than 5%, which is within a reasonable range. From the above figure and table, it can be seen that the final optimization results meet the on-site requirements, and all wells meet the required flow rate.
8. Discussions
This study proposes a novel hybrid Particle Swarm Optimization Algorithm (Hybrid Particle Swarm–Crested Porcupine Algorithm) for optimizing the operating parameters scheme of the ring-type water injection pipeline network. The research results indicate that this method can significantly reduce system energy consumption and improve average pump efficiency without increasing additional equipment and pipeline renovation investment.
The existing research mainly focuses on the model establishment, structural adjustment, or long-term planning of the water injection pipeline network. For example, Zhou et al. [
7] proposed a mixed-integer linear programming model, but the calculation of pressure in the water injection pipeline was simplified in the model design, which would result in a loss of calculation accuracy. However, the model proposed in this paper is a nonlinear hydraulic calculation model based on the water injection pipeline flow, which is a mixed-integer linear programming model. This model does not simplify the calculation of pressure in the water injection pipeline. Therefore, the proposed model can relatively more accurately reproduce the actual on-site situation of the water injection pipeline network.
White et al. [
31] analyzed the hydraulic performance of Aramco’s water injection pipeline network and found that energy savings of approximately 15% can be achieved by increasing pipeline diameter, improving mainline circulation, or reducing pump outlet pressure. However, these optimization measures rely on expensive infrastructure upgrades. In contrast, the optimization method proposed in this study does not require renovation of the existing pipeline network but achieves energy savings by adjusting the operable parameters of existing equipment, providing a “low-renovation-cost” optimization path for oilfield water injection systems.
In addition, Xie et al. [
32] proposed a multi-stage MINLP model to optimize the expansion and scheduling of the water injection pipeline network, achieving a cost reduction of approximately 14.6%. However, their research focuses on long-term capacity planning rather than daily operational optimization. Our research focuses on the daily operation optimization of the ring-type water injection pipeline network, which is relatively less discussed in the existing literature. The optimization results of the water injection pipeline network obtained through our method can be directly implemented in the existing water injection network, providing an immediately feasible solution for the oilfield.
Bai et al. [
33] achieved an energy consumption reduction of over 8% by integrating the Injection–Reservoir–Production (I-R-P) system into the energy consumption model. Their research emphasizes the value of cross domain coupling, but does not delve into the optimization problem of the ring-type water injection pipeline network. In contrast, our research has made a unique contribution to the optimization problem of the ring-type water injection pipeline network, especially in solving the complex hydraulic feedback problem of the ring-type water injection pipeline network. The complexity of a ring-type water injection pipeline network lies in the fact that the hydraulic regulation of a station will propagate and feedback throughout the entire cycle. Therefore, the optimization problem of the ring-type water injection pipeline network is more challenging. The hybrid Particle Swarm Optimization Algorithm proposed in this study has been validated by the standard test benchmark function of the IEEE CEC 2017 competition, demonstrating excellent convergence and solution accuracy. It can effectively address this challenge and provide new ideas for optimizing the ring-type water injection pipeline network.
In addition, this study successfully applied the algorithm to a large-scale actual water injection system in 131 wells, and the results showed a 6.8% reduction in system energy consumption and a 9.3% increase in average pump efficiency. This method not only reduces the energy consumption of the system, but also effectively reduces valve throttling and pressure fluctuations, improves the pressure stability of the entire pipeline network, and further enhances the stability and efficiency of the system. In mature oilfields, the water injection system is often one of the units with the highest electricity consumption, and these improvements are of great significance for the sustainable development of the oilfield.
In summary, this study not only proposes optimization methods for the daily operation of the ring-type water injection pipeline network, but also proposes a new hybrid Particle Swarm Optimization Algorithm, which provides an effective tool for solving high-dimensional optimization problems. At the same time, the innovation of this study in optimizing oilfield water injection systems provides valuable supplements to the existing literature, especially in terms of low renovation cost and optimization of the ring-type water injection pipeline network.
9. Conclusions
This article takes the operating parameters of the water injection pump as the design variables, considers multiple constraints such as the balance of supply and demand water in the station, pump displacement, and water injection well pressure, and establishes a mathematical model for optimizing the operating parameters of the oilfield water injection system with the goal of minimizing water injection energy consumption. This article proposes the Hybrid Particle Swarm–Crested Porcupine Algorithm (PSCPA), which uses the optimization solution process of the Particle Swarm Optimization Algorithm as the main framework. The four defense behaviors of the Crested Porcupine Optimizer (CPO) are used to dynamically adjust the and parameters of the Particle Swarm Optimization (PSO) Algorithm. A Multi-Mechanism Threat Response Strategy for Dynamic Parameter Adjustment is proposed, which maps the threat level assessment to the defense mechanism. The lower the threat level, the more likely the defense mechanism used is to perform global search. According to individual fitness, the individual fitness-influencing factor is designed to make secondary adjustments to individual particle parameters, so that particles with lower fitness have slower decay in exploration ability, ensuring population diversity. Analyzing the performance of the Hybrid Particle Swarm–Porcupine Algorithm (PSCPA), it was found that the fused algorithm has significantly improved both global search ability and local mining ability. By using this optimization algorithm to solve the mathematical model for optimizing the operating parameters of the oilfield water injection system, the optimal water injection scheme for the oilfield water injection system can be effectively determined based on the required flow rate.
This method has been successfully applied to large-scale real water injection systems in 131 wells. From the calculation results, it can be seen that under the condition of a certain total water volume and number of pumps, the optimized water injection system reduces energy consumption by about 6.8%, increases the average pump efficiency by about 9.3%, and the deviation between the optimized flow rate and the rated flow rate is less than 5%. The final optimization result meets the on-site requirements, and all wells meet the required flow rate.
In summary, energy conservation and optimization of the water injection system are not only effective means to enhance the economic benefits of the oilfield, but also an important way to promote the green and low-carbon transformation and sustainable development of the oilfield. This study provides a practical path for the oilfield to achieve energy conservation and consumption reduction while ensuring the demand for water injection development.
Despite these advances, our work has limitations. First, this article only focuses on the optimization solution of the surface water injection system scheme and does not take into account the situation of the underground water injection system due to the complexity of the internal structure of the formation. At present, there are few relevant studies that comprehensively consider underground and surface water injection systems. Therefore, in the future, the entire integrated system of surface and underground water injection systems will be taken into account, taking into account factors such as formation pressure, in order to optimize the water injection scheme in the surface water injection system. Second, the scalability of the algorithm for ultra-large-scale networks remains to be rigorously validated. Future work will focus on dynamic optimization and scalability to enhance the algorithm’s applicability across diverse oilfield settings.

