Life Cycle Assessment (LCA) and Life Cycle Cost (LCC) Analysis of Adhesives in Block-Glued Laminated Timber
Abstract
1. Introduction
2. Materials and Methods
- C0 is the initial capital cost (i.e., initial cost);
- Ct is the present value of all recurring costs (i.e., operation, maintenance, replacement, and disposal costs) in year t;
- t is the year of cash flow;
- i is the nominal discount rate;
- k is the inflation rate.
2.1. Goal and Scope Definition
2.2. Functional Unit
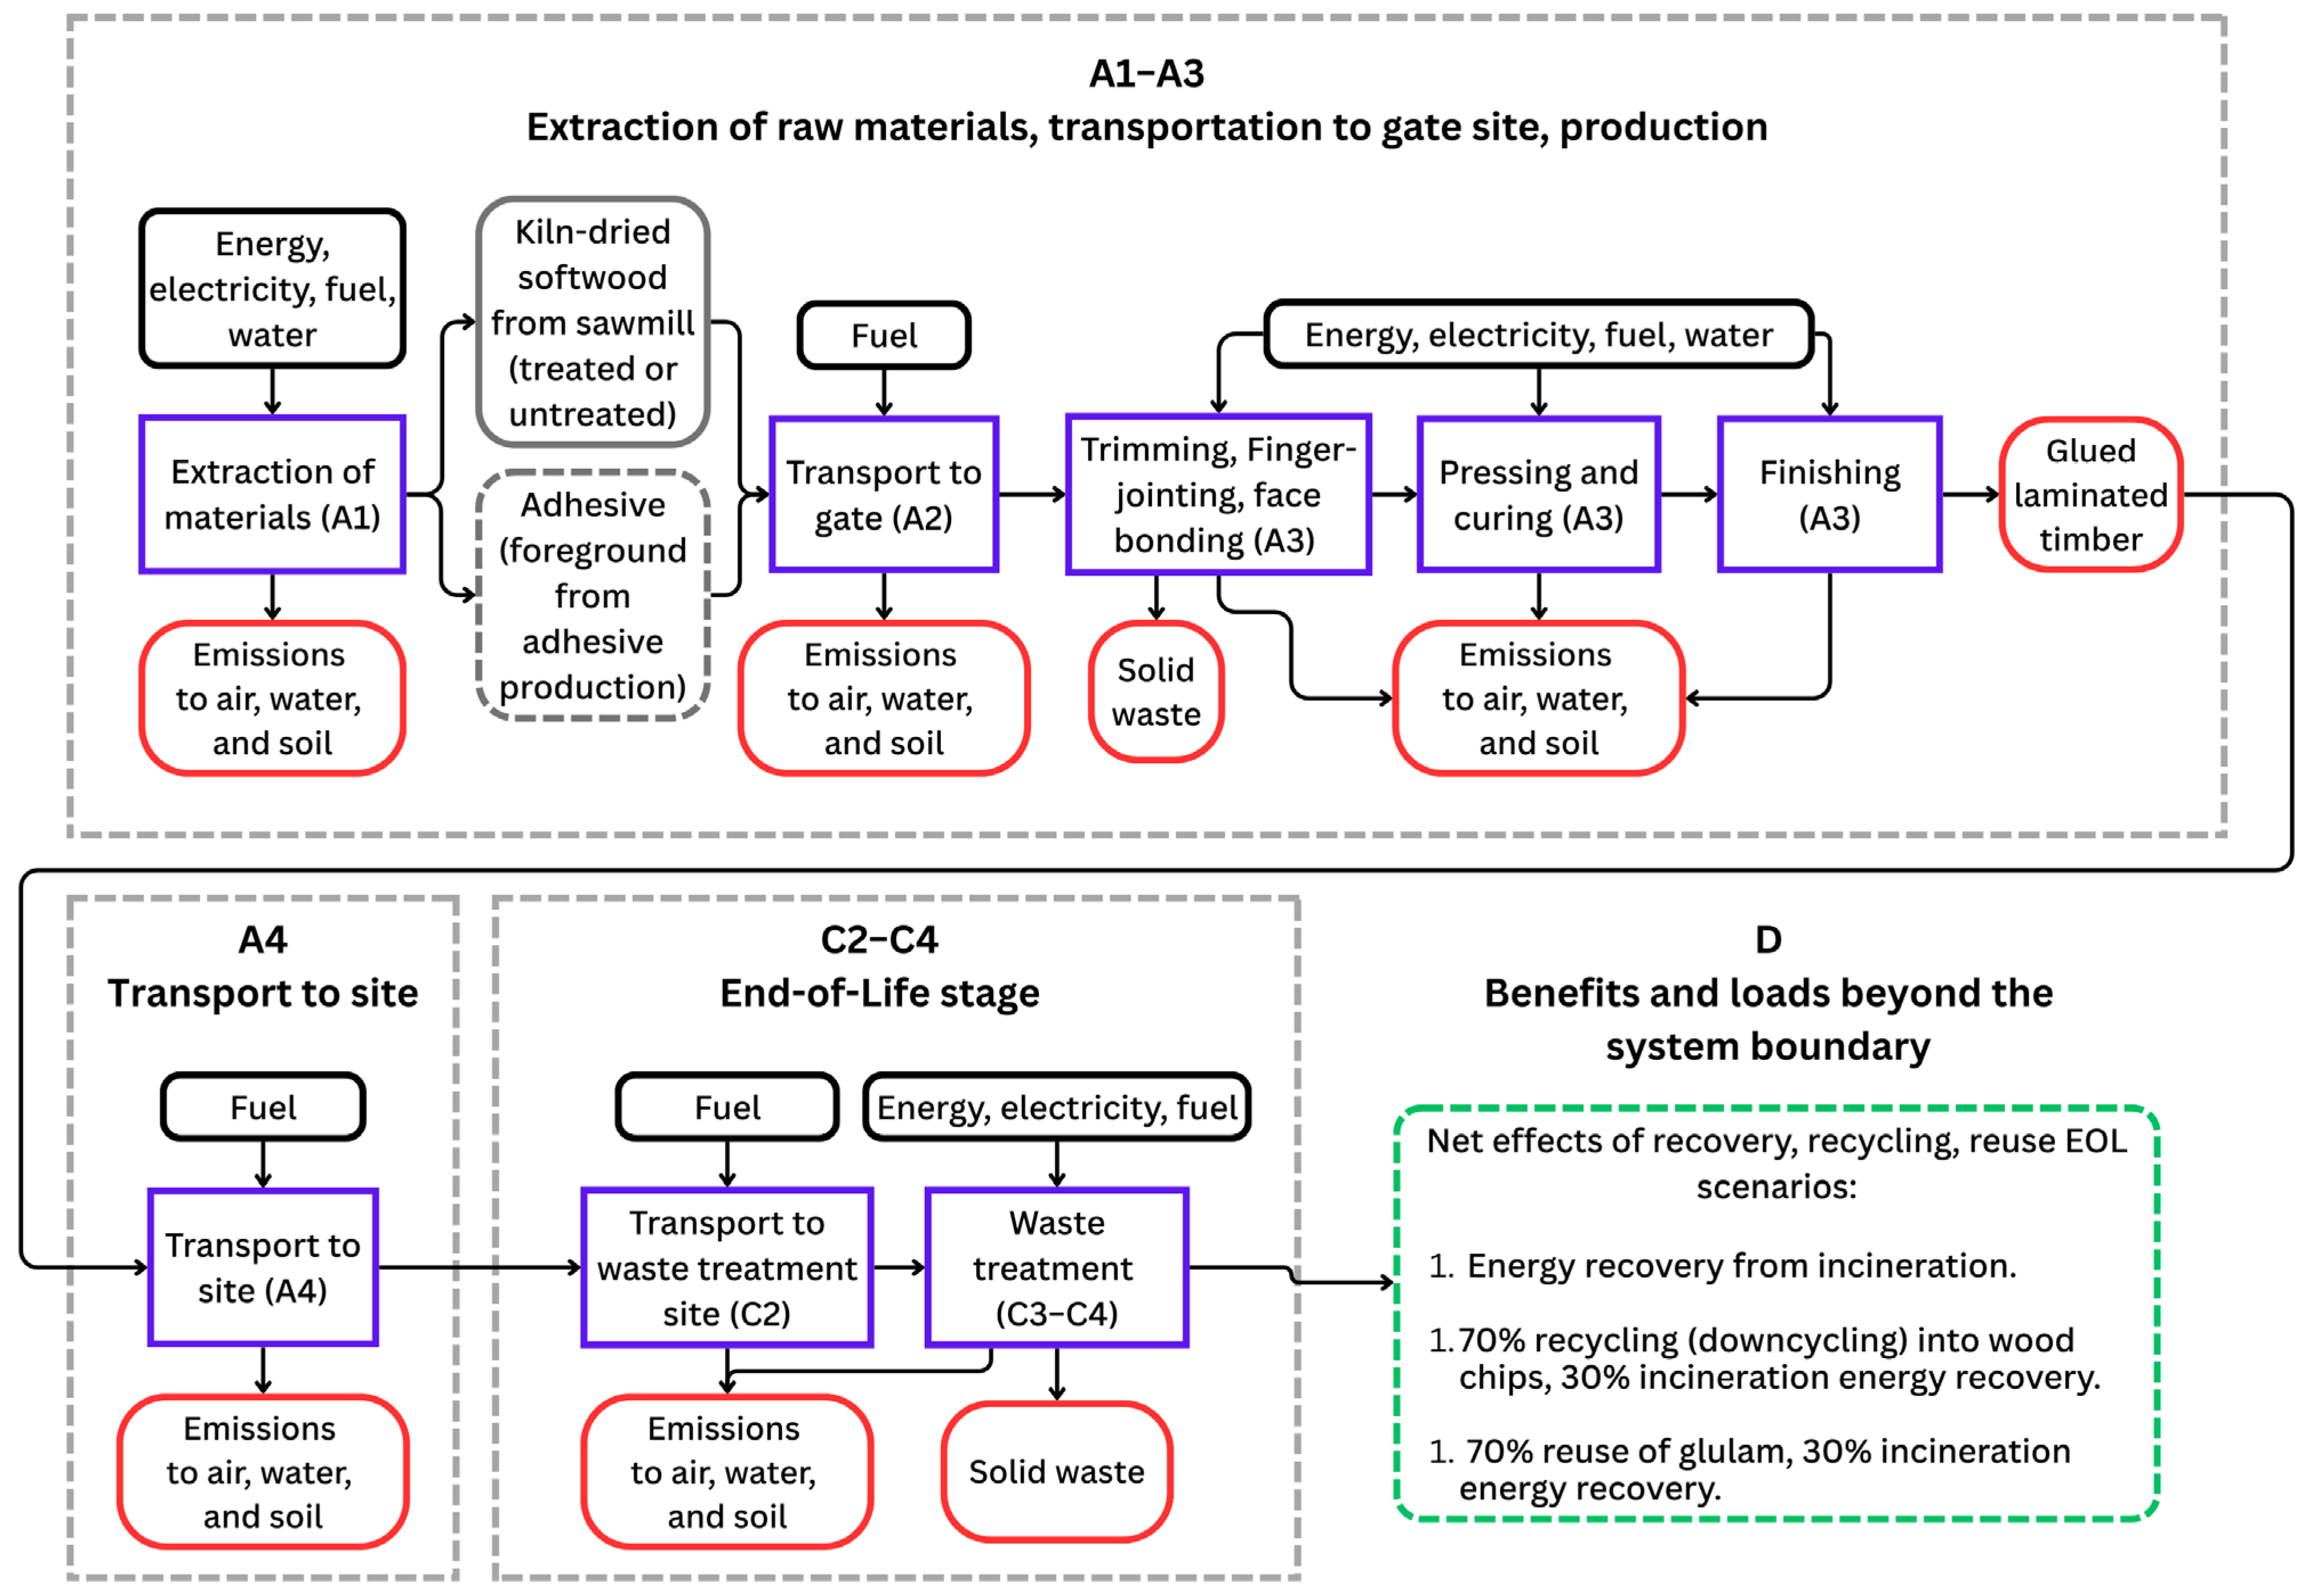
2.3. System Boundaries and Production System
2.3.1. Adhesive
2.3.2. Glued Laminated Timber (Glulam)
2.4. LCA Inventory
2.5. LCC Inventory
3. Results
3.1. Life Cycle Assessment (LCA) Findings
3.1.1. Environmental Impact Assessment per Adhesive
3.1.2. Comparison of 1 kg Adhesive
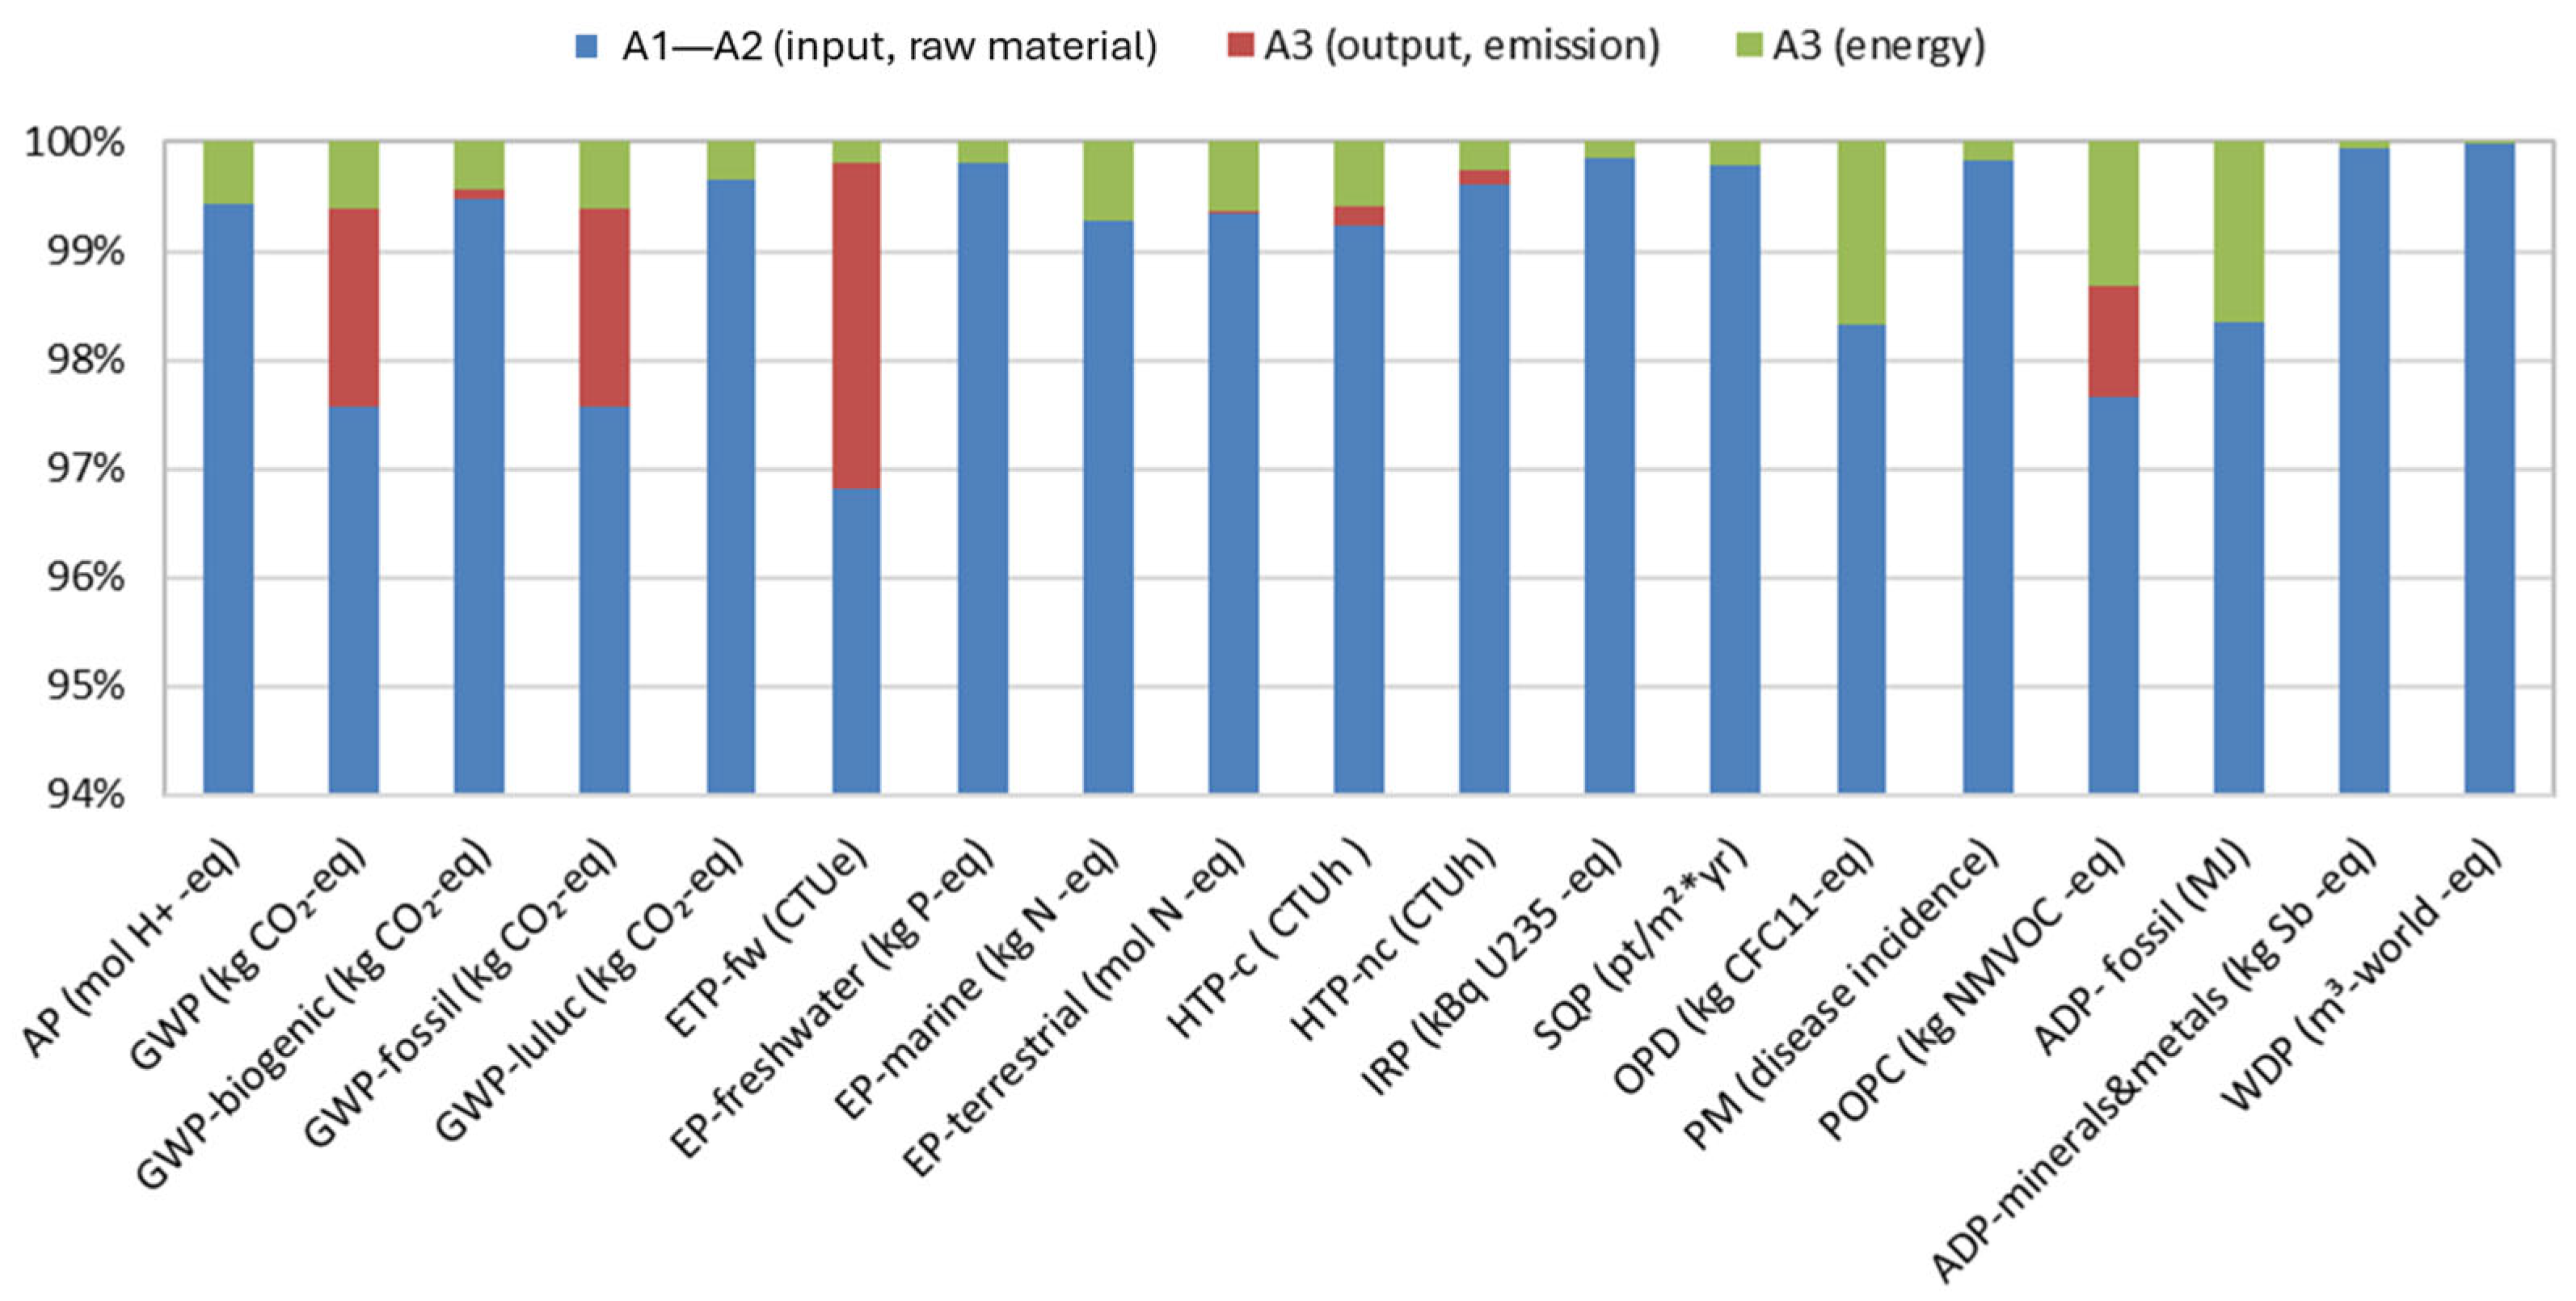
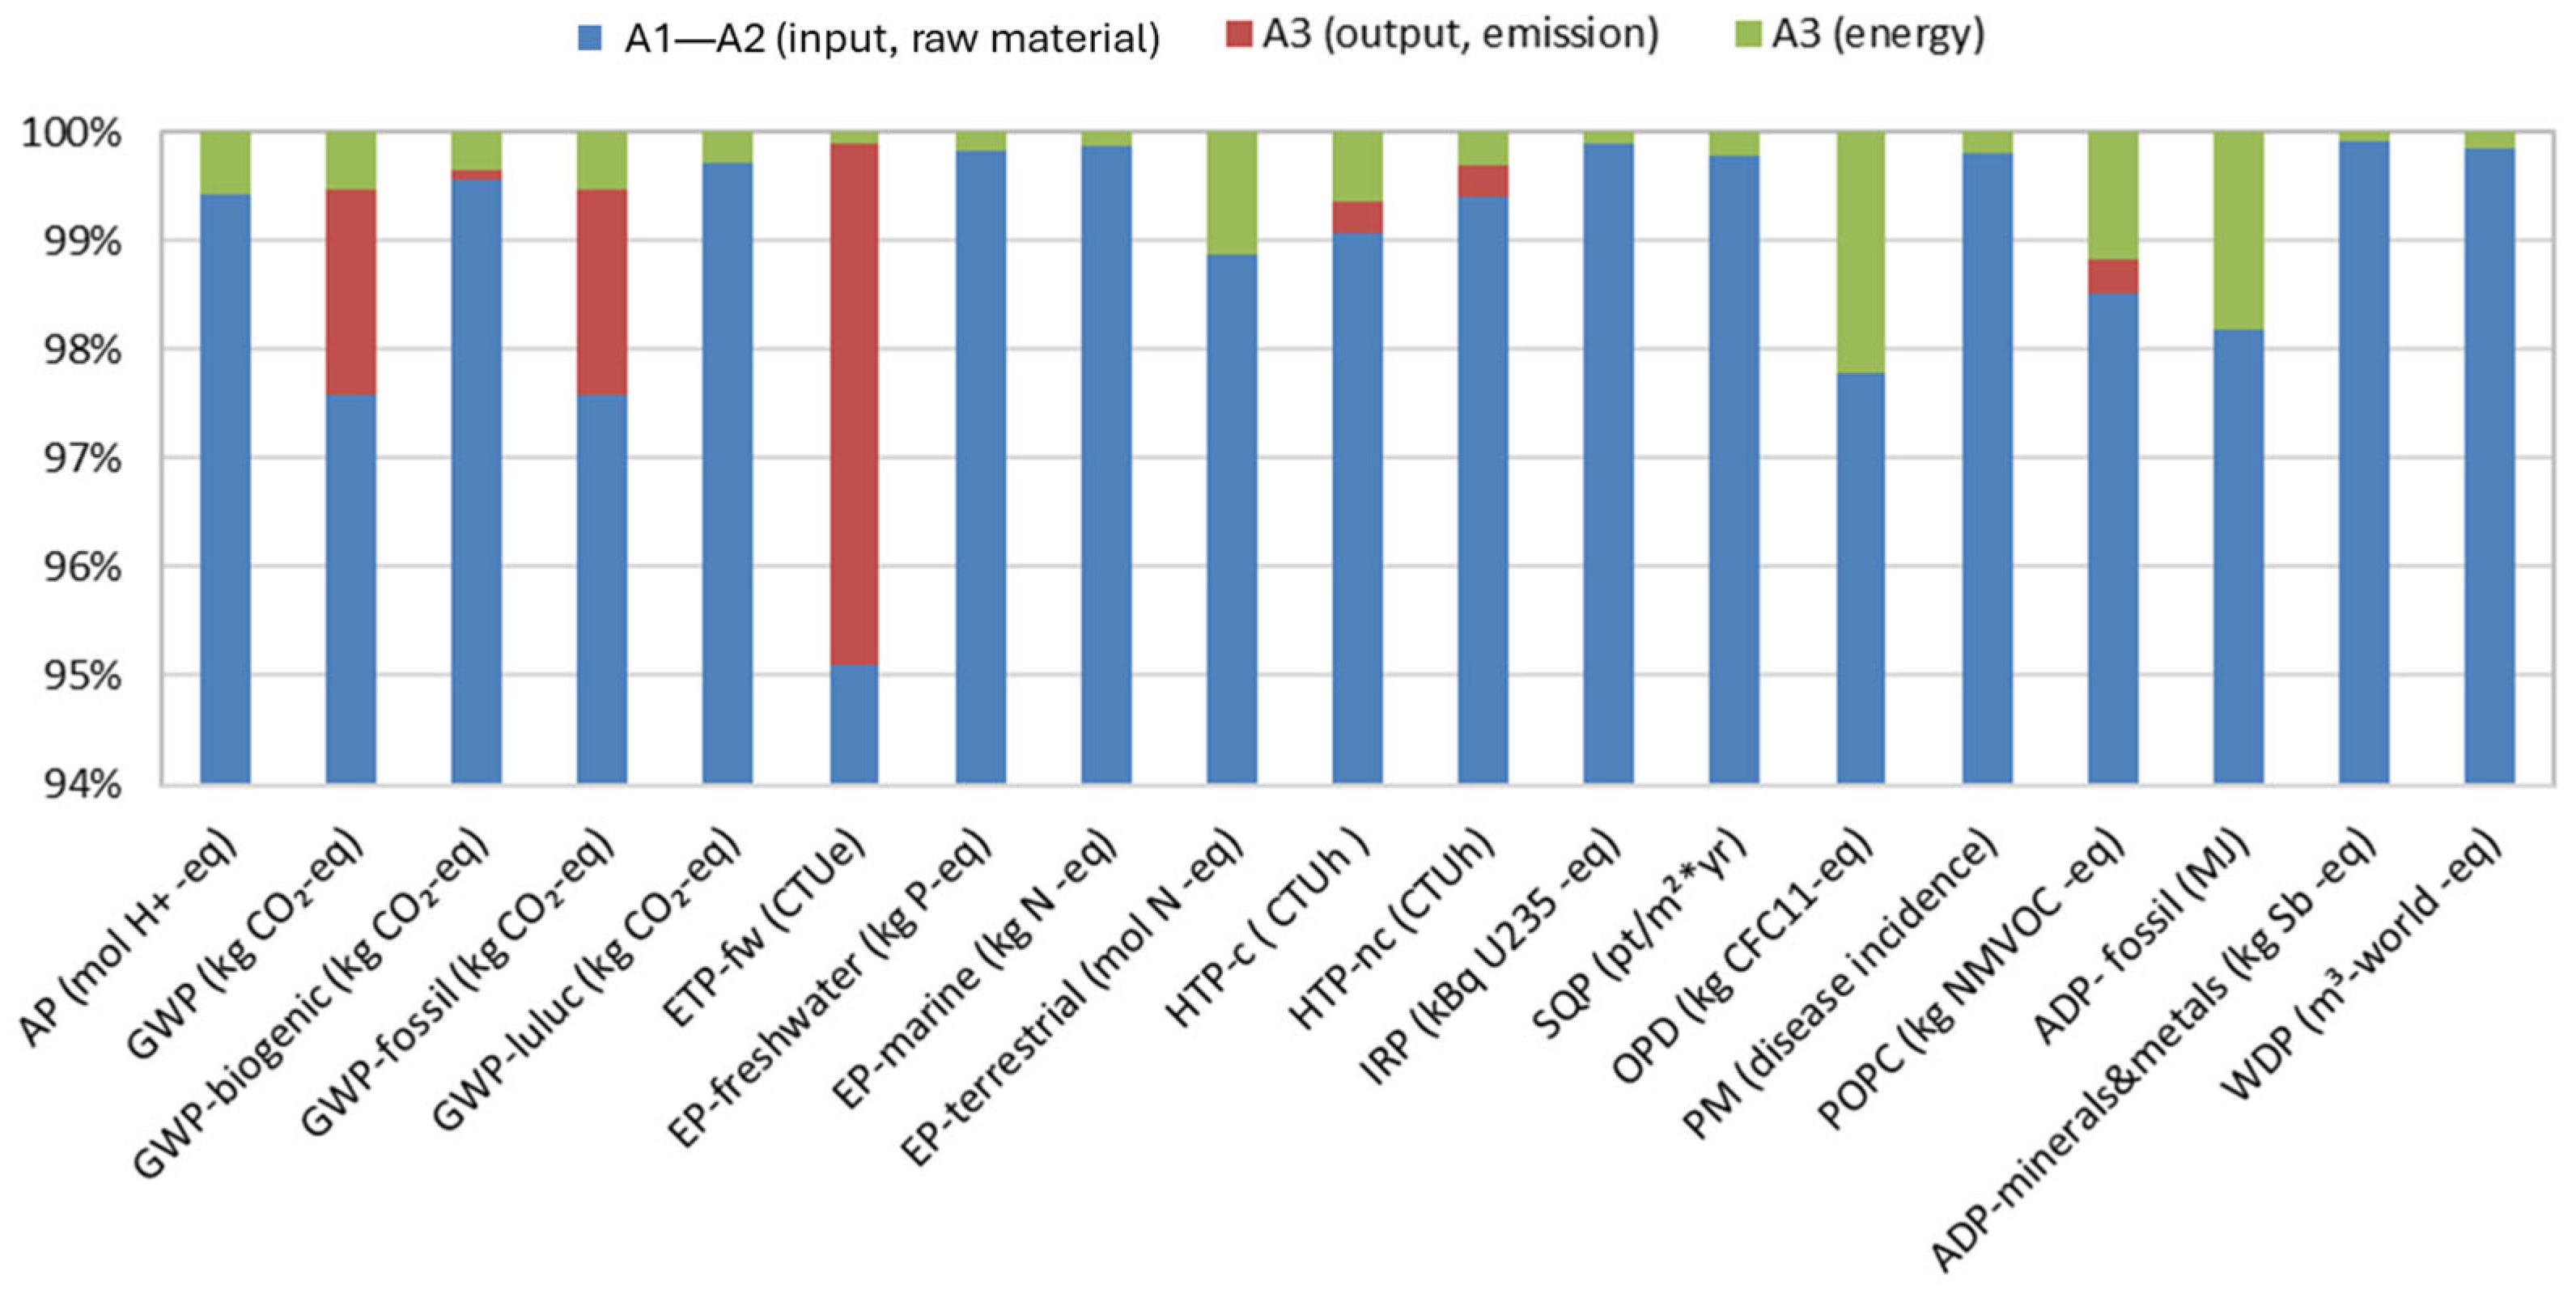
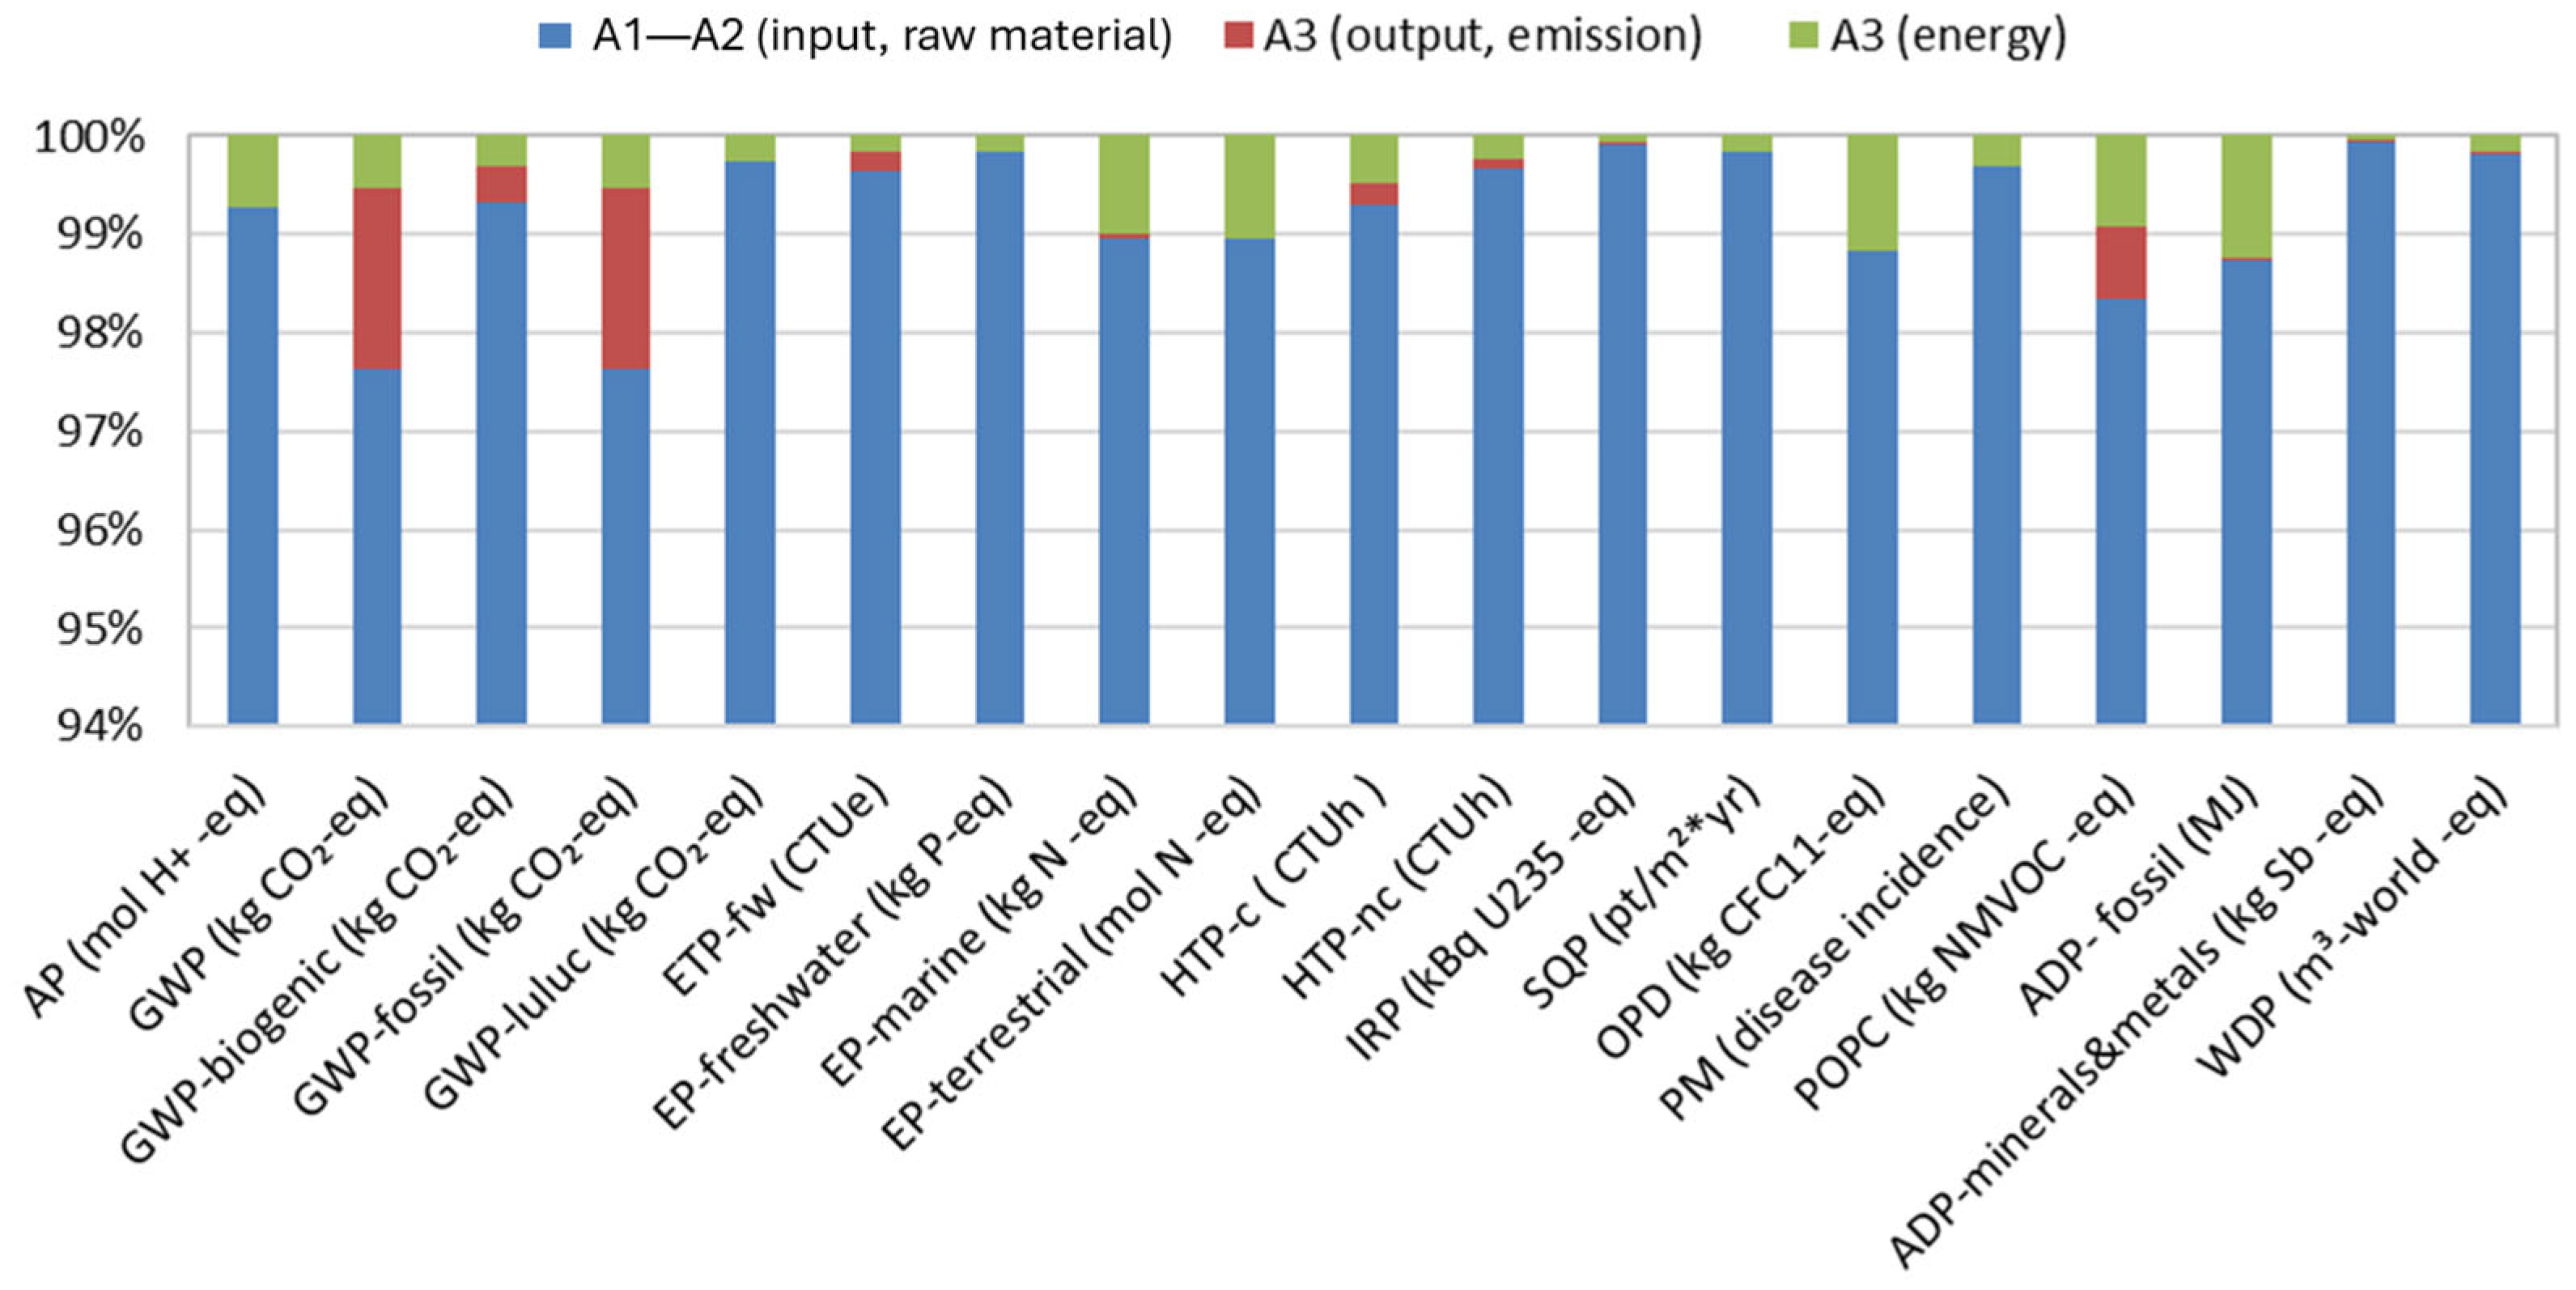
3.1.3. Environmental Impact Assessment of Glued Laminated Timber
3.1.4. Sensitivity Analysis
3.2. Life Cycle Cost (LCC) Analysis Findings
4. Discussion
Limitations and Recommendations
5. Conclusions
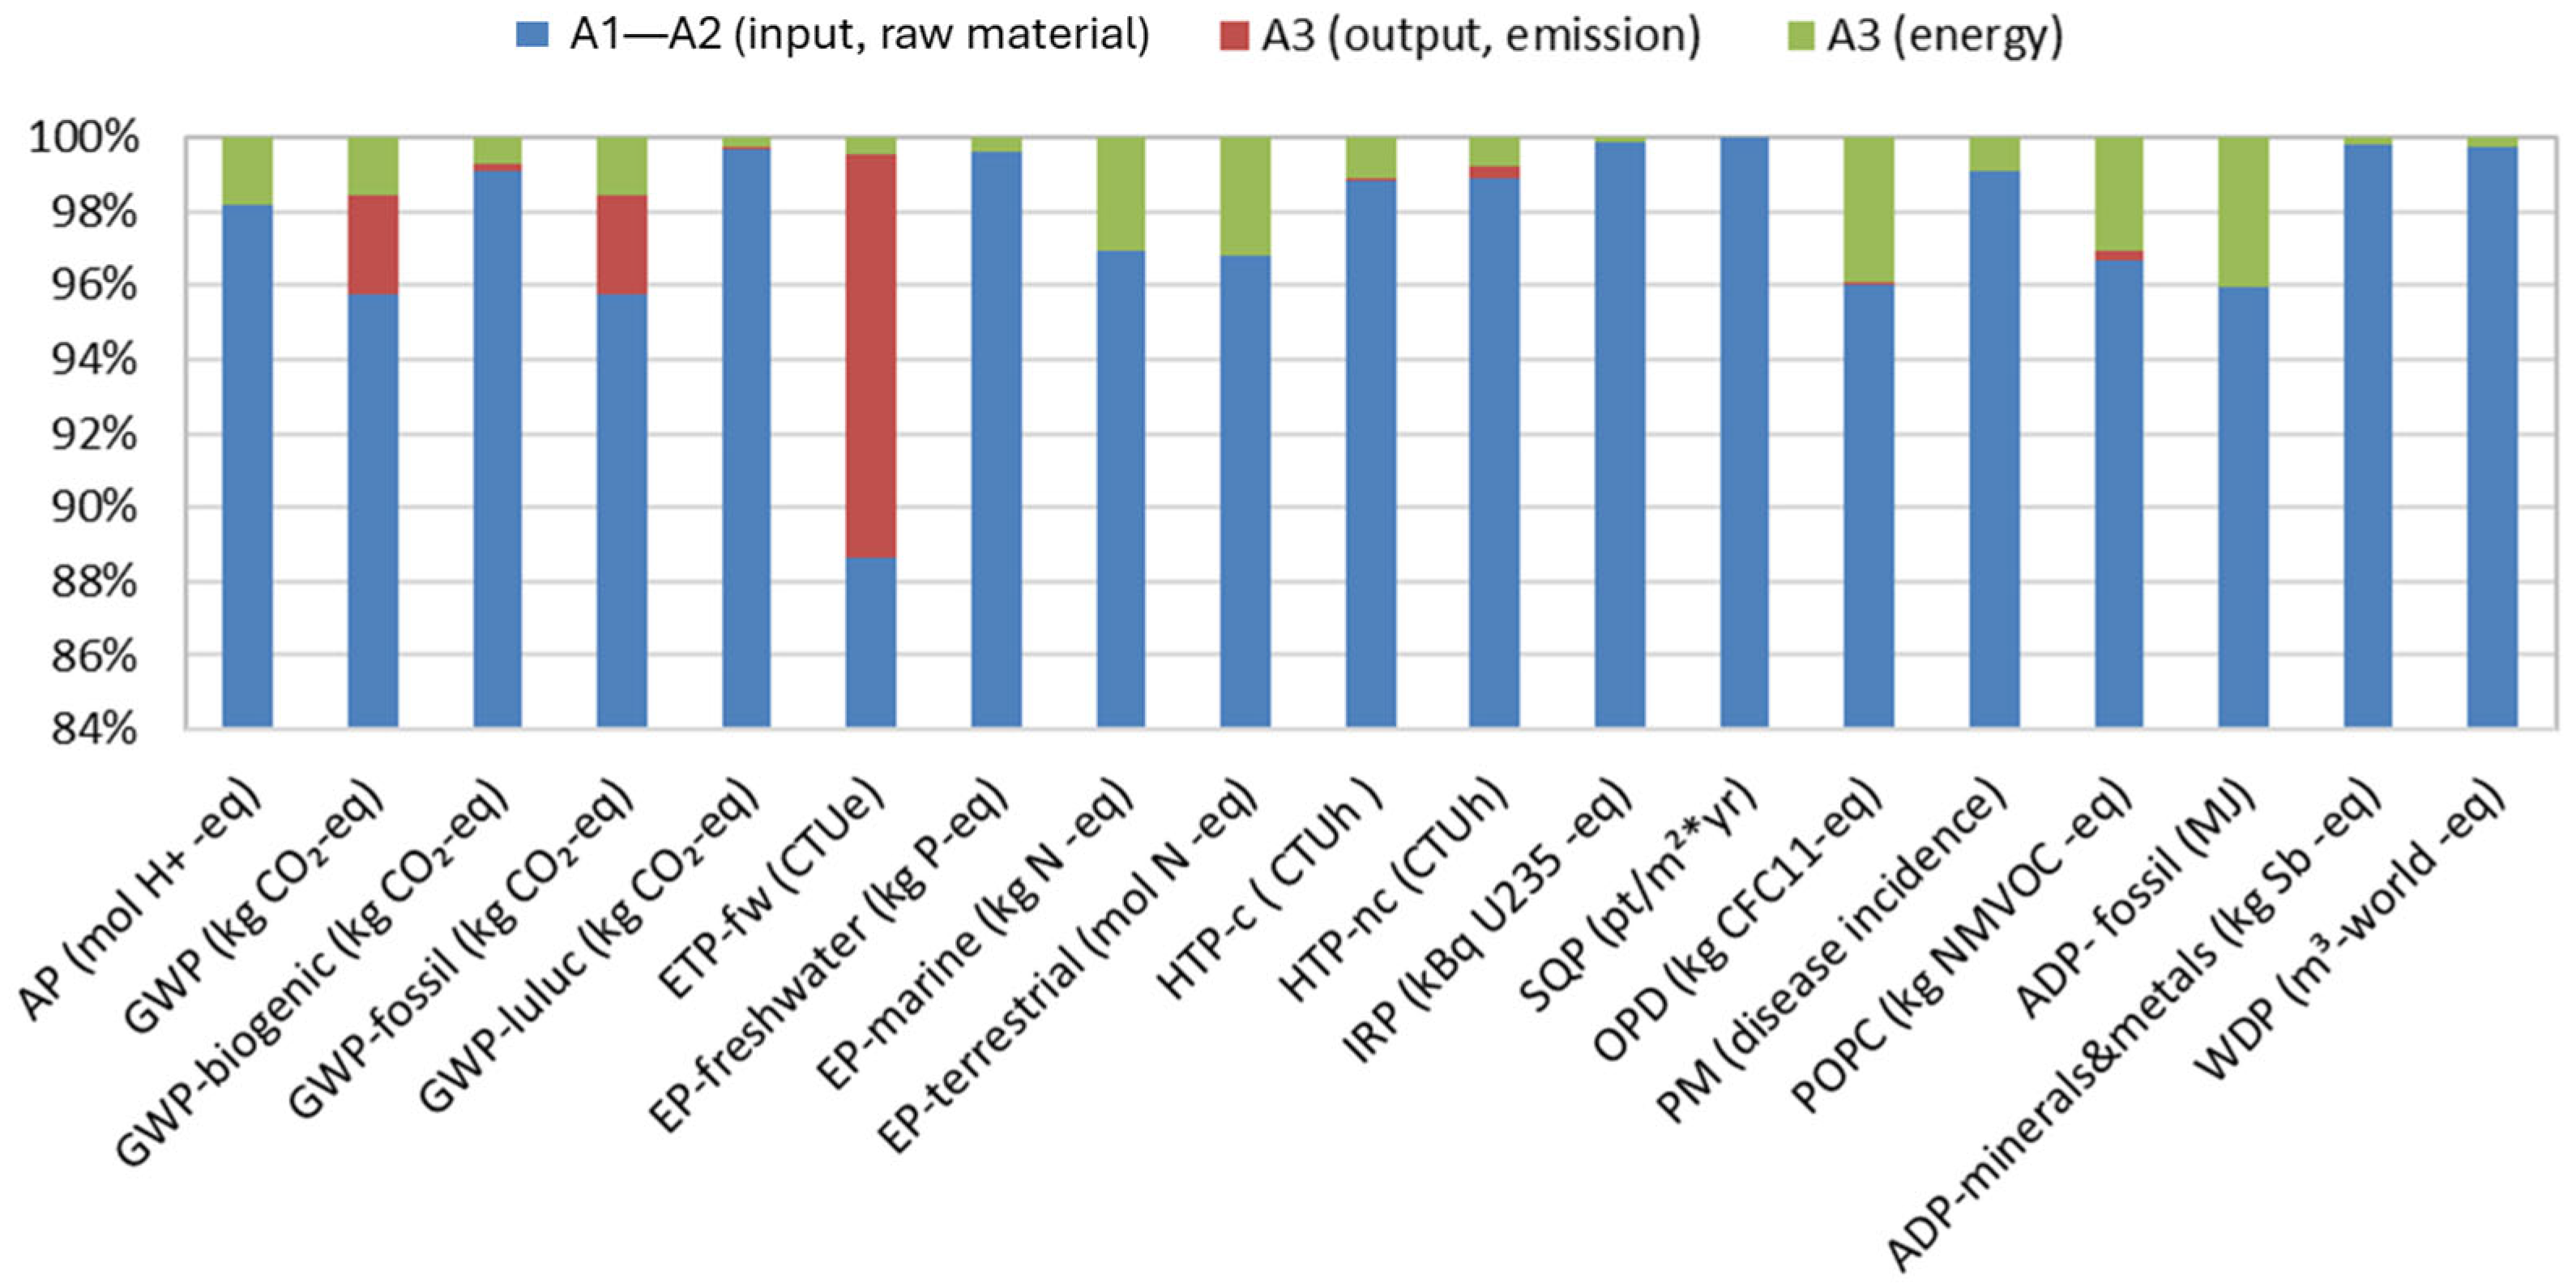
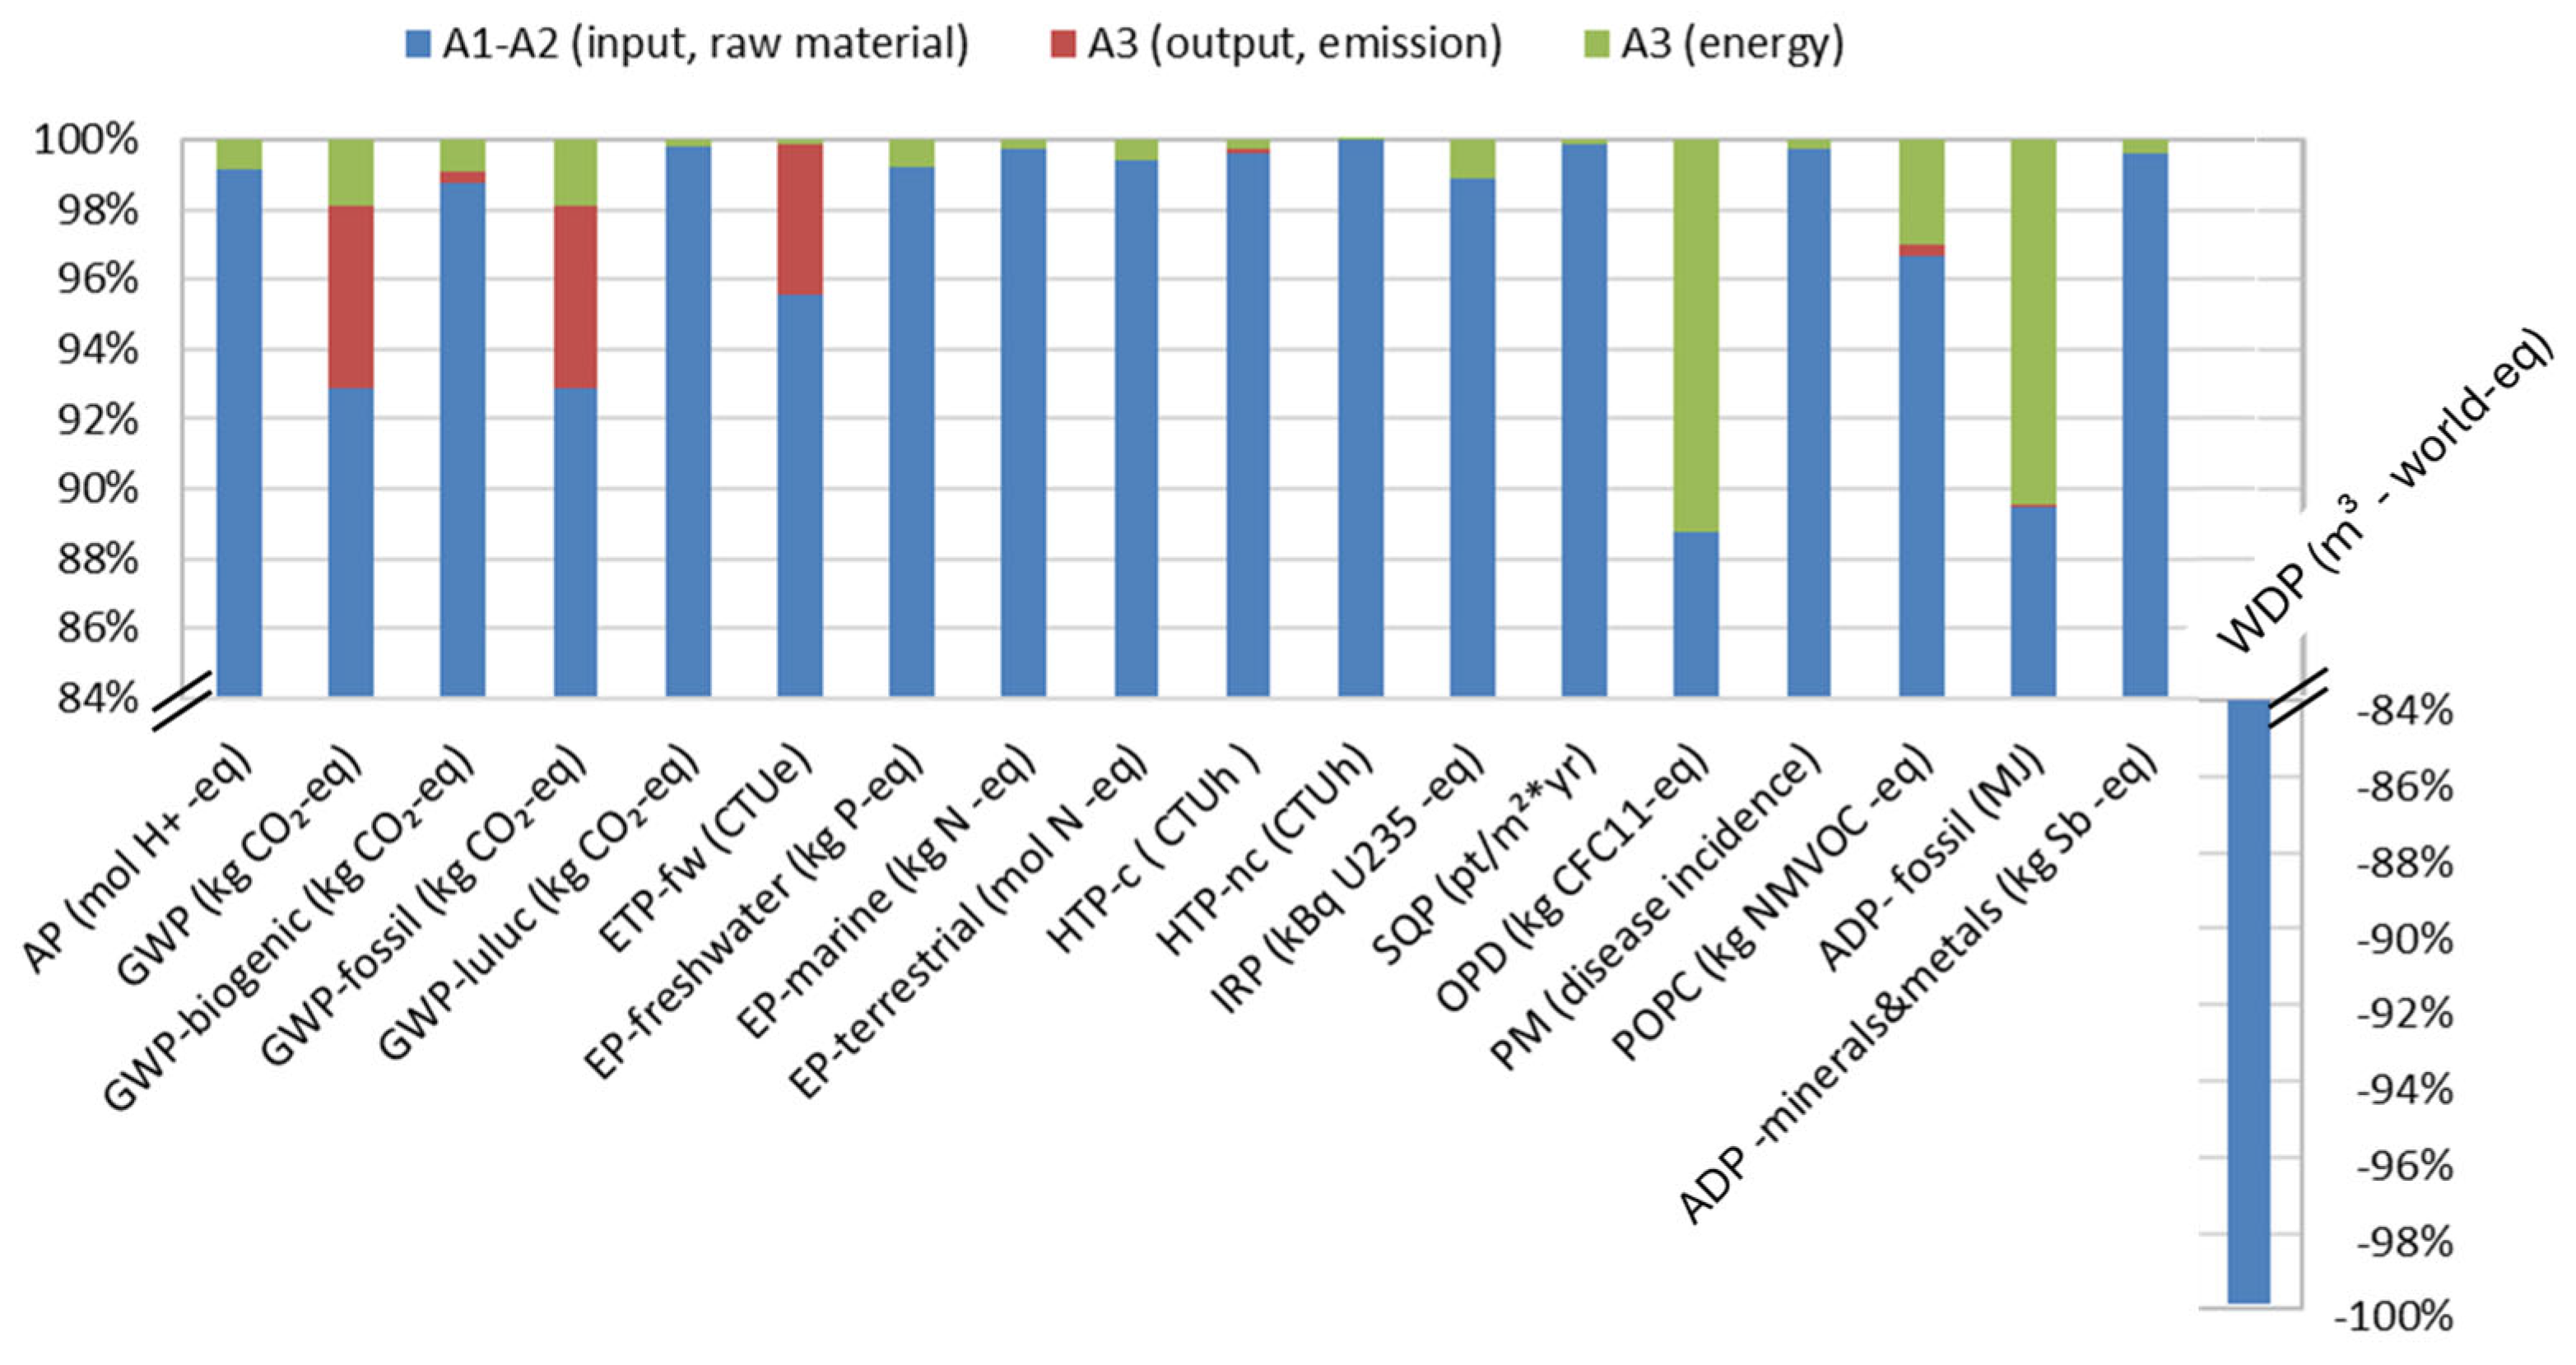
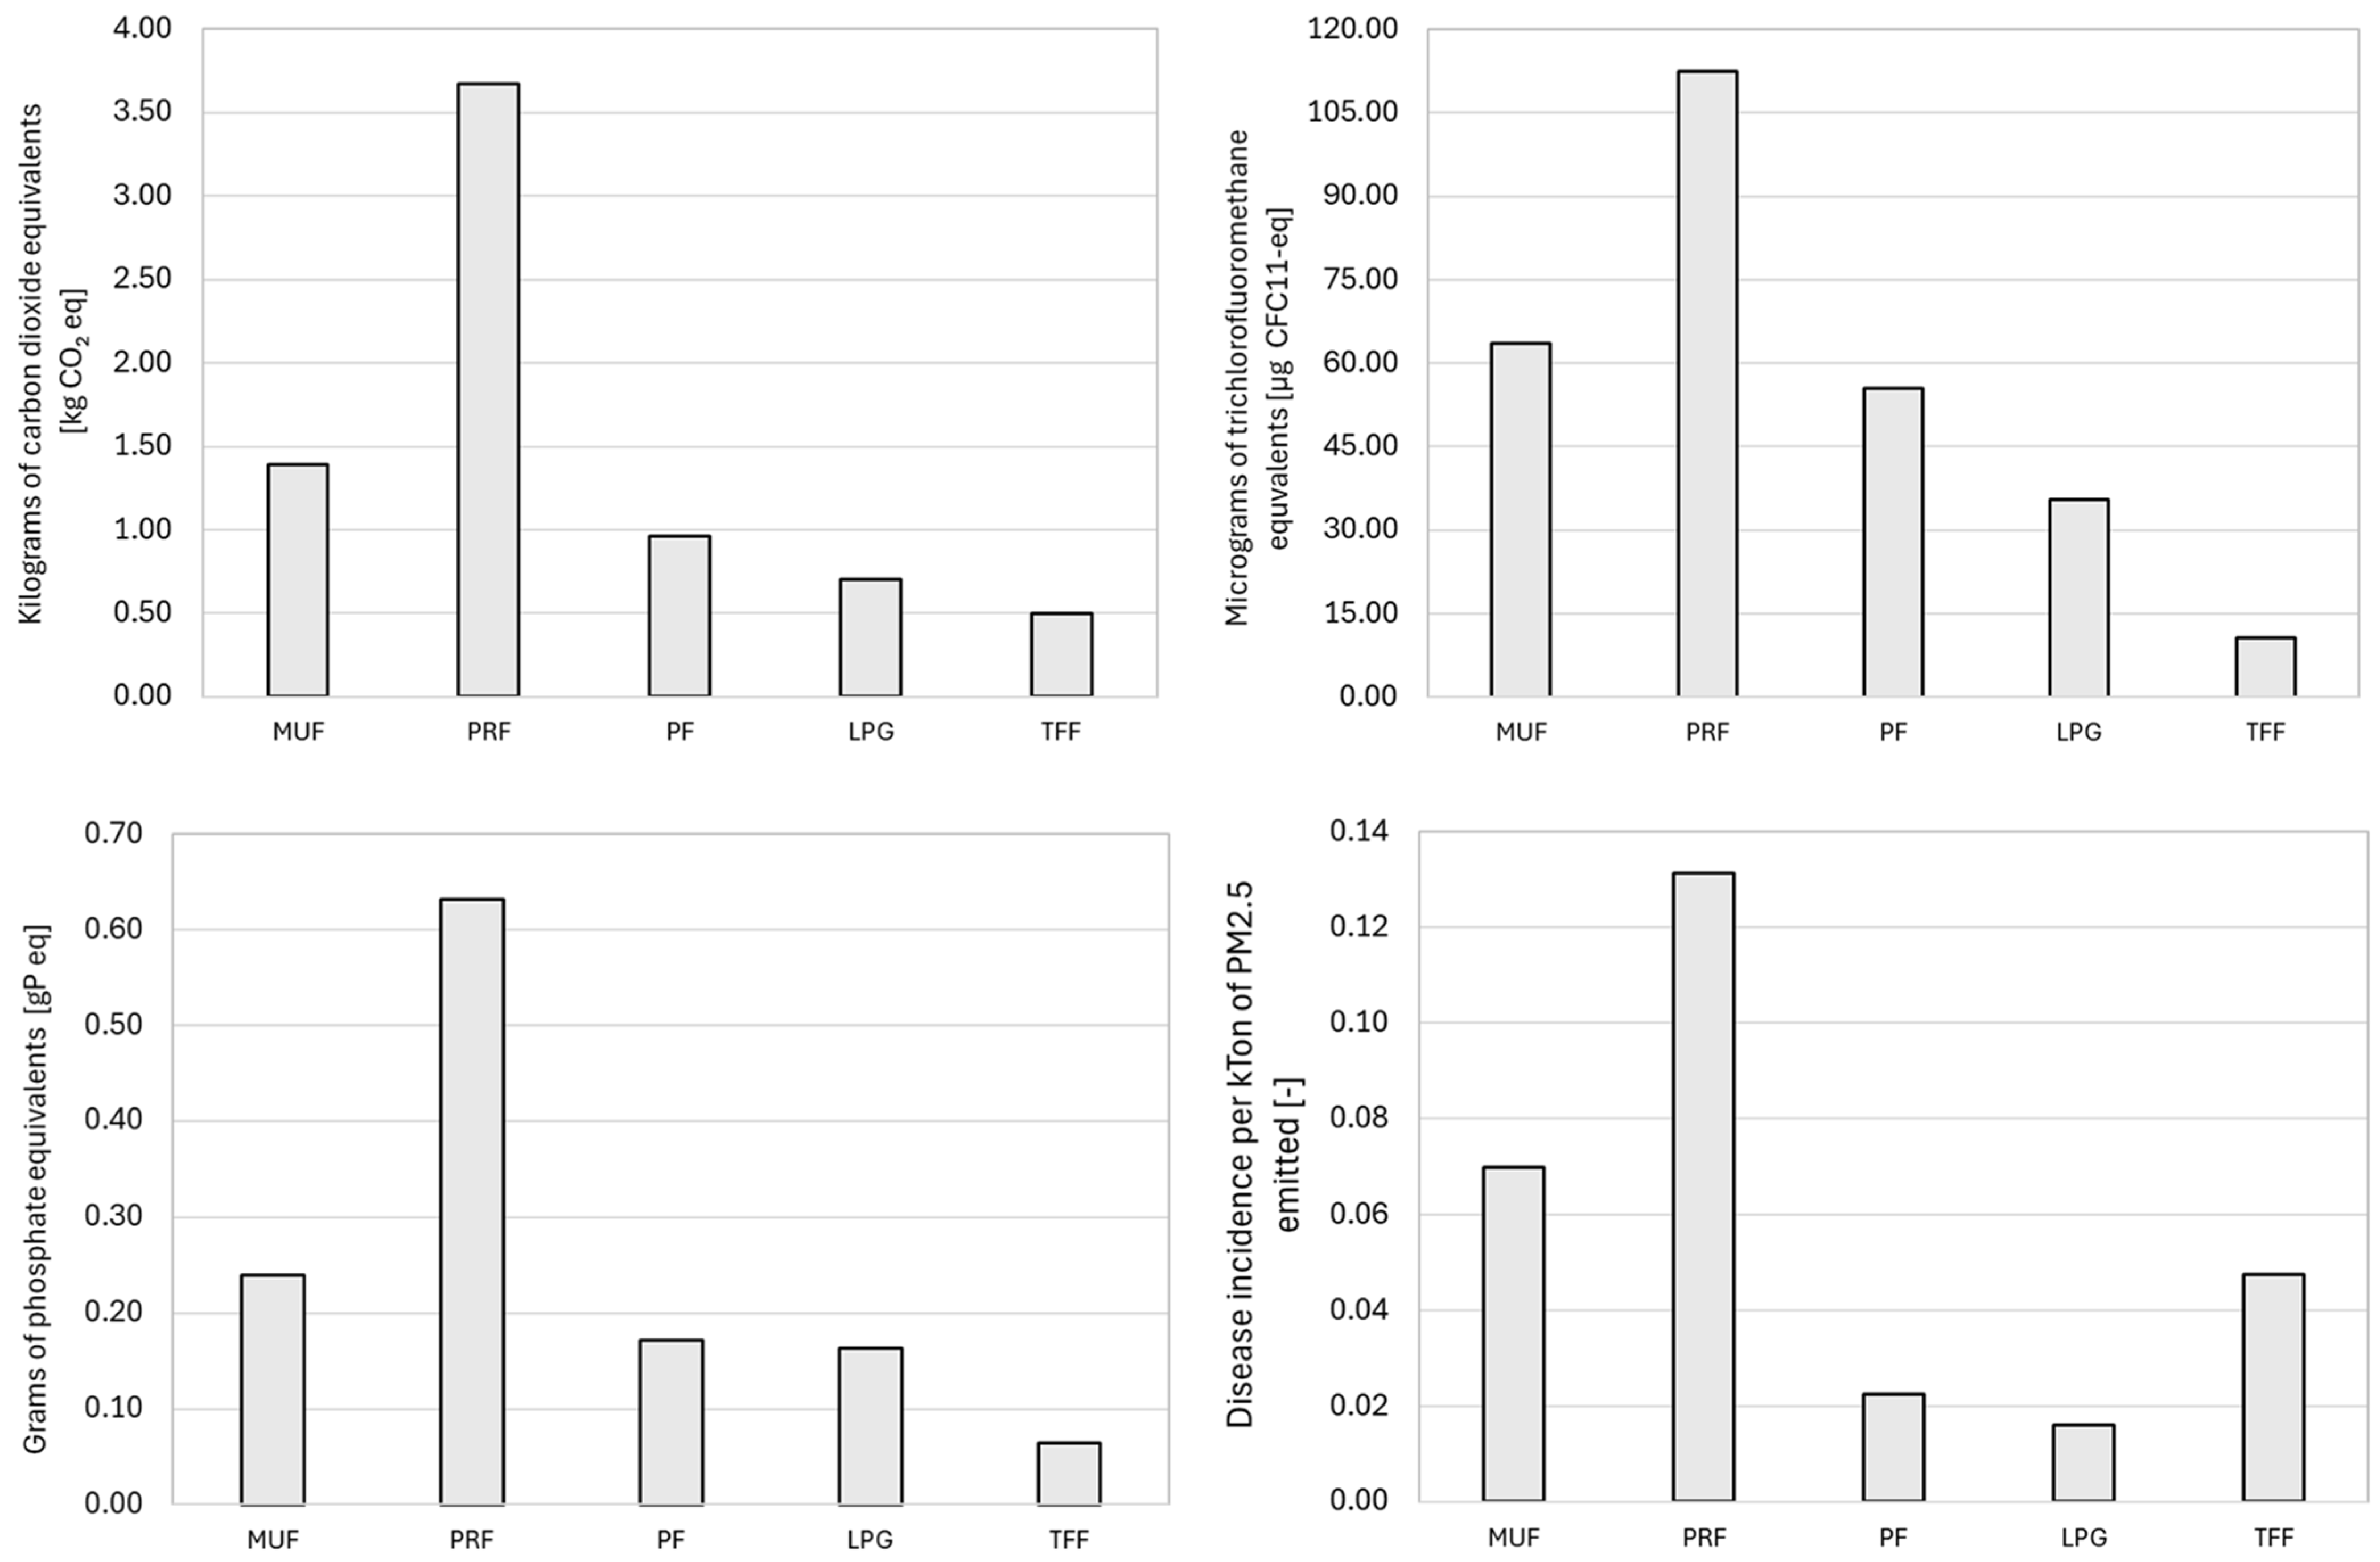
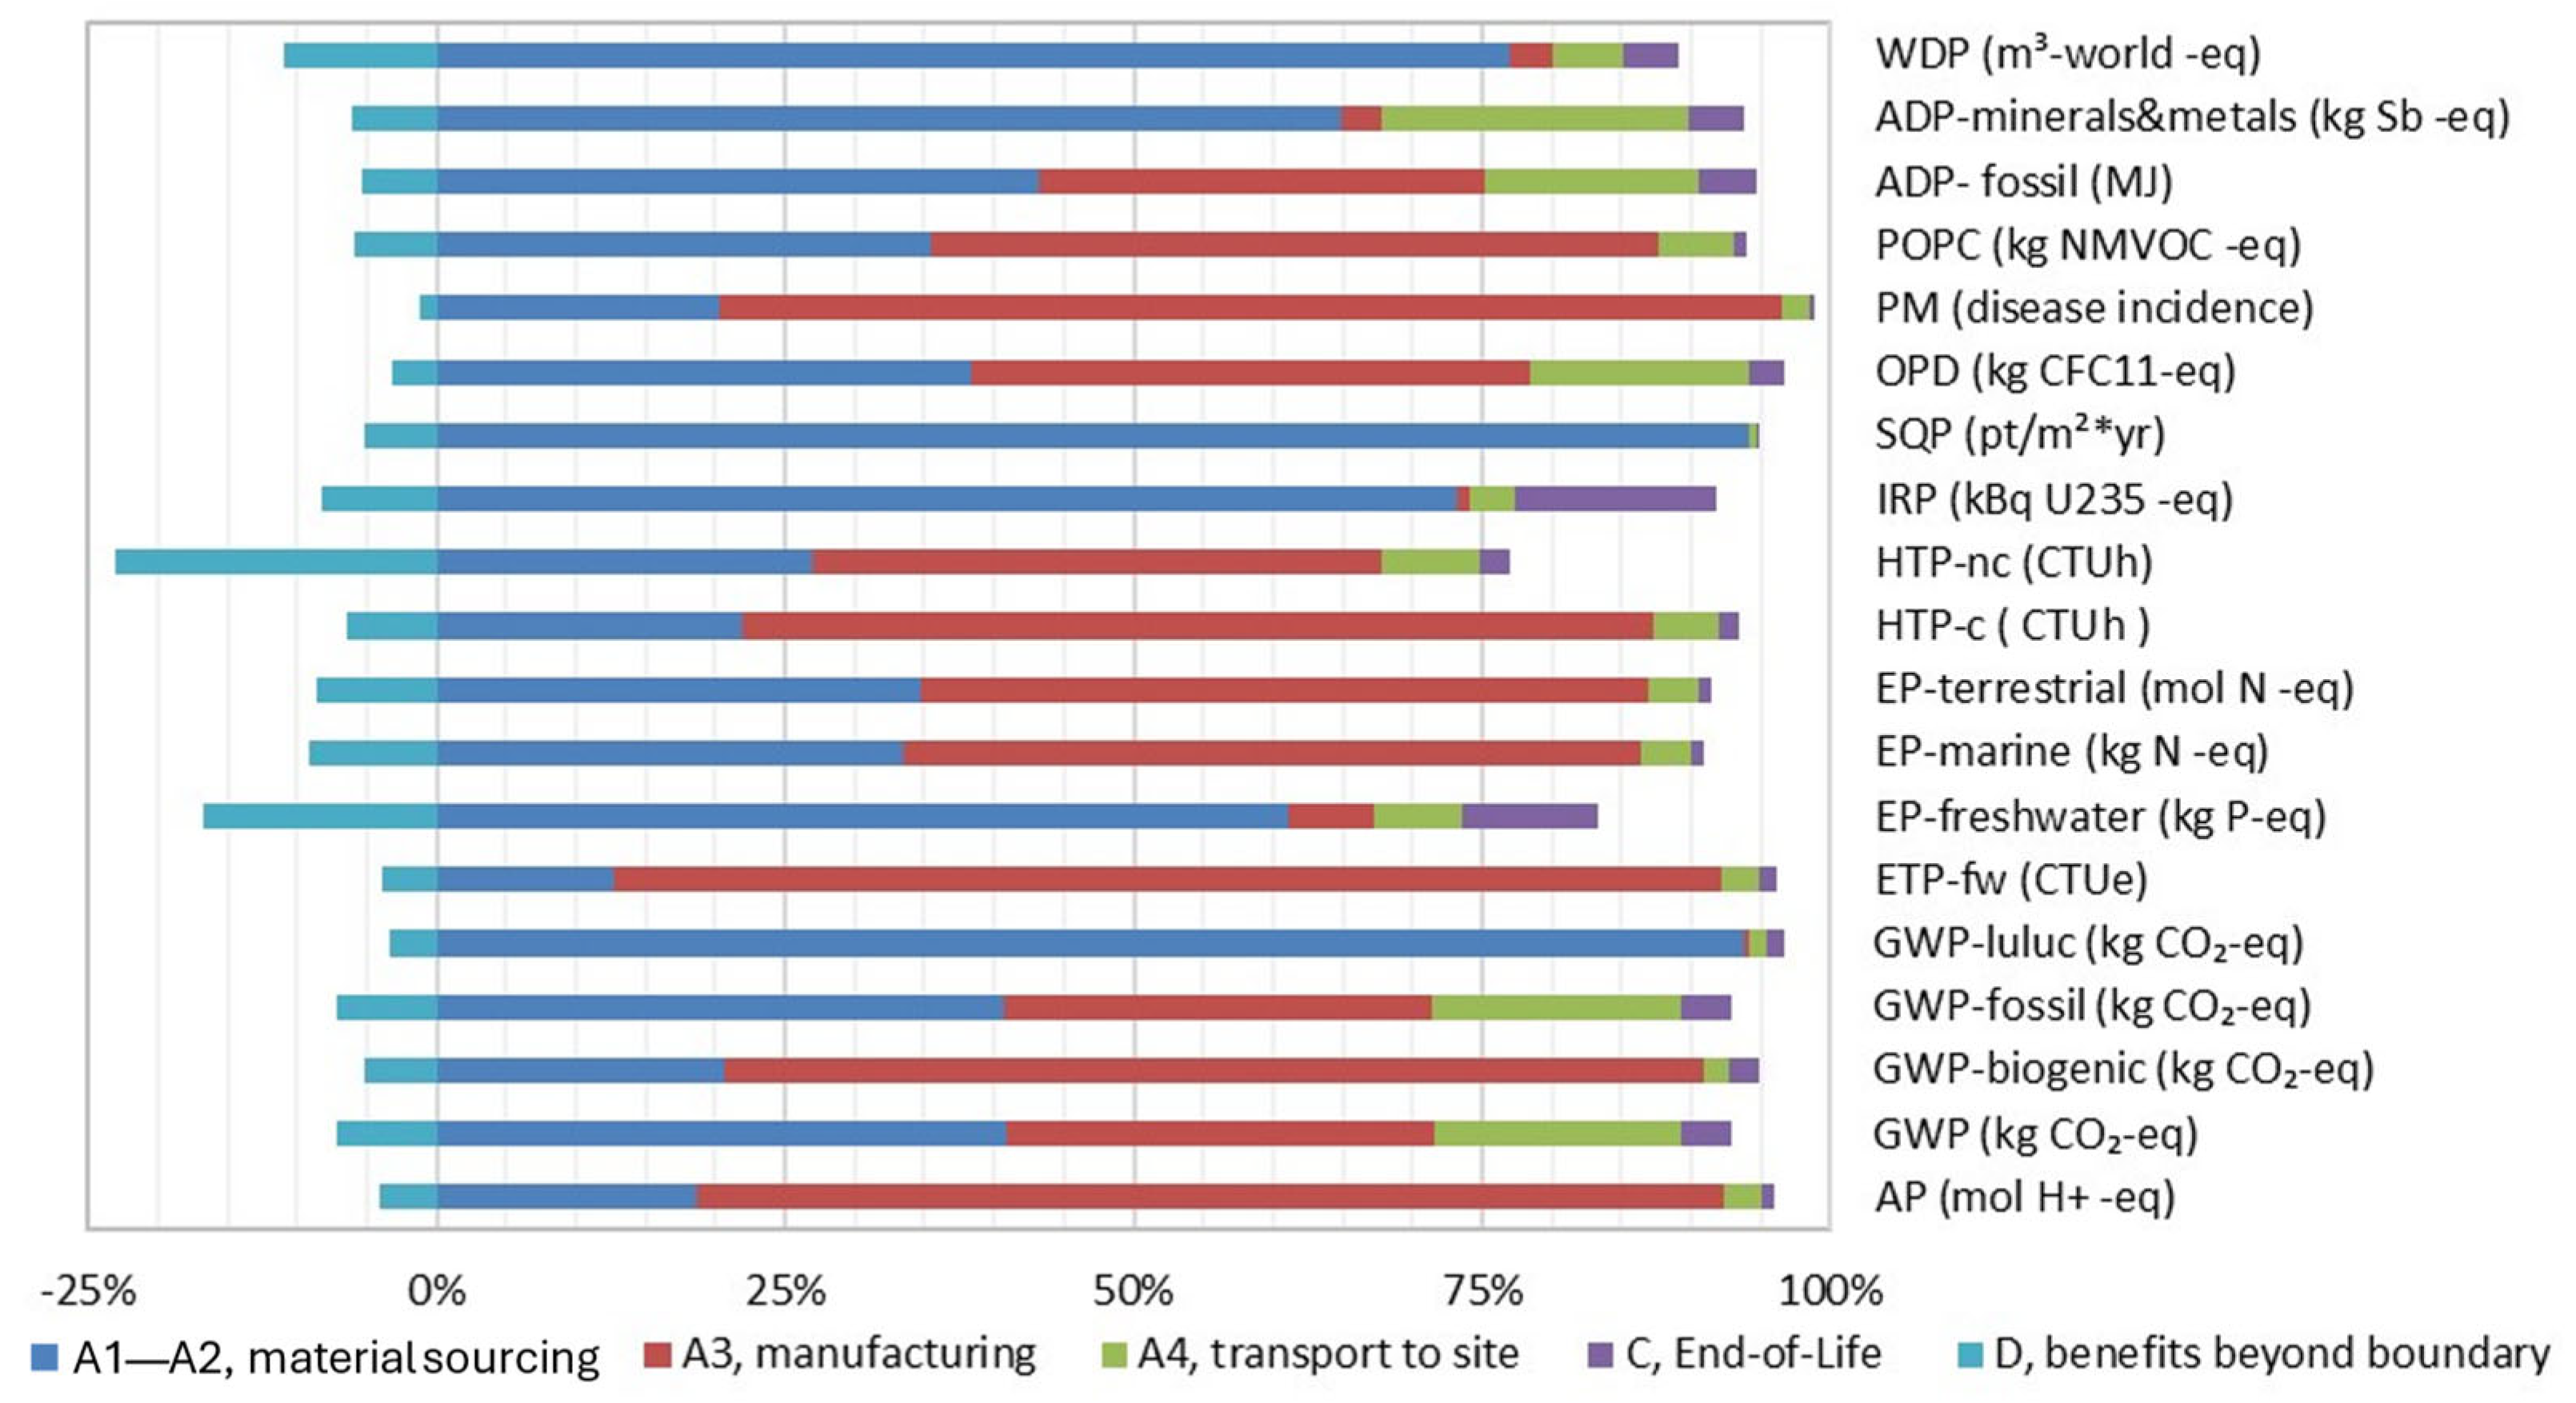
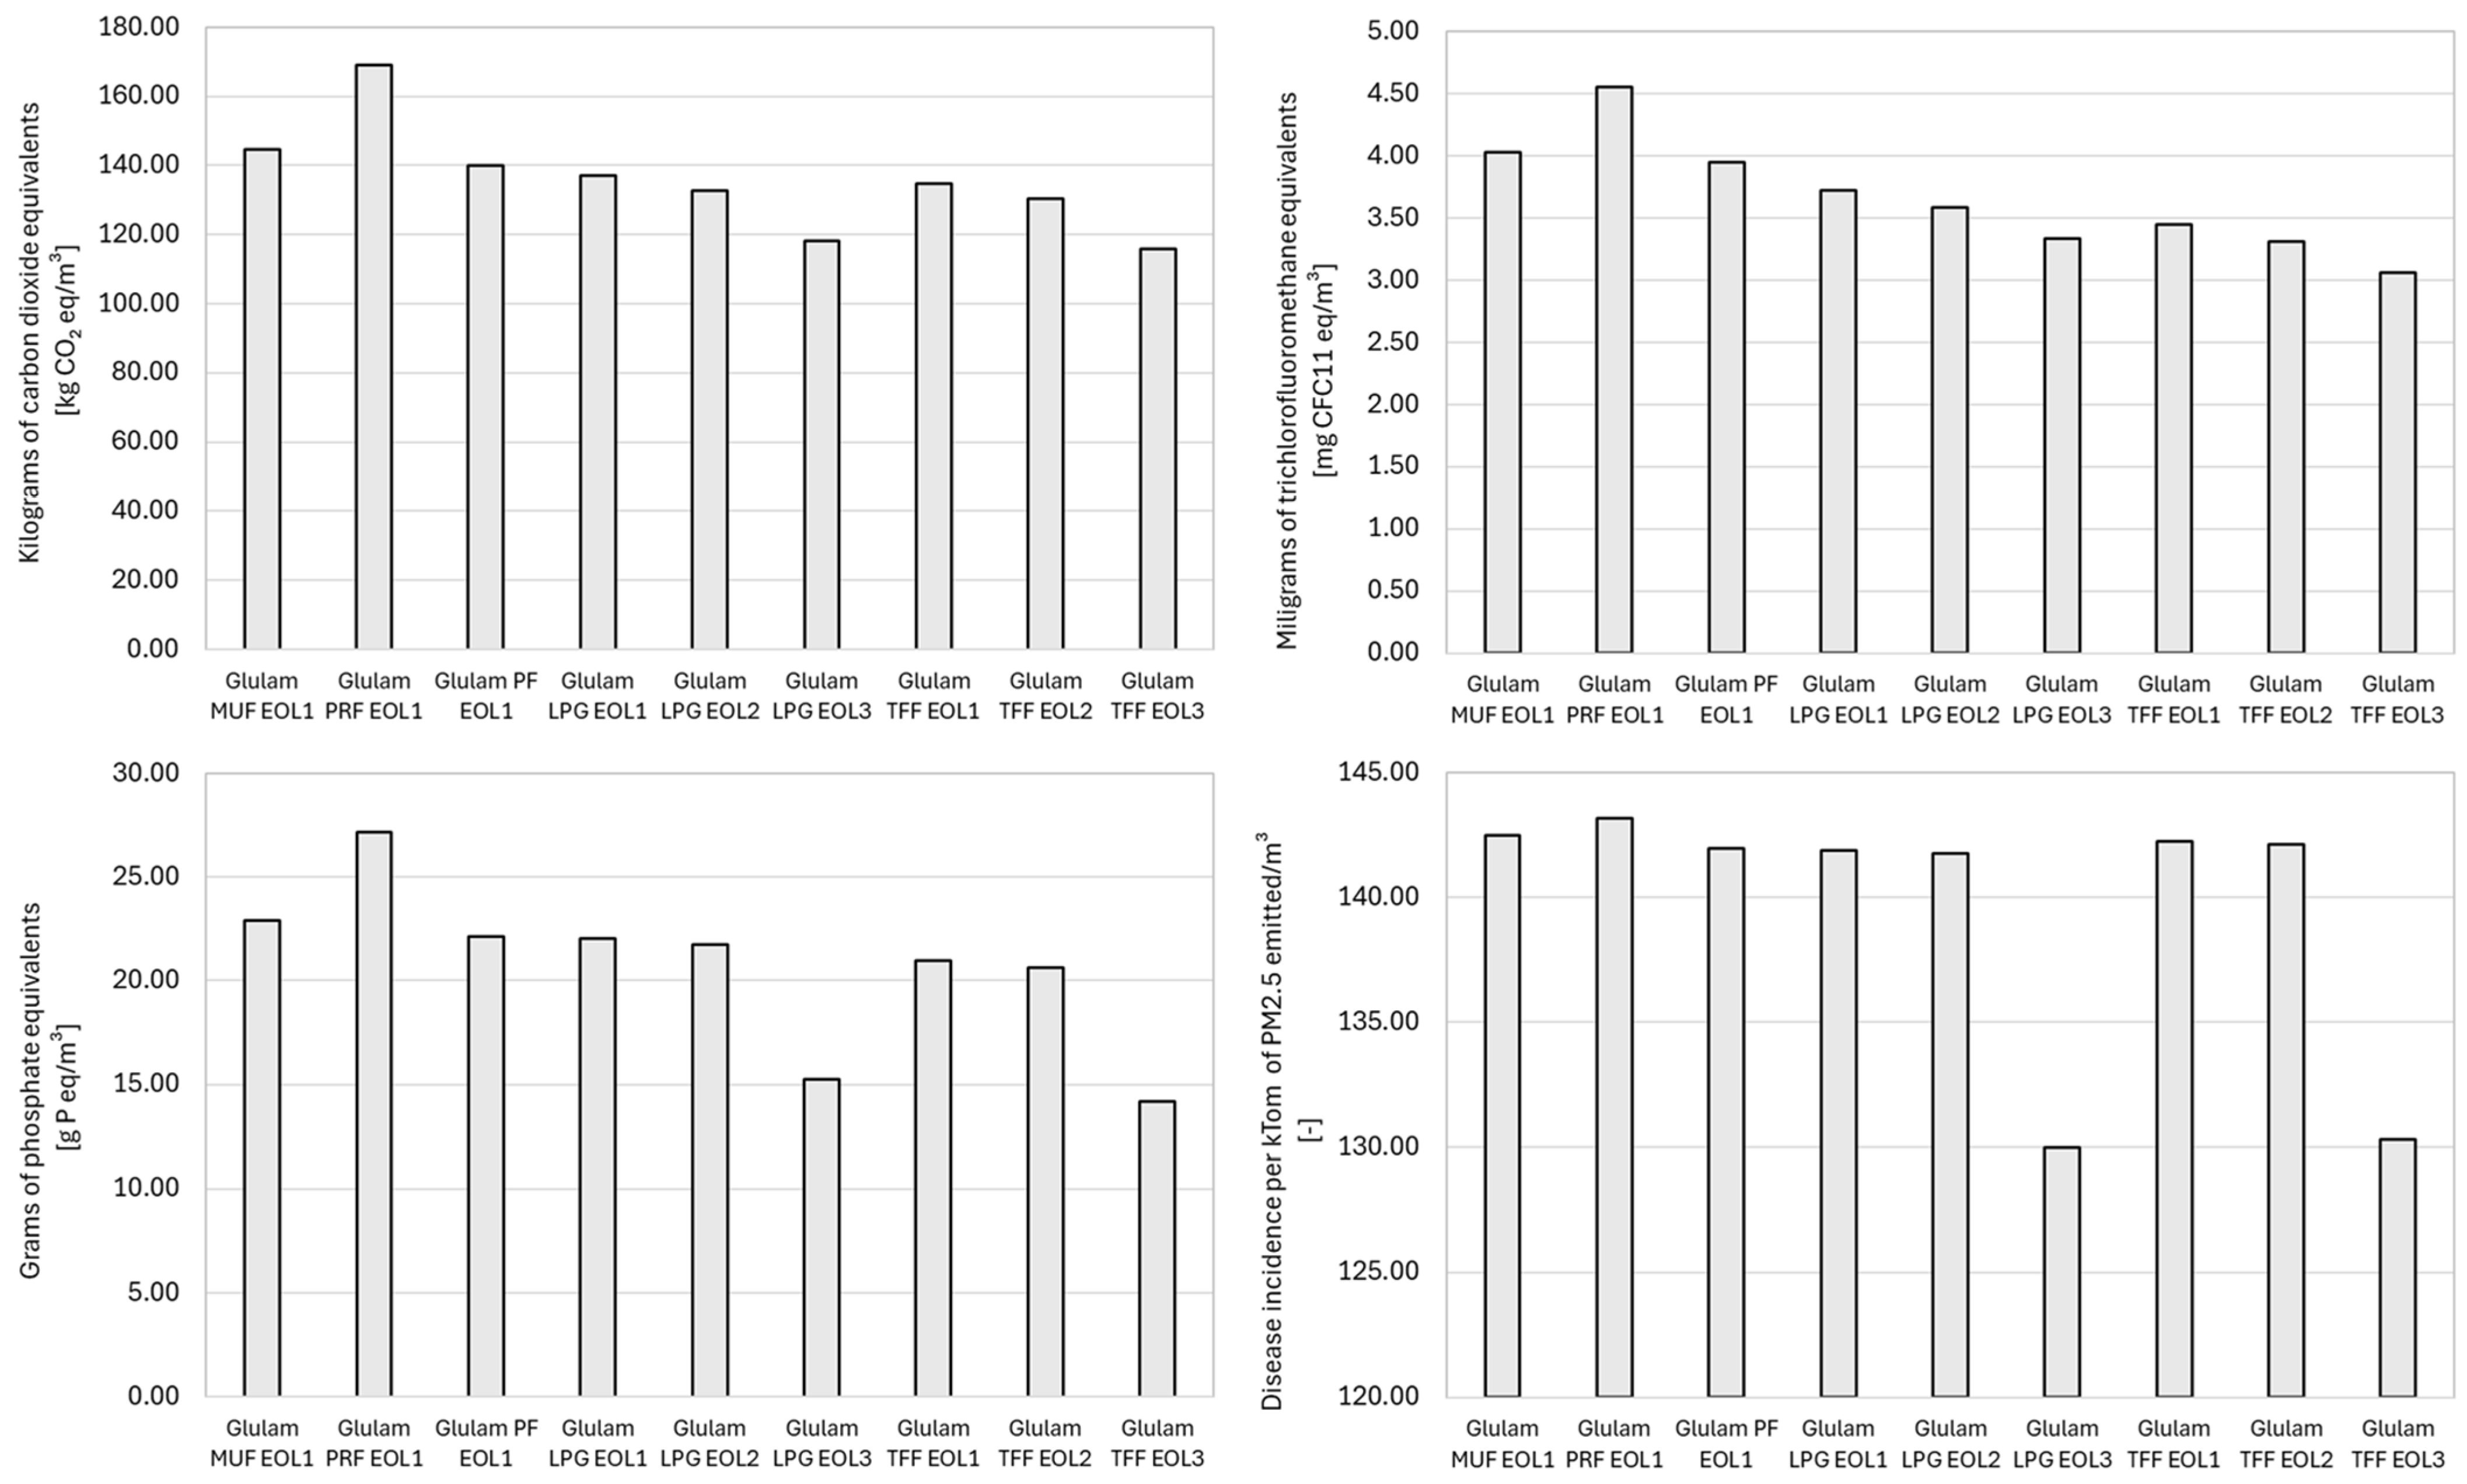
- When comparing bio-adhesives with traditional synthetic adhesives, bio-alternatives demonstrated lower environmental impacts for glulam applications, especially under circular end-of-life (EOL) scenarios like recycling or reuse. Synthetic adhesives contribute 23–43% to the environmental impact of raw material sourcing (A1–A2) of glulam based on CO2 equivalent emissions, and on average 10% to the environmental impact of the total life cycle. In contrast, bio-adhesives contribute 8–12% to modules A1–A2 and about 5% to the total life cycle.
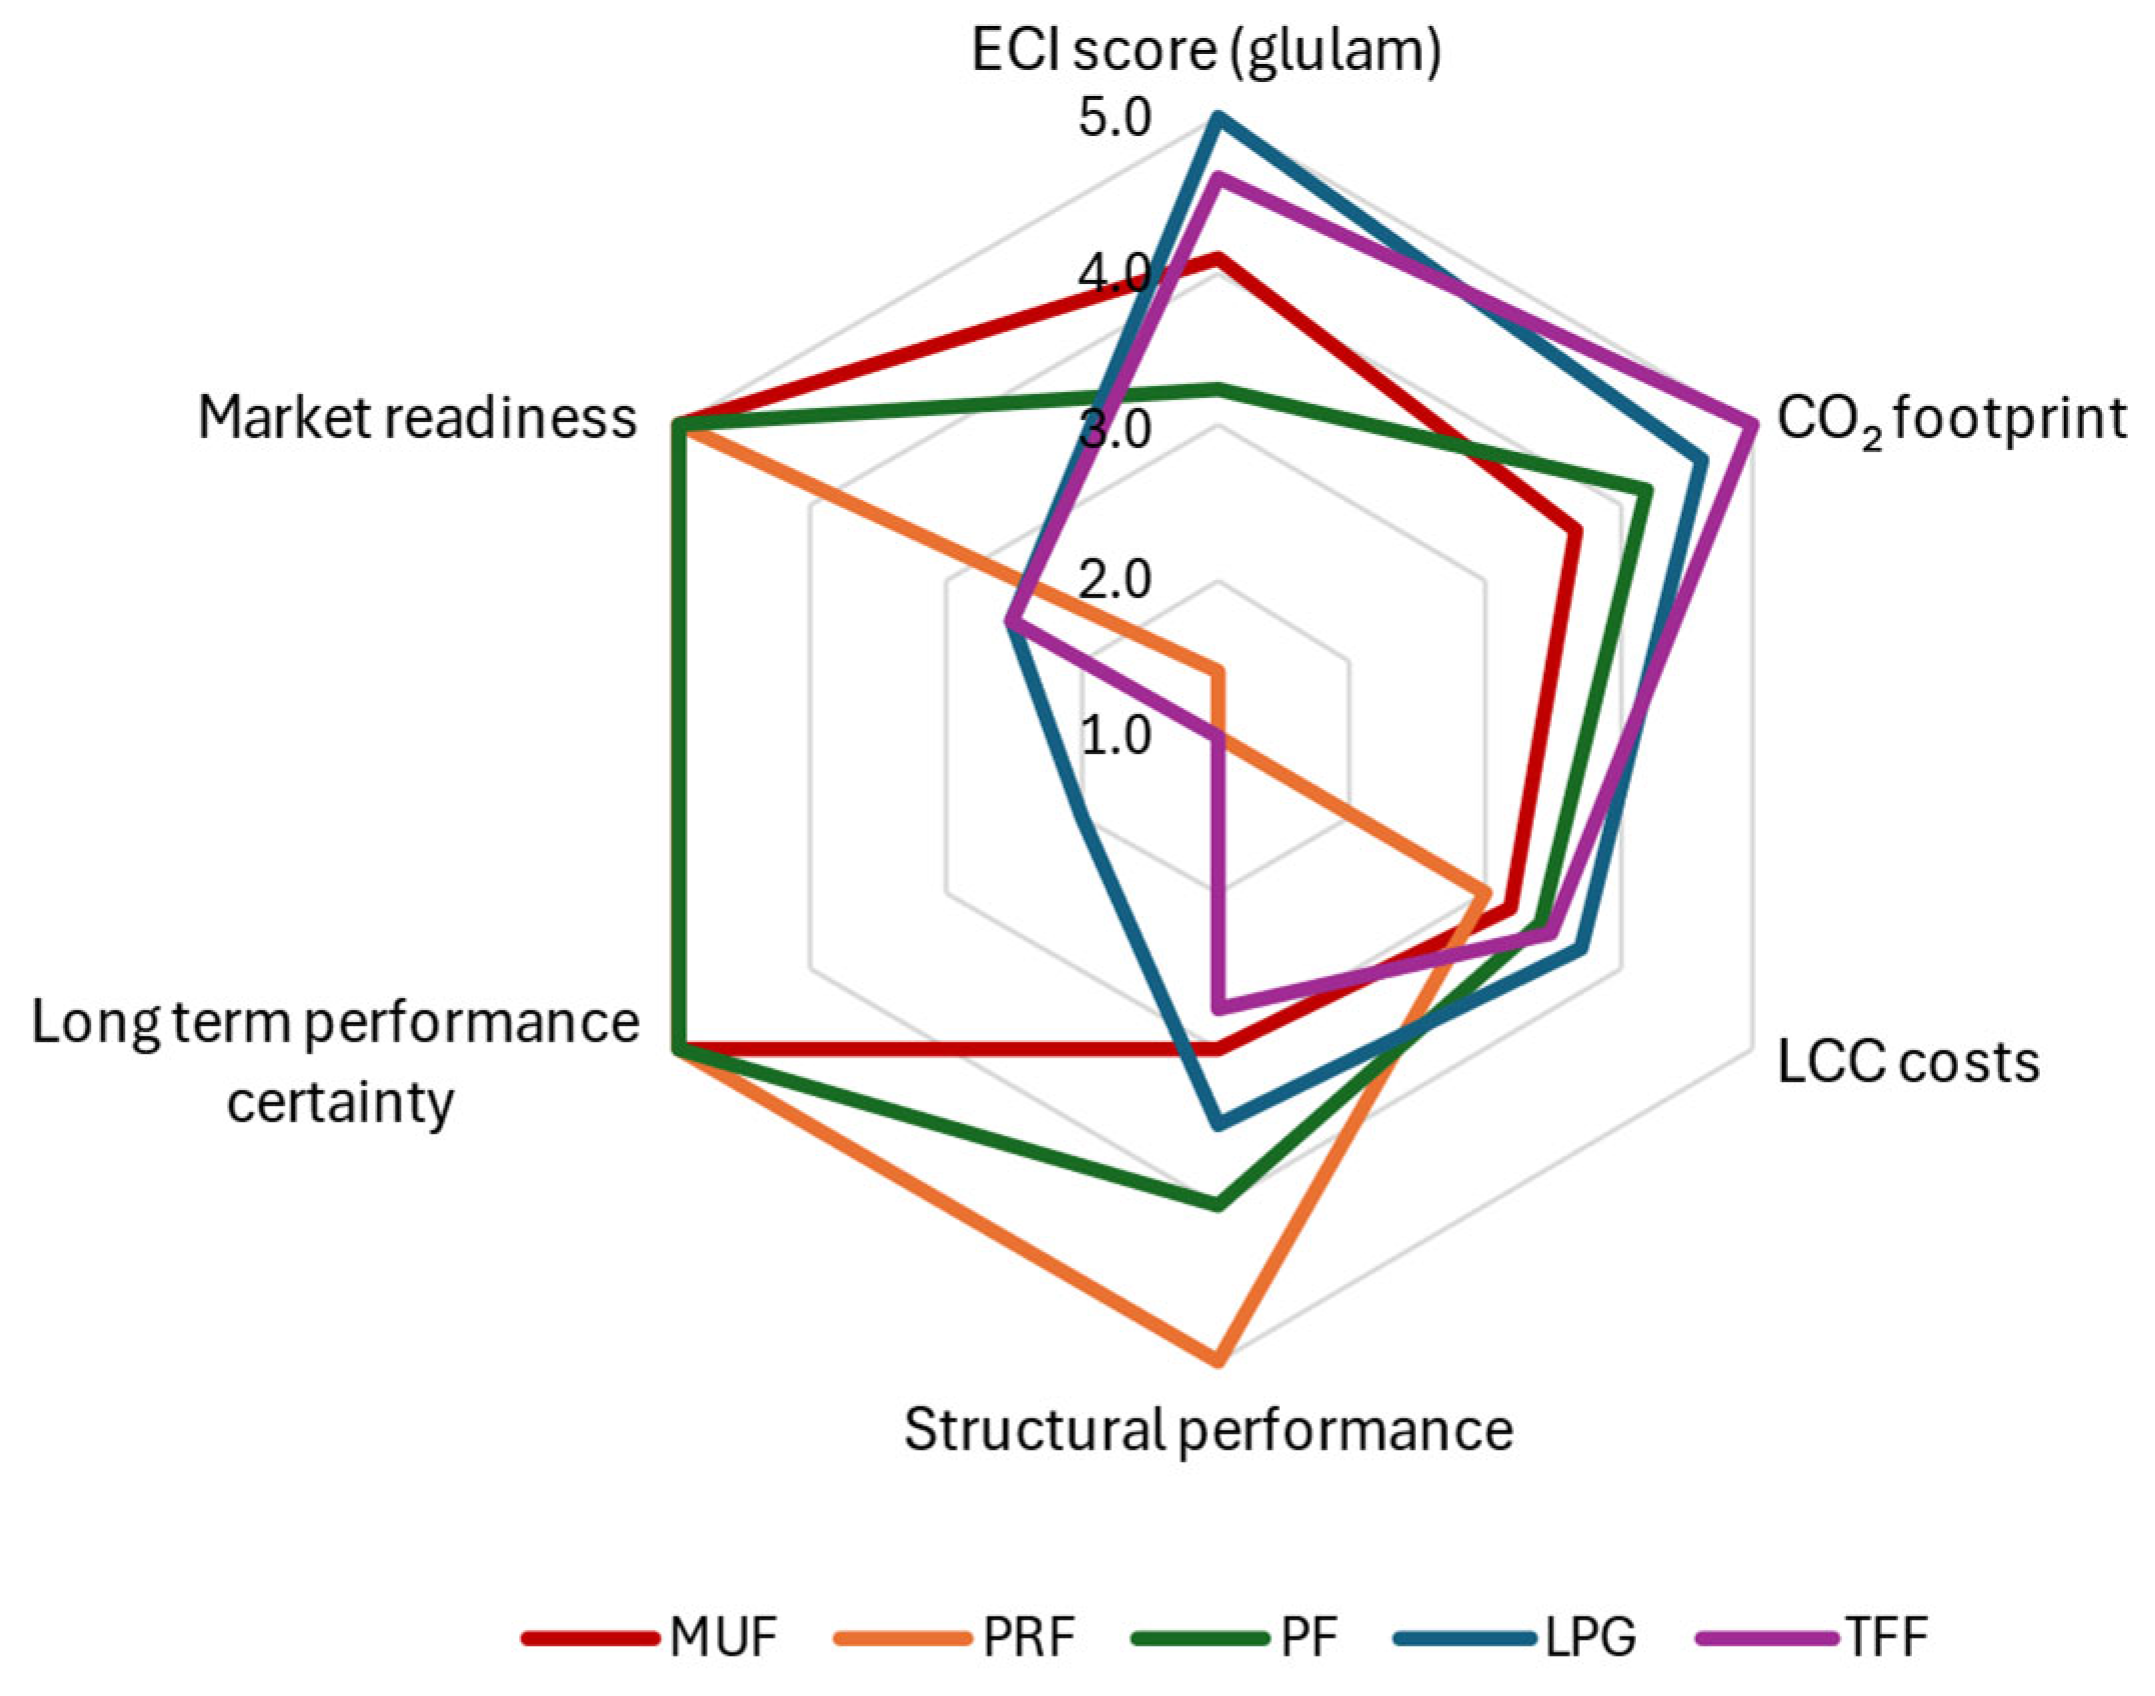
- The highest life cycle costs are associated with PRF, while the lowest are from LPG; however, these differences are not significant. Therefore, cost is not a decisive criterion in the selection of adhesive type.
- Among the synthetic adhesives, PRF consistently presents the highest environmental burden despite its structural superiority.
- Synthetic adhesives have been used for decades, whereas durability testing of bio-adhesives remains limited. Long-term assessments of their structural performance are therefore required, despite their demonstrated compliance with structural standards at the laboratory scale.
Author Contributions
Funding
Institutional Review Board Statement
Informed Consent Statement
Data Availability Statement
Conflicts of Interest
Abbreviations
| ECI | Environmental cost indicator |
| EPD | Environmental product declaration |
| EOL | End-of-life |
| EWP | Engineered wood product |
| FU | Functional unit |
| Glulam | Glued laminated timber |
| LCA | Life cycle assessment |
| LCC | Life cycle cost |
| LCI | Life cycle inventory |
| LPG | Lignin phenol glyoxal |
| MUF | Melamine-urea formaldehyde |
| PCR | Product category rules |
| PF | Phenol formaldehyde |
| PRF | Phenol resorcinol formaldehyde |
| SC | Service class |
| TFF | Tannin-furfuryl alcohol formaldehyde |
| TRL | Technology readiness level |
| VOC | Volatile organic compound |
Appendix A
| Flow | Data | Unit | Process (Ecoinvent 3.11) |
|---|---|---|---|
| Input, raw materials | |||
| Sulfuric acid for lignin extraction | 7.00 × 10⁻² | kg | Sulfuric acid|market for sulfuric acid|Europe |
| Liquid carbon dioxide for lignin extraction | 0.28 | kg | Carbon dioxide, liquid|market for carbon dioxide, liquid|Europe |
| Sodium hydroxide | 0.10 | kg | Sodium hydroxide|chlor-alkali electrolysis, average production|Europe |
| Lime | 0.41 | kg | Lime|market for hydraulic lime|Europe |
| Softwood | 4.99 × 10⁻² | m3 | Softwood|market for pulpwood, softwood, measured as solid wood under bark|Europe without Switzerland |
| Input, energy | |||
| Natural gas for lignin extraction | 1.03 | MJ | Natural gas|market group for heat, district or industrial, natural gas|Europe |
| Natural gas | 21.00 | MJ | Natural gas|market group for heat, district or industrial, natural gas|Europe |
| Combustion of hog fuel | 1.52 × 10+2 | MJ | Heat production, softwood chips from forest, at furnace 50 kW|Rest-of-World |
| Output, Product | |||
| Kraft lignin, dry | 1.00 | kg | |
| Output, emissions to air | |||
| Sulfur dioxide direct emissions | 2.70 × 10⁻² | kg | Sulfur dioxide, emission/air, unspecified |
| Fossil carbon dioxide direct emissions | 1.40 | kg | Carbon dioxide, emission/air, unspecified |
| Output, emissions to land | |||
| Waste to landfill | 1.07 | kg | Waste to landfill|treatment of inert waste, sanitary landfill|Europe |
| Flow | Data | Unit | Process (Ecoinvent 3.11) |
|---|---|---|---|
| Input, raw material | |||
| Milled bark (dry) | 32.10 | kg | Market for bark|Global |
| Water | 3.76 × 10+2 | kg | Market for water, harvested from rainwater|Global |
| Input, energy | |||
| Electricity | 1.14 × 10+2 | kWh | Electricity, medium voltage, European attribute mix|Europe |
| Output, product | |||
| Tannin | 1.00 | kg | |
| Dry bark co-product | 31.10 | kg | Market for bark|Global (inverted process) |
| Wastewater | 2.87 × 10+2 | kg | Market for sewage sludge, 97% water, WWT-SLF, waste wood, untreated|Europe |
| Flow | Data | Unit | Process (Ecoinvent 3.11) |
|---|---|---|---|
| Input, raw material | |||
| Pesticide | 2.43 × 10⁻³ | kg | Pesticide production, unspecified|Europe |
| Nitrogen fertilizer | 1.80 × 10⁻² | kg | Market group for inorganic nitrogen fertilizer, as N |
| Sulfuric acid | 0.17 | kg | Market for sulfuric acid|Europe |
| Corncob | 1.22 | kg | Maize grain production|Global |
| Water | 44.10 | kg | Market for water, harvested from rainwater|Global |
| Urea | 6.66 × 10⁻³ | kg | Market for urea|Europe |
| Calcium hydroxide | 9.50 × 10⁻² | kg | Lime|market for hydraulic lime|Europe |
| Input, energy | |||
| Electricity | 0.91 | kWh | Electricity, medium voltage, European attribute mix|Europe |
| Diesel | 4.93 × 10⁻³ | kg | Market group for diesel|Europe |
| Steam consumption for furfural production | 19.60 | kg | Market for steam, in chemical industry|Rest-of-World |
| Steam consumption for furfuryl alcohol production | 0.75 | kg | Market for steam, in chemical industry|Rest-of-World |
| Steam recovery from solid waste | −20.40 | kg | Market for steam, in chemical industry|Rest-of-World (inverted) |
| Output | |||
| Wastewater | 10.50 | kg | Market for sewage sludge, 97% water, WWT-SLF, waste wood, untreated|Europe |
| Furfural residue | 13.70 | kg | Furfural, emission/ground, unspecified |
| Solid waste to landfill | 1.53 × 10⁻² | kg | Market for municipal solid waste|Netherlands |
| Sulfur dioxide | 1.03 × 10⁻² | kg | Sulfur dioxide, emission/air, unspecified |
| Particulates | 1.09 × 10⁻³ | kg | Particulate matter, emission/air, unspecified |
| Nitrogen oxides | 1.55 × 10⁻³ | kg | Nitrogen oxides, emission/air, unspecified |
| Furfuryl alcohol | 0.11 | kg | Furfuryl alcohol matter, emission/air, unspecified |
| Furfural | 7.33 × 10⁻⁵ | kg | Furfural, emission/air, unspecified |
| Flow | Data | Unit | Process (Ecoinvent 3.11) |
|---|---|---|---|
| Input, raw materials (A1–A2) | |||
| Spruce softwood (440 kg/m3 density), 87.35% of total volume [63,64,65] | 1.00 | m3 | Beam, softwood, raw, kiln drying to u = 10%|Europe without Switzerland |
| Adhesive, 2.17% of total volume | 10.90 | kg | Modeledbased on Table A1 and Table A2 |
| Input, energy (A3) | |||
| Electricity | 77.70 | kWh | Electricity, medium voltage, European attribute mix|Europe |
| Natural gas | 20.70 | m3 | Market for natural gas, liquified|Global |
| Diesel (loaders) | 0.44 | L | Market group for diesel|Europe |
| Petrol (trucks within factory) | 0.23 | L | Market for petrol, unleaded|Europe |
| Liquified petroleum gas (forklifts) | 0.17 | L | Market for liquified petroleum gas|Global |
| Input, transport | |||
| Transport to site, A4 | 2.93 × 10+2 | T*km | Transport, freight, lorry, >32 metric ton, diesel, EURO6|Europe |
| Transport to waste management site, C2 | 24.90 | T*km | Transport, freight, lorry, >32 metric ton, diesel, EURO6|Europe |
| End-of-life processes (C3–4) and benefit beyond boundaries (D) | |||
| C, EOL1 and 2: wood chipping of 100% beams | 5.04 × 10+2 | kg | Wood chipping, industrial residual wood, stationary electric chipper|Europe |
| C, EOL3: wood chipping of 30% of beams | 1.51 × 10+2 | kg | Wood chipping, industrial residual wood, stationary electric chipper|Europe |
| C, EOL3: planning of beams | 3.53 × 10+2 | kg | Planning, beam, softwood, u=10%|Europe without Switzerland |
| D, EOL1: 100% incineration (incineration) | 5.04 × 10+2 | kg | Treatment of waste wood, untreated, municipal incineration|Global |
| D, EOL2: 70% recycling of woodchips (as output) | 3.53 × 10+2 | kg | Market for wood chips, from post-consumer wood, measured as dry mass|Europe |
| D, EOL3: 70% reuse of beams (as output) | 0.70 | m3 | Beam, softwood, raw, kiln drying to u=10% |Europe without Switzerland |
| D, EOL2 and EOL3: 30% incineration | 1.51 × 10+2 | kg | Treatment of waste wood, untreated, municipal incineration|Global |
| Output, (Co-)Products [66] | |||
| Glued laminated timber | 1.00 | m3 | FU |
| Co-products (sawdust) | 46.60 | kg | Suction, sawdust|Europe without Switzerland |
| Co-products (shavings, trimmings) | 46.60 | kg | Suction, shavings, softwood|Europe without Switzerland |
| Output, Emissions to air [66] | |||
| Carbon dioxide, fossil | 14.89 | kg | Carbon dioxide, emission/air, unspecified |
| Carbon dioxide, biogenic | 14.50 | kg | Carbon dioxide, biogenic, emission/air, unspecified |
| Particulates, unspecified | 1.07 | kg | Particulate matter, emission/air, unspecified |
| Sulfur dioxide | 0.99 | kg | Sulfur dioxide, emission/air, unspecified |
| VOC, volatile organic compounds | 0.94 | kg | Volatile organic compounds, emission/air, unspecified |
| Nitrogen oxides | 0.65 | kg | Nitrogen oxides, emission/air, unspecified |
| Carbon monoxide | 0.45 | kg | Carbon monoxide, emission/air, unspecified |
| Methane | 0.42 | kg | Methane, emission/air, unspecified |
| Particulates, >2.5 um, and <10 um | 0.38 | kg | Particulates, >2.5 um, and <10 um, emission/air, unspecified |
| Particulates, <2.5 um | 0.34 | kg | Particulates, <2.5 um, emission/air, unspecified |
| Methane, fossils | 7.15 × 10⁻² | kg | Methane, fossils, emission/air, unspecified |
| Sulfur oxides | 6.66 × 10⁻² | kg | Sulfur oxides, emission/air, unspecified |
| Carbon dioxide | 5.59 × 10⁻² | kg | Carbon dioxide, emission/air, unspecified |
| NMVOC, non-methane VOCS, unspecified origin | 3.36 × 10⁻² | kg | Non-methane volatile organic compounds, emission/air, unspecified |
| Formaldehyde | 3.46 × 10⁻³ | kg | Formaldehyde, emission/air, unspecified |
| Output, Emissions to water [66] | |||
| Solved solids | 5.90 | kg | Organic compounds, emission/water, unspecified |
| Chloride | 5.90 | kg | Total suspended solids, emission/water, unspecified |
| Ethane, 1,2-dichloro | 2.07 | kg | Suspended solids, inorganic, emission/water, unspecified |
| Sodium, ion | 1.96 | kg | Sodium, emission/water, unspecified |
| Calcium, ion | 0.51 | kg | Calcium, emission/water, unspecified |
| Propionic acid | 0.51 | kg | Propionic acid, emission/water, unspecified |
| Sulfate | 0.38 | kg | Sulfate, emission/water, unspecified |
| Zinc | 0.38 | kg | Zinc, emission/water, unspecified |
| Suspended solids, unspecified | 0.19 | kg | Suspended solids, emission/water, unspecified |
| Ethylene oxide | 0.19 | kg | Ethylene oxide, emission/water, unspecified |
| COD, Chemical oxygen demand | 0.16 | kg | Chemical Oxygen Demand, emission/water, unspecified |
| Carboxylic acids, unspecified | 0.16 | kg | Carboxylic acids, emission/water, unspecified |
| BOD5, Biological oxygen demand | 0.15 | kg | Organic compounds, emission/water, unspecified |
| Benzoic acid | 0.15 | Kg | Benzoic acid, emission/water, unspecified |
| Magnesium | 0.12 | kg | Magnesium, emission/water, unspecified |
| Output, Emissions to soil | |||
| Solids | 29.20 | kg | Market for municipal solid waste|Netherlands |
Appendix B
| Cost | Value | Unit | Source |
|---|---|---|---|
| Hourly average salary | 15.296 | EUR/h | [67] |
| Spruce | 110.90 | EUR/m3 | [68] |
| Waste treatment | 39.70 | EUR/ton | [69] |
| Energy and fuel | |||
| Electricity | 0.196 | EUR/kWh | [43] [43] |
| Natural gas | 0.934 | EUR/m3 | |
| Propane | 1.240 | EUR/L | [70] |
| Diesel | 1.602 | EUR/L | [71] |
| Gasoline | 1.875 | EUR/L | [71] |
| Liquified petroleum gas | 0.809 | EUR/L | [71] |
| Adhesives | |||
| Melamine | 1.179 | EUR/kg | [72] |
| Urea | 0.219 | EUR/kg | [73] |
| Formic acid | 0.633 | EUR/kg | [74] |
| Ammonium sulfate | 0.158 | EUR/kg | [75] |
| Methanol | 0.580 | EUR/kg | [76] |
| Sodium hydroxide | 0.222 | EUR/kg | [77] |
| Phenol | 1.044 | EUR/kg | [78] |
| Resorcinol | 6.040 | EUR/kg | [79] |
| Ethanol | 0.831 | EUR/kg | [80] |
| Lignin | 0.330 | EUR/kg | [81] |
| Glyoxal | 0.660 | EUR/kg | [82] |
| Formaldehyde | 0.330 | EUR/kg | [83] |
| Furfuryl alcohol | 1.244 | EUR/kg | [84] |
| Distilled water | 1.198 | EUR/kg | [85] |
| Tannin | 1644 | EUR/ton | [86] |
Appendix C
| Impact Category/Life Cycle Module | A1–A2 (Input, Material Sourcing) | A3 (Input, Energy) | A3 (Output, Emissions) |
|---|---|---|---|
| AP [mol H+-eq] | 6.04 × 10⁻³ | 1.51 × 10⁻⁷ | 3.50 × 10⁻⁵ |
| GWP-total [kg CO2-eq] | 1.36 | 2.56 × 10⁻² | 8.40 × 10⁻³ |
| GWP-biogenic [kg CO2-eq] | 5.23 × 10⁻⁴ | 4.48 × 10⁻⁷ | 2.26 × 10⁻⁶ |
| GWP-fossil [kg CO2-eq] | 1.36 | 2.56 × 10⁻² | 8.39 × 10⁻³ |
| GWP-luluc [kg CO2-eq] | 4.62 × 10⁻⁴ | 1.84 × 10⁻⁸ | 1.60 × 10⁻⁶ |
| ETP-fw [CTUe] | 2.83 × 10+1 | 8.75 × 10⁻¹ | 5.42 × 10⁻² |
| EP-freshwater [kg P-eq] | 2.39 × 10⁻⁴ | 9.37 × 10⁻⁹ | 4.43 × 10⁻⁷ |
| EP-marine [kg N-eq] | 1.38 × 10⁻³ | 7.69 × 10⁻⁸ | 1.01 × 10⁻⁵ |
| EP-terrestrial [mol N-eq] | 1.61 × 10⁻² | 4.35 × 10⁻⁷ | 1.04 × 10⁻⁴ |
| HTP-c [CTUh] | 3.83 × 10⁻⁹ | 6.35 × 10⁻¹² | 2.30 × 10⁻¹¹ |
| HTP-nc [CTUh] | 2.39 × 10⁻⁸ | 3.27 × 10⁻¹¹ | 6.33 × 10⁻¹¹ |
| IRP [kBd U235-eq] | 4.35 × 10⁻² | 2.56 × 10⁻⁶ | 6.35 × 10⁻⁵ |
| SQP [Pt/m2*yr] | 2.82 | 1.03 × 10⁻⁴ | 5.72 × 10⁻³ |
| OPD [kg CFC11-eq] | 6.24 × 10⁻⁸ | 5.04 × 10⁻¹² | 1.06 × 10⁻⁹ |
| PM [disease incidence] | 6.98 × 10⁻⁸ | 1.04 × 10⁻¹² | 1.12 × 10⁻¹⁰ |
| POPC [kg NMOV-eq] | 4.80 × 10⁻³ | 5.02 × 10⁻⁵ | 6.49 × 10⁻⁵ |
| ADP-fossil [MJ] | 3.70 × 10+1 | 2.06 × 10⁻³ | 6.21 × 10⁻¹ |
| ADP-m [kg SB-eq] | 9.99 × 10⁻⁶ | 3.20 × 10⁻¹⁰ | 5.25 × 10⁻⁹ |
| WDP [m3] | 2.36 × 10⁻¹ | 1.36 × 10⁻⁵ | 4.91 × 10⁻⁴ |
| Impact Category/Life Cycle Module | A1–A2 (Input, Material Sourcing) | A3 (Input, Energy) | A3 (Output, Emissions) |
|---|---|---|---|
| AP [mol H+-eq] | 1.41 × 10⁻² | 1.49 × 10⁻⁷ | 8.23 × 10⁻⁵ |
| GWP-total [kg CO2-eq] | 3.58 | 6.86 × 10⁻² | 1.98 × 10⁻² |
| GWP-biogenic [kg CO2-eq] | 1.52 × 10⁻³ | 1.39 × 10⁻⁶ | 5.32 × 10⁻⁶ |
| GWP-fossil [kg CO2-eq] | 3.58 | 6.86 × 10⁻² | 1.98 × 10⁻² |
| GWP-luluc [kg CO2-eq] | 1.35 × 10⁻³ | 1.19 × 10⁻⁸ | 3.77 × 10⁻⁶ |
| ETP-fw [CTUe] | 1.13 × 10+2 | 5.67 | 1.29 × 10⁻¹ |
| EP-freshwater [kg P-eq] | 6.31 × 10⁻⁴ | 1.18 × 10⁻⁸ | 1.05 × 10⁻⁶ |
| EP-marine [kg N-eq] | 1.94 × 10⁻² | 1.60 × 10⁻⁷ | 2.37 × 10⁻⁵ |
| EP-terrestrial [mol N-eq] | 2.15 × 10⁻² | 5.28 × 10⁻⁷ | 2.45 × 10⁻⁴ |
| HTP-c [CTUh] | 8.35 × 10⁻⁹ | 2.47 × 10⁻¹¹ | 5.43 × 10⁻¹¹ |
| HTP-nc [CTUh] | 4.72 × 10⁻⁸ | 1.31 × 10⁻¹⁰ | 1.49 × 10⁻¹⁰ |
| IRP [kBd U235-eq] | 1.46 × 10⁻¹ | 1.48 × 10⁻⁶ | 1.50 × 10⁻⁴ |
| SQP [Pt/m2*yr] | 6.19 | 1.19 × 10⁻⁴ | 1.35 × 10⁻² |
| OPD [kg CFC11-eq] | 1.10 × 10⁻⁷ | 2.21 × 10⁻¹² | 2.49 × 10⁻⁹ |
| PM [disease incidence] | 1.31 × 10⁻⁷ | 1.25 × 10⁻¹² | 2.63 × 10⁻¹⁰ |
| POPC [kg NMOV-eq] | 1.28 × 10⁻² | 4.08 × 10⁻⁵ | 1.53 × 10⁻⁴ |
| ADP-fossil [MJ] | 7.87 × 10+1 | 1.07 × 10⁻³ | 1.46 |
| ADP-m [kg SB-eq] | 1.49 × 10⁻⁵ | 1.98 × 10⁻¹⁰ | 1.24 × 10⁻⁸ |
| WDP [m3] | 7.78 × 10⁻¹ | 8.65 × 10⁻⁶ | 1.16 × 10⁻³ |
| Impact Category/Life Cycle Module | A1–A2 (Input, Material Sourcing) | A3 (Input, Energy) | A3 (Output, Emissions) |
|---|---|---|---|
| AP [mol H+-eq] | 2.91 × 10⁻³ | 1.57 × 10⁻⁷ | 2.13 × 10⁻⁵ |
| GWP-total [kg CO2-eq] | 9.42 × 10⁻¹ | 1.77 × 10⁻² | 5.11 × 10⁻³ |
| GWP-biogenic [kg CO2-eq] | 4.54 × 10⁻⁴ | 1.69 × 10⁻⁶ | 1.38 × 10⁻⁶ |
| GWP-fossil [kg CO2-eq] | 9.41 × 10⁻¹ | 1.77 × 10⁻² | 5.11 × 10⁻³ |
| GWP-luluc [kg CO2-eq] | 3.91 × 10⁻⁴ | 1.16 × 10⁻⁸ | 9.75 × 10⁻⁷ |
| ETP-fw [CTUe] | 2.01 × 10+1 | 3.71 × 10⁻² | 3.41 × 10⁻² |
| EP-freshwater [kg P-eq] | 1.71 × 10⁻⁴ | 1.31 × 10⁻⁸ | 2.72 × 10⁻⁷ |
| EP-marine [kg N-eq] | 6.04 × 10⁻⁴ | 1.90 × 10⁻⁷ | 6.13 × 10⁻⁶ |
| EP-terrestrial [mol N-eq] | 6.04 × 10⁻³ | 5.91 × 10⁻⁷ | 6.32 × 10⁻⁵ |
| HTP-c [CTUh] | 2.93 × 10⁻⁹ | 6.27 × 10⁻¹² | 1.40 × 10⁻¹¹ |
| HTP-nc [CTUh] | 1.58 × 10⁻⁸ | 1.42 × 10⁻¹¹ | 3.87 × 10+11 |
| IRP [kBd U235-eq] | 5.37 × 10⁻² | 1.41 × 10⁻⁶ | 3.86 × 10⁻⁵ |
| SQP [Pt/m2*yr] | 2.10 | 1.28 × 10⁻⁴ | 3.49 × 10⁻³ |
| OPD [kg CFC11-eq] | 5.49 × 10⁻⁸ | 2.29 × 10⁻¹² | 6.44 × 10⁻¹⁰ |
| PM [disease incidence] | 2.25 × 10⁻⁸ | 1.34 × 10⁻¹² | 6.80 × 10⁻¹¹ |
| POPC [kg NMOV-eq] | 4.19 × 10⁻³ | 3.09 × 10⁻⁵ | 3.95 × 10⁻⁵ |
| ADP-fossil [MJ] | 2.98 × 10+1 | 1.04 × 10⁻³ | 3.77 × 10⁻¹ |
| ADP-m [kg SB-eq] | 6.68 × 10⁻⁶ | 1.82 × 10⁻¹⁰ | 3.20 × 10⁻⁹ |
| WDP [m3] | 1.79 × 10⁻¹ | 1.01 × 10⁻⁵ | 2.99 × 10⁻⁴ |
| Impact Category/Life Cycle Module | A1–A2 (Input, Material Sourcing) | A3 (Input, Energy) | A3 (Output, Emissions) |
|---|---|---|---|
| AP [mol H+-eq] | 2.47 × 10⁻³ | 9.03 × 10⁻⁸ | 4.61 × 10⁻⁵ |
| GWP-total [kg CO2-eq] | 6.72 × 10⁻¹ | 1.87 × 10⁻² | 1.11 × 10⁻² |
| GWP-biogenic [kg CO2-eq] | 4.16 × 10⁻⁴ | 8.21 × 10⁻⁷ | 2.99 × 10⁻⁶ |
| GWP-fossil [kg CO2-eq] | 6.71 × 10⁻¹ | 1.87 × 10⁻² | 1.11 × 10⁻² |
| GWP-luluc [kg CO2-eq] | 7.40 × 10⁻⁴ | 7.25 × 10⁻⁹ | 2.12 × 10⁻⁶ |
| ETP-fw [CTUe] | 1.38 × 10+1 | 1.69 | 7.25 × 10⁻² |
| EP-freshwater [kg P-eq] | 1.63 × 10⁻⁴ | 7.03 × 10⁻⁹ | 5.88 × 10⁻⁷ |
| EP-marine [kg N-eq] | 4.24 × 10⁻⁴ | 9.49 × 10⁻⁸ | 1.33 × 10⁻⁵ |
| EP-terrestrial [mol N-eq] | 4.14 × 10⁻³ | 3.17 × 10⁻⁷ | 1.37 × 10⁻⁴ |
| HTP-c [CTUh] | 2.77 × 10⁻⁹ | 3.05 × 10⁻¹² | 3.04 × 10⁻¹¹ |
| HTP-nc [CTUh] | 1.09 × 10⁻⁸ | 3.49 × 10⁻¹¹ | 8.38 × 10⁻¹¹ |
| IRP [kBd U235-eq] | 8.56 × 10⁻² | 8.92 × 10⁻⁷ | 8.42 × 10⁻⁵ |
| SQP [Pt/m2*yr] | 4.44 × 10+1 | 7.05 × 10⁻⁵ | 7.58 × 10⁻³ |
| OPD [kg CFC11-eq] | 3.40 × 10⁻⁸ | 1.62 × 10⁻¹² | 1.40 × 10⁻⁹ |
| PM [disease incidence] | 1.58 × 10⁻⁸ | 7.55 × 10⁻¹³ | 1.48 × 10⁻¹⁰ |
| POPC [kg NMOV-eq] | 2.73 × 10⁻³ | 8.42 × 10⁻⁶ | 8.57 × 10⁻⁵ |
| ADP-fossil [MJ] | 1.93 × 10+1 | 7.27 × 10⁻⁴ | 8.19 × 10⁻¹ |
| ADP-m [kg SB-eq] | 3.75 × 10⁻⁶ | 1.15 × 10⁻¹⁰ | 6.95 × 10⁻⁹ |
| WDP [m3] | 2.77 × 10⁻¹ | 6.61 × 10⁻⁶ | 6.50 × 10⁻⁴ |
| Impact Category/Life Cycle Module | A1–A2 (Input, Material Sourcing) | A3 (Input, Energy) | A3 (Output, Emissions) |
|---|---|---|---|
| AP [mol H+-eq] | 4.73 × 10⁻³ | 9.34 × 10⁻⁸ | 3.94 × 10⁻⁵ |
| GWP-total [kg CO2-eq] | 4.63 × 10⁻¹ | 2.61 × 10⁻² | 9.47 × 10⁻³ |
| GWP-biogenic [kg CO2-eq] | 2.69 × 10⁻⁴ | 8.22 × 10⁻⁷ | 2.55 × 10⁻⁶ |
| GWP-fossil [kg CO2-eq] | 4.61 × 10⁻¹ | 2.61 × 10⁻² | 9.46 × 10⁻³ |
| GWP-luluc [kg CO2-eq] | 9.49 × 10⁻⁴ | 8.33 × 10⁻⁹ | 1.81 × 10⁻⁶ |
| ETP-fw [CTUe] | 3.61 × 10+1 | 1.61 | 6.19 × 10⁻² |
| EP-freshwater [kg P-eq] | 6.43 × 10⁻⁵ | 7.33 × 10⁻⁹ | 5.02 × 10⁻⁷ |
| EP-marine [kg N-eq] | 4.23 × 10⁻³ | 9.70 × 10⁻⁸ | 1.14 × 10⁻⁵ |
| EP-terrestrial [mol N-eq] | 1.99 × 10⁻² | 3.38 × 10⁻⁷ | 1.17 × 10⁻⁴ |
| HTP-c [CTUh] | 9.97 × 10⁻⁹ | 1.16 × 10⁻¹¹ | 2.60 × 10⁻¹¹ |
| HTP-nc [CTUh] | 4.63 × 10⁻⁷ | 5.47 × 10⁻¹¹ | 7.16 × 10⁻¹¹ |
| IRP [kBd U235-eq] | 6.41 × 10⁻³ | 1.09 × 10⁻⁶ | 7.19 × 10⁻⁵ |
| SQP [Pt/m2*yr] | 5.13 | 7.23 × 10⁻⁵ | 6.47 × 10⁻³ |
| OPD [kg CFC11-eq] | 9.43 × 10⁻⁹ | 2.05 × 10⁻¹² | 1.19 × 10⁻⁹ |
| PM [disease incidence] | 4.75 × 10⁻⁸ | 7.40 × 10⁻¹³ | 1.26 × 10⁻¹⁰ |
| POPC [kg NMOV-eq] | 2.36 × 10⁻³ | 8.43 × 10⁻⁶ | 7.32 × 10⁻⁵ |
| ADP-fossil [MJ] | 5.97 | 8.54 × 10⁻⁴ | 6.99 × 10⁻¹ |
| ADP-m [kg SB-eq] | 1.45 × 10⁻⁶ | 1.31 × 10⁻¹⁰ | 5.93 × 10⁻⁹ |
| WDP [m3] | −4.58 × 10⁻¹ | 6.80 × 10⁻⁶ | 5.55 × 10⁻⁴ |
| Impact Category/Life Cycle Module | A1-A3 (Material Sourcing and Manufacturing) | A4 (Transport to Site) | C (EOL 1: 100% Incineration) | D (Benefits Beyond Boundary, EOL1) |
|---|---|---|---|---|
| AP [mol H+-eq] | 2.44 | 7.24 × 10⁻² | 2.35 × 10⁻² | −1.07 × 10⁻¹ |
| GWP-total [kg CO2-eq] | 1.21 × 10+2 | 2.98 × 10+1 | 6.07 | −1.20 × 10⁻¹ |
| GWP-biogenic [kg CO2-eq] | 3.23 × 10⁻¹ | 6.41 × 10⁻³ | 7.61 × 10⁻³ | −1.82 × 10⁻² |
| GWP-fossil [kg CO2-eq] | 1.20 × 10+2 | 2.98 × 10+1 | 6.05 | −1.20 × 10+1 |
| GWP-luluc [kg CO2-eq] | 8.18 × 10⁻¹ | 1.11 × 10⁻² | 1.09 × 10⁻² | −2.88 × 10⁻² |
| ETP-fw [CTUe] | 9.84 × 10+3 | 2.87 × 10+2 | 1.27 × 10+2 | −4.20 × 10+2 |
| EP-freshwater [kg P-eq] | 2.31 × 10⁻² | 2.18 × 10⁻³ | 3.32 × 10⁻³ | −5.73 × 10⁻³ |
| EP-marine [kg N-eq] | 4.80 × 10⁻¹ | 1.94 × 10⁻² | 4.82 × 10⁻³ | −5.09 × 10⁻² |
| EP-terrestrial [mol N-eq] | 4.99 | 2.06 × 10⁻¹ | 4.48 × 10⁻² | −4.94 × 10⁻¹ |
| HTP-c [CTUh] | 1.53 × 10⁻⁶ | 8.17 × 10⁻⁸ | 2.79 × 10⁻⁸ | −1.14 × 10⁻⁷ |
| HTP-nc [CTUh] | 4.28 × 10⁻⁶ | 4.41 × 10⁻⁷ | 1.32 × 10⁻⁷ | −1.45 × 10⁻⁶ |
| IRP [kBd U235-eq] | 1.15 × 10+1 | 5.06 × 10⁻¹ | 2.24 | −1.28 |
| SQP [Pt/m2*yr] | 7.63 × 10+4 | 4.54 × 10+2 | 5.06 × 10+1 | −4.19 × 10+3 |
| OPD [kg CFC11-eq] | 3.38 × 10⁻⁶ | 6.75 × 10⁻⁷ | 1.14 × 10⁻⁷ | −1.41 × 10⁻⁷ |
| PM [disease incidence] | 1.41 × 10⁻⁴ | 2.95 × 10⁻⁶ | 3.20 × 10⁻⁷ | −1.78 × 10⁻⁶ |
| POPC [kg NMOV-eq] | 1.92 | 1.21 × 10⁻¹ | 1.91 × 10⁻² | −1.31 × 10⁻¹ |
| ADP-fossil [MJ] | 2.39 × 10+3 | 4.91 × 10+2 | 1.32 × 10+2 | −1.70 × 10+2 |
| ADP-m [kg SB-eq] | 2.67 × 10⁻⁴ | 8.67 × 10⁻⁵ | 1.58 × 10⁻⁵ | −2.42 × 10⁻⁵ |
| WDP [m3] | 4.14 × 10+1 | 2.56 | 2.06 | −5.66 |
| Impact Category/Life Cycle Module | A1-A3 (Material Sourcing and Manufacturing) | A4 (Transport to Site) | C (EOL 1: 100% Incineration) | D (Benefits Beyond Boundary, EOL1) |
|---|---|---|---|---|
| AP [mol H+-eq] | 2.53 | 7.24 × 10⁻² | 2.35 × 10⁻² | −1.07 × 10⁻¹ |
| GWP-total [kg CO2-eq] | 1.45 × 10+2 | 2.98 × 10+1 | 6.07 | −1.20 × 10+1 |
| GWP-biogenic [kg CO2-eq] | 3.34 × 10⁻¹ | 6.41 × 10+−3 | 7.61 × 10⁻³ | −1.82 × 10⁻² |
| GWP-fossil [kg CO2-eq] | 1.44 × 10+2 | 2.98 × 10+1 | 6.05 | −1.20 × 10+1 |
| GWP-luluc [kg CO2-eq] | 8.27 × 10⁻¹ | 1.11 × 10⁻² | 1.09 × 10⁻² | −2.88 × 10⁻² |
| ETP-fw [CTUe] | 1.08 × 10+4 | 2.87 × 10+2 | 1.27 × 10+2 | −4.20 × 10+2 |
| EP-freshwater [kg P-eq] | 2.74 × 10⁻² | 2.18 × 10⁻³ | 3.32 × 10⁻³ | −5.73 × 10⁻³ |
| EP-marine [kg N-eq] | 6.78 × 10⁻¹ | 1.94 × 10⁻² | 4.82 × 10⁻³ | −5.09 × 10⁻² |
| EP-terrestrial [mol N-eq] | 5.05 | 2.06 × 10⁻¹ | 4.48 × 10⁻² | −4.94 × 10⁻¹ |
| HTP-c [CTUh] | 1.58 × 10⁻⁶ | 8.17 × 10⁻⁸ | 2.79 × 10⁻⁸ | −1.14 × 10⁻⁷ |
| HTP-nc [CTUh] | 4.53 × 10⁻⁶ | 4.41 × 10⁻⁷ | 1.32 × 10⁻⁷ | −1.45 × 10⁻⁶ |
| IRP [kBd U235-eq] | 1.26 × 10+1 | 5.06 × 10⁻¹ | 2.24 | −1.28 |
| SQP [Pt/m2*yr] | 7.63 × 10+4 | 4.54 × 10+2 | 5.06 × 10+1 | −4.19 × 10+3 |
| OPD [kg CFC11-eq] | 3.91 × 10⁻⁶ | 6.75 × 10⁻⁷ | 1.14 × 10⁻⁷ | −1.41 × 10⁻⁷ |
| PM [disease incidence] | 1.42 × 10⁻⁴ | 2.95 × 10⁻⁶ | 3.20 × 10⁻⁷ | −1.78 × 10⁻⁶ |
| POPC [kg NMOV-eq] | 2.01 | 1.21 × 10⁻¹ | 1.91 × 10⁻² | −1.31 × 10⁻¹ |
| ADP-fossil [MJ] | 2.85 × 10+3 | 4.91 × 10+2 | 1.32 × 10+2 | −1.70 × 10+2 |
| ADP-m [kg SB-eq] | 3.21 × 10⁻⁴ | 8.67 × 10⁻⁵ | 1.58 × 10⁻⁵ | −2.42 × 10⁻⁵ |
| WDP [m3] | 2.40 × 10+1 | 2.56 | 2.06 | −5.66 |
| Impact Category/Life Cycle Module | A1-A3 (Material Sourcing and Manufacturing) | A4 (Transport to Site) | C (EOL 1: 100% Incineration) | D (Benefits Beyond Boundary, EOL1) |
|---|---|---|---|---|
| AP [mol H+-eq] | 2.40 | 7.24 × 10⁻² | 2.35 × 10⁻² | −1.07 × 10⁻¹ |
| GWP-total [kg CO2-eq] | 1.16 × 10+2 | 2.98 × 10+1 | 6.07 | −1.20 × 10⁻¹ |
| GWP-biogenic [kg CO2-eq] | 3.22 × 10⁻¹ | 6.41 × 10⁻³ | 7.61 × 10⁻³ | −1.82 × 10⁻² |
| GWP-fossil [kg CO2-eq] | 1.15 × 10+2 | 2.98 × 10+1 | 6.05 | −1.20 × 10+1 |
| GWP-luluc [kg CO2-eq] | 8.17 × 10⁻¹ | 1.11 × 10⁻² | 1.09 × 10⁻² | −2.88 × 10⁻² |
| ETP-fw [CTUe] | 9.75 × 10+3 | 2.87 × 10+2 | 1.27 × 10+2 | −4.20 × 10+2 |
| EP-freshwater [kg P-eq] | 2.24 × 10⁻² | 2.18 × 10⁻³ | 3.32 × 10⁻³ | −5.73 × 10⁻³ |
| EP-marine [kg N-eq] | 4.71 × 10⁻¹ | 1.94 × 10⁻² | 4.82 × 10⁻³ | −5.09 × 10⁻² |
| EP-terrestrial [mol N-eq] | 4.88 | 2.06 × 10⁻¹ | 4.48 × 10⁻² | −4.94 × 10⁻¹ |
| HTP-c [CTUh] | 1.52 × 10⁻⁶ | 8.17 × 10⁻⁸ | 2.79 × 10⁻⁸ | −1.14 × 10⁻⁷ |
| HTP-nc [CTUh] | 4.19 × 10⁻⁶ | 4.41 × 10⁻⁷ | 1.32 × 10⁻⁷ | −1.45 × 10⁻⁶ |
| IRP [kBd U235-eq] | 1.16 × 10+1 | 5.06 × 10⁻¹ | 2.24 | −1.28 |
| SQP [Pt/m2*yr] | 7.63 × 10+4 | 4.54 × 10+2 | 5.06 × 10+1 | −4.19 × 10+3 |
| OPD [kg CFC11-eq] | 3.30 × 10⁻⁶ | 6.75 × 10⁻⁷ | 1.14 × 10⁻⁷ | −1.41 × 10⁻⁷ |
| PM [disease incidence] | 1.40 × 10⁻⁴ | 2.95 × 10⁻⁶ | 3.20 × 10⁻⁷ | −1.78 × 10⁻⁶ |
| POPC [kg NMOV-eq] | 1.91 | 1.21 × 10⁻¹ | 1.91 × 10⁻² | −1.31 × 10⁻¹ |
| ADP-fossil [MJ] | 2.32 × 10+4 | 4.91 × 10+2 | 1.32 × 10+2 | −1.70 × 10+2 |
| ADP-m [kg SB-eq] | 2.30 × 10⁻⁴ | 8.67 × 10⁻⁵ | 1.58 × 10⁻⁵ | −2.42 × 10⁻⁵ |
| WDP [m3] | 1.74 × 10+1 | 2.56 | 2.06 | −5.66 |
| Impact Category/Life Cycle Module | A1–A3 | A4 | C (EOL1) | C (EOL2) | C (EOL3) | D (EOL1) | D (EOL2) | D (EOL 3) |
|---|---|---|---|---|---|---|---|---|
| AP [mol H+-eq] | 2.40 × 10⁻² | 7.24 × 10⁻² | 2.35 × 10⁻² | 2.35 × 10⁻² | 1.35 × 10⁻¹ | −1.07 × 10⁻¹ | −9.66 × 10⁻² | −3.49 × 10⁻¹ |
| GWP-total [kg CO2-eq] | 1.13 × 10+2 | 2.98 × 10⁻¹ | 6.07 | 6.07 | 1.95 × 10+1 | −1.20 × 10+1 | −1.64 × 10+1 | −4.45 × 10+1 |
| GWP-biogenic [kg CO2-eq] | 3.22 × 10⁻¹ | 6.41 × 10⁻³ | 7.61 × 10⁻³ | 7.61 × 10⁻³ | 3.19 × 10⁻² | −1.82 × 10⁻² | −1.75 × 10⁻² | −5.81 × 10⁻² |
| GWP-fossil [kg CO2-eq] | 1.12 × 10+2 | 2.98 × 10+1 | 6.05 | 6.05 | 1.93 × 10+1 | −1.20 × 10+1 | −1.64 × 10+1 | −4.38 × 10+1 |
| GWP-luluc [kg CO2-eq] | 8.21 × 10⁻¹ | 1.11 × 10⁻² | 1.09 × 10⁻² | 1.09 × 10⁻² | 2.18 × 10⁻¹ | −2.88 × 10⁻² | −3.70 × 10⁻² | −5.94 × 10⁻¹ |
| ETP-fw [CTUe] | 9.68 × 10+3 | 2.87 × 10+2 | 1.27 × 10+2 | 1.27 × 10+2 | 4.24 × 10+2 | −4.20 × 10+2 | −3.54 × 10+2 | −9.30 × 10+2 |
| EP-freshwater [kg P-eq] | 2.23 × 10⁻² | 2.18 × 10⁻³ | 3.32 × 10⁻³ | 3.32 × 10⁻³ | 6.93 × 10⁻³ | −5.73 × 10⁻³ | −6.06 × 10⁻³ | −1.61 × 10⁻² |
| EP-marine [kg N-eq] | 4.69 × 10⁻¹ | 1.94 × 10⁻² | 4.82 × 10⁻³ | 4.82E-03 | 4.93 × 10⁻² | −5.09 × 10⁻² | −3.61 × 10⁻² | −1.40 × 10⁻¹ |
| EP-terrestrial [mol N-eq] | 4.86 | 2.06 × 10⁻¹ | 4.48 × 10⁻² | 4.48 × 10⁻² | 5.34 × 10⁻¹ | −4.94 × 10⁻¹ | −3.68 × 10⁻¹ | −1.47 |
| HTP-c [CTUh] | 1.51 × 10⁻⁶ | 8.17 × 10⁻⁸ | 2.79 × 10⁻⁸ | 2.79 × 10⁻⁸ | 1.34 × 10⁻⁷ | −1.14 × 10⁻⁷ | −9.44 × 10⁻⁸ | −2.89 × 10⁻⁷ |
| HTP-nc [CTUh] | 4.14 × 10⁻⁶ | 4.41 × 10+−7 | 1.32 × 10⁻⁷ | 1.32 × 10⁻⁷ | 5.23 × 10⁻⁷ | −1.45 × 10⁻⁶ | −6.94 × 10⁻⁷ | −1.51 × 10⁻⁶ |
| IRP [kBd U235-eq] | 1.20 × 10+1 | 5.06 × 10⁻¹ | 2.24 | 2.24 | 4.04 | −1.28 | −2.92 | −8.85 |
| SQP [Pt/m2*yr] | 7.67 × 10+4 | 4.54 × 10+2 | 5.06 × 10+1 | 5.06 × 10+1 | 1.99 × 10+4 | −4.19 × 10+3 | −4.26 × 10+3 | −5.75 × 10+4 |
| OPD [kg CFC11-eq] | 3.08 × 10⁻⁶ | 6.75 × 10⁻⁷ | 1.14 × 10⁻⁷ | 1.14 × 10⁻⁷ | 3.48 × 10⁻⁷ | −1.41 × 10⁻⁷ | −2.78 × 10⁻⁷ | −7.60 × 10⁻⁷ |
| PM [disease incidence] | 1.40 × 10⁻⁴ | 2.95 × 10⁻⁶ | 3.20 × 10⁻⁷ | 3.20 × 10⁻⁷ | 7.93 × 10⁻⁶ | −1.78 × 10⁻⁶ | −1.91 × 10⁻⁶ | −2.13 × 10⁻⁵ |
| POPC [kg NMOV-eq] | 1.89 | 1.21 × 10⁻¹ | 1.91 × 10⁻² | 1.91 × 10⁻² | 2.08 × 10⁻¹ | −1.31 × 10⁻¹ | −1.15 × 10⁻¹ | −5.64 × 10⁻¹ |
| ADP-fossil [MJ] | 2.20 × 10+3 | 4.91 × 10+2 | 1.32 × 10+2 | 1.32 × 10+2 | 3.55 × 10+2 | −1.70 × 10+2 | −2.88 × 10+2 | −7.89 × 10+2 |
| ADP-m [kg SB-eq] | 1.98 × 10⁻⁴ | 8.67 × 10⁻⁵ | 1.58 × 10⁻⁵ | 1.58 × 10⁻⁵ | 6.84 × 10⁻⁵ | −2.42 × 10⁻⁵ | −4.50 × 10⁻⁵ | −1.16 × 10⁻⁴ |
| WDP [m3] | 1.85 × 10+1 | 2.56 | 2.06 | 2.06 | 5.13 | −5.66 | −4.53 | −1.23 × 10+1 |
| Impact Category/Life Cycle Module | A1–A3 | A4 | C (EOL1) | C (EOL2) | C (EOL3) | D (EOL1) | D (EOL2) | D (EOL 3) |
|---|---|---|---|---|---|---|---|---|
| AP [mol H+-eq] | 2.42 | 7.24× 10⁻² | 2.35× 10⁻² | 2.35× 10⁻² | 1.35× 10⁻¹ | −1.07× 10⁻¹ | −9.66× 10⁻² | −3.49× 10⁻¹ |
| GWP-total [kg CO2-eq] | 1.11 × 10+2 | 2.98× 10+1 | 6.07 | 6.07 | 1.95× 10+1 | −1.20× 10+1 | −1.64× 10+1 | −4.45× 10+1 |
| GWP-biogenic [kg CO2-eq] | 3.20 × 10⁻¹ | 6.41× 10⁻³ | 7.61× 10⁻³ | 7.61× 10⁻³ | 3.19× 10⁻² | −1.82× 10⁻² | −1.75× 10⁻² | −5.81× 10⁻² |
| GWP-fossil [kg CO2-eq] | 1.10 × 10+2 | 2.98× 10+1 | 6.05 | 6.05 | 1.93× 10+1 | −1.20× 10+1 | −1.64× 10+1 | −4.38× 10+1 |
| GWP-luluc [kg CO2-eq] | 8.23 × 10⁻¹ | 1.11× 10⁻² | 1.09× 10⁻² | 1.09× 10⁻² | 2.18× 10⁻¹ | −2.88× 10⁻² | −3.70× 10⁻² | −5.94× 10⁻¹ |
| ETP-fw [CTUe] | 9.92 × 10+3 | 2.87× 10+2 | 1.27× 10+2 | 1.27× 10+2 | 4.24× 10+2 | −4.20× 10+2 | −3.54× 10+2 | −9.30× 10+2 |
| EP-freshwater [kg P-eq] | 2.12 × 10⁻² | 2.18× 10⁻³ | 3.32× 10⁻³ | 3.32× 10⁻³ | 6.93× 10⁻³ | −5.73× 10⁻³ | −6.06× 10⁻³ | −1.61× 10⁻² |
| EP-marine [kg N-eq] | 5.11 × 10⁻¹ | 1.94× 10⁻² | 4.82× 10⁻³ | 4.82× 10⁻³ | 4.93× 10⁻² | −5.09× 10⁻² | −3.61× 10⁻² | −1.40× 10⁻¹ |
| EP-terrestrial [mol N-eq] | 5.03 | 2.06× 10⁻¹ | 4.48× 10⁻² | 4.48× 10⁻² | 5.34× 10⁻¹ | −4.94× 10⁻¹ | −3.68× 10⁻¹ | −1.47 |
| HTP-c [CTUh] | 1.59 × 10⁻⁶ | 8.17× 10⁻⁸ | 2.79× 10⁻⁸ | 2.79× 10⁻⁸ | 1.34× 10⁻⁷ | −1.14× 10⁻⁷ | −9.44× 10⁻⁸ | −2.89× 10⁻⁷ |
| HTP-nc [CTUh] | 9.11 × 10⁻⁶ | 4.41× 10⁻⁷ | 1.32× 10⁻⁷ | 1.32× 10⁻⁷ | 5.23× 10⁻⁷ | −1.45× 10⁻⁶ | −6.94× 10⁻⁷ | −1.51× 10⁻⁶ |
| IRP [kBd U235-eq] | 1.11 × 10+1 | 5.06× 10⁻¹ | 2.24 | 2.24 | 4.04 | −1.28 | −2.92 | −8.85 |
| SQP [Pt/m2*yr] | 7.63 × 10+4 | 4.54× 10+2 | 5.06× 10+1 | 5.06× 10+1 | 1.99× 10+4 | −4.19× 10+3 | −4.26× 10+3 | −5.75× 10+4 |
| OPD [kg CFC11-eq] | 2.80× 10⁻⁶ | 6.75× 10⁻⁷ | 1.14× 10⁻⁷ | 1.14× 10⁻⁷ | 3.48× 10⁻⁷ | −1.41× 10⁻⁷ | −2.78× 10⁻⁷ | −7.60× 10⁻⁷ |
| PM [disease incidence] | 1.41× 10⁻⁴ | 2.95× 10⁻⁶ | 3.20× 10⁻⁷ | 3.20× 10⁻⁷ | 7.93× 10⁻⁶ | −1.78× 10⁻⁶ | −1.91× 10⁻⁶ | −2.13× 10⁻⁵ |
| POPC [kg NMOV-eq] | 1.89 | 1.21× 10⁻¹ | 1.91× 10⁻² | 1.91× 10⁻² | 2.08× 10⁻¹ | −1.31× 10⁻¹ | −1.15× 10⁻¹ | −5.64× 10-º |
| ADP-fossil [MJ] | 2.05 × 10+3 | 4.91× 10+2 | 1.32× 10+2 | 1.32× 10+2 | 3.55× 10+2 | −1.70× 10+2 | −2.88× 10+2 | −7.89× 10+2 |
| ADP-m [kg SB-eq] | 1.73 × 10⁻⁴ | 8.67 × 10⁻⁵ | 1.58 × 10⁻⁵ | 1.58 × 10⁻⁵ | 6.84× 10⁻⁵ | −2.42× 10⁻⁵ | −4.50× 10⁻⁵ | −1.16× 10⁻⁴ |
| WDP [m3] | 1.04 × 10+1 | 2.56 | 2.06 | 2.06 | 5.13 | −5.66 | −4.53 | −1.23 × 10+1 |
Appendix D
| Cost | Year 0 (Investment Year) | Year 100 (End-of-Life) |
|---|---|---|
| Product stage (A1–A3) | ||
| Raw material (MUF) | 150.85 | - |
| Raw material (PRF) | 163.11 | - |
| Raw material (PF) | 151.13 | - |
| Raw material (LPG) | 149.41 | - |
| Manufacturing (energy consumption) | 149.78 | - |
| Manufacturing (labor) | 122.40 | - |
| Waste treatment of residues | 1.16 | - |
| Transport to site (A4) | ||
| Transport, fuel | 22.06 | - |
| Transport (labor) | 96.36 | - |
| End-of-life (C) | ||
| Transport, fuel | - | 1.87 |
| Transport (labor) | - | 15.30 |
| EOL 1 and 2: wood chipping | - | 1.18 |
| EOL3: wood chipping | - | 0.36 |
| EOL3: recuperation glulam | - | 14.42 |
| Potential savings (D) | ||
| Sawdust, shavings and trimmings sold to farmers for bedding | −1.60 | - |
| EOL1: Energy recovery 100% incineration | - | −180.02 |
| EOL2: Recycle 70% into wood chips | - | −105.81 |
| EOL3: Reuse 70% glulam beams | - | −132.76 |
References
- United Nations Environmental Program (UNEP); Yale Center for Ecosystems and Architecture. Building Materials and the Climate: Constructing a New Future; UNEP Report; 2023; Available online: https://wedocs.unep.org/20.500.11822/43293 (accessed on 28 August 2025).
- Villoria Sáez, P.; Osmani, M. A diagnosis of construction and demolition waste generation and recovery practice in the European Union. J. Clean. Prod. 2019, 241, 118400. [Google Scholar] [CrossRef]
- Aicher, S.; Stapf, G. Block Glued Glulam—Bridges, Beams and Arches. In Proceedings of the World Conference on Timber Engineering (WCTE 2014), Session 4.8, Quebec City, QC, Canada, 10–14 August 2014. [Google Scholar] [CrossRef]
- Frihart, C.R.; Hunt, C.G. Chapter 10: Adhesives with wood materials: Bond formation and performance. In Wood handbook: Wood as an Engineering Material, Centennial ed.; 2010; Volume 190, pp. 10.1–10.24. Available online: https://www.fpl.fs.usda.gov/documnts/fplgtr/fplgtr190/chapter_10.pdf (accessed on 28 August 2025).
- Properzi, M.; Pizzi, A.; Uzielli, L. Comparative wet wood glueing performance of different types of Glulam wood adhesives. Eur. J. Wood Wood Prod. 2003, 61, 77–78. [Google Scholar] [CrossRef]
- Berdnikova, P.; Zhizhina, E.; Pai, Z. Phenol-Formaldehyde Resins: Properties, Fields of Application, and Methods of Synthesis. Catal. Chem. Petrochem. Ind. 2021, 13, 119–124. [Google Scholar] [CrossRef]
- Yang, M.; Rosentrater, K.A. Life Cycle Assessment of Urea-Formaldehyde Adhesive and Phenol-Formaldehyde Adhesives. Environ. Process. 2020, 7, 553–561. [Google Scholar] [CrossRef]
- Technology Readiness Levels (TRL). Available online: https://www.rvo.nl/onderwerpen/trl (accessed on 24 June 2025).
- Arias, A.; González-García, S.; Feijoo, G.; Moreira, M.T. Tannin-based bio-adhesives for the wood panel industry as sustainable alternatives to petrochemical resins. J. Ind. Ecol. 2021, 26, 627–642. [Google Scholar] [CrossRef]
- Gonçalves, D.; Bordado, J.M.; Marques, A.C.; dos Santos, R.G. Non-Formaldehyde, Bio-Based Adhesives for Use in Wood-Based Panel Manufacturing Industry—A Review. Polymers 2021, 13, 4086. [Google Scholar] [CrossRef]
- Kumar, C.; Leggate, W. An overview of bio-adhesives for engineered wood products. Int. J. Adhes. Adhes. 2022, 118, 103187. [Google Scholar] [CrossRef]
- Kienberger, M.; Maitz, S.; Pichler, T.; Demmelmayer, P. Systematic Review on Isolation Processes for Technical Lignin. Processes 2021, 9, 804. [Google Scholar] [CrossRef]
- Huang, C.; Peng, Z.; Li, J.; Li, X.; Jiang, X.; Dong, Y. Unlocking the role of lignin for preparing the lignin-based wood adhesive: A review. Ind. Crops Prod. 2022, 187 Pt A, 115388. [Google Scholar] [CrossRef]
- Hussin, M.H.; Aziz, A.A.; Ibrahim, M.; Latif, N. Development and characterization novel bio-adhesive for wood using kenaf core (Hibiscus cannabinus) lignin and glyoxal. Int. J. Biol. Macromol. 2019, 122, 713–722. [Google Scholar] [CrossRef] [PubMed]
- Vazma, I.; Krigers, G.; Valters, K. A Review of Bio-Based Adhesives from Primary and Secondary Biomass for Wood Composite Applications. Environ. Clim. Technol. 2022, 26, 1350–1360. [Google Scholar] [CrossRef]
- Dhawale, P.V.; Vineeth, S.K.; Gadhave, R.V.; Jabeen Fatima, M.J.; Supekar, M.V.; Thakur, V.K.; Raghavan, P. Tannin as a renewable raw material for adhesive applications: A review. Mater. Adv. 2022, 3, 3365–3388. [Google Scholar] [CrossRef]
- Oktay, S.; Pizzi, A.; Köken, N.; Bengü, B. Tannin-based wood panel adhesives. Int. J. Adhes. Adhes. 2024, 130, 103621. [Google Scholar] [CrossRef]
- Zhang, J.; Xi, X.; Liang, J.; Pizzi, A.; Du, G.; Deng, S. Tannin-based adhesive cross-linked by furfuryl alcohol-glyoxal and epoxy resins. Int. J. Adhes. Adhes. 2019, 94, 42–52. [Google Scholar] [CrossRef]
- Dubinsky, J.; Žagars, A.; Snidvongs, S.; Hirunlabh, J. Furfuryl Alcohol made from Agriculture Waste Review. In Proceedings of the Fourth National and the Third International Academic Symposium Innovation and Technology for Social Development, Bangkok, Thailand, 23 July 2018. [Google Scholar]
- Chrobak, J.; Iłowska, J.; Chrobok, A. Formaldehyde-Free Resins for the Wood-Based Panel Industry: Alternatives to Formaldehyde and Novel Hardeners. Molecules 2022, 27, 4862. [Google Scholar] [CrossRef] [PubMed]
- Yi, Z.; Wang, W.; Zhang, W.; Li, J. Preparation of tannin–formaldehyde–furfural resin with pretreatment of depolymerization of condensed tannin and ring opening of furfural. J. Adhes. Sci. Technol. 2016, 30, 947–959. [Google Scholar] [CrossRef]
- ISO 14040; Environmental Management-Life Cycle Assessment-Principles and Framework. International Organization for Standardization: Geneva, Switzerland, 2006.
- ISO 14044; Environmental Management-Life Cycle Assessment. Requirements and Guidelines. ISO: Geneva, Switzerland, 2006.
- NEN-EN 15804:2012+A2; Sustainability of Construction Works. Environmental Product Declarations. Core Rules for the Product Category of Construction Products, 2019. CEN: Brussels, Belgium, 2023.
- ISO 15686-5; Buildings and Constructed Assets. ISO: Geneva, Switzerland, 2017.
- Wilson, J.B. Life-cycle inventory of formaldehyde-based resins used in wood composites in terms of resources, emissions, energy and carbon. Wood Fiber Sci. 2010, 42, 125–143. [Google Scholar]
- Hellweg, S.; Messmer, A. Life Cycle Assessment (LCA) of Adhesives Used in Wood Constructions. Master Thesis, Institute of Ecological System Design-ETH Zürich, Swiss Federal Institute of Technology Zurich, Zurich, Switzerland, 2015. [Google Scholar]
- Vroege, G.J.; Wildschut, M. Environmental Product Declaration of DERIX Glued Laminated Timber (Glulam); Germany; 2024; Available online: https://www.mrpi.nl/epd/derix-glued-laminated-timber-glulam/ (accessed on 28 August 2025).
- NEN-EN 301:2017; Adhesives, Phenolic and Aminoplastic, for Loadbearing Timber Structures. Classification and Performance Requirements, 2017. CEN: Brussels, Belgium, 2023.
- NEN-EN 14080:2013; Timber Structures. Glued Laminated Timber and Glued Solid Timber. Requirements, 2013. CEN: Brussels, Belgium, 2023.
- Zwolle Train Station Footbridge. IPV Delft. Available online: https://ipvdelft.com/projects/zwolle-train-station-footbridge/ (accessed on 12 March 2025).
- NEN-EN 16485:2023; Round and Sawn Timber—Environmental Product Declarations. Product Category Rules for Wood and Wood-Based Products for Use in Construction, 2023. CEN: Brussels, Belgium, 2023.
- Haupt, R.A.; Sellers, T.J. Characterizations of phenol-formaldehyde resol resins. Ind. Eng. Chem. Res. 1994, 33, 693–697. [Google Scholar] [CrossRef]
- NEN-EN 335:2013; Durability of Wood and Wood-Based Products. Use Classes: Definitions, Applications to Solid Wood and Wood-Based Board Materials, 2013. CEN: Brussels, Belgium, 2023.
- Tohmura, S.; Inoue, A.; Sahari, S.H. Influence of the melamine content in melamine-urea-formaldehyde resins on formaldehyde emission and cured resin structure. J. Wood Sci. 2001, 47, 451–457. [Google Scholar] [CrossRef]
- Schiere, M.; Peters, J. Pedestrian and cyclist bridges made with durable hardwoods. In Proceedings of the International Conference on Timber Bridges ICTB2021PLUS, Bern, Switzerland, 9–12 May 2022; Bern University of Applied Sciences: Bern, Switzerland, 2022. ISBN 9783906878126. [Google Scholar] [CrossRef]
- Besserer, A.; Troilo, S.; Girods, P.; Rogaume, Y.; Brosse, N. Cascading Recycling of Wood Waste: A Review. Polymers 2021, 13, 1752. [Google Scholar] [CrossRef]
- de Leeuuw, M.; Koelemeijer, R. Decarbonisation Options for the Dutch Waste Incineration Industry; Netherlands Environmental Assessment Agency: Bilthoven, The Netherlands, 2022. [Google Scholar]
- Tyagi, U.; Sarma, A.K. Perspectives of biomass based lignin to value added chemicals in biorefineries: Challenges, extraction strategies and applications. Biofuels Bioprod. Biorefin. 2022, 16, 1869–1892. [Google Scholar] [CrossRef]
- The Netherlands Inflation Rate. Available online: https://tradingeconomics.com/netherlands/inflation-cpi (accessed on 24 May 2025).
- The Netherlands Interest Rate. Available online: https://tradingeconomics.com/netherlands/interest-rate (accessed on 24 May 2025).
- USD to EUR May 2025. Google Finance. Available online: https://www.google.com/finance/quote/USD-EUR?sa=X&ved=2ahUKEwjh__efksmNAxXS3wIHHbcQOVwQmY0JegQIChAv (accessed on 28 May 2025).
- Prices of Natural Gas and Electricity. (Centraal Bureau voor de Statistiek|CBS). Available online: https://www.cbs.nl/en-gb/figures/detail/85666ENG (accessed on 26 May 2025).
- Ecoinvent Transport Fuel Consumption. Available online: https://ask.openlca.org/2295/ecoinvent-transport-fuel-consumption (accessed on 25 May 2025).
- Warguła, Ł.; Kukla, M.; Wieczorek, B.; Krawiec, P. Energy consumption of the wood size reduction processes with employment of a low-power machines with various cutting mechanisms. Renew. Energy 2022, 181, 630–639. [Google Scholar] [CrossRef]
- Typical Calorific Values of Fuels. Forest Research UK Government. Available online: https://www.forestresearch.gov.uk/tools-and-resources/fthr/biomass-enenergy%20reergy-resources/reference-biomass/facts-figures/typical-calorific-values-of-fuels/ (accessed on 2 June 2025).
- Biomass for Electricity Generation. National Institute of Building Science. Available online: https://www.wbdg.org/resources/biomass-electricity-generation (accessed on 1 June 2025).
- Producer Price Index by Industry: Sawmills: Wood Chips, Excluding Field Chips. Federal Reserve Bank of St. Louis. Available online: https://fred.stlouisfed.org/series/PCU3211133211135 (accessed on 1 June 2025).
- Rebitzer, G.; Hunkeler, D. Life cycle costing in LCM: Ambitions, opportunities, and limitations: Discussing a framework. Int. J. Life Cycle Assess. 2003, 8, 253–256. [Google Scholar] [CrossRef]
- Panigrahy, N.; Priyadarshini, A.; Sahoo, M.M.; Verma, A.K.; Daverey, A.; Sahoo, N.K. A comprehensive review on eco-toxicity and biodegradation of phenolics: Recent progress and future outlook. Environ. Technol. Innov. 2022, 27, 102423. [Google Scholar] [CrossRef]
- Peñaloza, D.; Erlandsson, M.; Falk, A. Exploring the climate impact effects of increased use of bio-based materials in buildings. Constr. Build. Mater. 2016, 30, 219–226. [Google Scholar] [CrossRef]
- Morris, J. Recycle, Bury, or Burn Wood Waste Biomass? LCA Answer Depends on Carbon Accounting, Emissions Controls, Displaced Fuels, and Impact Costs. J. Ind. Ecol. 2016, 21, 844–856. [Google Scholar] [CrossRef]
- Liu, J.; Yue, K.; Xu, L.; Wu, J.; Chen, Z.; Wang, L.; Liu, W.; Lu, W. Bonding performance of melamine-urea–formaldehyde and phenol-resorcinol–formaldehyde adhesive glulams at elevated temperatures. Int. J. Adhes. Adhes. 2020, 98, 102500. [Google Scholar] [CrossRef]
- Frihart, C.R. Chapter 9: Wood Adhesion and Adhesives. In Handbook of Wood Chemistry and Wood Composities, 2nd ed.; Rowell, R.M., Ed.; CRC Press: Boca Raton, FL, USA, 2012; Volume 38. [Google Scholar] [CrossRef]
- Milner, H.R.; Woodard, A.C. Sustainability of engineered wood products. In Woodhead Publishing Series in Civil and Structural Engineering, 2nd ed.; Khatib, J.M., Ed.; Woodhead Publishing: Cambridge, UK, 2016; pp. 159–180. [Google Scholar] [CrossRef]
- Pizzi, A.; Dunky, M. Resorcinol adhesives. In Surfaces, Chemistry & Applications; Dillard, D.A., Pocious, A.V., Chaudhury, M., Eds.; Elsevier Science: Amsterdam, The Netherlands, 2002; ISBN 978-0-444-51140-9. [Google Scholar]
- Backes, J.G.; Traverso, M. Social Life Cycle Assessment in the Construction Industry: Systematic Literature Review and Identification of Relevant Social Indicators for Carbon Reinforced Concrete. Environ. Dev. Sustain. 2024, 26, 7199–7233. [Google Scholar] [CrossRef]
- Rostamnezhad, M.; Thaheem, M.J. Social Sustainability in Construction Projects—A Systematic Review of Assessment Indicators and Taxonomy. Sustainability 2022, 14, 5279. [Google Scholar] [CrossRef]
- Shedding Light on Energy in Europe—2025 Edition. Available online: https://ec.europa.eu/eurostat/web/interactive-publications/energy-2025 (accessed on 18 August 2025).
- Moretti, C.; Corona, B.; Hoefnagels, R.; Veen, M.V.; Vural-Gürsel, I.; Strating, T.; Gosselink, R.; Junginger, M. Kraft lignin as a bio-based ingredient for Dutch asphalts: An attributional LCA. Sci. Total Environ. 2022, 806 Pt 1, 150316. [Google Scholar] [CrossRef] [PubMed]
- Ding, T.; Bianchi, S.; Ganne-Chédeville, C.; Kilpeläinen, P.; Haapala, A.; Räty, T. Life cycle assessment of tannin extraction from spruce bark. Biogeosci. For. 2017, 10, 807–814. [Google Scholar] [CrossRef]
- Hong, J.; Zhou, J.; Hong, J. Environmental and economic impact of furfuralcohol production using corncob as a raw material. Int. J. Life Cycle Assess. 2015, 20, 623–631. [Google Scholar] [CrossRef]
- Swedish Sawn Dried Timber of Spruce or Pine. Svenskt Trä, EPD International. Available online: https://environdec.com/library/epd2537 (accessed on 13 May 2025).
- Properties of Softwood—Swedish Forest Industries Federation. Available online: https://www.swedishwood.com/wood-facts/about-wood/from-log-to-plank/properties-of-softwood/ (accessed on 13 May 2025).
- Brettschichtholz. Environmental Product Declaration of BS-Holz Glued Laminated Timber (Glulam); Germany; 2018; Available online: https://www.studiengemeinschaft-holzleimbau.de/publish/binarydata/pdfs/2018/stghb_umweltdeklaration_bs-holz_2018_ihb_e_print_181109.pdf (accessed on 28 August 2025).
- Puettmann, M.; Oneil, E.; Johnson, L. Cradle to Gate Life Cycle Assessment of Glue-Laminated Timbers Productions from the Southeast; CORRIM Report; 2013; Available online: https://corrim.org/wp-content/uploads/2018/06/SE-Glulam-LCA-report-1_7_13-final.pdf (accessed on 28 August 2025).
- Factory Worker Salary in The Netherlands. Available online: https://www.erieri.com/salary/job/factory-worker/netherlands (accessed on 27 May 2025).
- Preisindizes für Land- und ForstwirtschaftErzeugerpreise der Produkte des Holzeinschlags. Available online: https://www.destatis.de/DE/Themen/Wirtschaft/Preise/Landwirtschaftspreisindex-Forstwirtschaftspreisindex/Tabellen/Erzeugerpreise-Holzeinschlag.html#241824 (accessed on 31 May 2025).
- Tarief Afvalstoffenbelasting. Available online: https://www.belastingdienst.nl/wps/wcm/connect/bldcontentnl/belastingdienst/zakelijk/overige_belastingen/belastingen_op_milieugrondslag/afvalstoffenbelasting/tarief_afvalstoffenbelasting (accessed on 31 May 2025).
- Propane Price Index. Available online: https://businessanalytiq.com/procurementanalytics/index/propane-price-index/ (accessed on 27 May 2025).
- Pump Prices Motor Fuels; per Type, per Day. Available online: https://www.cbs.nl/en-gb/figures/detail/80416ENG (accessed on 31 May 2025).
- Melamine Price Index. Available online: https://businessanalytiq.com/procurementanalytics/index/melamine-price-index/ (accessed on 27 May 2025).
- Urea Ammonium Nitrate (UAN) Price Index. Available online: https://businessanalytiq.com/procurementanalytics/index/urea-ammonium-nitrate-uan-price-index/ (accessed on 27 May 2025).
- Formic Acid Price Index. Available online: https://businessanalytiq.com/procurementanalytics/index/formic-acid-price-index/ (accessed on 27 May 2025).
- Ammonium Sulfate Price Index. Available online: https://businessanalytiq.com/procurementanalytics/index/ammonium-sulfate-index/ (accessed on 27 May 2025).
- Methanol Price Index. Available online: https://businessanalytiq.com/procurementanalytics/index/methanol-price-index/ (accessed on 28 May 2025).
- Sodium Hydroxide Price Index. Available online: https://businessanalytiq.com/procurementanalytics/index/sodium-hydroxide-price-index/ (accessed on 28 May 2025).
- Phenol Price Index. Available online: https://businessanalytiq.com/procurementanalytics/index/phenol-price-index/ (accessed on 28 May 2025).
- Resorcinol Price Index. Available online: https://businessanalytiq.com/procurementanalytics/index/resorcinol-price-index/ (accessed on 28 May 2025).
- Ethanol Price Index. Available online: https://businessanalytiq.com/procurementanalytics/index/ethanol-price-index/ (accessed on 28 May 2025).
- Assis, C.A.; Greca, L.G.; Ago, M.; Balakshin, M.Y.; Jameel, H.; Gonzalez, R.; Rojas, O.J. Techno-Economic Assessment, Scalability, and Applications of Aerosol Lignin Micro- and Nanoparticles. ACS Sustain. Chem. Eng. 2018, 6, 11853–11868. [Google Scholar] [CrossRef] [PubMed]
- Glyoxal Price Trend and Forecast. Available online: https://www.chemanalyst.com/Pricing-data/glyoxal-1568 (accessed on 26 May 2025).
- Formaldehyde Price Index. Available online: https://businessanalytiq.com/procurementanalytics/index/formaldehyde-price-index/ (accessed on 28 May 2025).
- Furfuryl Alcohol Price Index. Available online: https://businessanalytiq.com/procurementanalytics/index/furfuryl-alcohol-price-index/ (accessed on 28 May 2025).
- Gedestilleerd Water. Available online: https://verzinkshop.nl/gedestilleerd-water-1-tot-5-liter/?srsltid=AfmBOoo5qsFZBXKN89Plois5cS_vZWZdClpCGTz5KuXu44lk21qTR8-Y (accessed on 28 May 2025).
- Wijeyekoon, S.; Suckling, I.; Fahmy, M.; Hall, P.; Bennett, P. Techno-economic analysis of tannin and briquette co-production from bark waste: A case study quantifying symbiosis benefits in biorefinery. Biofuels Bioprod. Biorefining 2021, 15, 1332–1344. [Google Scholar] [CrossRef]




| kg/kg MUF 60% Solids | kg/kg PRF 60% Solids | kg/kg PF 47% Solids | kg/kg LPG 54% Solids | kg/kg TFF 47% Solids | |
|---|---|---|---|---|---|
| Input, materials (kg total) | 0.91 | 0.80 | 0.81 | 0.64 | 0.41 |
| Urea | 43.67% | - | - | - | - |
| Melamine | 8.89% | - | - | - | - |
| Formic acid | 0.006% | - | - | - | - |
| Ammonium sulfate | 0.003% | - | - | - | - |
| Methanol | 33.44% | 12.86% | 25.77% | 24.72% | - |
| Sodium hydroxide | 0.02% | 0.46% | 7.52% | 0.423% | - |
| Ethanol | - | 0.29% | - | - | - |
| Phenol | - | 34.76% | 30.09% | 6.01% | - |
| Resorcinol | - | 23.72% | - | ||
| Lignin | - | - | - | 2.58% | - |
| Glyoxal | - | - | - | 19.38% | - |
| Tannin | - | - | - | - | 16.99% |
| Formaldehyde | - | - | - | - | 7.64% |
| Furfuryl alcohol | - | - | - | - | 9.60% |
| Distilled water | - | - | - | - | 24.27% |
| Water (production) | 13.97% | 27.46% | 36.62% | 46.89% | 41.51% |
| Input, water use (kg total) | 0.66 | 0.44 | 0.05 | 0.38 | 0.33 |
| Water use, cooling tower | 87.20% | 66.74% | 29.55% | 76.82% | 76.82% |
| Water use, boiler makeup | 12.80% | 33.26% | 70.45% | 23.18% | 23.18% |
| Unit | Unit/kg MUF 60% Solids | Unit/kg PRF 60% Solids | Unit/kg PF 47% Solids | Unit/kg LPG 54% Solids | Unit/kg TFF 47% Solids | |
|---|---|---|---|---|---|---|
| Input, energy | ||||||
| Electricity, process | kWh | 2.09 × 10⁻² | 8.30 × 10⁻² | 2.20 × 10⁻² | 4.20 × 10⁻² | 4.20 × 10⁻² |
| Electricity, emissions control | kWh | 1.42 × 10⁻² | 1.59 × 10⁻² | 1.36 × 10⁻² | 1.46 × 10⁻² | 1.46 × 10⁻² |
| Natural gas | m3 | 1.35 × 10⁻² | 3.18 × 10⁻² | 8.21 × 10⁻³ | 1.78 × 10⁻² | 1.78 × 10⁻² |
| Propane | L | 1.55 × 10⁻⁵ | 2.50 × 10⁻⁵ | 2.96 × 10⁻⁶ | 1.45 × 10⁻⁵ | 1.45 × 10⁻⁵ |
| Output, emissions to air | ||||||
| Carbon dioxide | kg | 2.55 × 10⁻² | 6.85 × 10⁻² | 1.76 × 10⁻² | 2.60 × 10⁻² | 2.60 × 10⁻² |
| Carbon monoxide | kg | 1.30 × 10⁻⁵ | 1.49 × 10⁻⁴ | 3.81 × 10⁻⁵ | 4.67 × 10⁻⁵ | 4.67 × 10⁻⁵ |
| VOC (Volatile Organic Compounds) | kg | 4.94 × 10⁻⁵ | 3.38 × 10⁻⁵ | 2.89 × 10⁻⁵ | 2.62 × 10⁻⁵ | 2.62 × 10⁻⁵ |
| Particulate matter | kg | 1.65 × 10⁻⁶ | 3.01 × 10⁻⁶ | 2.31 × 10⁻⁵ | 6.48 × 10⁻⁶ | 6.48 × 10⁻⁶ |
| Formaldehyde | kg | 7.85 × 10⁻⁶ | 8.80 × 10⁻⁶ | 6.69 × 10⁻⁶ | - | 5.45 × 10⁻⁶ |
| Methanol | kg | 5.49 × 10⁻⁶ | 5.20 × 10⁻⁶ | 3.20 × 10⁻⁶ | 3.24 × 10⁻⁶ | 3.24 × 10⁻⁶ |
| Phenol | kg | - | 4.16 × 10⁻⁶ | 4.73 × 10⁻⁶ | 1.45 × 10⁻⁶ | - |
| Dimethyl ether | kg | 2.26 × 10⁻⁵ | - | 2.04 × 10⁻⁶ | 6.38 × 10⁻⁶ | 6.38 × 10⁻⁶ |
| Output, emissions to water | ||||||
| BOD (Organic water pollutant) | kg | 6.62 × 10⁻⁴ | 2.81 × 10⁻³ | - | 1.22 × 10⁻³ | 1.22 × 10⁻³ |
| TSS (Total suspended solids) | kg | 3.94 × 10⁻⁴ | 1.67 × 10⁻⁴ | - | 1.96 × 10⁻⁴ | 1.96 × 10⁻⁴ |
| Phenol | kg | - | 1.14 × 10⁻⁴ | - | 3.99 × 10⁻⁵ | - |
| Formaldehyde | kg | 2.39 × 10⁻⁴ | 3.32 × 10⁻⁴ | - | - | 1.44 × 10⁻⁴ |
| Solids | kg | 1.30 × 10⁻⁴ | - | - | 8.37 × 10⁻⁵ | 8.37 × 10⁻⁵ |
| Ammonia nitrogen | kg | 7.84 × 10⁻⁵ | - | - | 4.55 × 10⁻⁵ | 4.55 × 10⁻⁵ |
| Output, emissions to land | ||||||
| Solids | kg | 5.09 × 10⁻⁵ | 1.64 × 10⁻⁴ | 2.00 × 10⁻⁴ | 9.68 × 10⁻⁵ | 9.68 × 10⁻⁵ |
| MUF | PRF | PF | LPG | TFF | |
|---|---|---|---|---|---|
| −15% | −0.823% | −1.619% | −0.604% | −0.450% | −0.318% |
| +15% | +0.799% | +1.511% | +0.595% | +0.443% | +0.292% |
Disclaimer/Publisher’s Note: The statements, opinions and data contained in all publications are solely those of the individual author(s) and contributor(s) and not of MDPI and/or the editor(s). MDPI and/or the editor(s) disclaim responsibility for any injury to people or property resulting from any ideas, methods, instructions or products referred to in the content. |
© 2025 by the authors. Licensee MDPI, Basel, Switzerland. This article is an open access article distributed under the terms and conditions of the Creative Commons Attribution (CC BY) license (https://creativecommons.org/licenses/by/4.0/).
Share and Cite
Pedrero Zazo, C.; Gosselink, P.; Kromanis, R. Life Cycle Assessment (LCA) and Life Cycle Cost (LCC) Analysis of Adhesives in Block-Glued Laminated Timber. Sustainability 2025, 17, 8055. https://doi.org/10.3390/su17178055
Pedrero Zazo C, Gosselink P, Kromanis R. Life Cycle Assessment (LCA) and Life Cycle Cost (LCC) Analysis of Adhesives in Block-Glued Laminated Timber. Sustainability. 2025; 17(17):8055. https://doi.org/10.3390/su17178055
Chicago/Turabian StylePedrero Zazo, Candela, Peter Gosselink, and Rolands Kromanis. 2025. "Life Cycle Assessment (LCA) and Life Cycle Cost (LCC) Analysis of Adhesives in Block-Glued Laminated Timber" Sustainability 17, no. 17: 8055. https://doi.org/10.3390/su17178055
APA StylePedrero Zazo, C., Gosselink, P., & Kromanis, R. (2025). Life Cycle Assessment (LCA) and Life Cycle Cost (LCC) Analysis of Adhesives in Block-Glued Laminated Timber. Sustainability, 17(17), 8055. https://doi.org/10.3390/su17178055


