Article

Effect of Window Structure and Mounting on Sound Insulation: A Laboratory-Based Study

Faculty of Civil Engineering, Silesian University of Technology, 44-100 Gliwice, Poland
*
Author to whom correspondence should be addressed.
Sustainability 2025, 17(15), 6892; https://doi.org/10.3390/su17156892
Submission received: 20 June 2025 / Revised: 16 July 2025 / Accepted: 25 July 2025 / Published: 29 July 2025
(This article belongs to the Special Issue Advancements in Green Building Materials, Structures, and Techniques)

Abstract

The acoustic performance of windows significantly influences evaluations of building quality, particularly in urban environments. This study presents the results of laboratory tests on the airborne sound insulation of windows with dimensions greater than those specified in ISO 10140-5:2021-10. The aim was to determine the impact of construction details and installation techniques on sound insulation, specifically Rw and Rw + Ctr values. The experimental variables included mounting methods (expansion tape versus low-pressure polyurethane foam), the presence or absence of a threshold in the lower frame, and the type of mullion (fixed versus movable). The tests involved two types of IGUs characterized by different acoustic properties. The findings indicate that the frame configuration, including threshold and mullion type, has a negligible influence on sound insulation. However, the standard method for estimating acoustic performance (EN 14351-1:2006 + A2:2017), which relies on IGU-based data, proved unreliable for modern window assemblies. The estimated values of Rw and Rw + Ctr were consistently lower than those obtained from direct laboratory measurements. These results highlight the need for verification through full-size window testing and suggest that reliance on simplified estimation procedures may lead to underperformance in real-world acoustic applications.

1. Introduction

The insulation of windows described in the standard [1] has an impact on limiting the noise penetrating into the building. Noise pollution caused by various sources, such as transportation [2] and industry, has a negative impact on human health [3,4]. Impulse noise, e.g., from bridge expansion joints, can be even more harmful to health [5]. Another type of urban noise is noise from trams [6,7]. External noise can be reduced by acoustic screens [8], and it is important to analyze noise exposure levels on facades [9,10,11]. Windows are the weakest part of the facade in terms of sound insulation [12]. Reducing external noise in the indoor environment is crucial not only for residential buildings, but also for public buildings such as hospitals [13] and schools [14]. The most significant part of the noise one perceives indoors from the external environment passes through the windows of the facade [15]. It can be said that the presence of a window with a lower sound insulation index than an opaque wall reduces the overall sound insulation of the facade [16]. In the 1970s, Ford and Kerry [17,18] proposed the use of partially open double glazing with offset inlet and outlet openings to improve sound insulation. Since then, this simple window design has been the subject of much research [19,20,21]. Thus, the choice of window design, frame material, glazing thickness, gaskets, seals, and perimeter closures must take into account boundaries and environmental factors [22]. As Berardi et al. [23] write, the choice of window frame design for a window system is of paramount importance for achieving high acoustic insulation, especially for thermal break lift-and-slide systems.
The literature offers many traditional window-based solutions that aim to reduce noise while ensuring adequate ventilation and daylight [24,25]. Recently, these solutions have been used while taking metamaterials into consideration [26]. Tsukamoto et al. [27] determined that the acoustic transmission characteristics of double windows depend mainly on two types of resonance: the air mass resonance of the window panes and air cavity; and the acoustic mode resonance of the air cavity between them. They also found that the resonance of the acoustic mode is suppressed by attaching absorbent materials to the interior of the window cavity, thereby increasing the sound insulation index. Takahasi et al. [28] used viscoelastic materials as connectors between two glass panels to improve the sound insulation of double-glazed windows. They based their work on an analytical model that took into account the effect of spacing on sound insulation. Work is also underway on a simulation model to predict the insulation properties of windows in buildings [29].

2. Research Objectives and Questions

The windows in a building are one of the main elements determining the acoustic comfort of a room. Their acoustic insulation has a direct impact on the amount of acoustic energy that penetrates the interior of the building from its surroundings. Therefore, at the design stage, it is necessary to determine the optimal window insulation to reduce noise and ensure comfort in the room. The EN 14351-1:2006 + A2:2017 [30] standard allows for the determination of acoustic insulation by extrapolating the result of a laboratory test of IGUs (insulating glass units). This method is often used by designers because it allows one to avoid time-consuming and expensive laboratory tests of windows. However, using the methodology according to EN 14351-1:2006 + A2:2017 [30] for windows with dimensions significantly larger than a size of 1.23 m × 1.48 m (reference size) leads to a drastic reduction in the airborne sound insulation of the window compared to the value determined in the laboratory for IGUs. Additionally, according to EN 14351-1:2006 + A2:2017 [30], the sound insulation values of the windows Rw ≥ 41 dB or Rw + Ctr ≥ 37 dB must be determined by laboratory measurements. In the case of large investments, laboratory tests of the sound insulation of windows are carried out; however, in the case of smaller projects, window parameters are often adopted without laboratory tests, solely on the basis of the glass parameters. Due to the lack of appropriate guidelines for windows with sound insulation Rw ≥ 41 dB or Rw + Ctr ≥ 37 dB, designers, working “in the dark”, try to determine this value themselves. This issue has been previously identified [31]. The authors demonstrated that the tabular estimation method may result in the underestimation of acoustic performance, particularly in high-Rw window systems. They also emphasized the significant role of the window frame in determining overall sound insulation. These doubts were the reason for carrying out laboratory measurements of the airborne sound insulation of windows described in the article. Measurements were carried out for windows with relatively high-insulation glass: Rw = 41 dB and Rw = 46 dB. The tested windows were characterized by dimensions larger than the reference window according to ISO 10140-5:2021 [1], which has dimensions of 1.23 m × 1.48 m (reference size). In addition, the impact of changes in the construction and assembly of the windows was analyzed on the sound insulation parameters. The purpose of the measurements was also to verify the hypothesis that the calculation methodology specified in EN 14351-1:2006 + A2:2017 [30] excessively reduces the estimated acoustic insulation of windows with surface areas exceeding the reference dimensions and that the limitation of the estimation of sound insulation for glazing with Rw > 40 dB is unjustified in the context of current window technologies.

3. Materials and Methods

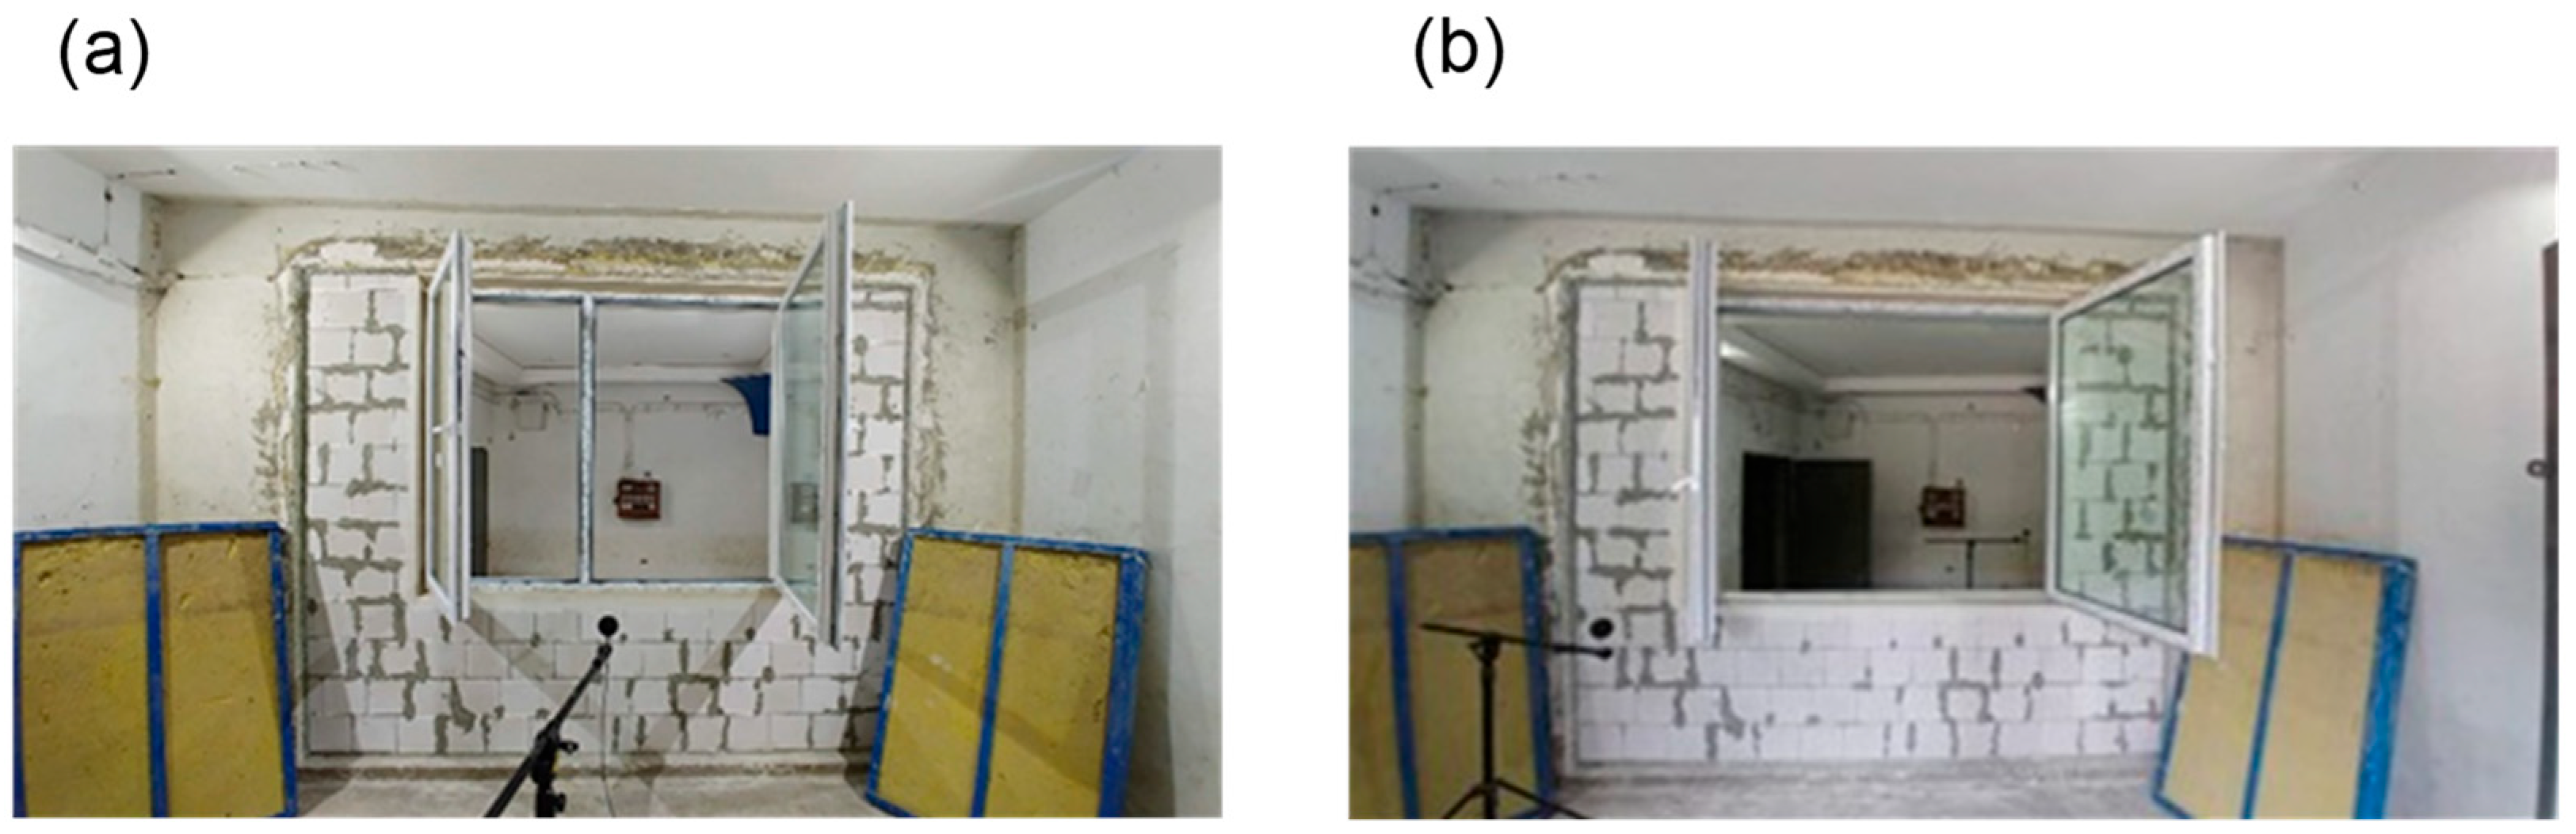
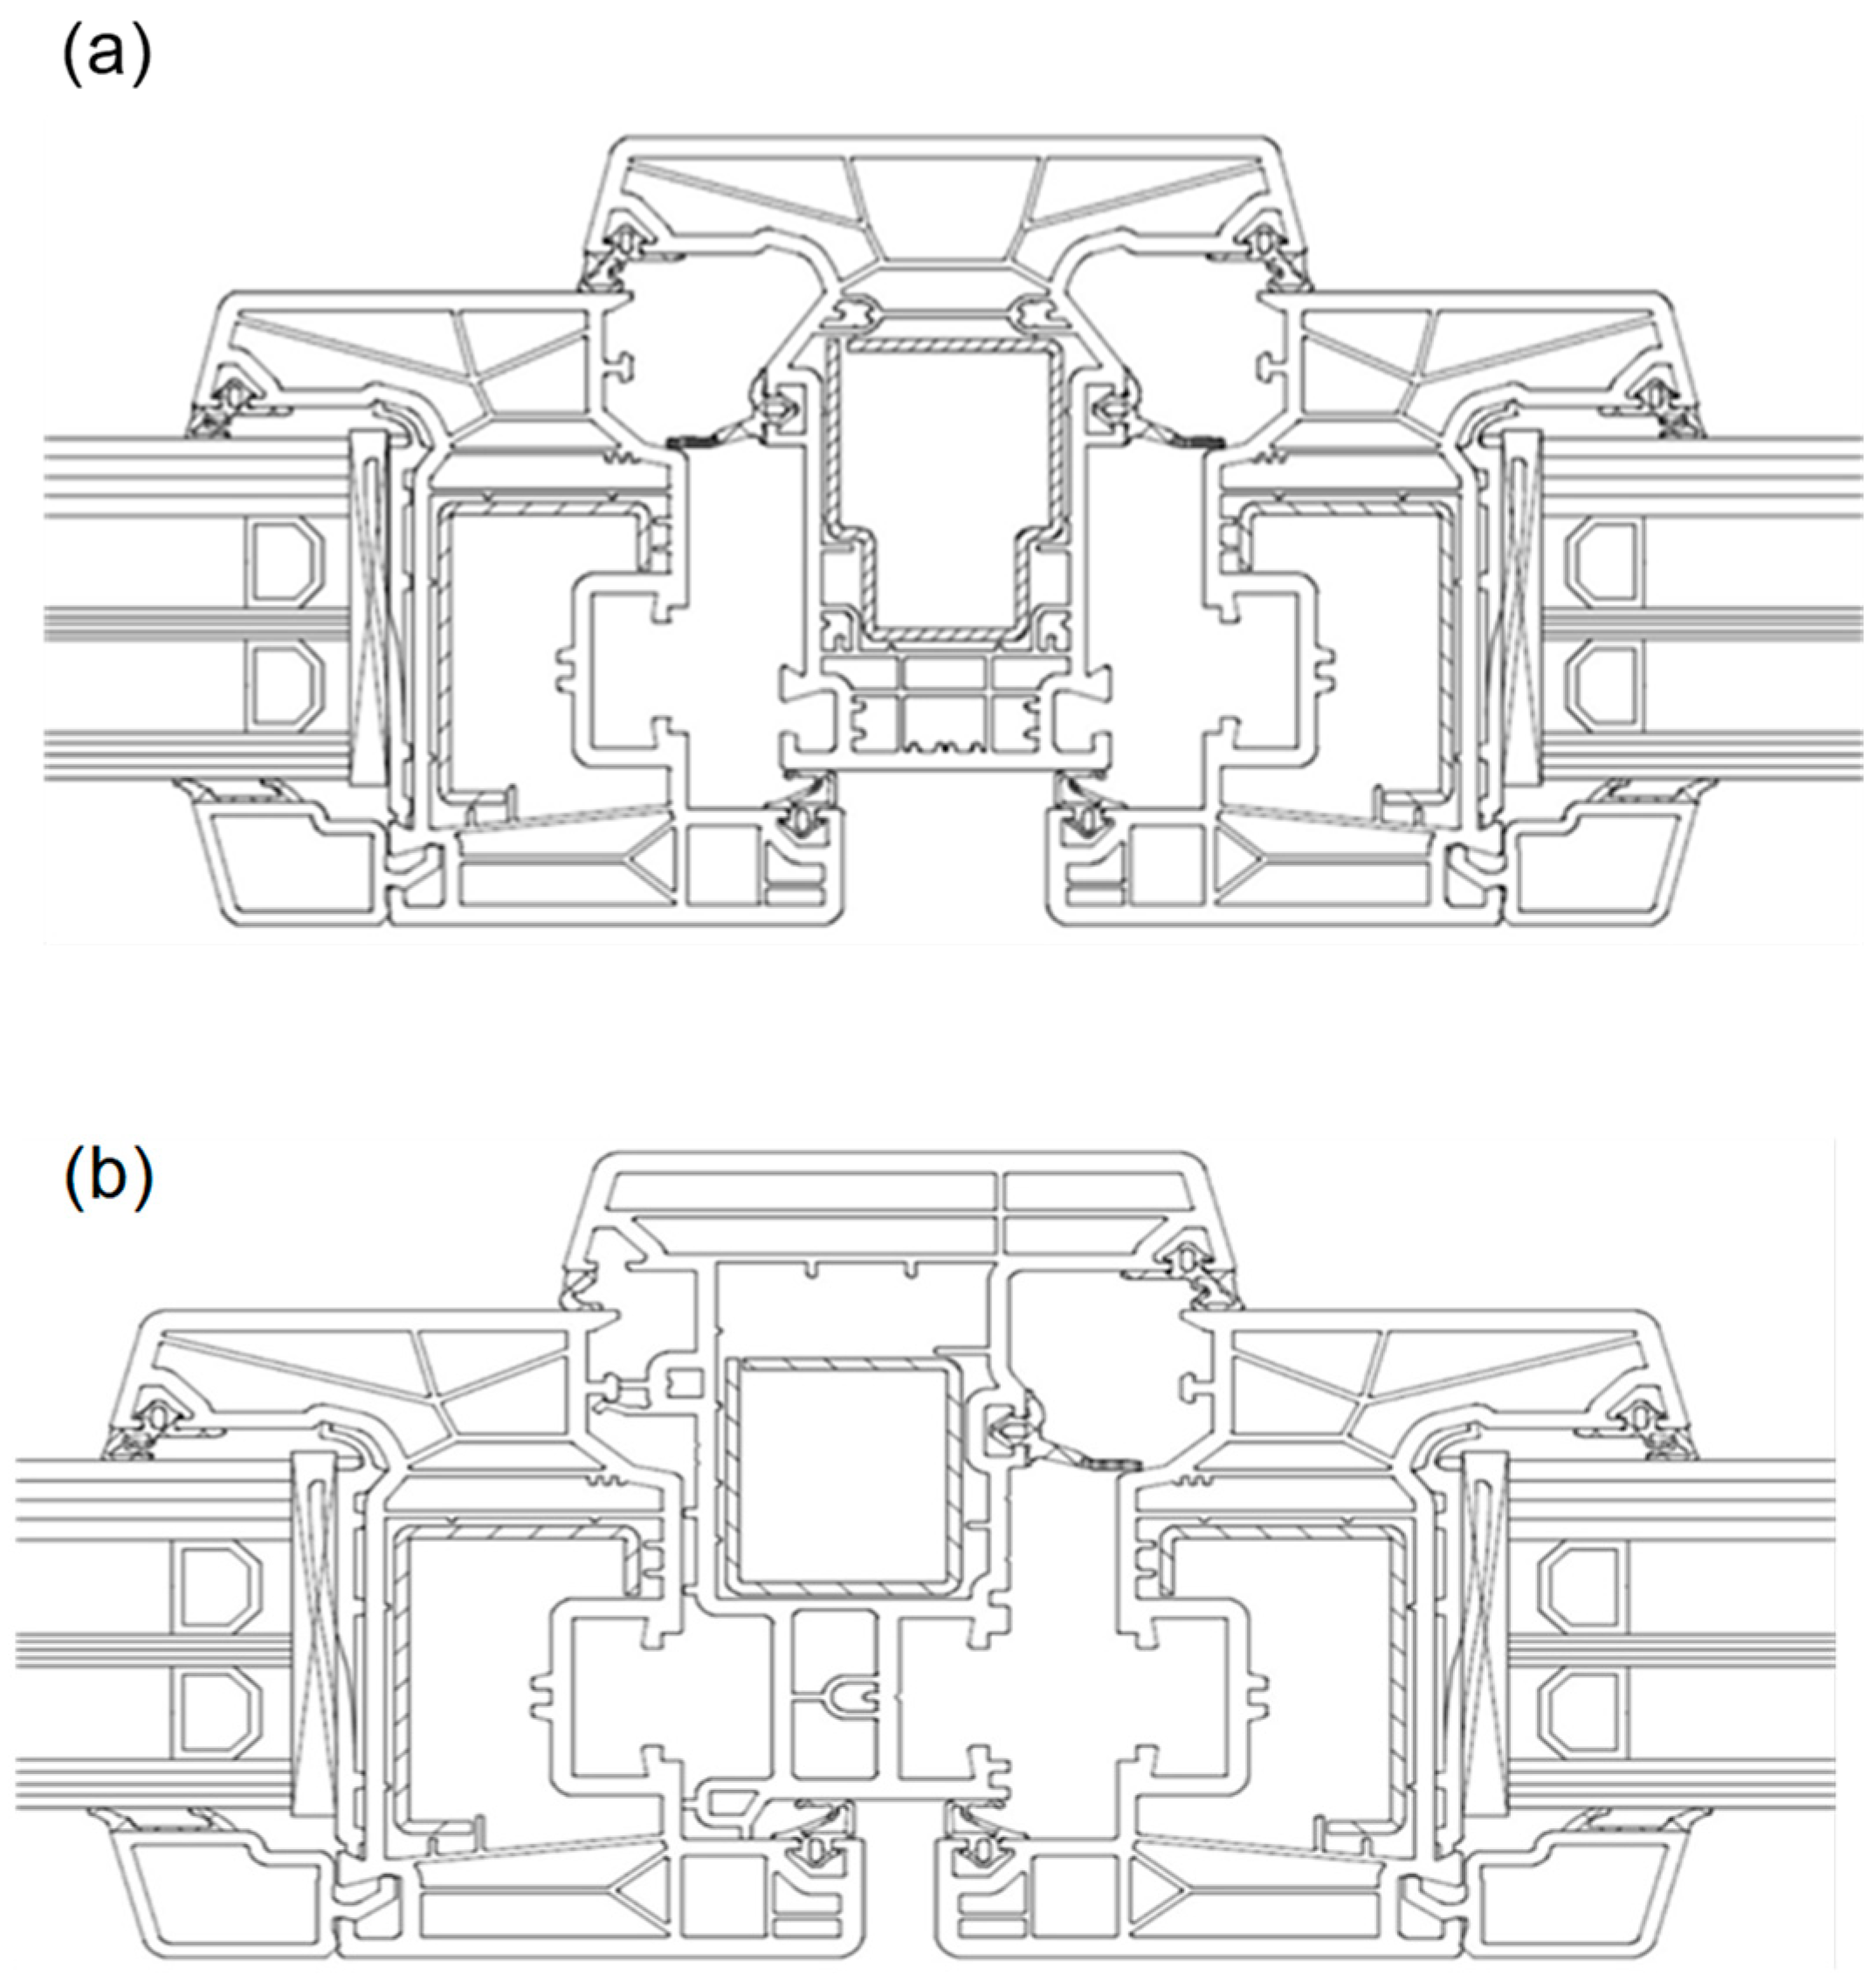
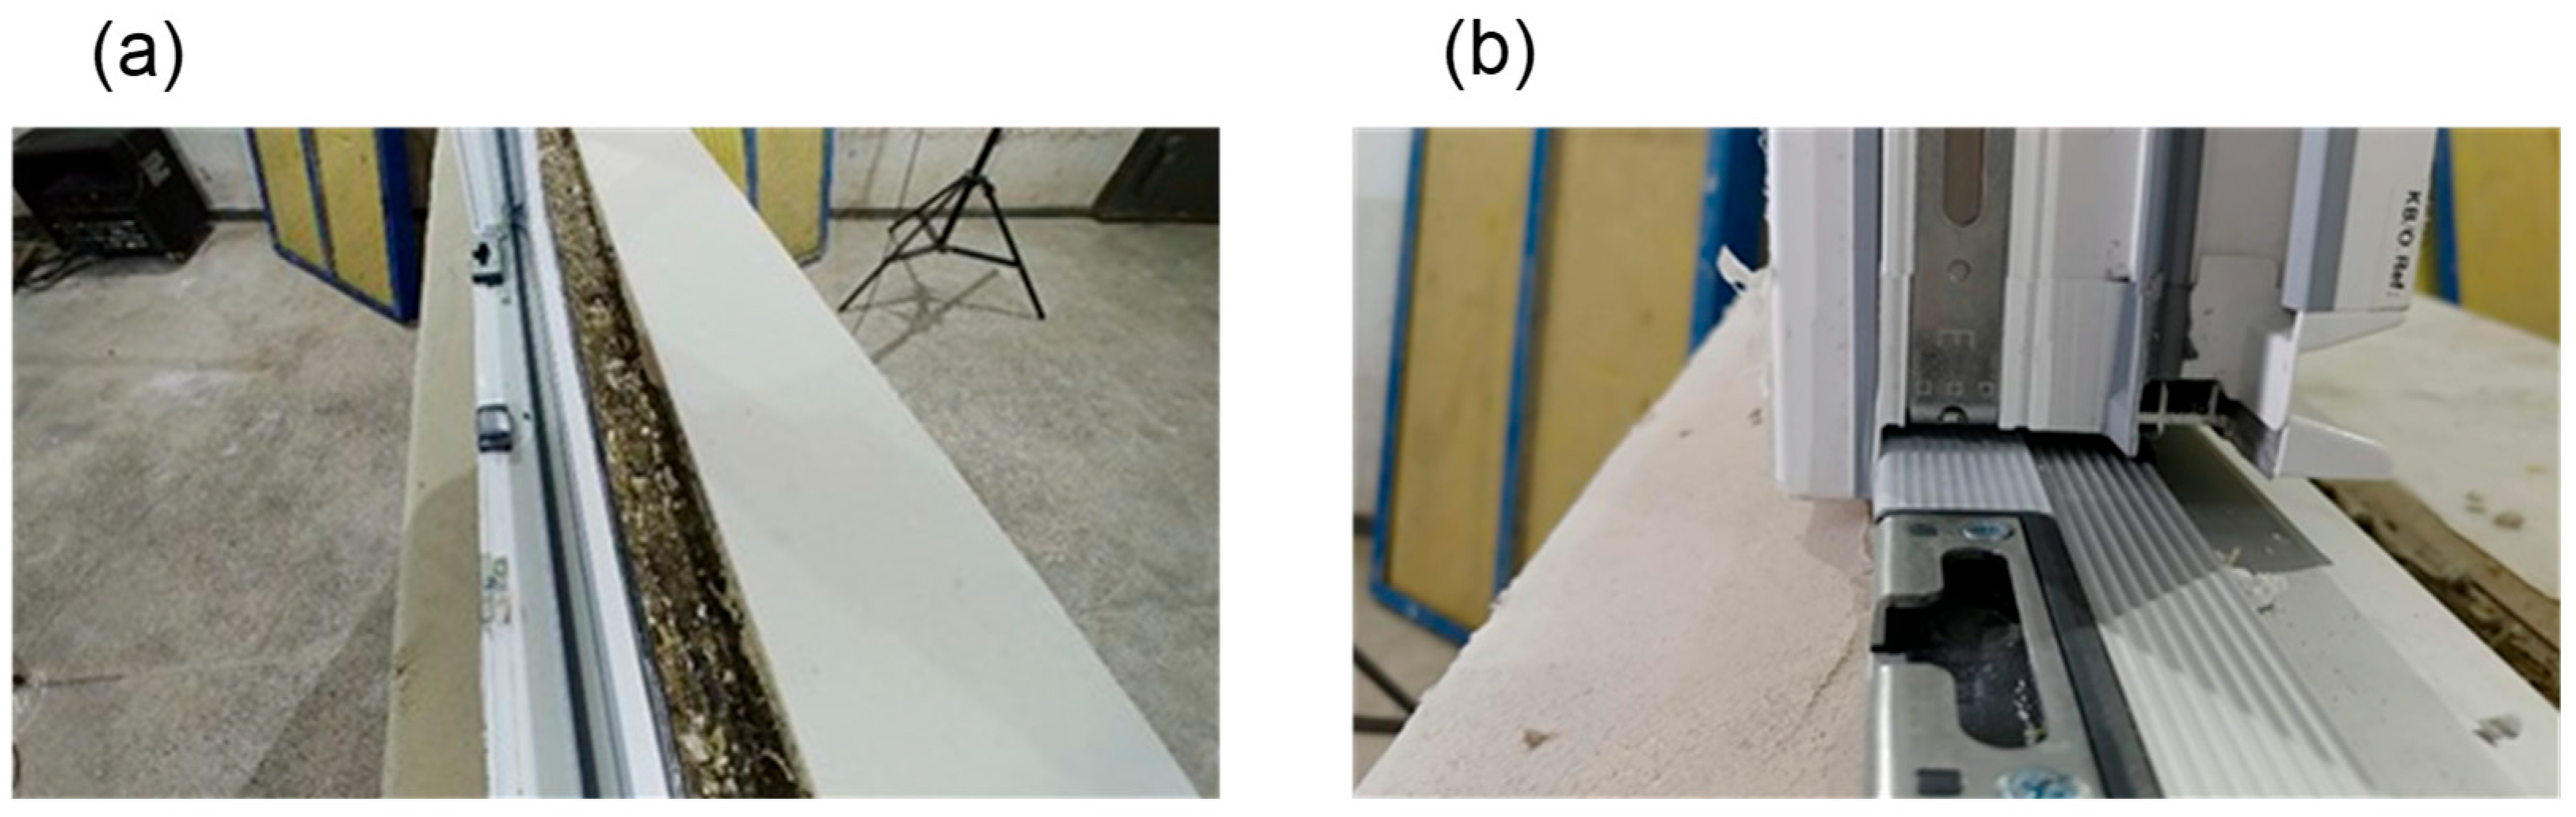
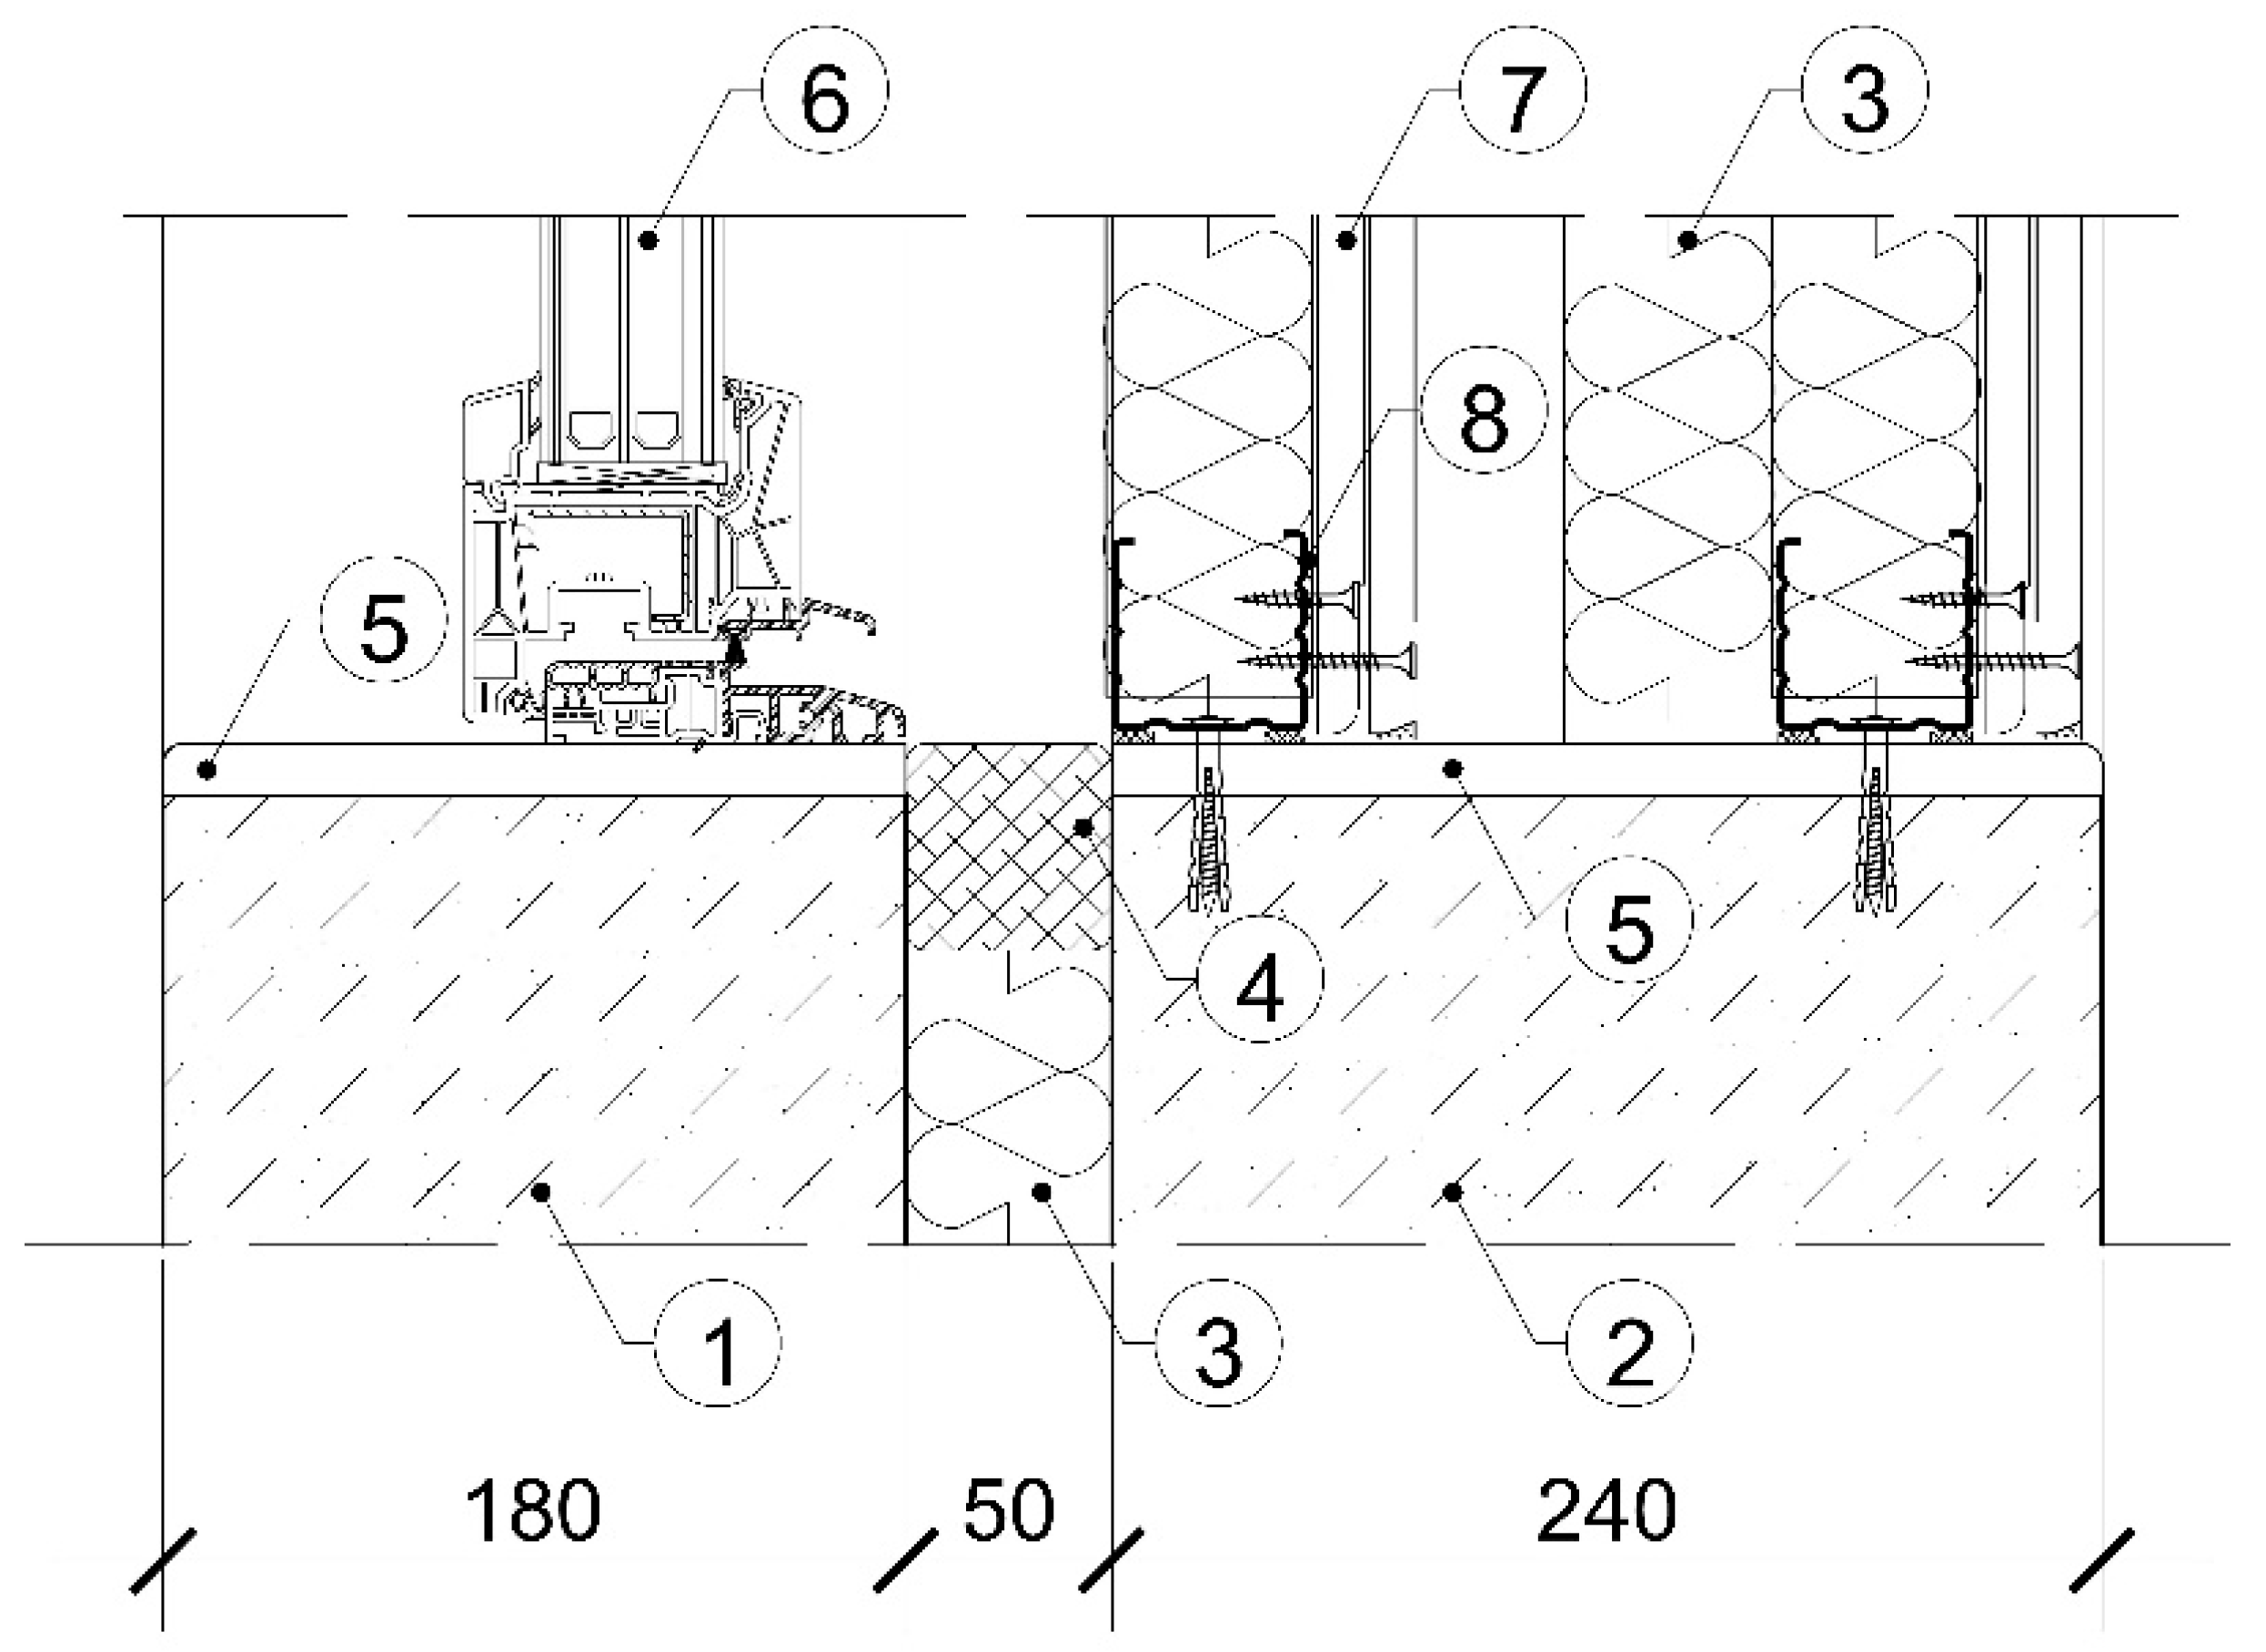
3.1. Window Characteristics
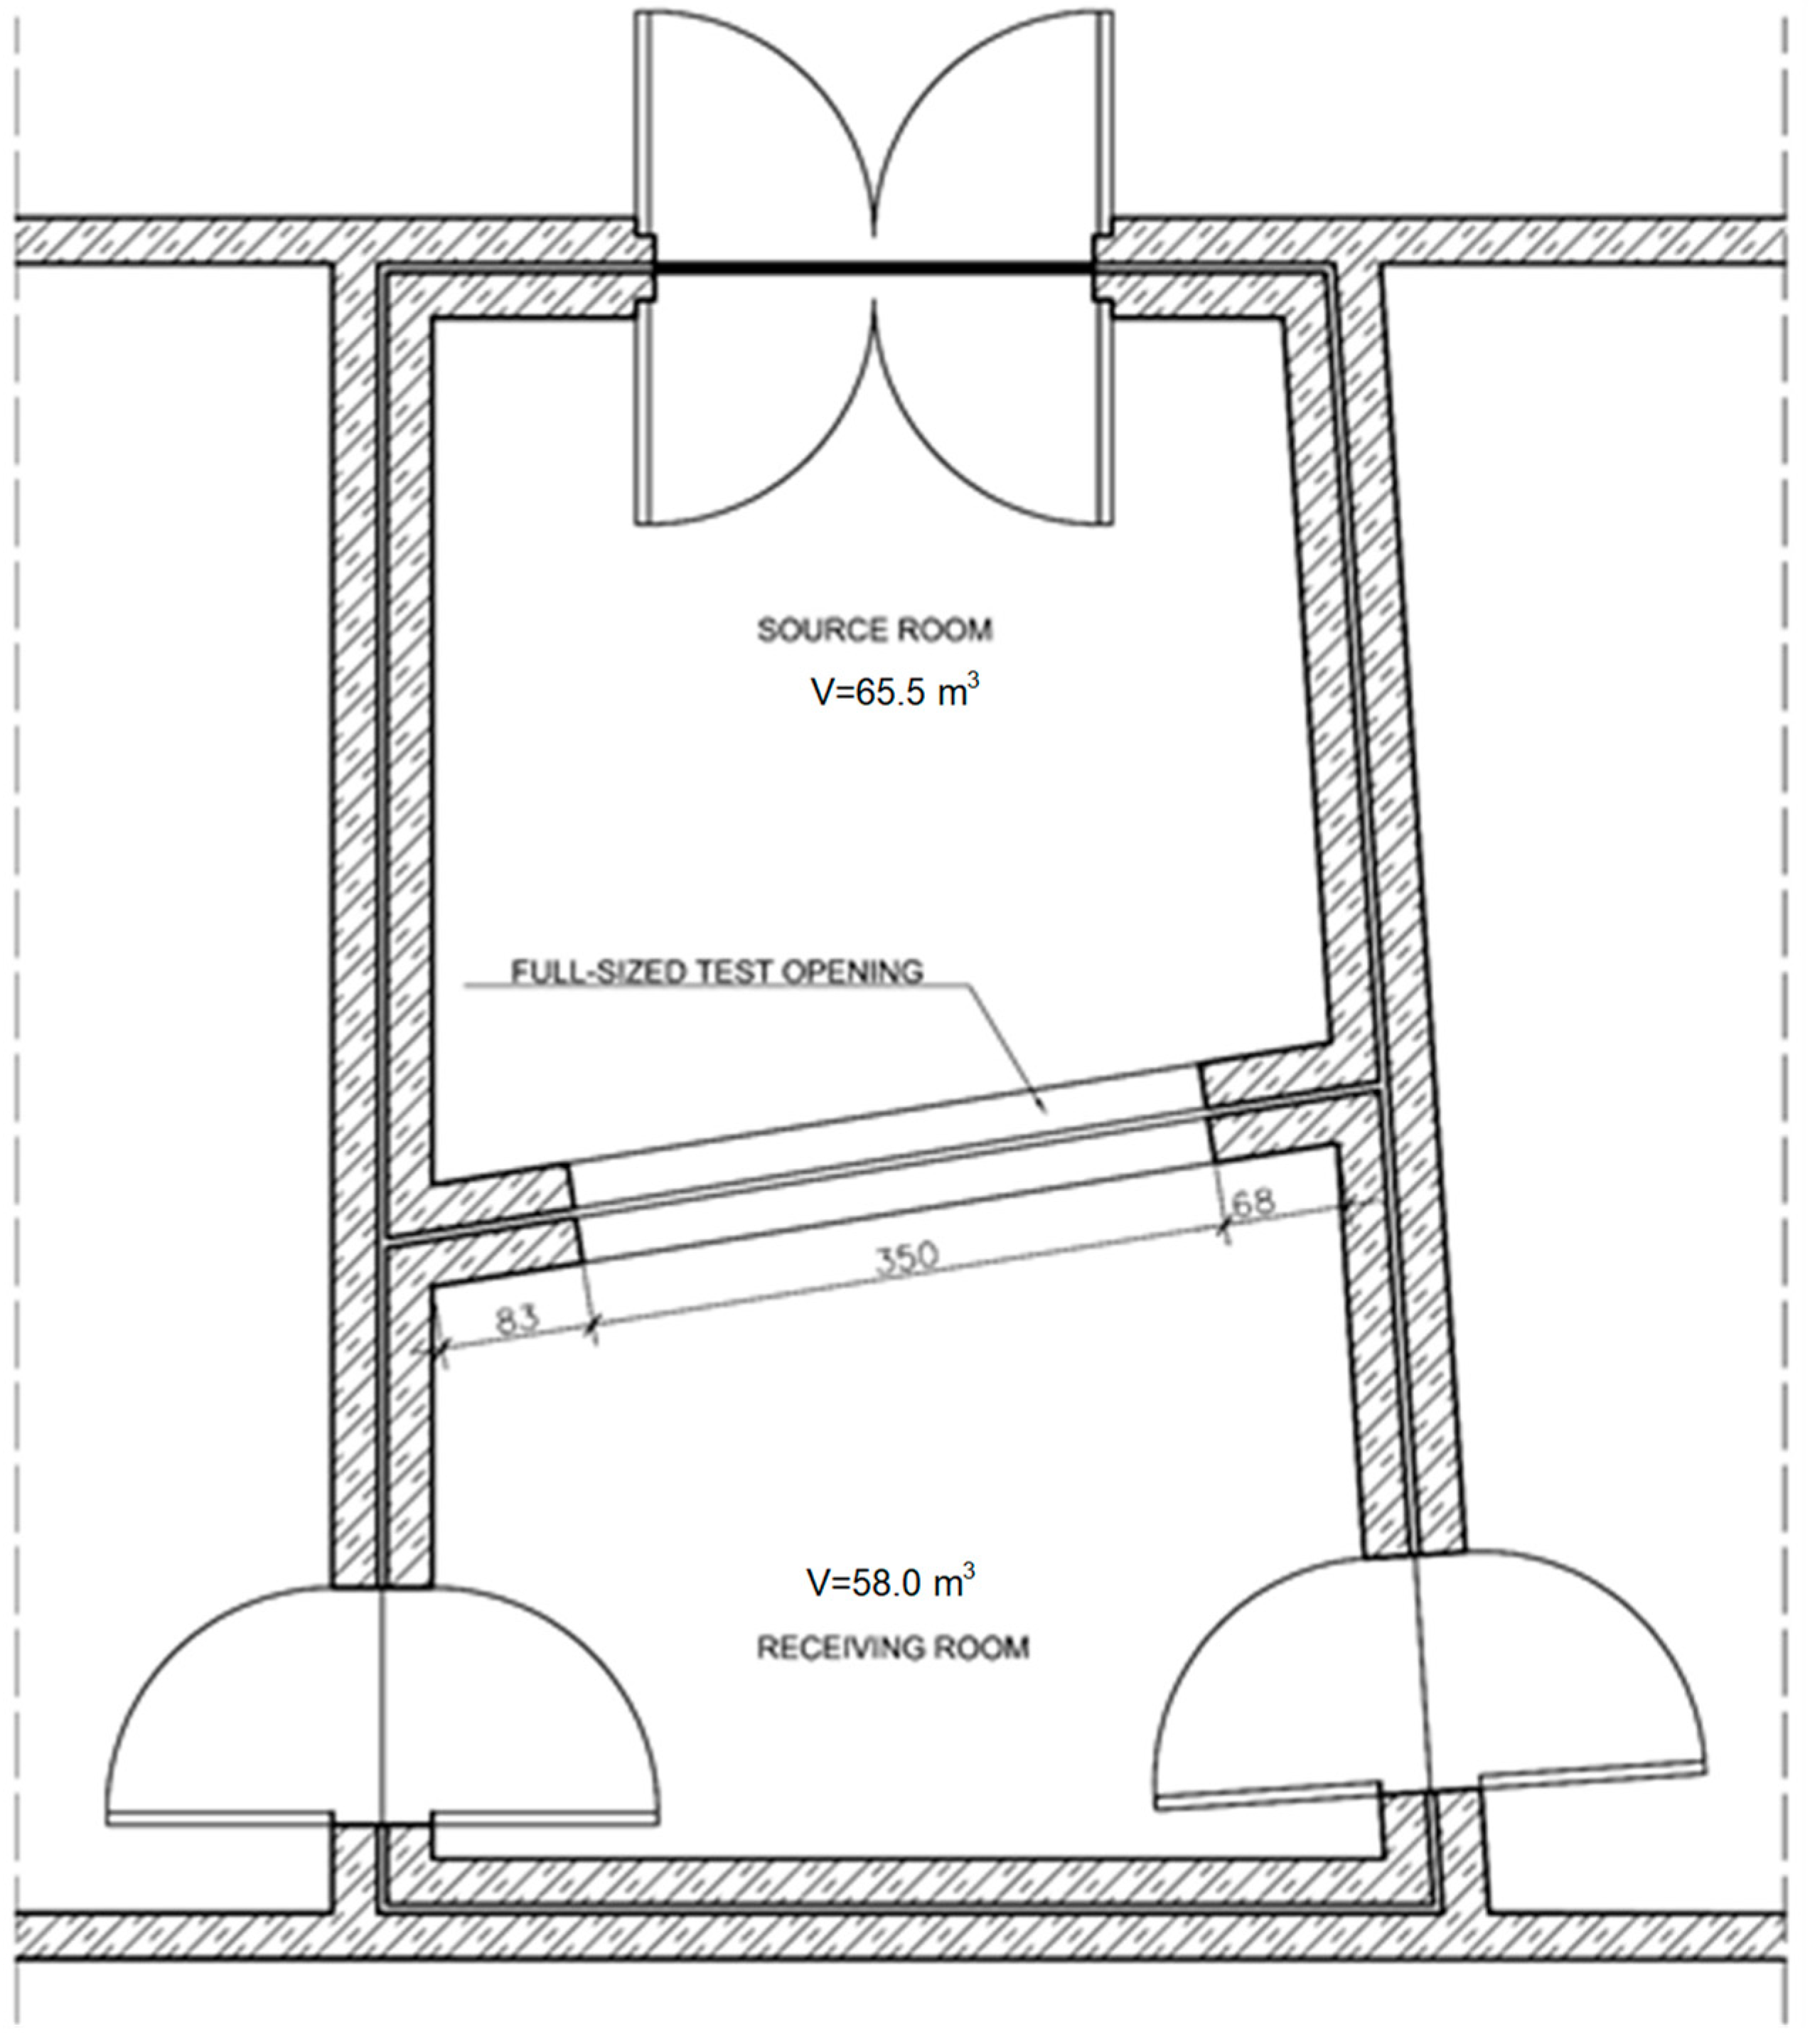
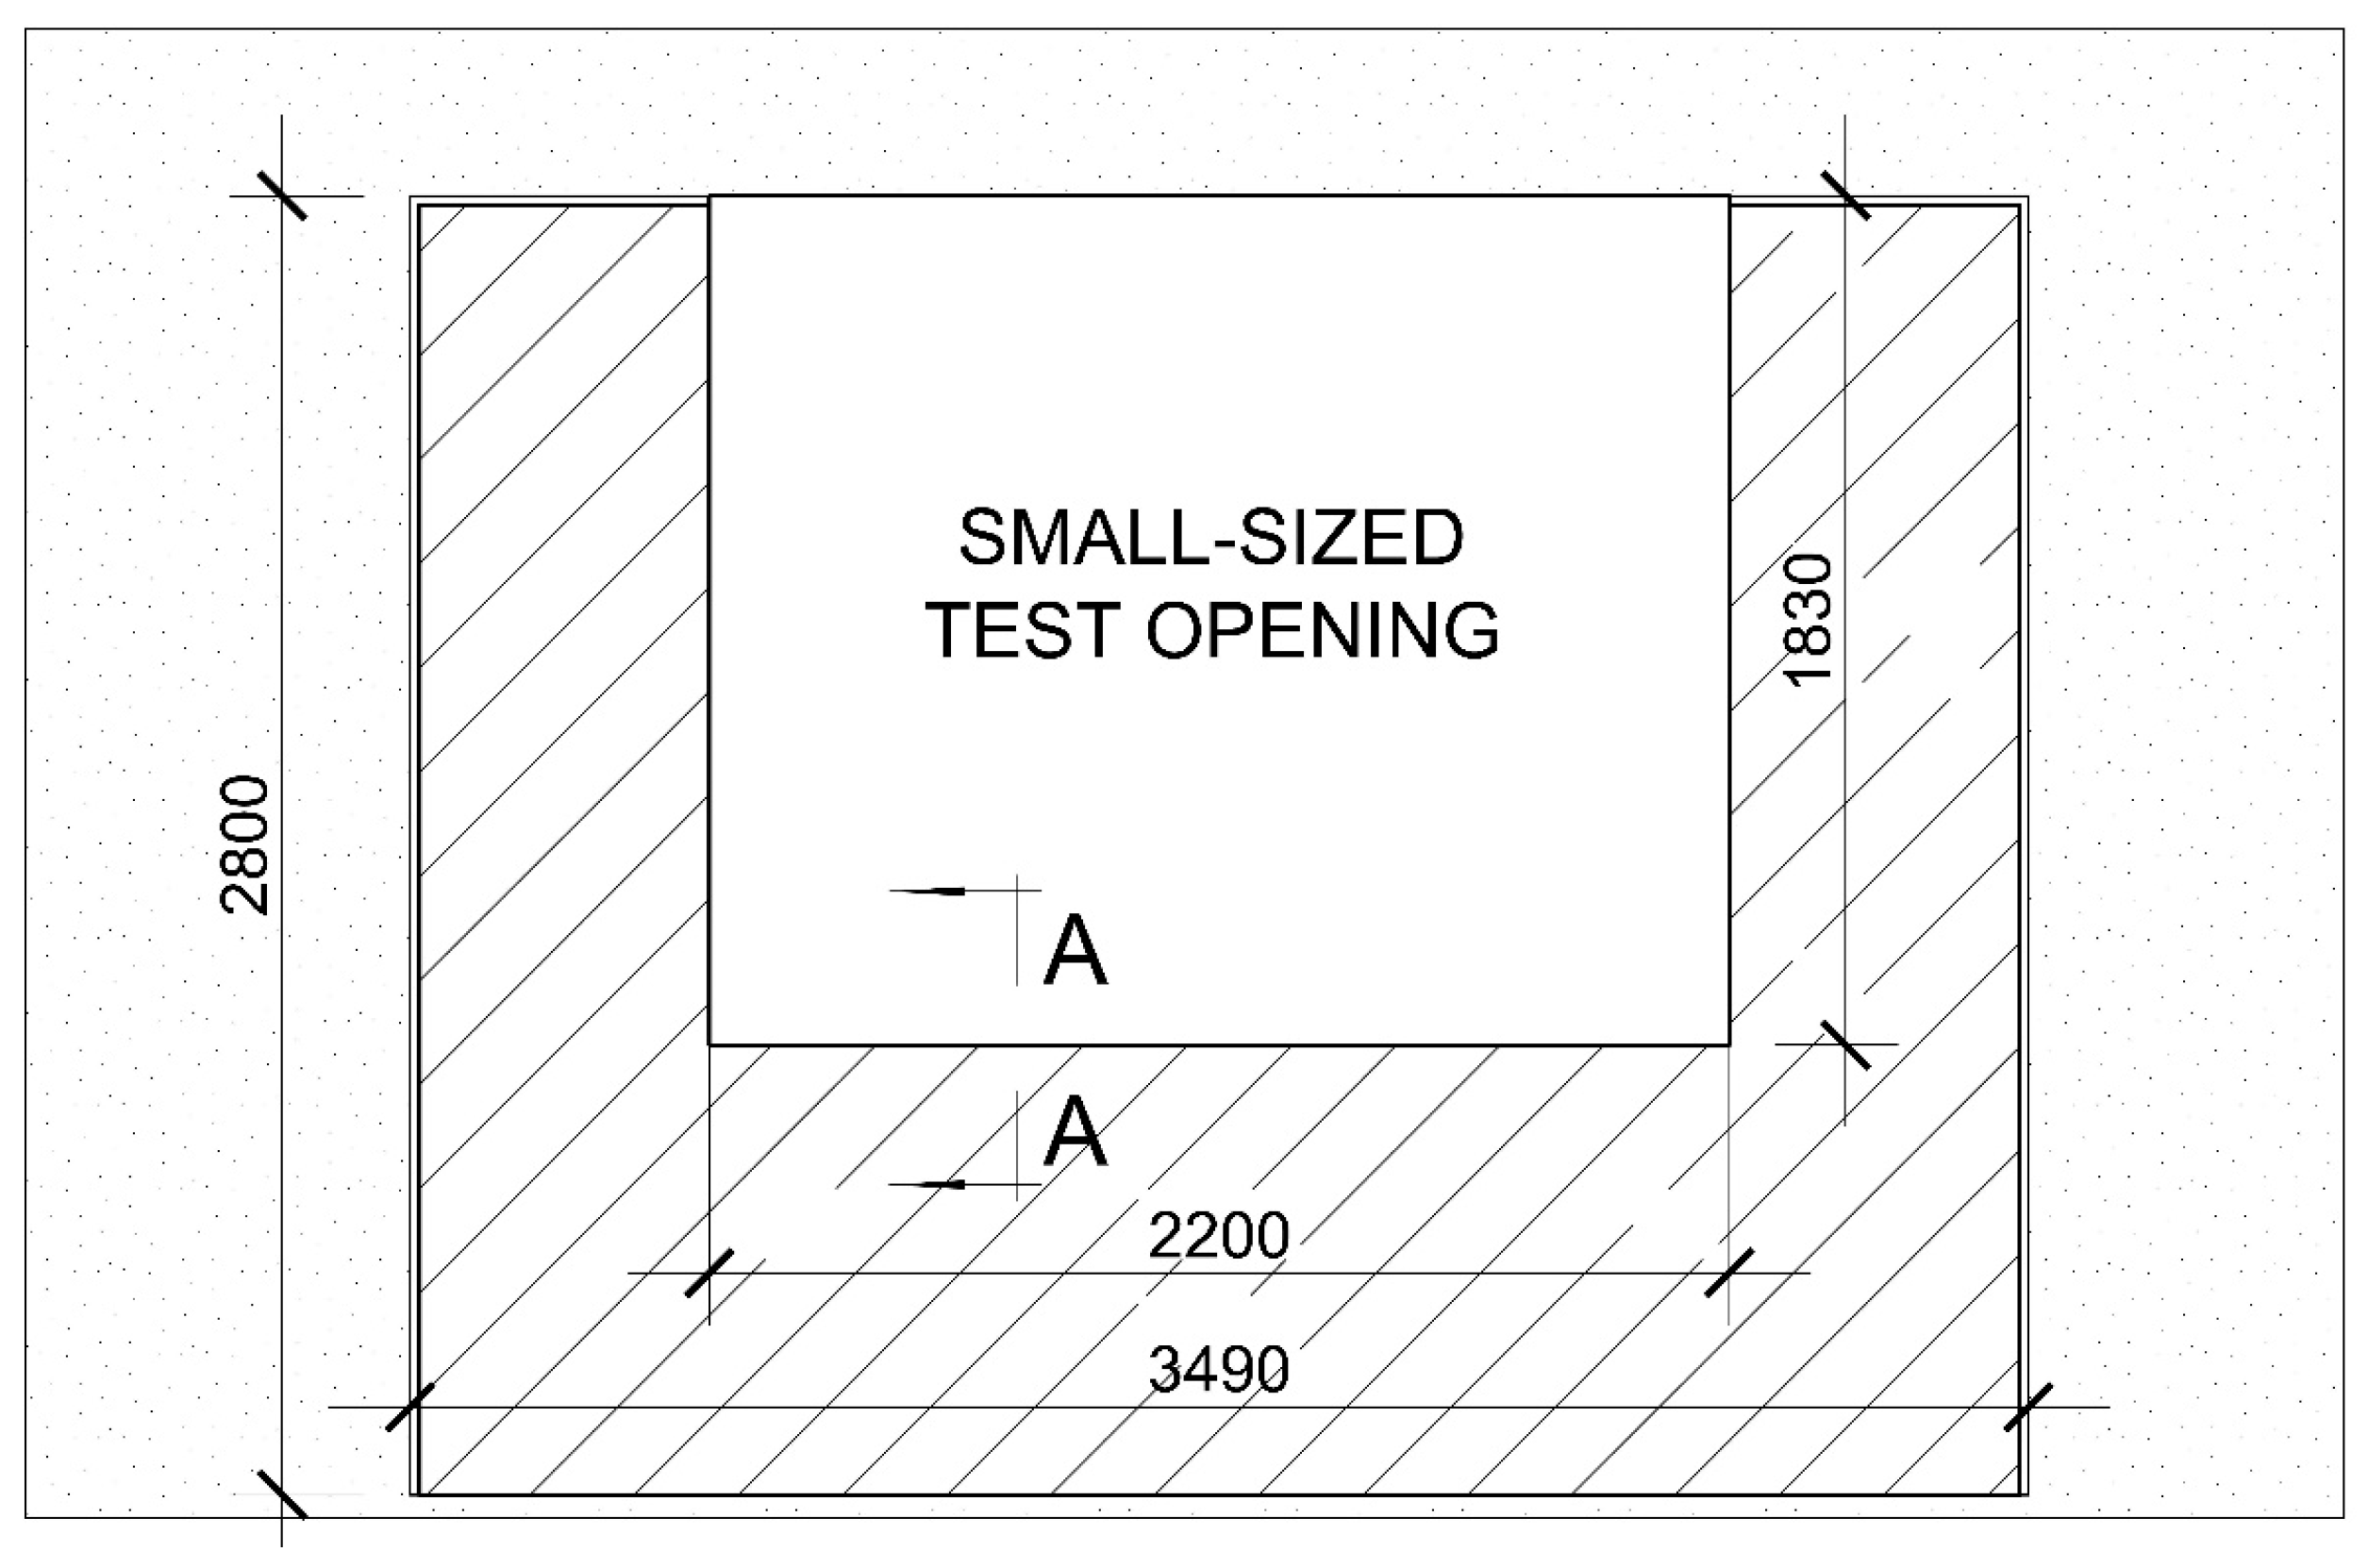
To determine the effect of window construction and the method of its installation on airborne sound insulation, a laboratory test program was planned, which took into account two types of window mullion construction: permanent mullion and movable mullion (Figure 1 and Figure 2).
The test program also took into account the construction of the lower window frame: frame with a threshold or frame without a threshold (Figure 3 and Figure 4).
The tests were performed for two types of window installation: installation using TP650 illbruck expansion tape or installation using FM355 illbruck low-pressure foam. Laboratory measurements were taken for two types of IGUs (insulating glass units): glass 10/12/4/12/6 with lower insulation (Rw = 41 dB (Rw + Ctr = 37 dB)) and glass with foil 10/12/6/12/44.1 with higher insulation (Rw = 46 dB (Rw + Ctr = 40 dB)). Both IGUs were filled with argon. The tests were intentionally carried out for a window with dimensions of 1.80 m × 2.17 m and surface S = 3.91 m2, significantly larger than dimensions of 1.23 m × 1.48 m and surface S = 1.82 m2 (reference size according to standard [1]). Table 1 presents the characteristics of subsequent test samples taking into account the differences mentioned above in the method of window installation and construction. Temperature and humidity were continuously monitored during the measurement period. The recorded values ranged from 19.7 °C to 21.1 °C and from 58% to 68% relative humidity.

3.2. Test Rooms

The measurement of airborne sound insulation in the laboratory was carried out in reverberant test rooms of the Laboratory of the Faculty of Civil Engineering of the Silesian University of Technology in Gliwice (Figure 5). Measurements were taken in laboratory testing facilities in which flanking sound transmission was suppressed.
In order to carry out window tests, a full-size test opening of test rooms was specially adapted according to the standard [1]. A special wall with specific small-sized test opening was built, measuring 2200 mm × 1830 mm, corresponding to the size of the windows tested, 2170 mm × 1800 mm (a 15 mm thick window installation gap was provided on each side). The view of the wall with a specific small-sized test opening is shown in Figure 6 and Figure 7.
If the test element is mounted in a reduced-size opening, a preliminary test shall be carried out to ensure that the sound power transmitted through the surrounding partition is small compared to the sound power transmitted through the test element. The value used for the purpose of this test is denoted as R’F. The apparent noise reduction index applies to the filler wall, including all flanking elements calculated using the test opening area. For this purpose, the reduced-size opening was filled as shown in Figure 8.
If the measured value of the sound reduction index for a test element is less than RF–15dB, the indirectly transmitted sound may be considered negligible. If the measured value is greater than or equal to RF - 15dB, the measured value shall be corrected using Formula (1).
R = 10 l g 10 R M 10 10 R F 10 ,
where R is the corrected sound reduction index of the test element, in dB, RM is the sound reduction index measured with the test element in the test opening, in dB, and RF is the flanking sound reduction index measured with the special construction in the test opening, in dB.
If the difference (RF - RM) is less than 6 dB in any of the frequency bands, the correction must be 1.3 dB; this corresponds to a difference of 6 dB. In this situation, RF shall be stated in the test report such that it is clear that the reported values are minimum values.
Table 2 gives typical values of RF for a small test opening in a laboratory capable of measuring elements having Rw values of up to 45 dB.
Figure 9 compared typical values of RF in a laboratory with a small test opening according to ISO 10140-2:2021 [32] with the values obtained for the filler wall in the Laboratory of the Faculty of Civil Engineering of the Silesian University of Technology. The comparison indicates that RF in the Laboratory of the Silesian University of Technology for the entire frequency range is significantly higher than the typical ISO values.
Figure 9 confirms the correctness of the reduced test opening in terms of sound insulation. Figure 10 describes the diagram of the measurement system used in the laboratory measurements of airborne sound insulation of windows.

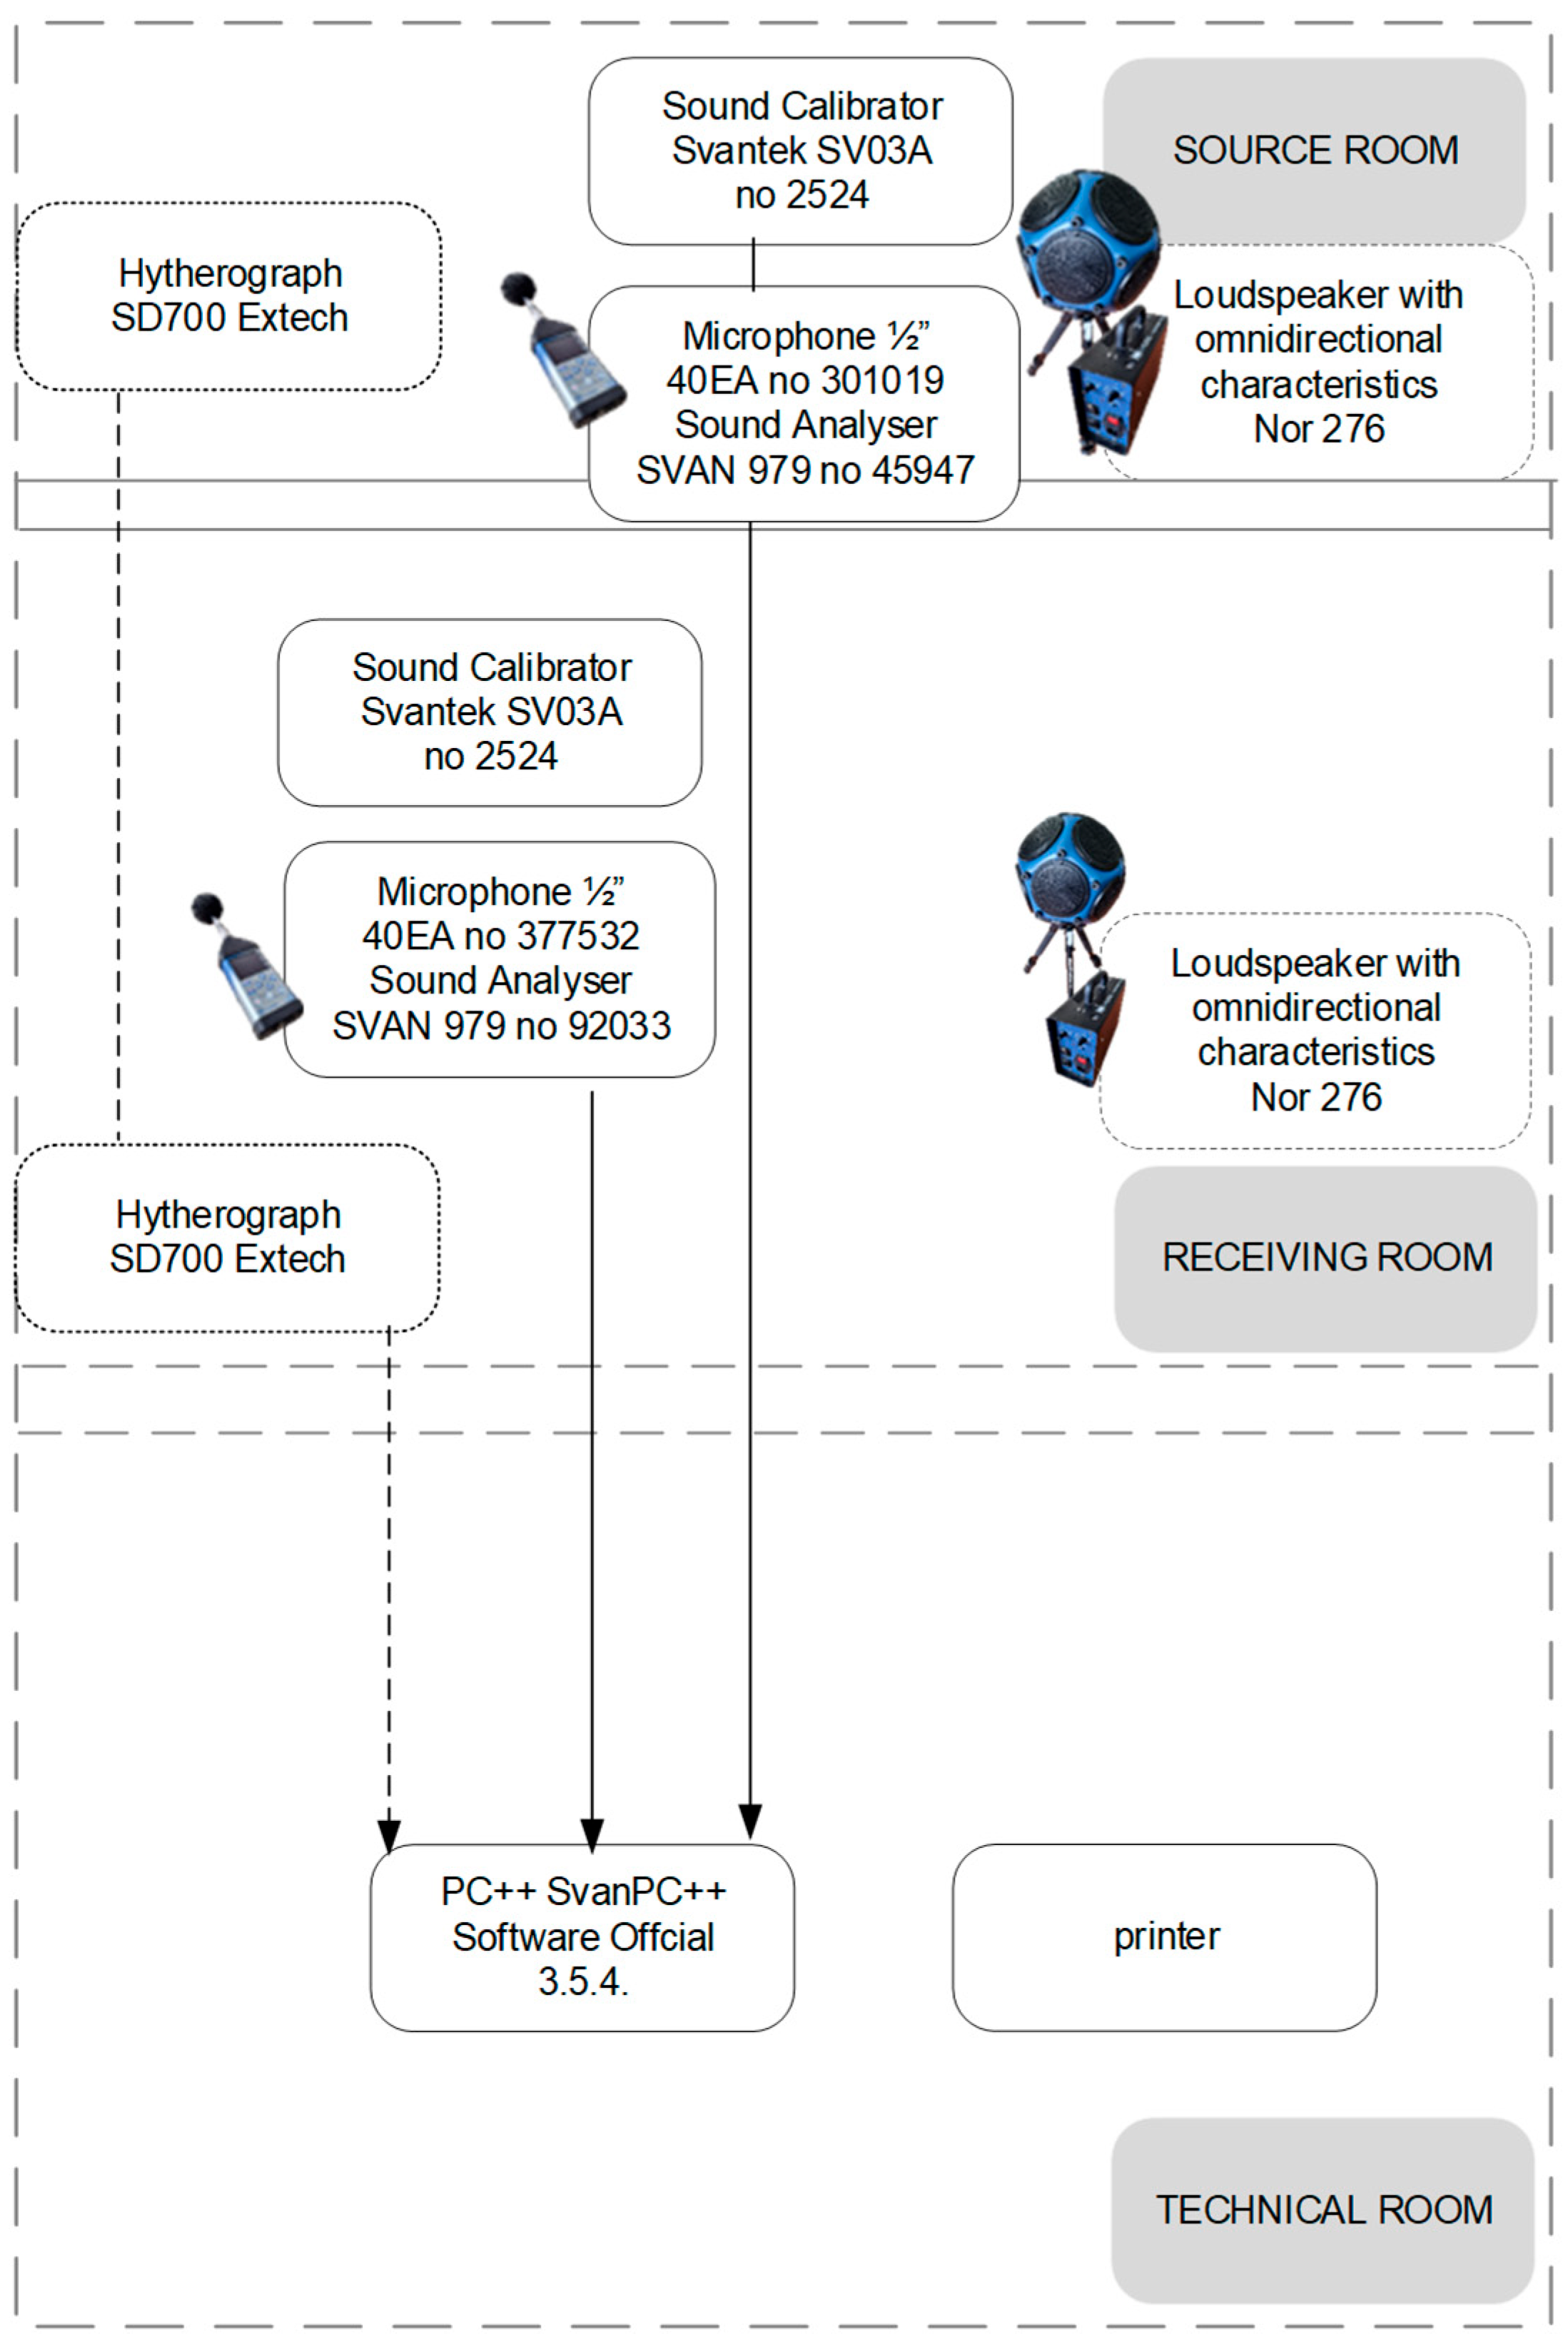
3.3. Measurement of Airborne Sound Insulation

The airborne sound insulation of the windows has been determined according to the standard [1,32]. The R sound reduction index is expressed in decibels. It has been determined using Formula (1). Alternatively, in the United States of America, the expression “sound transmission loss” (TL) is used according to ASTM standard E413 [33]. It is equivalent to the “sound reduction index”.
R = 10   l g W 1 W 2 ,
where W1 is the sound power, which is dependent on the test element in W, and W2 is the sound power, which is radiated by the test element in W.
For laboratory measurements using sound pressure, the sound reduction index R is calculated using Formula (2).
R = L 1 L 2 + 10   l g S A ,
where L1 is the average energy sound pressure level in the source room in dB, L2 is the average energy sound pressure level in the receiving room in dB, S is the area of the free test opening in which the test elements are installed in m2, and A’ is the equivalent sound absorption area in the receiving room in m2.
It is given by Sabine’s formula in Formula (3).
A = 10   l g 0.16 · V T ,
where V is the receiving room volume in m3, and T is the reverberation time made in accordance with ISO 354:2003 [34] in s.
The windows were mounted in a small test opening in the partition between these rooms (see Figure 6 and Figure 7). In the source room, a loudspeaker generated a diffuse sound field at two fixed positions. The average sound pressure levels are measured in the source and receiving rooms in the frequency range covering one-third octave bands with center frequencies from 100 Hz to 5000 Hz. Measurements were carried out within an extended frequency range of 50–5000 Hz. Due to the substantial variability of the data observed in the 80 Hz band, the analysis was limited to the 100–5000 Hz frequency range. The equivalent sound absorption area in the receiving room was calculated from measurements of reverberation time. From the difference in sound pressure level between the rooms, the quantities described in Formula (2) were evaluated by taking into account the equivalent absorption area and the size of the window. To determine the average levels of sound pressure corrected for background noise and the reverberation time, ISO 10140-4 was taken as a reference [35].
For rating airborne sound insulation and to simplify the formulation of acoustical requirements in building codes, single-number quantities are ideal according to ISO 717-1:2020 [36]. For evaluating single-number quantities (e.g., Rw), the values obtained in accordance with ISO 10140-2 [32] are compared with reference values at the frequencies of measurement within the range 100 Hz to 3150 Hz for one-third octave bands. The measured R values in one-third octave frequency bands (100 Hz to 3150 Hz) were compared with the standard reference curve (specified in ISO 717–1:2020 [36]), shifting the curve vertically in 1 dB steps until the sum of the negative deviations between the measured R values and the reference curve is as close as possible to 32 dB without exceeding it. The value of the adjusted reference curve at 500 Hz is taken as the Rw value.
To account for the characteristics of particular sound spectra in the single-number rating Rw, the spectrum adaptation term values C or Ctr should be added.
The spectrum adaptation terms C and Ctr in decibels are calculated with the sound spectra no. 1 and no. 2 according to ISO 717–1:2020 [36]:
C j = X A j X w
where j is the subscript for the sound spectra no.1 and no.2, Xw is the single number quantity calculated from R values, and XAj is calculated from the following:
X A j = 10 l g 10 ( L i , j X i ) / 10
In which i is the subscript for the one-third-octave bands from 100 Hz to 3150 Hz, Lij are the levels as given at the frequency i for the spectrum j, and Xi is the sound reduction index Ri given to one decimal place.
The resulting spectrum adaptation term is an integer by definition and is identified in accordance with the spectrum used as C when calculated with spectrum no. 1 (A-weighted pink noise) and Ctr when calculated with spectrum no. 2 (A-weighted urban traffic noise).
Generally, for different windows and different types of construction, both R and Ctr should be considered, and requirements are based on the sum of Rw and Ctr. An estimate of the indoor level weighted with A from the known A-weighted traffic noise level in front of the facade should be based on Rw + Ctr.

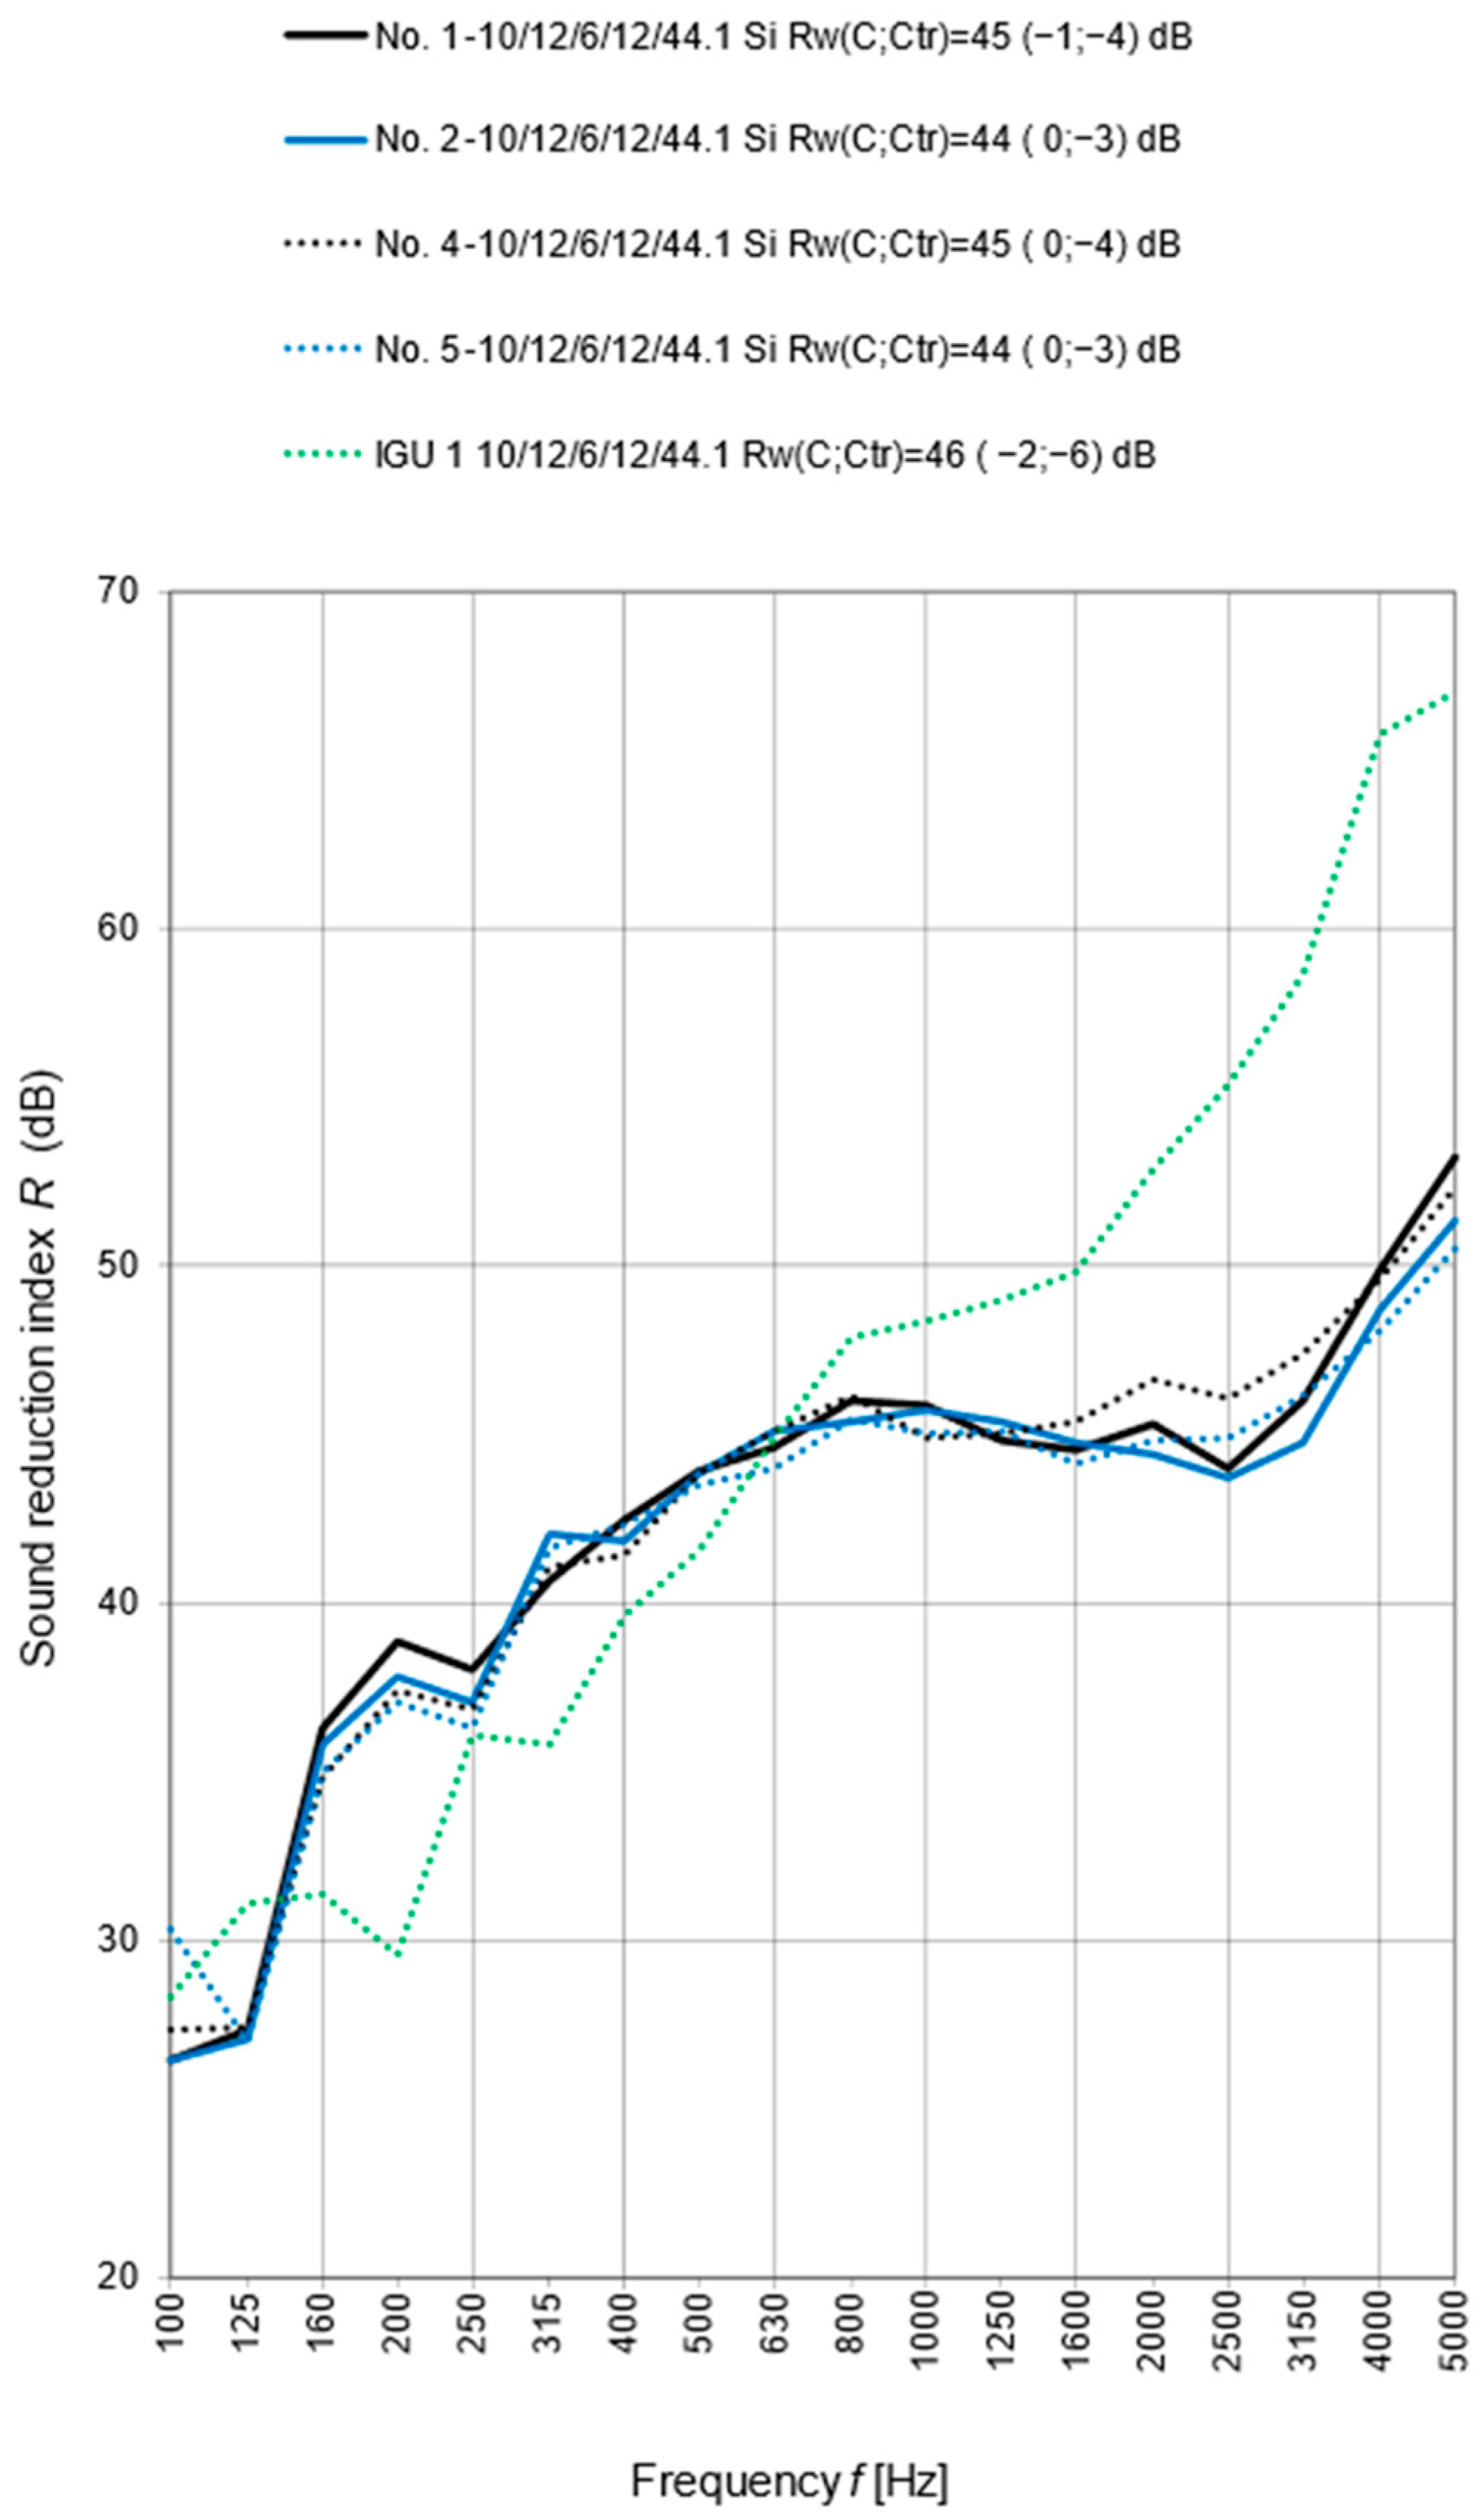
4. Results and Discussions

Figure 11 shows the test results of the sound reduction index R as a 1/3 octave frequency band for windows with IGU 1 10/12/6/12/44.1. What is surprising is that no significant reduction in sound insulation was observed for windows without a threshold and with a moving mullion (samples 4 and 5) compared to windows with a threshold and a permanent mullion. Moreover, for window no. 4, an increase in the R value was observed in the frequency range of 1600 Hz ÷ 3150 Hz compared to windows no. 1 and no. 2. Most likely, this effect is related to it having been mounted with TP650 Illbruck expansion tape, which is less rigid than if it was mounted with FM355 low-pressure polyurethane foam. These conclusions seem to be confirmed by Figure 12, which shows the results for samples 3 and 6. Both samples were mounted with FM355 Illbruck low-pressure polyurethane foam, and no effect of the difference in the construction of the threshold and the mullion on the acoustic insulation was observed. For all windows tested, a significant reduction in sound insulation was observed in the frequency range of 800 Hz ÷ 5000 Hz and a slight increase in the range of 160 Hz ÷ 500 Hz. The reduction in the high frequency range is a typical phenomenon related to leaks occurring in the window structure. The increase in insulation might be associated with a reduction in the unfavorable phenomenon of glass resonance near the frequency of 200 Hz.
Figure 12 shows the test results of the sound reduction index R as a 1/3 octave frequency band for windows with IGU 2 10/12/4/12/6. Similarly as before, for samples no. 3 and 6, a significant reduction in sound insulation was observed in the frequency range of 800 Hz ÷ 5000 Hz and a slight increase in the range of 160 Hz ÷ 500 Hz. The reasons for this occurrence are the same as for the mechanism of window production, which is shown in Figure 11.
Figure 13 shows the test results of the sound reduction index R for windows mounted with low-pressure polyurethane foam. Based on the results presented, it can be concluded that in the case of window installation using foam, the window frame structure and types of window mullion structure (movable (no. 5 and no. 6) or permanent (no. 2 and no. 3)) do not have a significant influence on the results of the acoustic insulation measurement. The differences observed are even less pronounced compared to those resulting from window installation using the TP650 Illbruck expansion tape (see Figure 11; samples no. 1 and no. 4).
Table 3 presents the test results using the weighted sound reduction index Rw and the spectrum adaptation term 1 C and 2 Ctr. Figure 14 shows the results of the weighted sound reduction index Rw for the tested windows. Figure 15 shows the results of the weighted sound reduction index Rw with the spectrum adaptation term 2 Ctr for the tested windows. The figures additionally present the predicted values of the indices calculated using the standard methodology [30], which allows us to determine the values for windows based on the glass parameters, taking into account the difference between the size of the designed window and the window with reference dimensions of 1.23 m × 1.48 m (an area of 1.8 m2).
The results after correction due to the larger window size (area S = 3.91 m2) in relation to the reference size (area 1.8 m2) were as follows: Rw = 46 – 2 = 44 dB and RW + Ctr = 40 – 2 = 38 dB for IGU 1 10/12/6/12/44.1 and Rw = 41 – 2 = 39 dB and RW + Ctr = 37 – 2 = 35 dB for IGU 2 10/12/4/12/6.
It was not possible to accept the correction that took into account the sound insulation of IGU 1 10/12/6/12/44.1 and IGU 2 10/12/4/12/6 due to the high value because, in accordance with the EN 14351-1:2006 + A2:2017 standard [30], the sound insulation values of windows RW ≥ 41 dB or RW + Ctr ≥ 37 dB should be determined by testing.
However, in the case of small investments, an investor who does not have funds for expensive and time-consuming laboratory tests often expects the designer to accept the correction value according to EN 14351-1:2006 + A2:2017 [30]. In such cases, the designer sometimes accepts the most critical correction, which is −2 dB. For such a case, the final value of the sound insulation for windows would be Rw = 42 dB and RW + Ctr = 36 dB for IGU 1 10/12/6/12/44.1 and Rw = 37 dB and RW + Ctr = 33 dB for IGU 2 10/12/4/12/6. These values are marked with a red line in Figure 14 and Figure 15.
The results of the weighted sound reduction index Rw = 45 dB for windows with IGU 1 and the TP650 Illbruck expansion tape shown in Figure 14 are 1 dB lower than the results for IGU 1 (Rw = 46 dB). The results of the weighted sound reduction index Rw = 44 dB for windows with IGU 1 and low-pressure polyurethane foam FM355 Illbruck are 2 dB lower. The results of the index Rw = 40 dB for windows with IGU 2 and the low-pressure polyurethane foam FM355 Illbruck are 1 dB lower than the results of IGU 2 (Rw = 41 dB). All windows had significantly better measurement results than the extrapolation based on EN 14351-1:2006 + A2:2017 [30], in which Rw = 42 dB and Rw = 37 dB.
The measurement results of the weighted sound reduction index Rw with spectrum adaptation term 2 Ctr shown in Figure 15 may be surprising. In the case of the IGU 1 windows for all samples (no. 1, 2, 4, and 5), RW + Ctr = 41 dB, and this value was higher than RW + Ctr = 40 dB for the reference glass, IGU 1. The increase in the RW + Ctr value for the window in relation to IGU 1 is a consequence of higher R values in the frequency range of 160 Hz ÷ 500 Hz (Figure 11). In the case of the window with IGU 2, the result for the window with a movable mullion (sample no. 6 → RW + Ctr = 38) was higher by 1 dB compared to both the window with a permanent mullion (sample no. 3 → RW + Ctr = 37) and the result of the reference glass, IGU 2 (RW + Ctr = 37).
To fully illustrate the measurement results, which differ slightly, the uncertainties ui determined from the following dependencies are presented:
u i = δ L 1 2 + δ L 2 2 + δ A 2
where δ L 1 ,   δ L 2 are the standard uncertainties of the mean determined on the basis of the following theorem:
δ L ¯ =   σ L N
where σ L is standard deviation.
The proof of theorem (8) can be found in the article of Nowoświat [37].
On the other hand, δ A is the uncertainty determined using formula (9), which was determined using the total differential for function (3) taking into account (4):
δ A = 10 T · l n 10 · ( l n T + l n ( 10.1152 )
The overall uncertainty will be expressed as an expanded uncertainty U (the results are presented in Table 4). This will be obtained by multiplying the combined standard uncertainty by a numerical factor, known as the coverage factor k, given with the following equation:
U = k · u i

5. Conclusions and Recommendations

Based on the laboratory measurements of the airborne sound insulation of the windows, the following conclusions were formulated. The window with IGU 1 with TP650 Illbruck expansion tape in samples 1 and 4 had a 1 dB higher RW index value than the window mounted with FM355 Illbruck low-pressure polyurethane foam in samples 2 and 5 (Table 3, Figure 14a). In the case of the sum RW + Ctr, the installation method had no effect on the result (Table 3, Figure 15a). The results indicate a negligible impact of the window structure on acoustic insulation. For two types of window frame structure (samples 1 and 2 with a threshold and permanent window mullion structure and samples 4 and 5 without a threshold and with a movable window mullion structure), the same RW and RW + Ctr values were obtained (Table 3, Figure 14a and Figure 15a). The same conclusions regarding the lack of effect of the frame structure of the window on the result can be drawn from the tests of the IGU 2 window (Table 3, Figure 14b and Figure 15b). The sound insulation results presented as a function of frequency show small differences that have no influence on whether the values are single numbers (Figure 11 and Figure 12). Despite the fact that the tested windows had dimensions larger than the reference size (1.23 m × 1.48 m), the RW values for the windows were at most 2 dB lower than the result for the glass of the reference size for IGU 1 and IGU 2 (Figure 14). What may be surprising is that the RW + Ctr value for the window with the IGU 2 glass was 1 dB higher than the result for the IGU 1 glass alone (Figure 15a) or, in the worst case, equal to the values for the glass of the reference size in the case of IGU 2 (Figure 15b). The research results indicate that the methodology according to EN 14351-1:2006 + A2:2017 [30], which allows for the estimation of single-number quantities RW and RW + Ctr for windows with dimensions other than the reference size based on the research results of IGUs (insulating glass units), does not work for the window structures used. The comparison of the test results with the estimation results using EN 14351-1:2006 + A2:2017 [30] indicates an unjustified reduction in the estimated values of RW and RW + Ctr for windows (Figure 14 and Figure 15). Of course, the authors are aware that the above conclusions apply only to the examined window structures, but the results are so promising that they encourage further research in this area.

Author Contributions

Conceptualization, L.D.; methodology, L.D.; validation, L.D.; formal analysis, L.D. and A.N.; investigation, L.D.; resources, L.D.; data curation, L.D.; writing—original draft preparation, A.N.; writing—review and editing, A.N.; visualization, A.N.; supervision, A.N. and L.D.; project administration, L.D. and A.N. All authors have read and agreed to the published version of the manuscript.

Funding

This publication was supported by a Pro-Quality Grant from the Rector at Silesian University of Technology, grant number 03030/RGJ24/0231.

Institutional Review Board Statement

Not applicable.

Informed Consent Statement

Not applicable.

Data Availability Statement

Data are available from the authors.

Acknowledgments

The authors have reviewed and edited the output and take full responsibility for the content of this publication.

Conflicts of Interest

The authors declare no conflicts of interest.

References

  1. ISO 10140-5: 2021; Acoustics–Laboratory measurement of sound insulation of building elements–Part 5: Requirements for test facilities and equipment. ISO: Geneva, Switzerland, 2021.
  2. Ozturk, Z.S.; Kang, J.; Aletta, F. Soundscape research in streets. A scoping review. Sustainability 2025, 17, 3329. [Google Scholar] [CrossRef]
  3. Liang, M.; Wu, H.; Liu, J.; Shen, Y.; Wu, G. Improved sound absorption performance of synthetic fiber materials for industrial noise reduction: A review. J. Porous Mater. 2022, 29, 869–892. [Google Scholar] [CrossRef]
  4. Nowoświat, A.; Sorociak, w.; Żuchowski, R. The impact of the application of thin emulsion mat microsurfacing on the level of noise in the environment. Constr. Build. Mater. 2020, 263, 120626. [Google Scholar] [CrossRef]
  5. Żuchowski, R.; Nowoświat, A.; Marchacz, M.; Górski, M. Noise assessment of expansion joints built perpendicularly and angled in the direction of traffic. Measurement method: Case study. Appl. Acoust. 2025, 235, 110674. [Google Scholar] [CrossRef]
  6. Grassie, S.L. Rail irregularities, corrugation and acoustic roughness: Characteristics, significance and effects of reprofiling. J. Rail Rapid Transit 2012, 226, 542–557. [Google Scholar] [CrossRef]
  7. Żuchowski, R.; Nowoświat, A.; Kucharski, I. Reduction of tram noise by using a rail lubrication device. Appl. Acoust. 2023, 210, 109429. [Google Scholar] [CrossRef]
  8. Nowoświat, A.; Bochen, J.; Dulak, L.; Żuchowski, R. Study on ound absorption of road acoustic screens under simulated weathering. Arch. Acoust. 2018, 43, 323–337. [Google Scholar] [CrossRef]
  9. Andargie, M.S.; Touchie, M.; O’brien, W.; Müller-Traped, M. Assessment of indoor exposure to outdoor environmental noise and effects on occupant comfort in multi-unit residential buildings. Build. Acoust. 2023, 30, 293–313. [Google Scholar] [CrossRef]
  10. Peng, P.; Wang, K.I.K.; Abdulla, W.H. Robust classification of urban sounds in noisy environments: A novel approach using SPWVD-MFCC and dual-stream classifier. Acoust. Aust. 2025. [Google Scholar] [CrossRef]
  11. Balderrama, A.; Kang, J.; Prieto, A.; Luna-Navaro, A.; Arztmann, D.; Knaack, U. Effects of Facades on urban acoustic environment and soundscape: A systematic Review. Sustainabillity 2022, 14, 9670. [Google Scholar] [CrossRef]
  12. Buratti, C.; Barelli, L.; Moretti, E. Wooden windows: Sound insulation evaluation by means of artificial neural networks. Appl. Acoust. 2013, 74, 740–745. [Google Scholar] [CrossRef]
  13. Sánchez-Sánchez, R.; Barba-Lobo, A.; Isati-Aizpurua, G.; Bolivar, J.P. Evaluation of environmental noise and prevention measures for a standard hospital area from Spain. Acoustics 2025, 7, 16. [Google Scholar] [CrossRef]
  14. Bhandari, N.; Tadepalli, S.; Gopalakrishnan, P. The combined influence of thermal and acoustic environment on overall comfort and productivity in naturally ventilated University classrooms in India. Build. Environ. 2025, 267, 112212. [Google Scholar] [CrossRef]
  15. Forssén, J.; Zachos, G.; Perez, C.R.; Kropp, W. A model study low-frequency noise exposure indoors due to road traffic. Build. Acoust. 2023, 30, 3–24. [Google Scholar] [CrossRef]
  16. Badache, K.; Guedouh, K.S.; Haddad, D. A multi-objective optimization of window Surface and glass thickness determination for daylight factor, thermal resistance and acoustic insulation of a test room performances under an avercast sky. J. Build. Eng. 2025, 101, 111717. [Google Scholar] [CrossRef]
  17. Ford, R.; Kerry, G. The sound insulation of partially open double glazing. Appl. Acoust. 1973, 6, 57–72. [Google Scholar] [CrossRef]
  18. Kerry, G.; Ford, R.D. The field performance of partially open dual glazing. Appl. Acoust. 1974, 7, 213–227. [Google Scholar] [CrossRef]
  19. Kang, J. Numerical simulation of an acoustic window system using finite element method. Acta Acust. United Acustics 2007, 93, 152–163. [Google Scholar]
  20. Yuya, N.; Tsuyoshi, N.; Takashi, Y. Sound propagation in soundproofing casement windows. Appl. Acoust. 2009, 70, 1160–1167. [Google Scholar] [CrossRef]
  21. Tong, Y.G.; Tang, S.K. Plenum window insertion loss in the presence of a line source-a scale model study. J. Acoust. Soc. Am. 2013, 133, 1458–1467. [Google Scholar] [CrossRef]
  22. Mucci, N.; Traversini, V.; Lorini, C.; De Sio, S.; Galea, R.P.; Bonaccorsi, G.; Arcangeli, G. Urban noise and psychological distress: A symetric revive. Int. J. Environ. Res. Public Health 2020, 17, 6621. [Google Scholar] [CrossRef]
  23. Berardi, U.; Ivina, C.; Stasi, R. Sound insulation improvements in lift-and-slide window systems. Build. Environ. 2025, 282, 113258. [Google Scholar] [CrossRef]
  24. Haase, M.; Amato, A. Performance evaluation of three different Façade models for sustainable office buildings. J. Green Build 2006, 1, 89–103. [Google Scholar] [CrossRef]
  25. Fusaro, G.; Kang, J. Participatory approach to draw ergonomic criteria for window design. Int. J. Ind. Erg. 2021, 82, 103098. [Google Scholar] [CrossRef]
  26. Rubino, C.; Liuzzi, S.; Fusaro, G.; Martellotta, F.; Scrosati, C.; Garai, M. Balancing ventilation and sound insulation in windows by means of metamaterials: A review of the state of the art. Built. Environ. 2025, 275, 112780. [Google Scholar] [CrossRef]
  27. Tsukamoto, Y.; Tomikawa, Y.; Sakagami, K.; Okuzono, T.; Maikawa, H.; Komoto, Y. Experimental assessment of sound insulation performance of a double window with porous absorbent materials its cavity perimeter. Appl. Acoust. 2020, 165, 107317. [Google Scholar] [CrossRef]
  28. Takahashi, D.; Sawaki, S.; Mu, R.L. Improvement of sound insulation performance of double-glazed window by using viscoelastic connectors. J. Sound Vib. 2016, 371, 56–66. [Google Scholar] [CrossRef]
  29. Yu, X.; Lau, S.-K.; Cheng, L. A numerical investigation on the sound insulation of ventilation windows. Appl. Acoust. 2017, 117, 113–121. [Google Scholar] [CrossRef]
  30. EN 14351-1:2006+A2:2017; Windows and Doors–Product Standard, Performance Characteristics–Part 1: Windows and External Pedestrian Doorsets. Available online: https://www.en-standard.eu/une-en-14351-1-2006-a2-2017-windows-and-doors-product-standard-performance-characteristics-part-1-windows-and-external-pedestrian-doorsets/?srsltid=AfmBOopDHiBysxljvfzUNzXanJ3wTuBp8DEyRfdAiUSYLCIxYFOYC_N1 (accessed on 20 June 2025).
  31. ISO 10140-2:2021; Acoustics—Laboratory measurement of sound insulation of building elements–Part 2: Measurement of airborne sound insulation. ISO: Geneva, Switzerland, 2021.
  32. ISO 10140-4:2021; Acoustics—Laboratory measurement of sound insulation of building elements–Part 4: Measurement procedures and requirements. ISO: Geneva, Switzerland, 2021.
  33. ISO 717-1:2020; Acoustics–Rating of sound insulation in buildings and of building elements–Part 1: Airborne sound insulation. ISO: Geneva, Switzerland, 2020.
  34. ASTM-E413-22; Classification for Rating Sound Insulation. Available online: https://store.astm.org/e0413-22.html (accessed on 20 June 2025).
  35. ISO 354:2003; Measurement of sound absorption in a reverberation room. ISO: Geneva, Switzerland, 2003.
  36. Bartnik, W.; Nieradka, P.; Jóska, J.; Chmielewski, B. Predicting Acoustic performance of window with high sound insulation. Forum Acusticum 2023, 179–184. [Google Scholar] [CrossRef]
  37. Nowoświat, A. Determination of the reverberation time using the measurement of sound decay curves. Appl. Sci. 2023, 13, 8607. [Google Scholar] [CrossRef]
Figure 1. View of windows installed for laboratory measurements of airborne sound insulation: (a) permanent mullion and (b) movable mullion.
Sustainability 17 06892 g001
Figure 2. Drawing of the structure of the post: (a) permanent mullion, (b) movable mullion.
Sustainability 17 06892 g002
Figure 3. View of the lower window frame: (a) with threshold, (b) without threshold.
Sustainability 17 06892 g003
Figure 4. Drawing of the construction of the lower window frame: (a) with a threshold, and (b) without a threshold.
Sustainability 17 06892 g004
Figure 5. Test rooms with full-size test opening at the Laboratory of the Faculty of Civil Engineering of the Silesian University of Technology in Gliwice.
Sustainability 17 06892 g005
Figure 6. A view of the wall with specific small-sized test opening for the laboratory measurement of airborne sound insulation of windows.
Sustainability 17 06892 g006
Figure 7. Cross-sections A-A through a reduced-sized test opening for sound insulation tests of windows. Elements in the figure: (1) calcium silicate solid block that was 1820 kg/m3 with a thickness of 180 mm; (2) calcium silicate solid block that was 1820 kg/m3 with a thickness of 240 mm; (3) mineral stone wool that was 50 kg/m3 with a thickness of 50 mm; (4) olkit plastic kit; (5) plasterboard that was 700 kg/m3 with a thickness of 12.5 mm; (6) tested window.
Sustainability 17 06892 g007
Figure 8. Cross-sections A-A through a reduced-sized test opening for sound insulation tests of windows. Elements in the figure: (1) calcium silicate solid block that was 1820 kg/m3 with a thickness of 180 mm; (2) calcium silicate solid block that was 1820 kg/m3 with a thickness of 240 mm; (3) mineral stone wool that was 50 kg/m3 with a thickness of 50 mm; (4) olkit plastic kit; (5) plasterboard that was 700 kg/m3 with a thickness of 12.5 mm; (6) tested window; (7) 2x plasterboard that was 700 kg/m3 with a thickness of 12.5 mm; (8) steel profile UW 50.
Sustainability 17 06892 g008
Figure 9. Comparison of typical values of F’R in a laboratory with a small test opening according to ISO 10140-2:2021 [32] with the values obtained for the filler wall at the Laboratory of the Faculty of Civil Engineering of the Silesian University of Technology presented in Figure 8.
Sustainability 17 06892 g009
Figure 10. Diagram of the measuring system used in the tests. TP650 illbruck—Trempo CPG Europe Bodenwöhr, Germany; Norsonic, Norsonic—AS, Trandby, Norway; Svantek—Warsaw, Poland.
Sustainability 17 06892 g010
Figure 11. Results of the sound reduction index R as a 1/3 octave frequency band for windows with IGU 1 10/12/6/12/44.1.
Sustainability 17 06892 g011
Figure 12. Results of the sound reduction index R as a 1/3 octave frequency band for windows with IGU 2 10/12/4/12/6.
Sustainability 17 06892 g012
Figure 13. Results of the sound reduction index R as a 1/3 octave frequency band for windows with IGU 1 10/12/6/12/44.1 (samples no. 3 and no. 6).
Sustainability 17 06892 g013
Figure 14. Results of the weighted sound reduction index Rw for windows with (a) IGU 1 10/12/6/12/44.1 and (b) IGU 2 10/12/4/12/6. Designation: red line is according to standard EN [30].
Sustainability 17 06892 g014
Figure 15. Results of the weighted sound reduction index Rw with spectrum adaptation term 2 Ctr for windows with (a) IGU 1 10/12/6/12/44.1 and (b) IGU 2 10/12/4/12/6. Designation: red line is according to standard EN [30].
Sustainability 17 06892 g015
Table 1. Characteristics of the test samples taking into account differences in the method of installation and construction of windows.
Sample NumberMountingIGUs (Insulating Glass Units)
Rw (C; Ctr) [dB]
Mullion Structure
FoamTapeIGU 1 10/12/6/12/44.1 46 (−2; −6) dBIGU 2 10/12/4/12/6
(−2; −4) dB
MovablePermanent
1 ++ +
2+ + +
3+ + +
4 ++ +
5+ + +
6+ ++
Note: IGU 1: glass 10/12/4/12/6 with lower insulation Rw = 41 dB (Rw + Ctr = 37 dB), IGU 2: glass with foil 10/12/6/12/44.1 with higher insulation Rw = 46 dB (Rw + Ctr = 40 dB), Foam: FM355 illbruck low-pressure foam, Tape: TP650 illbruck expansion tape. "+" means that a variant exists
Table 2. Typical values of R’F in a laboratory with a small test opening according to ISO 10140-2:2021 [32].
f [Hz]100125160200250315400500630
RF′ [dB]354042475052545658
f [Hz]80010001250160020002500315040005000
RF′ [dB]606263656768707273
Table 3. Results of the weighted sound reduction index Rw and spectrum adaptation term 1 C and 2 Ctr for windows with size of 1.80 m × 2.17 m and area of S = 3.91 m2 with IGU 1 10/12/12/44.1 and IGU 2 10/12/12/6. “+” means that a variant exists.
Sample NumberMountingIGUs (Insulating Glass Units)
Rw (C; Ctr) dB
Mullion Structure
FoamTapeIGU 1 10/12/6/12/44.1 46 (−2; −6) dBIGU 2 10/12/4/12/6 41 (−2; −4) dBMovablePermanent
1 +45 (−1; −4) +
2+ 44 (0; −3) +
3+ 40 (0; −3) +
4 +45 (0; −4) +
5+ 44 (0; 3) +
6+ 40 (0; −2)+
Table 4. Uncertainties U for sound reduction index R.
fSample 1Sample 2Sample 3Sample 4Sample 5Sample 6
1002.562.312.102.298.522.42
1251.431.511.493.922.041.77
1601.572.022.311.601.382.54
2001.231.591.251.251.411.40
2501.041.041.660.790.811.11
3150.940.971.161.010.691.07
4000.740.760.870.740.610.58
5000.610.590.720.600.520.6
6300.670.620.500.510.620.57
8000.420.550.630.500.450.53
10000.570.420.520.430.450.50
12500.580.470.440.390.390.41
16000.390.400.430.300.410.45
20000.300.420.380.370.270.39
25000.320.410.350.360.380.34
31500.280.330.710.350.340.36
40000.410.470.550.310.370.32
50000.400.490.660.310.380.32
Disclaimer/Publisher’s Note: The statements, opinions and data contained in all publications are solely those of the individual author(s) and contributor(s) and not of MDPI and/or the editor(s). MDPI and/or the editor(s) disclaim responsibility for any injury to people or property resulting from any ideas, methods, instructions or products referred to in the content.

