Article

Structure-from-Motion Photogrammetry for Density Determination of Lump Charcoal as a Reliable Alternative to Archimedes’ Method †

Department of Land, Environment, Agriculture and Forestry, University of Padova, Viale dell’Università 16, 35020 Legnaro, Italy
*
Authors to whom correspondence should be addressed.
This article is a revised and expanded version of a paper entitled Comparative assessment of lump charcoal density using photogrammetry as an alternative to Archimedes method according to ASTM D2395-17 standard, which will be presented at AIIA 2025 “Biosystems Engineering for the Green Transition”, Reggio Calabria, Italy, 21–24 September 2025.
Sustainability 2025, 17(17), 7991; https://doi.org/10.3390/su17177991
Submission received: 11 August 2025 / Revised: 2 September 2025 / Accepted: 3 September 2025 / Published: 4 September 2025

Abstract

Lump charcoal is used in various applications, with combustion performance reliant on physical properties including apparent density. Currently, apparent density is measured by liquid displacement using Archimedes’ principle, which can yield inconsistent results for porous, irregular materials. This study investigates structure-from-motion (SfM) photogrammetry as a non-destructive alternative for estimating the apparent density of lump charcoal. Ninety fragments from 15 commercial samples were analyzed. Mass was measured using an analytical balance, and volume was estimated independently via Archimedes’ method and photogrammetry. Apparent density was calculated as the ratio of mass to volume. Results showed strong agreement between the two methods. Mean density values ranged from 284.2 to 751.6 kg/m3 for photogrammetry and from 267.2 to 765.7 kg/m3 for Archimedes. No significant differences were found (Wilcoxon test, p > 0.05), and a strong correlation was observed (Spearman’s ρ = 0.94, p < 0.001). Photogrammetry also demonstrated low estimation errors, with a mean absolute error of 38.8 kg/m3, a percentage error of 9.9%, and a root mean squared error of 50.2 kg/m3. Beyond methodological innovation, this approach strengthens sustainability by supporting accurate fuel properties control, allowing better use of the resource and maximizes combustion efficiency. In this way, it contributes to United Nations Sustainable Development Goal 7 (SDG7) on affordable, reliable, and sustainable energy.

1. Introduction

Lump charcoal is a widely used material with applications ranging from industrial processes, such as in the iron and steel industries, to domestic uses for cooking and grilling in both rural and urban settings [1]. Production technologies, feedstock type, and pyrolysis conditions determine the quality and performance of charcoal [2]. Depending on its intended use, charcoal must exhibit specific physical, chemical, and mechanical characteristics to ensure optimal performance [3,4,5]. Among the key physical properties, density plays an important role and is typically discussed in three forms. True density refers to the density of the solid carbon structure, excluding internal pores, and is typically measured on a dry, anhydrous basis; bulk density considers the mass-per-unit volume, including inter-particle voids; and apparent density represents the overall density of each particle, accounting for both the solid material and its internal porosity [6,7].
Apparent density is crucial because it directly influences combustion behavior, thermal efficiency, burning rate, and mechanical performance during handling and storage [3,4,5,8,9]. It also affects related parameters such as porosity, bulk density, and energy density [3,9]. Energy density, defined as the energy stored per unit volume of fuel, is critical in determining combustion performance and logistical aspects such as transportation and storage. A higher apparent density typically corresponds to greater energy density and combustion efficiency, along with reduced handling costs [3]. In contrast, low-density charcoal generally shows reduced reactivity and incurs higher transport costs due to the larger volume required to move the same mass and energy [6].
In industrial contexts, such as the steel sector, apparent density is a key parameter influencing both the mechanical behavior under stress, including fiber compression and resistance, and gravimetric yields [4]. Denser charcoal increases furnace productivity, as a greater mass can be loaded into the same volume. In domestic applications, especially in cooking and grilling, apparent density remains a crucial performance factor. Charcoal with higher apparent density is associated with higher combustion efficiency, leading to extended cooking times and reduced fuel consumption [9]. However, Mencarelli et al. [5] showed that a strong negative correlation exists between apparent density and both weight loss and burning rate. They also observed that while denser charcoal burns more efficiently, excessive apparent density may reduce peak combustion temperatures, potentially affecting cooking performance.
In both industrial and domestic contexts, improving how apparent density is assessed directly supports sustainability goals, in particular United Nations Sustainable Development Goal (SDG) 7: “Ensure access to affordable, reliable, sustainable and modern energy for all”. Reliable and repeatable apparent density metrics enable more efficient grading and process control, which increases productivity, reduces transport volumes at equal mass, and stabilizes combustion behavior across uses. By ensuring that the same useful heat can be delivered with less fuel and time, accurate density characterization promotes affordable access to energy services (Target 7.1), while also driving efficiency improvements across the energy value chain (Target 7.3) [10]. In this way, better apparent density assessment not only benefits industrial productivity and domestic cooking performance but also contributes to reducing resource use and environmental impacts.
Despite this centrality and its implications for SDG7, no specific international standards currently exist for its measurement. The European standards EN 1860-2 [11] and EN ISO 17225-1 [12] include only bulk density among the required parameters. No specific ISO standards have been developed for this purpose. The most closely applicable protocol currently available is the American standard ASTM D2395-17 [13], which, although originally developed for wood products, offers the most suitable framework for assessing properties relevant to charcoal. This method relies on Archimedes’ principle to determine apparent density. Although widely used, it presents major limitations when applied to porous and irregular materials such as lump charcoal: entrapped air bubbles, incomplete liquid penetration into pores, and operator-dependent immersion practices often lead to systematic overestimation of apparent density and limited repeatability [14,15]. These issues reduce the reliability of data and hinder cross-study comparisons.
To overcome such limitations, recent studies have explored image-based approaches for characterizing the physical properties of solid biofuels. Pierdicca et al. [16] introduced a deep learning-based system employing a Mask Region-Based Convolutional Neural Network (Mask R-CNN) with a 101-layer Residual Network (ResNet-101) backbone to automatically detect and measure wood pellet dimensions from digital images. The method proved robust under various lighting conditions, achieving a mean average precision of 0.74 and average length estimation errors of 16–17%. More recently, Toscano et al. [17] developed a system using traditional computer vision techniques, including edge detection and morphological operations, to assess wood pellet geometry and bulk distribution. Their approach enabled non-contact measurements of length, shape, and volume with good agreement with manual measurements. Igathinathane et al. [18] applied a 3D laser-scanned imaging workflow to compute the envelope volume of reference materials (cylinders and cuboids), densified biomass (pellets and briquettes), and softwood chips. On reference objects, the approach exceeded 98% accuracy, validating the scan as a measurement standard. For biomass fuels, repeatability tests on representative pieces showed sub-percent variability: cotton-gin briquettes exhibited coefficients of variation of 0.05% (volume) and 0.07% (area), while switchgrass pellets yielded 0.13% and 0.29%, respectively, confirming high within-object precision under repeated scans. For softwood chips, the authors optimized vertical mounting and plane scans to capture irregular surfaces, highlighting that high resolution is essential for measurement accuracy. Altgen et al. [19] further advanced the field by employing an automated line-scanning laser system to characterize particle geometry in heterogeneous post-consumer wood chips, resolving length, width, and thickness at sub-millimeter resolution (0.1 mm for length/width; 0.02 mm for thickness) and deriving size distributions across fractions. This approach proved valuable for accurately describing the geometric characteristics of irregular biofuels. Nevertheless, current applications remain relatively few and mostly restricted to regular densified biofuels, such as wood pellets and briquettes, whereas their performance on more heterogeneous and structurally complex materials, such as lump charcoal, has yet to be investigated.
In other fields, the measurement of size and volume for irregularly shaped materials is increasingly performed using photogrammetry. This technique has emerged as a powerful and non-invasive tool for volumetric analysis. Structure-from-motion (SfM) photogrammetry reconstructs three-dimensional shapes from a series of overlapping photographs taken from different perspectives. Although the process is computationally demanding, advances in software and hardware have made it increasingly accessible, even for non-specialists [14,20]. Photogrammetry enables the accurate measurement of distances, angles, surface areas, and volumes, and has demonstrated high performance when applied to complex, irregular shapes [14,20,21,22]. Yet, its potential for assessing irregular solid biofuels has not been systematically investigated. This study addresses that gap by applying and validating a photogrammetric workflow for lump charcoal, directly comparing it to the conventional Archimedes method. By doing so, it extends the applicability of photogrammetry from standardized fuels to highly irregular, porous materials, demonstrating its suitability for more complex biofuel characterization.
Given the current lack of standardized methods for measuring apparent density and the growing potential of image-based technologies, this study aims to compare two approaches for determining the apparent density of lump charcoal. The first is the conventional gravimetric method based on Archimedes’ principle. The second is the implementation of a dedicated photogrammetric method. The goal is to evaluate and compare the two techniques in terms of accuracy, repeatability, and practical feasibility, and to validate photogrammetry as a reliable and non-destructive alternative for charcoal quality assessment. By lowering the cost and complexity of apparent density testing, the proposed approach can support more affordable and efficient energy services, in line with SDG7.

2. Materials and Methods

2.1. Sample Collection

An overview of the experimental workflow is shown in Figure 1. This study involved the comparative evaluation of two methods for determining the apparent density of lump charcoal: Archimedes’ water displacement technique and photogrammetric volume reconstruction.
Fifteen lump charcoal samples (labeled LC01 to LC15) were selected, each originating from a different commercial bag available on the Italian market. The samples differed in origin and production processes, which involved the use of various wood species and tree parts, to capture a broad range of potential apparent density values. For each sample, 6 individual charcoal fragments were randomly chosen, resulting in a total of 90 analyzed units.
In this study, “sample” refers to each commercial bag/batch (LC01–LC15), whereas “fragment” denotes an individual charcoal piece (n = 6 per sample). All primary measurements were performed at the fragment level; sample-level results represent aggregated statistics across the six fragments.
Before weighing, all fragments were oven-dried at 105 ± 2 °C to a constant mass following ISO 18134-2 (oven-dry method). Constant mass was defined as a change <0.1% after an additional 60 min drying [23].
The mass of each dry fragment was measured using an analytical balance (model PS 6000/C/2, Radwag, Radom, Poland), with a precision of 0.01 g. Volume was assessed independently using both the Archimedean method and the photogrammetric approach. Apparent density was calculated as the ratio between the measured mass and the estimated volume. Detailed descriptions of the volume determination procedures and subsequent statistical analyses are provided in the following sections. Apparent density (ρ) was calculated using the following equation:
ρ = M/V
where M is the mass (kg) and V is the volume (m3) as determined by either method.

2.2. Archimedes’ Method

Volume measurements based on Archimedes’ principle were carried out following ASTM D2395-17 [13]. This standard relies on the principle that a body submerged in a fluid experiences an upward buoyant force equal to the weight of the displaced fluid. Consequently, the volume of displaced water corresponds to the volume of the submerged object. To ensure complete saturation of internal pores and to prevent bubbles that could affect the final volume measurement [14], the charcoal samples were soaked in water for at least one hour before measurement. The saturated sample was then submerged in a graduated cylinder filled with water, and the water displaced was measured from the change in water level. The water temperature was kept at room temperature (~20–22 °C) to ensure consistency in fluid density. Since the density of charcoal is lower than that of water, samples tend to float and therefore require submersion. To ensure full immersion, a small auxiliary body (weight) of known and independently determined volume was used to hold the sample below the water surface. During calculations, the displaced volume corresponding to this auxiliary body was subtracted from the total measured displacement, so that only the net volume of the charcoal fragments was considered.

2.3. Photogrammetry

2.3.1. Image Acquisition

To ensure consistent and diffuse lighting during image acquisition, a light box (40 × 40 × 40 cm) was used. The background consisted of a smooth, dust-free green paper sheet designed to minimize reflections and avoid feature points that could interfere with structure-from-motion (SfM) reconstruction [16]. Wrinkles or textures on the background were carefully avoided to reduce image noise.
A fixed-camera configuration was employed for image acquisition, as this setup is faster and more convenient than rotating the camera around the object [14,21,22]. In this approach, each of the six charcoal fragments per sample was placed on a manually rotatable 360° platform. Samples were positioned with their flattest surface in contact with the platform, without the use of adhesives, to preserve their physical integrity. Visual markers, each 100 ± 0.1 mm in length, were placed both on the rotating platform and directly on the samples. These markers were positioned at known and fixed distances to aid the SfM algorithm in image alignment and to facilitate accurate scale calibration. Additionally, a cylindrical object with a known volume was positioned at the center of each reconstruction. This served as a reference to verify the accuracy of the volume estimates obtained from the 3D models.
Images were acquired using a Fujifilm® X-T1 digital camera (Fujifilm Corporation, Tokyo, Japan) with the following settings: 1920 × 1080 px resolution, f/4.5 aperture, 1/60 s exposure time, and ISO 200. Based on preliminary assessments from the literature [21], the optimal object-to-camera distance was determined to be approximately 15–30 cm, balancing image distortion and field of view. The acquisition protocol consisted of multiple image series taken around each fragment. An initial set of 150 photographs was captured with the camera oriented frontally (0° angle). As the platform was manually rotated, the camera was repositioned vertically to capture additional sets of 120 images at approximately 30° and 45°, and 130 images at 90° (top view). These angles were selected to ensure full coverage of the particle surface, minimizing occlusions and improving the reconstruction of both lateral and internal irregularities. In total, 500–520 images were acquired per sample. From these, blurred or poorly lit images were discarded, and only the highest quality photographs were retained for subsequent 3D reconstruction.

2.3.2. 3D Modeling and Volume Estimation of Charcoal Samples

To estimate the volume of charcoal samples, 3D models were reconstructed using photogrammetry via the structure-from-motion (SfM) commercial software Agisoft® Metashape (2.2.0), known for its user-friendly interface and high reconstruction speed [16]. The workflow consisted of the following steps:
  • Photo alignment and sparse point cloud generation: Images were aligned through automatic feature detection and matching, allowing estimation of internal and external camera parameters. This produced a sparse point cloud through triangulation (Figure 2A). As previously mentioned, manual markers were placed on predefined visual targets during sample preparation to enhance alignment accuracy.
  • Dense point cloud generation: A dense point cloud was computed using multi-view stereo (mvs) algorithms, which interpolated additional points based on image overlap to enhance spatial resolution.
  • Model cleaning and orientation: Erroneous or noisy points were manually removed from the dense cloud. The model was then aligned with the reference plane.
  • Digital Elevation Model (DEM) and mesh construction: A DEM was generated from the dense point cloud (Figure 2B). The uniform coloration of the DEM base was used to verify correct orientation. A polygonal mesh was then built using Delaunay triangulation, producing a continuous 3D surface (Figure 2C). Original photographs were projected onto the mesh to create a high-resolution texture, highlighting surface details and improving visual realism.
  • Volume estimation: To calculate volumes, polygonal regions were drawn around each charcoal fragment. Using the “Measure” tool in Metashape, volumes were computed relative to a best-fit plane, which minimizes irregularities in the base surface. The obtained volume was used for apparent density calculation.

2.4. Economic Evaluation

A semi-quantitative economic analysis was conducted to complement the comparison between Archimedes’ method and photogrammetry. The evaluation was based on cost parameters representative of research laboratory settings in Italy, including technician labor, equipment, and software. Labor costs were estimated at EUR 18 per hour, corresponding to the gross cost to the institution for technical personnel. Time requirements were derived from empirical observations during the experimental phase and incorporated into different operational scenarios.
For the photogrammetric approach, the analysis considered expenses associated with a high-resolution camera, lighting system, platform, workstation, and a professional license of Agisoft Metashape® (Agisoft LLC, St. Petersburg, Russia). Three scenarios were modeled to reflect varying levels of equipment availability: (1) exclusive use of equipment, (2) amortized use distributed across multiple applications over three years (33% allocation), and (3) the preexisting availability of all equipment. For Archimedes’ method, only basic laboratory instruments were included, assuming negligible capital costs. All cost parameters, assumptions, and results are provided in Table S1.

2.5. Statistical Analysis

All statistical analyses were performed using R software (version 4.5.1). Before analysis, data were tested for normality and homoscedasticity using the Shapiro–Wilk test and Levene’s test, respectively. Since the assumptions of normality and equal variances were not met, non-parametric tests were applied. Apparent density measurements obtained via photogrammetry and Archimedes’ method were compared using the Wilcoxon signed-rank test to evaluate differences within each sample. Intra-sample variability was quantified using the coefficient of variation (CV), and differences in CV between methods were also assessed with the Wilcoxon signed-rank test. Spearman’s rank correlation coefficient was calculated to examine the monotonic relationship between the two measurement techniques. To assess the magnitude and distribution of differences between methods, the mean absolute error (MAE), mean absolute percentage error (MAPE), and root mean squared error (RMSE) were computed. Lastly, to evaluate potential systematic bias, a Bland–Altman analysis was also conducted. All statistical tests were two-tailed with a significance threshold of α = 0.05.

3. Results and Discussion

3.1. Apparent Density Values

Figure 3 shows the distribution of apparent density values obtained using photogrammetry and the Archimedes method across 15 lump charcoal samples. Apparent density values obtained via photogrammetry and Archimedes’ method exhibited strong concordance, with mean values ranging from 284.2 kg/m3 to 751.6 kg/m3 for photogrammetry and from 267.2 kg/m3 to 765.7 kg/m3 for Archimedes, with overlapping distributions. In detail, most samples exhibit mean apparent densities below 500 kg/m3. These values fall within the range of 350–550 kg/m3 reported in previous studies on commercial charcoal [9], providing a methodological reference that supports the consistency of the results obtained in this work. However, a subset of samples exceeded this range, reaching values above 700 kg/m3. These higher densities may reflect differences in wood species and pyrolysis conditions.
The observed variability in apparent density is largely attributable to intrinsic characteristics of the samples. Apparent density is influenced by several properties of the raw woody biomass used for charcoal production, including the wood species, the anatomical origin of the material (e.g., stem vs. branch, sapwood vs. heartwood), and chemical composition, especially lignin and extractive content, as well as by production conditions that ultimately determine its suitability for different technological uses [4,6,24,25]. Wood’s basic density significantly affects charcoal’s apparent density, as the final product reflects, in part, the density of the starting material [26]. The variability in charcoal apparent density among samples has been widely reported in the literature [5,6,9]. Dufourny et al. [6] attributed this variability to wood heterogeneity, even among fragments derived from different trees of the same species. Such variation is likely present in the lump charcoal samples analyzed here and may contribute to the spread observed with both measurement techniques.
In addition to the properties of the raw material, the carbonization process also affects the final apparent density of charcoal. Pyrolysis temperatures above 600 °C, particularly when combined with short residence times, can increase apparent density due to greater volume shrinkage and lower mass loss associated with the structural reorganization of carbon. Conversely, carbonization at lower temperatures (300–500 °C) typically results in less devolatilization and structural transformation, yielding charcoal with lower apparent densities [3,6].
The mean apparent density measured using the Archimedes method was 472.7 ± 113.5 kg/m3, while photogrammetry produced a slightly higher mean of 480.7 ± 104.8 kg/m3. Several samples, including LC_06, LC_07, LC_13, and LC_14, showed a high degree of overlap between the two methods, both in median and interquartile range, suggesting consistency between the techniques. For instance, sample LC_07 showed a mean apparent density of 464 kg/m3 with a standard deviation of 29 kg/m3 via Archimedes, compared to 471 kg/m3 ± 34 kg/m3 from photogrammetry. In many cases, the interquartile range of apparent density values remained relatively narrow, indicating that both techniques yielded consistent and reproducible results within each sample. This is particularly relevant for quality control or comparative analysis, where repeatability across replicates is essential.
Apparent density patterns remained highly consistent between the two approaches, supporting their agreement across the sample set. However, photogrammetry tended to exhibit greater variability in certain samples, particularly LC_01 and LC_11, where broader distributions were observed. This suggests lower precision or higher sensitivity of the method to surface irregularities and geometric complexity. In contrast, samples with lower apparent density values, such as LC_05 through LC_09, displayed narrower distributions and good concordance between methods, indicating higher reliability of photogrammetry within this apparent density range.

3.2. Statistical Agreement and Method Comparison Between Photogrammetry and Archimedes’ Method

To statistically assess the agreement between methods across samples, a series of comparative tests was conducted, beginning with the Wilcoxon signed-rank analysis. This non-parametric test was applied to each sample to determine whether significant differences existed between charcoal apparent density measurements obtained via photogrammetry and those obtained using the Archimedes method.
Sample LC_06 exhibited a balanced distribution of positive and negative differences, with three lump charcoal fragments yielding higher densities using photogrammetry and three yielding higher densities using the immersion method. The mean ranks for the positive and negative differences were 2.67 and 4.33, respectively, resulting in summed ranks of 8.0 and 13.0. The adjusted p-value was non-significant (p_adj = 0.857). The presence of both positive and negative ranks of similar magnitude indicates that both techniques yielded closely matching apparent density values for this sample, with no systematic directional bias.
This pattern was consistent across most samples. In 12 out of 15 samples, the differences between methods were either non-directional or marginal in magnitude. For instance, sample LC_10 displayed four positive and two negative differences, with summed ranks of 16.0 and 5.0, respectively (p_adj = 0.521). At the same time, LC_14 showed five positive ranks and one negative, yielding a modest difference in total ranks (sum_pos = 18.0, sum_neg = 3.0). These results reflect typical within-sample variability rather than systematic method-driven bias.
In contrast, only three lump charcoal samples (LC_01, LC_05, and LC_09) demonstrated uniform shifts in one direction across all replicates, with all fragments consistently favoring either photogrammetry or Archimedes’ method. The absence of ties in these samples indicates a strong directional effect. The number of replicates per sample (n = 6) was chosen to balance analytical feasibility with statistical reliability. While sufficient to support method-level comparisons across the full dataset (90 fragments), it reduces statistical power for within-sample tests such as the Wilcoxon. For this reason, results at the individual sample level should be regarded as indicative, whereas the overall agreement observed across the complete dataset provides robust evidence of consistency between the two methods.
Overall, the Wilcoxon test results suggest that photogrammetry and Archimedes’ method yield largely convergent apparent density estimates for lump charcoal at the sample level, with only minor, non-systematic discrepancies observed (Table 1). The rank-based structure of the test, coupled with the low number of ties, reinforces the presence of small but consistent numerical differences between methods that are not sufficient to indicate methodological bias.
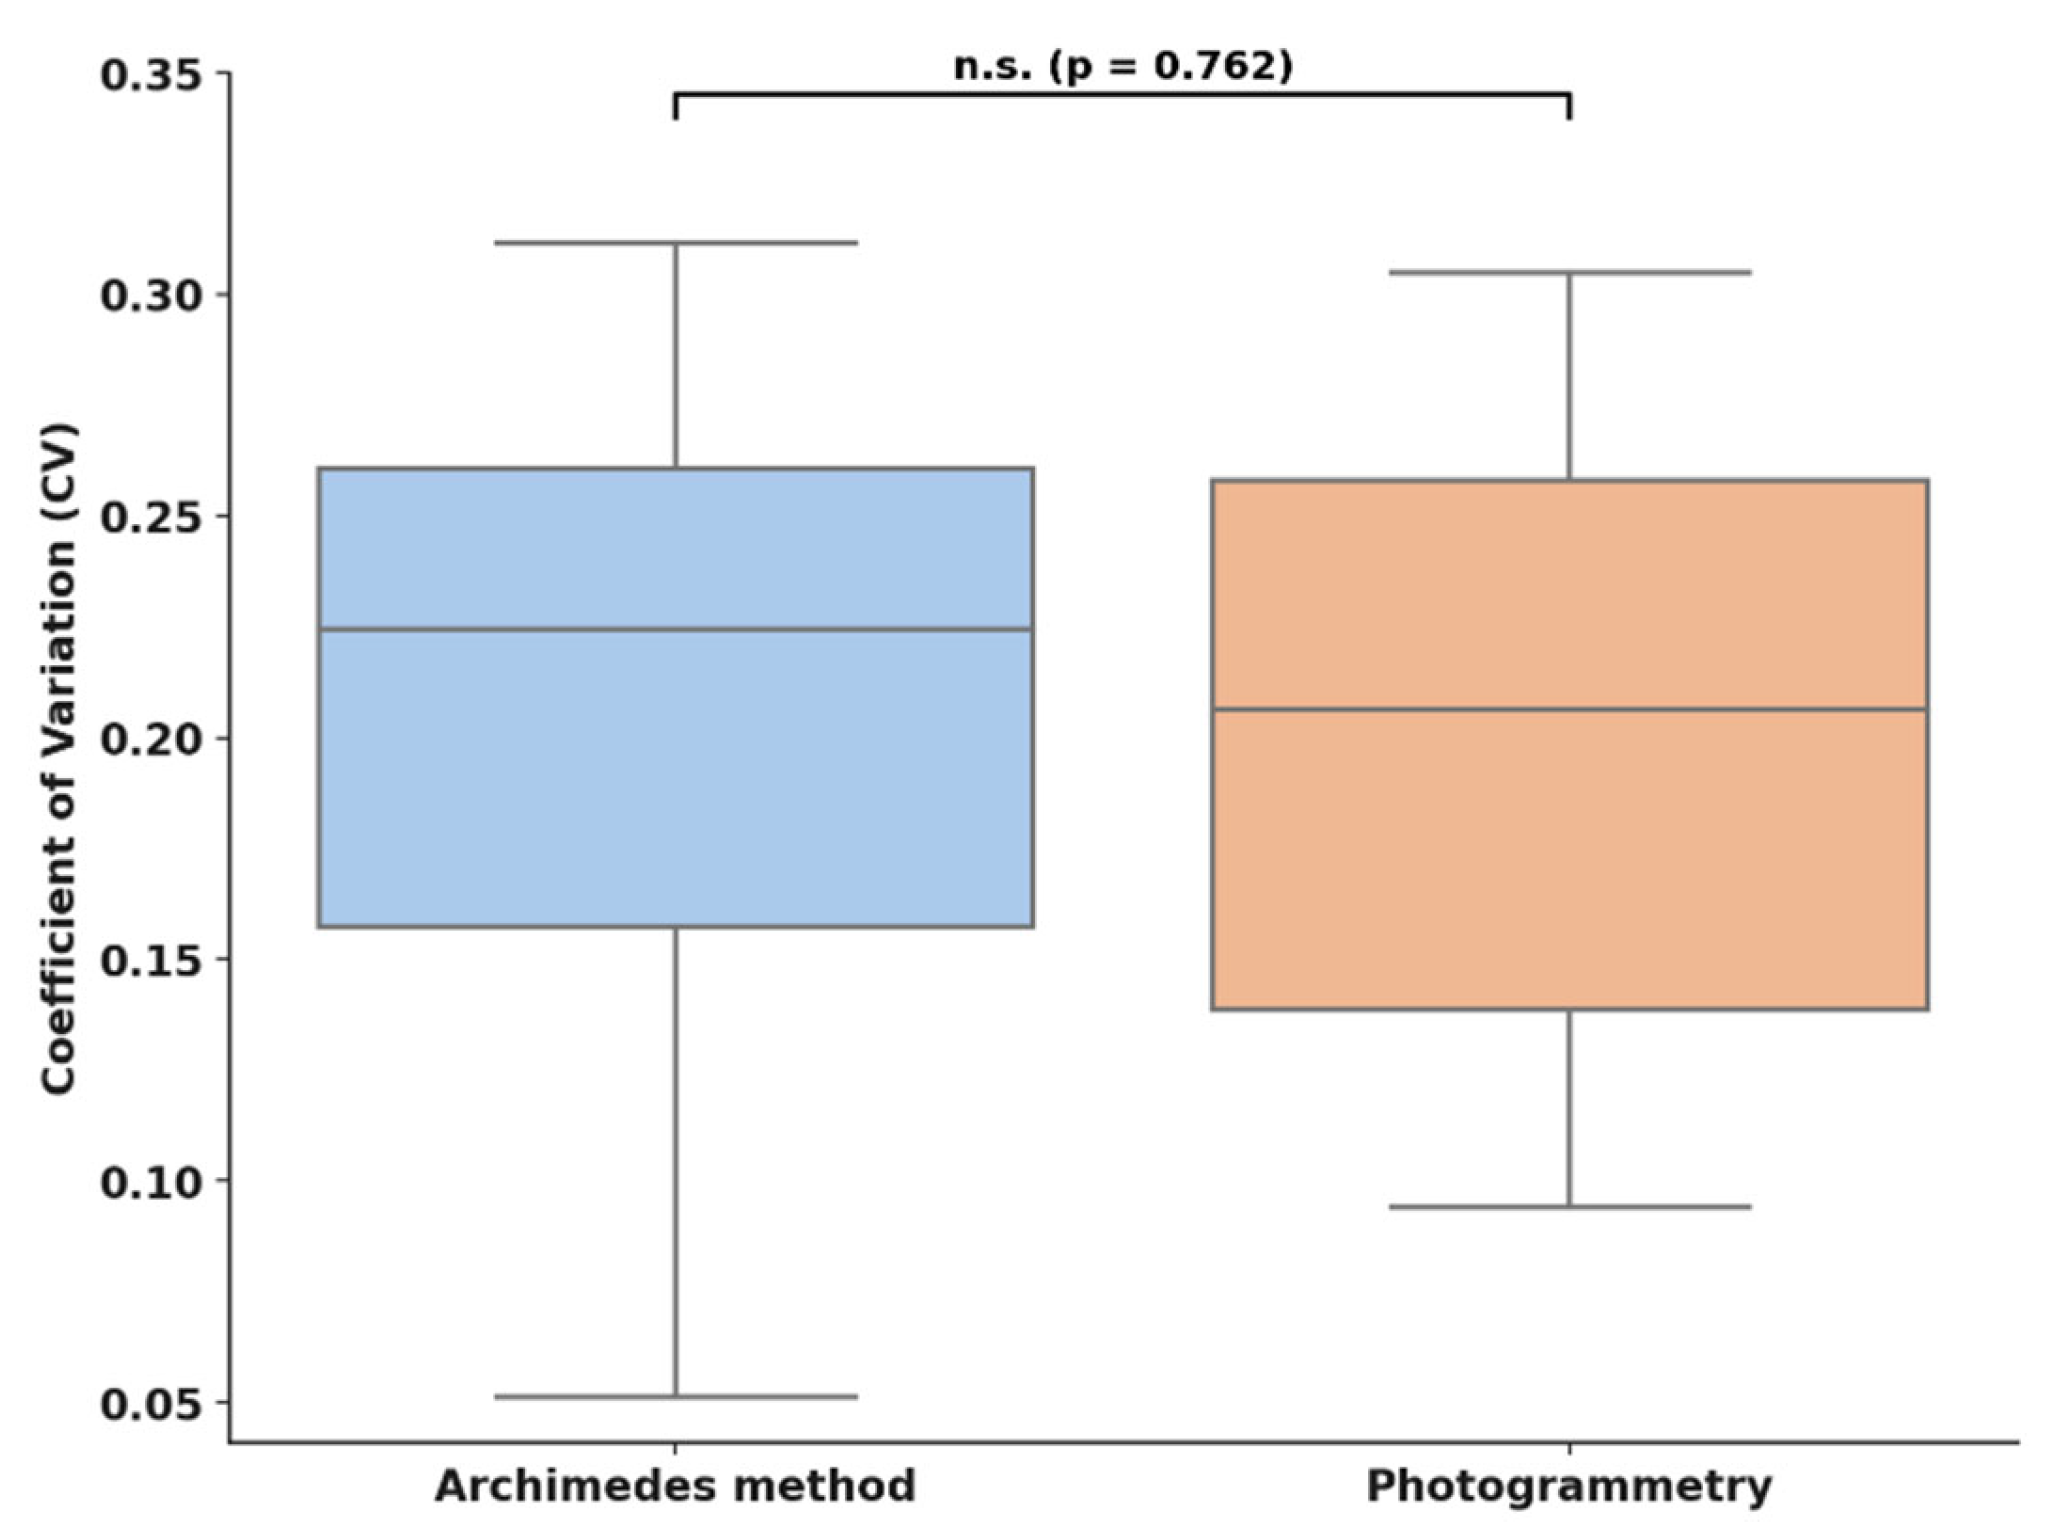
While the Wilcoxon test captures directional differences in median values, intra-sample consistency was further examined through the coefficient of variation (CV). This metric was calculated for each sample based on replicate measurements to assess the relative precision of the two methods. Figure 4 shows the distribution of CV values for each method, highlighting their comparable intra-sample variability and the absence of statistically significant differences based on the Wilcoxon signed-rank test (p = 0.762). These results indicate that the dispersion of values around the mean was comparable between photogrammetry and the Archimedes method.
While photogrammetry relies on image processing and surface reconstruction, potentially sensitive to light conditions, texture contrast, material shape, or manual landmarking [21], its intra-sample variability did not differ from that of the Archimedes approach, which can be affected by fluid adherence, bubble formation, or sample irregularities [14]. The lack of increased dispersion in either method supports the conclusion that both approaches demonstrate comparable precision and repeatability under the conditions tested.
This similarity in measurement variability suggests that neither method introduces greater dispersion across replicates, despite their differing operational principles. The comparable CV distributions indicate that sources of potential technical variability, such as optical reconstruction in photogrammetry or fluid interaction in immersion, did not systematically affect measurement consistency. This reinforces the notion that both methods perform similarly in terms of internal precision under controlled experimental conditions.
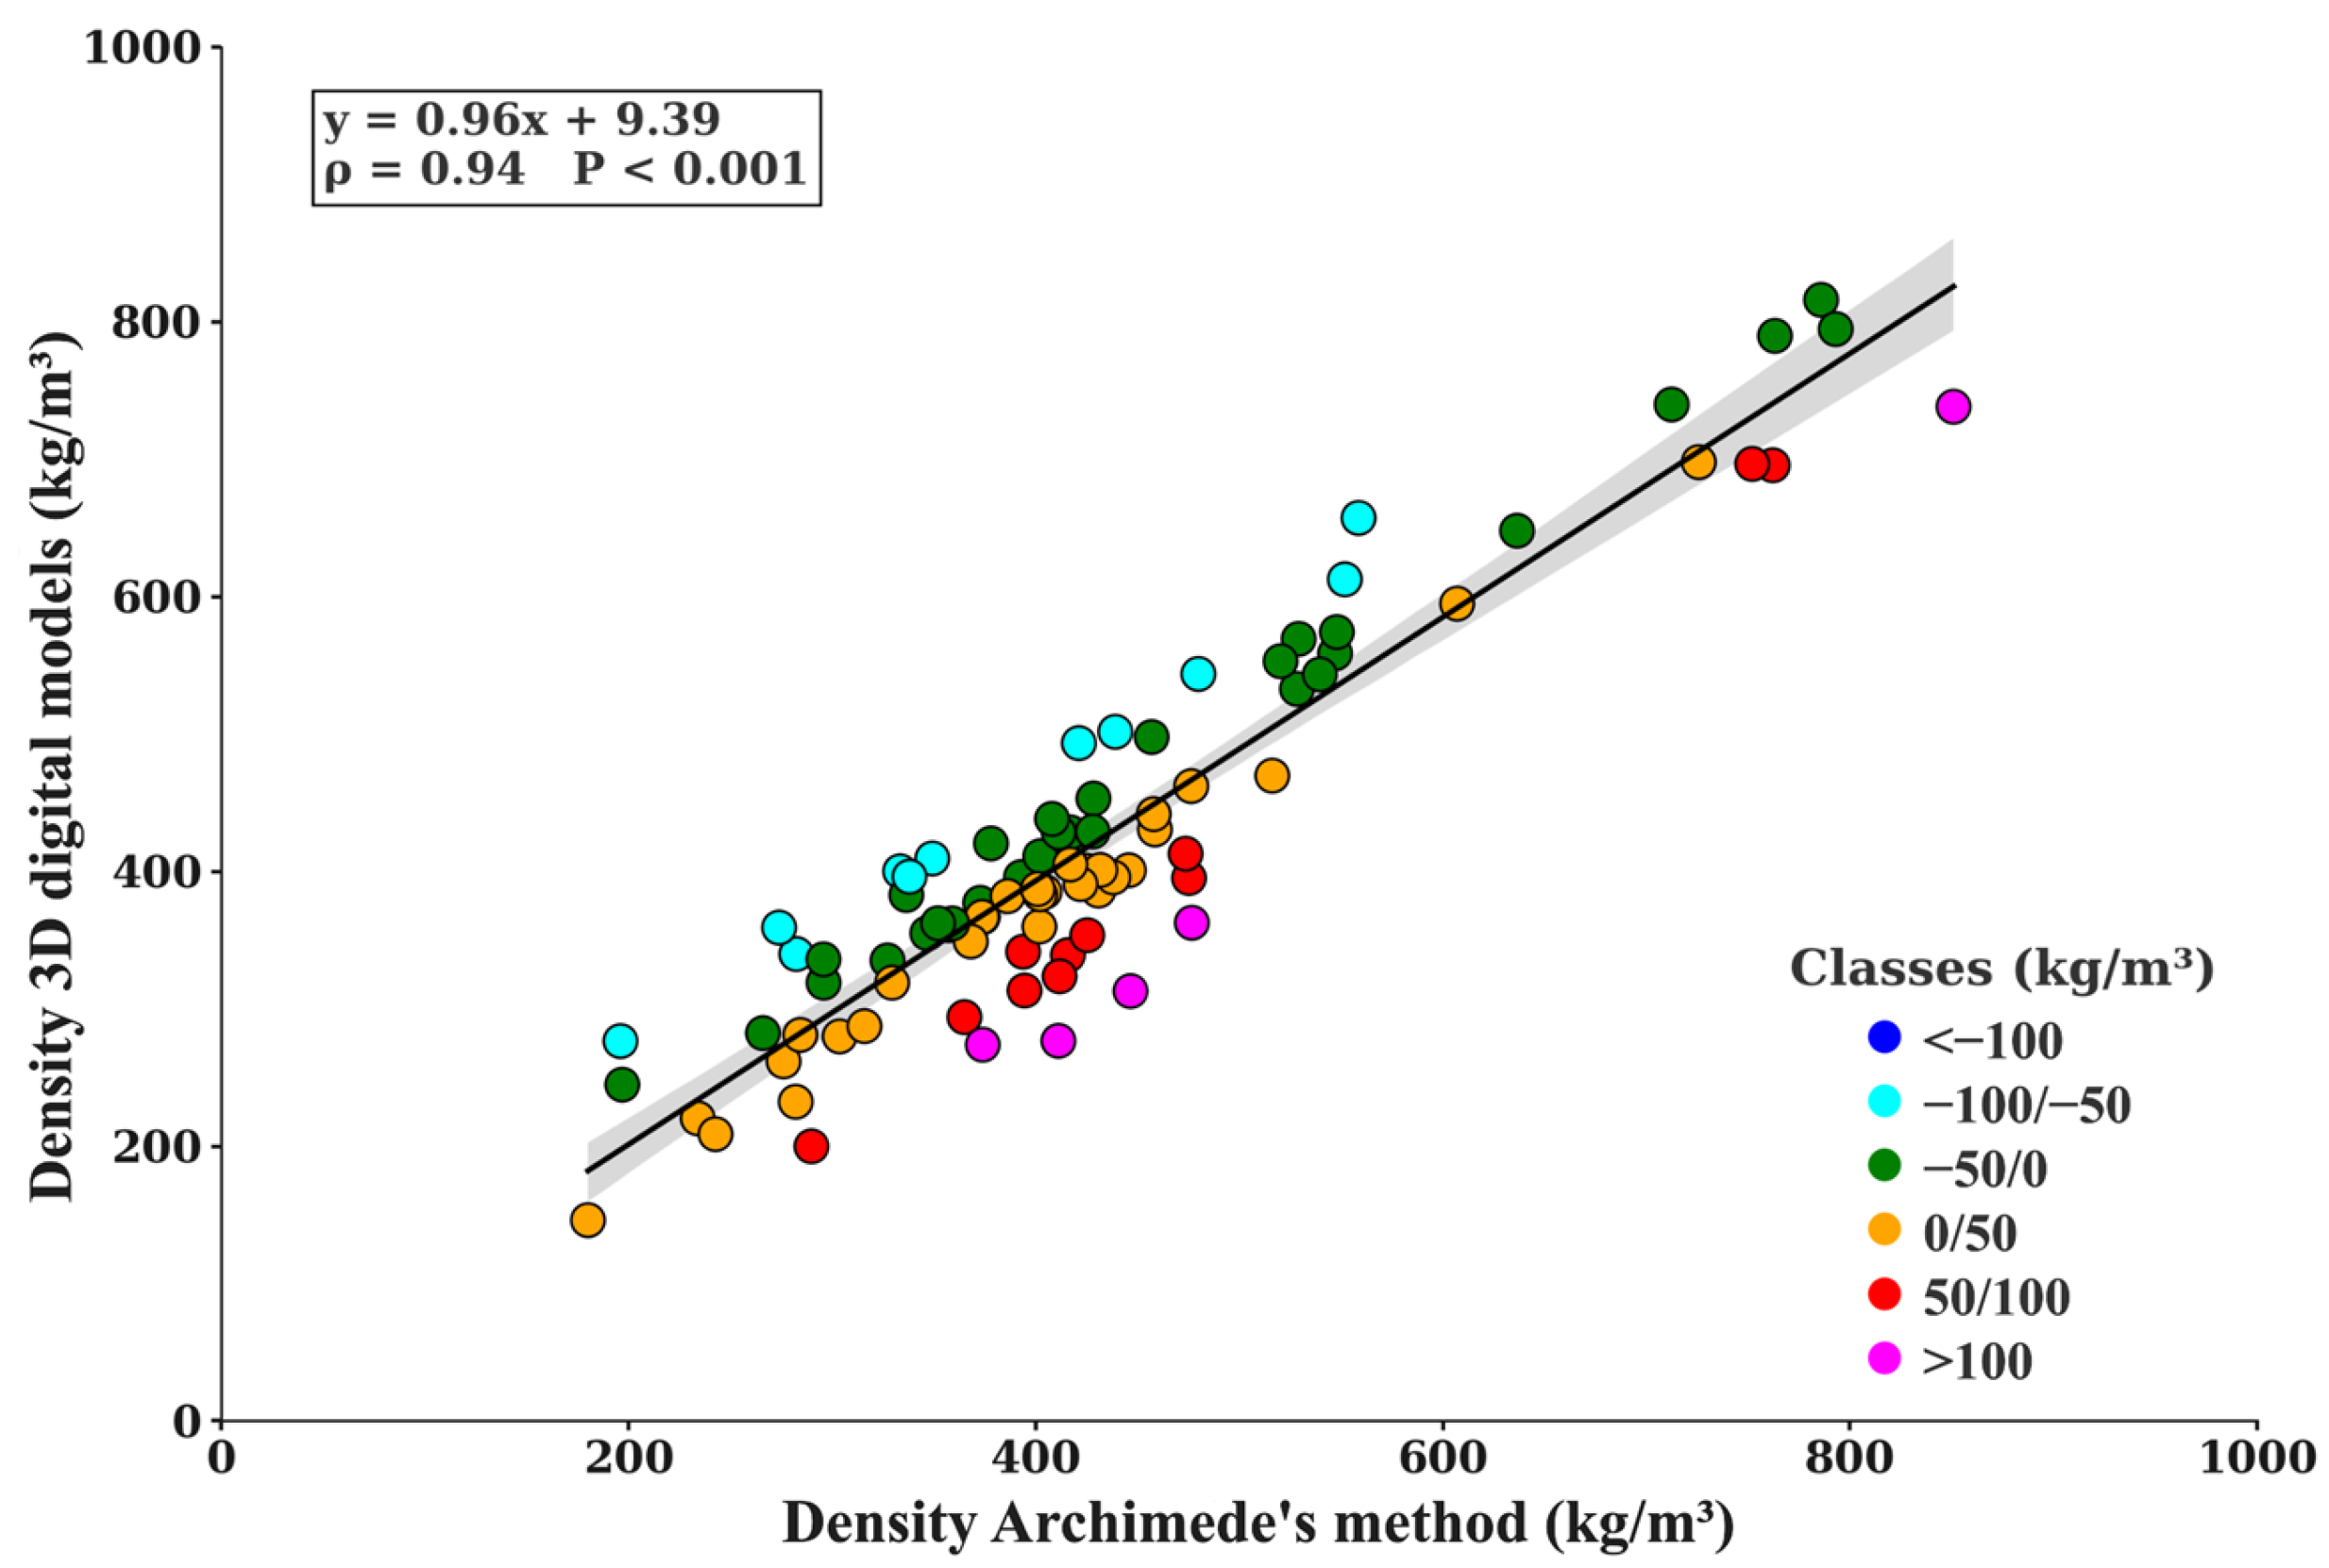
To further examine the relationship between the two methods, individual apparent density measurements were compared through correlation analysis, frequency distributions of absolute and relative differences, and class-based interpretation. A strong Spearman correlation (ρ = 0.94, p < 0.001) confirmed high consistency between photogrammetry and Archimedes’ method across all samples (Figure 5). Linear regression (y = 0.96x + 9.39) closely matched the identity line, with minimal deviation in slope and intercept, suggesting only a slight systematic divergence.
The absolute differences were symmetrically distributed around zero (44 negative, 46 positive) (Figure 6A). The most frequent class was −50 to 0 kg/m3 (33 observations), followed by 0 to +50 kg/m3 (30 observations). Together, these classes accounted for 63 of the 90 observations, indicating that most differences were moderate. The −50/−100 kg/m3 and +50/+100 kg/m3 classes contained 11 observations each, and only 5 cases exceeded +100 kg/m3, confirming that large discrepancies remained rare. Relative differences mirrored this behavior: approximately 68% of observations fell within ±10% of the Archimedes values. The −5% to 0% and 0% to +5% classes were the most populated, and extreme deviations beyond ±30% were uncommon (Figure 6B).
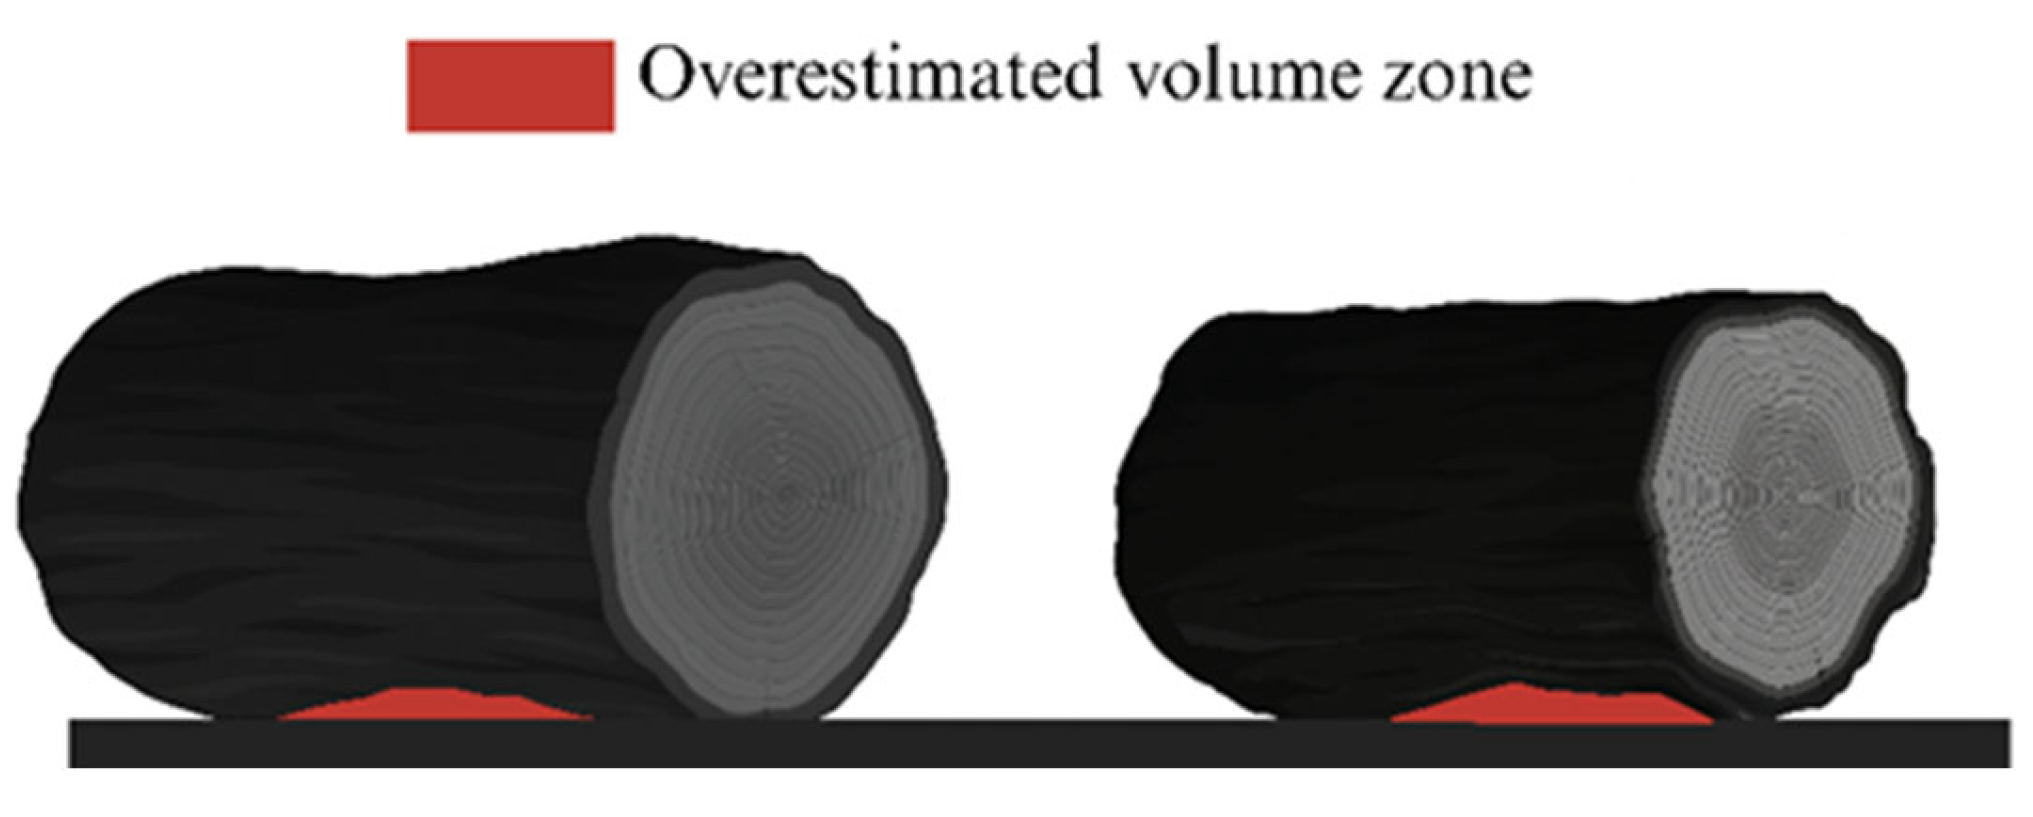
Notably, in the lower apparent density range (<500 kg/m3), 41 observations showed higher apparent density values with Archimedes compared to 30 with photogrammetry, further suggesting a modest tendency for photogrammetric overestimation in light, geometrically complex samples. One plausible explanation lies in the irregular geometry of the charcoal fragments and the viewing angle of image acquisition. When the base of a fragment rests unevenly on the plate, the underside may not be fully captured, causing the photogrammetry software to interpolate a closed surface where none exists (Figure 7). This artefactual closure causes an overestimation of volume and, consequently, an underestimation of apparent density. Such inaccuracies reflect a known limitation of photogrammetry when modeling geometrically complex objects, particularly those with undercuts or shadowed surfaces. They should be considered when working with highly porous or irregular samples [14]. Based on the distribution of differences (Figure 6), only a small proportion of fragments (5 out of 90, <6%) showed deviations greater than ±100 kg/m3 compared to Archimedes’ values, which can be reasonably attributed to occlusion artefacts similar to those illustrated in Figure 7. While limited in frequency, these cases highlight the importance of the acquisition strategy. Mitigation options include multi-angle imaging (capturing both upper and lower views), merging complementary reconstructions, or suspending fragments to reduce shadowed regions. Future developments may also rely on AI-based surface completion to minimize errors in highly irregular geometries.
To further quantify the accuracy of the photogrammetric approach, absolute and relative error metrics were calculated. The mean absolute error (MAE) between photogrammetry and the Archimedes method was 38.82 kg/m3. In contrast, the mean absolute percentage error (MAPE) was 9.88%, indicating that, on average, photogrammetric estimates deviated less than 10% from Archimedean values. The root mean squared error (RMSE), which is more sensitive to large deviations, was 50.24 kg/m3, reflecting low overall dispersion and a limited influence from outliers.
To further support the equivalence between methods and explore the scale of individual discrepancies, a Bland–Altman plot was implemented (Figure 8). The average difference (bias) was −8.03 kg/m3, indicating that photogrammetry tends to yield slightly higher apparent density values. However, the magnitude of this bias is modest relative to the full measurement range.
The 95% limits of agreement (−67.20 to +51.15 kg/m3) encompassed nearly all observations, with only one point falling outside the interval. Most data clustered around the mean bias, with a large portion falling within ±0.5 SD, confirming a narrow and symmetric distribution of differences between the two methods.
No systematic pattern of increasing or decreasing error was observed across the apparent density range, although, as noted earlier, slightly more pronounced deviations occurred in low-density samples. These are consistent with the previously discussed volumetric overestimations by photogrammetry in irregular geometries.
Overall, the Bland–Altman analysis reinforces the consistency between methods already evidenced by correlation and rank-based tests, highlighting that discrepancies remain small, balanced, and well within acceptable analytical bounds.

3.3. Operational and Economic Comparison of Archimedes’ Method and Photogrammetry

3.3.1. Operational and Technical Comparison

From an operational standpoint, Archimedes’ method is both faster and more economical than photogrammetry. The water displacement approach requires minimal preparation: the operator submerges the sample in a graduated cylinder and records the displaced water. The required equipment is basic, and the procedure is rapid, making it suitable for routine or high-throughput applications. In this study, all Archimedes measurements were performed by a single trained operator to ensure consistency and minimize handling variability. Inter-operator variability was not assessed here but could be addressed in future work, as immersion-based protocols are known to be sensitive to practices such as bubble removal and sample positioning [14].
Photogrammetry, by contrast, is more time-consuming and resource-intensive. The sample setup involves careful placement on a turntable or fixed platform, insertion of visual markers for scale and alignment, and consistent diffuse lighting, typically achieved using a light box. A high-resolution camera is essential to capture the multiple images required for accurate 3D reconstruction.
Compared to Archimedes’ method, the quality of reconstruction in photogrammetry depends on several factors. These include (1) camera resolution, (2) the geometry and surface texture of the sample, (3) the image acquisition strategy (angles and distances), and (4) the performance of the processing software [21]. Among these, image quality is the most critical factor, as it directly affects the apparent density and accuracy of the point cloud. High-resolution cameras generate more detailed and reliable models [21,22], while poor image quality may introduce noise, blur, or insufficient detail, leading to incomplete reconstructions. However, excessively high pixel counts can be counterproductive, increasing file size and processing time without significant improvements in model accuracy [14].
The most time-consuming phase is image processing using software such as Agisoft Metashape®, as employed in this study. Processing time depends on the number of photos and computer specifications (CPU, RAM, GPU). In this study, a high number of photos were used (>500). However, prior studies in the literature have used fewer photos, fewer than 100, with good results as well [14,21,22]. Reducing the number of pictures can increase processing speed. Moreover, although not requiring continuous supervision, manual intervention is often needed to clean and refine the point cloud, particularly with porous or irregular samples.
In this study, only samples with at least one flat surface were selected to ensure stable positioning during image acquisition. This constraint excluded highly irregular or rounded fragments but was justified by both geometric and operational considerations. While alternative strategies, such as suspending the sample or capturing and merging images from opposite sides [21,22], could allow full 360° reconstruction, they would require handling and processing each fragment individually. This would significantly increase setup complexity, acquisition time, and reduce overall throughput, limiting the method’s applicability in studies involving large sample sets.

3.3.2. Economic Evaluation and Applicability

Photogrammetry also entails significantly higher costs. Beyond labor, it requires capital investment in a high-resolution camera, lighting system, turntable platform, a capable workstation, and licensed photogrammetry software. These costs, together with longer processing times, may limit its suitability for routine or large-scale measurements.
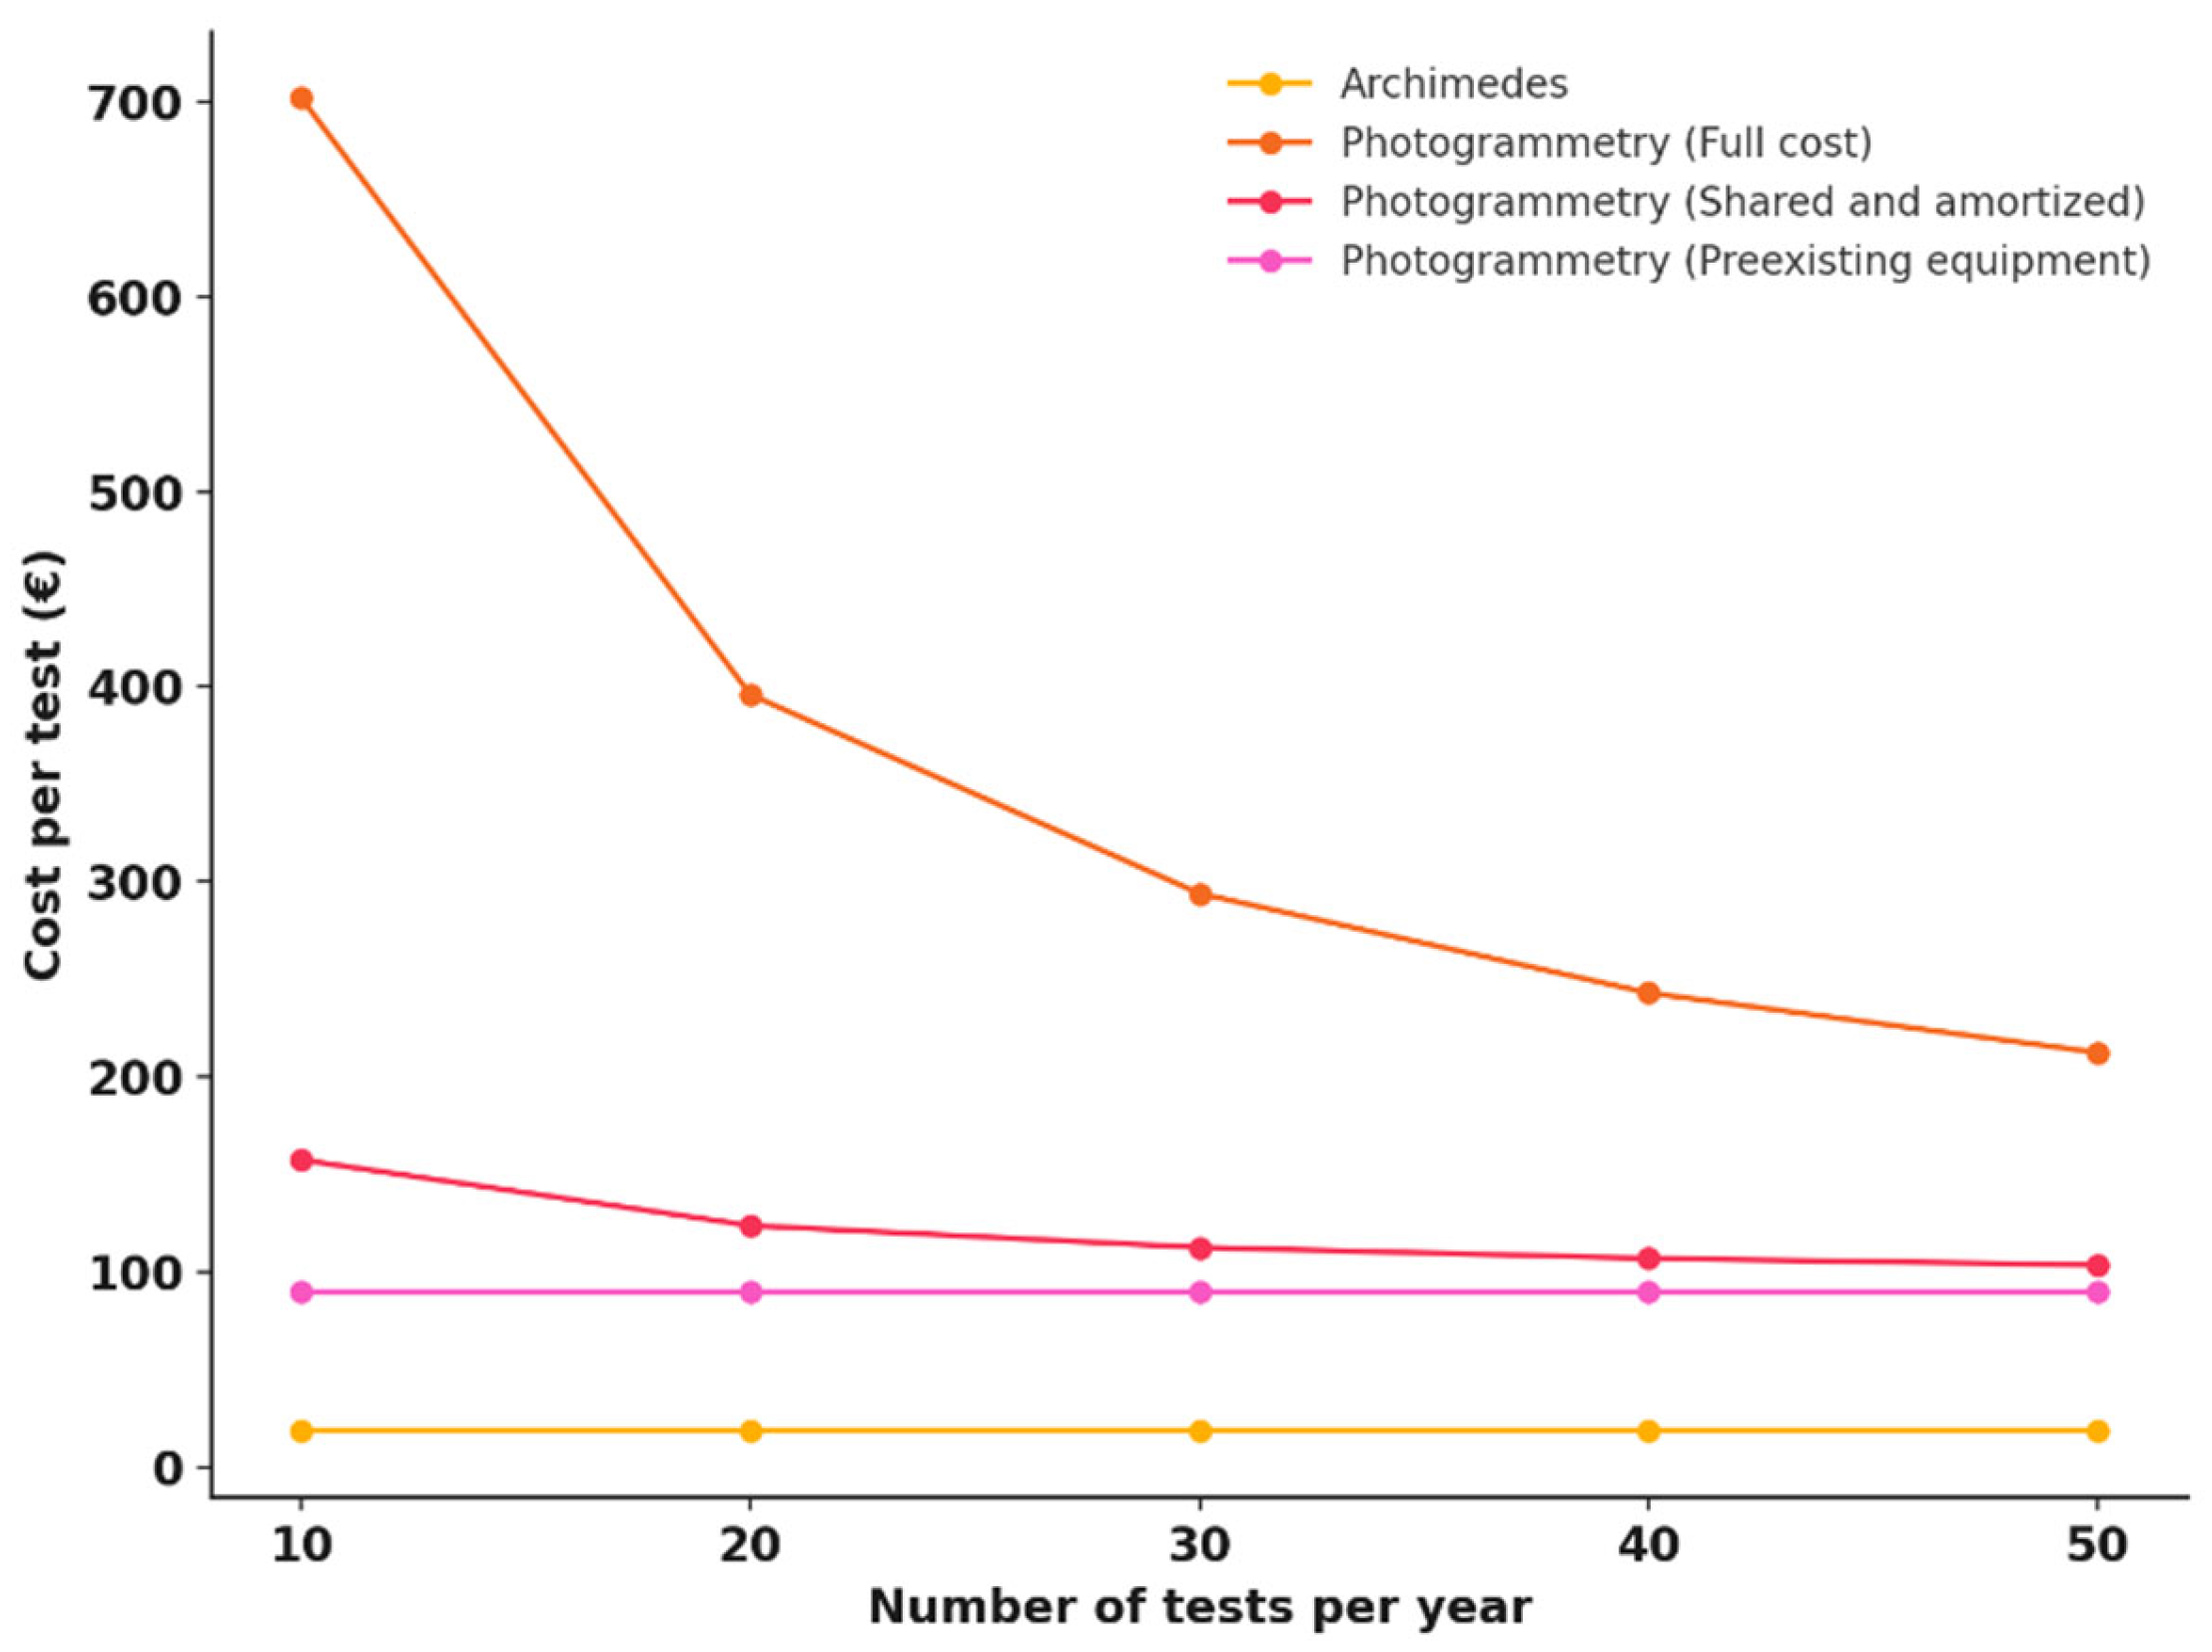
To better quantify the cost–performance trade-off, a cost comparison was performed considering four operational scenarios: (1) Archimedes’ method, (2) photogrammetry with full cost allocation (equipment and software purchased exclusively for the test), (3) photogrammetry with amortized costs shared across three years and multiple projects (33% use), and (4) photogrammetry assuming all equipment were already available (preexisting use) (Figure 9).
Archimedes’ method required only a graduated cylinder (EUR 20) and 1 h of operator time (EUR 18), for a total of EUR 18.4 per test. Photogrammetry, by contrast, entailed higher investments including a professional software license (EUR 3500), a workstation (EUR 1500), a lightbox (EUR 70), and a rotating platform (EUR 50), in addition to 5 h of operator time (EUR 90). Depending on the scenario, the resulting cost per test was EUR 212.4 when all equipment was newly purchased, EUR 103.5 when amortized across multiple projects (33% allocation), and EUR 90 when using preexisting equipment.
These findings highlight that although photogrammetry is initially more expensive and complex, its cost-effectiveness increases significantly with higher sample throughput or shared infrastructure. Once established, the setup can be reused for different applications. The method provides a scalable workflow, where initial manual inputs can lead to progressively automated image acquisition and processing. In this regard, the automatization of both phases could substantially improve scalability: motorized turntables with automated camera triggering and AI-based segmentation (e.g., Mask R-CNN architectures) can reduce manual handling and post-processing. Such integration has the potential to lower labor time significantly, shifting the main costs from personnel to initial setup and improving cost-effectiveness in large-scale applications. A key advantage is the generation of reusable 3D models that can be archived digitally for future analysis. This preliminary cost analysis aims to guide methodological decisions and support future optimization. Despite its limitations, the method’s statistical agreement, variability, and practicality endorse photogrammetry as a reliable alternative to displacement-based methods, particularly in preserving sample integrity or digital archiving in fields like archaeology and ecological studies.

4. Conclusions

A preliminary version of this work was presented at the AIIA conference “Biosystems Engineering for the Green Transition” 2025; this article offers an extended discussion and additional data [27]. This study demonstrates that photogrammetry is a valid, non-destructive alternative to the Archimedes method for determining the apparent density of lump charcoal. Across 90 fragments from 15 commercial samples, the two methods produced highly consistent results, with no significant differences and a strong correlation (ρ = 0.94). Error metrics confirmed the robustness of photogrammetry, with a mean absolute error of 38.8 kg/m3, a mean absolute percentage error of 9.9%, and a root mean square error (RMSE) of 50.2 kg/m3.
While photogrammetry requires more time and technical setup, it offers key advantages: the ability to preserve sample integrity, generate high-resolution 3D models, and support future digital re-analysis. These features are particularly valuable in research and quality control contexts where destructive testing is undesirable or where archiving physical properties is important.
Known limitations, such as occlusions or undersampled geometries, can lead to volume overestimation in some cases but can be mitigated through improved acquisition strategies. Building on this, future research should explore concrete solutions, such as (1) deep learning frameworks for automated surface completion in occluded regions, (2) integrated acquisition systems combining motorized platforms with automated imaging to reduce manual handling, and (3) extending validation to other irregular biofuels to test the method’s generalizability.
The findings of this study support the adoption of photogrammetry as a practical and accurate alternative to Archimedes’ method, particularly in workflows requiring non-invasive measurement, digital preservation, or the analysis of irregular materials, supporting practical progress toward SDG7 by improving efficiency and lowering operational costs.

Supplementary Materials

The following supporting information can be downloaded at https://www.mdpi.com/article/10.3390/su17177991/s1: Table S1: Summary of fixed and variable costs for Archimedes’ method and three photogrammetry scenarios. Total costs are calculated per test, assuming 50 samples per year.

Author Contributions

Conceptualization, A.M. and S.G.; methodology, A.M., M.M., R.G., and S.G.; software, A.M., M.M., S.I., and S.G.; validation, A.M. and M.M.; formal analysis, A.M. and S.I.; investigation, A.M. and S.I.; resources, S.G.; data curation, A.M., M.M., and S.I.; writing—original draft preparation, A.M.; writing—review and editing, M.M., R.G., and S.G.; visualization, A.M., M.M., R.G., and S.G.; supervision, S.G.; project administration, S.G.; funding acquisition, S.G. All authors have read and agreed to the published version of the manuscript.

Funding

This study was carried out within the Agritech National Research Center and received funding from the European Union Next-GenerationEU (PIANO NAZIONALE DI RIPRESA E RESILIENZA(PNRR)—MISSIONE 4 COMPONENTE 2, INVESTIMENTO 1.4—D.D.1032 17/06/2022, CN00000022).

Institutional Review Board Statement

Not applicable.

Informed Consent Statement

Not applicable.

Data Availability Statement

The original data presented in the study are openly available in Research Data Unipd at https://researchdata.cab.unipd.it/1606/, accessed on 10 August 2025.

Conflicts of Interest

The authors declare no conflicts of interest.

Abbreviations

The following abbreviations are used in this manuscript:
SfMStructure from motion
mvsMulti-view-stereo
SDGSustainable development goal
DEMDigital elevation model
CVCoefficient of variation
MAEMean absolute error
MAPEMean absolute percentage error
RMSERoot mean squared error

References

  1. Seboka, Y. Charcoal Production: Opportunities and Barriers for Improving Efficiency and Sustainability. In Bio-Carbon Opportunities in Eastern & Southern Africa. Harnessing Carbon Finance to Promote Sustainable Forestry, Agro-Forestry and Bio-Energy; United Nations Development Programme: New York, NY, USA, 2009; pp. 102–126. [Google Scholar]
  2. Pyshyev, S.; Miroshnichenko, D.; Malik, I.; Contreras, A.B.; Hassan, N.; ElRasoul, A.A. State of the Art in the Production of Charcoal: A Review. Chem. Chem. Technol. 2021, 15, 61–73. [Google Scholar] [CrossRef]
  3. Pereira, A.K.S.; Júnior, D.L.; da Silva, Á.M.; Cupertino, G.F.M.; de Souza, E.C.; Delatorre, F.M.; Ucella-Filho, J.G.M.; de Oliveira, P.R.S.; Rodrigues, B.P.; Júnior, A.F.D. How Pyrolysis Conditions Shape the Structural and Functional Properties of Charcoal? A Study of Tropical Dry Forest Biomass. Renew. Energy 2025, 243, 122575. [Google Scholar] [CrossRef]
  4. Assis, M.R.; Brancheriau, L.; Napoli, A.; Trugilho, P.F. Factors Affecting the Mechanics of Carbonized Wood: Literature Review. Wood Sci. Technol. 2016, 50, 519–536. [Google Scholar] [CrossRef]
  5. Mencarelli, A.; Greco, R.; Grigolato, S. Can the Qualitative Characteristics of Commercial Charcoal-Based Products Affect Combustion Performance during Grilling? Biomass Convers. Biorefin. 2025. [Google Scholar] [CrossRef]
  6. Dufourny, A.; Van De Steene, L.; Humbert, G.; Guibal, D.; Martin, L.; Blin, J. Influence of Pyrolysis Conditions and the Nature of the Wood on the Quality of Charcoal as a Reducing Agent. J. Anal. Appl. Pyrolysis 2019, 137, 1–13. [Google Scholar] [CrossRef]
  7. Capareda, S.C. Comprehensive Biomass Characterization in Preparation for Conversion. In Sustainable Biochar for Water and Wastewater Treatment; Elsevier: Amsterdam, The Netherlands, 2022; pp. 1–37. ISBN 978-0-12-822225-6. [Google Scholar]
  8. Júnior, A.F.D.; Andrade, C.R.; Milan, M.; Brito, J.O.; de Andrade, A.M.; de Souza, N.D. Quality Function Deployment (QFD) Reveals Appropriate Quality of Charcoal Used in Barbecues. Sci. Agric. 2020, 77, e20190021. [Google Scholar] [CrossRef]
  9. Júnior, A.F.D.; Andrade, C.R.; Lana, A.Q.; da Silva, Á.M.; Brito, J.O.; Milan, M. Tips on the Variability of BBQ Charcoal Characteristics to Assist Consumers in Product Choice. Eur. J. Wood Wood Prod. 2021, 79, 1017–1026. [Google Scholar] [CrossRef]
  10. Demirbas, A.; Ahmad, W.; Alamoudi, R.; Sheikh, M. Sustainable Charcoal Production from Biomass. Energy Sources Part A Recovery Util. Environ. Eff. 2016, 38, 1882–1889. [Google Scholar] [CrossRef]
  11. EN 1860-2:2023; Appliances, Solid Fuels and Firelighters for Barbecuing—Part 2: Barbecue Charcoal and Barbecue Charcoal Briquettes—Requirements and Test Methods. British Standards Institution: London, UK, 2023.
  12. ISO 17225-1:2021; Solid Biofuels—Fuel Specifications and Classes—Part 1: General Requirements. International Organization for Standardization: Geneva, Switzerland, 2021.
  13. ASTM D2395-17R22; Standard Test Methods for Density and Specific Gravity (Relative Density) of Wood and Wood-Based Materials. ASTM International: West Conshohocken, PA, USA, 2022. [CrossRef]
  14. Brzeziński, K.; Duda, A.; Styk, A.; Kowaluk, T. Photogrammetry-Based Volume Measurement Framework for the Particle Density Estimation of LECA. Materials 2022, 15, 5388. [Google Scholar] [CrossRef] [PubMed]
  15. Dos Santos, V.B.; Baraúna, E.E.P.; Colen, F.; Baldin, T.; Monteiro, T.C.; Arantes, M.D.C. Energy Characterization of Wood and Charcoal from Savannah Forest Species. BioResources 2023, 18, 1780–1787. [Google Scholar] [CrossRef]
  16. Pierdicca, R.; Balestra, M.; Micheletti, G.; Felicetti, A.; Toscano, G. Semi-Automatic Detection and Segmentation of Wooden Pellet Size Exploiting a Deep Learning Approach. Renew. Energy 2022, 197, 406–416. [Google Scholar] [CrossRef]
  17. Toscano, G.; Leoni, E.; De Francesco, C.; Ciccone, G.; Gasperini, T. The Application of Image Acquisition and Processing Techniques for the Determination of Wooden Pellet Length as an Alternative to ISO 17829. Resources 2023, 12, 125. [Google Scholar] [CrossRef]
  18. Igathinathane, C.; Davis, J.D.; Purswell, J.L.; Columbus, E.P. Application of 3D Scanned Imaging Methodology for Volume, Surface Area, and Envelope Density Evaluation of Densified Biomass. Bioresour. Technol. 2010, 101, 4220–4227. [Google Scholar] [CrossRef] [PubMed]
  19. Altgen, M.; Gedde, K.B.; Ross, L.; Larnøy, E. Physical and Chemical Characterization of Post-Consumer Wood Chips for Recycling. Waste Manag. 2025, 200, 114762. [Google Scholar] [CrossRef] [PubMed]
  20. Whiting, M.; Salley, S.W.; James, D.K.; Karl, J.W.; Brungard, C.W. Rapid Bulk Density Measurement Using Mobile Device Photogrammetry. Soil Sci. Soc. Am. J. 2020, 84, 811–817. [Google Scholar] [CrossRef]
  21. Fang, K.; Zhang, J.; Tang, H.; Hu, X.; Yuan, H.; Wang, X.; An, P.; Ding, B. A Quick and Low-Cost Smartphone Photogrammetry Method for Obtaining 3D Particle Size and Shape. Eng. Geol. 2023, 322, 107170. [Google Scholar] [CrossRef]
  22. Paixão, A.; Resende, R.; Fortunato, E. Photogrammetry for Digital Reconstruction of Railway Ballast Particles—A Cost-Efficient Method. Constr. Build. Mater. 2018, 191, 963–976. [Google Scholar] [CrossRef]
  23. ISO 18134-2:2024; Solid Biofuels—Determination of Moisture Content—Part 2: Simplified Method. International Organization for Standardization: Geneva, Switzerland, 2024.
  24. Dias Júnior, A.F.; Esteves, R.P.; da Silva, Á.M.; Júnior, A.D.S.; Oliveira, M.P.; Brito, J.O.; Napoli, A.; Braga, B.M. Investigating the Pyrolysis Temperature to Define the Use of Charcoal. Eur. J. Wood Wood Prod. 2020, 78, 193–204. [Google Scholar] [CrossRef]
  25. Miroshnichenko, D.; Zhylina, M.; Shmeltser, K. Modern Use of Biochar in Various Technologies and Industries. A Review. Chem. Chem. Technol. 2024, 18, 232–243. [Google Scholar] [CrossRef]
  26. Antal, M.J.; Grønli, M. The Art, Science, and Technology of Charcoal Production. Ind. Eng. Chem. Res. 2003, 42, 1619–1640. [Google Scholar] [CrossRef]
  27. Mencarelli, A.; Greco, R.; Ippoliti, S.; Grigolato, S. Comparative assessment of lump charcoal density using photogrammetry as an alternative to Archimedes method according to ASTM D2395-17 standard. In Proceedings of the AIIA 2025 “Biosystems Engineering for the Green Transition”, Reggio Calabria, Italy, 21–24 September 2025. [Google Scholar]
Figure 1. Schematic overview of the experimental workflow.
Sustainability 17 07991 g001
Figure 2. Stages of 3D reconstruction of charcoal samples using Metashape: (A) sparse point cloud generated from photo alignment; (B) Digital Elevation Model (DEM) showing surface elevation of the samples and base; and (C) final textured 3D mesh model, including markers and control object.
Sustainability 17 07991 g002
Figure 3. Apparent density (kg/m3) of 15 lump charcoal samples measured by Archimedes’ principle (blue) and photogrammetry (orange). Boxes show interquartile ranges with medians; whiskers indicate full data range.
Sustainability 17 07991 g003
Figure 4. Coefficient of variation (CV) of apparent density measurements obtained using photogrammetry and the Archimedes method (n = 15), compared using the Wilcoxon signed-rank test. n.s. indicates not statistically significant (p > 0.05).
Sustainability 17 07991 g004
Figure 5. Spearman correlation between apparent density values obtained using the Archimedes method and photogrammetry, with points colored by absolute difference class (kg/m3).
Sustainability 17 07991 g005
Figure 6. Frequency distribution (A) of absolute differences in apparent density between the Archimedes and photogrammetry methods in six classes (kg/m3) and relative differences (B) as percentage deviation from Archimedes’ values.
Sustainability 17 07991 g006
Figure 7. Overestimated volume zone in lump charcoal samples.
Sustainability 17 07991 g007
Figure 8. Bland–Altman plot showing the agreement between apparent density values from photogrammetry and the Archimedes method. Red dots represent individual charcoal samples. The y-axis represents the difference (Archimedes−photogrammetry) against the mean of both methods. The black line indicates mean bias, while the dashed lines show the 95% limits of agreement (+51.15 and −67.20 kg/m3). The shaded area denotes the ±0.5 standard deviation zone around the mean bias.
Sustainability 17 07991 g008
Figure 9. Estimated cost per test (EUR ) as a function of the number of samples analyzed annually, comparing Archimedes’ method with three photogrammetry scenarios: (1) full cost allocation of dedicated equipment and software, (2) shared and amortized use over three years (33% allocation), and (3) preexisting use of all required equipment.
Sustainability 17 07991 g009
Table 1. Summary of the Wilcoxon signed rank test results.
Sample ComparisonNegative RanksPositive Ranks Test Statistics
nMean RankSum of RanksnMean RankSum of RanksTiesZpp-adj
LC_0100.00.063.521.00−2.3060.0210.106 n.s.
LC_0233.310.033.711.00−0.2100.8340.834 n.s.
LC_0334.012.033.09.00−0.4190.6750.834 n.s.
LC_0425.010.042.7511.00−0.2100.8340.834 n.s.
LC_0563.521.000.00.00−2.3060.0210.106 n.s.
LC_0634.714.032.37.00−0.8390.4020.670 n.s.
LC_0735.015.032.06.00−1.0480.2950.552 n.s.
LC_0842.510.025.511.00−0.2100.8340.834 n.s.
LC_0963.521.000.00.00−2.3060.0210.106 n.s.
LC_1022.55.044.016.00−1.2380.2080.521 n.s.
LC_1123.06.043.7515.00−1.0480.2950.552 n.s.
LC_1242.7511.025.010.00−0.2100.8340.834 n.s.
LC_1333.711.033.310.00−0.2100.8340.834 n.s.
LC_1413.03.053.618.00−1.6770.0930.351 n.s.
LC_1544.016.022.55.00−1.2580.2080.521 n.s.
n.s. indicates not statistically significant (p > 0.05).
Disclaimer/Publisher’s Note: The statements, opinions and data contained in all publications are solely those of the individual author(s) and contributor(s) and not of MDPI and/or the editor(s). MDPI and/or the editor(s) disclaim responsibility for any injury to people or property resulting from any ideas, methods, instructions or products referred to in the content.