Article

A Study on the Associative Regulation Mechanism Based on the Water Environmental Carrying Capacity and Its Impact Indicators in the Songhua River Basin in Harbin City, China

1
School of Water Conservancy and Civil Engineering, Northeast Agricultural University, Harbin 150030, China
2
Research Center for Ecological Agriculture and Soil-Water Environment Restoration, Northeast Agricultural University, Harbin 150030, China
3
State Environmental Protection Key Laboratory of Soil Environmental Management and Pollution Control, Nanjing Institute of Environmental Sciences, Ministry of Ecology and Environment of China, Nanjing 210042, China
4
Northern Rice Research Center of Bao Qing, Shuangyashan 155600, China
*
Author to whom correspondence should be addressed.
These authors contributed equally to this work.
Sustainability 2025, 17(17), 7636; https://doi.org/10.3390/su17177636
Submission received: 21 July 2025 / Revised: 20 August 2025 / Accepted: 21 August 2025 / Published: 24 August 2025

Abstract

With intensifying watershed pollution pressures and growing ecological vulnerability, scientifically revealing and enhancing the water environmental carrying capacity is crucial for ensuring the long-term health of the basin and the sustainable socioeconomic development of the region. However, the dynamic regulatory mechanisms linking narrow-sense and broad-sense water environmental carrying capacity remain poorly understood, limiting the development of integrated management strategies. This study systematically investigated the changing trends of both the narrow-sense and broad-sense water environmental carrying capacity in the Harbin section of the Songhua River basin through model calculations, along with the regulatory mechanisms of its key influence indicators. The results of the study on the carrying capacity of the water environment in the narrow sense show that permanganate, total phosphorus, and ammonia nitrogen exhibited partial carrying capacity across water periods, while dissolved oxygen decreased during flat and dry periods, with only limited capacity remaining at the Ash River estuary and in the Hulan River. The biochemical oxygen demand in the Ash River was consistently overloaded, and total nitrogen showed insufficient capacity except during the abundant water period. Broad-sense analysis indicated that improving urbanization quality, water supply infrastructure, and drinking water safety could effectively reduce future overload risks, with projections suggesting a transition from critical to loadable levels by 2030, though latent threats persist. Correlation analysis between narrow- and broad-sense indicators informed targeted control strategies, including stricter regulation of nitrogen- and phosphorus-rich industrial discharges, restoration of aquatic vegetation, and periodic dredging of riverbed sediments. This work is the first to dynamically integrate pollutant and socio-economic indicators through a hybrid modelling framework, providing a scientific basis and actionable strategies for improving water quality and achieving sustainable management in the Songhua River Basin.

1. Introduction

With the rapid growth of the urban population and economy, water shortage and water pollution problems are becoming increasingly serious [1,2]. The carrying capacity of the water environment has become a key factor constraining regional development, particularly in terms of industrial structure optimization, urban expansion, agricultural productivity, and ecological sustainability [3]. Once the carrying capacity of the water environment of urban watersheds is exceeded, water quality deterioration, water resource shortages, and water ecosystem degradation will occur, which will seriously jeopardize the sustainable development of water systems in urban watersheds and affect people’s normal survival [4,5]. The carrying capacity of the water environment is now divided into the narrow sense and the broad sense [6]. The narrow-sense water environmental carrying capacity is described from the perspective of “quantity”, that is, the capacity of the water environment calculated using pollutant concentrations or loads as indicators, such as the maximum allowable load of nutrients or organic matter before exceeding a given water quality class. The broad-sense water environmental carrying capacity is described from the perspective of “quality”, that is, the ability of the water environment to sustain socioeconomic development, such as the extent to which water resource availability can support industrial expansion or population growth. [7]. In the past, only one-sided research on the broad and narrow aspects of the water environment carrying capacity was conducted; comprehensive studies on the water environment carrying capacity of “quantity” and “quality” have rarely been reported, and breakthroughs are urgently needed. Moreover, the indicator system and calculation of the water environment carrying capacity involve many complex and changing uncertainty variables [8]. It is difficult to quantitatively describe the promotional or constraining relationships among indicator systems, and there is a lack of deep-level indicator information such as long-term monitoring records, detailed human activity data, and representative ecological health metrics to provide effective feedback for regulating the carrying capacity of the water environment. [9]. The above problems should be solved to ensure the sustainable development of urban watershed water systems. Efforts are needed to establish appropriate narrow and broad water environment carrying capacity systems and select appropriate models to evaluate and predict the narrow and broad water environment carrying capacity of urban watersheds. The promotional or constraining relationships between water environment indicators should be explored to accurately identify the causes of overloading the water environment carrying capacity of urban watersheds. According to the corresponding relationships between the indicators, there is an urgent need to carry out targeted management of the water environment carrying capacity and other work [10,11].
Studying the water environmental carrying capacity from a narrow-sense perspective primarily involves identifying key pollutant indicators that reflect the degree of water quality degradation [12]. In the context of the Songhua River, previous studies have demonstrated that parameters such as dissolved oxygen, total nitrogen, total phosphorus, permanganate index, biochemical oxygen demand, and ammonia nitrogen are the primary determinants of water quality variation [13]. Although Escherichia coli has been considered in some assessments, its high strain specificity and instability limit its applicability as a general index [14]. Moreover, the conversion between permanganate and biochemical oxygen demand lacks consistency due to spatial heterogeneity in water body conditions [15,16]. Therefore, this study focuses on six representative pollutants—excluding E. coli—to characterize the narrow-sense water environmental carrying capacity.
In terms of modelling approaches, several techniques have been employed to estimate water environmental carrying capacity, including one-dimensional water quality models [17], the QUAL2K framework [18], and two-dimensional bank discharge models [19]. However, the one-dimensional model inadequately captures seasonal hydrological variability, while the QUAL2K model overlooks dynamic flow conditions and often requires unavailable parameters [20]. In contrast, the two-dimensional bank discharge model offers improved simulation fidelity by accounting for complex diffusion and dispersion processes, making it more suitable for river systems such as the Songhua River [21].
The broad-sense water environmental carrying capacity aims to evaluate the sustainable development capacity of integrated socio-economic–ecological systems using composite indicator frameworks [22]. Establishing a comprehensive and time-sensitive indicator system is critical to assess the water environmental carrying capacity of urban watersheds under different development trajectories [23]. In this paper, based on the established principle, the influence of the current urban water environment carrying capacity indicator system on the relationship and establishment process is investigated. Drawing on the research results of the existing sustainable development indicator system, we screened and improved the water resource quantity indicators, water resource consumption indicators, and water resource quality impact indicators [24]. Common methods used in this domain include fuzzy comprehensive evaluation [25], multi-objective decision analysis [26], and system dynamics modelling [20]. Nevertheless, these methods often fall short in quantifying risk levels or describing interdependencies among indicators. To overcome these limitations, advanced multi-criteria decision-making tools are introduced. The projection tracing method combined with hierarchical analysis can easily process and analyses high-dimensional data, determine the optimal projection direction of indicator weights and achieve global optimization [27,28]. By combining the set-pair analysis posture evaluation method and the bias linkage number method, one can better judge the risk level of carrying water environments; this approach has greater reliability and safety for complex systems.
The indicator evaluation system for calculating the carrying capacity of the water environment in a narrow sense is composed of various types of pollutants in the water body and is related to water quality objectives, the size of the water body, the self-purification capacity of pollutants, physical and chemical characteristics, and other factors [29,30]. The indicator evaluation system of broad water environment carrying capacity involves many factors, such as the water environment, macroeconomics, society, and population, which are mutually reinforcing and constraining [31,32,33]. The narrow and broad water environment carrying capacity impact indicators are obtained from the prediction [34,35]. The narrow water environment carrying capacity impact indicators (pollutant indicators) and the broad water environment carrying capacity impact indicators (socioeconomic and ecological indicators) are jointly analyzed to clarify the promotion or constraints between the indicator factors. Based on the predicted results of the narrow-sense and broad-sense water environmental carrying capacity impact indicators, a combined correlation analysis was conducted between the narrow-sense indicators and the broad-sense indicators to identify the promoting or constraining relationships among the influencing factors. This study aims to comprehensively assess the pressure on and resilience of the water environment. This approach goes beyond the traditional single-indicator framework, enabling a more dynamic and systematic understanding of the interactions between water quantity and quality, thereby providing targeted recommendations for enhancing environmental sustainability and promoting coordinated regional development [36].
As one of the seven major water systems in China, the Songhua River is the main source of water for daily life and industrial use in Heilongjiang Province. Most of the water in Harbin comes from the Songhua River, which receives a large amount of sewage wastewater [37]. The water resources of the Songhua River Basin are related to the economic development and social stability of Heilongjiang Province and even the entire northeastern region of China [38,39]. Due to regional agricultural development and the frequent occurrence of environmental incidents in the Songhua River basin in recent years, the carrying capacity of the water environment in the mainstream of the Harbin section of the Songhua River has been declining year by year since the 20th century, placing the city in a relatively dire situation in the process of economic development [40]. In summary, the goals of this paper are to (1) first establish a narrow water environment carrying capacity and broad water environment carrying capacity index system for the urban watershed of the Harbin section of the Songhua River and utilize the Back Propagation (BP) neural network method to predict future index data values. The Nemerow pollution index method is used to establish a mathematical model for river water quality evaluation, and the integrated pollution indices of the river water quality sections are compared with the integrated eigenvalues of the standard categories to determine the water quality categories of the sections. (2) When calculating the environmental capacity of the river basin, the changes in the periods of abundance, flatness and dryness are accounted for, and the two-dimensional bank discharge model is used to calculate the narrow water environmental carrying capacity of the Harbin section of the Songhua River at the present stage. Combined with the predicted index values, the set-pair potential-partial linkage number method of PP-AHP optimization is used to calculate the future carrying capacity of the generalized water environment. (3) The correlation between the pollutant indicators of the narrow water environment carrying capacity and the indicators of the broad water environment carrying capacity are analyzed; the advantages and disadvantages of the positive and negative indicators are combined to realize accurate judgement of the risk factors for the water environment carrying capacity of the watershed; and corresponding solution measures are provided. The results of this study provide a scientific basis for the rational development of urban water environments, full use of water environment capacity, etc. The deterioration trend of water pollution in Harbin city can be effectively controlled, the quality of the water environment can be improved, and the century’s sustainable development planning can be realized [41,42]. The flowchart of the study is shown in Figure 1.

2. Materials and Methods

2.1. Overview of the Study Area

The Songhua River is one of the seven major rivers in China and is the largest tributary of the Heilongjiang River in China. The Songhua River Basin lies between 41°42′~51°38′ N and 119°52′~132°31′ E, with a watershed area of 556,800 km2, accounting for 30.2% of the total watershed area of 1,843,000 km2 in Heilongjiang [43]. The Harbin section of the Songhua River (with an opening level of 116.29 metres, a flow rate of 1100 cubic metres per second, and a total length of approximately 153.5 km) is located in the mid-temperate continental monsoon climate zone, and the average multiyear temperature ranges from 3 to 5 °C [44]. The multiyear average precipitation is generally approximately 500 mm. The section from the Three Forks River to Harbin city is the upper section, which is 240 km2 in length, with a catchment area of 30,000 km2 in the zone, and flows through the grasslands and wetlands of the Songnen Plain; its slope drop from the Three Forks River to the Lower Daiji is relatively gentle, at 0.022%. Due to the influence of climate, the seasonal distribution of precipitation and other factors, the Harbin section of the Songhua River is also characterized by alternating periods of multiple water periods, such as the abundant water period, the flat water period, and the dry water period [45].

2.2. Data Sources

The pollutant water quality data for the Harbin section of the Songhua River were collected from the following authoritative sources: the Functional Area Delineation of Surface Water Environmental Quality and Supplementary Standards for Water Environmental Quality in Heilongjiang Province, the Technical Report on the Delineation of Environmental Functional Areas of Surface Waters in Harbin City, the National Report on Surface Water Quality, and the Calendar of Surface Water Quality Detection System. The dataset covers the period from January 1999 to December 2020, with monthly monitoring conducted at six control sections. These data capture seasonal variations, including the abundant water period (July, August, and September), the normal water period (April, May, June, October, and November), and the dry water period (January, February, March, December), which are analyzed separately to reflect seasonal impacts on water quality.
The socioeconomic and environmental data used for evaluating the broad water environmental carrying capacity were sourced from the Harbin Statistical Yearbook, the Heilongjiang Statistical Yearbook, and the Harbin Environmental Quality Bulletin.

2.3. Selection of Indicators of the Carrying Capacity of a Water Environment in a Narrow Sense

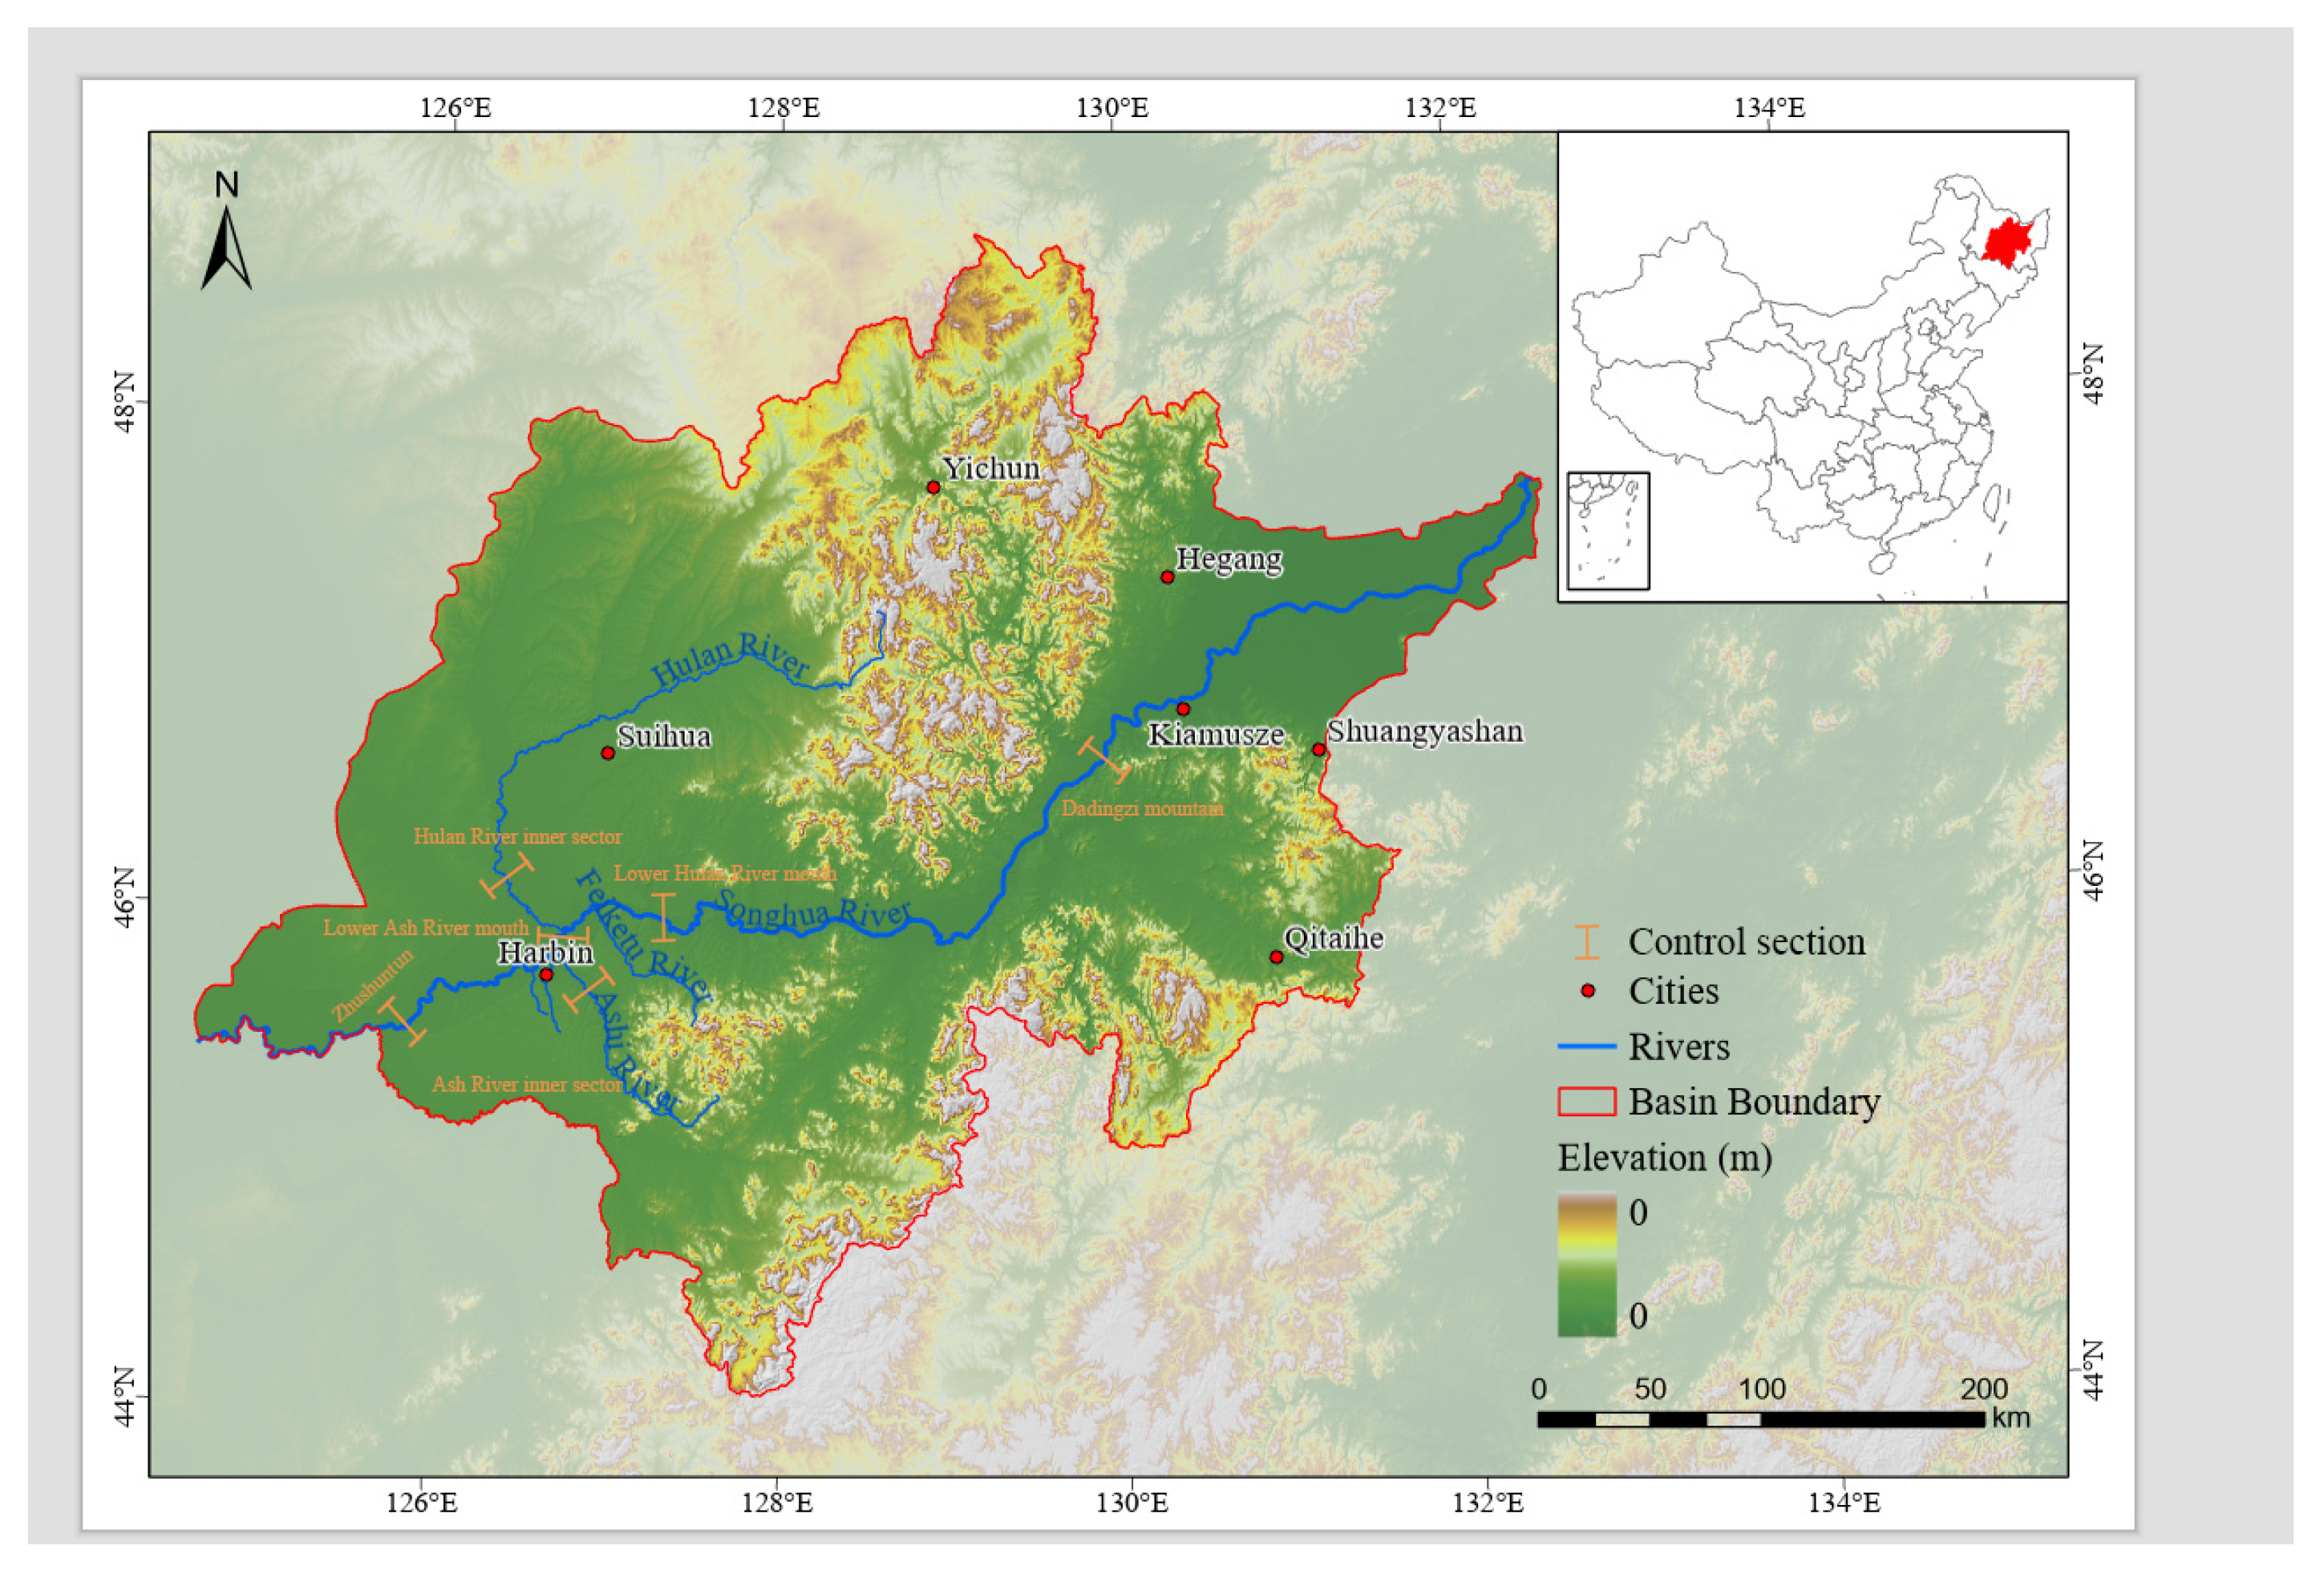
The water environment functional areas of a river comprise the land area surrounding a designated river section, its catchment area and pollution sources. These areas are divided into control units; in Harbin city, one functional area corresponds to one control unit [46]. Pollution sources in each functional area were classified in accordance with the national Pollution Source Census Technical Guidelines and relevant local environmental management standards into three categories: (1) industrial point sources, including factories, enterprises, and wastewater treatment plants with fixed discharge outlets; (2) agricultural non-point sources, such as farmland runoff, livestock and poultry breeding areas, and rural domestic wastewater; and (3) urban domestic point sources, including municipal sewage systems and direct residential discharges. Since the main stream of the Songhua River in Harbin City and its tributaries—the Ashi River and the Hulan River—receive most of the city’s sewage and wastewater, six control units were selected: Zhushuntun, Ash River inner sector, Lower Ash River mouth, Hulan River inner sector, Lower Hulan River mouth, and Dadingzi mountain, as shown in Figure 2.
For the mainstem of the Songhua River, downtown Harbin is a point source, and sewage from downtown Harbin is discharged into the Songhua River through 3 outfalls and 12 outfalls [47]. Currently, there are 9 outfalls in the section of the river from Zhushuntun to Dongjiangqiao, and 6 in the section of the river from Dongjiangqiao to Daitengzishan. After the outfalls were comprehensively considered, three river outfalls from urban point sources, Hejiagou and Majiagou, located in the river section between Zhushuntun to Dongjiangqiao, were chosen, as was one located in the river section between Dongjiangqiao to Dadingzi mountain [48], which is below the Dongjiangqiao outfall in the southern part of the river. Sampling sites were strategically selected to represent urban (Zhushuntun), suburban (Ash River), and rural (Hulan River) zones. The environmental quality standards for surface water (GB3838-2002) [49] are shown in Table 1.

2.4. Narrowly Defined Water Environment Carrying Capacity Calculations

2.4.1. Water Quality Fuzzy Closeness Modelling [50]

For example, if n samples of polluted water bodies are evaluated for classification, each sample has m pollution indicators, whose measured concentration values are y′. As an evaluation standard, k water quality functional classifications corresponding to m pollution indicators, all of which have a standard value of x. k water quality standard pollutant eigenvalues are:
x i = X i 1 , X i 2 , , X i m ( i = 1 ,   2   ,   k )
The pollution indices for n samples of polluted water bodies are as follows:
y i = y j 1 , y j 2 , , y j m ( j = 1 ,   2   ,   n )
The closeness between the evaluation samples and the criteria of class k, i.e., proximity, is defined as follows:
d i j   =   x i y j
where d i j is the closeness of evaluation sample j to category i. An evaluation sample j is said to belong to category i if it satisfies d i j = m i n d i j = min d i j , d z j , , d k j .
The evaluation parameter for the decrease in the hazard level of a pollutant with increasing concentration is calculated as follows:
x i = X ¯ i x i X ¯ i ,   y j = X ¯ i y j X ¯ i
The evaluation parameter for the increase in the hazard level of a pollutant with its concentration is calculated as follows:
x i = x i X ¯ i , y j = y j X ¯ i
Among them, X ¯ i = i = 1 k x i k

2.4.2. Two-Dimensional Riparian Discharge Modelling for the Carrying Capacity of the Water Environment in a Narrow Sense

The average width of the Harbin section of the Songhua River is approximately 1025 m, the average depth is approximately 4.5 m, and the average flow rate for many years is more than 600 m3/s; these rivers are large rivers with wide and shallow channels [51]. According to the actual situation of surface water environmental functional areas in Harbin, a two-dimensional bank discharge water quality model was used. Because the buoyancy of the Harbin section of the Songhua River is neutral and involves non-jet discharge, the vertical mixing length is proportional to the water depth [52]. Therefore, shortly after entering the river, pollutants are fully vertically mixed into its depths. Thus, the pollutants are assumed to be mixed instantaneously in the axial direction after discharge into the river, with only long and persistent concentration gradients in the transverse and longitudinal directions, which are calculated according to the two-dimensional model of the water environment capacity. Since the location of the sensitive point is often taken at the bank, the horizontal distance from the sensitive point to the bank where the outfall is located is 0 [53]. The relevant calculation model for the capacity of the water environment is:
M y   =   ( 0.058 H   +   0.0065 B ) g H i
W = c p Q p = c s e x p ( K 1 x 86400 u x ) c 0 · H π M y · x · u x · 1 + e x p ( u x B 2 M y · x ) 1
where x is the longitudinal distance from the outfall to the sensitive point, m. y is the lateral distance from the sensitive point to the bank where the outfall is located, m. Qp is the flow rate of the outfall, m3/s. cp is the concentration of pollutants discharged at the outfall, mg/L. ch is the background concentration of the pollutants in the river, mg/L. My is the longitudinal and transverse dispersion coefficient of the river, m2/s. u is the longitudinal and transverse mean K1 is the pollutant decay rate constant (0.100 d−1 is used), d−1. B is the water surface width of the river, m. H is the average depth of the river, m. cs is the water quality standard, mg/L. c0 is the background concentration or background value of the pollutant in the river, mg/L. g is the acceleration of gravity, 9.8 m/s2. i is the average longitudinal slope drop, which is taken as 0.05% to 0.1% for the Harbin section of the Songhua River [54].

2.5. Establishment of a Generalized Water Environment Carrying Capacity Indicator System

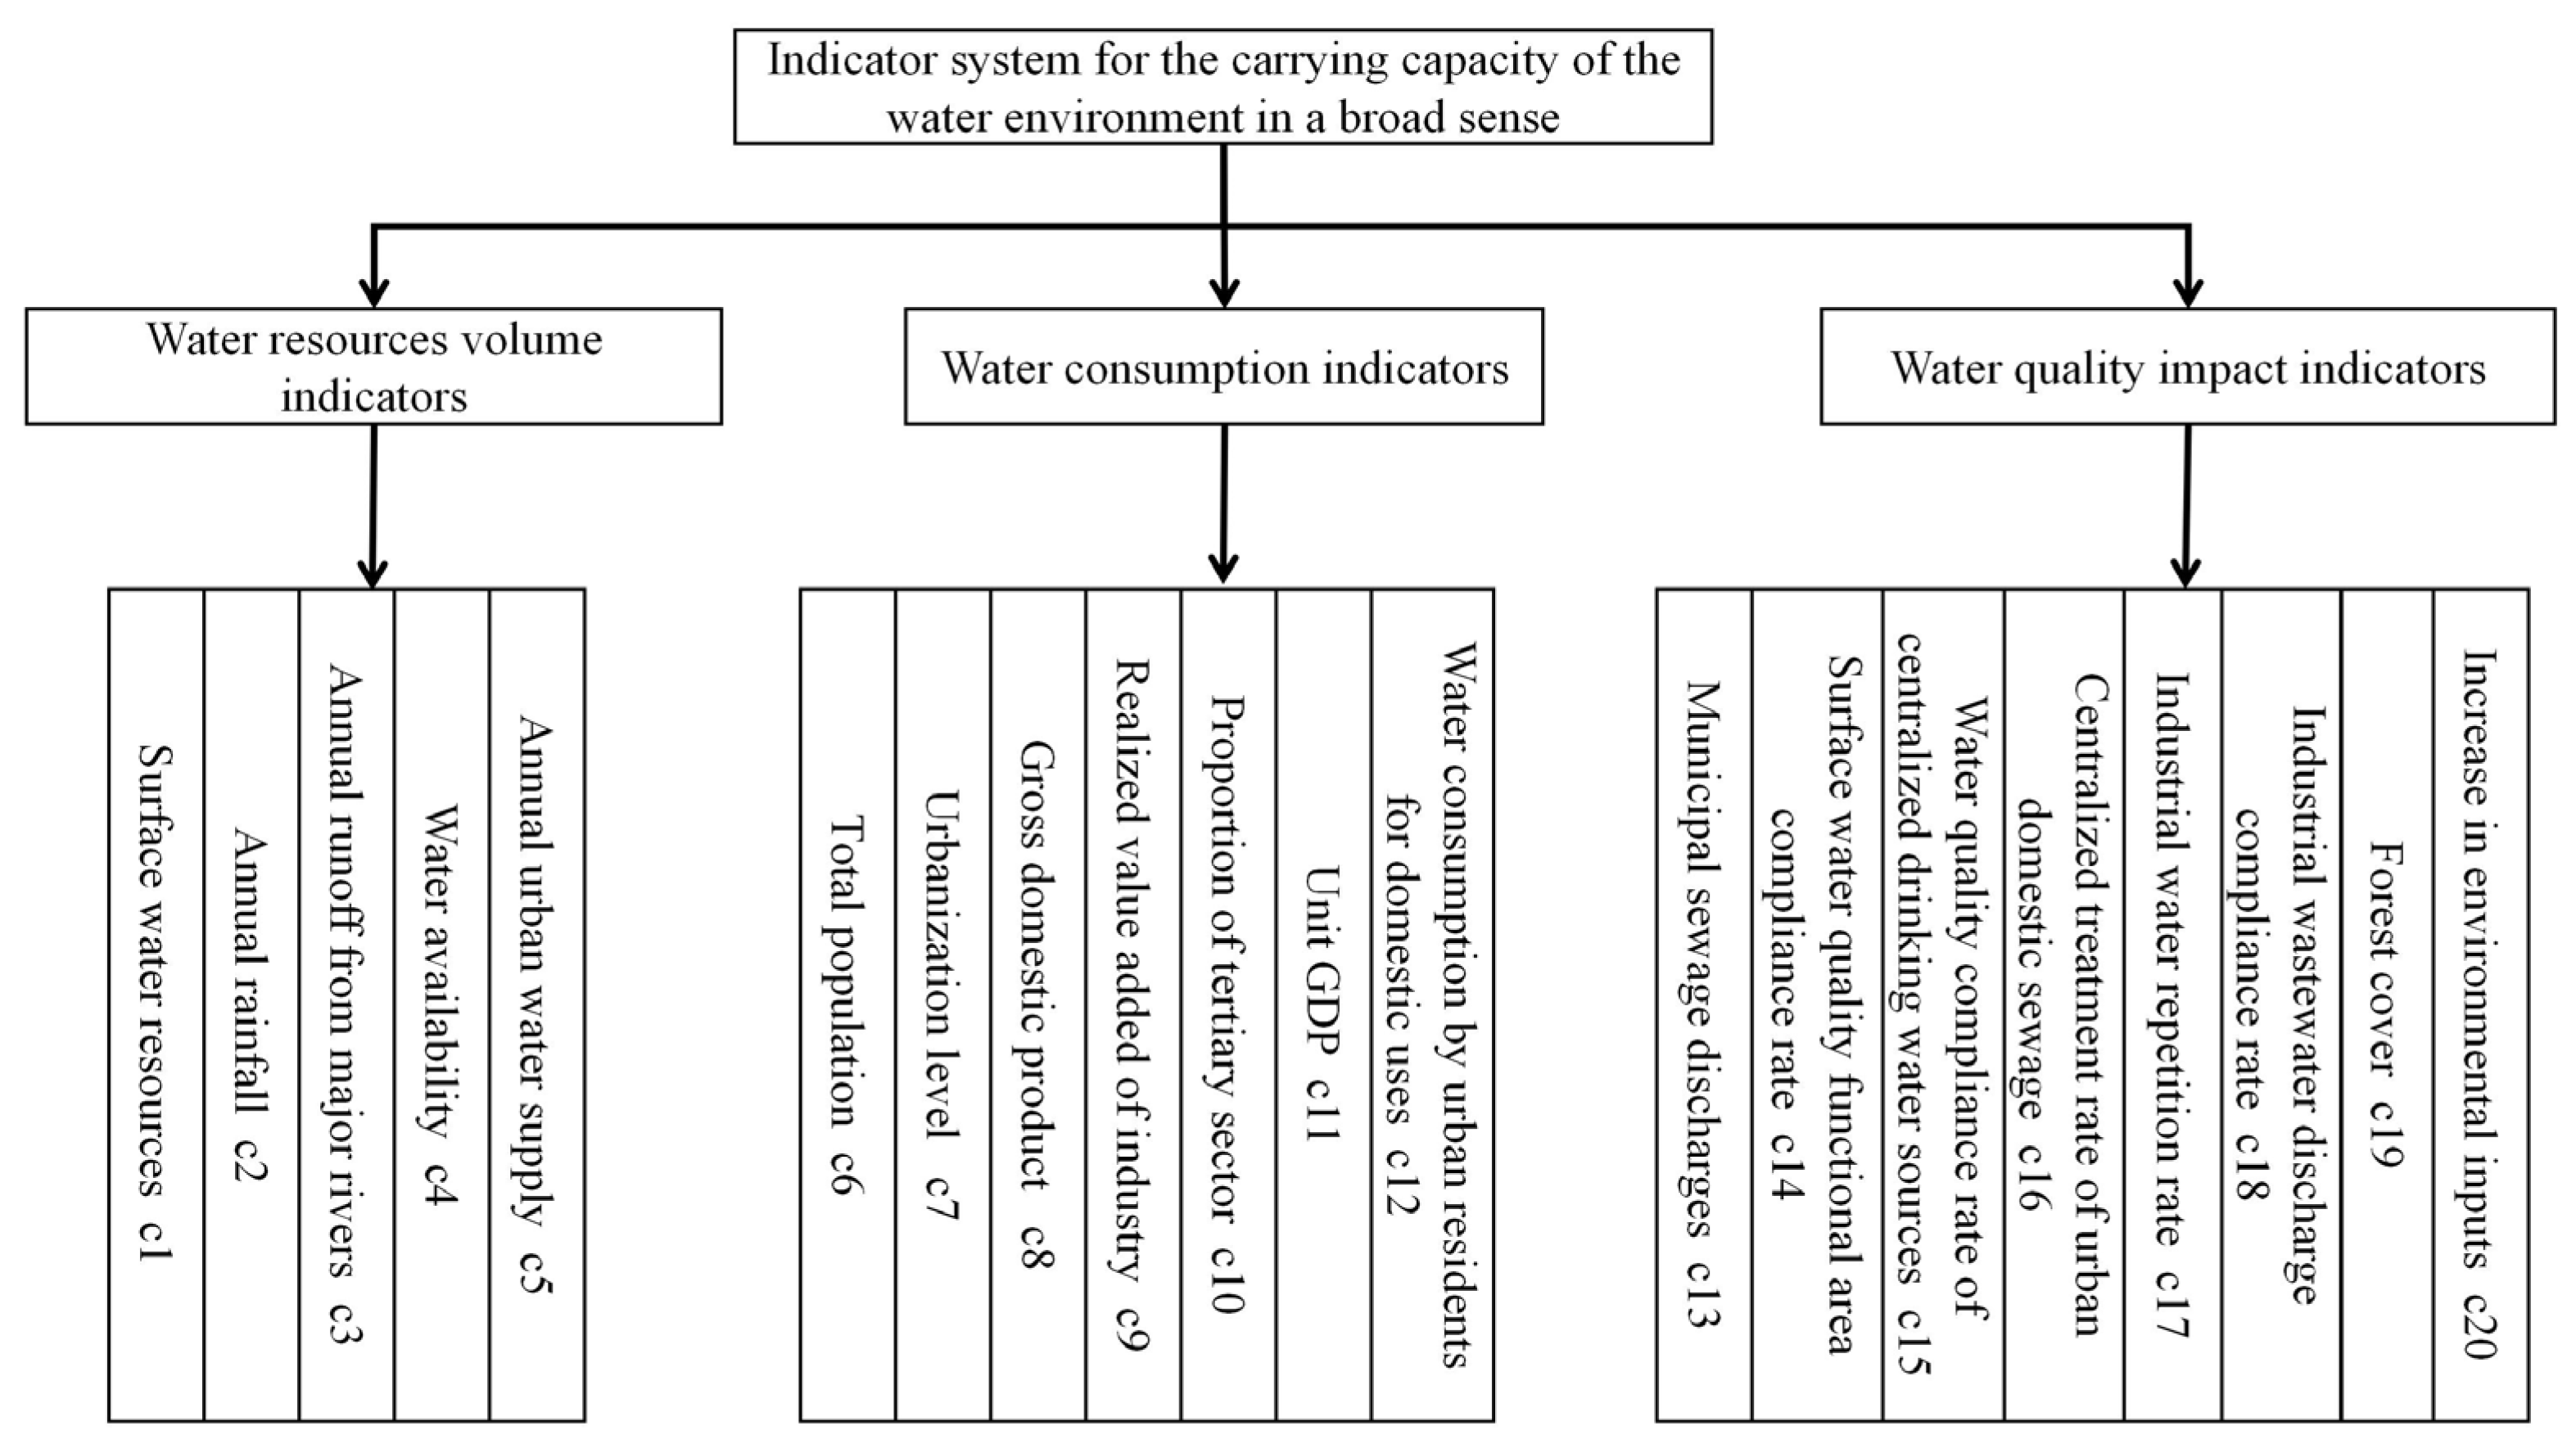
Considering the complexity of the factors affecting the water environment, the water environment carrying capacity indicator system was first simplified into three subsystems: social, economic, and water environment [55]. Then, 20 indicators affecting the water environment carrying capacity of the Harbin section of the Songhua River were screened from the three aspects and refined into statistically or computationally calculable elements. A sustainability evaluation index system for the carrying capacity of the water environment in Harbin was constructed; it is shown in Figure 3.

2.6. Calculation of the Carrying Capacity of the Generalized Water Environment

Based on previous studies, the dataset of water environment carrying capacity indicators was first collected for a long time period [56], the BP neural network time series prediction model was used to predict the trend in the next 10 years, and the ternary evaluation linkage number of each research object was calculated based on the 20 evaluation indicators. The hierarchical analysis method (AHP) was used to determine the weights of each indicator of the system, and the projection finding method (PP) was subsequently applied to optimize the determined weights to provide a unified quantitative characterization of the positive and negative dynamics and grades in which the system is located [57].
Zi = j = 1 n c j x i j
maxQ ( c ) = R
Equations (10) and (11) were used to calculate the affiliation and single indicator value linkage numbers u i j for ranks k = 1, 2, and 3.
v i j k   = 0.5 + 0.5 u i j k
v i j k = v i j k / k = 1 3 v i j k
From Equations (12) and (13), the number of evaluation indicator value links for sample i is calculated (i = 1, 2…, m), where ω j is the weight of the jth evaluation indicator.
u i j   = v i j 1   + v i j 2 I + v i j 3 J
u i   = vi 1 + vi 2 I + vi 3 J = j = 1 n ω j v i j 1   + j = 1 n ω j v i j 2 I + j = 1 n ω j v i j 3 J
In the water environment carrying capacity evaluation system, the numerical value of a class is generally represented by the numbers 1, 2, and 3. The set-pair potential eigenvalue takes the value interval as [1,3,58]. This interval can effectively reflect the range of grades and, at the same time, the posture of the system, as shown in Table 2.
Then, we analyzed the evolution law between adjacent linkage components in terms of the ternary linkage number based on the 1st-order partial linkage number method and used the sum of the 1st-order evolution values between adjacent components and a chosen component to portray the support of the linkage number for each level [59].
R = 1 b 0 + a 1 c 0 + b 1
S′ = U·R′ = (S′1, S′2, S′3)
The model was further extended to study the comparison by using 2nd-order partial linkage numbers.
R = 1 a 2 c + a 1 c 2 + a + b 1
S″ = U·R″ = (S1″, S2″, S3″)
The above methods were combined to predict and evaluate the analysis of the carrying capacity of the water environment.

2.7. BP Neural Network Prediction Model

The BP neural network propagates signals forward (from input to output) and then propagates errors backward (from output to input). This process repeatedly adjusts the weights of connections within the network to minimize the difference between the actual output vector and the desired output vector. A common three-layer BP neural network consists of an input layer, a hidden layer, and an output layer, with each layer containing multiple nodes. The output value of each node is determined by the outputs of all nodes in the upper layer, the weights between the current node and all nodes in the previous layer, the bias of the current node, and the activation function used. The formulas for calculating the output values of nodes in the hidden layer and output layer are as follows [60]:
h j = f ( i w j i x i + b j )
y l = f ( j v l j h j + b l )
where xi represents the value of the input layer node, hj represents the value of the hidden layer node, wji represents the weight between the input layer node and the hidden layer node, bj and bl represent the bias of the current node, yl represents the value of the output layer node, vlj represents the weight between the hidden layer node and the output layer node, and f represents the activation function.
When there is an error between the output value and the target value, the BP neural network adjusts its weights and biases through a process called backpropagation. First, the BP neural network uses the mean squared error as its loss function E to measure the error:
E = 1 n l ( z l y l ) 2
where zl represents the target value. Subsequently, the derivatives of the loss function with respect to the weights and biases are calculated, which are referred to as gradients.
The BP neural network consisted of 3 input layers, 8 hidden layers, and 1 output layer, trained over 1000 epochs with a learning rate of 0.01.

2.8. Statistical Analysis

The data chosen for the carrying capacity indicators were analyzed using Origin 8.6 and SPSS 25 for correlation processing.

3. Results and Discussion

3.1. Narrowly Defined Water Environment Carrying Capacity Results

3.1.1. Water Quality Analysis of Different Cross-Sections During the Periods of Abundant Water, Flat Water, and Dry Water

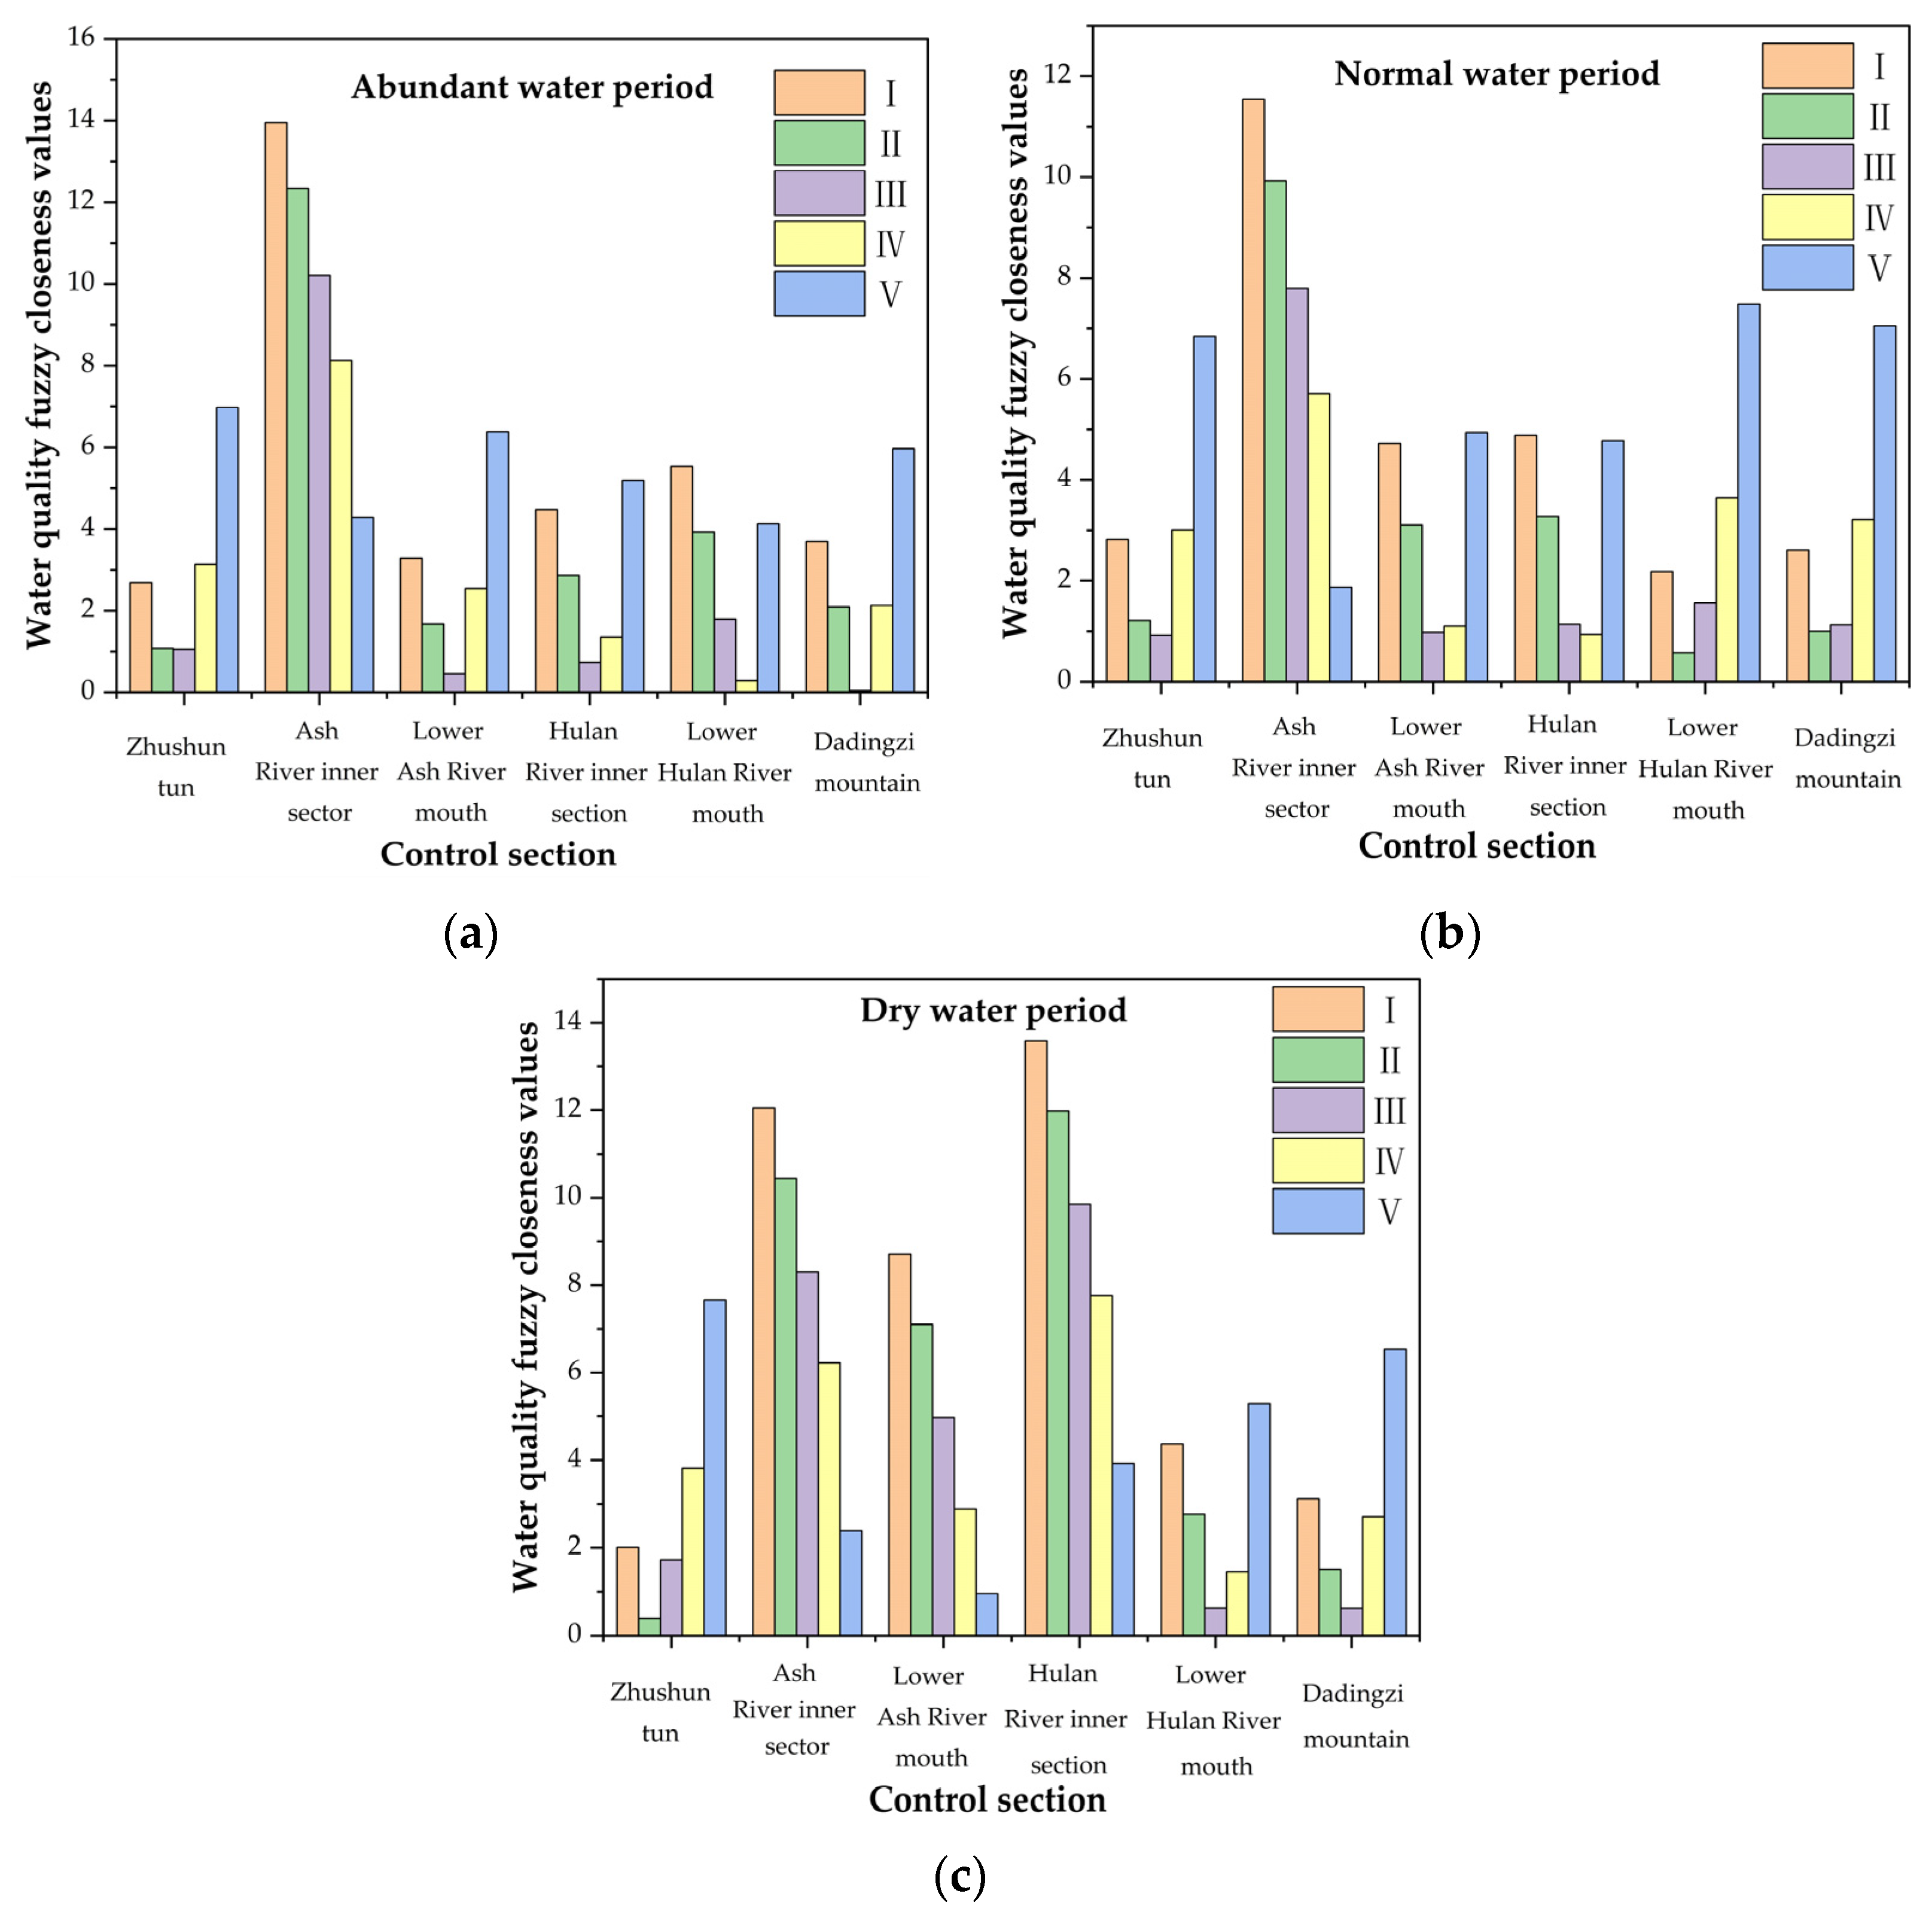
Figure 4 shows the results of the water quality fuzzy closeness method for each control section in the abundant water period, the normal water period, and the dry water period. The results show that in the three water periods, the closeness value of category V within the Ash River is the smallest, so the water quality in the section within the Ash River belongs to category V; this is because the biochemical oxygen demand and nitrogen indices are dominant factors and because the remaining capacity of both is seriously insufficient. The same analogy is made for the remaining sections and the water quality categories of each section in different water periods [61].
An analysis of the results presented in Figure 4, combined with the water quality objectives of the functional areas, reveals the following: (1) At the Zhushuntun section, water quality reaches Class II during the dry period but declines to Class III in the abundant and normal periods, reflecting subdued non-point source and tributary loads under low flows versus runoff-driven inputs of nutrients and organics during high-runoff seasons. As a key water source protection area for Harbin, Zhushuntun serves domestic drinking water, rare aquatic habitats, and fish breeding grounds. However, based on classification closeness, its water quality only marginally meets the functional requirements and still falls short of the national Class II standard. (2) The section from Zhushuntun to Dongjiangqiao is heavily polluted. The main pollution source between Zhushuntun and Dongjiangqiao, particularly in the Hejiagou tributary, is municipal domestic sewage combined with industrial wastewater from surrounding districts, with Hejiagou acting as a drainage channel that carries over 20% of Harbin’s sewage into the Songhua River. (3) The Ash River and Hulan River also fall within the heavily polluted zones. The Ash River water quality remains worse than Class V during all hydrological periods, which is mainly attributed to its role as the main receiver of domestic and industrial wastewater in Harbin, which also contains wastewater from the heavily polluted tributaries of the Hejiagou. However, the Hulan River shows Class III during the abundant period but deteriorates to lower classes as flow decreases, reflecting the strong influence of seasonal hydrology on nitrogen and oxygen balance. (4) In the lower reaches of the Ash and Hulan Rivers, particularly near their estuaries, water quality improves significantly compared to upstream sections, with a trend of upgrading from worse than Class V to around Class III–IV. This indicates strong natural degradation and self-purification capacity in these areas, mainly driven by dilution under high flow, sedimentation of particulate pollutants, and microbial decomposition of organic matter. These estuarine zones should therefore be prioritized in future river management. Similar seasonal improvement patterns have been documented in the Lake Baikal Watershed, where dilution during high-flow periods enhances natural self-purification [62]. (5) The section from the lower Hulan estuary to the Dadingzi mountainous area shows Class III water quality during the dry period, Class II during the normal period, and an improvement from Class IV to Class III during the abundant period. This reflects effective natural purification under higher flow conditions. Calculating the environmental capacity and reducing pollutant discharge at the Dadingzi outfall are thus necessary.

3.1.2. Indicator Capacity Analysis of Pollutants in the Water Environment

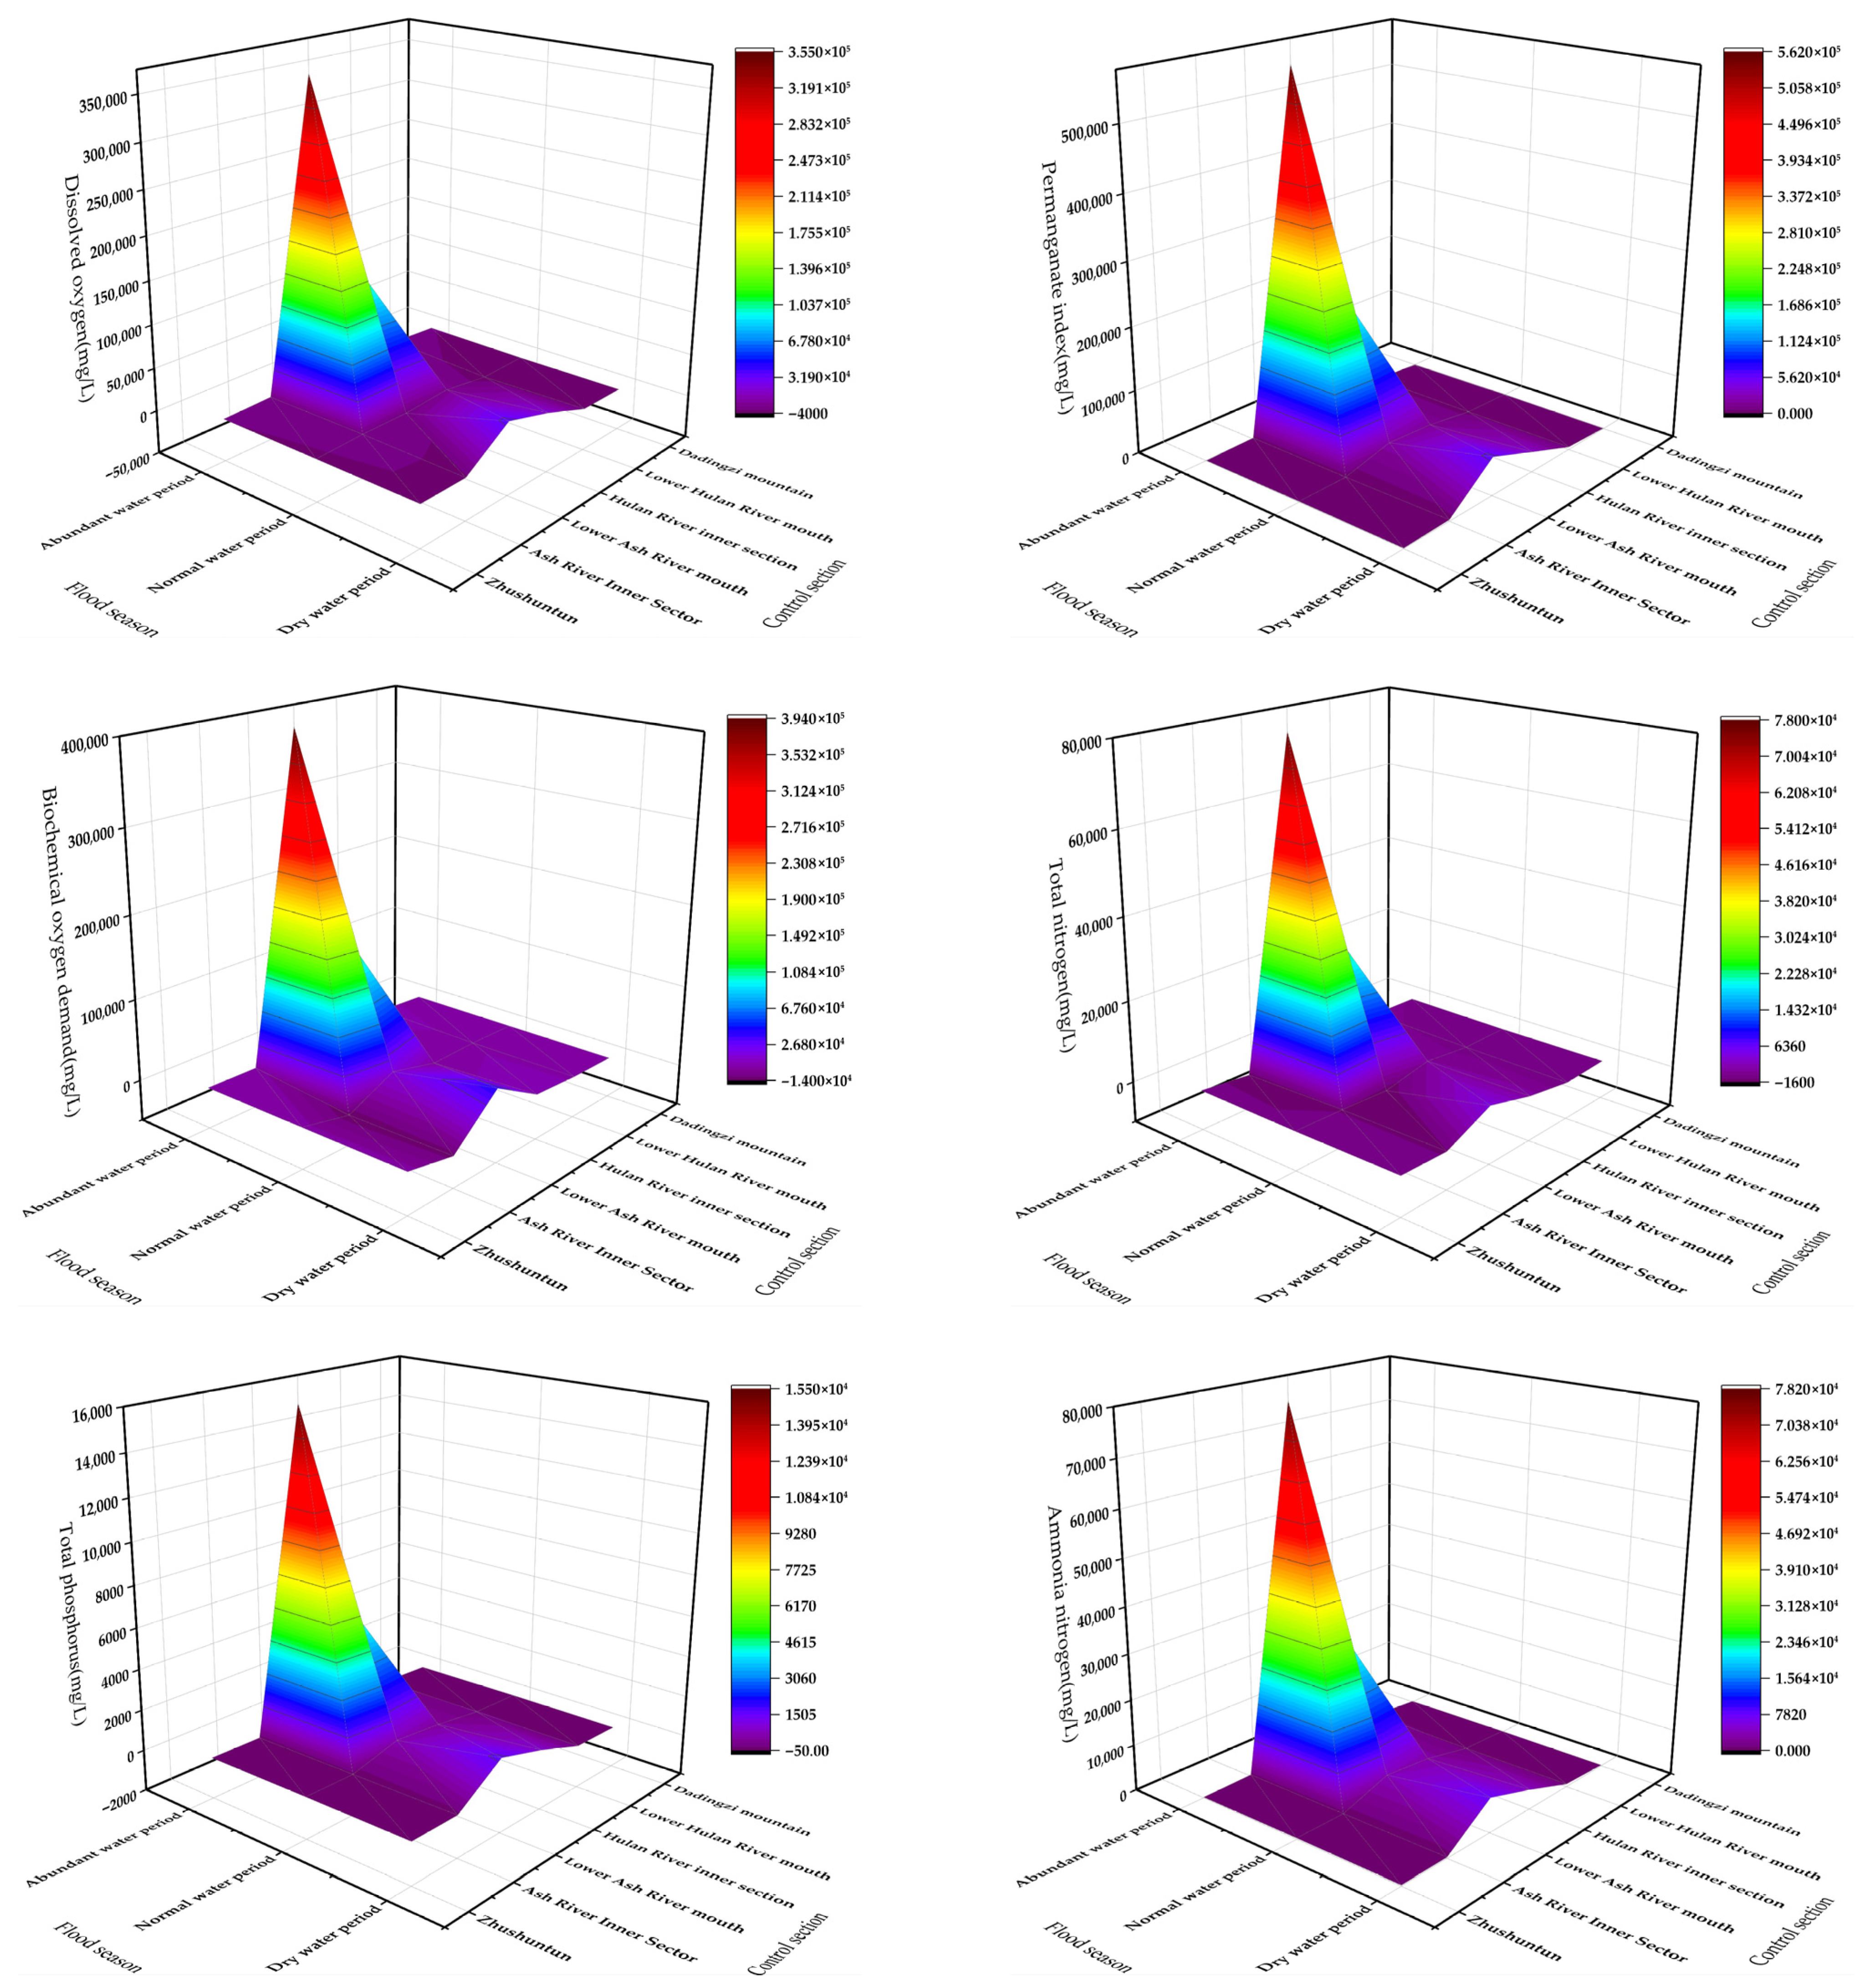
Figure 5 shows the water environment capacity values of each pollutant indicator based on the two-dimensional shore discharge model. According to the analysis in the figure, the three indicators of permanganate index, total phosphorus concentration and ammonia nitrogen concentration had certain impacts on the water environment in each water period and control section. The dissolved oxygen capacity in the basin during the period of abundant water exhibited a trend of “more in the middle, less on both sides”. During the period of normal water and dry water, when water volume in the basin was reduced, the dissolved oxygen capacity also gradually decreased, but only at the mouth of the Ashe River, while the Hulan River retained a certain capacity. The biochemical oxygen demand in the Ash River is insufficient for all water periods in the basin, which needs to be remedied in the river, and the remaining control cross-sections still have a certain capacity. The total nitrogen index of each cross-section is insufficient for the water environment as a whole, except for during the abundant water period. According to the results of the capacity control analysis, the pollution control work in the Songhua River mainstem Harbin section is under great pressure [63], with the remaining environmental capacity mainly concentrated in the lower Hulan River and the downstream section below Dadingzi Mountain. Furthermore, during the dry season, the overall capacity in the basin approaches zero because reduced flow severely limits dilution and self-purification. The main pollution pressures in the Harbin section stem from three sources: industrial point sources, urban domestic sewage, and agricultural non-point source runoff. Industrial and domestic sewage dominate localized loads, while agricultural runoff contributes substantially to nitrogen and phosphorus inputs during the abundant water period. Key challenges include clustered industrial discharges, limited sewage treatment capacity, and the diffuse seasonal nature of agricultural pollution. Compared with the Haihe and Liao River Basins, where nitrogen and phosphorus overloads are also critical, the Songhua River shows stronger seasonal fluctuations in dissolved oxygen capacity due to its freeze–thaw hydrology, underscoring the need for adaptive, source-specific management [64].

3.2. Results of the Generalized Water Environment Carrying Capacity

3.2.1. Determination of Evaluation Index Weights

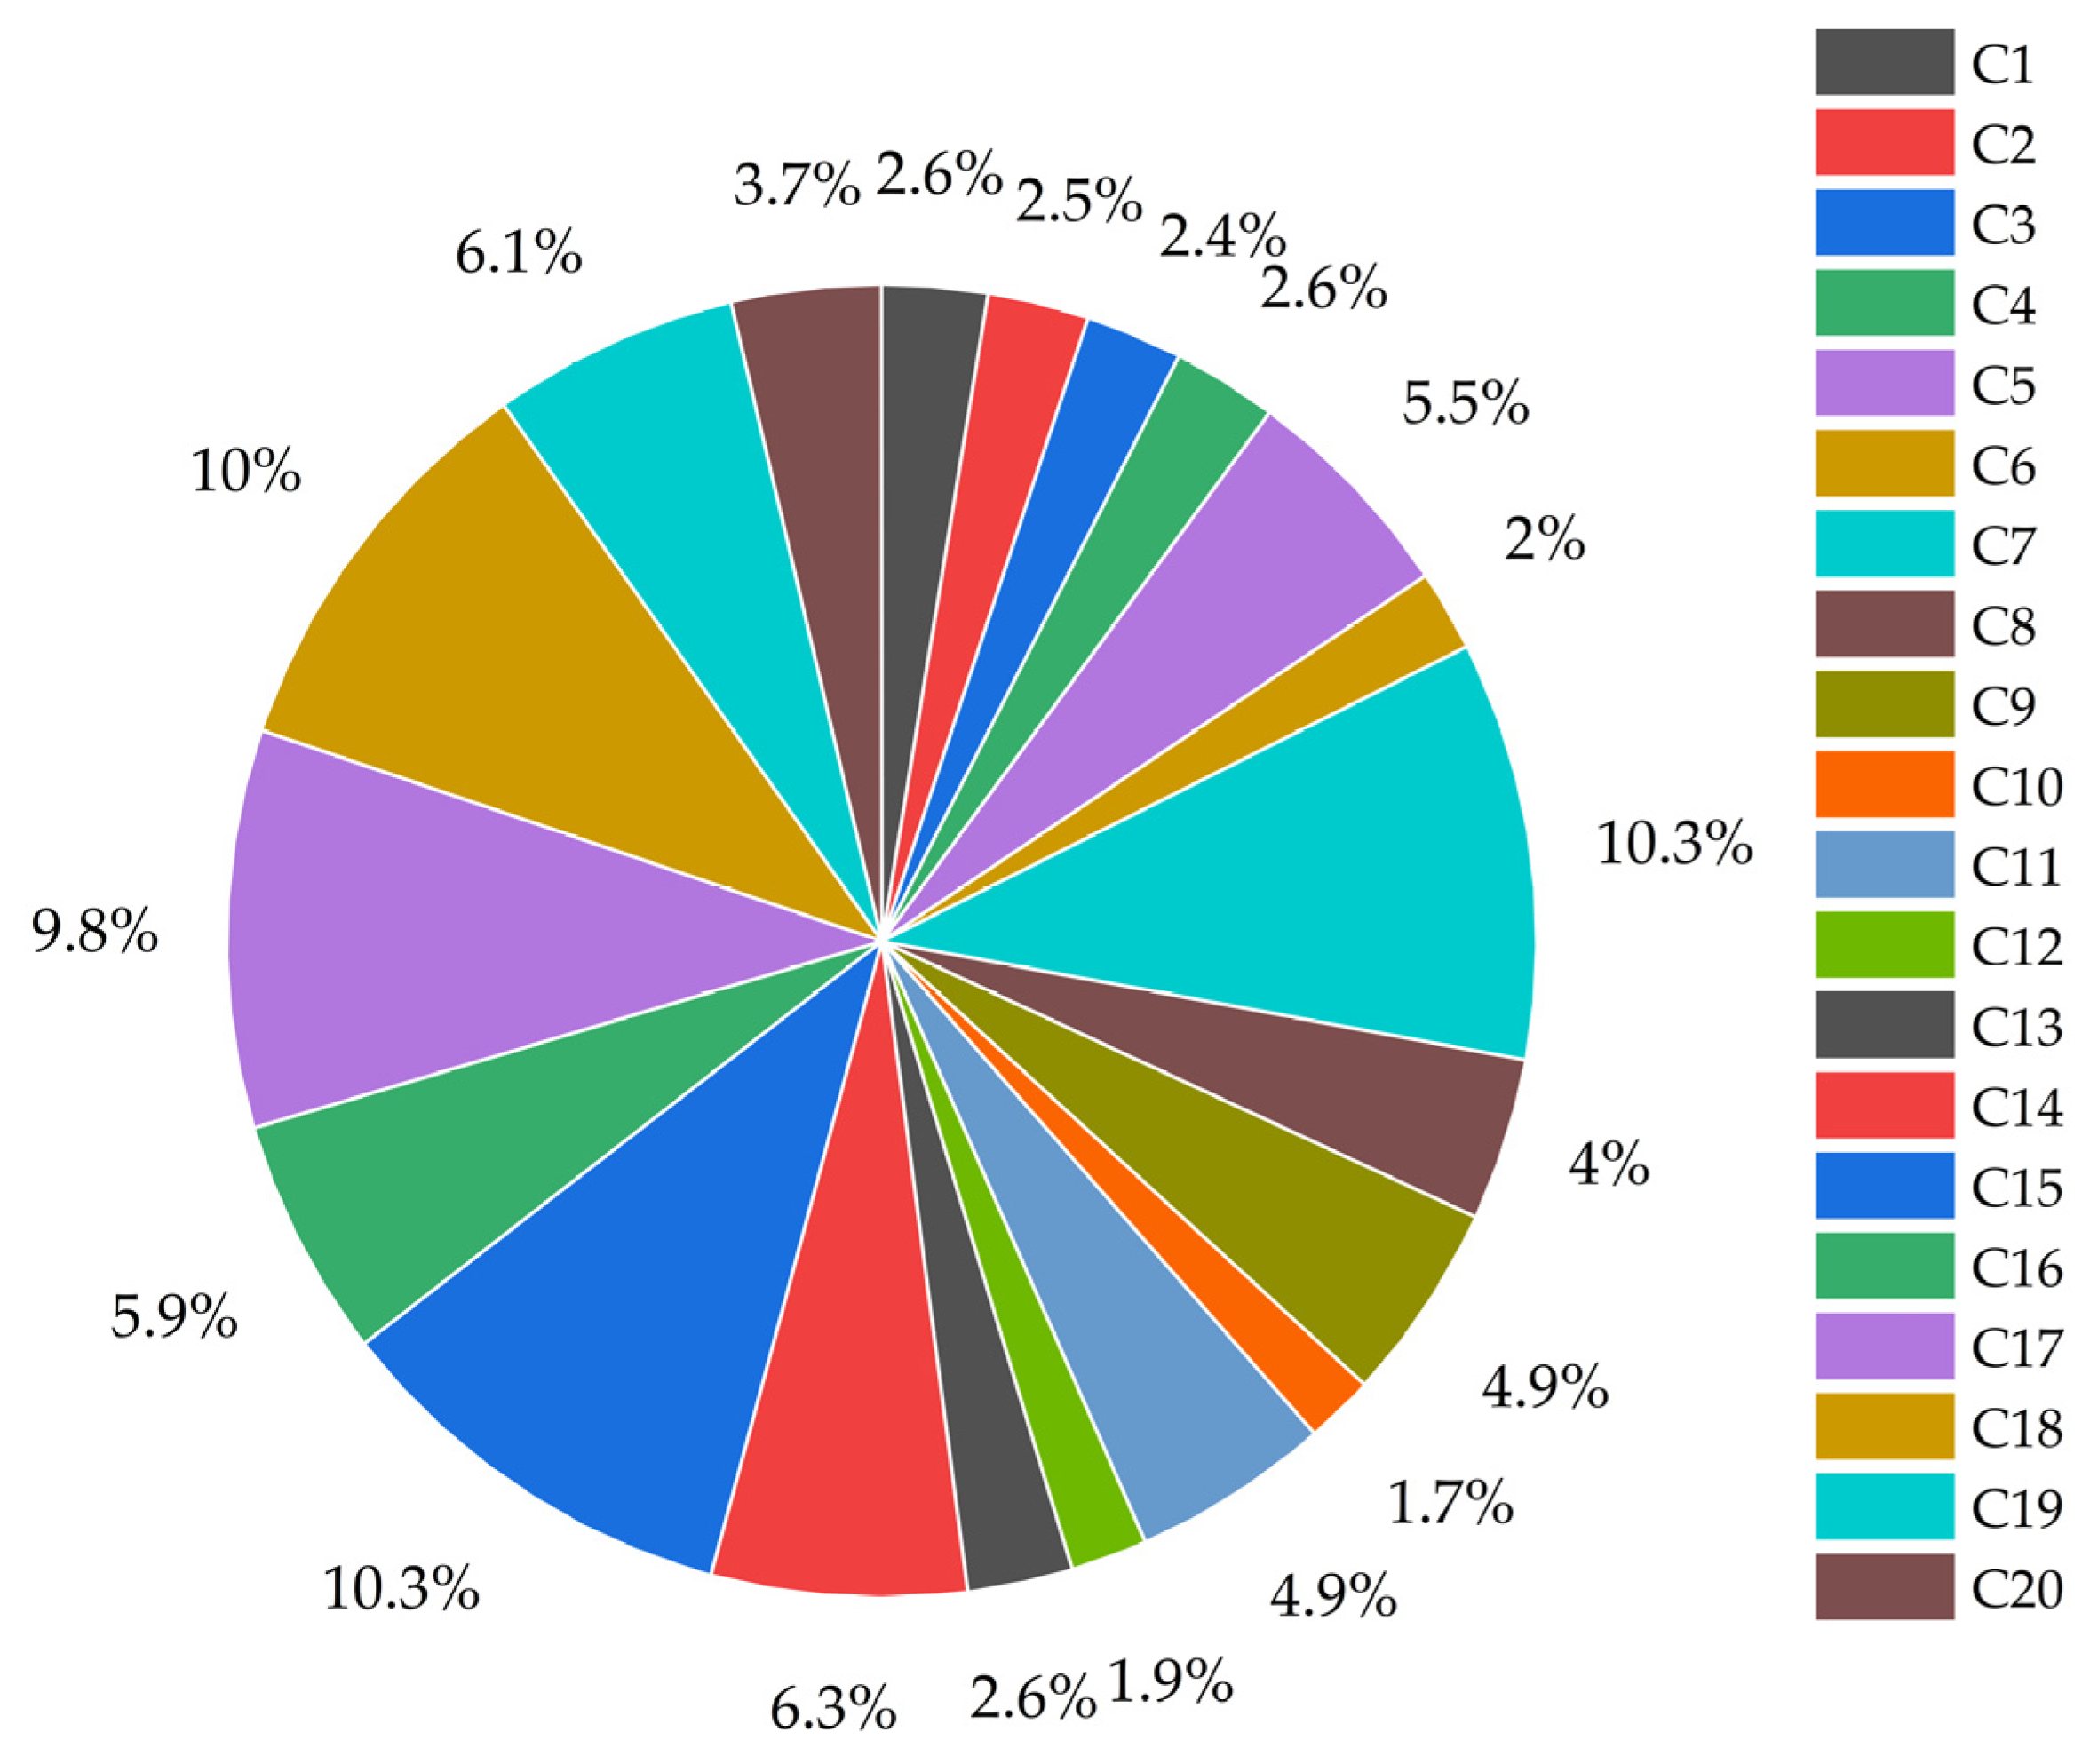
According to the PP-AHP weighting results in Figure 6, among the water quality indicators, the annual urban water supply (c5) has the largest weight, 5.5%. Among the water consumption indicators, the urbanization level (c7) has the largest weight, 10.3%. The water quality impact indicators in the centralized drinking water source water quality standard rate (c15) accounted for the largest weight, 10.3%. The urbanization level and water supply of Harbin city are important factors affecting the carrying capacity of the water environment in the Harbin section of the Songhua River. The water quality of urban residential drinking water sources also supports the importance of studying the water quality and water environment capacity of a basin [65].

3.2.2. Analysis of Set-Pair Potential-Partial Linkage Number Results for PP-AHP Optimization

Table 3 below shows the results of the linkage number method with corresponding set-pair potential eigenvalues and ranks. The linkage coefficients show that the difference coefficients between the grades corresponding to the different eigenvalues for the next 10 years range between [0.24, 0.39], and the opposition coefficients range between [0.28, 0.52]. In the future, the overall grade dominance decreases and gradually changes from quasi 2 to minus 2.
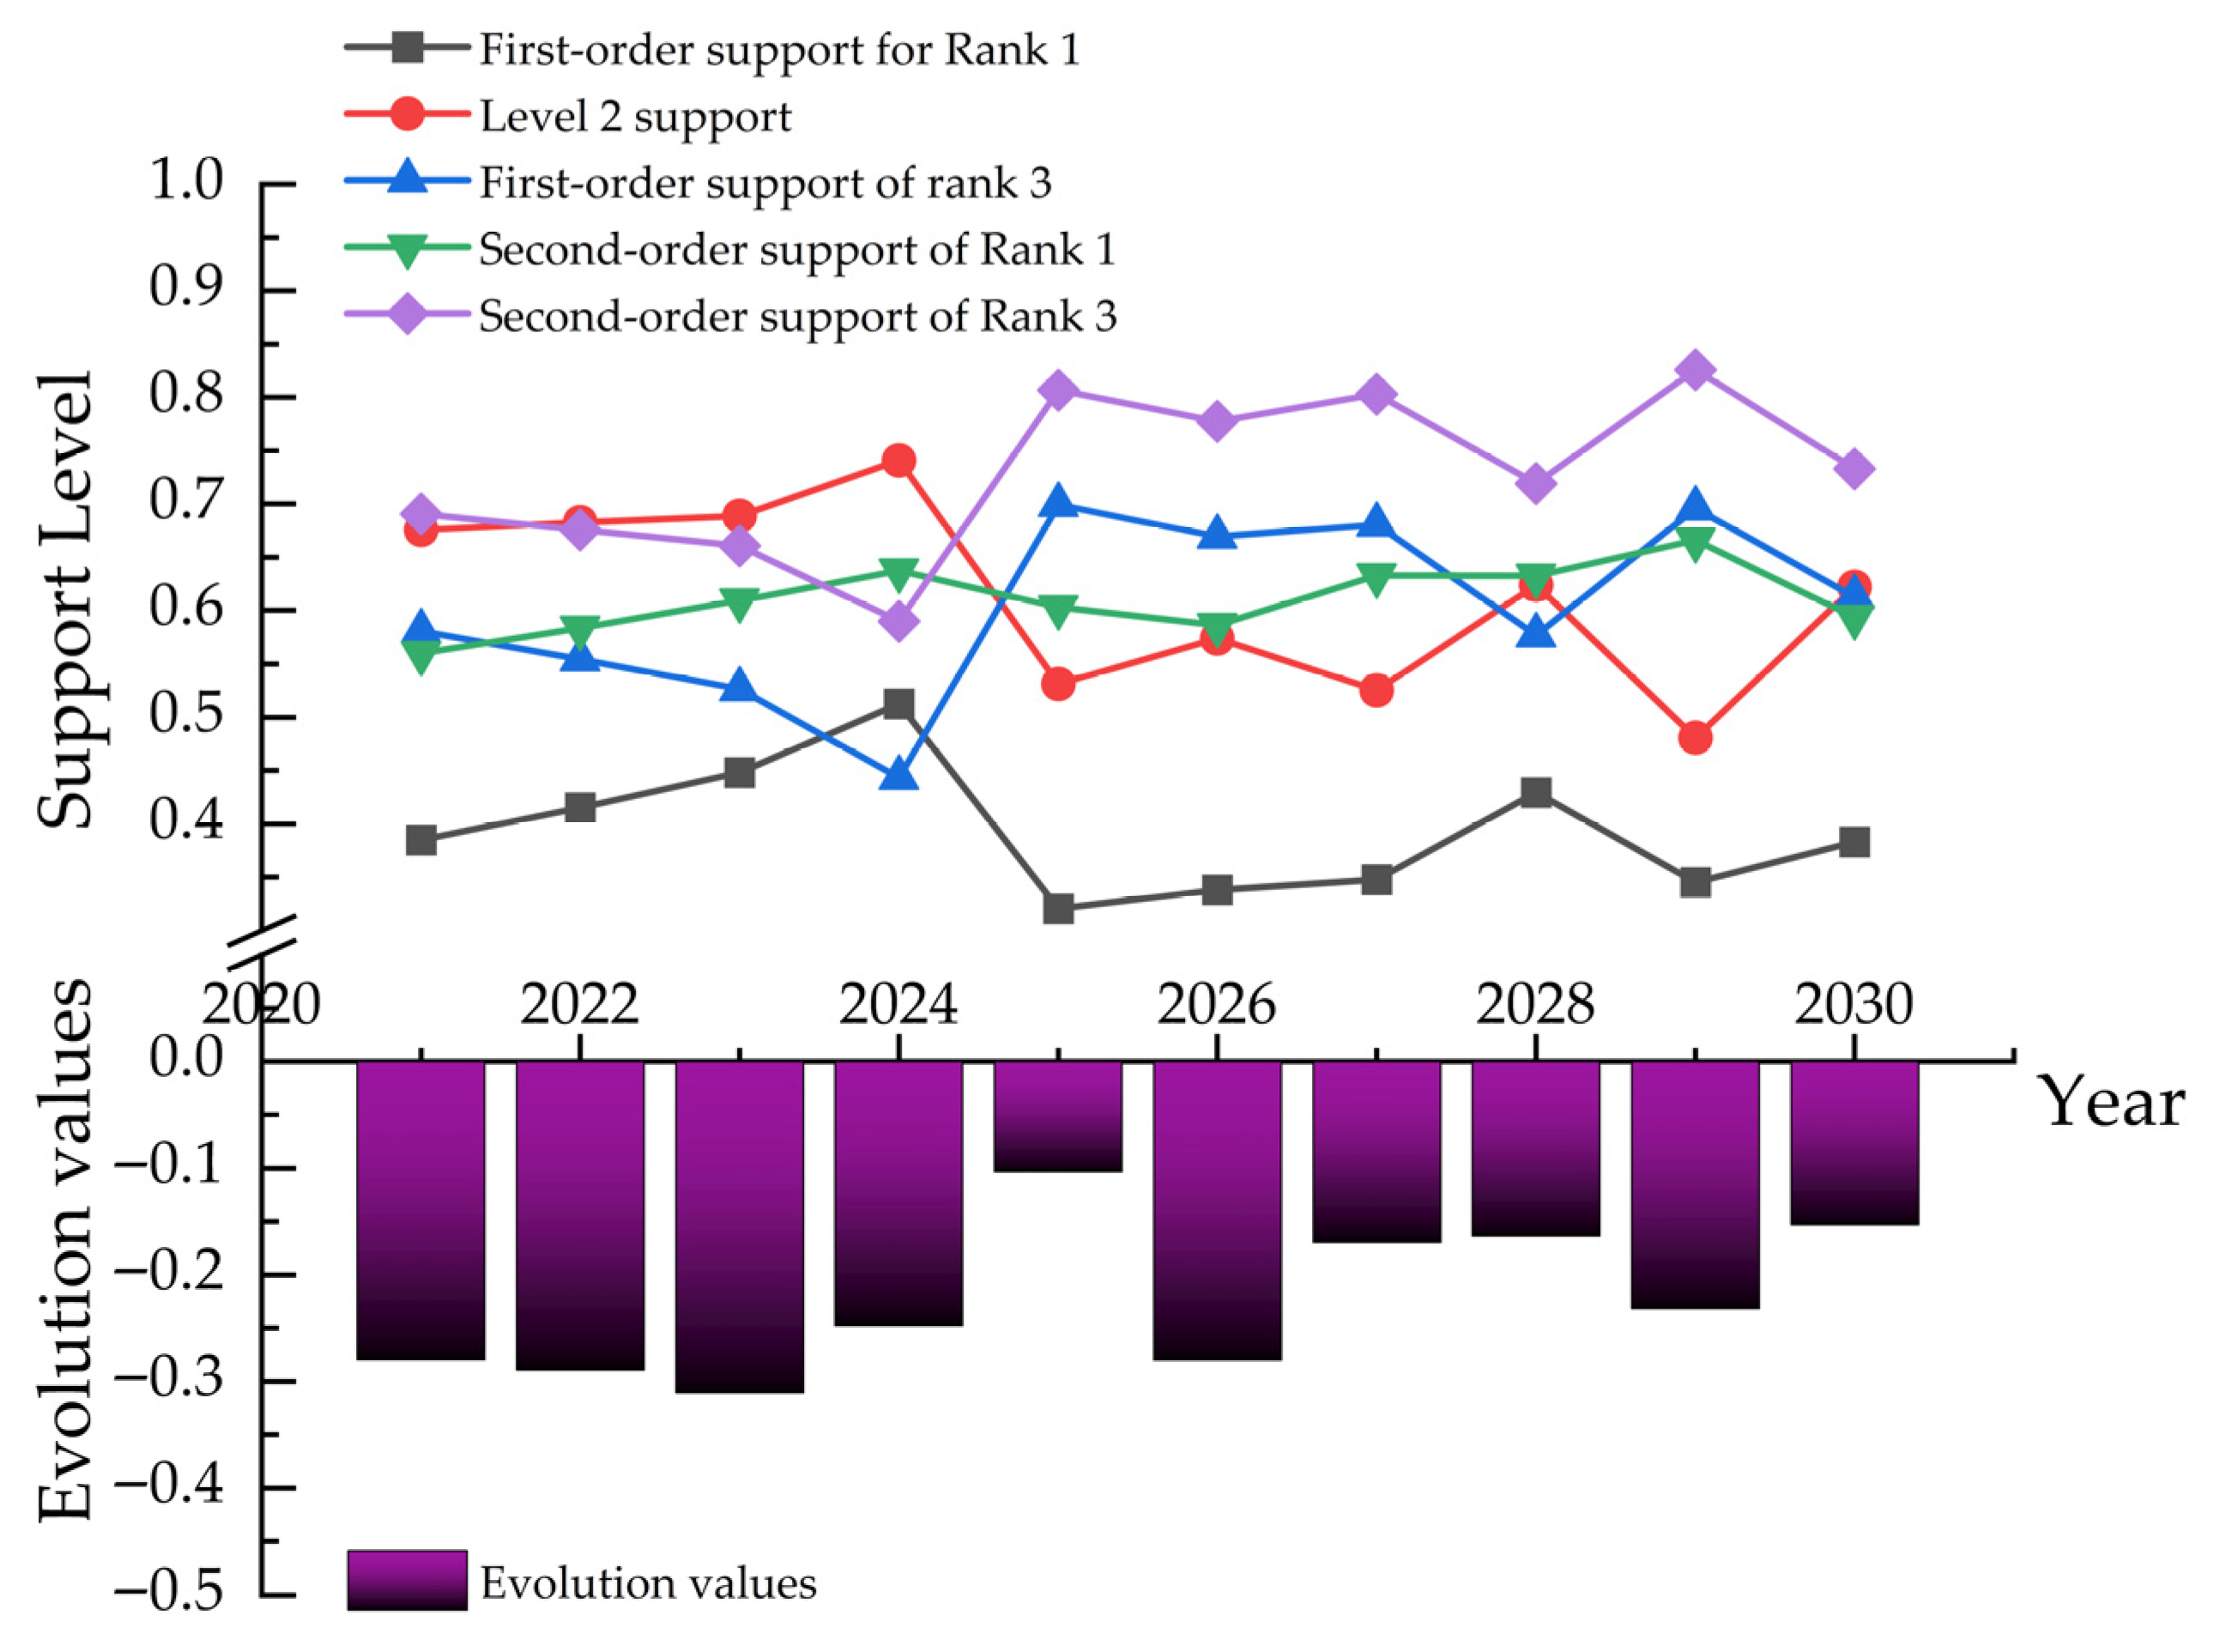
Based on the established evaluation and prediction system, the water environmental carrying capacity of the Harbin section of the Songhua River was assessed. As shown in Figure 7, the results were derived by integrating the principle of maximum support with the evolution of second-order bias linkage information. The dynamic evolution values were used as grading standards, with risk levels defined as: 1 (loadable), 2 (critical), and 3 (overloaded) [66].
The evaluation results show that from 2021 to 2024, the support degrees for levels 1 and 2 gradually increase, suggesting that the carrying capacity is improving—shifting from a critical to a loadable level. A more detailed analysis of level 2 indicates a clear upward trend during this period. However, starting in 2025, the support for level 3 (overloaded) rises sharply, indicating that the carrying capacity begins to decline due to specific damaging factors. At the same time, support for levels 1 and 2 shows a slow annual decrease. In the years following 2025, the support levels remain relatively stable, suggesting that the water environment carrying capacity may face persistent but undefined threats.

3.3. Joint Regulatory Mechanism of Broad and Narrow Water Environment Carrying Capacity Indicators

The data used to evaluate the water environmental carrying capacity in the broad sense and in the narrow sense were predicted and processed separately via the BP neural network time series prediction model to obtain the data for 2021–2030 (combine each of the six control sections with the six pollutant indicators in the form of a “section name-indicator” with codes c21–c56 are shown in Table S1). SPSS correlation was used to analyze the changes in each indicator factor associated with narrow and broad water environment carrying capacities [67]. An in-depth analysis was performed to determine the potential connection between the water environment carrying capacity indicator factors and the water environment capacity indicator factors [68]; the results are shown in Figure 8 below.
In the broad water environment carrying capacity indicator system, representative positive and negative indicators were selected to correlate with the pollutant indicators at the narrow water environment carrying capacity [69]. (A positive indicator shows that the larger the value of the indicator is, the better the carrying capacity of the water environment, and a negative indicator indicates that the larger the value of the indicator is, the worse the carrying capacity of the water environment).
The urban sewage discharge c13, a negative indicator of the water environment carrying capacity, is taken as an example. As shown in the figure, there are significant positive correlations between urban sewage discharge c13 and total nitrogen content c50 and total phosphorus content c56 in the Dadingzi mountain section, which are negative indicators of water environmental capacity. These findings suggest that high nutrient loads from domestic and industrial wastewater directly weaken water environment capacity, thereby constraining agricultural irrigation, drinking water safety, and industrial water use in downstream areas. High nitrogen and phosphorus discharges near factories and enterprises should therefore be strictly controlled. Similar conclusions were drawn by Chen et al., who demonstrated that nutrient-rich urban wastewater is a primary driver of capacity decline in heavily industrialized river sections [70]. The urban wastewater discharge (c13) was significantly negatively correlated with the total phosphorus content (c53) at the mouth of the Ash River, and the overall phosphorus content (c54) within the Hulan River was a negative indicator of water environmental capacity. It is necessary to coordinate and control the total phosphorus content in the urban watersheds of these two regions to maintain the carrying capacity of the urban water environment. For phosphorus control, targeted measures such as advanced phosphorus removal in municipal treatment plants, ecological interception ditches, and stricter effluent discharge limits are recommended to reduce urban point-source inputs. There was a significant negative correlation was observed between urban sewage discharge (c13) and dissolved oxygen concentration (c35) at the downstream section of the Ash River Estuary, a positive indicator within the water environmental capacity. This finding indicates that the focus should be on increasing the dissolved oxygen content in the lower section of the Ash River estuary. For example, cultivating more oxygen-producing aquatic plants and regularly treating silt at the bottom of a river can greatly enhance the carrying capacity of the urban water environment. There is no obvious positive correlation between urban sewage discharge c13 and dissolved oxygen content, which is a positive indicator in the water environment capacity index system.
The positive indicator in the water environment carrying capacity indicator system-industrial wastewater discharge compliance rate c18 is taken as an example. As shown in the figure, the industrial wastewater discharge compliance rate c18 is significantly positively correlated with the ammonium nitrogen content c30 in the Hulan River, which is a negative indicator of water environmental capacity. Therefore, we should focus on coordinating the ammonium nitrogen content in the Hulan River cross-sectional basin with the wastewater discharge from nearby industrial areas to maintain a good balance between wastewater discharge and pollutant content in wastewater. The compliance rate of industrial wastewater discharge c18 was significantly negatively correlated with the ammonium nitrogen content c31 in the Hulan River estuary and the permanganate content c44 in the Dadingzi mountain cross-sectional basin; these variables are negative indicators of the water environment capacity. This finding indicates that it is necessary to strictly reduce wastewater discharge from industries near the two cross-sectional areas and strengthen wastewater purification facilities. The industrial wastewater discharge compliance rate c18 was negatively correlated with the positive indicator in the water environment capacity indicator system, the dissolved oxygen content c33 in the Zhushuntun section. This finding indicates that the dissolved oxygen content in the urban watershed near the Zhushuntun section should be coordinated and controlled to maintain the carrying capacity of the urban water environment. There is no significant correlation between the industrial wastewater discharge compliance rate c18 and the dissolved oxygen content of other sections in the water environment capacity indicator system. These results are in line with prior research indicating that dissolved oxygen enhancement near urbanized river stretches is a critical driver for sustaining carrying capacity [71].

4. Conclusions

(1) Predictions of the water environment carrying capacity should consider water quality, water environment capacity influencing factors and fusion information evolution. From the different perspectives of subjects and objects, the water environment carrying capacity of the Harbin section of the Songhua River has been studied more specifically, deeply, and quantitatively. The results of the water quality evaluation based on the Nemerow pollution index method showed that the water quality of the Harbin section of the Songhua River has not yet reached the national water quality standards for functional areas. Furthermore, the Ash River demonstrates the most significant deviation from its target quality. The key contributors to water quality deterioration upstream include persistent inputs of organic pollutants from industrial wastewater and the continuous increase in domestic sewage, highlighting unresolved structural pollution and ineffective pollutant discharge reduction. These issues necessitate prioritized and targeted intervention.
(2) The results of the two-dimensional bank discharge model based on water environmental capacity show that there is remaining environmental capacity in the basin of the mainstream region of the Harbin section of the Songhua River, but most of the remaining capacity is concentrated below the mouth of the Ash River and in the Hulan River. The remaining capacity mostly occurs in the section of the river far from the city and is concentrated in the abundant and flat water periods, especially in the dry water period, when the Songhua River basin has almost no capacity. This feature is typical of rivers in cold northern regions. Moreover, urban watersheds increasingly face intensified surface runoff pollution and diversification of contaminant types. These trends call for immediate enhancement of vegetative buffer zones and upgraded wastewater treatment infrastructure to curb diffuse and point source pollution.
(3) To enhance future water environmental carrying capacity, it is necessary to establish a multi-dimensional coordinated management system. Based on the correlation between pollutants and carrying capacity indicators, it is recommended to implement a ‘source-process-end’ full-chain governance strategy: 1. Strengthen industrial point-source control. Implement clean production audits in chemical industry clusters along the Ash River, require real-time total nitrogen and phosphorus monitoring, and introduce tiered environmental tax mechanisms for non-compliant enterprises. However, its effectiveness will depend on sustained regulatory enforcement and the willingness of enterprises to adopt advanced pollution control technologies. 2. Reinforce agricultural non-point source pollution control. Promote ecological interception ditches in the Hulan River basin, adopt soil-testing-based fertilizer application, and target zero growth in fertilizer and pesticide use by 2030. However, achieving this will require overcoming challenges such as farmers’ adoption willingness, variability in agricultural runoff under extreme weather. 3. Implement ecological river restoration. Carry out annual sediment dredging in dry seasons and restore submerged plant communities downstream of sensitive areas such as Dadingzi Mountain, while carefully managing risks of sediment resuspension and biodiversity imbalance. 4. Optimize water resource allocation. Deploy intelligent water management platforms to dynamically regulate water pressure and raise reclaimed water utilization from 35% to 60% by 2030; nonetheless, high investment demand and cross-departmental coordination are potential bottlenecks. 5. Implement a performance-based water quality agreement for the upstream and downstream reaches of the Songhua River (Harbin section), with a matching ecological compensation fund. The fund is co-financed by water consumption and pollution load for ecological restoration and pollution management; still, reconciling regional economic interests and governance differences will be a key challenge. Through the systematic implementation of these targeted measures, it is possible to effectively overcome the technical bottlenecks in enhancing the current carrying capacity, providing an operational solution for achieving fundamental improvements in water quality within the basin.

Supplementary Materials

The following supporting information can be downloaded at: https://www.mdpi.com/article/10.3390/su17177636/s1, Table S1: Control sections and pollutant indicators represented by codes c21~c56.

Author Contributions

Writing—original draft preparation and Figures, Z.Y.; Writing—original draft preparation and Editing, X.W.; Resources and Methodology, N.S.; Writing—review and Editing, T.W.; Methodology and Figures, H.Y. All authors have read and agreed to the published version of the manuscript.

Funding

This work was financially supported by the Open Project of the Key Laboratory of the Efficient Use of Agricultural Water Resources, Ministry of Agriculture and Rural Affairs of the People’s Republic of China in Cold Regions (No. AWR2021003). The School of Water Conservancy and Civil Engineering, Northeast Agricultural University is acknowledged.

Institutional Review Board Statement

Not applicable.

Informed Consent Statement

Not applicable.

Data Availability Statement

Data will be made available upon reasonable request.

Conflicts of Interest

The authors declare that they have no known competing financial interests or personal relationships that could have appeared to influence the work reported in this paper.

References

  1. Wang, T.-Z.; Jian, S.-Q.; Wang, J.-Y.; Yan, D.-H. Dynamic interaction of water–economic–social–ecological environment complex system under the framework of water resources carrying capacity. J. Clean. Prod. 2022, 368, 133132. [Google Scholar] [CrossRef]
  2. Jury, W.A.; Vaux, H.J. The Emerging Global Water Crisis: Managing Scarcity and Conflict Between Water Users. Adv. Agron. 2007, 95, 1–76. [Google Scholar]
  3. Song, W.-W.; Pang, Y. Research on narrow and generalized water environment carrying capacity, economic benefit of Lake Okeechobee, USA. Ecol. Eng. 2021, 173, 106420. [Google Scholar] [CrossRef]
  4. Wang, L.-T.; Zeng, W.-H.; Cao, R.-X.; Zhuo, Y.; Fu, J.; Wang, J.-P. Overloading risk assessment of water environment-water resources carrying capacity based on a novel Bayesian methodology. J. Hydrol. 2023, 622, 129697. [Google Scholar] [CrossRef]
  5. Sun, N.; Wang, T.-Y.; Qi, B.-W.; Yu, S.-J.; Yao, Z.-B.; Zhu, G.-L.; Fu, Q.; Li, C.-Y. Inhibiting release of phenanthrene from rice-crab coculture sediments to overlying water with rice stalk biochar: Performance and mechanisms. Sci. Total Env. 2024, 908, 168385. [Google Scholar] [CrossRef]
  6. Mei, P.; Li, M.; Zhang, Q.; Li, G.-L.; Song, L. Prediction model of drinking water source quality with potential industrial-agricultural pollution based on CNN-GRU-Attention. J. Hydrol. 2022, 610, 127934. [Google Scholar] [CrossRef]
  7. Lu, X.-X.; Zhang, Y.; Liu, Y.; Fan, Y.-F. Differences in planktonic and benthic diatoms reflect water quality during a rainstorm event in the Songhua River Basin of northeast China. Ecol. Indic. 2022, 144, 109547. [Google Scholar] [CrossRef]
  8. Zhang, Z.-Y.; Hörmann, G.; Huang, J.-L.; Fohrer, N. A grid-based interpretable machine learning method to understand the spatial relationships between watershed properties and water quality. Ecol. Indic. 2023, 154, 110627. [Google Scholar] [CrossRef]
  9. Sun, D.-T.; Barton, M.; Parker, M.; Sheng, Y.P. Estuarine water quality: One-dimensional model theory and its application to a riverine subtropical estuary in Florida. Estuar. Coast. Shelf Sci. 2022, 277, 108058. [Google Scholar] [CrossRef]
  10. Bui, H.H.; Ha, N.H.; Nguyen, T.N.D.; Nguyen, A.T.; Pham, T.H.H.; Jaya, K.; Tien, V.N. Integration of SWAT and QUAL2K for water quality modeling in a data scarce basin of Cau River basin in Vietnam. Ecohydrol. Hydrobiol. 2019, 19, 210–223. [Google Scholar] [CrossRef]
  11. Chen, Q.-W.; Tan, K.; Zhu, C.-B.; Li, R.-N. Development and application of a two-dimensional water quality model for the Daqinghe River Mouth of the Dianchi Lake. J. Env. Sci. 2009, 21, 313–318. [Google Scholar] [CrossRef]
  12. Tan, F.-F.; Lu, Z. Study on the interaction and relation of society, economy and environment based on PCA–VAR model: As a case study of the Bohai Rim region, China. Ecol. Indic. 2015, 48, 31–40. [Google Scholar] [CrossRef]
  13. Wu, H.-Y.; Chen, K.-L.; Chen, Z.-H.; Chen, Q.-H.; Qiu, Y.-P.; Wu, J.-C.; Zhang, J.-F. Evaluation for the ecological quality status of coastal waters in East China Sea using fuzzy integrated assessment method. Mar. Pollut. Bull. 2012, 64, 546–555. [Google Scholar] [CrossRef] [PubMed]
  14. Fu, Z.-H.; Zhang, Y.; He, S.-S.; Wang, H.; Jiang, X.; Wang, S.-H. Multi-objective programming for economy–energy–environment system and policy mix with dual constraints of carbon emission and water consumption based on multi-scenario analysis. Energy Rep. 2012, 8, 7884–7891. [Google Scholar] [CrossRef]
  15. Wang, Z.-Y.; Fu, X. Scheme simulation and predictive analysis of water environment carrying capacity in Shanxi Province based on system dynamics and DPSIR model. Ecol. Indic. 2023, 154, 110862. [Google Scholar] [CrossRef]
  16. Xu, L.; Wang, C.-X.; Ba, N.; Hao, Y. On the urban resource and environment carrying capacity in China: A sustainable development paradigm. J. Environ. Manag. 2023, 342, 118212. [Google Scholar] [CrossRef]
  17. Zhang, J.; Zhang, C.-L.; Shi, W.-L.; Fu, Y. Quantitative evaluation and optimized utilization of water resources-water environment carrying capacity based on nature-based solutions. J. Hydrol. 2019, 568, 96–107. [Google Scholar] [CrossRef]
  18. Wang, G.; Xiao, C.-L.; Qi, Z.-W.; Meng, F.-N.; Liang, X.-J. Development tendency analysis for the water resource carrying capacity based on system dynamics model and the improved fuzzy comprehensive evaluation method in the Changchun city, China. Ecol. Indic. 2021, 122, 107232. [Google Scholar] [CrossRef]
  19. Wang, B.-B.; Wang, Y.-Y.; Wang, S.-L. Improved water pollution index for determining spatiotemporal water quality dynamics: Case study in the Erdao Songhua River Basin, China. Ecol. Indic. 2021, 129, 107931. [Google Scholar] [CrossRef]
  20. Wang, Y.; Wang, P.; Bai, Y.-J.; Tian, Z.-X.; Li, J.-W.; Shao, X.; Mustavich, L.F.; Li, B.L. Assessment of surface water quality via multivariate statistical techniques: A case study of the Songhua River Harbin region, China. J. Hydro Env. Res. 2013, 7, 30–40. [Google Scholar] [CrossRef]
  21. Xie, Y.-Y.; Kang, C.-G.; Chi, Y.-P.; Wu, P.; Wei, Z.-Y.; Wang, J.-X.; Sun, L. Reversal of the middle-upper Songhua River in the late Early Pleistocene, Northeast China. Geomorphology 2020, 369, 107373. [Google Scholar] [CrossRef]
  22. Wang, S.-J.; Wang, Y.-J.; Ran, L.-S.; Su, T. Climatic and anthropogenic impacts on runoff changes in the Songhua River basin over the last 56years (1955–2010), Northeastern China. Catena 2015, 127, 258–269. [Google Scholar] [CrossRef]
  23. Bai, Y.-J.; Guo, R. The construction of green infrastructure network in the perspectives of ecosystem services and ecological sensitivity: The case of Harbin, China. Glob. Ecol. Conserv. 2021, 27, 101534. [Google Scholar] [CrossRef]
  24. Jia, Z.; Bian, J.-M.; Wang, Y. Impacts of urban land use on the spatial distribution of groundwater pollution, Harbin City, Northeast China. J. Contam. Hydrol. 2018, 215, 29–38. [Google Scholar] [CrossRef]
  25. Escher, B.I.; Aït-Aïssa, S.; Behnisch, P.A.; Brack, W.; Brion, F.; Brouwer, A.; Buchinger, S.; Crawford, S.E.; Pasquier, D.D.; Hamers, T.; et al. Effect-based trigger values for in vitro and in vivo bioassays performed on surface water extracts supporting the environmental quality standards (EQS) of the European Water Framework Directive. Sci. Total Environ. 2018, 628, 748–765. [Google Scholar] [CrossRef]
  26. Ji, Y.; Sun, W.; Liu, Y.; Liu, Q.-L.; Su, J.; Huang, G.-H.; Zhao, J. Inexact fuzzy-flexible left-hand-side chance-constrained programming for agricultural nonpoint-source water quality management. Sci. Total Environ. 2023, 854, 158565. [Google Scholar] [CrossRef]
  27. Yang, J.; Yu, Z.-B.; Yi, P.; Frape, S.K.; Gong, M.; Zhang, Y.-T. Evaluation of surface water and groundwater interactions in the upstream of Kui river and Yunlong lake, Xuzhou, China. J. Hydrol. 2020, 583, 124549. [Google Scholar] [CrossRef]
  28. Mamoon, A.A.; Keupink, E.; Rahman, M.M.; Eljack, Z.A.; Rahman, A. Sea outfall disposal of stormwater in Doha Bay: Risk assessment based on dispersion modelling. Sci. Total Environ. 2020, 732, 139305. [Google Scholar] [CrossRef]
  29. Ma, M.; Liu, S.; Su, M.; Wang, C.; Ying, Z.-A.; Huo, M.-X.; Lin, Y.-Z.; Yang, W. Spatial distribution and potential sources of microplastics in the Songhua River flowing through urban centers in Northeast China. Env. Pollut. 2022, 292, 118384. [Google Scholar] [CrossRef]
  30. Xu, L.; Chen, S.S. Coupling coordination degree between social-economic development and water environment: A case study of Taihu lake basin, China. Ecol. Indic. 2023, 148, 110118. [Google Scholar] [CrossRef]
  31. Li, X.-Y.; Pu, X.; Wang, W.-M.; Dong, X.; Zhang, Y.-H.; Wang, J.-J.; Wang, Y.-F.; Meng, M.-X. Surface water environmental carrying capacity and surface water quality based on economy-society-environment nexus—Evidence from China. Water Energy Nexus 2023, 6, 231–243. [Google Scholar] [CrossRef]
  32. Peng, J.-Y.; Tong, H.-J.; Liu, X.-C.; Feng, Y.; Zhu, Y.-M.; Wu, Y.; Chu, Z.-S.; Zheng, B.-H. Comprehensive evaluation of water resources and environmental carrying capacity based on dualistic water cycle analysis and its application in the Tuo River Basin, China. Ecol. Indic. 2023, 146, 109897. [Google Scholar] [CrossRef]
  33. Liu, B.; Xi, H.-J.; Hu, Y.; Liu, Z.; Li, T.-H.; Wen, Z.-Q. Impact of local environmental standards on water environmental carrying capacity in large water diversion project: A system dynamics analysis in Shandong, China. J. Clean. Prod. 2022, 362, 132423. [Google Scholar] [CrossRef]
  34. Zhou, X.-X.; Lei, K.; Meng, W.; Khu, S.T.; Zhao, J.; Wang, M.-N.; Yang, J.-F. Space-time approach to water environment carrying capacity calculation. J. Clean. Prod. 2017, 149, 302–312. [Google Scholar] [CrossRef]
  35. Bai, D.; Wang, T.; Li, C.-M.; Wang, W.-Q. mpact of coal energy development on the surrounding environmental water resources carrying capacity. Desalination Water Treat. 2024, 319, 10518. [Google Scholar] [CrossRef]
  36. Huang, A.; Tian, L.; Li, Y.-F.; Xiong, B.-Y.; Yu, J.-H.; Gao, Y.; Li, Q.; Fan, C.-J.; Liu, L.-X.-E.; Duan, X.-J.; et al. Regional complex system simulation optimization through linking governance and environment performance: A case study of water environmental carrying capacity based on the SDES model. Environ. Impact Assess. Rev. 2024, 104, 107356. [Google Scholar] [CrossRef]
  37. Peng, Y.-T.; Welden, N.; Renaud, F.G. A framework for integrating ecosystem services indicators into vulnerability and risk assessments of deltaic social-ecological systems. J. Environ. Manag. 2023, 326, 116682. [Google Scholar] [CrossRef]
  38. Jing, J.-Y.; Dai, C.-L.; Liu, G.-W.; Feng, X.; Wei, Y.-R.; Su, Q.-C. Analysis on the evolution law of precipitation and runoff in Sanjiang Plain: A case study of the lower Songhua River Basin. Res. Cold Arid. Reg. 2025; in press. [Google Scholar] [CrossRef]
  39. Murillas-Maza, A.; Broszeit, S.; Pouso, S.; Bueno-Pardo, J.; Ruiz-Frau, A.; Terrados, J.; Jernberg, S.; Iriondo, A.; Dolbeth, M.; Katsanevakis, S.; et al. Ecosystem indicators to measure the effectiveness of marine nature-based solutions on society and biodiversity under climate change. Nat. Based Solut. 2023, 4, 100085. [Google Scholar] [CrossRef]
  40. Lü, D.; Lü, Y. Spatiotemporal variability of water ecosystem services can be effectively quantified by a composite indicator approach. Ecol. Indic. 2021, 130, 108061. [Google Scholar] [CrossRef]
  41. Fuentes-Cortés, L.F.; Rodríguez-Gutiérrez, J.E.; Valencia-Márquez, D. The renewable energy–water–environment nexus analysis. In The Renewable Energy-Water-Environment Nexu; Elsevier: Amsterdam, The Netherlands, 2024; pp. 361–398. [Google Scholar]
  42. Song, D.-D.; Zhang, C.; Saber, A. Integrating impacts of climate change on aquatic environments in inter-basin water regulation: Establishing a critical threshold for best management practices. Sci. Total Environ. 2024, 913, 169297. [Google Scholar] [CrossRef]
  43. Wu, X.-L.; Zhang, Y. Coupling analysis of ecological environment evaluation and urbanization using projection pursuit model in Xi’an, China. Ecol. Indic. 2023, 156, 111078. [Google Scholar] [CrossRef]
  44. Wang, B.; Zhu, J.-W.; Gao, M.; Xie, J.-C.; Yang, L.; Lu, N.; Wang, B. Do the protection and harnessing of river systems promote the society, economy, and ecological environment of cities? A case study of Xi’an, China. Sustain. Cities Soc. 2023, 97, 104761. [Google Scholar] [CrossRef]
  45. Bilalova, S.; Newig, J.; Tremblay-Lévesque, L.C.; Roux, J.; Herron, C.; Crane, S. Pathways to water sustainability? A global study assessing the benefits of integrated water resources management. J. Environ. Manage. 2023, 343, 118179. [Google Scholar] [CrossRef] [PubMed]
  46. Han, M.; Liu, Y.; Du, H.; Yang, X.-Y. Advances in Study on Water Resources Carrying Capacity in China. Procedia Env. Sci. 2021, 2, 1894–1903. [Google Scholar]
  47. Ba, W.-X.; Wang, D.-J.; Gong, B.-H.; Dai, Y.-H.; Yang, Z.-P.; Liu, Z.-F. Urban water scarcity in China: A systematic review of research advances and future directions. Appl. Geogr. 2023, 159, 103069. [Google Scholar] [CrossRef]
  48. Zhang, M.; Liu, Y.-M.; Wu, J.; Wang, T.-T. Index system of urban resource and environment carrying capacity based on ecological civilization. Environ. Impact Assess. Rev. 2018, 68, 90–97. [Google Scholar] [CrossRef]
  49. GB3838-2002; Environmental Quality Standards for Surface Water. Ministry of Ecology and Environment of the People’s Republic of China: Beijing, China, 2002.
  50. Gómez-Llanos, E.; Durán-Barroso, P.; Matías-Sánchez, A. Management effectiveness assessment in wastewater treatment plants through a new water footprint indicator. J. Clean. Prod. 2018, 198, 463–471. [Google Scholar] [CrossRef]
  51. Wei, C.; Dai, X.-Y.; Ye, S.-F.; Guo, Z.-Y.; Wu, J.-P. Prediction analysis model of integrated carrying capacity using set pair analysis. Ocean. Coast. Manag. 2016, 120, 39–48. [Google Scholar] [CrossRef]
  52. Zhang, Y.-J.; Hao, J. The evaluation of environmental capacity: Evidence in Hunan province of China. Ecol. Indic. 2016, 60, 514–523. [Google Scholar] [CrossRef]
  53. Wei, Y.-G.; Huang, C.; Lam, P.T.I.; Yuan, Z. A review on urban carrying capacity assessment. Habitat. Int. 2015, 46, 64–71. [Google Scholar] [CrossRef]
  54. Kılkış, S.; Krajačić, G.; Duić, N.; Rosen, M.A.; Al-Nimr, M.A. Sustainable development of energy, water and environment systems in the critical decade for climate action. Energy Convers. Manag. 2015, 296, 117644. [Google Scholar] [CrossRef]
  55. Tian, P.; Wu, H.-Q.; Yang, T.-T.; Jiang, F.-L.; Zhang, W.-J.; Zhu, Z.-L.; Yue, Q.-M.; Liu, M.-X.; Xu, X.-Y. Evaluation of urban water ecological civilization: A case study of three urban agglomerations in the Yangtze River Economic Belt, China. Ecol. Indic. 2021, 123, 107351. [Google Scholar] [CrossRef]
  56. Cheng, Y.-X.; Wu, D.-S.; Bian, Y. A systematic approach of determining compensation and allocation for river basin water environment based on total pollutants control. J. Environ. Manag. 2020, 271, 110896. [Google Scholar] [CrossRef] [PubMed]
  57. Steiniger, S.; Wagemann, E.; Barrera, F.; Molinos-Senante, M.; Villegas, R.; Fuente, H.; Vives, A.; Arce, G.; Herrera, J.C.; Carrasco, J.A.; et al. Localising urban sustainability indicators: The CEDEUS indicator set, and lessons from an expert-driven process. Cities 2020, 101, 102683. [Google Scholar] [CrossRef]
  58. Juwana, I.; Muttil, N.; Perera, B.J.C. Indicator-based water sustainability assessment—A review. Sci Total Env. 2012, 438, 357–371. [Google Scholar] [CrossRef] [PubMed]
  59. Galvis, A.; Zambrano, D.A.; Steen, N.P.; Gijzen, H.J. Evaluation of pollution prevention options in the municipal water cycle. J. Clean. Prod. 2024, 66, 599–609. [Google Scholar] [CrossRef]
  60. Wang, K.; Huang, H.; Deng, J.; Zhang, Y.-N.; Wang, Q. A spatio-temporal temperature prediction model for coal spontaneous combustion based on back propagation neural network. Energy 2024, 294, 130824. [Google Scholar] [CrossRef]
  61. Biswas, R.R.; Rahman, A. Development and application of regional urban water security indicators. Util. Policy 2023, 84, 101637. [Google Scholar] [CrossRef]
  62. Semenov, M.Y.; Semenov, Y.M.; Silaev, A.V.; Begunova, L.A. Assessing the Self-Purification Capacity of Surface Waters in Lake Baikal Watershed. Water 2019, 11, 1505. [Google Scholar] [CrossRef]
  63. Bui, L.T.; Pham, H.T.H. Linking hydrological, hydraulic and water quality models for river water environmental capacity assessment. Sci. Total Env. 2023, 857, 159490. [Google Scholar] [CrossRef] [PubMed]
  64. Wang, L.; Ma, S.; Liu, S.; Chen, Y.; Gao, W.; Zhang, Y. Study on Temporal and Spatial Distribution Characteristics of Biogenic Pollutant Fluxes in Ten Main Rivers Discharging into the Sea in Eastern China. Sustainability 2025, 17, 4239. [Google Scholar] [CrossRef]
  65. Nazer, N.; Chithra, K.; Bimal, P. Framework for the application of ecosystem services based urban ecological carrying capacity assessment in the urban decision-making process. Environ. Chall. 2023, 13, 100745. [Google Scholar] [CrossRef]
  66. Wu, Y.-X.; Jiang, L.-L.; Ouyang, X.-T.; Wang, Z.-L.; Jiang, Q.-X. Sustainable evaluation of the water footprint in Heilongjiang Province, China, based on correlation-matter element analysis. J. Clean. Prod. 2023, 408, 137231. [Google Scholar] [CrossRef]
  67. Feng, H.-L.; Liu, M.; Xu, M.-Y.; Zhang, M.-X.; Mo, L.; Chen, T.; Tan, X.-Y.; Liu, Z.-Y. Study on the integrated protection strategy of water environment protection: The case of Hainan Province of China. Env. Technol. Innov. 2021, 24, 101990. [Google Scholar] [CrossRef]
  68. Nie, T.-Z.; Gong, Z.-P.; Zhang, Z.-X.; Wang, T.-Y.; Sun, N.; Tang, Y.; Chen, P.; Li, T.; Yin, S.; Zhang, M.; et al. Irrigation Scheduling for Maize under Different Hydrological Years in Heilongjiang Province, China. Plants 2023, 12, 1676. [Google Scholar] [CrossRef]
  69. Sun, N.; Yao, Z.-B.; Xie, Y.-P.; Wang, T.-Y.; Yang, J.-Z.; Li, X.-Y.; Fu, Q. Sustainability Analysis of the Water Environment Carrying Capacity of Harbin City Based on an Optimized Set Pair Analysis Posture-Deviation Coefficient Method Evaluation Model. Water 2023, 15, 1575. [Google Scholar] [CrossRef]
  70. Chen, C.; Wen, Z.-G.; Wang, Y.-H. Nitrogen flow patterns in the food system among cities within urban agglomeration: A case study of the Pearl River Delta region. Sci. Total Environ. 2020, 703, 135506. [Google Scholar] [CrossRef]
  71. Ma, R.-C.; Chen, Z.; Wang, B.; Xu, C.; Jia, Z.-Z.; Li, L.; Hu, J.-T. Spatiotemporal variations and controlling mechanism of low dissolved oxygen in a highly urbanized complex river system. J. Hydrol. Reg. Stud. 2024, 52, 101691. [Google Scholar] [CrossRef]
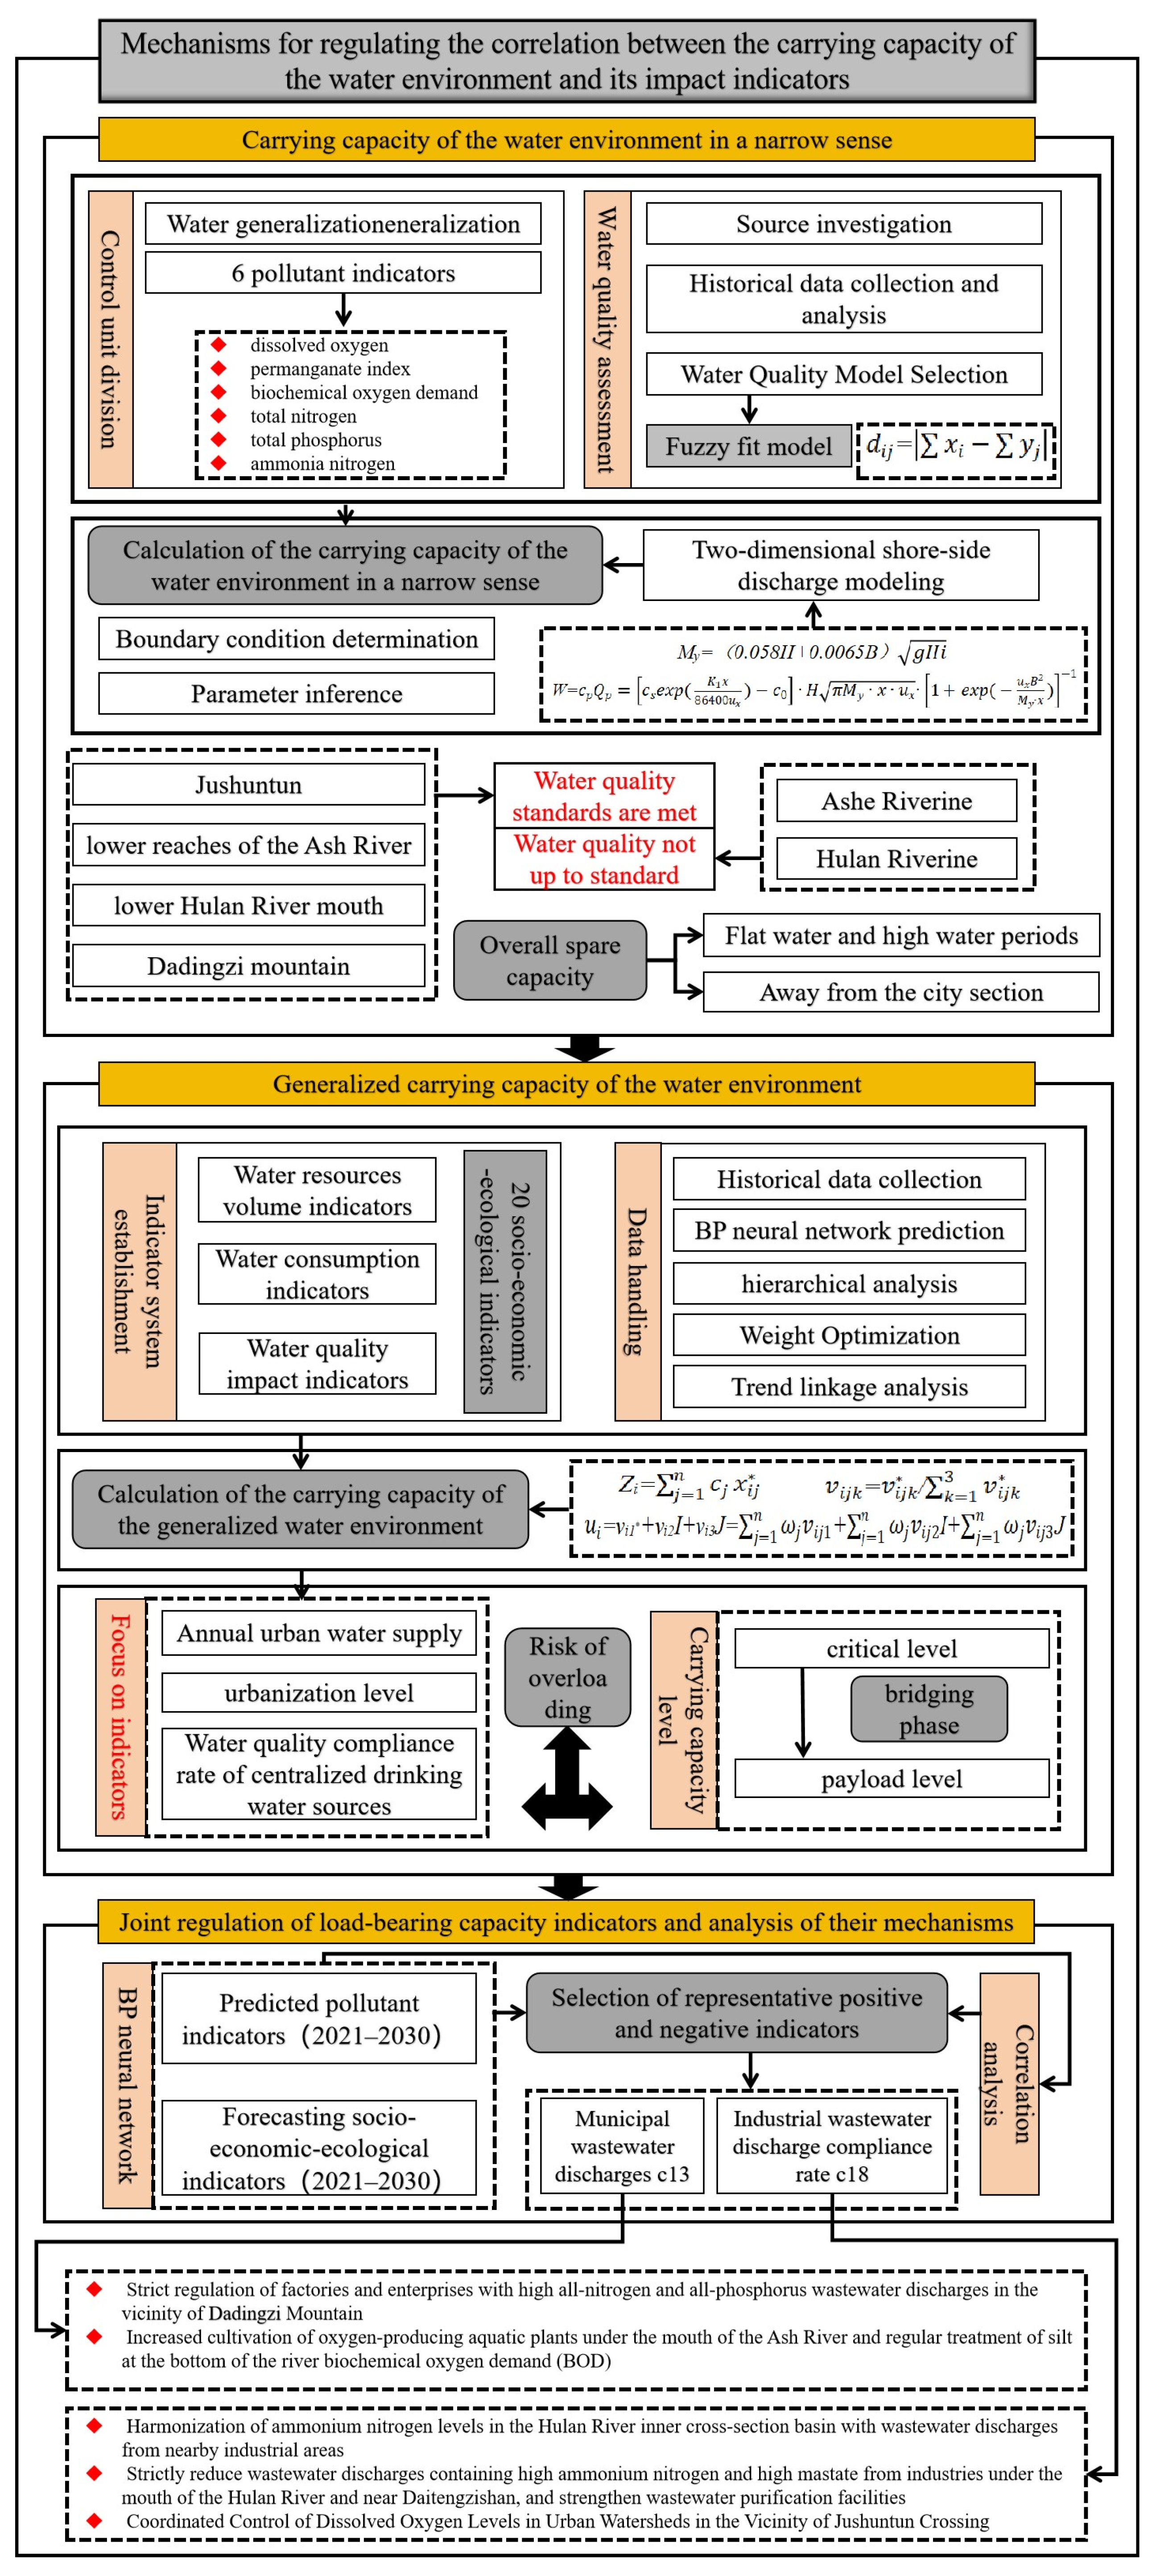
Figure 1. Research Flowchart.
Sustainability 17 07636 g001
Figure 2. An overview of the Songhua River Basin in Harbin City.
Sustainability 17 07636 g002
Figure 3. An indicator system for the carrying capacity of the water environment in a broad sense.
Sustainability 17 07636 g003
Figure 4. (a) The results of the fuzzy closeness method for water quality in the control section during the abundant water periods; (b) The results of the fuzzy closeness method for water quality in the control section during the normal water periods; (c) The results of the fuzzy closeness method for water quality in the control section during the dry water periods. Categories I–V correspond to the classification standards defined in Table 1.
Sustainability 17 07636 g004
Figure 5. Narrow-sense water environment carrying capacity values for each impact indicator.
Sustainability 17 07636 g005
Figure 6. PP-AHP weight shares. Indicators c1~c20 are shown in Figure 2.
Sustainability 17 07636 g006
Figure 7. Support and evolutionary trends.
Sustainability 17 07636 g007
Figure 8. Heatmap of indicator correlations.
Sustainability 17 07636 g008
Table 1. Environmental quality standards for surface water (GB3838-2002) (mg/L).
Water Quality IndicatorsIIIIIIIVV X ¯ i
Dissolved oxygen7.565324.7
Permanganate index24610157.4
Biochemical oxygen demand3346105.2
Total nitrogen0.20.51.01.52.01.04
Total phosphorus0.020.10.20.30.40.204
Ammonia nitrogen0.150.511.52.01.03
Note: Based on the environmental functions and protection objectives of surface water bodies, surface water is classified into five categories in descending order of functional priority. I: Primarily applicable to sources of drinking water and national nature reserves; II: Mainly applicable to the first-grade protection zones of centralized drinking water sources, habitats of rare aquatic organisms, spawning grounds for fish and shrimp, and feeding grounds for fry and juvenile fish; III: Primarily applicable to the second-grade protection zones of centralized drinking water sources, overwintering grounds for fish and shrimp, migration corridors, aquaculture areas, and recreational waters designated for swimming; IV: Mainly applicable to general industrial water use and recreational waters where there is no direct human contact; V: Primarily applicable to agricultural water use and water bodies with general landscape requirements. The average value X ¯ i is calculated as the arithmetic mean of Classes I–V and is used solely for model normalization and parameterization in subsequent analyses, rather than for direct water quality classification.
Table 2. Correspondence between set-pair potential eigenvalues and ranks.
PosturesSELevel
Homotopy[1.0, 1.4]Quasi 1
Partial isotropy(1.4, 1.8]Bias positive 2
Homogeneous potential(1.8, 2.2]Quasi 2
Partial antipathy(2.2, 2.6]Bias minus 2
Countertrend(2.6, 3.0]Quasi 3
Table 3. Set pair of potential eigenvalues.
YearContact NumberSELevel
20210.24+0.369I+0.391J2.151190386Quasi 2
20220.262+0.368I+0.37J2.108041479Quasi 2
20230.288+0.364I+0.348J2.060940913Quasi 2
20240.334+0.386I+0.281J1.946995856Quasi 2
20250.203+0.279I+0.518J2.315210071Bias minus 2
20260.213+0.305I+0.483J2.269849672Bias minus 2
20270.225+0.271I+0.505J2.279660537Bias minus 2
20280.28+0.321I+0.399J2.119063574Quasi 2
20290.228+0.243I+0.53J2.302087332Bias minus 2
20300.243+0.33I+0.427J2.183602842Quasi 2
Disclaimer/Publisher’s Note: The statements, opinions and data contained in all publications are solely those of the individual author(s) and contributor(s) and not of MDPI and/or the editor(s). MDPI and/or the editor(s) disclaim responsibility for any injury to people or property resulting from any ideas, methods, instructions or products referred to in the content.