Article

Multi-Dimensional Accessibility Framework for Nursing Home Planning: Insights from Kunming, China

1
School of Architecture and Planning, Yunnan University, Kunming 650500, China
2
State Key Laboratory of Urban and Regional Ecology, Research Center for Eco-Environmental Sciences, Chinese Academy of Sciences, Beijing 100085, China
3
Department of Global Architecture, Graduate School of Engineering, Osaka University, Suita, Osaka 565-0871, Japan
4
Institute for Smart City of Chongqing University in Liyang, Chongqing University, Liyang 213300, China
5
Key Laboratory of New Technology for Construction of Cities in Mountain Area, Ministry of Education, Chongqing University, Chongqing 400045, China
*
Author to whom correspondence should be addressed.
Sustainability 2025, 17(17), 7606; https://doi.org/10.3390/su17177606
Submission received: 15 July 2025 / Revised: 12 August 2025 / Accepted: 20 August 2025 / Published: 23 August 2025
(This article belongs to the Section Health, Well-Being and Sustainability)

Abstract

Rapid population aging in developing countries has intensified demand for accessible nursing home services, yet spatial disparities in service distribution remain insufficiently examined in secondary cities. This study investigates spatial distribution and multi-dimensional accessibility of nursing homes in Kunming, China, using comprehensive spatial analytical methods to inform sustainable urban development. We analyzed 205 nursing homes with 47,600 beds, evaluating spatial distribution patterns, economic accessibility, and spatial accessibility across different transportation modes. Our analysis reveals a pronounced monocentric pattern with nursing resources concentrated within central urban districts, creating a “primary core-multiple satellite” structure and spatial mismatch between service supply and older adult population needs. A distinct institutional dichotomy exists between publicly and privately operated facilities, establishing a dual-track system with different accessibility implications for social equity. Economic accessibility analysis demonstrates significant barriers in central urban and tourism-oriented districts dominated by higher-priced private facilities, where minimum prices frequently exceed average monthly pension. Spatial accessibility remains inadequate across all transportation modes, with only 24.3% of communities achieving normal or higher accessibility via private car, 21.5% via public bus, and merely 13.9% via walking. These limitations primarily stem from insufficient service capacity (34 beds per 1000 older adults) relative to demographic needs rather than transportation constraints. We recommend three sustainable interventions: implementing demand-based planning mechanisms, establishing progressive pricing policies, and developing older adult-friendly transportation networks. This framework supports sustainable urbanization by promoting spatial equity and efficient resource allocation, providing valuable insights for secondary cities pursuing sustainable development goals.

1. Introduction

Population aging has become a significant global demographic phenomenon, with China experiencing particularly rapid aging due to its unique demographic trajectory. According to the National Bureau of Statistics of China, the population aged 60 and above reached 296.97 million in 2023, accounting for 21.1% of the total population, marking China’s entry into a moderately aged society [1]. Projections indicate that by 2030, China will transition into an “ultra-aged society” [2]. Unlike developed countries, China’s aging process has been accelerated by nearly four decades of the one-child policy [3]. Furthermore, significant disparities in economic development between rural and urban areas, as well as between eastern and western regions, have created uneven aging patterns across the country [4].
Secondary cities in rapidly aging societies often serve as regional centers that face unique challenges in balancing demographic transitions with infrastructure development. These cities frequently emerge as retirement destinations due to factors such as favorable climate conditions, lower costs of living compared to major metropolitan areas, and cultural amenities. This positioning creates distinctive older adult care landscapes where local aging patterns intersect with significant influxes of non-local older residents seeking retirement amenities, generating complex and spatially differentiated demands for older adult care services.
Ensuring equitable access to care services is essential for addressing social disparities among older adult populations [5]. The spatial distribution and accessibility of care services crucially determines whether all communities, particularly underserved ones, can reach essential health and support resources [6]. Understanding these patterns allows for identifying service gaps, optimizing facility locations to effectively serve diverse older adult populations, and informing policies that promote more inclusive and accessible care systems [7].
The sustainable development of aging societies requires comprehensive approaches that balance social equity, environmental considerations, and economic viability in older adult care provision. The United Nations Sustainable Development Goals (SDGs) [8], particularly SDG 3 (Good health and well-being), SDG 10 (Reduced inequalities), and SDG 11 (Sustainable cities and communities), emphasize the importance of ensuring inclusive and equitable access to healthcare services while promoting sustainable urbanization patterns. However, achieving these sustainability goals in practice requires addressing concrete challenges in nursing home distribution and accessibility. Current nursing home development in Chinese cities faces spatial mismatches between facility locations and demographic needs, economic barriers limiting access for vulnerable populations, and transportation connectivity issues that affect service utilization. Understanding these practical challenges through spatial analysis provides essential insights for developing sustainable and equitable older adult care systems.
To address these challenges, current research on older adult care facilities has revealed significant spatial disparities across various international contexts. Studies in China [9] and the United States [10] have demonstrated significant urban–rural disparities in care facility distribution. Research in rapidly developing countries has highlighted unique challenges in care facility planning. Market-driven development often creates spatial mismatches between facility locations and population needs [11]. For instance, research studies [12,13] simulated older adult care facility demands in Shanghai, revealing significant gaps between actual demand and supply capacity, particularly in suburban areas. Studies using cluster analysis, spatial heat maps, and the average nearest neighbor index have analyzed the distribution of older adult care facilities in Shanghai, finding significant concentration differences between central and suburban areas [14,15]. Research has also demonstrated that private facilities tend to be more concentrated in urbanized areas compared to public facilities, while public facilities face challenges in high-demand, high-price areas [16].
Healthcare accessibility research has evolved from simple distance-based measures to sophisticated spatial analysis methods through progressive methodological refinements [17]. Early accessibility studies primarily relied on Euclidean distance measurements and basic catchment areas to assess facility availability, often treating all facilities equally regardless of capacity or service quality. Subsequently, more recent research has advanced toward time-based accessibility measures incorporating road networks and public transportation systems to better reflect actual travel patterns [18,19,20]. The 2SFCA method has been widely applied in accessibility evaluation, with various enhancements developed over time [21]. Among them, the Gaussian 2SFCA, which was first introduced by Dai [22], incorporates a distance decay function, resulting in more realistic, continuous, and differentiated assessments of accessibility. Researchers have applied this method to analyze older adult care facility accessibility in various Chinese cities, including Beijing [23], Wuhan [24], and Jinan [25], as well as international contexts such as Belgium [26], Victoria [27], Michigan [28], and Chicago [29].
Despite these methodological advances and diverse applications, nursing home accessibility research exhibits several key limitations. Healthcare accessibility research has established multiple dimensions including spatial access, economic barriers, and service availability [30], with international studies consistently showing rural–urban disparities across diverse contexts [31]. Nursing home accessibility research specifically has identified distance decay effects and significant spatial inequalities [32,33,34], with low-income older adult populations experiencing disproportionate access barriers due to limited transportation options. However, existing studies have limited attention to comprehensive multi-modal accessibility analysis or systematic examination of equity implications across different socioeconomic groups. Moreover, few studies have addressed accessibility patterns across different facility types (public versus private) or examined the specific context of rapidly urbanizing developing countries where transportation infrastructure and demographic transitions present unique accessibility challenges.
Building on these methodological considerations, while older adults’ selection of nursing homes involves multiple considerations including service quality, cost, family proximity, and facility reputation, physical accessibility through transportation remains a fundamental constraint that determines the feasible choice set [35]. Unlike younger populations who may relocate for services, older adults typically prefer facilities within reasonable travel distance from their existing social networks and familiar environments [36]. Moreover, the progressive decline in mobility capabilities with aging makes transportation accessibility increasingly critical for maintaining family visits and social connections, which are essential for older adults’ psychological well-being and quality of life [37].
Transportation mode analysis is particularly relevant in the context of nursing home accessibility for several reasons. First, family members and friends constitute the primary visitors to nursing homes, and their travel convenience significantly influences facility selection [38]. Second, older adults often require medical transfers between nursing homes and hospitals, making transportation infrastructure crucial for emergency response and routine medical care [39]. Third, in many developing countries including China, older adults’ mobility is heavily constrained by limited private vehicle ownership and age-related physical limitations, making public transportation and walking accessibility critical factors in actual service utilization [40]. However, limited research has systematically examined how accessibility varies across different transportation modes and socioeconomic groups within rapidly urbanizing Chinese cities, particularly regarding equity implications of current spatial distributions.
As a rapidly aging city in southwest China, Kunming has established a network of nursing homes across its urban and rural areas to address growing care demands. This study addresses these research gaps by examining nursing home accessibility equity. The research seeks to answer three key questions:
  • How are nursing homes spatially distributed in relation to older adult population needs and what patterns exist across different facility types?
  • How does spatial accessibility vary across different transportation modes (walking, public transit, private vehicle) and geographic areas?
  • What are the equity implications of current accessibility patterns for different socioeconomic groups and community types?
By addressing these questions, this study contributes to understanding spatial equity in aging services and provides evidence for more equitable urban planning in rapidly urbanizing Chinese cities. This paper is structured as follows: Section 2 describes the study area, data, and analytical methods; Section 3 presents the results of spatial distribution, density, economic accessibility, and spatial accessibility analyses; Section 4 discusses findings and policy implications; Section 5 concludes with key contributions; and Section 6 addresses study limitations and future research directions.

2. Data and Methods

2.1. Research Framework

Based on the literature review presented in the introduction, this study employs a comprehensive analytical framework integrating spatial distribution analysis and multi-dimensional accessibility assessment. Our methodological selection addresses key limitations identified in previous studies: (1) we employ the Gaussian 2SFCA method rather than standard distance-based measures to incorporate both supply-demand ratios and distance decay effects, providing more realistic accessibility assessments; (2) we integrate facility capacity (bed numbers) into accessibility calculations to address critiques of earlier research that treated all facilities equally regardless of service provision capacity; and (3) we analyze accessibility across three transportation modes to capture the diverse mobility constraints of older adult populations, as recommended by studies examining older adult care accessibility in similar contexts.
Figure 1 illustrates the overall research framework, showing the relationships between data sources, analytical methods, and expected outcomes. The selection of three transportation modes (private car, public bus, and walking) for accessibility analysis reflects the diverse mobility patterns and constraints of older adult populations and their families. This framework enables comprehensive analysis of both spatial and service dimensions of accessibility while incorporating realistic travel behavior and capacity constraints.

2.2. Study Area

Kunming was selected as the case study due to its representative characteristics as a secondary city experiencing rapid demographic aging combined with retirement migration flows. Kunming, the capital of Yunnan Province in southwestern China, serves as the political, economic, and cultural center of the province. With its renowned “spring-like climate year-round,” pristine natural landscapes, and relatively lower cost of living compared to eastern metropolitan areas, Kunming has emerged as a premier destination for retirement migration and seasonal older adult residence in China. This status has created a distinctive older adult care landscape, where local aging patterns intersect with a significant influx of non-local old residents seeking retirement amenities. By 2023, the population aged 60 and above in Kunming reached 16.07% [41], which, while lower than in China’s eastern regions, represents a steadily increasing older adult population. When combined with the substantial number of seasonal and permanent older adult migrants from other provinces, this demographic pattern has generated complex and spatially differentiated demands for older adult care services across the city [42].
Kunming covers an area of 21,012.54 square kilometers and has a complex topography characterized by a high-plateau landscape, with most areas at elevations between 1500 and 2800 m above sea level. The city’s older adult population shows distinct spatial distribution patterns. Local older residents are predominantly concentrated in traditional residential areas within the central urban districts, particularly in Wuhua and Panlong districts where established communities provide familiar social networks. Meanwhile, retirement migrants tend to cluster in scenic areas such as Dianchi Lake surroundings, popular tourist destinations like the Western Hills, and newly developed residential complexes in Chenggong and southern Kunming that offer modern amenities and healthcare facilities. The city’s major tourist attractions, including Stone Forest (Shilin), Dianchi Lake scenic areas, and the historic city center, have influenced retirement settlement patterns and subsequently shaped demands for accessible nursing home services in these areas.
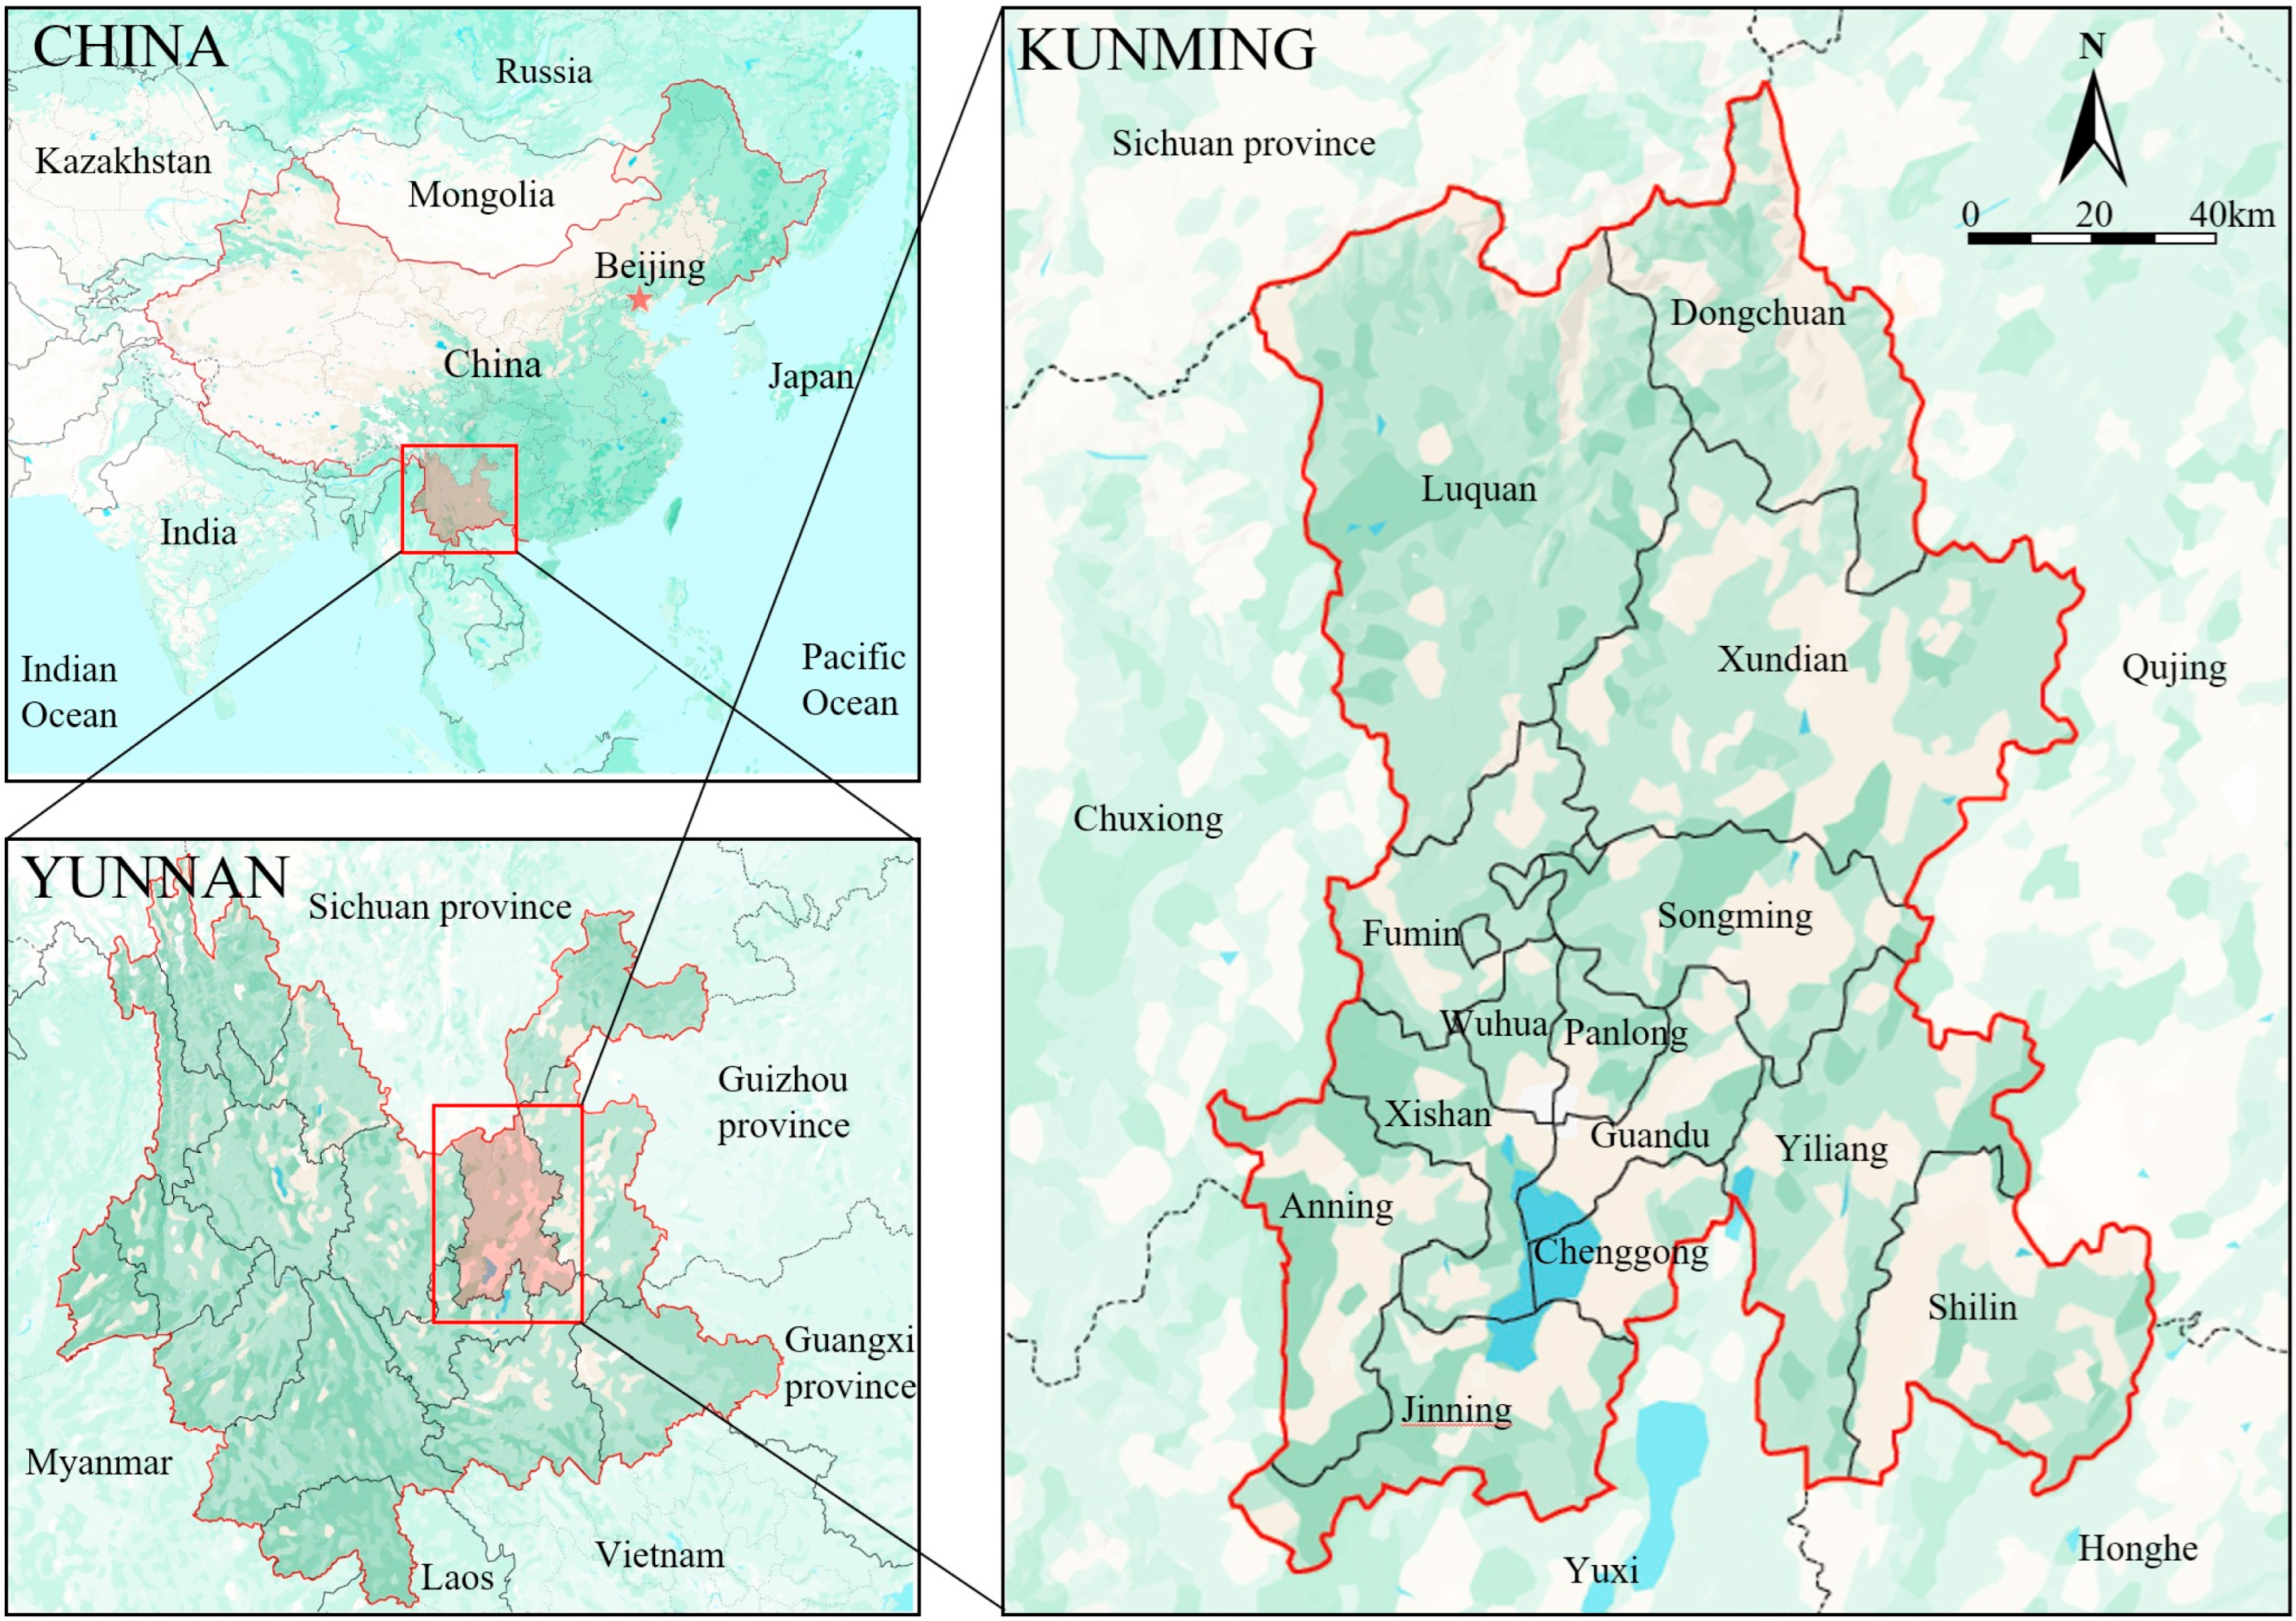
Administratively, Kunming consists of 4 central urban districts (Wuhua, Panlong, Xishan, and Guandu), 3 suburban districts (Chenggong, Jinning, and Dongchuan), 3 counties (Fumin, Yiliang, and Songming), 3 ethnic minority autonomous counties (Luquan, Shilin, and Xundian), and 1 county-level city (Anning). This administrative diversity provides an excellent setting for analyzing urban-rural disparities in older adult care service provision. The study area is shown in Figure 2.

2.3. Data Sources

This study integrates three complementary data categories—facility data, demographic data, and transportation network data—to comprehensively assess older adult care accessibility in Kunming for the year 2023.

2.3.1. Older Adult Care Facility Data

Comprehensive data on nursing homes were obtained from the Kunming Municipal Civil Affairs Bureau. This dataset includes crucial facility attributes such as geographic coordinates, bed capacity, service scope, and fee structures for all 205 nursing homes operating in Kunming. These facilities collectively provide 47,600 care beds distributed across the city’s districts and counties.
The “service scope” refers to the range and level of healthcare and care services provided by each nursing home, which varies significantly across facilities and directly impacts their accessibility patterns for older adults with different care needs. Based on our data analysis and facility licensing information, nursing homes in Kunming offer three primary service levels: (1) Basic residential care, which includes daily living assistance, meal provision, social activities, and basic safety monitoring, typically serving independent or semi-independent older adults; (2) Intermediate care, encompassing medication management, basic health monitoring, physical therapy, rehabilitation services, and chronic disease management, catering to older adults with moderate care dependencies; and (3) Advanced care, providing comprehensive medical nursing, specialized dementia care, end-of-life care, and 24 h medical supervision, designed for older adults with severe care dependencies or complex medical conditions. These different service levels correspond to varying staffing requirements (nurse-to-resident ratios), facility certifications (medical vs. social care licenses), and operational costs, which subsequently influence their spatial distribution patterns and catchment areas.
Following the “Guidelines for service standard system construction of senior care organization (MZ/T 170-2021)” jointly issued by Ministry of Civil Affairs of the People’s Republic of China [43], we classified these facilities into three categories based on capacity: small-scale facilities (Less than 100 beds), medium-scale facilities (100–300 beds), large-scale facilities (more than 300 beds). This classification, combined with the service scope categorization, enables a nuanced analysis of both capacity distribution and service provision patterns across different facility scales and care levels, providing a more comprehensive understanding of accessibility variations for older adults with diverse care requirements.
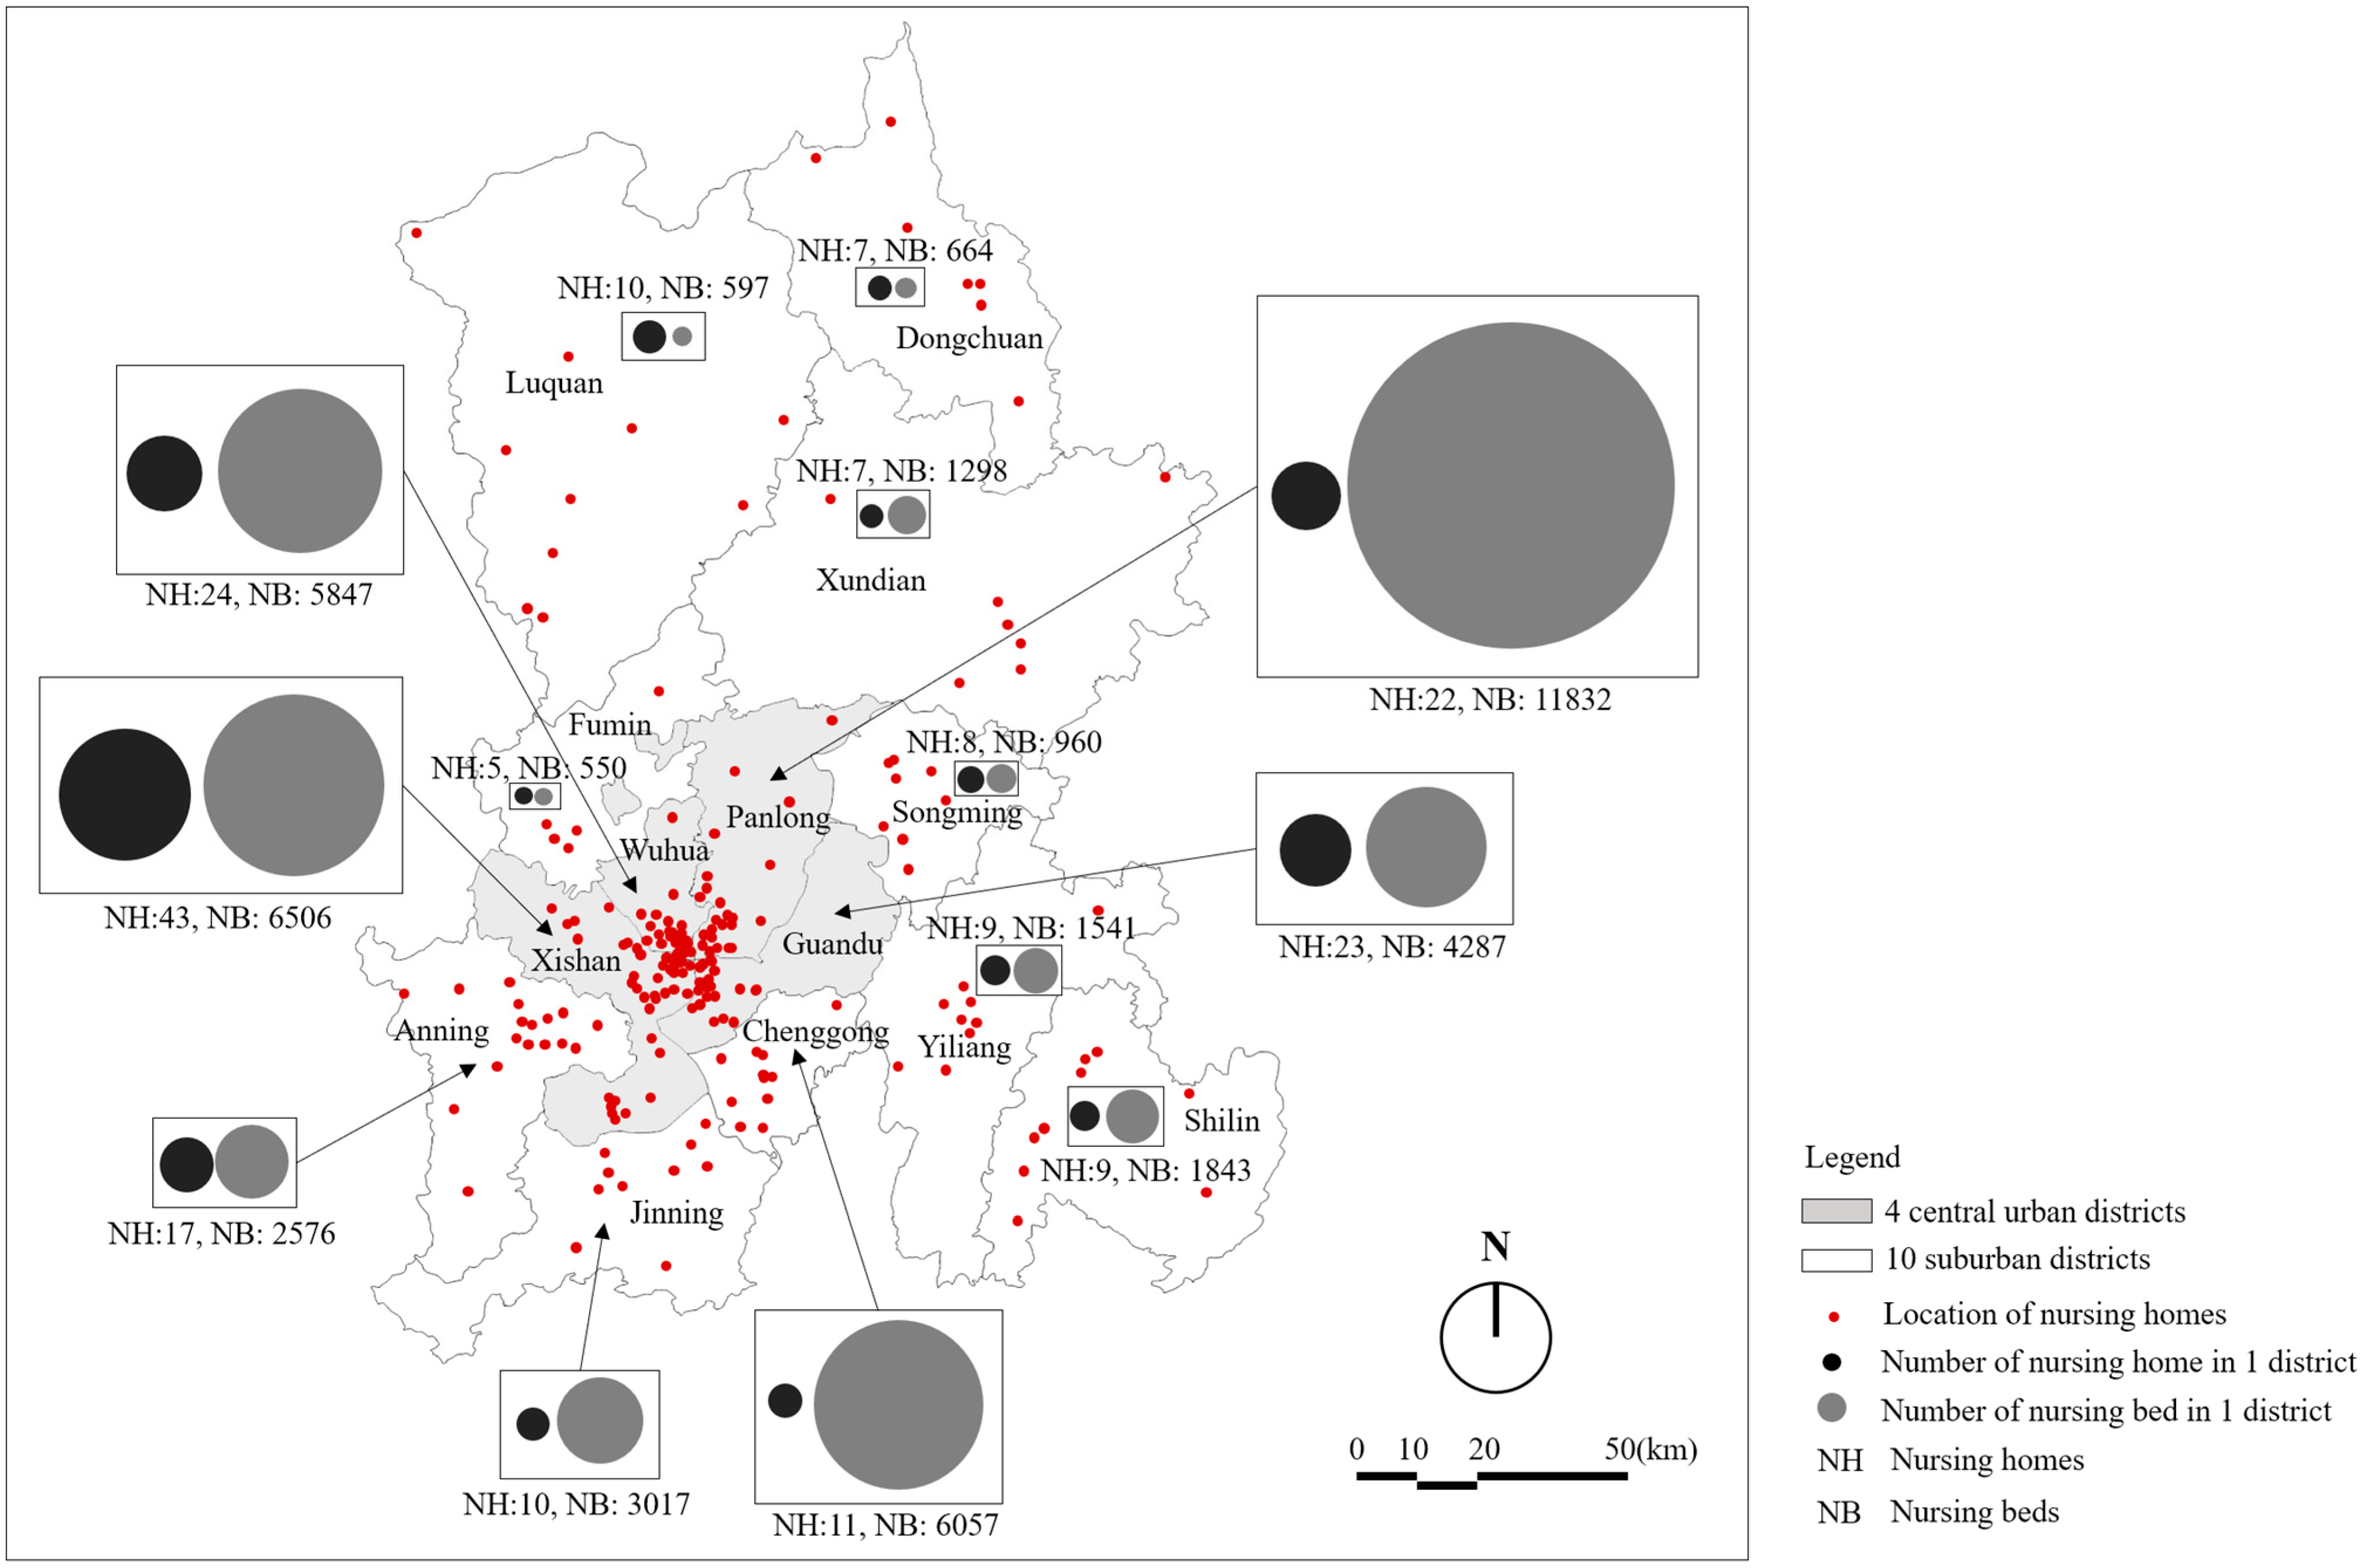
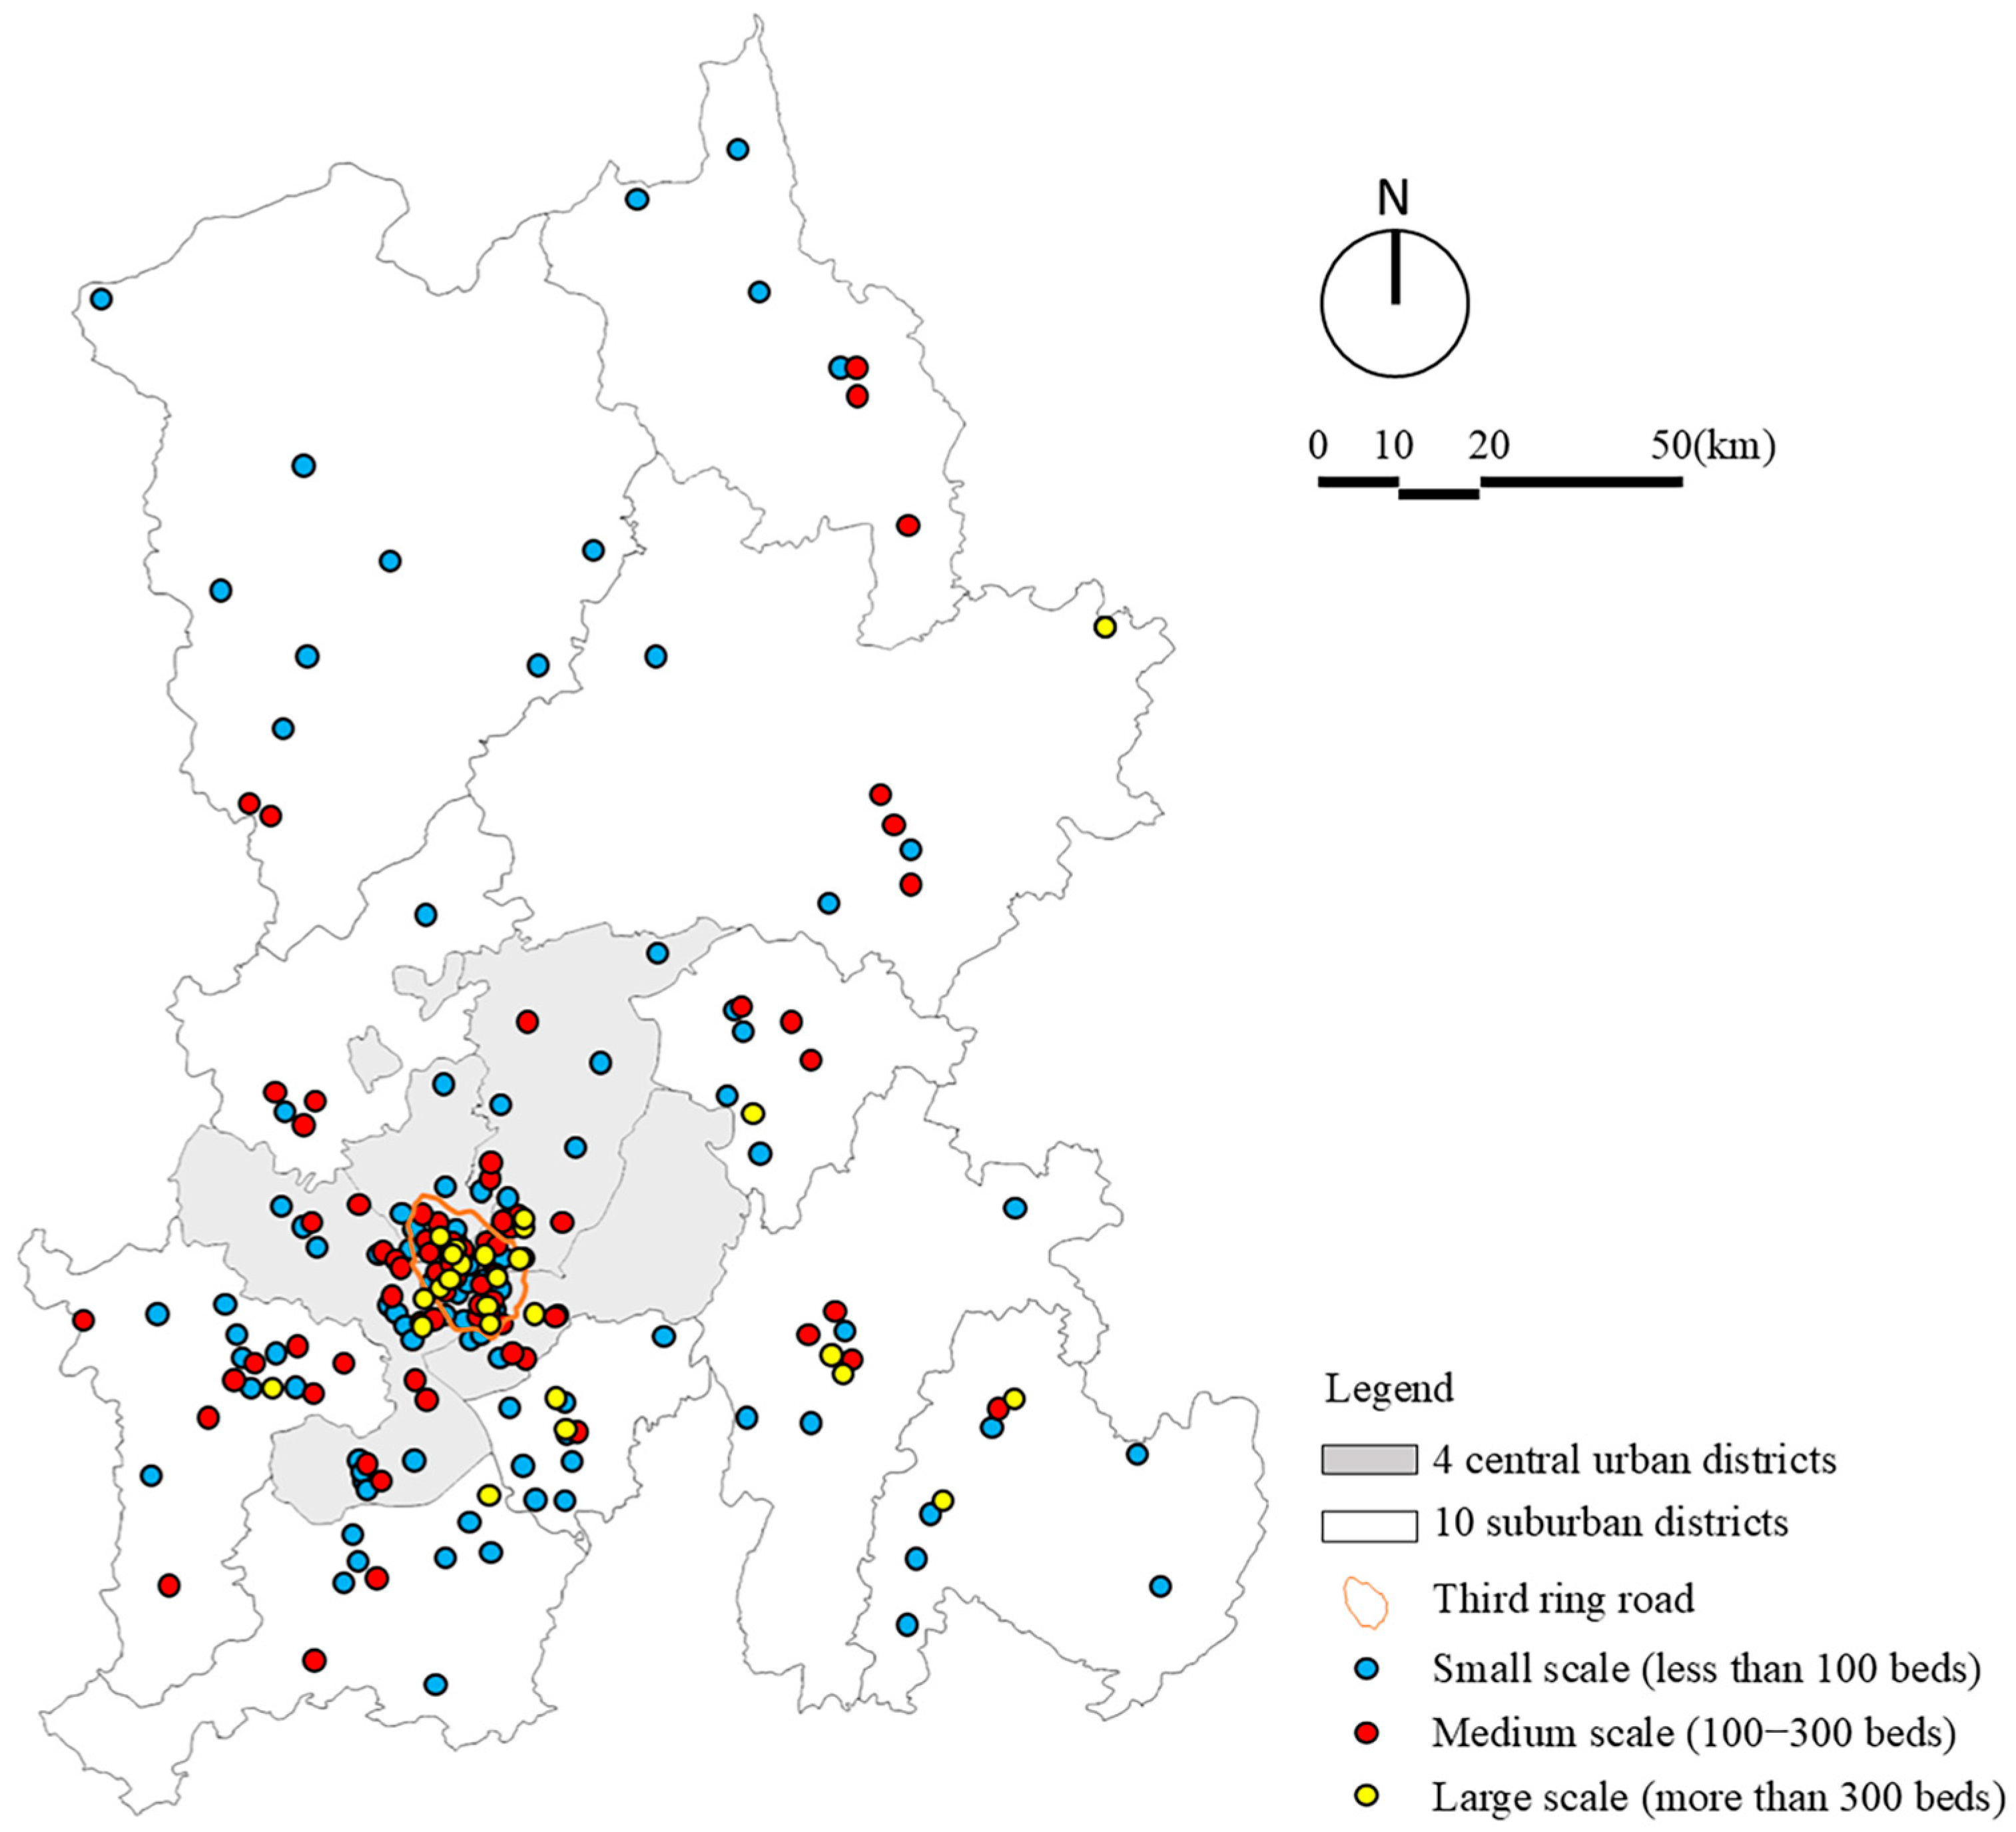
The nursing home data reveals significant variation in facility scale and spatial distribution across Kunming. The spatial distribution of these facilities is shown in Figure 3, which illustrates the locations and scale categories of all nursing homes across the study area.

2.3.2. Demographic and Economic Data

Demographic data essential for accessibility assessment was compiled from multiple authoritative sources. Population statistics and aging rates for each administrative unit were extracted from the 2023 Kunming Statistical Yearbook. As of 2023, the city’s permanent population reached 8.68 million, with an urbanization rate of 82.32%. Among this population, 1.395 million people are aged 60 and above (16.07% of the total) [41]. Notably, the city recorded a negative natural growth rate of −0.13‰ in 2023, indicating an accelerating aging process that intensifies the demand for older adult care services.
District-level economic indicators, including disposable income levels and detailed aging demographics, were collected from both the Kunming Municipal Civil Affairs Bureau and official websites of local district and county governments. Figure 4 illustrates the spatial distribution of older adult populations and aging rates across different districts of Kunming, revealing significant variations in older adult population density and aging rates throughout the metropolitan area (Data from the 2023 Kunming Statistical Yearbook [41]). This spatial heterogeneity of aging demographics forms a critical baseline for assessing the match between service provision and population needs.
Crucially, data on average monthly pension payments for retired workers were obtained from the Department of Human Resources and Social Security of Yunnan Province [44]. As of 2023, the average monthly basic pension for retirees in Yunnan Province was 3431 yuan (approximately 469 USD). Additionally, this study analyzed the pricing structure of nursing homes listed on the Kunming Older adult Care Services platform (https://www.yanglao.com.cn/kunming, accessed on 20 December 2024), which catalogs older adult care facilities across Kunming with diverse service types and fee structures. The platform categorizes facilities by price ranges from below 2000 yuan to above 10,000 yuan monthly, allowing for comprehensive assessment of economic accessibility across different income levels. These datasets together establish the demand patterns and economic constraints that shape older adult care accessibility across Kunming’s diverse urban-rural landscape.

2.3.3. Transportation Network Data

A comprehensive multi-modal transportation network was constructed to model physical accessibility. Bus transportation data, including route configurations and stop locations, were extracted from Gaode Maps (https://www.gaode.com/). Road network data, including hierarchical road classifications and connectivity information, were sourced from OpenStreetMap (https://www.openstreetmap.org/) and supplemented with Google Maps (https://maps.google.com/maps, accessed on 20 December 2024) data where necessary. Administrative boundary information for Kunming’s districts and counties was also obtained from these mapping platforms.
For transportation modeling purposes, we applied parameters based on the “Design Specification for Highway Alignment” (JTG D20-2017) published by the Ministry of Transport of the People’s Republic of China [45]. According to these standards, private vehicle travel speeds were differentiated by road classification: 60 km/h for expressways, 40 km/h for main roads, 30 km/h for secondary roads, and 20 km/h for branch roads. Bus stops were assigned a 300 m service radius (straight-line distance) using GIS tools, with an average operational speed of 30 km/h. These transportation parameters were used to generate origin-destination (OD) time-cost matrices in ArcGIS, enabling the calculation of travel times between residential areas and older adult care facilities under different transportation scenarios.

2.4. Research Methods

This study employs four complementary analytical methods to comprehensively assess the spatial distribution and accessibility of nursing homes in Kunming. ArcGIS is utilized throughout the analysis process for spatial data processing, analysis, and visualization of results.

2.4.1. Nearest Neighbor Index

The nearest neighbor index (NNI) is selected to objectively determine the spatial clustering pattern of nursing homes. This method is particularly valuable for identifying whether the distribution of facilities follows a clustered, random, or dispersed pattern [46]. This method is particularly valuable for identifying whether the distribution of facilities follows a clustered, random, or dispersed pattern [47]. NII is calculated by comparing the actual distance between point features to the expected distance in a theoretical random distribution, as expressed in Formula (1):
N I I = 2 d i N / A ,
where d i represents the average actual distance between two facilities, N is the number of nursing homes, and A is the land area of Kunming city. The interpretation of NII values follows statistical conventions: when NII = 1, nursing homes are randomly distributed; when NII < 1, facilities show a clustered pattern (with values closer to 0 indicating stronger clustering); when NII > 1, facilities display a uniform distribution pattern (with higher values indicating more dispersion).

2.4.2. Kernel Density Estimation

Kernel density estimation (KDE) is employed to examine the relative concentration of nursing homes based on its superiority for continuous surface representation in healthcare accessibility research [48]. This method was chosen for its ability to visualize spatial hotspots and accommodate facility capacity weighting, addressing limitations of discrete counting methods identified in previous studies [49]. In two-dimensional space, the KDE is expressed as Formula (2):
λ ( s ) = i = 1 n 1 π γ 2 φ ( d i s / γ ) ,
where λ ( s ) is the estimated kernel density value at point s, γ is the kernel density calculation radius (determined based on the average service radius of nursing homes in Kunming), n is the number of nursing home points, and φ is the weight of the distance between nursing home point i and s. The resulting density values directly reflect the spatial concentration of nursing homes, with higher values indicating stronger concentration.

2.4.3. Ratio of Means Method

Economic accessibility is assessed using the Ratio of Means (RoM) method, which effectively captures the relationship between residents’ income levels and the cost of nursing home services. This approach is particularly relevant for older adult care facilities, where affordability is a critical factor affecting access [50]. The specific calculation is shown in Formula (3):
E k = n p 0 j = 1 n p j ( j k ) ,
where Ek represents the economic accessibility index of nursing homes in community k. If Ek > 1, it indicates good economic accessibility of nursing homes in this community; if Ek < 1, it indicates relatively poor economic accessibility. P0 refers to the average monthly pension of retired workers in Kunming, and Pj represents the minimum price, maximum price, or average price of nursing homes. The nursing home j is spatially located within community k.

2.4.4. Gaussian Two-Step Floating Catchment Area Method (Gaussian 2SFCA)

The Gaussian two-step floating catchment area method (Gaussian 2SFCA) method is employed to calculate the spatial accessibility of nursing homes, considering both supply and demand factors with distance decay effects. In this analysis, the demand points represent the 144 sub-district level administrative units within Kunming’s 14 districts, which serve as the spatial units for population aggregation and accessibility calculation. This advanced method was selected over standard 2SFCA because it incorporates Gaussian distance decay functions, which more accurately reflect how accessibility diminishes with increasing travel time [22,51]. The method involves two steps:
Step 1: Calculate the supply-demand ratio. Using each sub-district i as the center, determine the travel time threshold d0, search for all nursing homes j within this threshold, and calculate the supply-demand ratio Rᵢⱼ as shown in Formula (4):
R i j = s j i d i j < d 0 p i G d i j , d 0 ,
where Rij represents the supply-demand ratio within the search radius; Sⱼ represents the supply capacity of nursing home j; pᵢ is the older adult population at demand point i; dij is the travel time from population demand point i to nursing home supply point j; d0 is the travel time threshold (set based on typical maximum acceptable travel times for older adult individuals); and G(dij,d0) is the Gaussian distance decay function, calculated as follows:
G d i j , d 0 = e 1 / 2 × d i j / d 0 2 e 1 / 2 ,     i f   d i j d 0 0 ,     i f   d i j > d 0 ,
Step 2: Calculate the spatial accessibility of each sub-district unit i, as expressed in Formula (6):
A i j = j d i j < d 0 R i j G d i j , d 0 ,
where A i j represents the accessibility of the older adult population in sub-district unit i to nursing home j. Higher values indicate better spatial accessibility to older adult care services.

3. Results

3.1. The Spatial Distribution Characteristics of Nursing Homes in Kunming

3.1.1. Spatial Coupling Between Nursing Homes and Older Adult Population

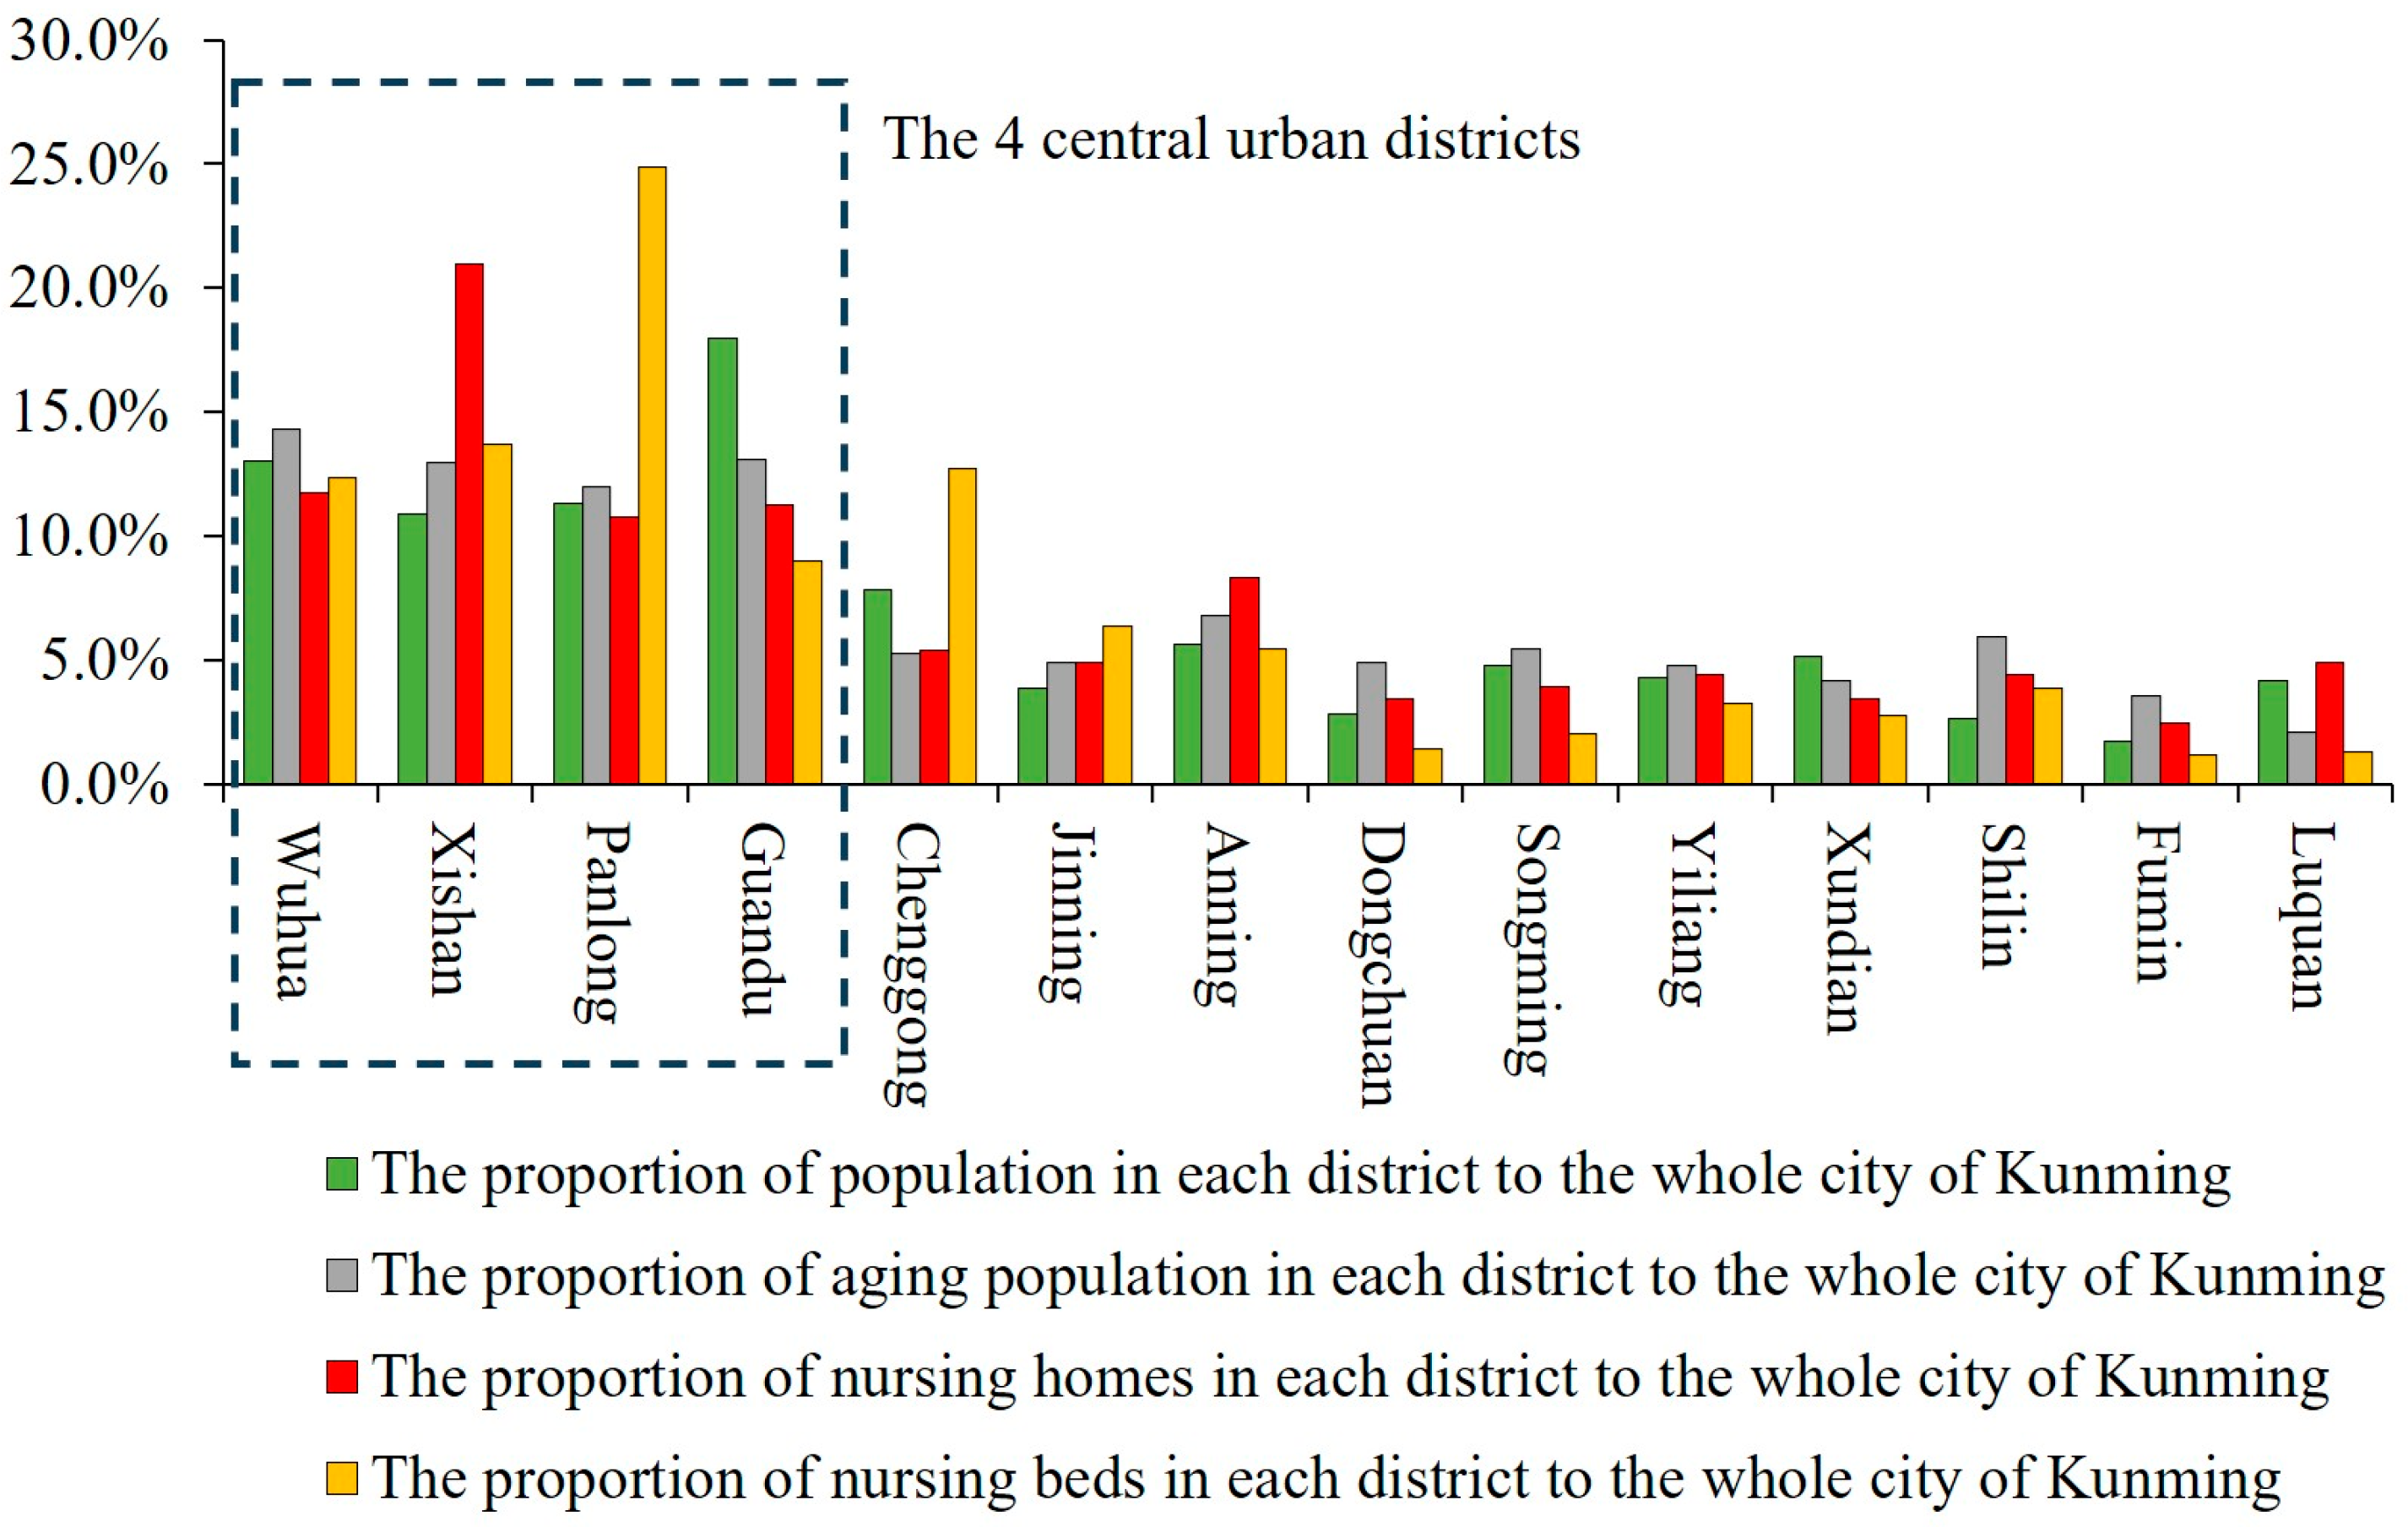
Figure 5 illustrates the distribution patterns of older adult care resources across Kunming’s administrative divisions relative to population demographics. While the four central urban districts collectively accommodate 52.3% of the city’s older adult population and possess 54.6% of nursing homes—showing a relatively balanced macro-level distribution—significant internal disparities emerge at the district level. Notably, Xishan district contains 21.0% of the city’s nursing homes despite housing only 12.9% of the older adult population, representing a concentration coefficient of 1.63. Similarly, Panlong district exhibits a remarkable concentration of nursing beds (24.9%) relative to its older adult population share (12.0%), yielding a ratio of 2.08. Conversely, Guandu district demonstrates an inverse relationship, with its proportion of nursing beds (9.0%) substantially lower than its older adult population share (13.1%). Beyond the central urban core, Chenggong district presents another significant case of resource concentration, possessing 12.7% of the city’s nursing beds while housing merely 5.2% of the older adult population. In contrast, several peripheral districts—including Dongchuan, Songming, and Fumin—exhibit concerning resource deficiencies, with nursing bed proportions less than half their respective older adult population shares.
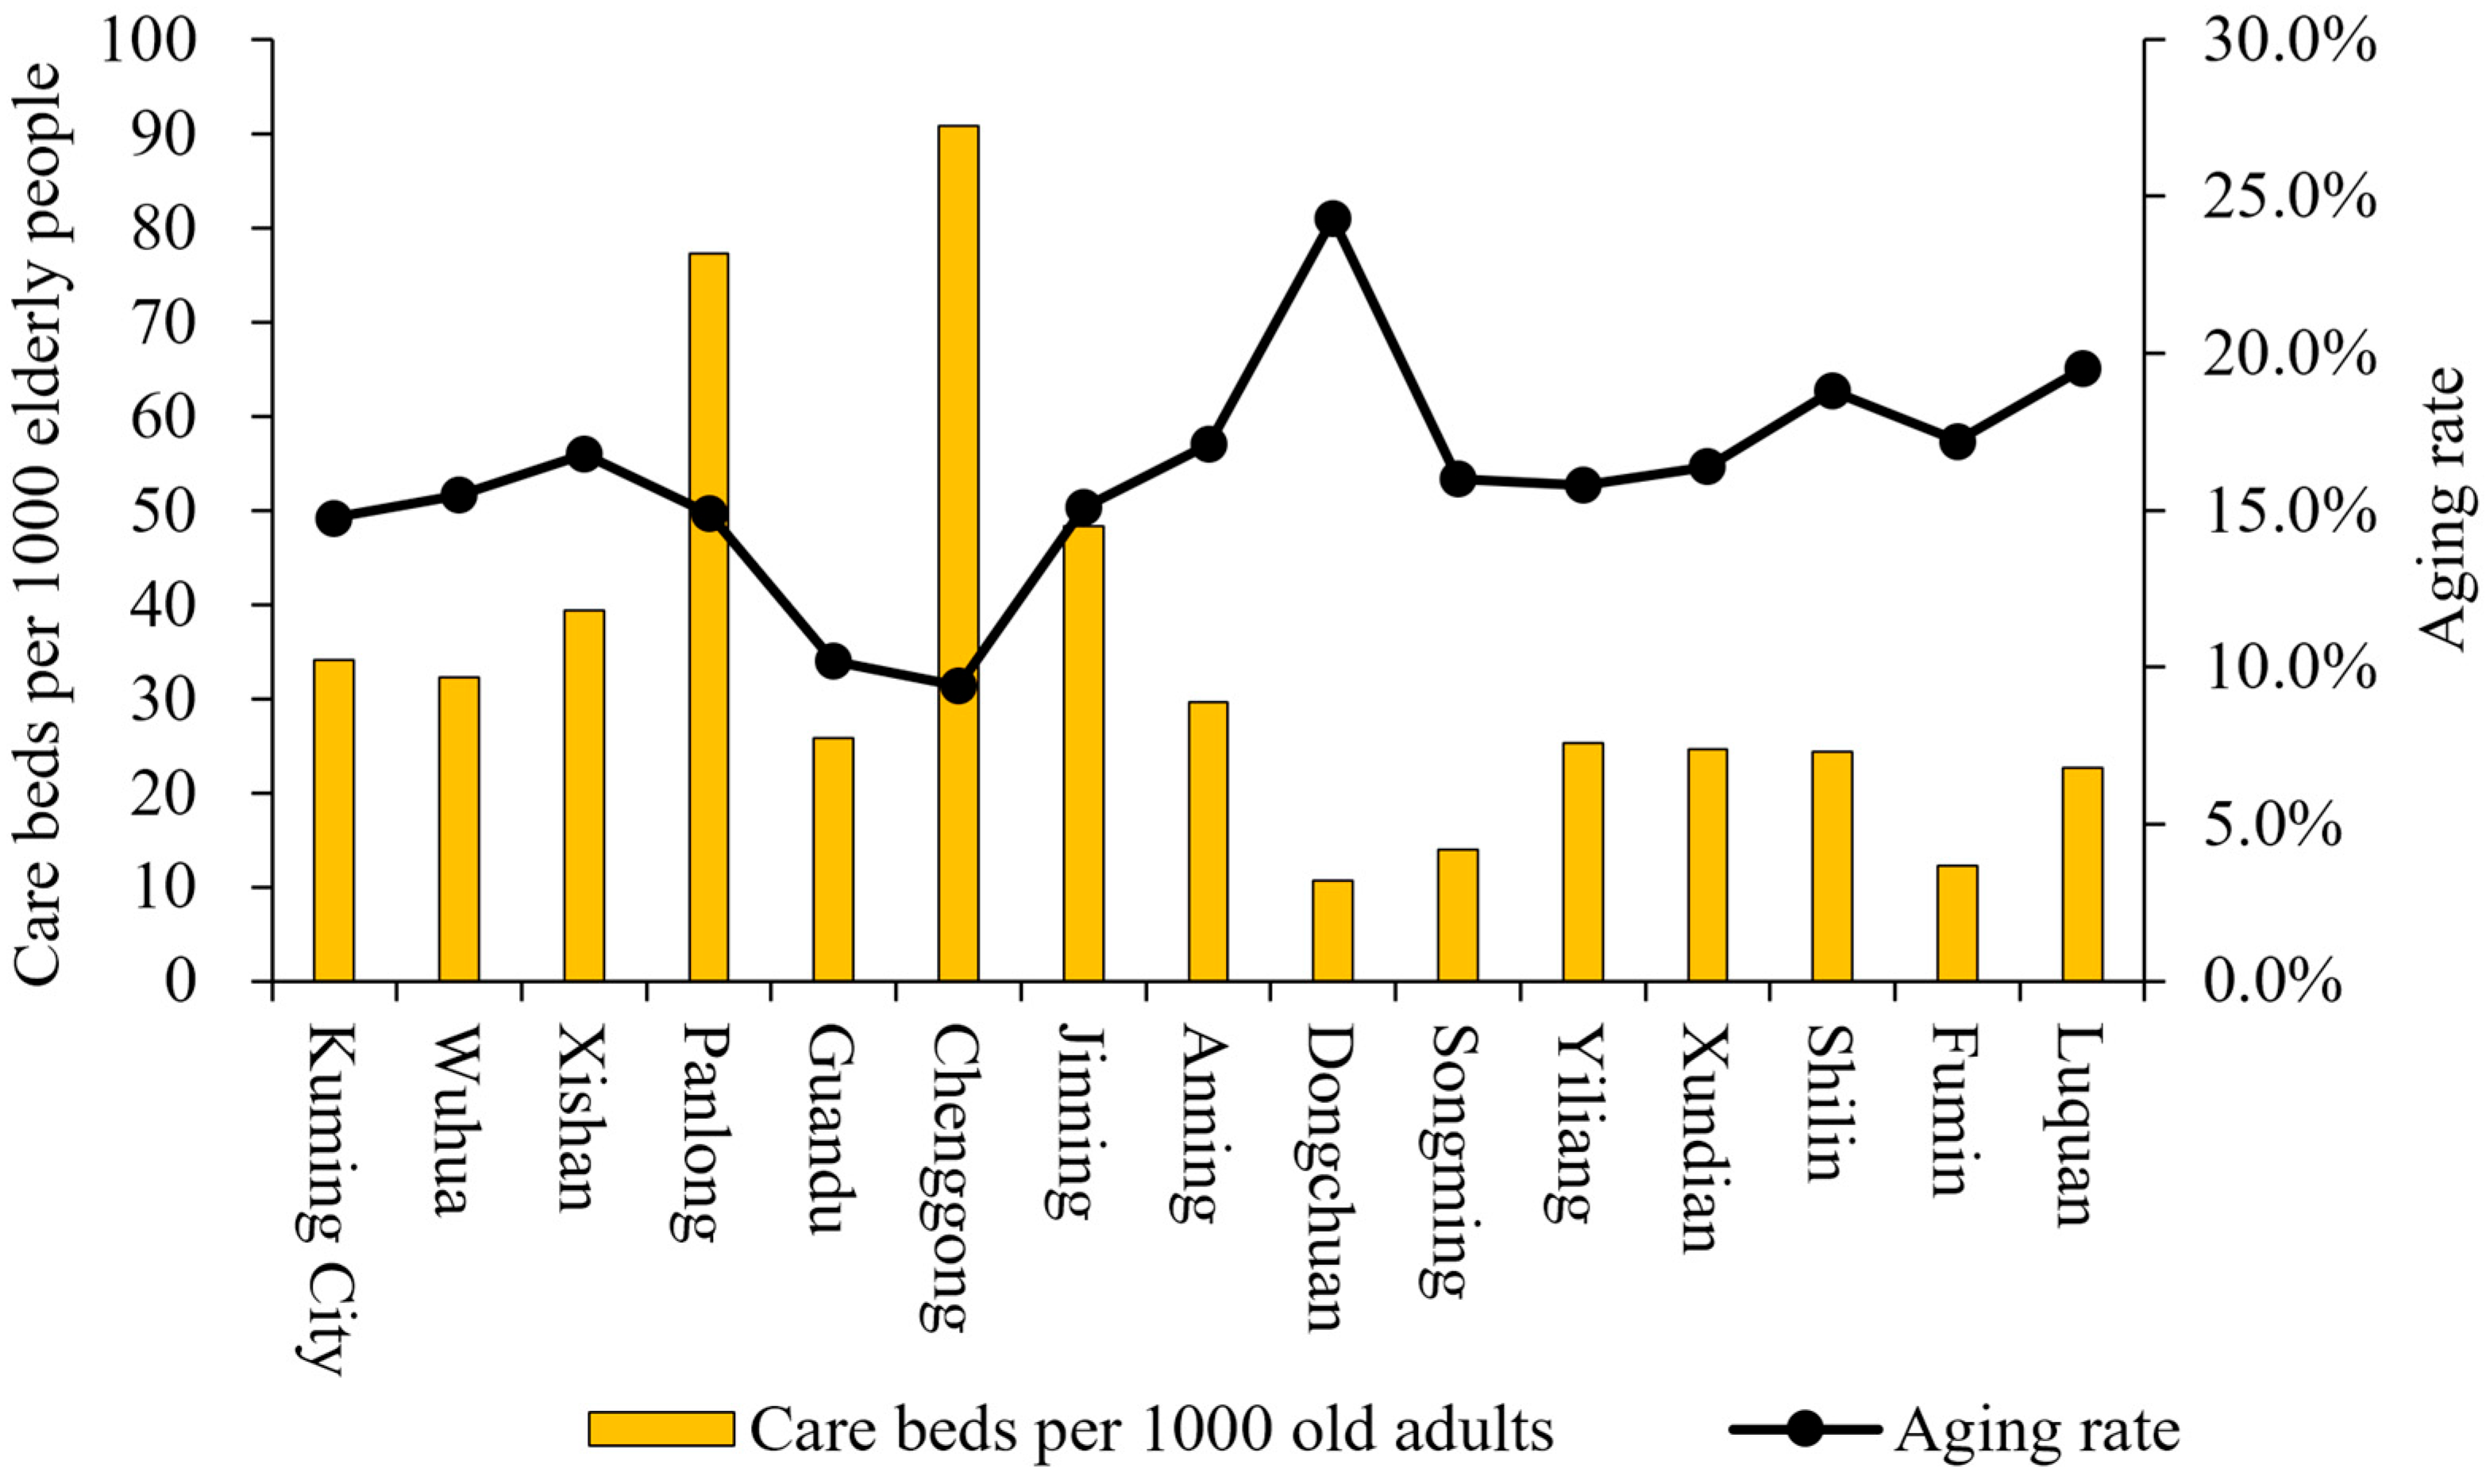
Figure 6 complements this distributional analysis by examining service capacity relative to demographic needs. The care bed provision ratio (beds per 1000 older adults) reveals substantial heterogeneity across districts, with Chenggong exhibiting exceptional capacity (91 beds per 1000 older adults) while several peripheral districts demonstrate significant deficiencies (Dongchuan: 11 beds; Fumin: 12 beds). This provision ratio demonstrates minimal correlation with district-level aging rates, as evidenced by Dongchuan district, which despite having the highest aging rate (24.3%), maintains one of the lowest bed provision rates. These findings indicate that the spatial configuration of older adult care resources throughout Kunming is governed by factors beyond simple demographic metrics, potentially including economic development trajectories, land availability, investment priorities, and historical development patterns.

3.1.2. Distribution Characteristics Based on Scale and Operational Nature

The spatial analysis of nursing home distribution across Kunming reveals distinctive patterns that correlate with urban-rural gradients and demographic characteristics (Figure 7). Quantitative analysis shows that of the city’s 101 small-scale facilities, 47 are located within the four central urban districts while 54 are distributed across the ten suburban areas; concurrently, of the 104 medium and large-scale facilities, 65 are concentrated in urban districts with only 39 situated in suburban localities. This spatial differentiation demonstrates a pronounced dichotomy between urban and suburban areas: the four central urban districts (Wuhua, Xishan, Panlong, and Guandu) demonstrate a predominance of medium-scale facilities (100–300 beds) and large-scale institutions (>300 beds), constituting approximately 58.04% of their nursing home inventory, while the ten suburban districts exhibit a marked concentration of small-scale facilities (<100 beds), which account for 58.06% of nursing homes in these areas. This disproportionate distribution suggests potential spatial mismatches between service capacity and demographic needs, particularly exemplified by Xishan District, which presents a paradoxical case where despite not hosting the largest older adult population in the metropolitan area, it contains the highest concentration of nursing homes overall and leads in the number of medium and large-scale facilities, indicating that facility distribution may be influenced by factors beyond mere population demographics, including land availability, economic development levels, and policy interventions.
The spatial distribution pattern illustrated in Figure 8 demonstrates pronounced heterogeneity throughout the metropolitan area. The distribution shows intense clustering of all three facility types within the four central districts, particularly inside the Third Ring Road, creating a high-density core area. Large-scale nursing homes (yellow dots) are primarily concentrated in the central urban districts and southern suburban areas, while being almost entirely absent from northern suburban districts. Medium-scale facilities (red dots) demonstrate more dispersed distribution but remain predominantly within central and southern areas. Small-scale nursing homes (blue dots), while most numerous and widely distributed, still exhibit significant spatial bias, with clusters in central districts and sparse representation in remote suburban areas. Inter-facility distances in suburban regions are substantially greater than in urban areas, with several peripheral zones completely lacking nursing facilities, potentially creating accessibility challenges for older adult residents in these areas.
Examination of operational characteristics reveals significant patterns related to facility scale and management type. As presented in Figure 9, of the 205 nursing homes analyzed, 117 (57.1%) operate under private management (including 4 Public–Private Partnerships), while 88 (42.9%) are publicly operated. A pronounced relationship exists between facility scale and operational nature: small-scale nursing homes are predominantly publicly managed (64 public vs. 37 private), reflecting government efforts to provide basic older adult care services in areas where private investment may be limited. Conversely, medium and large-scale institutions demonstrate strong private sector dominance (58 private vs. 19 public for medium-scale; 22 private vs. 5 public for large-scale). This indicates that private investment preferentially targets larger facilities, potentially due to economies of scale and greater profitability opportunities in larger operations.
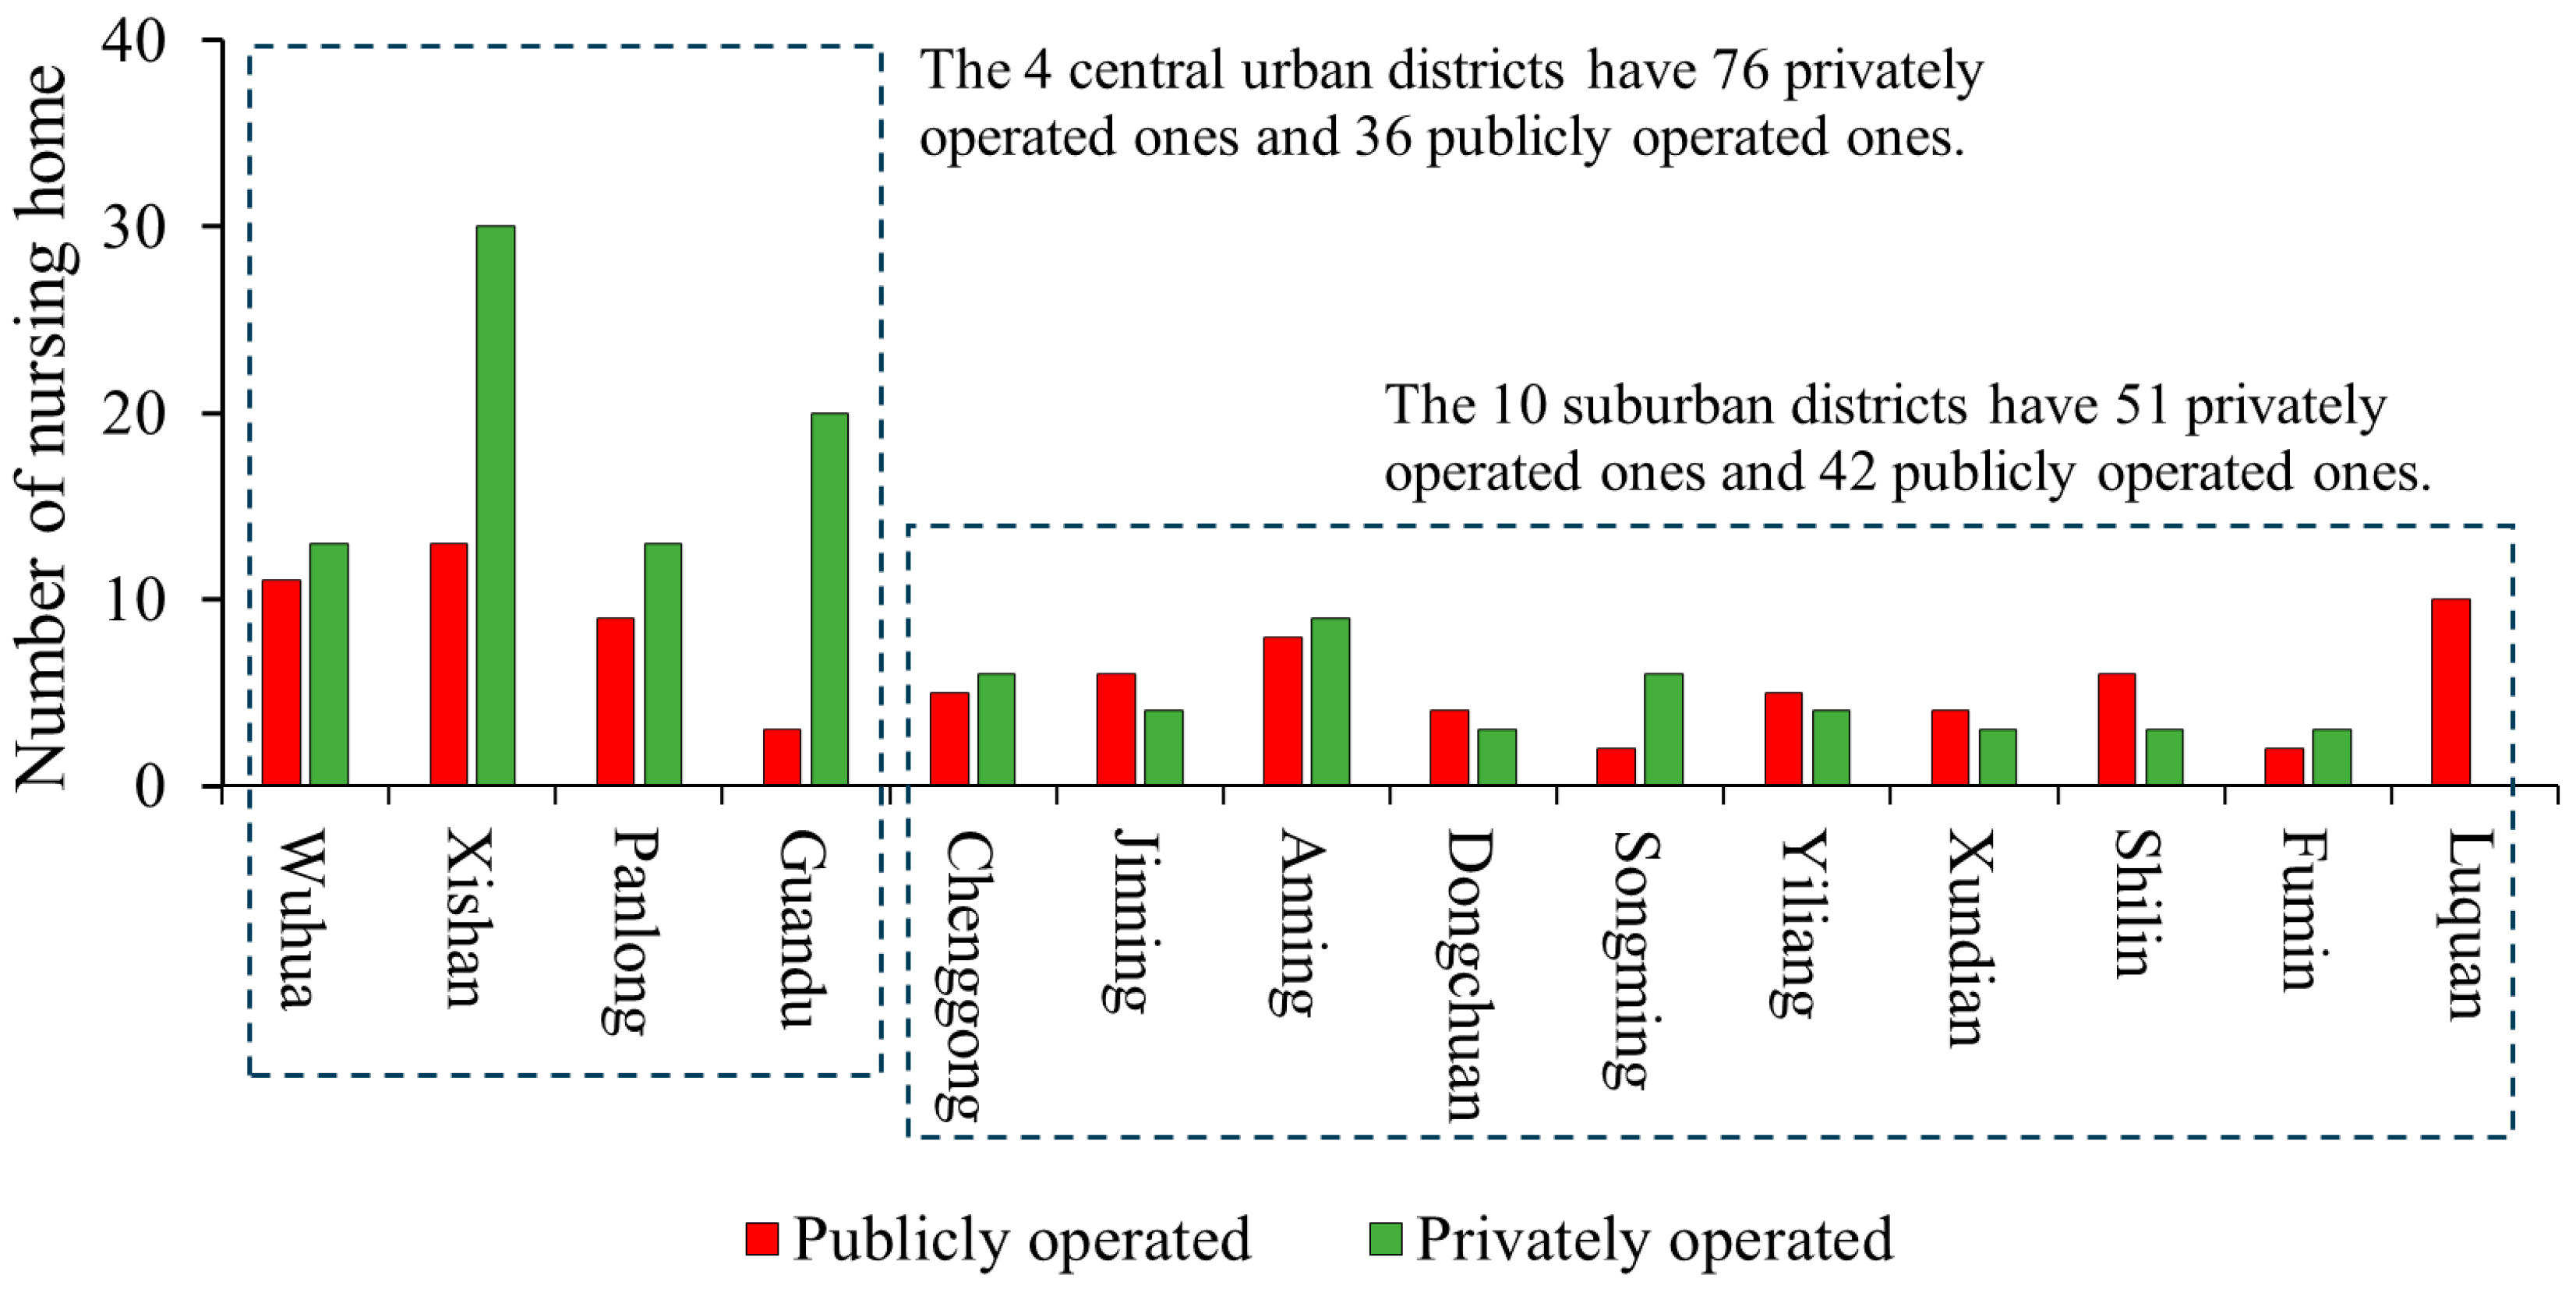
Spatial analysis of operational patterns, as shown in Figure 10, reveals distinct geographical preferences between public and private operators. Privately operated facilities strongly dominate the four central urban districts (76 private vs. 36 public), particularly in Guandu district where private facilities outnumber public ones by a factor of approximately 4:1. Conversely, in the ten suburban districts, public and private operations are more balanced overall (51 private vs. 42 public), with several districts showing public sector dominance. Luquan district represents the extreme case with exclusively publicly operated nursing homes, highlighting the critical role of government provision in areas with potentially limited commercial viability. This spatial differentiation suggests that private operators preferentially establish facilities in urban areas with higher population density, better infrastructure, and potentially higher income levels, while public institutions play a crucial role in ensuring service provision in less commercially attractive suburban and rural areas.
These findings collectively indicate a complex relationship between facility scale, operational nature, and spatial distribution, with significant implications for equity of access and service provision across different districts of Kunming. The concentration of larger, privately operated facilities in central urban areas contrasts with the predominance of smaller, publicly operated institutions in suburban regions, potentially creating disparities in service quality and accessibility.

3.1.3. Spatial Clustering Characteristics of Nursing Homes

The spatial distribution of nursing homes in Kunming exhibits significant clustering, as demonstrated through quantitative analysis. Application of the Average Nearest Neighbor Index yields a nearest neighbor ratio R = 0.67 (Z-score = −8.98, p-value < 0.001), statistically confirming that nursing facilities demonstrate non-random clustering throughout the metropolitan area.
Kernel density analysis reveals distinctive spatial concentration patterns of both nursing homes and beds (Figure 11). The distribution follows a monocentric pattern with pronounced density gradients: a high-density core encompassing the four central urban districts (Wuhua, Guandu, Panlong, and Xishan), predominantly within the Third Ring Road, with density values decreasing progressively outward. Several secondary, lower-density clusters emerge in suburban districts, creating a “primary core-multiple satellite” structure characteristic of many rapidly developing Chinese cities.
Comparative analysis between facility density (Figure 11a) and bed density (Figure 11b) reveals more pronounced concentration in the bed distribution pattern, indicated by the smaller spatial extent of high-density zones. This suggests that larger-capacity facilities are disproportionately concentrated in specific locations, particularly within the central urban core and select suburban nodes, potentially creating capacity imbalances across the metropolitan area.
The juxtaposition of facility distribution patterns with older adult population density (Figure 11c) demonstrates general spatial correlation, with high-density older adult areas largely corresponding to areas of high nursing facility concentration. However, notable exceptions exist, particularly in Chenggong and Jinning districts, which exhibit substantial nursing bed concentrations despite relatively low older adult population density. Field investigations reveal that these anomalies result from the strategic establishment of large-scale, tourism-oriented nursing facilities in these districts’ scenic areas (near Dianchi Lake and Liangwang mountain areas, respectively). These facilities function as “destination nursing homes,” attracting older adult residents from throughout Yunnan Province and neighboring regions, operating on an economic model distinct from community-serving facilities.
This core-periphery distribution pattern has significant implications for equity of access, suggesting potential service gaps in areas where facility density does not align with older adult population distribution, particularly in the northeastern and northwestern suburban regions.

3.2. Accessibility Analysis of Nursing Homes at the Community Level in Kunming

3.2.1. Economic Accessibility of Nursing Homes at the Community Level

Economic accessibility is the extent to which a good or service is financially affordable and accessible to individuals, given their income, wealth, and the price of the good or service, without compromising other basic needs [52,53]. Willingness to pay for care services rises significantly with income, highlighting clear disparities across income groups [54].
Equitable economic access to older adult care services represents a fundamental component in addressing socioeconomic disparities and ensuring welfare provision for aging populations. Using the average monthly basic pension (3431 yuan/476 USD) as a baseline reference point, this study evaluates the economic accessibility of nursing homes by incorporating minimum, maximum, and average price points from the comprehensive pricing data to overcome the limitations of single-metric evaluations.
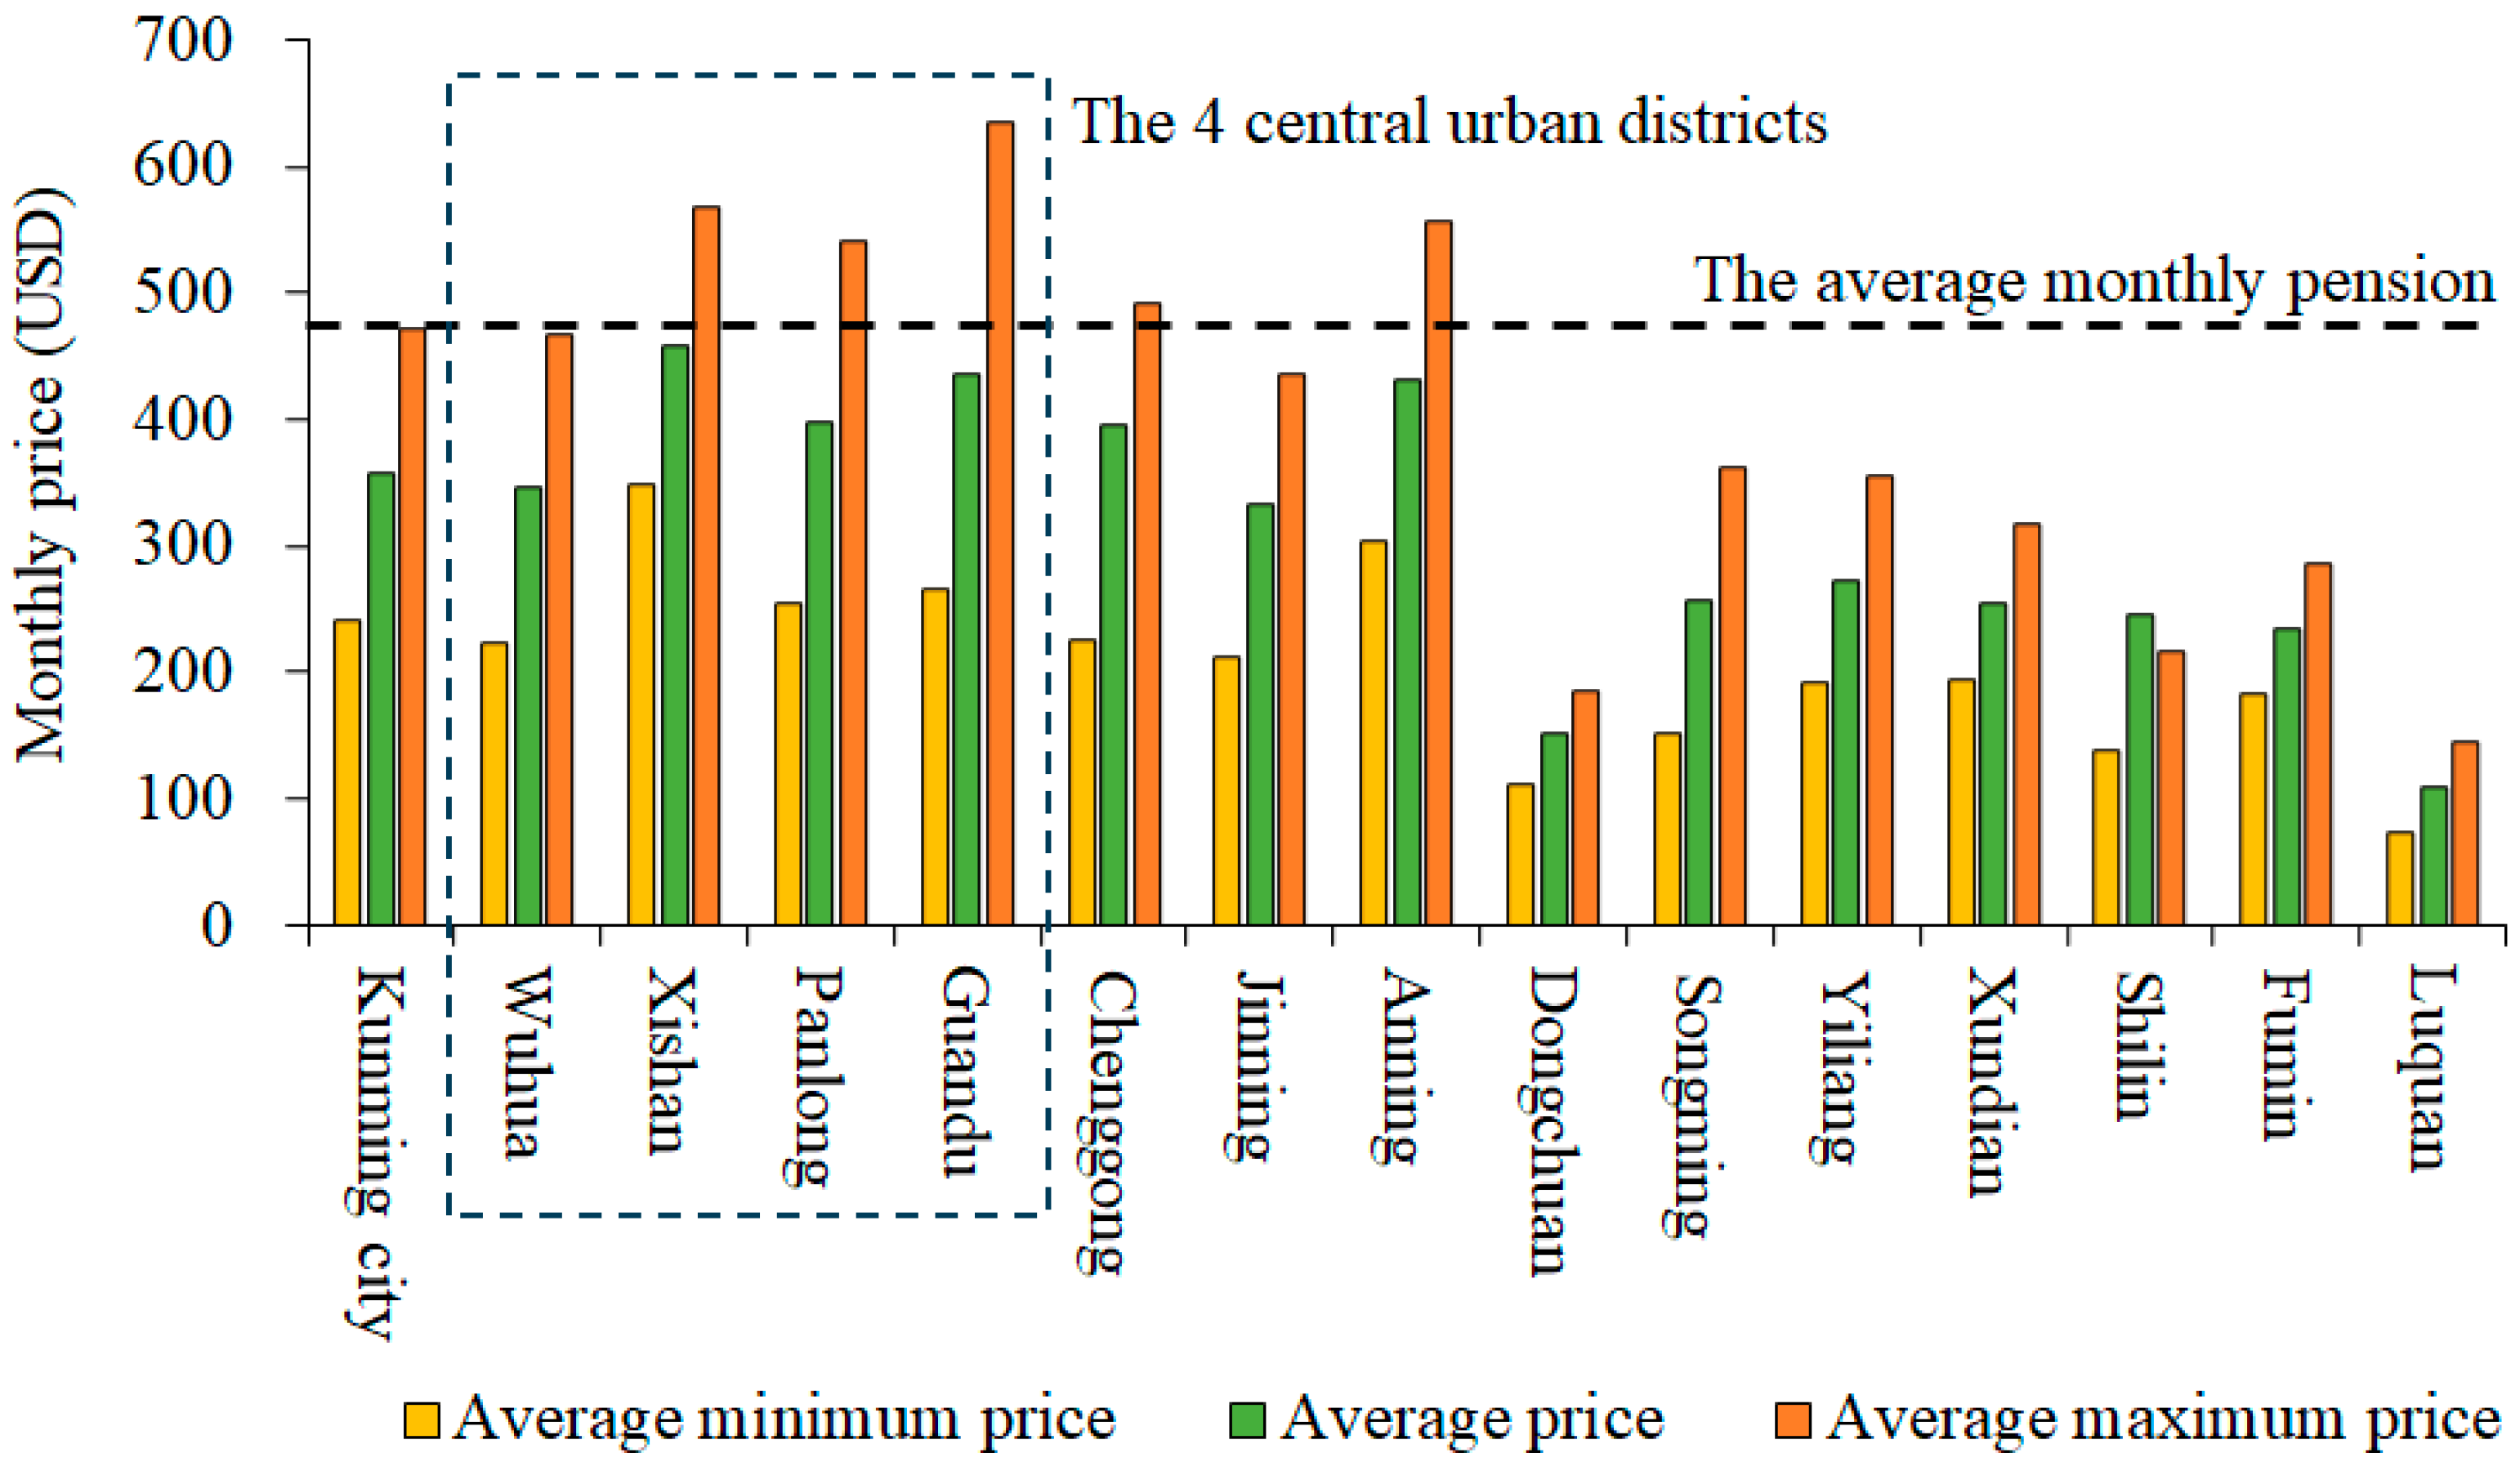
Figure 12 presents a comparative analysis between the average monthly pension and nursing home pricing structures across all districts. The data reveal that the average basic monthly pension generally exceeds the average monthly accommodation costs in most nursing homes throughout Kunming, suggesting broad affordability. However, significant inter-district variations emerge, with the four central urban districts (Wuhua, Xishan, Panlong, and Guandu) exhibiting markedly higher maximum prices, frequently approaching or exceeding the pension threshold. Conversely, suburban districts demonstrate greater economic accessibility, with even maximum prices typically remaining below pension levels.
To quantify economic accessibility at the community level, we employed the mean ratio methodology on the ArcGIS platform, where the ratio (Ek) represents the relationship between average pension and facility price. Values where Ek > 1 indicate favorable economic accessibility (pension exceeds price), while Ek < 1 suggests potential affordability challenges. As illustrated in Figure 13, the spatial distribution of economic accessibility demonstrates distinct patterns across minimum (Figure 13a), average (Figure 13b), and maximum (Figure 13c) price scenarios. Communities with darker shading indicate higher economic accessibility indices, while white areas denote communities lacking nursing facilities entirely.
The spatial analysis reveals that economic accessibility is generally favorable throughout most communities in Kunming, particularly in peripheral suburban districts. However, pronounced accessibility constraints emerge in specific geographic contexts. Communities with the lowest economic accessibility indices are predominantly concentrated in the four central urban districts and two suburban districts—Anning and Chenggong. This pattern correlates strongly with ownership structure distribution, as privately operated facilities, which predominate in these areas, implement significantly higher pricing structures than their publicly operated counterparts.
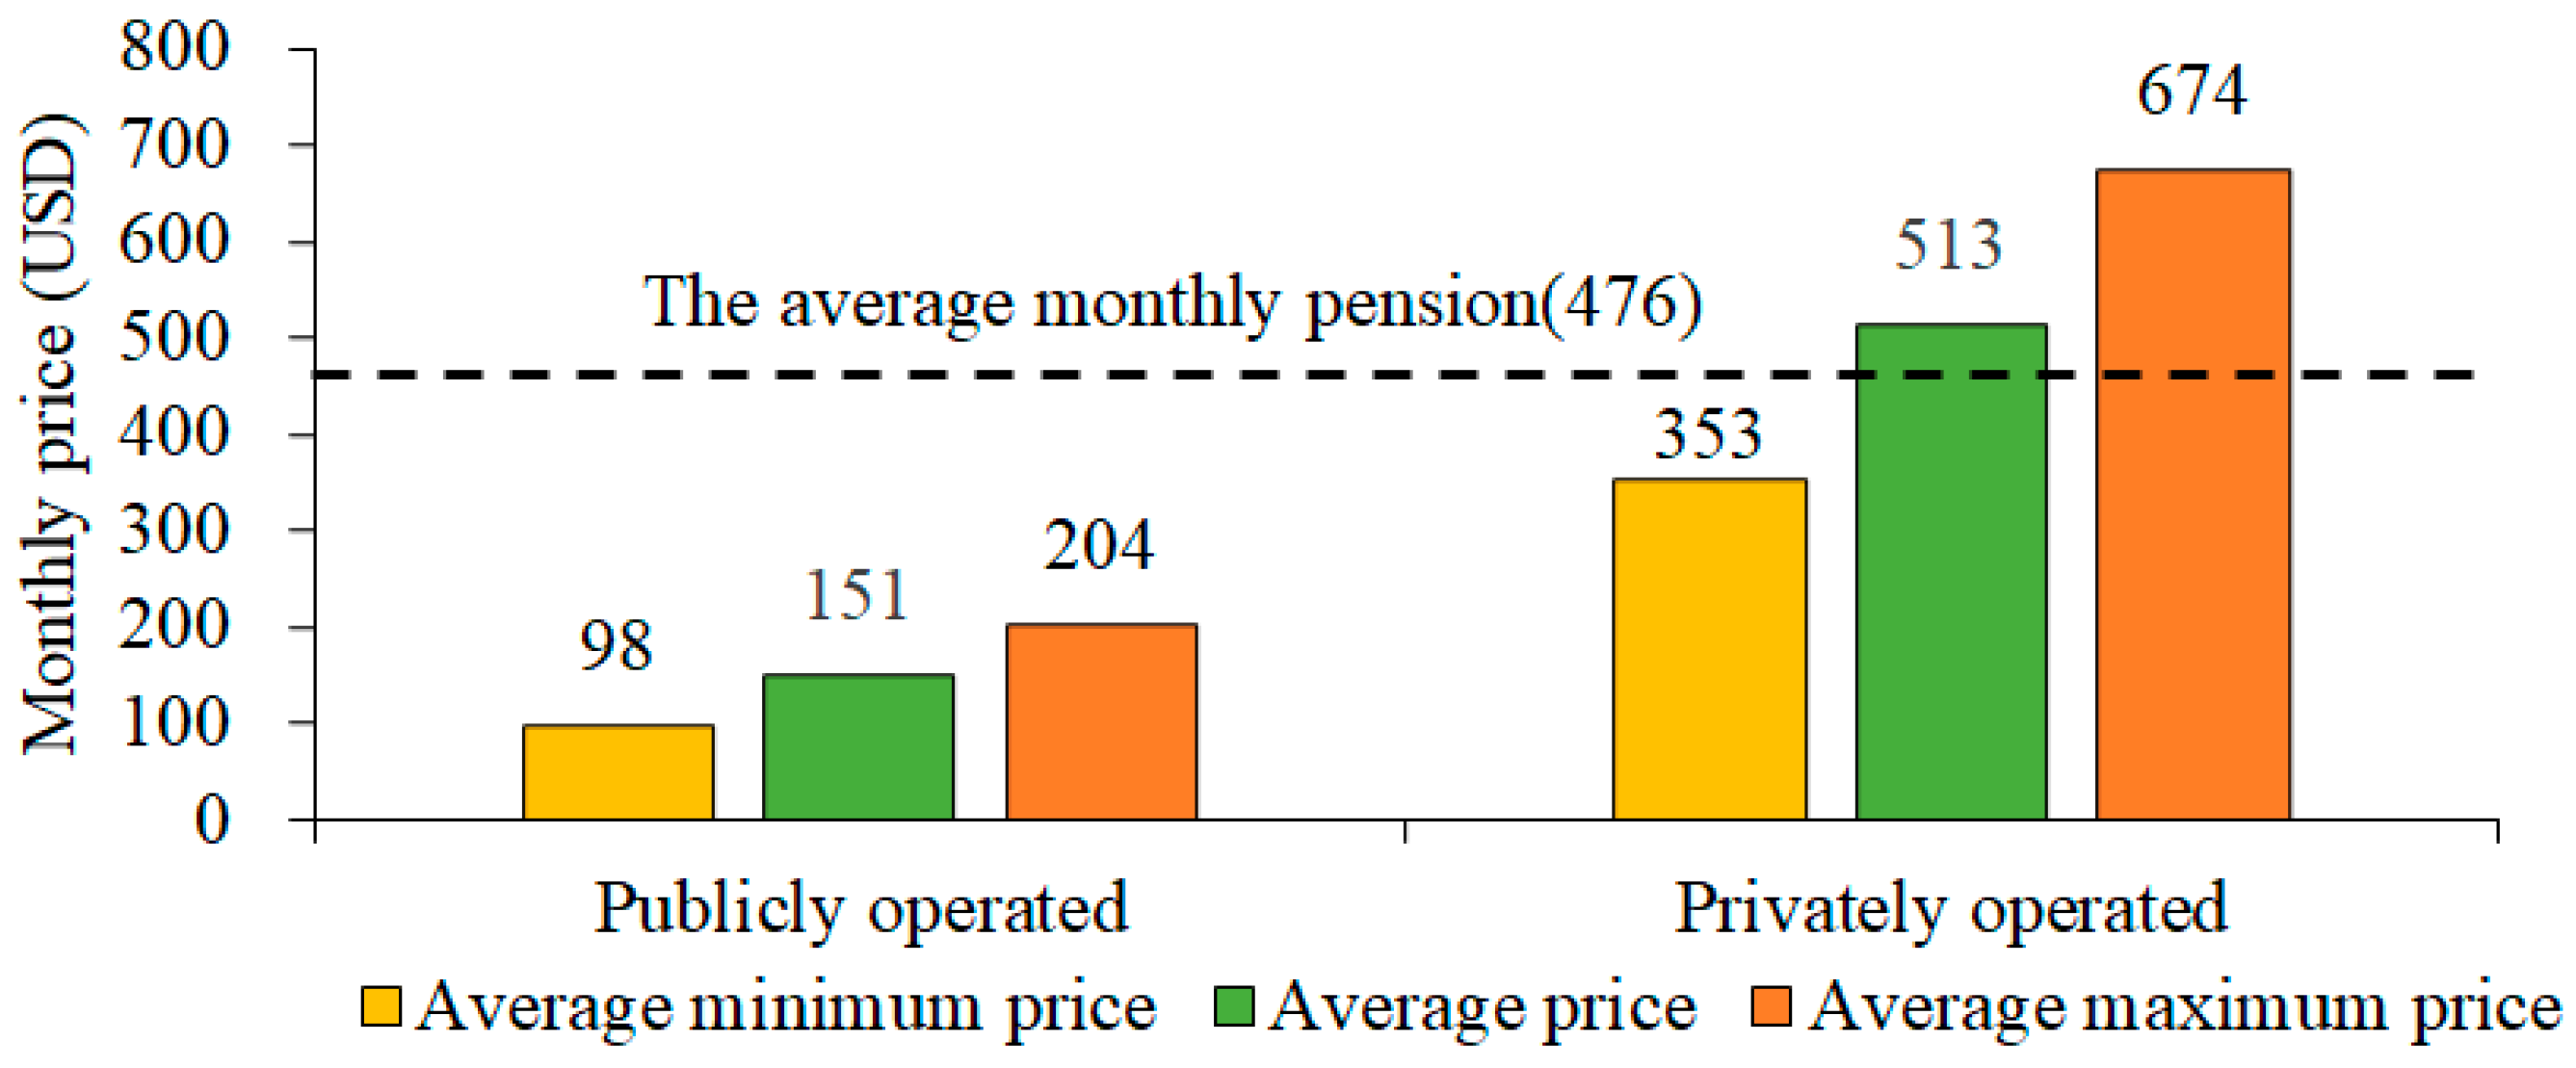
Figure 14 quantifies this public–private differential, demonstrating that privately operated nursing homes command substantially higher prices across all pricing tiers—minimum, average, and maximum. The minimum price point for privately operated facilities (2547 yuan/353 USD) exceeds even the average price of publicly operated facilities (1087 yuan/151 USD), while maximum prices in private facilities (4858 yuan/674 USD) significantly exceed the average pension benchmark. This public–private dichotomy creates pronounced spatial inequalities in economic accessibility. The main reason is that the suburban districts of Kunming have relatively low population density and limited market demand, which has resulted in fewer privately operated nursing homes in these regions. Consequently, suburban nursing facilities are predominantly publicly operated.
The tourism-oriented districts of Anning and Chenggong present particularly interesting cases of diminished economic accessibility despite their suburban location. Anning, renowned for its therapeutic hot springs, and Chenggong, situated adjacent to the scenic Dianchi Lake, have attracted substantial investment in premium rehabilitation-focused nursing facilities targeting affluent retirees from throughout Yunnan Province and beyond. These specialized facilities implement premium pricing strategies that significantly exceed local pension levels, creating accessibility challenges for local older adult residents despite their suburban location.
This spatial heterogeneity in economic accessibility underscores the complex interplay between facility ownership structure, location advantages, and target market orientation in shaping affordability patterns across Kunming’s diverse urban landscape.

3.2.2. Spatial Accessibility of Nursing Homes at the Community Level

This study employs the Gaussian 2SFCA method to analyze spatial accessibility of nursing homes at the community level across Kunming. This methodology incorporates distance decay effects and calculates accessibility indices under three distinct travel modes: private car, public bus, and walking. Table 1 presents the quantitative distribution of accessibility values across communities, while Figure 15 spatially visualizes these accessibility patterns.
The private car accessibility pattern (Figure 15a) reveals the absence of concentrated high-accessibility clusters, with higher accessibility values dispersed predominantly throughout suburban districts. Notably, of the 35 communities classified with normal or higher accessibility, only 7 are located within the four central urban districts. This counterintuitive pattern—central districts having lower accessibility despite higher facility density—reflects the combined effect of two factors: (1) disproportionately high older adult population density exceeding the service capacity of available facilities, and (2) severe traffic congestion reducing the effective service area accessible within time thresholds. These conditions create a situation where the theoretical advantage of higher nursing home density in central districts is negated by demographic and infrastructural constraints.
Public bus accessibility patterns (Figure 15b) demonstrate marginally lower overall accessibility values compared to private car travel but exhibit parallel spatial distribution characteristics. High-accessibility communities remain predominantly concentrated in suburban districts rather than central urban areas. This pattern stems from the compounded effects of older adult care resource limitations, traffic congestion, and additional public transportation constraints including: (1) suboptimal bus stop density in certain areas, and (2) significant distances between population centroids and bus stops in several communities, exceeding the 300 m threshold considered accessible for older adult residents. These factors collectively diminish the effectiveness of public transportation as an accessibility mechanism for older adult care services.
Walking accessibility (Figure 15c) presents the most severe accessibility constraints, with 113 communities (78.5%) classified in the low-accessibility category. High-accessibility communities are predominantly concentrated in southern Kunming, particularly in areas with unique demographic-service configurations: communities with modest older adult populations served by disproportionately large nursing facilities located within walking distance of residential concentrations. Central urban districts consistently demonstrate poor walking accessibility due to the mismatch between facility capacity and population density.
Comparative analysis across all three transport modes reveals consistently inadequate accessibility throughout Kunming. Only 24.3% of communities achieve normal or higher accessibility levels under private car travel conditions, 21.5% under public bus conditions, and merely 13.9% under walking conditions. This systemic accessibility deficit stems primarily from the substantial gap between service capacity and demographic need. Although Kunming’s care bed ratio of 34 beds per 1000 older adults, it falls significantly below the developed metropolitan regions such as Beijing (49 beds per 1000 older adults) [55] and Shanghai (54 beds per 1000 older adults) [56]. Secondary contributing factors include Kunming’s expansive geographic footprint, challenging topography with significant elevation changes, and suboptimal transportation infrastructure—particularly in peripheral areas.
The hierarchical relationship in accessibility across transportation modes (private car > public bus > walking) highlights the critical role of mobility in determining effective access to older adult care services. Higher travel speeds expand the theoretical service area of nursing facilities, allowing for more efficient resource utilization. However, this accessibility advantage is disproportionately available to older adult residents with private vehicle access, creating potential equity concerns given that many older adult individuals have limited mobility and depend primarily on public transportation or walking.
This analysis further demonstrates that increased travel speeds produce complex effects on accessibility distribution. As travel convenience improves with faster modes, service areas expand, and regional accessibility becomes more equitably distributed. Paradoxically, however, this expansion does not necessarily translate to improved accessibility in central urban areas due to the counterbalancing effects of traffic congestion and high population density. This highlights the need for integrated planning approaches that consider both the spatial distribution and capacity of older adult care facilities in relation to population density, transportation infrastructure, and mobility patterns of the older adult population.

4. Discussion

4.1. Spatial Distribution Patterns and Their Implications

The spatial distribution analysis reveals distinct clustering patterns of nursing homes in Kunming that both align with and diverge from patterns observed in other Chinese cities. The monocentric distribution pattern with a core-periphery structure is consistent with findings from studies in Beijing [23] and Shanghai [57], suggesting this may be a characteristic pattern in rapidly urbanizing Chinese cities. However, the dual-core structure emerging in Kunming’s southern districts represents a distinctive pattern possibly attributable to the region’s unique topography and tourism appeal.
Our findings indicate that publicly operated facilities predominate in suburban areas while privately operated facilities concentrate in central urban districts correspond with previous research [58] showing that market-driven older adult care provision follows commercial logic prioritizing dense markets and higher-income demographics. This study extends this understanding by revealing how these ownership patterns create distinctive spatial inequality patterns in economic accessibility.
The spatial mismatch between nursing home distribution and older adult population density in Kunming’s central urban districts contrasts with findings from a Beijing study [59]. This research demonstrated that despite older adult population decentralization from Beijing’s urban core to new development areas between 2010 and 2020, residential care facilities strategically realigned to improve accessibility and spatial equity across the metropolitan region. Unlike Beijing’s coordinated approach, Kunming exhibits a more pronounced disconnect between facility distribution and demographic patterns, suggesting significant challenges in balancing market-driven development with equitable service provision.
This spatial mismatch in Kunming is further complicated by another distinctive pattern observed in its suburban districts. The concentration of large-scale facilities in scenic suburban areas reflects the concept of “health tourism” emerging in Chinese tourism-rich regions [60], where facilities leverage natural amenities to attract mobile, affluent older adult populations from broader geographic ranges. This development pattern, while economically beneficial for the region, further contributes to the spatial inequities in older adult care provision across Kunming’s metropolitan area.
The spatial coupling mechanism between population aging and older adult care facilities in Kunming reveals a complex interplay of demographic transitions, market forces, and institutional responses that operate across multiple spatial scales [61]. At the macro level, the observed spatial mismatch reflects what we term “asynchronous spatial coupling,” where facility development responds to economic opportunities rather than demographic demand patterns. This creates a temporal lag between aging-in-place processes—where long-term residents age within established neighborhoods [62]—and market-driven facility development that prioritizes areas with favorable investment conditions. The coupling mechanism operates through three primary pathways: demographic concentration effects, where aging populations cluster in specific urban areas due to housing tenure and social network factors; institutional clustering effects, where facilities agglomerate near existing healthcare infrastructure and transportation nodes to achieve operational efficiencies; and policy-mediated spatial responses, where government interventions attempt to redirect market forces toward underserved areas. However, our findings suggest that these coupling mechanisms are often misaligned, particularly in central urban districts where high demographic demand coincides with limited facility expansion capacity due to land constraints and regulatory barriers. The emergence of regional service facilities in suburban tourism areas represents an alternative coupling model that decouples from local demographic patterns to serve broader geographic markets, fundamentally altering traditional assumptions about spatial proximity in care provision. This multi-scalar coupling dynamic suggests that effective planning for aging societies requires understanding not only local demographic needs but also the broader economic and institutional forces that shape facility location decisions across metropolitan regions.

4.2. Multi-Dimensional Accessibility Challenges

The economic accessibility analysis reveals a complex picture where pension adequacy varies substantially across districts and facility types. While our findings indicate general affordability in suburban districts, the significant price premium in privately operated facilities creates economic barriers for many urban older adult residents [63]. Unlike coastal cities with higher average pension levels, Kunming’s position as a regional center in a less economically developed province amplifies these affordability challenges.
The spatial accessibility analysis utilizing the 2SFCA method indicates that transportation mode is a significant factor influencing access to older adult care, aligning with the findings of Chen et al. [64], which highlighted the substantial impact of mobility constraints on older adult populations. However, our finding that even private car accessibility remains poor in central districts diverges from studies in Wuhan, where transportation network density typically enhances central district accessibility [24]. This may reflect Kunming’s distinctive urban morphology, characterized by relatively severe traffic congestion and challenging topography.
The counterintuitive finding that increased mobility (via private car) fails to significantly enhance accessibility in central districts contrasts with findings from international studies [65,66] that generally demonstrate positive correlations between mobility and service accessibility. This suggests that Kunming’s accessibility challenges stem more fundamentally from inadequate facility capacity relative to population needs rather than from transportation limitations alone.

4.3. Policy Recommendations

Based on our empirical analysis of nursing home distribution and accessibility in Kunming, we propose three targeted policy recommendations to address the identified challenges.
Firstly, implementation of demand-oriented planning mechanisms is essential to address the spatial mismatch between nursing home distribution and older adult population needs, supporting SDG 11. Municipal authorities should establish data-driven older adult care demand forecasting systems at the community level, incorporating demographic projections and land availability to guide strategic facility placement. This aligns with research by Zhang et al. [67] demonstrating that demand-based facility planning significantly improves service equity. For central urban districts (Wuhua and Panlong), priority should focus on adaptive reuse of existing buildings and mandatory inclusionary requirements in redevelopment projects. For suburban districts (Anning and Chenggong), emphasis should be on integrating local demand considerations into existing large-scale facility planning. For peripheral districts, community-based care hubs combining multiple services should be prioritized to achieve economies of scale. Specifically, Kunming should incorporate older adult service facilities into its statutory planning framework, following successful practices implemented in Shanghai’s “14th Five-Year Plan for Older Adult Care Service Development,” which established minimum requirements for older adult care facility in all new residential developments [68]. Particular attention should focus on increasing small to medium-sized public nursing homes in central urban districts where our analysis identified critical service gaps despite high older adult population density.
Secondly, enhancing economic accessibility requires coordinated public–private partnerships through progressive pricing policies, aligning with SDG 10. Our findings revealed significant economic barriers in central urban and tourism-oriented districts dominated by higher-priced private facilities. Following the research on affordable older adult care [69], we recommend implementing a multi-level subsidy framework targeting both providers and older adult consumers. In tourism-oriented districts, establish dual-track pricing systems requiring facilities to reserve beds for local residents at regulated rates. In central urban districts, focus on direct operational subsidies for facilities accepting low-income residents. In underserved peripheral areas, prioritize public sector investment with means-tested vouchers for residents.
Thirdly, transportation integration represents a critical intervention for improving spatial accessibility, particularly given our finding that only 24.3% of communities achieve normal or higher accessibility via private car and merely 13.9% via walking. Central urban districts should prioritize micro-mobility solutions and barrier-free pedestrian infrastructure. Suburban districts require inter-district shuttle services connecting facilities with urban transit networks. Peripheral districts need dedicated older adult transportation services linking residential clusters to care facilities. Our spatial accessibility analysis particularly supports focusing these transportation enhancements in the identified low-accessibility communities within Wuhua and Panlong districts.
These targeted policy interventions, informed by empirical spatial analysis and successful practices elsewhere, offer practical pathways to address the accessibility challenges identified in Kunming’s older adult care system, providing a foundation for more equitable service provision in the context of rapid demographic aging.

5. Conclusions

This study utilized spatial analytical methods to examine the distribution and accessibility of nursing homes in Kunming. Our findings revealed a monocentric pattern with facilities concentrated within central urban districts, creating a spatial mismatch with older adult population needs. The institutional dichotomy between publicly and privately operated facilities has established a dual-track system with distinct spatial configurations and price points.
Accessibility analysis demonstrated significant challenges across both economic and spatial dimensions. Economic barriers are particularly pronounced in central urban and tourism-oriented districts dominated by higher-priced private facilities. Spatial accessibility remains inadequate across all transportation modes, with the majority of communities experiencing poor or very poor accessibility regardless of transportation method. These limitations primarily stem from insufficient service capacity relative to demographic needs rather than merely transportation constraints.
As Kunming continues to experience demographic aging, strategic coordination between urban planning, transportation, and social welfare sectors will be essential for developing a sustainable older adult care system that balances market efficiency with equitable access and environmental considerations. From an institutional governance perspective, our findings highlight the critical need for enhanced public–private collaboration mechanisms that can leverage the complementary strengths of both sectors while addressing their respective limitations. The observed dual-track system necessitates governance frameworks that integrate public oversight with private sector innovation, ensuring service quality standardization across facility types while maintaining market competitiveness and accessibility equity. The identified accessibility challenges and spatial mismatches represent sustainability risks that require immediate policy attention to prevent long-term social and economic inequities. This analytical framework provides valuable insights for integrated planning efforts in rapidly aging secondary cities throughout China and beyond, contributing to the achievement of Sustainable Development Goals and promoting sustainable urbanization in aging societies. Future research should continue to explore the intersection of demographic transition, spatial equity, and sustainability to support evidence-based policy interventions in rapidly changing urban contexts.

6. Limitations and Future Research Directions

Several limitations warrant consideration when interpreting this study’s findings. First, the analysis focuses on registered nursing homes, potentially overlooking informal care arrangements that may significantly contribute to older adult care in Kunming. Second, the accessibility analysis employs standardized travel times that may not fully capture the heterogeneous mobility patterns of older adult residents with varying physical capabilities. Future research should incorporate actual travel behavior data from older adult residents to enhance model accuracy.
Additionally, this study primarily examines supply-side accessibility factors, with limited attention to demand-side preferences. Future research should incorporate qualitative dimensions of accessibility, including cultural preferences, social networks, and subjective perceptions of facility quality. Longitudinal analysis tracking accessibility changes across rapid urbanization would further enhance understanding of dynamic accessibility patterns. Comparative studies between Kunming and other second-tier Chinese cities facing similar demographic transitions would also help identify generalizable patterns versus context-specific challenges.

Author Contributions

Conceptualization, G.X.; Methodology, W.D. and G.X.; Software, W.D.; Validation, W.D.; Formal analysis, G.X.; Investigation, R.M., M.M. and H.L.; Resources, W.D.; Data curation, W.D.; Writing—original draft, W.D. and G.X.; Writing—review & editing, W.D. and G.X.; Visualization, W.D. and G.X.; Supervision, J.X. and S.M.; Funding acquisition, M.M. All authors have read and agreed to the published version of the manuscript.

Funding

This work was supported by Yunnan Fundamental Research Projects (grant NO. 202501CF070061, and NO. 202401CF070194), the Open Program of the Key Laboratory of Mountain Town Construction and New Technologies of the Ministry of Education (LNTCCMA-20250106).

Institutional Review Board Statement

Not applicable. This study did not involve humans or animals. The research was based solely on publicly available secondary data regarding the spatial distribution and accessibility of nursing home facilities in Kunming, China. No personal information of nursing home residents or staff was collected or analyzed. The study focused exclusively on facility-level characteristics (location, capacity, pricing) and geographic accessibility analysis using spatial analytical methods, therefore ethical approval was not required.

Informed Consent Statement

Not applicable.

Data Availability Statement

The original contributions presented in this study are included in the article. Further inquiries can be directed to the corresponding author.

Conflicts of Interest

The authors declare no conflict of interest.

References

  1. National Bureau of Statistics of China. China Statistical Yearbook. 2024. Available online: https://data.stats.gov.cn/easyquery.htm?cn=C01 (accessed on 17 March 2025).
  2. Li, Q. Report on the Work of the Government: Delivered at the Third Session of the 14th National People’s Congress. The State Council of the People’s Republic of China. 2025. Available online: https://www.gov.cn/yaowen/liebiao/202503/content_7013163.htm (accessed on 17 March 2025).
  3. Zeng, Y.; Hesketh, T. The effects of China’s universal two-child policy. Lancet 2016, 388, 1930–1938. [Google Scholar] [CrossRef]
  4. Li, M.; Peng, P.; Ao, Y.; Zhou, Z.; Zuo, J.; Martek, I. Equity in public decision-making: A dynamic comparative study of urban–rural elderly care institution resource allocation in China. Humanit. Soc. Sci. Commun. 2024, 11, 1526. [Google Scholar] [CrossRef]
  5. Carroll, C.; Sworn, K.; Booth, A.; Tsuchiya, A.; Maden, M.; Rosenberg, M. Equity in healthcare access and service coverage for older people: A scoping review of the conceptual literature. Integr. Healthc. J. 2022, 4, e000092. [Google Scholar] [CrossRef]
  6. Sritart, H.; Tuntiwong, K.; Miyazaki, H.; Taertulakarn, S. Disparities in healthcare services and spatial assessments of mobile health clinics in the border regions of Thailand. Int. J. Environ. Res. Public Health 2021, 18, 782. [Google Scholar] [CrossRef]
  7. Huang, X.; Gong, P.; White, M.; Zhang, B. Research on spatial distribution characteristics and influencing factors of pension resources in Shanghai community-life circle. ISPRS Int. J. Geo-Inf. 2022, 11, 518. [Google Scholar] [CrossRef]
  8. United Nations. Sustainable Development Goals. 2015. Available online: https://www.un.org/sustainabledevelopment/sustainable-development-goals/ (accessed on 4 June 2025).
  9. Li, J.; Shi, L.; Liang, H.; Ding, G.; Xu, L. Urban-rural disparities in health care utilization among Chinese adults from 1993 to 2011. BMC Health Serv. Res. 2018, 18, 102. [Google Scholar] [CrossRef]
  10. Quigley, D.D.; Estrada, L.V.; Alexander, G.L.; Dick, A.; Stone, P.W. Differences in care provided in urban and rural nursing homes in the United States: Literature review. J. Gerontol. Nurs. 2021, 47, 48–56. [Google Scholar] [CrossRef]
  11. Qian, Z. Master plan, plan adjustment and urban development reality under China’s market transition: A case study of Nanjing. Cities 2013, 30, 77–88. [Google Scholar] [CrossRef]
  12. Huang, X.; Gong, P.; White, M. Study on spatial distribution equilibrium of elderly care facilities in downtown Shanghai. Int. J. Environ. Res. Public Health 2022, 19, 7929. [Google Scholar] [CrossRef] [PubMed]
  13. Yin, W.; Liu, S. Study on spatial distribution and accessibility of the elderly care institutions in Shanghai. Mod. Urban Res. 2021, 6, 17–23. [Google Scholar]
  14. Si, M. A study on the characteristics of spatial distribution of care facilities and capacities for the elderly in Shanghai. J. Archit. 2018, 2, 90–94. [Google Scholar]
  15. Chen, J.; Yao, S. Study on spatial distribution of residential care facilities in Shanghai. J. East China Norm. Univ. (Nat. Sci.) 2018, 3, 157–169. [Google Scholar]
  16. Jia, M.; Zhou, Y.; Lin, J. Spatial distribution characteristics and existing problems of privately operated elderly care facilities in Beijing. Beijing Plan. Constr. 2017, 5, 62–66. [Google Scholar]
  17. Wood, S.M.; Alston, L.; Beks, H.; Mc Namara, K.; Coffee, N.T.; Clark, R.A.; Shee, A.W.; Versace, V.L. The application of spatial measures to analyse health service accessibility in Australia: A systematic review and recommendations for future practice. BMC Health Serv. Res. 2023, 23, 330. [Google Scholar] [CrossRef]
  18. Chen, X.; Jia, P. A comparative analysis of accessibility measures by the two-step floating catchment area (2SFCA) method. Int. J. Geogr. Inf. Sci. 2019, 33, 1739–1758. [Google Scholar] [CrossRef]
  19. Huang, B.-X.; Chiou, S.-C.; Li, W.-Y. Accessibility and street network characteristics of urban public facility spaces: Equity research on parks in Fuzhou city based on GIS and space syntax model. Sustainability 2020, 12, 3618. [Google Scholar] [CrossRef]
  20. Salze, P.; Banos, A.; Oppert, J.-M.; Charreire, H.; Casey, R.; Simon, C.; Chaix, B.; Badariotti, D.; Weber, C. Estimating spatial accessibility to facilities on the regional scale: An extended commuting-based interaction potential model. Int. J. Health Geogr. 2011, 10, 2. [Google Scholar] [CrossRef]
  21. Tao, Z.; Cheng, Y.; Liu, J. Hierarchical two-step floating catchment area (2SFCA) method: Measuring the spatial accessibility to hierarchical healthcare facilities in Shenzhen, China. Int. J. Equity Health 2020, 19, 164. [Google Scholar] [CrossRef]
  22. Dai, D. Black residential segregation, disparities in spatial access to health care facilities, and late-stage breast cancer diagnosis in metropolitan Detroit. Health Place 2010, 16, 1038–1052. [Google Scholar] [CrossRef] [PubMed]
  23. Tao, Z.; Cheng, Y. Modelling the spatial accessibility of the elderly to healthcare services in Beijing, China. Environ. Plan. B Urban Anal. City Sci. 2019, 46, 1132–1147. [Google Scholar] [CrossRef]
  24. Luo, J.; Chen, G.; Li, C.; Xia, B.; Sun, X.; Chen, S. Use of an E2SFCA method to measure and analyse spatial accessibility to medical services for elderly people in Wuhan, China. Int. J. Environ. Res. Public Health 2018, 15, 1503. [Google Scholar] [CrossRef]
  25. Jin, M.; Deng, Q.; Wang, S.; Wei, L. Equity evaluation of elderly-care institutions based on Ga2SFCA: The case study of Jinan, China. Sustainability 2023, 15, 16943. [Google Scholar] [CrossRef]
  26. Fransen, K.; Neutens, T.; De Maeyer, P.; Deruyter, G. A commuter-based two-step floating catchment area method for measuring spatial accessibility of daycare centers. Health Place 2015, 32, 65–73. [Google Scholar] [CrossRef] [PubMed]
  27. McGrail, M.R.; Humphreys, J.S. Measuring spatial accessibility to primary care in rural areas: Improving the effectiveness of the two-step floating catchment area method. Appl. Geogr. 2009, 29, 533–541. [Google Scholar] [CrossRef]
  28. Delamater, P.L. Spatial accessibility in suboptimally configured health care systems: A modified two-step floating catchment area (M2SFCA) metric. Health Place 2013, 24, 30–43. [Google Scholar] [CrossRef]
  29. Luo, W.; Wang, F. Measures of spatial accessibility to health care in a GIS environment: Synthesis and a case study in the Chicago region. Environ. Plan. B Plan. Des. 2003, 30, 865–884. [Google Scholar] [CrossRef]
  30. Comber, A.J.; Brunsdon, C.; Radburn, R. A spatial analysis of variations in health access: Linking geography, socio-economic status and access perceptions. Int. J. Health Geogr. 2011, 10, 44. [Google Scholar] [CrossRef]
  31. Caldwell, J.T.; Ford, C.L.; Wallace, S.P.; Wang, M.C.; Takahashi, L.M. Intersection of living in a rural versus urban area and race/ethnicity in explaining access to health care in the United States. Am. J. Public Health 2016, 106, 1463–1469. [Google Scholar] [CrossRef]
  32. Kelly, C.; Hulme, C.; Farragher, T.; Clarke, G. Are differences in travel time or distance to healthcare for adults in global north countries associated with an impact on health outcomes? A systematic review. BMJ Open 2016, 6, e013059. [Google Scholar] [CrossRef]
  33. Kaneko, M.; Ohta, R.; Mathews, M. Rural and urban disparities in access and quality of healthcare in the Japanese healthcare system: A scoping review. BMC Health Serv. Res. 2025, 25, 667. [Google Scholar] [CrossRef] [PubMed]
  34. Park, Y.J.; Martin, E.G. Geographic disparities in access to nursing home services: Assessing fiscal stress and quality of care. Health Serv. Res. 2018, 53, 2932–2951. [Google Scholar] [CrossRef]
  35. Stineman, M.G.; Xie, D.; Streim, J.E.; Pan, Q.; Kurichi, J.E.; Henry-Sánchez, J.T.; Zhang, Z.; Saliba, D. Home accessibility, living circumstances, stage of activity limitation, and nursing home use. Arch. Phys. Med. Rehabil. 2012, 93, 1609–1616. [Google Scholar] [CrossRef]
  36. Gardner, P.J. Natural neighborhood networks—Important social networks in the lives of older adults aging in place. J. Aging Stud. 2011, 25, 263–271. [Google Scholar] [CrossRef]
  37. Webber, S.C.; Porter, M.M.; Menec, V.H. Mobility in older adults: A comprehensive framework. Gerontol. 2010, 50, 443–450. [Google Scholar] [CrossRef]
  38. Huang, Y.-C.; Chu, C.-L.; Ho, C.-S.; Lan, S.-J.; Hsieh, C.-H.; Hsieh, Y.-P. Decision-making factors affecting different family members regarding the placement of relatives in long-term care facilities. BMC Health Serv. Res. 2014, 14, 21. [Google Scholar] [CrossRef] [PubMed]
  39. Jensen, P.M.; Fraser, F.; Shankardass, K.; Epstein, R.; Khera, J. Are long-term care residents referred appropriately to hospital emergency departments? Can. Fam. Physician 2009, 55, 500–505. [Google Scholar]
  40. Zhou, Y.; Yuan, Q.; Ding, F.; Chen, M.; Yang, C.; Guo, T. Demand, mobility, and constraints: Exploring travel behaviors and mode choices of older adults using a facility-based framework. J. Transp. Geogr. 2022, 102, 103368. [Google Scholar] [CrossRef]
  41. Statistics Bureau of Kunming. Kunming Statistical Yearbook. 2023. Available online: https://tjj.km.gov.cn/2023tjnj/ (accessed on 20 December 2024).
  42. Kunming Municipal People’s Government Office. Notice on the Issuance of Kunming’s Three-Year Action TASK Division Plan for Promoting High-Quality Development of Older Adult Care Services (2024–2026). 8 January 2025. Available online: https://www.km.gov.cn/c/2025-01-08/4931867.shtml (accessed on 17 March 2025).
  43. Ministry of Civil Affairs of the People’s Republic of China. Guidelines for Service Standard System Construction of Senior Care Organization (MZ/T 170-2021). 2021. Available online: https://www.hengyang.gov.cn/DFS//file/2021/12/02/20211202162049621qtbmmb.pdf (accessed on 17 March 2025).
  44. Yunnan Provincial Department of Human Resources and Social Security. Statistical Bulletin on the Development of Human Resources and Social Security in Yunnan Province in 2023. 2024. Available online: https://hrss.yn.gov.cn/Uploads/NewsPhoto/2024-07-17/0f39c7dc-70fd-4f5b-a735-97dac1dd955d.pdf (accessed on 17 March 2025).
  45. Ministry of Transport of the People’s Republic of China. Design Specification for Highway Alignment (JTG D20-2017). 2017. Available online: https://xxgk.mot.gov.cn/2020/jigou/glj/202006/P020230330590791909604.pdf (accessed on 17 March 2025).
  46. Getis, A. Temporal land-use pattern analysis with the use of nearest neighbor and quadrat methods. Ann. Assoc. Am. Geogr. 1964, 54, 391–399. [Google Scholar] [CrossRef]
  47. Hu, H.; Shao, H.; Li, Y.; Guan, M.; Tong, J. GIS-Based Analysis of Elderly Care Facility Distribution and Supply–Demand Coordination in the Yangtze River Delta. Land 2025, 14, 723. [Google Scholar] [CrossRef]
  48. Carlos, H.A.; Shi, X.; Sargent, J.; Tanski, S.; Berke, E.M. Density estimation and adaptive bandwidths: A primer for public health practitioners. Int. J. Health Geogr. 2010, 9, 39. [Google Scholar] [CrossRef] [PubMed]
  49. Yu, W.; Ai, T. The visualization and analysis of urban facility pois using network kernel density estimation constrained by multi-factors. Bol. Cienc. Geod. 2014, 20, 902–926. [Google Scholar] [CrossRef]
  50. Di, X.; Wang, L.; Yang, L.; Dai, X. Impact of economic accessibility on realized utilization of home-based healthcare services for the older adults in China. Healthcare 2021, 9, 218. [Google Scholar] [CrossRef] [PubMed]
  51. Guo, X.; Zeng, S.; Namaiti, A.; Zeng, J. Evaluation of supply–demand matching of public health resources based on Ga2SFCA: A case study of the central urban area of Tianjin. ISPRS Int. J. Geo-Inf. 2023, 12, 156. [Google Scholar] [CrossRef]
  52. Penchansky, R.; Thomas, J.W. The concept of access: Definition and relationship to consumer satisfaction. Med. Care 1981, 19, 127–140. [Google Scholar] [CrossRef]
  53. van Heerden, Q.; Karsten, C.; Holloway, J.; Petzer, E.; Burger, P.; Mans, G. Accessibility, affordability, and equity in long-term spatial planning: Perspectives from a developing country. Transp. Policy 2022, 120, 104–119. [Google Scholar] [CrossRef]
  54. Kwon, J.; Han, E.-J.; Kim, H.K. An analysis of the effects of the income level of the family caregivers for the recipients in long-term care facilities on the willingness to pay for use of better services: A cross-sectional study. J. Korean Gerontol. Nurs. 2023, 25, 103–115. [Google Scholar] [CrossRef]
  55. Office of the Beijing Municipal Working Committee on Aging; Beijing Association of the Elderly; China Philanthropy Re-search Institute of Beijing Normal University. Beijing Municipal Report on Elderly Care Development (2023). 2024. Available online: https://mzj.beijing.gov.cn/attach/0/e579da4186d440e7890d97711cc87d91.pdf (accessed on 17 March 2025).
  56. Green Qingpu. 54 Older Adult Care Beds Per Thousand Residents! Qingpu Continues to Enhance Older Adult Care Service Capacity Building. 2023. Available online: https://www.shqp.gov.cn/shqp/qpyw/20230417/1113401.html (accessed on 17 March 2025).
  57. Wang, C.; Geng, X. Assessing the spatial equity of the aged care institutions based on the improved potential model: A case study in Shanghai, China. Front. Public Health 2024, 12, 1428424. [Google Scholar] [CrossRef]
  58. Bi, X.; Li, M. Equity versus efficiency: A spatial analysis of residential aged care resources in Beijing. Chin. J. Sociol. 2023, 9, 127–158. [Google Scholar] [CrossRef]
  59. Sun, X.; Cheng, Y.; Tao, Z. Spatial accessibility and equity of residential care facilities in Beijing from 2010 to 2020. Health Place 2024, 86, 103219. [Google Scholar] [CrossRef]
  60. Shi, S.; Liu, G. Spatial matching relationship between health tourism destinations and population aging in the Yangtze River Delta Urban Agglomeration. Environ. Res. Commun. 2023, 5, 095001. [Google Scholar] [CrossRef]
  61. Tao, Z.; Cheng, Y.; Dai, T.; Rosenberg, M.W. Spatial optimization of residential care facility locations in Beijing, China: Maximum equity in accessibility. Int. J. Health Geogr. 2014, 13, 33. [Google Scholar] [CrossRef]
  62. Wiles, J.L.; Leibing, A.; Guberman, N.; Reeve, J.; Allen, R.E.S. The meaning of “aging in place” to older people. Gerontologist 2012, 52, 357–366. [Google Scholar] [CrossRef] [PubMed]
  63. Feng, Z.; Glinskaya, E.; Chen, H.; Gong, S.; Qiu, Y.; Xu, J.; Yip, W. Long-term care system for older adults in China: Policy landscape, challenges, and future prospects. Lancet 2020, 396, 1362–1372. [Google Scholar] [CrossRef] [PubMed]
  64. Chen, L.; Chen, T.; Lan, T.; Chen, C.; Pan, J. The contributions of population distribution, healthcare resourcing, and transportation infrastructure to spatial accessibility of health care. Inq. J. Health Care Organ. Provis. Financ. 2023, 60, 00469580221146041. [Google Scholar] [CrossRef] [PubMed]
  65. Gorman, M.; Jones, S.; Turner, J. Older people, mobility and transport in low- and middle-income countries: A review of the research. Sustainability 2019, 11, 6157. [Google Scholar] [CrossRef]
  66. Sasaki, K.; Aihara, Y.; Yamasaki, K. The effect of accessibility on aged people’s use of long-term care ser-vice. Transp. Res. Procedia 2017, 25, 4381–4391. [Google Scholar] [CrossRef]
  67. Zhang, Y.; Li, T.; Yuan, Y.; Xu, F.; Yang, F.; Sun, F.; Li, Y. Demand-driven Urban Facility Visit Prediction. ACM Trans. Intell. Syst. Technol. 2024, 15, 1–24. [Google Scholar] [CrossRef]
  68. Shanghai Civil Affairs Bureau. Shanghai’s “14th Five-Year Plan” for Elderly Care Service Development. 2021. Available online: https://mzj.sh.gov.cn/mz-jhgh/20210928/acb2374791b24a35b39bfd5a2a1c47df.html (accessed on 17 March 2025).
  69. Golant, S.M. Affordable Clustered housing-care: A category of long-term care options for the elderly poor. J. Hous. Elder. 2008, 22, 3–44. [Google Scholar] [CrossRef]
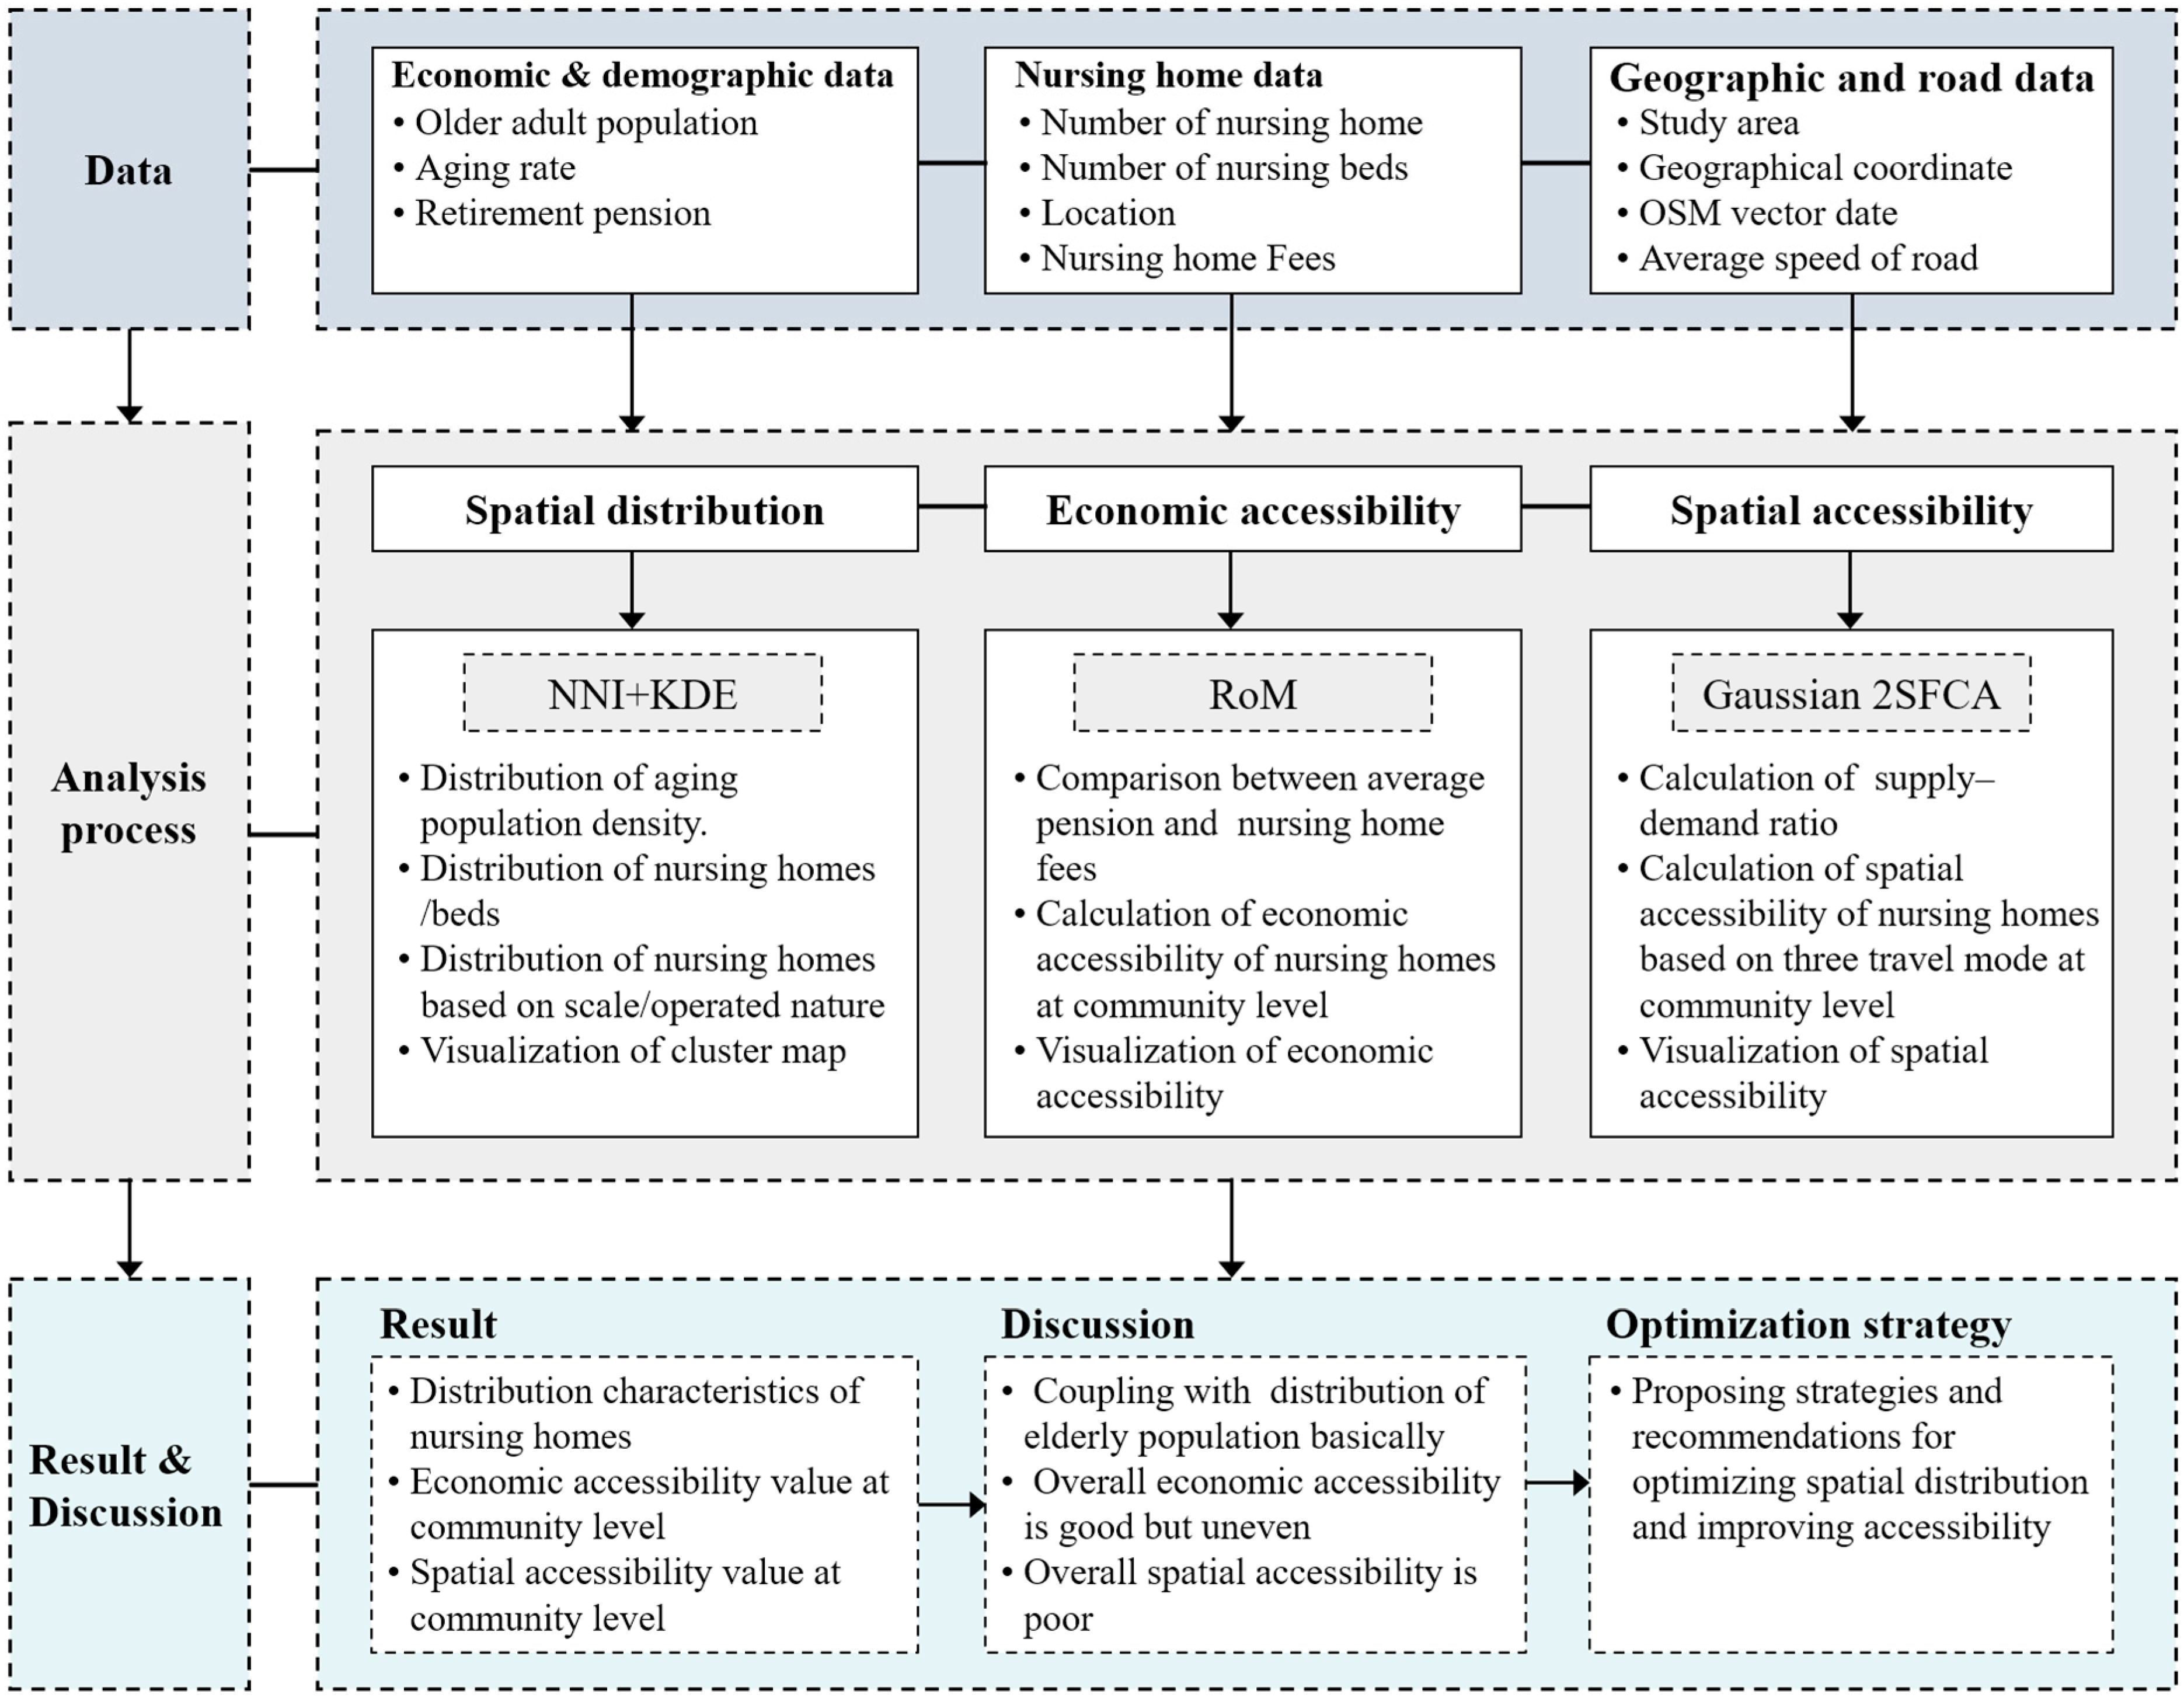
Figure 1. Study framework.
Sustainability 17 07606 g001
Figure 2. Study area.
Sustainability 17 07606 g002
Figure 3. District-level distribution of nursing homes and beds in Kunming.
Sustainability 17 07606 g003
Figure 4. Number of older adult people and the aging rate in each district of Kunming.
Sustainability 17 07606 g004
Figure 5. Comparative proportions of population, aging population, nursing homes, and nursing beds across districts in Kunming city.
Sustainability 17 07606 g005
Figure 6. Comparation between the care beds per 1000 older adults and the aging rate across districts in Kunming city.
Sustainability 17 07606 g006
Figure 7. Distribution of nursing homes by scale across Kunming districts in relation to aging population.
Sustainability 17 07606 g007
Figure 8. Spatial distribution pattern of nursing homes by scale in Kunming.
Sustainability 17 07606 g008
Figure 9. Distribution of nursing homes by operational nature across different scales.
Sustainability 17 07606 g009
Figure 10. Distribution of nursing homes across central urban and suburban districts.
Sustainability 17 07606 g010
Figure 11. Spatial distribution analysis of nursing facilities in Kunming: (a) Kernel density of nursing homes, (b) Kernel density of nursing beds, and (c) Aging population density.
Sustainability 17 07606 g011
Figure 12. District-level comparison of nursing home pricing structure (minimum, average, maximum) relative to average monthly pension in Kunming.
Sustainability 17 07606 g012
Figure 13. Spatial distribution of economic accessibility indices at community level: (a) minimum price ratio, (b) average price ratio, and (c) maximum price ratio.
Sustainability 17 07606 g013
Figure 14. Comparative analysis of pricing structures between publicly and privately operated nursing homes relative to average monthly pension.
Sustainability 17 07606 g014
Figure 15. Spatial distribution of nursing home accessibility indices at community level: (a) accessibility by private car, (b) accessibility by public bus, and (c) accessibility by walking.
Sustainability 17 07606 g015
Table 1. Accessibility values and grades of three transportation modes based on Gaussian 2SFCA.
Travel ModeAccessibility LevelAccessibility ValueNumber of CommunitiesRatio
Private carLow0.0000–0.00078357.6%
Relatively low0.0008–0.00252618.1%
Normal0.0026–0.00571812.5%
Relatively high0.0058–0.0104149.7%
High0.0105–0.028632.1%
WalkingLow0.0000–0.005110170.1%
Relatively low0.0052–0.02452316.0%
Normal0.0246–0.0533149.7%
Relatively high0.0534–0.116242.8%
High0.1163–0.215521.4%
Public busLow0.0000–0.00279163.2%
Relatively low0.0028–0.00772215.3%
Normal0.0078–0.0133149.7%
Relatively high0.0134–0.0205139.0%
High0.0206–0.038542.8%
Disclaimer/Publisher’s Note: The statements, opinions and data contained in all publications are solely those of the individual author(s) and contributor(s) and not of MDPI and/or the editor(s). MDPI and/or the editor(s) disclaim responsibility for any injury to people or property resulting from any ideas, methods, instructions or products referred to in the content.