Article

Does the New-Type Urbanization Policy Help Reduce PM2.5 Pollution? Evidence from Chinese Counties

School of Finance, Harbin University of Commerce, Harbin 150028, China
*
Author to whom correspondence should be addressed.
Sustainability 2025, 17(17), 7585; https://doi.org/10.3390/su17177585
Submission received: 4 July 2025 / Revised: 6 August 2025 / Accepted: 18 August 2025 / Published: 22 August 2025

Abstract

Traditional urbanization prioritizes economic growth but often degrades the environment, challenging SDGs 9 and 13. China’s New-Type Urbanization Policy (NTUP) balances economic expansion, energy conservation, and environmental protection. By applying the difference-in-differences (DID) method, this study examines the causal effect of NTUP on urban air quality, taking the full implementation of NTUP in 2014 and the designated pilot cities as the policy shock and treatment group, respectively. Furthermore, we explore the mediating roles of land use efficiency and innovation efficiency in this relationship. The results show the following: (1) NTUP significantly lowers urban PM2.5, robust to confounders and selection bias; (2) land use and innovation efficiency mediate this effect, verified by Sobel and Bootstrap tests; and (3) policy effectiveness varies by city level, industrial base, and economic structure. These findings highlight NTUP’s environmental benefits and inform sustainable urbanization strategies globally.

1. Introduction

The acceleration of global industrialization has elevated air pollution to the forefront of environmental and public health concerns. Sustainable Development Goals 9 and 13 (SDG 9 and SDG 13) call for resilient infrastructure, integrated and eco-friendly industrial development, creativity, and swift climate change mitigation efforts. Of all airborne contaminants, fine particulate matter—commonly known as PM2.5—stands out as especially hazardous. These microscopic particles, measuring 2.5 μm or smaller, wreak havoc on human health by infiltrating the deepest reaches of our lungs and even crossing into the bloodstream. Their tiny size belies their outsized impact, making them one of the most dangerous pollutants we face today [1,2] making its reduction a core priority of global sustainable development. As the world’s largest developing economy, China faces acute air quality challenges amidst rapid economic growth. Data from the World Bank Group and the National Bureau of Statistics of China (2006–2021) reveal two notable trends: first, China’s GDP rose steadily from approximately USD 2.8 trillion in 2006 to USD 14.7 trillion in 2020; second, annual PM2.5 concentrations initially remained high—peaking in 2013 at 58.47 μg/m3—but then declined sharply to 34.81 μg/m3 by 2020, marking a cumulative reduction of over 40%. This divergence between sustained economic expansion and improving air quality underscores the urgent need to identify effective policy interventions capable of harmonizing development goals with environmental sustainability.
As a particularly detrimental air pollutant impacting both human well-being and the environment, PM2.5 is shaped by a broad spectrum of social, economic, and ecological influences. To uncover the determinants of PM2.5 concentrations, a growing body of literature has explored drivers such as economic growth [3], industrial structure [4], manufacturing activity [5], environmental regulations [6], technological innovation [7], land use [8], and emissions from transportation and industrial sectors [9]. These factors are, to varying degrees, inherently linked to the process of urbanization.
While traditional urbanization has contributed to rapid economic growth, it remains a key driver of air pollution globally. In many developing countries, this growth-centric model has led to significantly higher PM2.5 concentrations compared to developed economies [10]. In South Asia, rapid urbanization and industrialization have improved socioeconomic indicators but severely compromised air quality [11]. Similarly, experiences from MINT economies suggest that urban expansion and economic growth often coincide with environmental degradation [12]. In the case of China, traditional urbanization has exacerbated air pollution through intertwined demographic, economic, and land use mechanisms. First, population and industrial agglomeration have driven up fossil fuel consumption [13]. Second, unregulated urban sprawl has intensified traffic congestion and overheated real estate markets, further elevating PM2.5 levels [14,15]. Third, land capitalization has distorted land use patterns, encouraging excessive industrial land allocation and the concentration of high-polluting industries [16].
In response to these urban-environmental challenges, the international community has explored systematic governance strategies. Empirical studies in European cities indicate that urban spatial fragmentation and excessive expansion of built-up areas significantly increase PM2.5 concentrations, prompting widespread adoption of compact city models across the EU [17]. However, urbanization strategies focused solely on improving transportation sustainability often fall short when evaluated from a general equilibrium perspective [18]. China has launched several national initiatives—such as the National Innovative City (NIC) program [19], Smart City pilots [20], and the Broadband China strategy [21]—which have contributed to air pollution mitigation. However, these individual intervention measures are still not sufficient to address the structural root causes of pollution. Therefore, it is urgently necessary to formulate a comprehensive urbanization strategy that focuses on environmental sustainability and resource utilization efficiency and is promoted in a coordinated manner across the country.
To advance the transformation of urbanization toward sustainability, the New-Type Urbanization Policy (NTUP) offers distinctive institutional advantages by promoting synergy between economic development and environmental governance. Existing studies indicate that NTUP generates notable ecological benefits, with significant variation across provinces [22]. The policy is believed to reduce PM2.5 concentrations through channels such as industrial restructuring, technological innovation, and energy transition [23]. Empirical evidence from the Yangtze River Delta supports the effectiveness of these mechanisms [24], while case studies from Shandong Province further reveal a strong decoupling relationship between NTUP implementation and air pollution levels [25]. These findings underscore NTUP’s potential to reconcile urban expansion with environmental improvement.
Despite emerging evidence, the relationship between NTUP and PM2.5 concentrations remains inconclusive. Several research gaps persist: (1) Most existing studies focus on traditional urbanization, lacking targeted evaluation of NTUP’s environmental effects; (2) Empirical analyses are predominantly conducted at the provincial or municipal level, with limited county-level investigations, which constrains understanding of spatial heterogeneity and urban–rural integration; (3) The mechanisms through which NTUP affects air pollution remain underexplored, particularly regarding mediating factors such as technological innovation and land use efficiency. To mitigate these deficiencies, this research 94 assembles a balanced panel dataset encompassing 1462 Chinese counties spanning 2006–2020. We use DID to estimate the impact of NTUP on PM2.5 concentration. Furthermore, we adopt a mediation analysis framework to examine the roles of land use efficiency and innovation capacity in the policy’s transmission mechanism.
This research offers three major scholarly contributions. First, it provides one of the earliest systematic evaluations of the New-Type Urbanization Policy (NTUP)’s impact on PM2.5 reduction within the broader context of China’s “dual carbon” strategy, thereby expanding the analytical scope of research at the intersection of urbanization and environmental governance. Second, using a balanced panel dataset of 1462 counties from 2006 to 2020, the study adopts a quasi-natural experiment design and applies a difference-in-differences (DID) approach to mitigate endogeneity in assessing NTUP’s environmental effects. Third, it identifies and empirically tests two key transmission mechanisms—land use efficiency and innovation capacity—offering insights into how NTUP shapes environmental outcomes. In addition, the study constructs a “city tier–industrial base” typology to examine heterogeneity in policy impacts, enriching the understanding of spatially differentiated approaches to air pollution control.
To clarify the causal relationship between NTUP and PM2.5 concentrations, this study undertakes a comprehensive analysis including theoretical framing, empirical testing, mechanism exploration, and heterogeneity assessment. Specifically: we first apply legitimacy theory and regulatory theory to establish a conceptual framework; second, we conduct empirical analysis using a DID approach on county-level panel data from 2006 to 2020; and third, we investigate the transmission channels and contextual heterogeneity of NTUP’s effects on PM2.5. The remaining structure of this article is arranged as follows: The second part elaborates on the policy background and research hypotheses; the third part describes the empirical strategy and variable construction; the fourth part presents the benchmark results; the fifth part conducts mechanism and heterogeneity analysis; the sixth part summarizes the main findings and policy implications.

2. Policy Background and Research Hypotheses

2.1. Policy Background

In March 2014, the NDRC rolled out the National New-Type Urbanization blueprint for the period 2014 to 2020, marking the formal launch of a shift towards a people-centric approach to urbanization. This signals a pivotal change in China’s urbanization policy, prioritizing qualitative growth over rapid expansion. The Plan explicitly called for improving the quality of urbanization by integrating key elements such as population management, land use, industrial upgrading, and public service provision. It also highlighted the central role of local governments in implementing reform, encouraging stronger coordination at the municipal and county levels to foster urban–rural integration. Subsequently, come December 2014, the National Development and Reform Commission (NDRC) and a total of eleven other government ministries joined forces to roll out the “Guidelines for the Comprehensive Pilot Program of New Urbanization,” handpicking Jiangsu and Anhui provinces, in addition to 62 cities and towns like Ningbo, as the first cohort of national pilot regions. Two additional rounds of pilot designations followed: 73 cities and towns were selected in November 2015, and another 111 were designated in December 2016. Detailed information is presented in Figure 1.
The National New-Type Urbanization Plan (2014–2020) identifies five primary focal points within the New-Type Urbanization Policy (NTUP). (1) It promotes the urban integration of rural migrant populations by deepening the hukou (household registration) reform and ensuring access to essential services such as employment, housing, and education. (2) It emphasizes industrial restructuring by replacing outdated production capacity with advanced energy-efficient technologies and strengthening land use efficiency through compact and intensive spatial planning. (3) NTUP supports transportation system reform aimed at improving intercity commuting efficiency and promoting clean and sustainable modes of transport. (4) It advances urban renewal and green livability initiatives by encouraging energy-efficient retrofitting of aging residential communities and expanding green infrastructure. (5) Finally, the policy seeks to improve implementation mechanisms through enhanced fiscal, land, financial, and human capital support, while encouraging local governments to explore differentiated and context-specific implementation strategies.
It is evident from the preceding analysis that, unlike conventional urbanization approaches that favored population density and economic expansion while neglecting ecological preservation, the New-Type Urbanization Policy (NTUP) represents a strategic shift toward a more balanced and sustainable approach. NTUP was introduced to mitigate the adverse consequences associated with conventional urbanization—such as excessive resource consumption, ecological degradation, regional disparities, and escalating social tensions [26]. By abandoning the previously extensive, growth-at-all-costs paradigm, NTUP adopts a development model grounded in green and sustainable principles. It emphasizes the coordinated advancement of environmental protection, economic development, and social progress, while placing people at the center of urbanization efforts and striving to enhance the overall quality of urban development [27]. Primary PM2.5 contributors encompass industrial manufacturing, automotive emissions, construction operations, traffic-generated dust, biomass combustion, and specific environmental elements. Notably, NTUP has direct regulatory implications for key emission sectors, including industrial discharge, vehicular pollution control, and construction management. These characteristics suggest that NTUP holds significant potential as a policy instrument for effectively reducing PM2.5 concentrations and improving urban air quality.
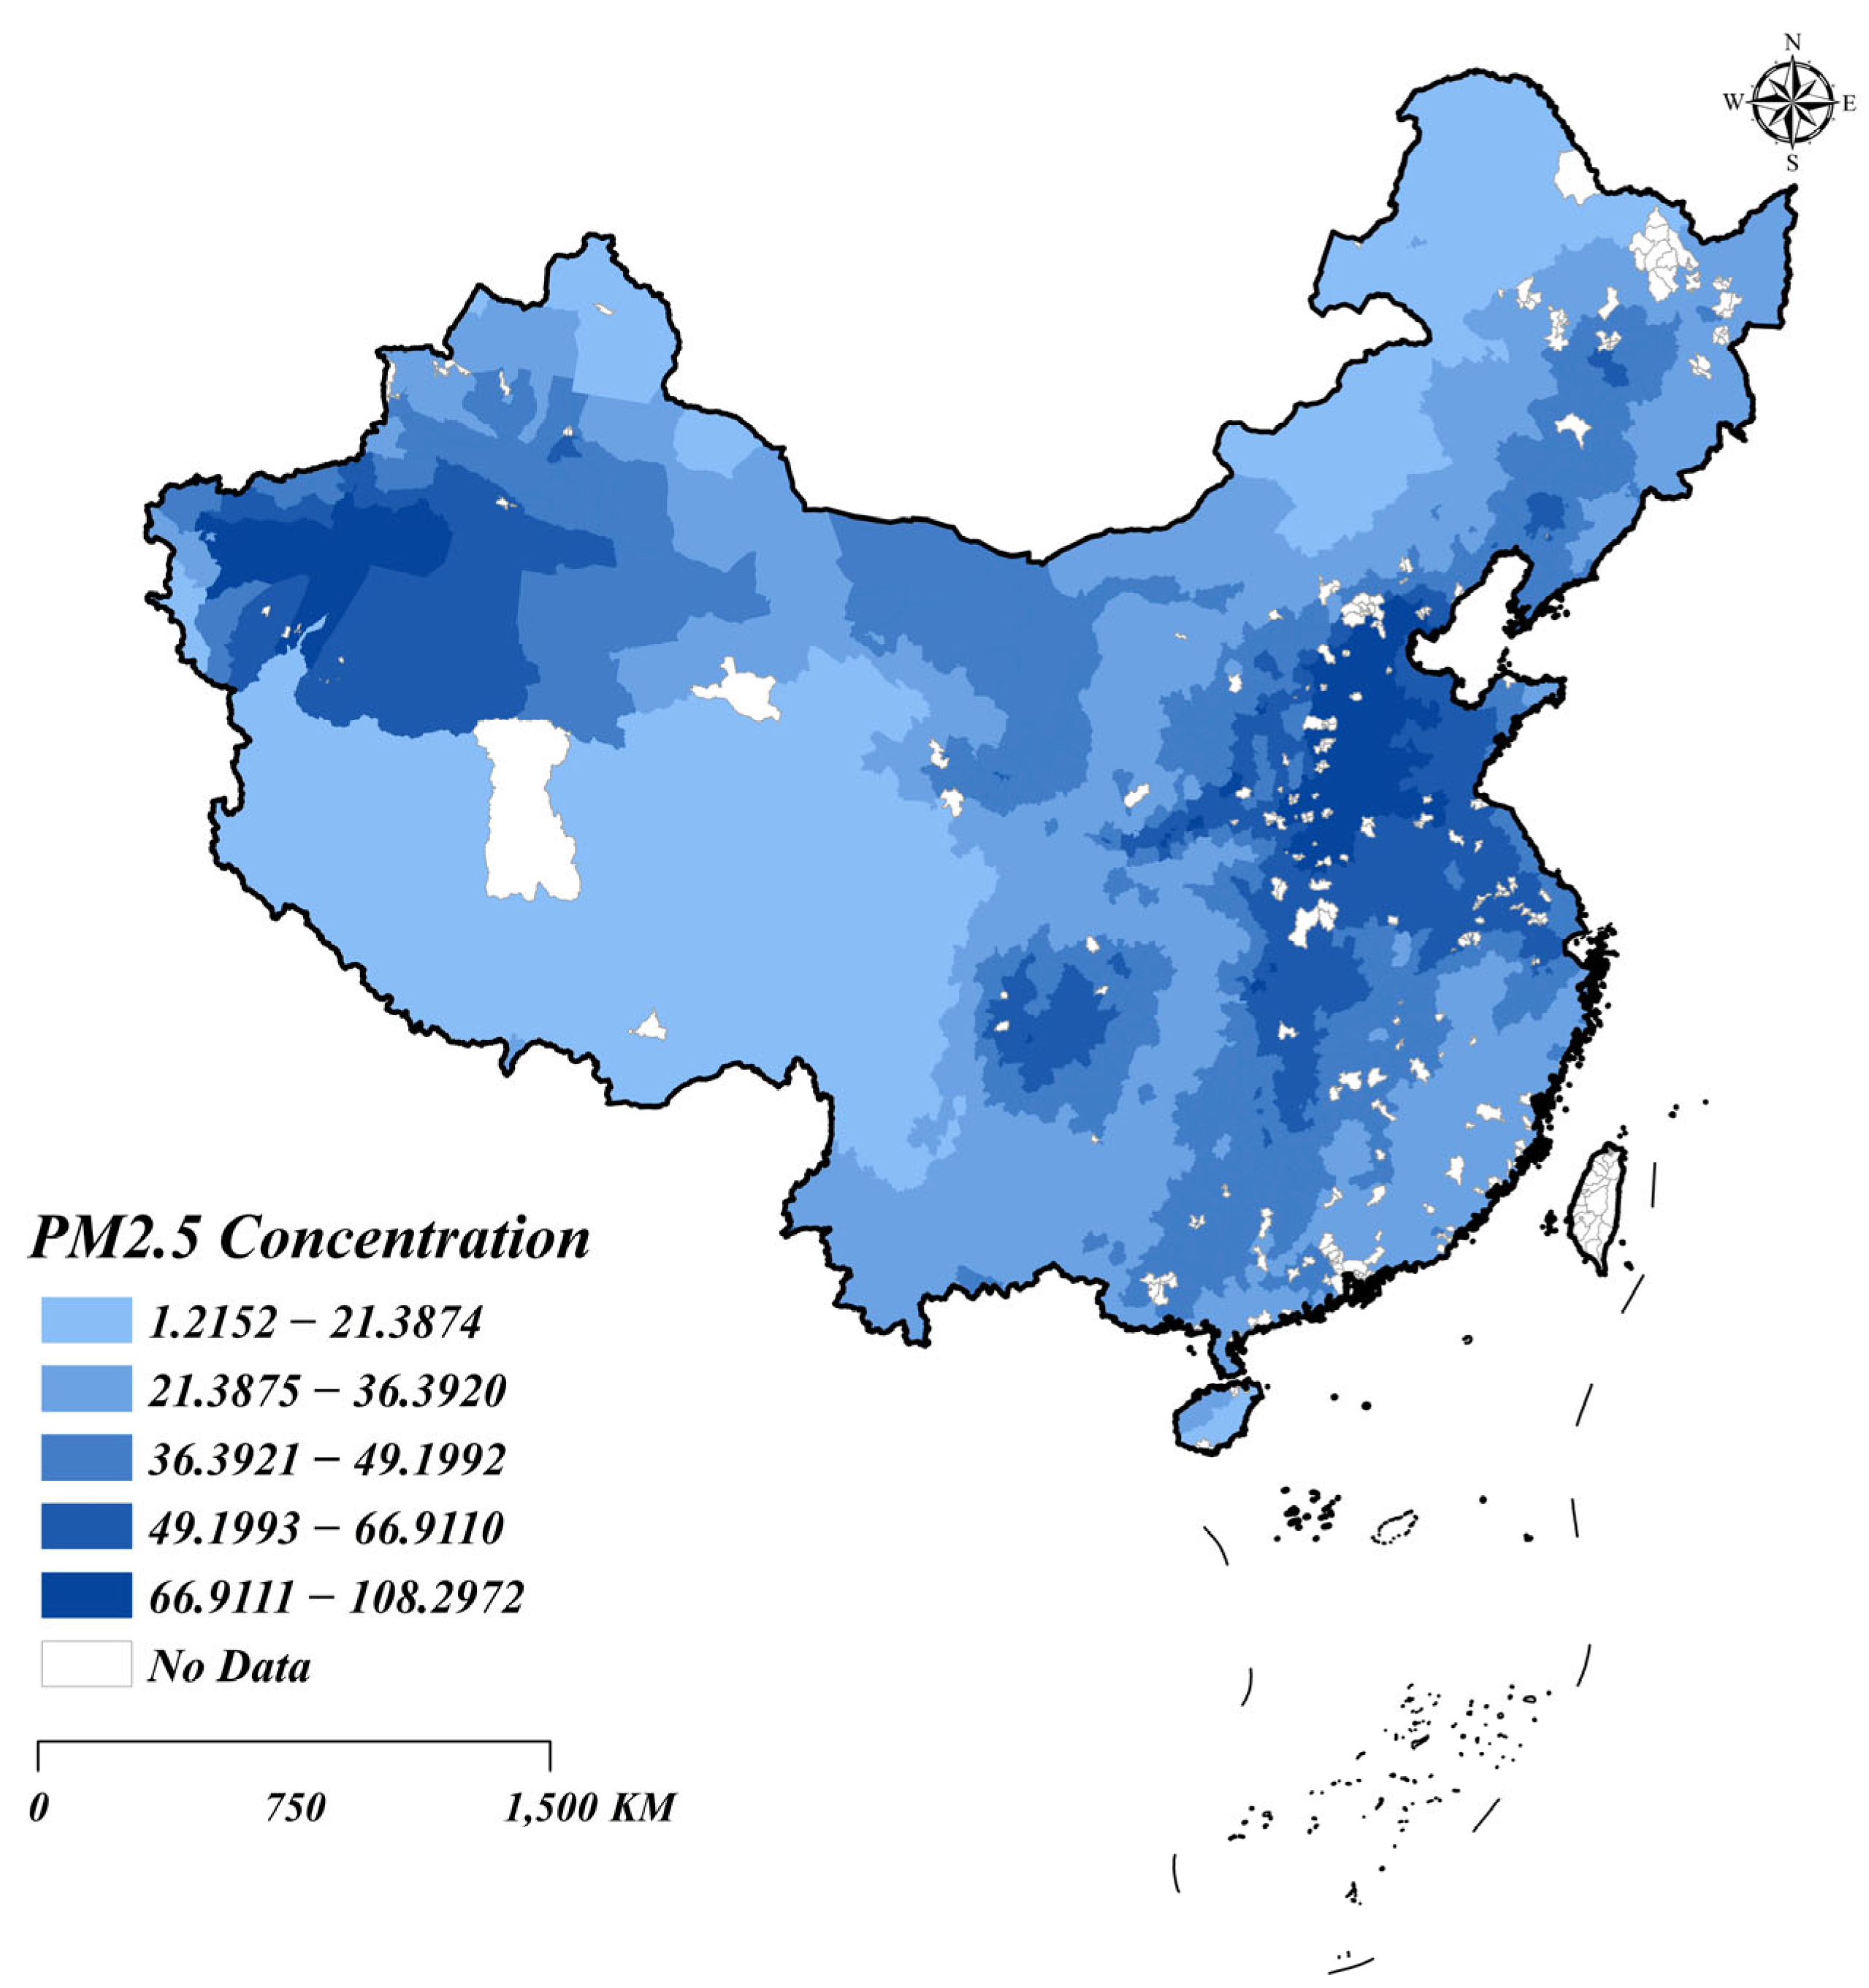
Figure 2 maps the spatial distribution of PM2.5 concentrations throughout China. This study employs ArcGIS to calculate and visualize county-level PM2.5 averages annually between 2006 and 2021. The graph makes it crystal clear that regions with high PM2.5 levels are predominantly found in places like Tibet, Henan, Hebei, Shanxi, and Sichuan. These regions are confronting intense PM2.5 contamination, driven by factory discharges, vehicle fumes, and area-specific environmental factors. Conversely, some areas experience less PM2.5 pollution, reflecting significant regional differences in air quality nationwide.

2.2. Research Hypotheses

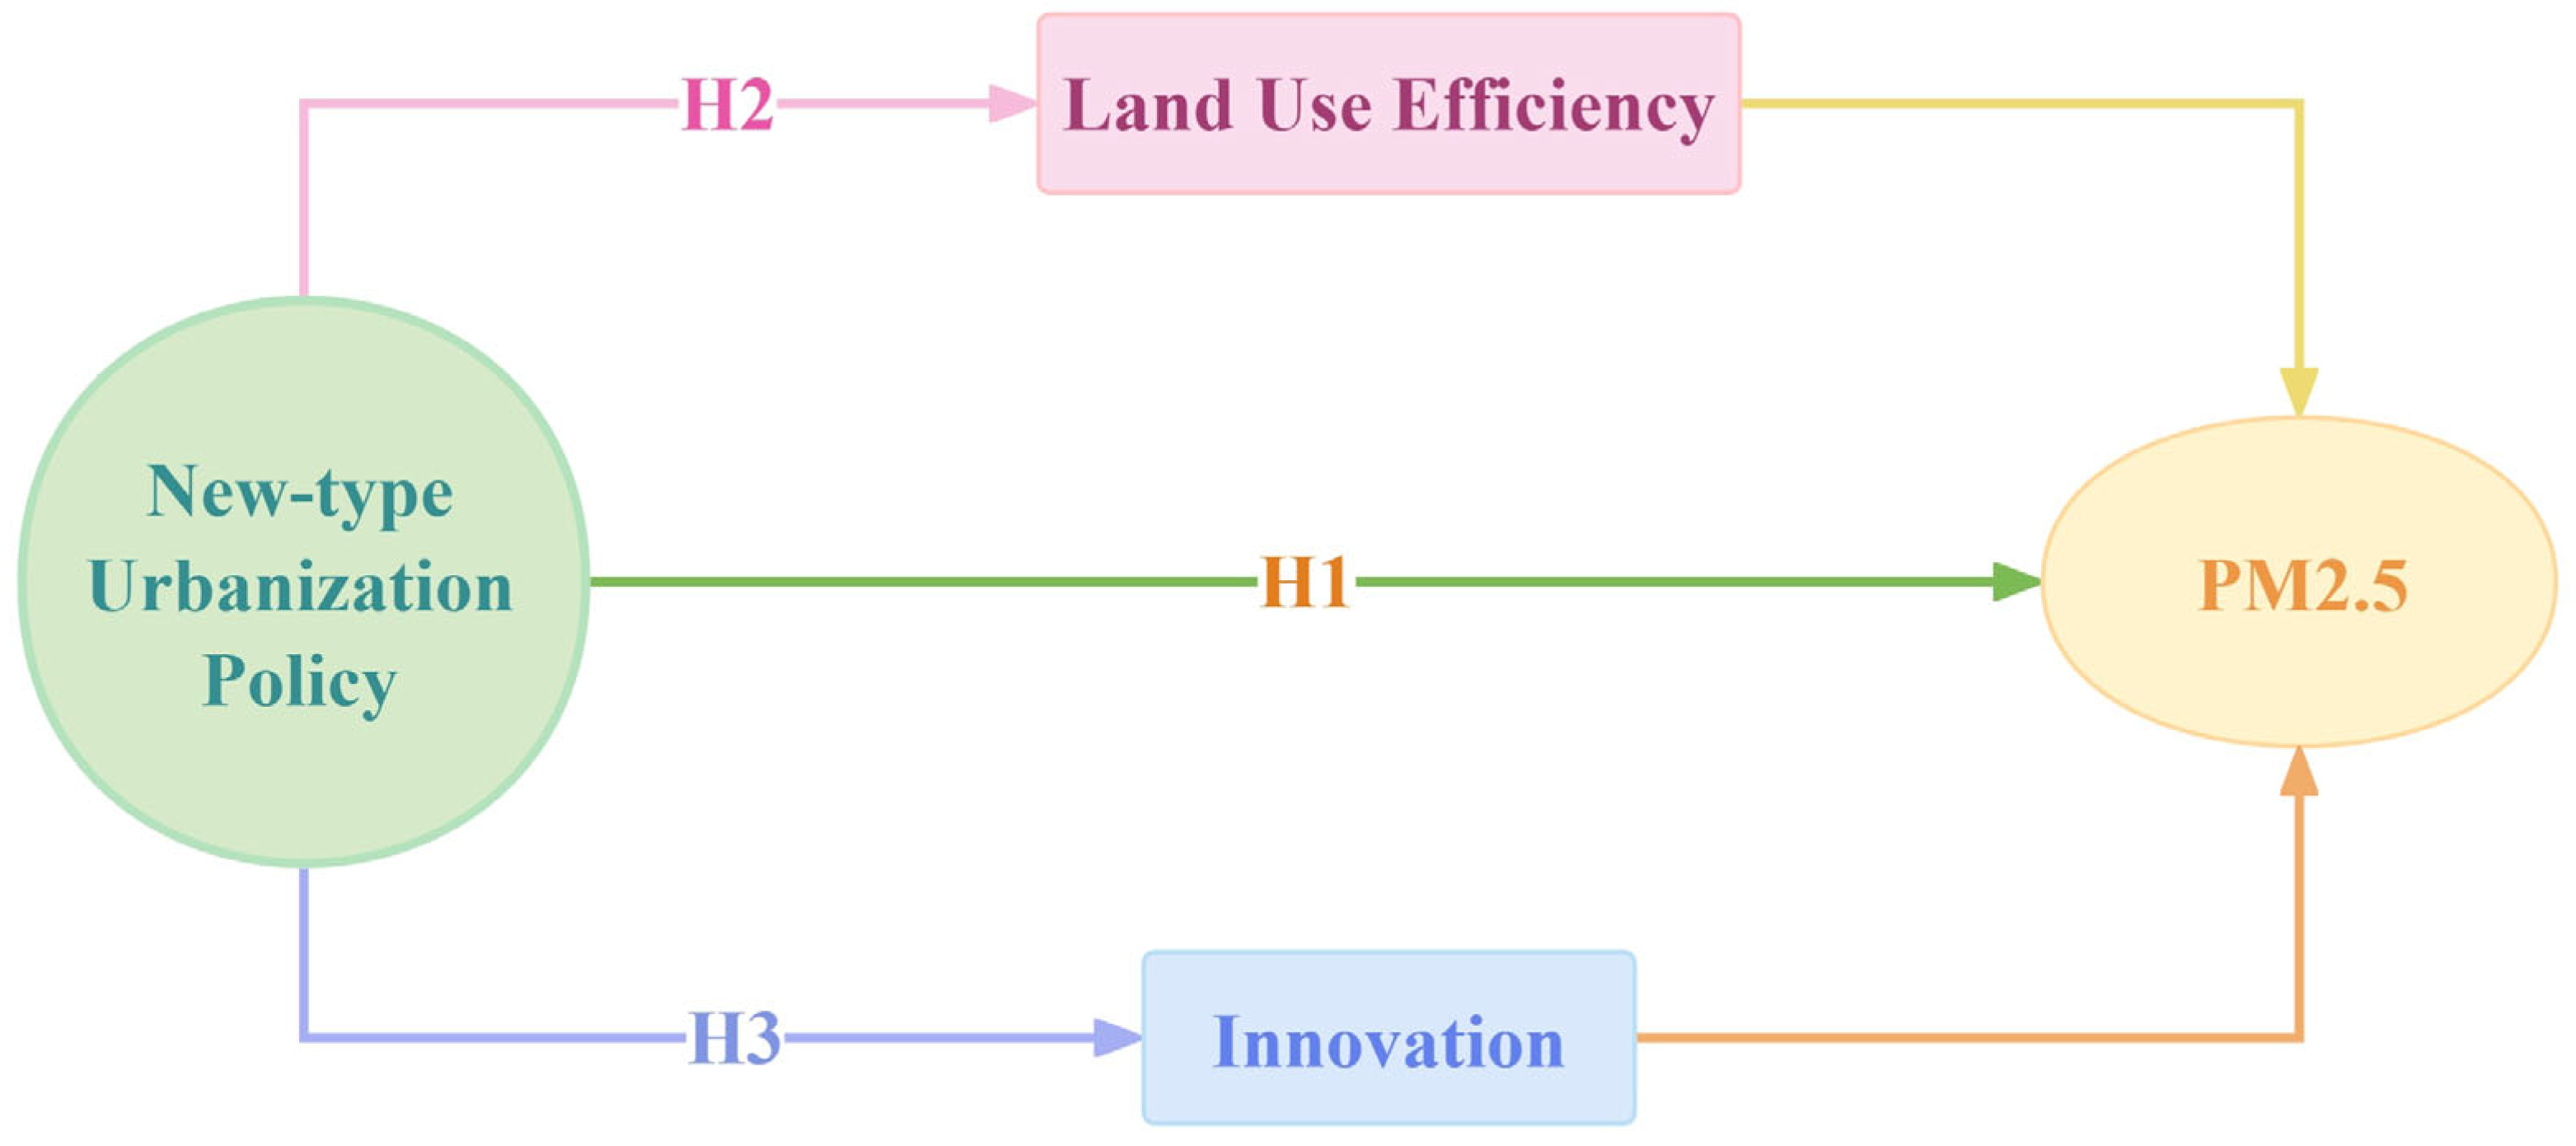
In order to delve into how the New-Type Urbanization Policy (NTUP) impacts PM2.5 concentrations, this study constructs a theoretical framework that incorporates both direct effects and intermediary pathways (see Figure 3). This framework is grounded in the policy orientation and focuses on two key channels: first, the indirect impact on PM2.5 concentrations through improvements in land use efficiency; and second, the environmental improvement driven by enhanced regional innovation efficiency. From this, the following research hypotheses are derived:
The New-Type Urbanization Policy (NTUP) has demonstrated substantial effectiveness in mitigating PM2.5 pollution by reshaping urban development patterns through coordinated adjustments in industrial structure and factor allocation. At the policy level, NTUP promotes a high-quality urbanization framework oriented toward pollution reduction and low-carbon development by advancing systemic reforms in transportation, industry, energy, and construction. Industrially, the policy accelerates the phasing out of outdated and high-pollution capacities while strengthening the adoption of energy-saving and environmentally friendly technologies through both market incentives and regulatory constraints. This facilitates the transition away from high-emission industries and fosters the growth of green sectors such as new energy, green construction, and environmental technologies [28,29]. In terms of factor allocation, NTUP optimizes the spatial and functional deployment of land, capital, and technology toward low-carbon and high-efficiency trajectories. Transportation reforms—such as subway expansion, electric bus deployment, and the promotion of new energy vehicles—reduce dependence on fossil fuel-powered private cars and curb transport-related PM2.5 emissions [30]. In land use, enhanced planning and ecological regulation improve land use efficiency and promote compact urban development [31]. On the energy front, the policy advances the substitution of solar, hydro, biomass, and wind power for fossil fuels, thereby enhancing the overall cleanliness and efficiency of energy consumption and reducing total energy demand [32]. Finally, NTUP enforces stricter pollutant emission standards, which incentivize large-scale urban renewal and the adoption of green construction materials and technologies. These measures collectively reduce emissions from both the construction process and ongoing energy use in urban spaces [33]. Through these integrated interventions, NTUP significantly enhances air quality and promotes sustainable city management. Drawing from the preceding analysis, we formulate the following hypothesis:
H1: 
The NTUP significantly contributes to the reduction in PM2.5 emissions.
A core objective of the NTUP is to enhance land use efficiency through policy direction and fiscal incentives, thereby supporting sustainable economic development. First, NTUP improves the tradability and allocative efficiency of land assets by clarifying land tenure and strengthening property rights, leading to more effective land utilization [34]. Second, it enables spatial restructuring by reallocating underutilized agricultural land to urban construction, promoting compact and intensive development [35,36]. NTUP further emphasizes job–housing balance and transit-oriented planning, which helps reduce commuting and traffic-related pollution. Third, to address inefficient urban expansion, NTUP supports urban renewal, shantytown redevelopment, and industrial zone relocation—replacing scattered, polluting land uses with cleaner, more efficient forms [37]. Fourth, by reshaping capital and labor density, expanding built-up areas, and optimizing industrial structures, NTUP boosts land productivity and efficiency at a systemic level [38]. Fifth, NTUP promotes rural–urban integration by guiding peripheral rural land to support spillover urban functions, easing pollution pressure in core cities and improving land efficiency [39]. Land use efficiency reflects the economic and social value generated per land unit. Improving it helps reduce PM2.5 emissions through multiple channels. First, NTUP facilitates centralized control of high-emission industries, improving treatment effectiveness and reducing emissions [40]. Second, better spatial configuration of forests, farmland, and built-up areas produces regional and spillover benefits for PM2.5 reduction [41]. Third, enhanced transport systems, residential density, and infrastructure clustering under NTUP lead to energy savings and centralized waste management, further cutting PM2.5 pollution. Based on these considerations, we propose the following hypothesis:
H2: 
The NTUP reduces PM2.5 emissions by promoting improvements in land use efficiency.
The core objective of the NTUP is to foster technological innovation through policy guidance and financial incentives, thereby reducing pollutant emissions and supporting sustainable development. In promoting green transformation, NTUP enhances the policy environment and reallocates resources toward clean energy and energy-saving technologies, accelerating the development of efficient low-carbon systems [42]. By improving the business environment, NTUP encourages industrial clustering and talent agglomeration, which fosters knowledge spillovers and collaborative innovation among firms [43]. In addition, NTUP supports rational population concentration in key cities, increasing labor supply and demand, and facilitating frequent knowledge exchange—thus building a robust foundation for innovation [44]. Through synergies in green transformation, business facilitation, and population agglomeration, NTUP creates an ecosystem conducive to technological advancement. Technological innovation—referring to the creation and utilization of novel technologies, methodologies, and substances—alters productivity and enhances service effectiveness [45], and is crucial for lowering PM2.5 reduction. First, it enables advanced pollution control and abatement technologies, overcoming cost and efficacy limitations of existing systems [46,47]. Second, it promotes energy-efficient and cleaner production, especially in traditional high-emission sectors [48,49]. Third, a shift from fossil fuels to wind and solar alternatives quickens, significantly reducing PM2.5 pollution [50]. Based on these considerations, we propose the following hypothesis:
H3: 
The New-Type Urbanization Policy contributes to the reduction in PM2.5 emissions by promoting technological innovation.

3. Research Design

3.1. Model

This chapter outlines the econometric models and variable settings used to evaluate the policy impact, aiming to construct a comprehensive empirical analysis framework. First, we introduce the multi-period difference-in-differences (MDID) model to capture the policy effects before and after the implementation of the NTUP.

3.1.1. MDID Model

This study employs a DID method to address the shortcomings of conventional regression models in assessing policy impacts. By differencing twice—across time and between treatment and control groups—the model eliminates both time-invariant unobserved heterogeneity and common temporal trends, thereby isolating the net effect of policy implementation [51,52]. Compared to the conventional DID model, the multi-period difference-in-differences (MDID) framework extends the original design by incorporating multiple time points, allowing for a more precise identification of dynamic policy effects over time [53]. Given that the NTUP was implemented in a phased manner, the MDID model is particularly suitable for capturing the policy’s heterogeneous impacts at different points in time, enabling a more comprehensive policy evaluation. Consequently, the research utilizes the MDID framework for evaluating NTUP’s impact. The defined model is structured as follows:
Y it = β 0 + β 1 T r e a t e d i × P o s t i t + λ C o n t r o l s i t + υ i + τ t + ε i t
In Model (1), Yit represents the dependent variable, which is the PM2.5 concentration in county i in year t. Treatedi denotes the grouping variable, with a value of 1 indicating county i is part of the treatment group, and 0 if it is not. Postit is the policy implementation dummy variable, taking a value of 1 if county i participates in the NTUP in year t, and 0 otherwise. Treatedi × Postit captures the differential effect of NTUP on the treated counties relative to the control group. The model also includes a series of control variables Controls, including the fiscal budget level (budget), household savings level (sav), social welfare supply (welfare), education penetration (student), medical service capacity (hos), industrial development level (ind), and industrial productivity (iva). Following the standard difference-in-differences model setting, the model simultaneously controls for county fixed effects υi and time fixed effects τi and includes an error term εi to account for unobserved disturbances.

3.1.2. Mediation Analysis Model

To further investigate the indirect transmission mechanisms through which the NTUP influences PM2.5 concentrations, this study follows the methodology proposed by Baron and Kenny [54] establishing the following analytical models:
Y it = α 1 + β 1 T r e a t e d i × P o s t i t + λ C o n t r o l s i t + υ i + τ t + ε i t
M it = α 2 + β 2 T r e a t e d i × P o s t i t + λ C o n t r o l s i t + υ i + τ t + ε i t
Y it = α 3 + β 3 T r e a t e d i × P o s t i t + γ M i t + λ C o n t r o l s i t + υ i + τ t + ε i t
In Models (3) and (4), M represents the mechanism variable, which primarily includes land use efficiency and innovation efficiency.

3.2. Variables and Data Sources

3.2.1. Dependent Variable

The core dependent variables used in this study consist of annual mean PM2.5 concentrations across all Chinese districts and counties from 2006 to 2020. PM2.5 concentration refers to the annual average mass concentration of fine particulate matter (PM2.5) per unit volume, measured in micrograms per cubic meter (μg/m3). The PM2.5 data used in this study are sourced from the Atmospheric Composition Analysis Group, which integrates aerosol optical depth (AOD) observations from multiple satellite instruments, including MODIS, VIIRS, MISR, and SeaWiFS. These observations are processed using a combination of retrieval algorithms such as Dark Target, Deep Blue, and MAIAC, in conjunction with outputs from the GEOS-Chem chemical transport model, to produce global and regional gridded datasets of PM2.5 concentrations. To enhance accuracy and comparability, the dataset is further calibrated against ground-based sun photometer observations from AERONET, thereby correcting for relative uncertainties and minimizing systematic deviations from surface monitoring data [55,56]. Based on this calibrated dataset, we employ ArcGIS 2019 software to perform spatial resampling and aggregation, generating annual average PM2.5 concentration estimates at the Chinese county level.

3.2.2. Independent Variable

For the purpose of comparative analysis, this study classifies the counties that have implemented the New-Type Urbanization Plan (NTUP) as the experimental group, while those that have not implemented the plan are assigned to the control group. This variable equals 1 for a city during its designation as a New-Type Urbanization Policy pilot year and all following years; otherwise, it is 0.

3.2.3. Control Variables

In empirical analysis, introducing control variables helps eliminate external factors that affect PM2.5 concentration, thereby more accurately assessing the net impact of NTUP on PM2.5 concentration. The PM2.5 concentrations in various districts and counties of China are influenced by multiple factors such as economy, politics, and ecology. This paper references existing literature [57] and examines the macro economy, social development, and industrial economy aspects, incorporating the following control variables, specifically: (1) Macro economic factors mainly include fiscal budget level and resident savings level. The fiscal budget level (budget) is measured as the proportion of local government general budget revenue and expenditure to the regional GDP [58]. The resident savings level (sav) is represented as the proportion of urban and rural resident savings deposits to the regional GDP [59]. (2) Social development factors include welfare level, education level, and healthcare level. The welfare level (welfare) is specifically the number of beds in social welfare and adoption institutions per 10,000 people [60]. The education level (stu) is expressed as the proportion of ordinary secondary school students to the total population [61]. The healthcare level (hos) is measured as the number of hospital beds per 10,000 people. (3) Industrial economic factors specifically include industrial level (ind) and industrial productivity (iva). The industrial level (ind) is measured by the number of large-scale industrial enterprises per 10,000 people. Industrial productivity (iva) is specifically measured by the average industrial added value per 10,000 people, further scaled down by 100 times. Detailed information for each variable is shown in Table 1.

3.2.4. Sample Selection and Data Sources

Due to significant challenges in accessing county-level data, including non-disclosure and missing values in certain regions, a total of 13,148 valid observations were ultimately collected. Despite some degree of sample incompleteness, the dataset covers key regions before and after policy implementation and retains strong representativeness in terms of both spatial distribution and temporal span, thereby meeting the basic requirements for subsequent empirical analysis. The PM2.5 data are obtained from the Atmospheric Composition Analysis Group; New-Type Urbanization Policy (NTUP) data are sourced from the official website of the Chinese government (https://www.gov.cn/, accessed on 5 April 2025). Data on control variables and industrial structure were sourced from the “China County Statistical Yearbook.” This study utilized patent data sourced from the Tianyancha Corporate Information Platform and the official database of the China National Intellectual Property Administration (CNIPA), categorizing the information according to the green patent list criteria established by the World Intellectual Property Organization (WIPO). Descriptive statistics for the main variables used in this study are presented in Table 2. Table 2 shows that the average value of NTUP is 0.049, indicating that only about 4.9% of the 13,148 samples have implemented NTUP. Meanwhile, the number of observations for PM2.5 concentration is 13,082, meaning that approximately 66 data points are missing, corresponding to a missing rate of about 0.5%. This suggests that the PM2.5 data is relatively complete, with very few missing values.

4. Empirical Results

Before conducting the base regression analysis, it is necessary to verify that there is no significant multicollinearity among the explanatory variables in the model. This section first verifies this through a VIF test, followed by the presentation of the baseline regression and robustness analysis results.

4.1. Multicollinearity Test

Multicollinearity testing is a necessary preliminary step before conducting baseline regressions, as it is essential to ensure that no significant multicollinearity exists among the explanatory variables. To verify this, we employ the Variance Inflation Factor (VIF) test. According to the generally accepted standards in the field of statistics, if the variance inflation factor (VIF) value is below 10, it can be determined that there is no problem of multicollinearity. The test data presented in Table 3 of this study show that the VIF values of all variables are far below the critical value of 10, thereby confirming that there is no problem of multicollinearity in this study.

4.2. Baseline Regression Results

Table 4 presents the benchmark regression results of the impact of the New-Type Urbanization Policy (NTUP) on PM2.5 concentration based on the two-way fixed effects model. To assess the robustness of the estimated treatment effect, additional control variables are sequentially included in Columns (1) to (8).
Column (1), which includes only the NTUP indicator alongside county and year fixed effects, shows that NTUP is associated with a statistically significant reduction in PM2.5 levels. The estimated coefficient of −1.317 is significant at the 1% level, indicating that cities affected by NTUP experienced an average decrease of 1.317 μg/m3 in PM2.5 concentrations relative to untreated cities. This result provides initial empirical support for Hypothesis 1. As additional covariates are introduced from Columns (2) to (8)—including budgetary expenditure (budget), savings level (sav), social welfare expenditure (welfare), educational resources (student), healthcare infrastructure (hos), industrial structure (ind), and value-added from industry (iva)—the estimated NTUP coefficients remain negative, statistically significant, and of comparable magnitude. This consistency underscores the robustness of the policy effect across model specifications. In Column (8), the full specification includes all control variables. The NTUP coefficient remains significant at the 1% level with a value of −1.188, reinforcing the conclusion that NTUP significantly contributes to air quality improvement. The high R-squared values across all specifications (approximately 0.966–0.967) suggest that the models explain a large proportion of the variance in PM2.5 levels.
Among the control variables, several exhibit notable effects. Budgetary expenditure is positively and significantly associated with PM2.5 concentrations, possibly reflecting increased economic activity and infrastructure investment that may raise pollution levels. The variable hos (healthcare infrastructure) shows a strong negative association with PM2.5, suggesting that better medical infrastructure may be linked to more effective local health and environmental governance. Industrial structure (ind) is positively associated with PM2.5, highlighting the role of industrialization in contributing to air pollution. Meanwhile, the negative and significant coefficient of iva (industrial value added) implies that higher industrial productivity may reflect a shift toward cleaner, more efficient production technologies. In sum, the baseline regression results offer robust empirical evidence that the NTUP significantly reduces PM2.5 concentrations in treated counties. The results remain stable across multiple model specifications, reinforcing the credibility of the policy’s environmental impact. These findings provide a solid foundation for subsequent robustness checks and heterogeneity analyses.

4.3. Parallel Trends Test

To guarantee the reliability of policy evaluation outcomes obtained through the difference-in-differences method (DID), it is necessary to satisfy the parallel trends assumption. This fundamental assumption stipulates that, in the absence of policy intervention, the treatment and control groups should exhibit similar trends over time, without systematic differences in their pre-treatment trajectories [62,63,64]. Only when the post-intervention trends diverge significantly can the observed effects be credibly attributed to the policy.
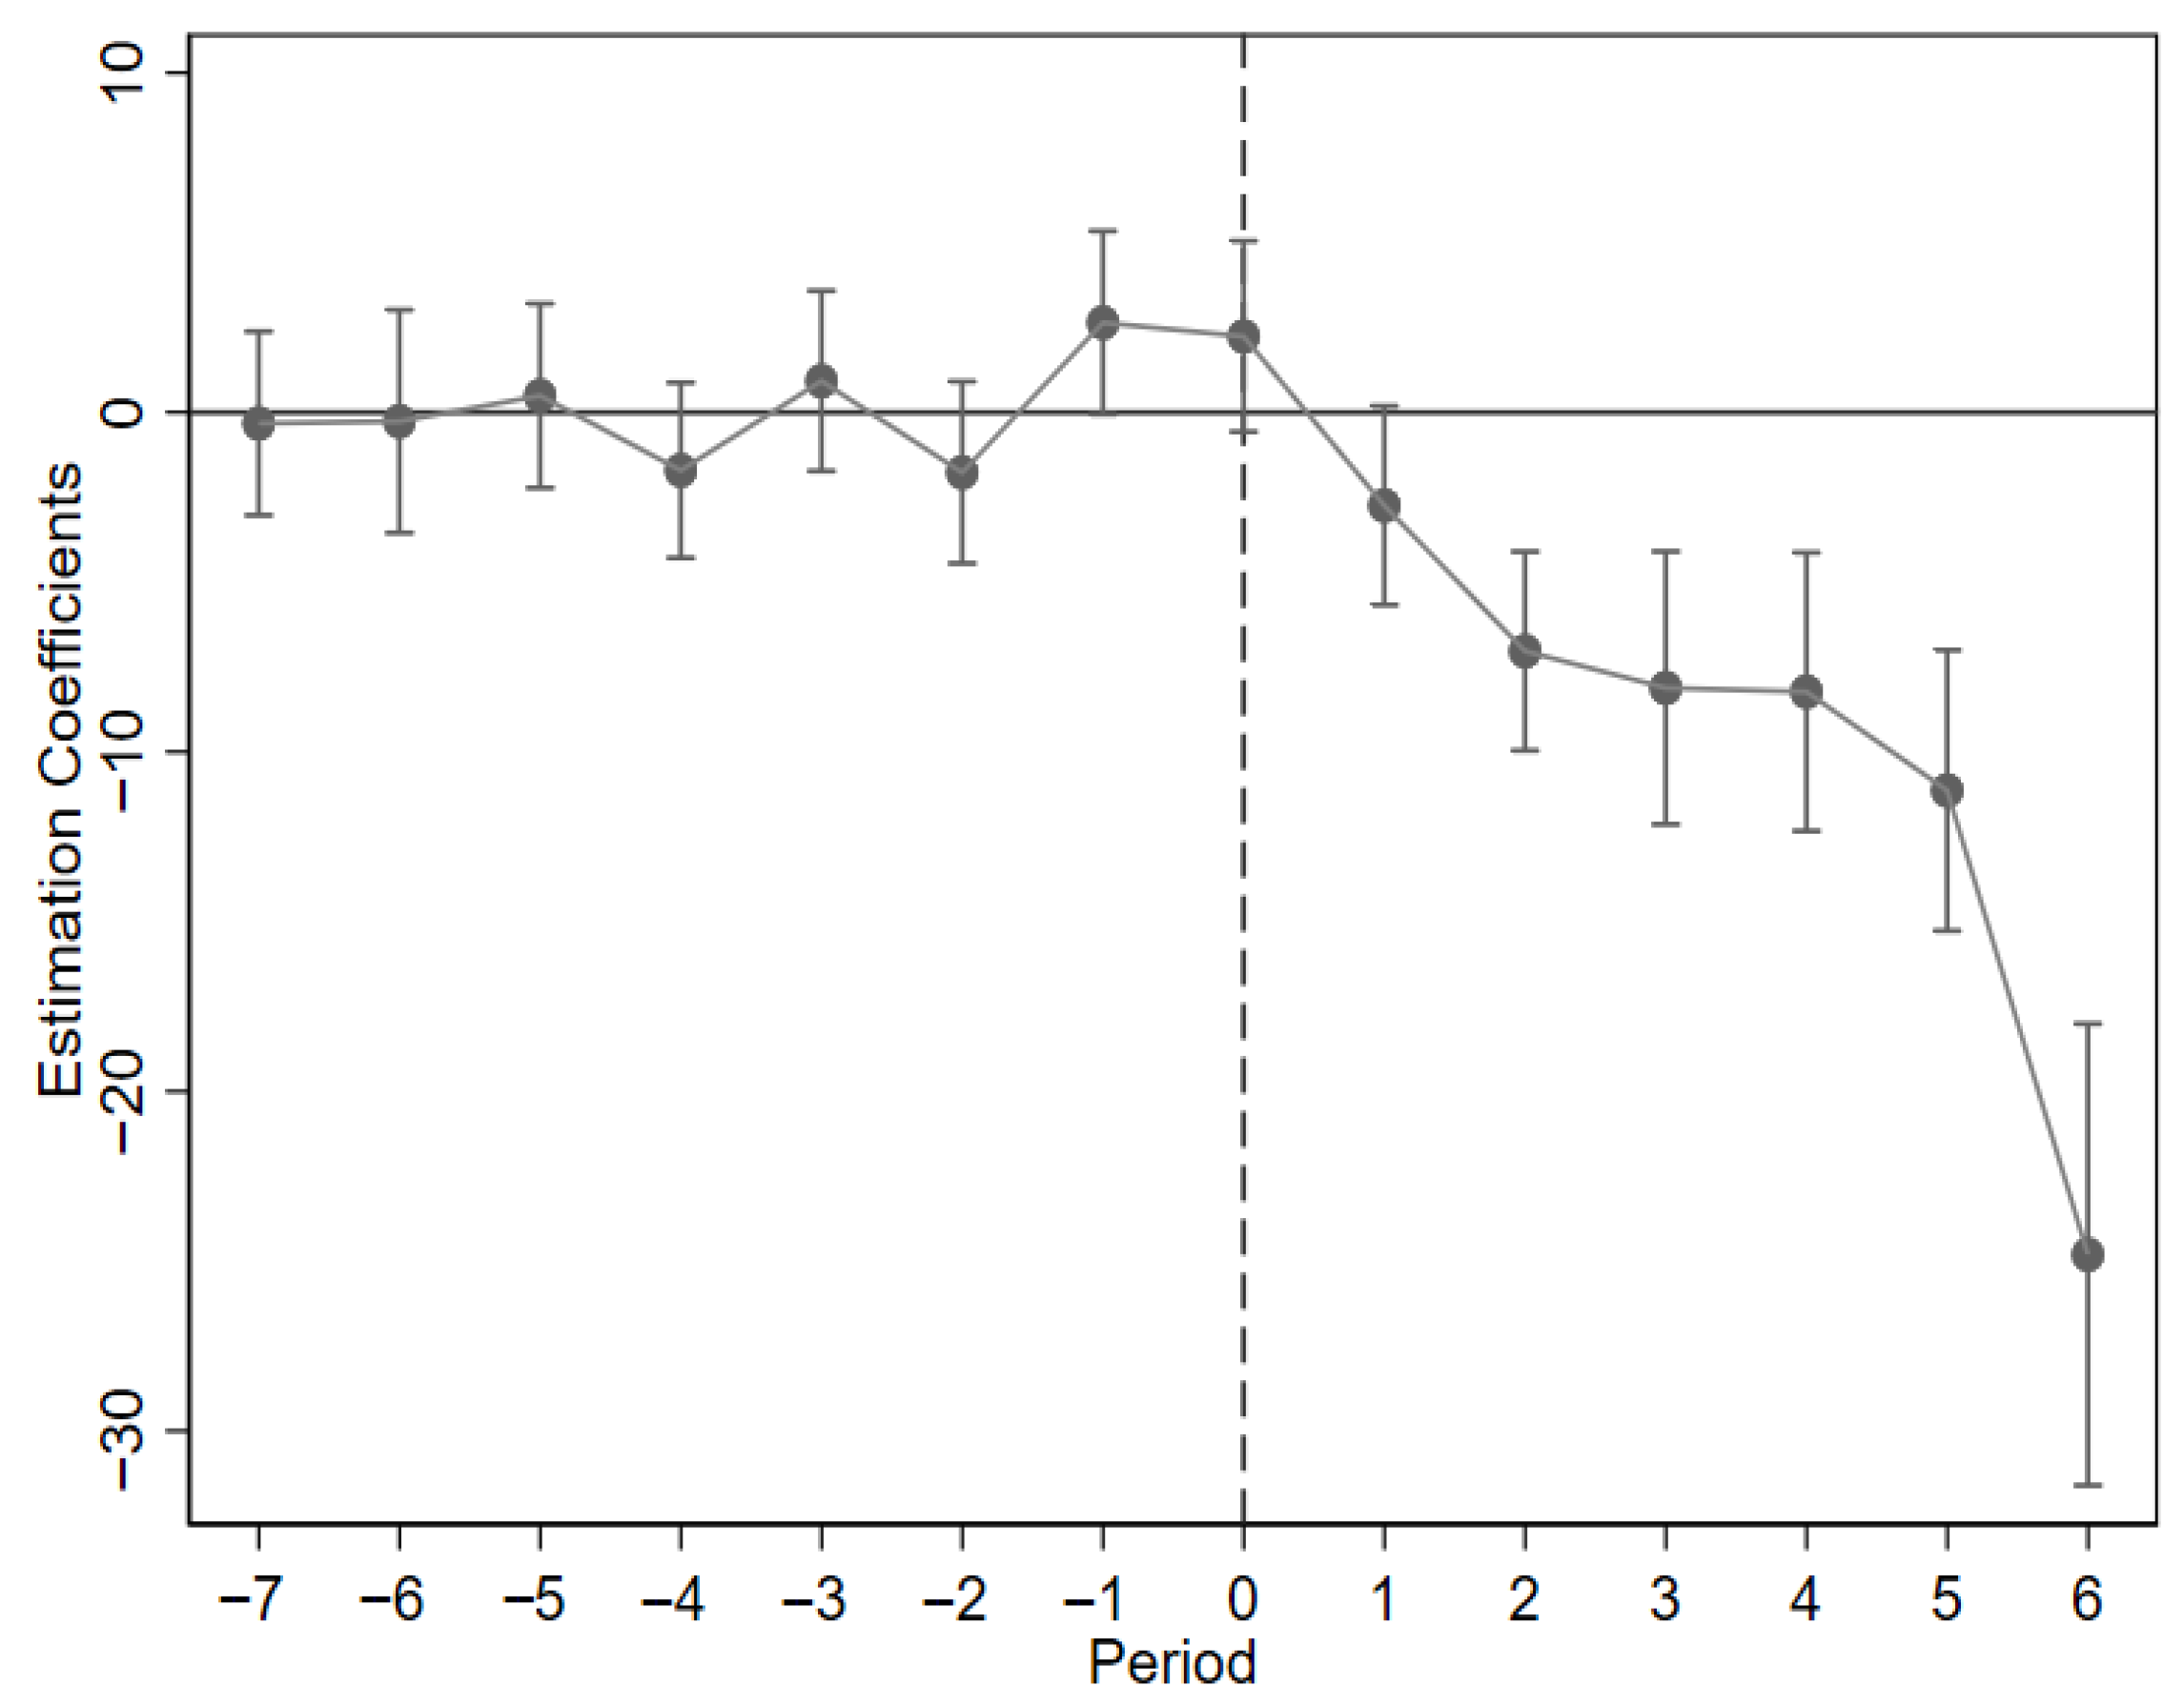
Drawing on existing literature, this study employs the event study method to verify the parallel trend assumption. As shown in Figure 4, before the NTUP (i.e., during the period from −7 to −1), the estimated coefficients fluctuated around zero, and the corresponding 95% confidence intervals always included zero. This finding suggests that the treatment and control groups followed statistically similar trajectories before the policy, thereby supporting the validity of the parallel trends assumption. Notably, approximately two years after the policy implementation, the estimated coefficients exhibit a significant and sustained decline, indicating a strong negative impact of NTUP on PM2.5 concentrations. Figure 4 also illustrates a progressively intensifying policy effect over time, highlighting the efficacy of NTUP in improving air quality and delivering measurable environmental benefits. Collectively, these results affirm that the parallel trends assumption holds in this context.
Moreover, the figure reveals an approximate two-year lag before the policy effect becomes statistically significant. Several plausible explanations account for this delayed response: (1) Systemic complexity of the policy: The NTUP encompasses multi-dimensional interventions, including industrial restructuring, energy system optimization, and the promotion of clean technologies. These transformations require substantial time and resources, contributing to a lag in observable outcomes. (2) Technology diffusion and maturity: The deployment of energy-saving and emission-reduction technologies typically involves a time-consuming process of development, investment, commercialization, and cross-sector adoption, all of which can delay the realization of policy benefits. (3) Heterogeneity in local governance capacity: Variations in local governments’ resource allocation, policy comprehension, and enforcement capabilities affect the pace and effectiveness of implementation across regions. (4) Behavioral inertia in public response: Changes in public awareness and behavioral patterns related to green consumption and low-carbon lifestyles often evolve gradually, requiring continuous policy incentives and social reinforcement. (5) Environmental system dynamics: PM2.5 concentrations are influenced by complex environmental and meteorological factors, such as atmospheric conditions, topography, and regional ecological capacity. These natural constraints may obscure or delay the detectable impact of emission control measures. In sum, the lagged policy effect is likely attributable to the interplay of institutional, technological, behavioral, and environmental factors. This temporal delay should be taken into account when interpreting the effectiveness of environmental policies in empirical research.

4.4. Robustness Test

This study comprehensively verifies the robustness and reliability of the baseline regression outcomes through a series of robustness checks. Specifically, these include: replacing the dependent variable, adjusting the clustering of standard errors, applying winsorization to address extreme values, modifying the timing of policy implementation, excluding data during the COVID-19 pandemic, removing regions affected by other concurrent policies, adopting the Propensity Score Matching Difference-in-Differences (PSM-DID) approach, and conducting placebo tests. These methods aim to control for potential sources of bias from multiple perspectives, thereby ensuring that the estimated policy effects are credible, causally interpretable, and generalizable.

4.4.1. Variable Replacement Test

To further verify the robustness of the empirical research results, this study replaced the explanatory variables with the maximum and minimum annual PM2.5 concentrations, denoted as PM2.5MAX and PM2.5MIN, respectively. As shown in Columns (1) and (2) of Table 5, the estimated coefficients of NTUP are −1.116 and −1.053, respectively, both statistically significant at the 1% level, further confirming the robustness and reliability of the baseline regression results.

4.4.2. Changing the Clustering of Standard Errors

This study conducts a robustness test on the regression results by applying the standard error method of clustering at the county-level administrative regions, thereby enhancing the reliability of the estimation effect. Compared with the traditional robust standard error, the clustered standard error can more effectively handle the inter-group correlation and diversity within the sample, thereby enhancing the accuracy of inference. Specifically, at the implementation level, this standard error conducts cluster analysis at the county level to account for the similarity among observations within a county and mitigate the potential impact of autocorrelation. As shown in Column (3) of Table 5, even after accounting for county-level clustering, the estimated coefficient of the New-Type Urbanization Policy is −1.257 and remains statistically significant at the 1% level, further confirming the robustness and reliability of the main conclusions of this study.

4.4.3. Winsorization

To mitigate potential biases caused by outliers in the regression results, this study employs winsorization. Specifically, values below the 1st percentile for each variable are replaced with the 1st percentile, and values above the 99th percentile are replaced with the 99th percentile. The regression is then re-estimated using the adjusted data. Column (4) of Table 5 presents the corresponding regression results, where the estimated coefficient is −1.257 and remains statistically significant at the 1% level. This suggests that extreme values have a limited impact on the estimation results, further reinforcing the robustness of the main conclusions of this study.

4.4.4. Alternative Policy Implementation Timing

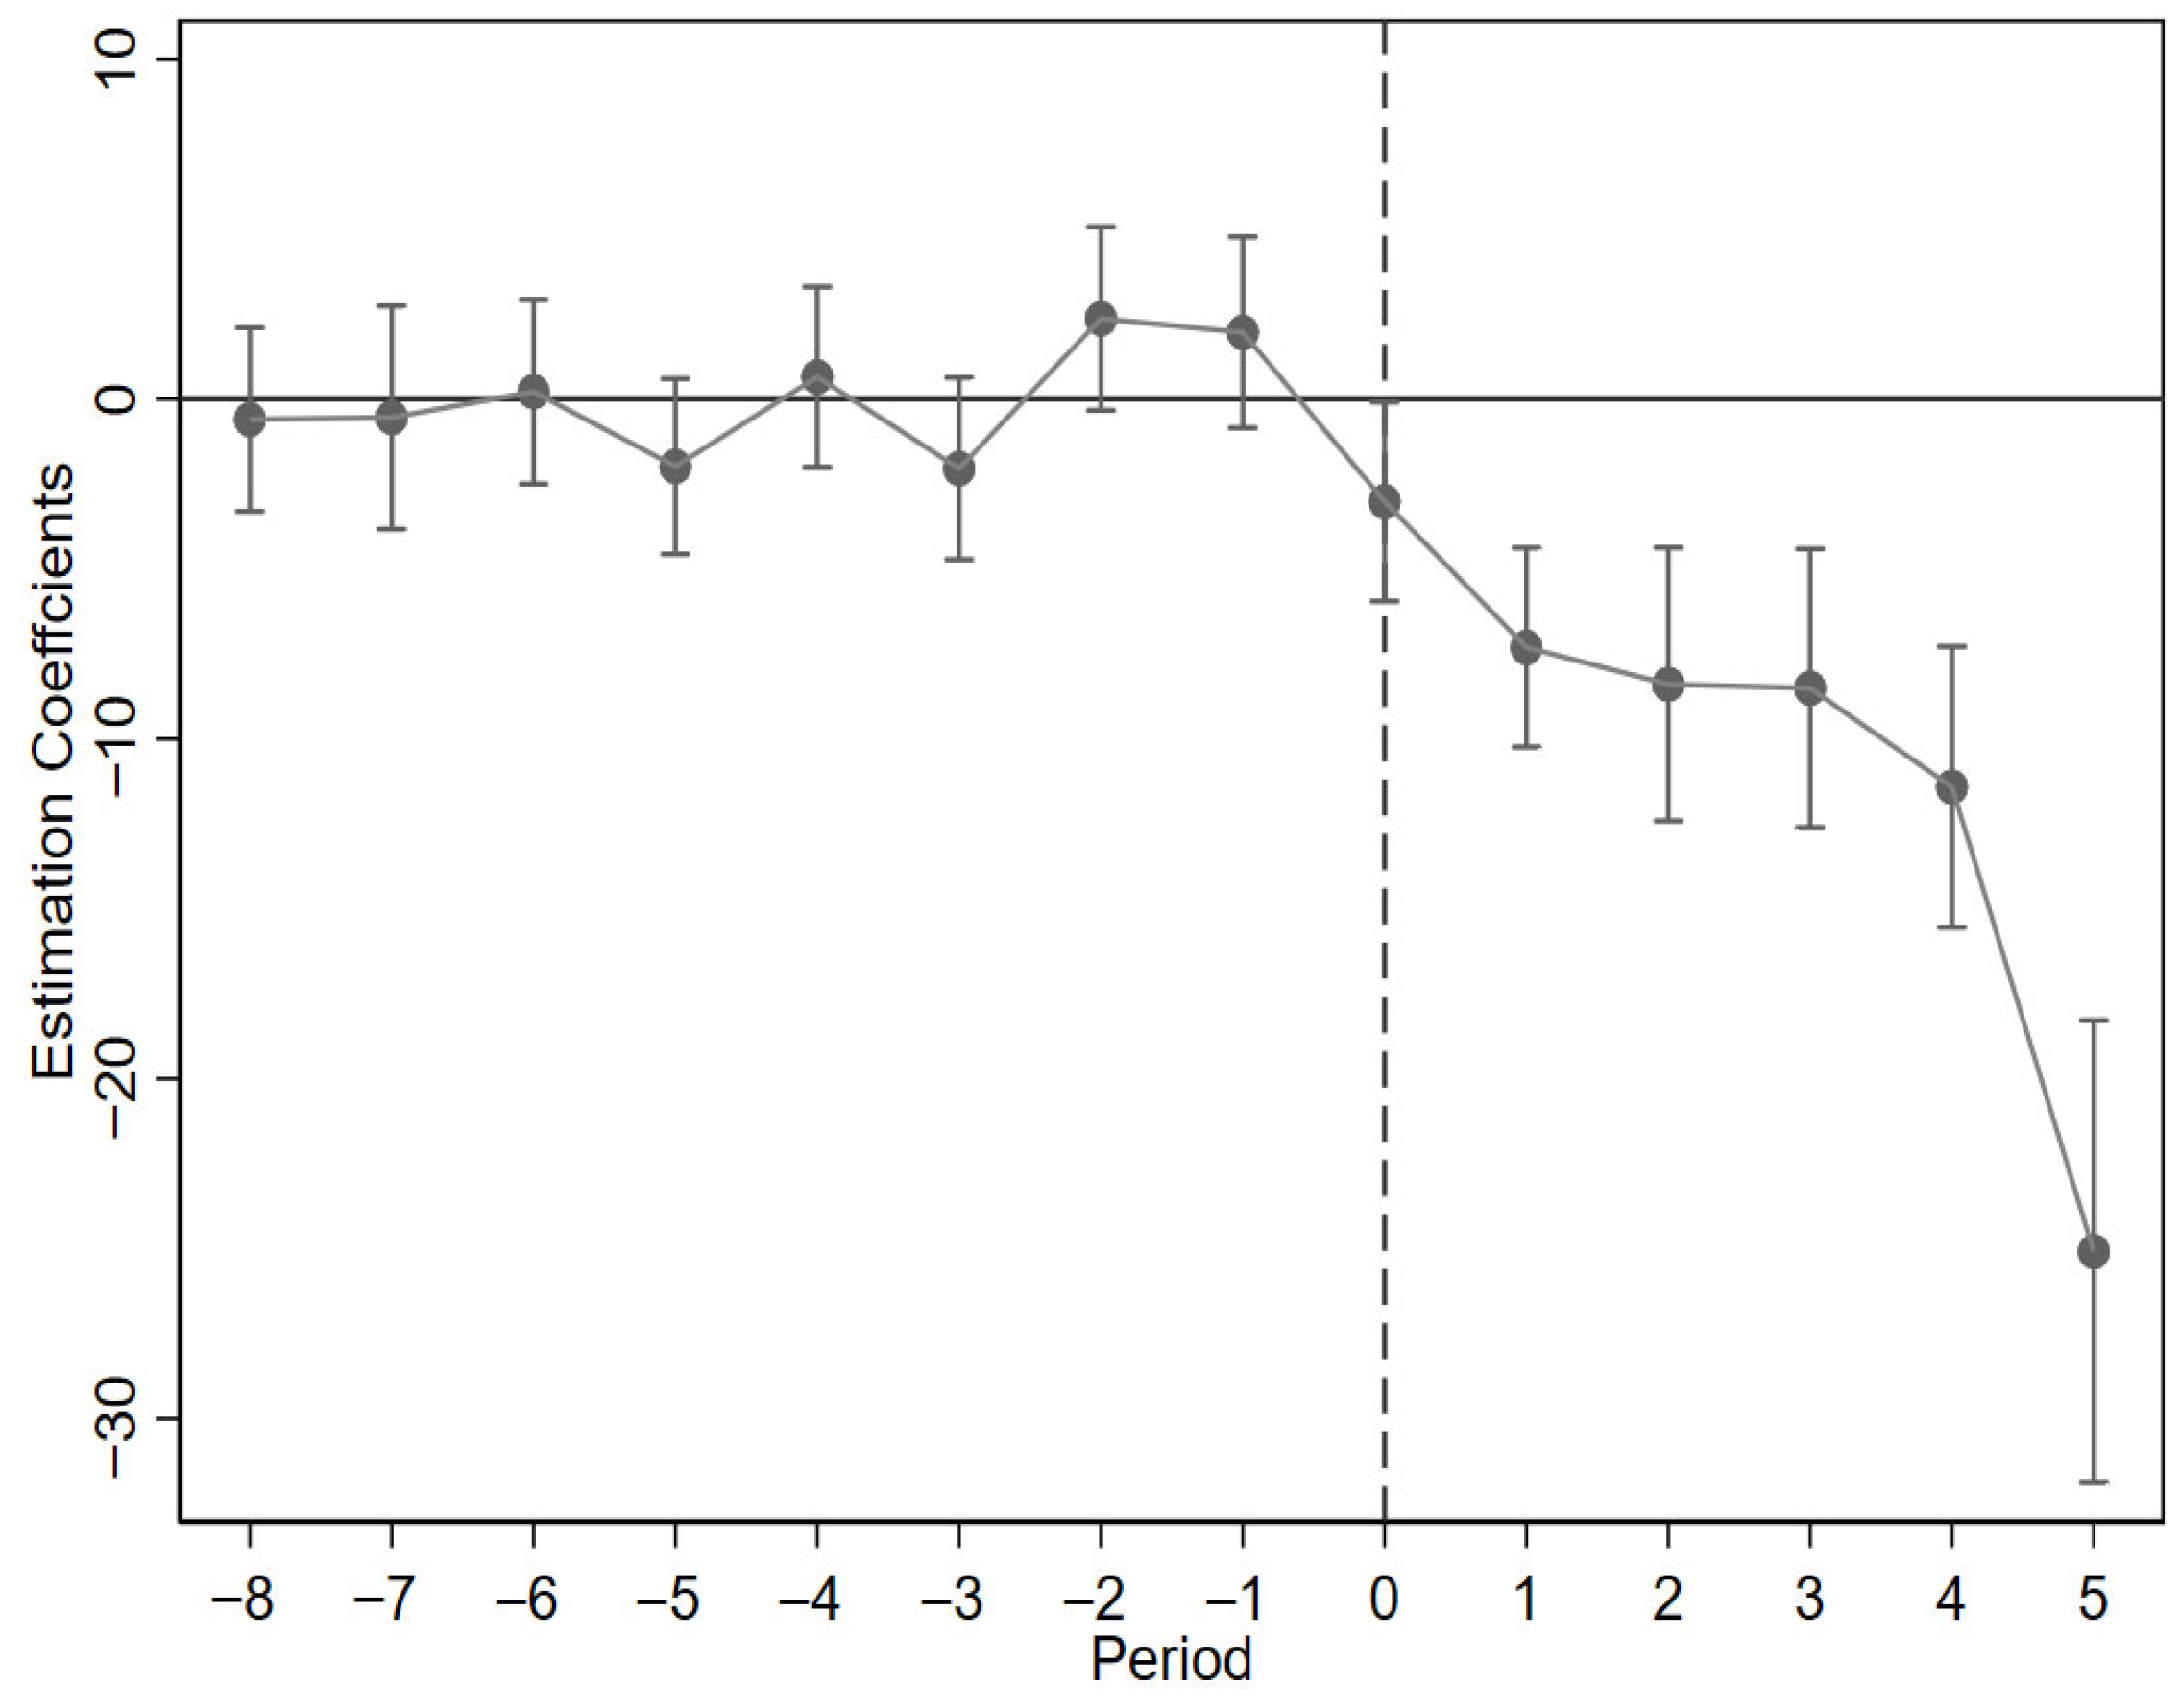
In the preceding analysis, this paper sets the policy implementation year as 2014. However, since the New-Type Urbanization Policy (NTUP) was officially launched in December 2014—very close to 2015—there is a possibility that a misalignment in policy timing could bias the regression results. To address this concern, we reassign the policy implementation year to 2015 and re-estimate the model accordingly. Figure 5 shows the results of the parallel trend test. Table 5, Column (5) shows that after adjusting the policy implementation year from 2014 to 2015, the estimated coefficient of NTUP changes from −1.188 in the baseline regression to −0.965. This change may be attributed to a stronger policy impact in the year of implementation, followed by a gradual decline, or to the possibility that part of the effect was already reflected in earlier periods. Although the coefficient decreases slightly, both estimates remain statistically significant at the 1% level, indicating that the adjustment of policy timing does not materially affect the study’s conclusions. The findings of this study indirectly confirm the existence of a lag effect in the NTUP. The parallel trend test results based on the lag model are also significant. This discovery not only enhances the robustness of the main conclusion but also provides strong evidence for the validity of causal inference.

4.4.5. Sample Space Replacement

Given the possible effects of COVID-19-related lockdowns on PM2.5 emissions, which may confound the observed effects of the NTUP [65]—this analysis omits data from 2019 through 2021 and reruns the regression. As shown in Column (1) of Table 6, the NTUP coefficient holds steady at −1.055 and maintains strong statistical significance (p < 0.01), confirming the policy’s robust effect even when controlling for extraordinary circumstances. These results once again verify the reliability of the core conclusion of this research.

4.4.6. Excluding Concurrent Policies

To control for the potential confounding effects of other concurrent national policies—specifically the National Innovative City Pilot (NIC), the National Smart City Pilot (Smart), and the Broadband China Demonstration City (BBC)—might muddy the waters when it comes to the impact on air pollution, this analysis removes data from counties covered by these three programs and re-estimates the model [19,20,21]. The results presented in Columns (2) to (4) of Table 6 are consistent: the coefficient of the New-Type Urbanization Policy (NTUP) is always significantly negative, being −1.303, −1.224 and −0.966, respectively, and all are statistically significant at the 1% confidence level. These results confirm that the main conclusion of this paper remains robust even after excluding the potential impact of other policy interventions.

4.4.7. PSM-DID

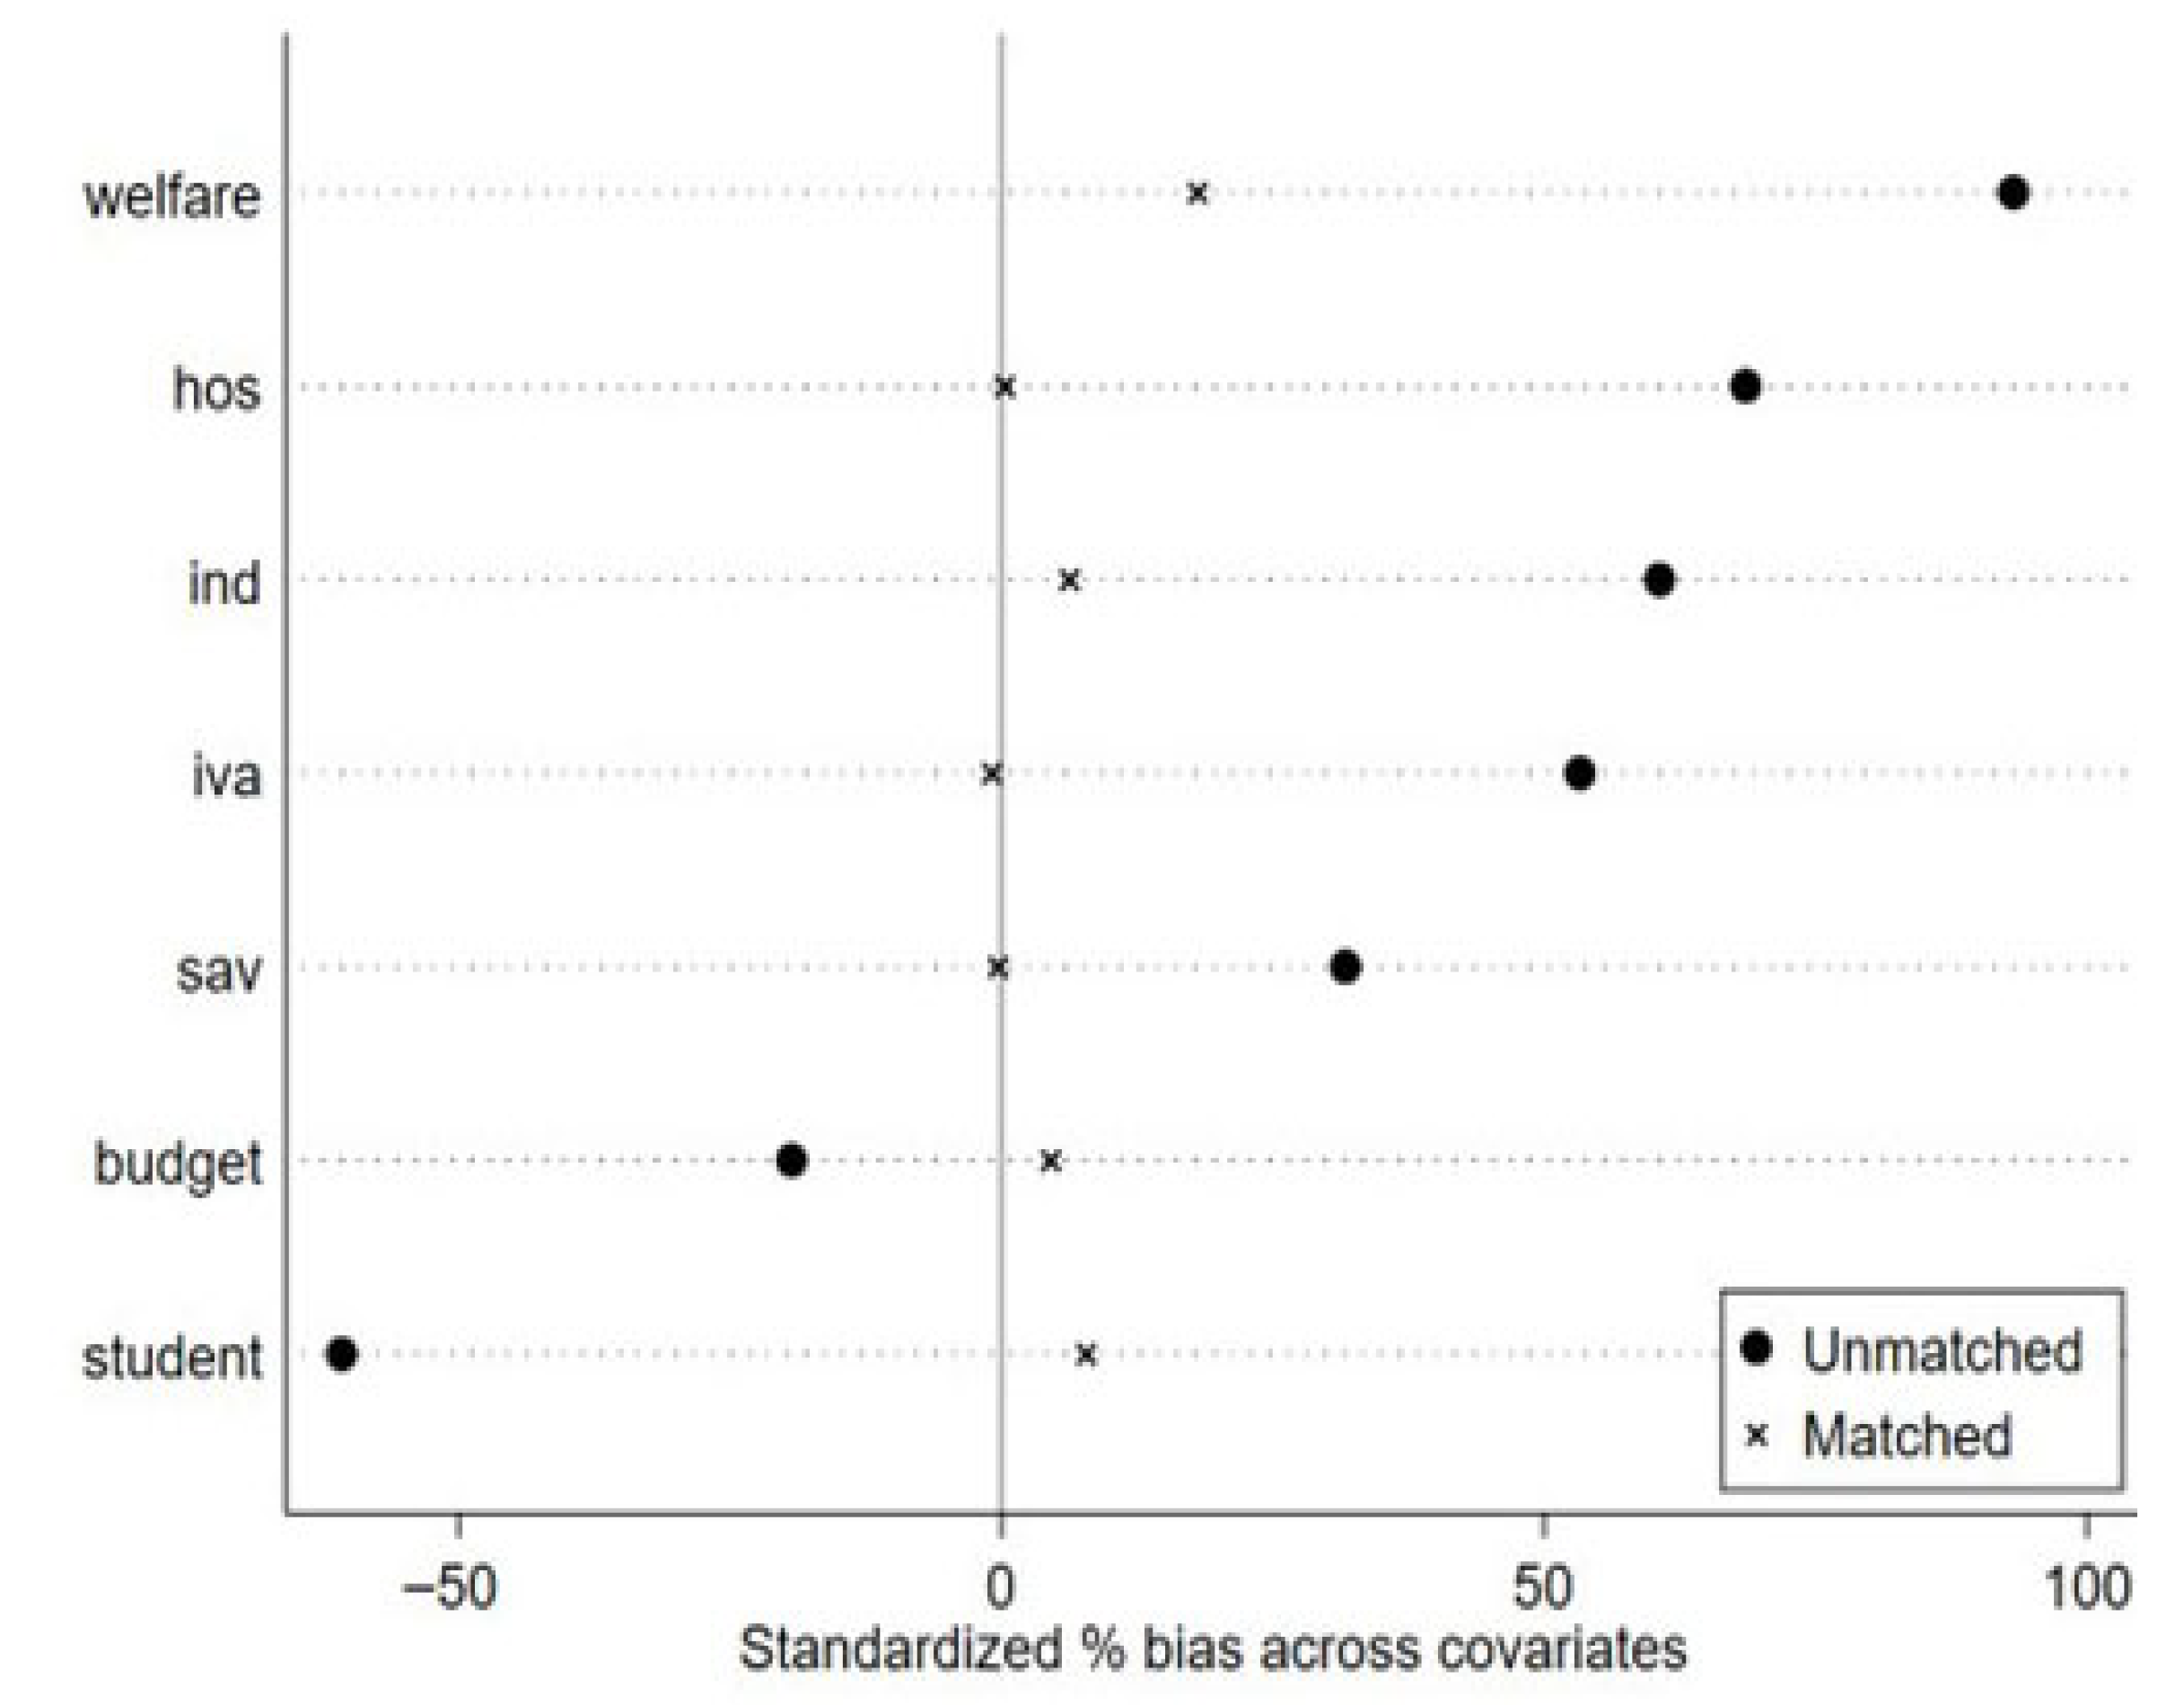
This research uses a DID approach to identify how the NTUP affected city PM2.5 emissions. The DID approach measures policy impact by analyzing outcome differences in treatment and control groups pre- and post-intervention. Nonetheless, if the treatment and control groups exhibit systematic disparities before the intervention, the estimates could be skewed as a result of self-selection [66]. To enhance the precision of causal inference, this study incorporates Propensity Score Matching (PSM) to mitigate potential selection biases [67]. In the matching analysis process, the selection of the matching algorithm is crucial for ensuring the robustness of the results. This study adopts the 1:2 nearest neighbor matching method within the caliper and estimates the propensity score with the aid of a logistic model. The caliper is set to one-quarter of the standard deviation of the propensity scores. The effectiveness of the matching process is illustrated in Figure 6, which shows the percentage bias (%bias) of covariates before and after matching. In Figure 6, black dots represent unmatched observations, while crosses represent matched observations. A significant reduction in %bias across most variables is evident after matching, with the majority of covariates clustering closely around zero. This indicates that the matching procedure has substantially improved covariate balance.
In summary, the matching method effectively mitigates sample selection bias, laying a credible empirical foundation for the subsequent DID regression analysis. The difference-in-differences regression analysis using fixed effects—applied to the matched sample (see Column 8, Table 6)—reveals a statistically significant coefficient of −1.05 for the NTUP’s effect on PM2.5 concentration, with significance at the 1% threshold. This further confirms the robustness and reliability of the main conclusions of this study.

4.5. Placebo Test

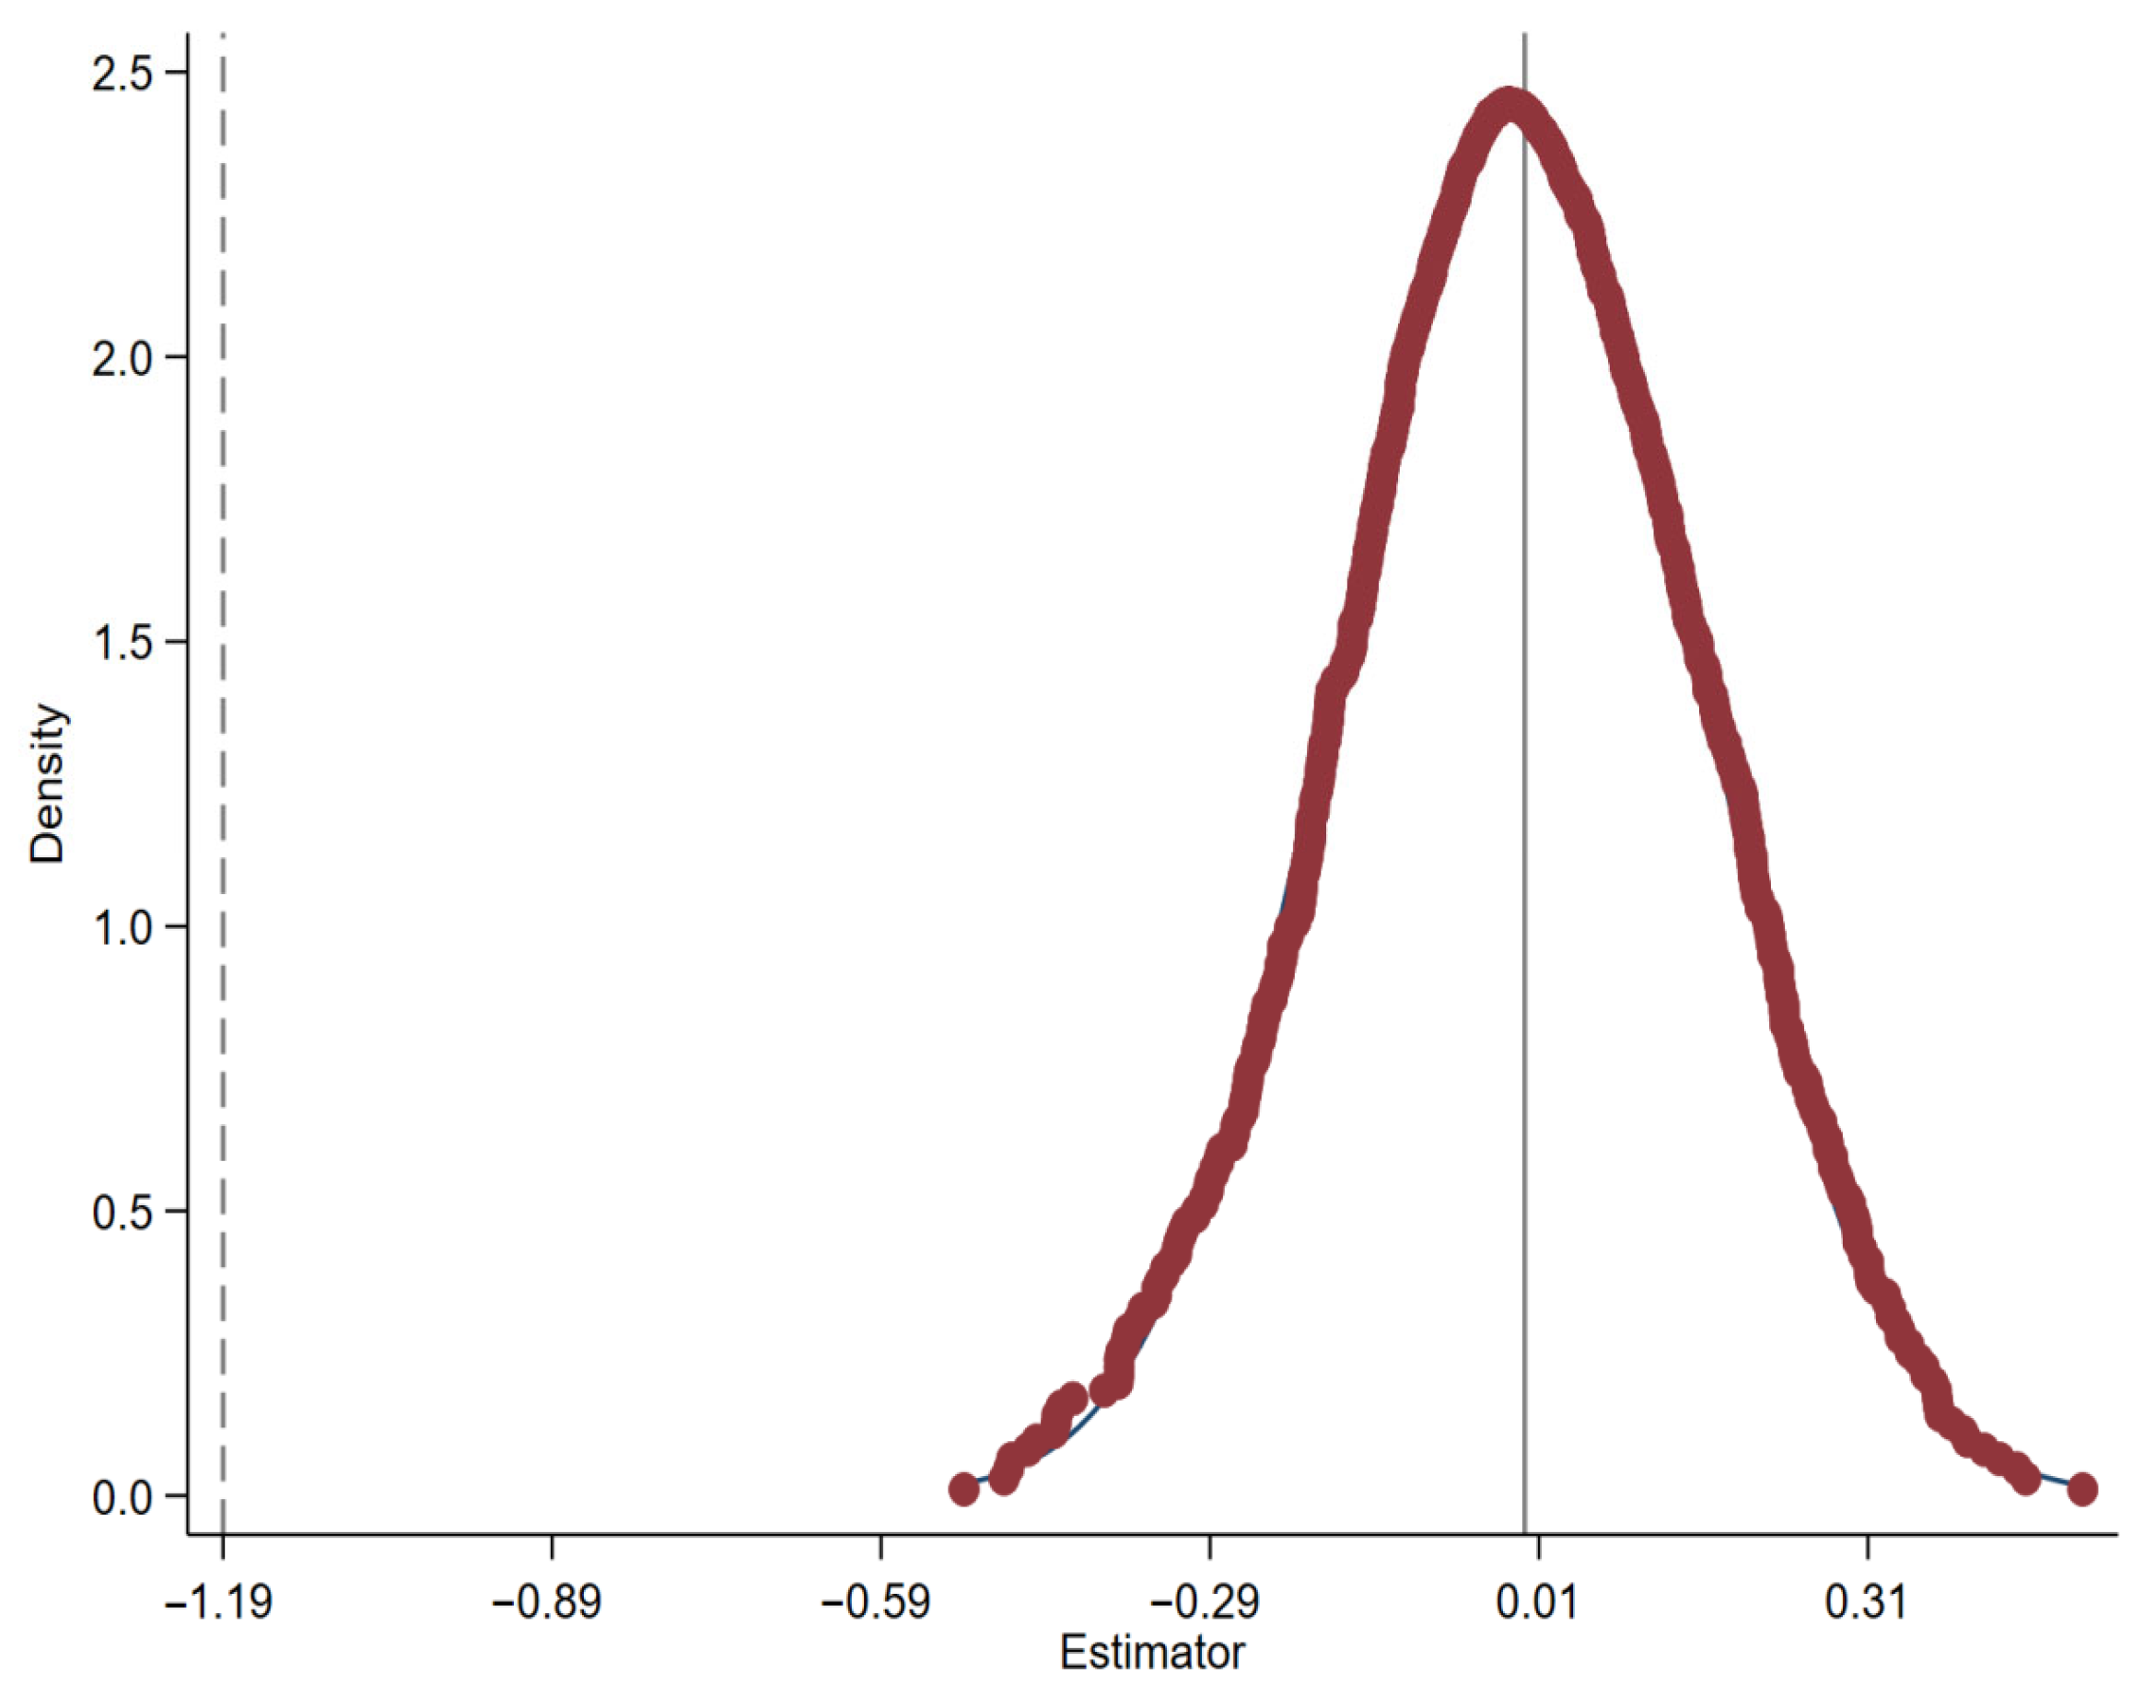
To eliminate the potential impact of unobservable factors on estimation outcomes, this study conducts a placebo test to verify the robustness of the DID model. The approach involves constructing “fake treatments” in the absence of a real policy shock to examine whether spurious correlations exist [68,69,70]. According to existing literature, two common methods are employed in DID-based placebo tests: (1) the fictitious policy timing method, which artificially shifts the policy implementation date forward and tests whether the interaction term between time dummy and the treatment group is significant—insignificance would suggest model robustness; and (2) the randomized treatment group method, which repeatedly assigns treatment labels randomly to construct pseudo-treatment groups, and then observes whether the estimated treatment effects are centered around zero and whether they significantly deviate from the actual policy effect. Compared to the first method, the second avoids potential bias caused by the shortened time window that results from shifting the policy start date. Therefore, this study adopts the second method: within the original sample, we randomly assign NTUP pilot labels to all counties, repeat the DID estimation 1000 times, and record the “fake” treatment effect each time [70,71,72]. The simulated distribution is then visualized using a kernel density plot to assess robustness.
Figure 7 presents the results of the placebo test, showing the distribution of DID estimates under random assignment of treatment and control groups. The x-axis represents the estimated treatment effects, and the y-axis indicates the kernel density. As shown, the simulated distribution approximates a symmetric bell-shaped curve centered around zero. In contrast, the dotted line represents the actual DID estimate (approximately −1.187), which lies at the far tail of the simulated distribution, suggesting that such an outcome would be extremely unlikely to arise by chance. The research findings indicate that the treatment effect observed in the baseline regression model is not caused by random assignment or omitted confounding factors, but truly reflects the causal effect produced by the NTUP.

5. Further Analysis

5.1. Mechanism Test

Previous analysis has demonstrated that the implementation of the New-Type Urbanization Policy (NTUP) significantly reduces PM2.5 concentrations. A natural follow-up question is how this effect is achieved. To address this, the present section explores the potential mediating roles of land use efficiency and innovation efficiency. The Sobel test and bootstrap methods are employed to validate the existence and significance of these mediating channels, thus improving the thoroughness and reliability of the mechanism analysis.

5.1.1. Land Use Effciency

Drawing inspiration from established methodologies in the field [73], this investigation employs a novel metric for assessing land use efficiency: divide the economic gross product of the secondary and tertiary industries by the area of the corresponding administrative region. Compared with traditional indicators based on population or construction land area, this method better captures how leading urban industries utilize land resources. It highlights the economic value generated per unit of land and serves as a more effective measure for assessing the intensity of land use and the effectiveness of related policies across different regions. The data presented in Table 7 (Columns 1 and 2) reveal a marked improvement in land use efficiency within the treatment group after the New-Type Urbanization Policy (NTUP) took effect. The policy’s impact is substantial, with a coefficient estimate of 10.361 that is statistically significant (p < 0.01). Simultaneously, we observe an inverse relationship between land use efficiency (LUE) and PM2.5 levels (−0.043, p < 0.01), suggesting that smarter land use directly contributes to cleaner air. The mediation analysis reinforces this connection: with a Sobel Z-value of 10.53 and Bootstrap results significant at the 1% level, LUE clearly acts as a mediator between NTUP and reduced PM2.5 concentrations. These findings robustly support Hypothesis H2—the NTUP curbs air pollution indirectly by optimizing how land is utilized. The evidence leaves little doubt that promoting efficient land use is a viable pathway to better air quality under this policy framework.

5.1.2. Innovation Efficiency

Drawing on prior research [74], this study employs the number of invention patents (ip) and the number of granted green patents (gp) as representative indicators of regional innovation capacity, and conducts separate regression analyses for each. Specifically, the invention patent variable is constructed by aggregating the counts of granted invention patents, utility models, and design patents, followed by standardization (dividing the total by 100) to capture overall technological innovation capacity. In contrast, green innovation is measured by the number of green technology patents granted, as reported by the China National Intellectual Property Administration, serving as a proxy for eco-innovation activities. The regression results in Columns (3) to (6) of Table 7 show that the estimated coefficients of NTUP on green patents (gp) and invention patents (ip) are 54.597 and 2.996, respectively, both statistically significant at the 1% level. This indicates that NTUP significantly enhances both regional green innovation and overall innovation capacity. Further analysis reveals that the coefficients of gp and ip on PM2.5 are −0.007 and −0.073, respectively, also significant at the 1% level, suggesting that improvements in innovation capacity contribute to the reduction in pollution emissions. The corresponding Sobel Z-values are −6.882 and −5.61, and the Bootstrap test results are likewise significant at the 1% level, confirming that innovation efficiency serves as a significant mediating variable between policy implementation and pollution control. These empirical findings strongly suggest that the New-Type Urbanization Policy promotes reductions in PM2.5 emissions by fostering technological and green innovation, thereby supporting high-quality development. In summary, the empirical analysis in this section validates Hypothesis H3: the NTUP can indirectly improve urban air quality by enhancing technological innovation efficiency.

5.2. Heterogeneity by City Level

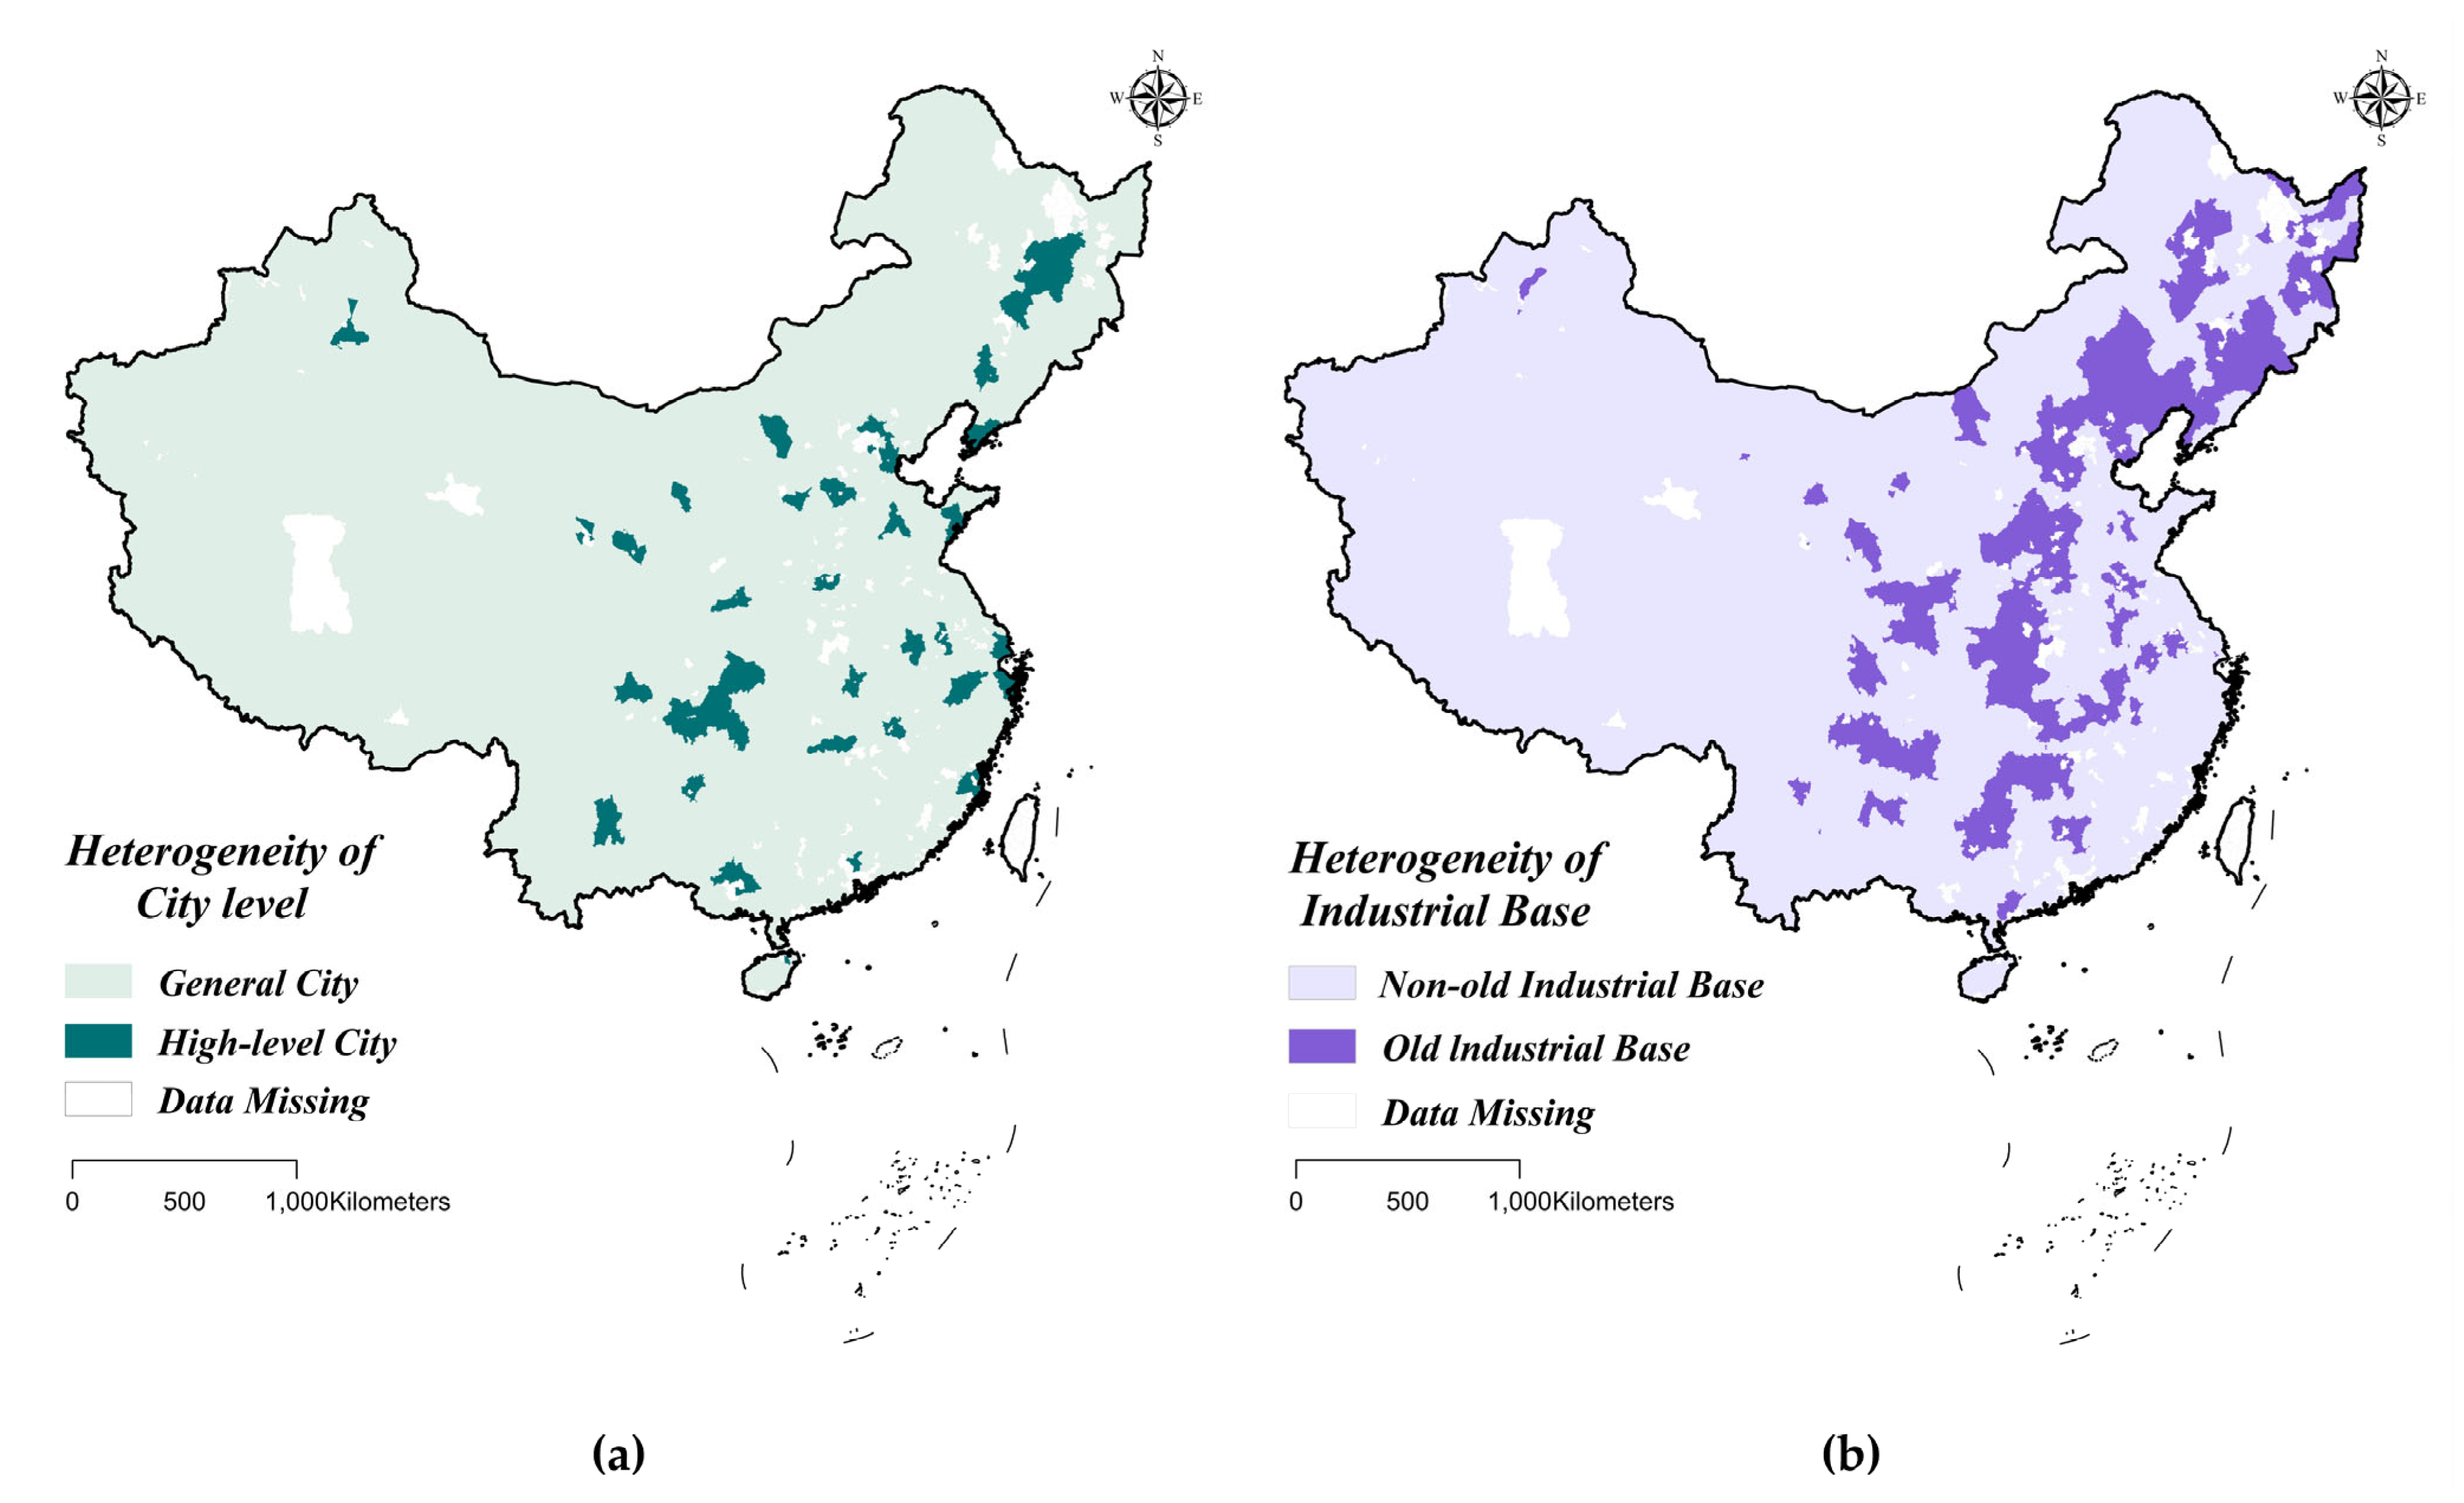
To investigate whether the effects of the policy vary across city hierarchies, this study divides the sample into General Cities (GC) and High-level Cities (HC, including provincial capitals and sub-provincial cities) for separate regressions. Additionally, an interaction term between city level and the NTUP implementation indicator (CL×NTUP) is incorporated into the full-sample model. Columns (1) to (3) of Table 8 reveal the specific results of the regression analysis. Specifically, the data in Columns (1) and (2) indicate that the impact of the new urbanization policy (NTUP) on PM2.5 concentration shows significant differences across various urban levels. In HC, the coefficient of NTUP is negative (−1.638) but statistically insignificant (p > 0.1), suggesting limited pollution mitigation effects in these cities. In contrast, the effect is both negative and statistically significant in GC (coefficient = −1.418, p < 0.01), indicating a substantial reduction in PM2.5 concentrations. Furthermore, Column (3) introduces the interaction between NTUP and city hierarchy, yielding a significant negative coefficient (−3.779, p < 0.01). This result implies that, relative to GC, the marginal pollution reduction effect of NTUP is stronger in HC. Several factors may explain this heterogeneity. First, the relatively small number of HC observations and their already lower baseline pollution levels and stronger environmental governance capacities may limit observable improvements. Second, GC—characterized by rapidly evolving infrastructure and industrial structures—may benefit more from marginal policy interventions. Third, the interaction effect may reflect a synergistic relationship, whereby HC leverage superior institutional capacity and resource endowments to amplify the impact of NTUP. Figure 8a illustrates the geographic distribution of HC and GC.

5.3. Heterogeneity by Industrial Base

To investigate how differences in industrial foundations affect policy outcomes, this study adopts the classification criteria of the National Development and Reform Commission’s Adjustment and Revitalization Plan for Old Industrial Bases (2013–2022), dividing the sample into two categories: Old Industrial Bases (OIB) and Non-Old Industrial Bases (NOIB). An interaction term (IB×NTUP) between the industrial base and the New-Type Urbanization Policy (NTUP) is introduced in the full sample to conduct separate regression analyses. Based on the regression results presented in Columns (4) to (6) of Table 8, the study further examines the heterogeneity of NTUP’s environmental impact across different industrial contexts. Specifically, Model (4), which focuses on OIB cities, shows a negative coefficient for NTUP (−0.531), though the result is statistically insignificant (p > 0.1), indicating that the policy does not significantly reduce PM2.5 concentrations in these cities. In contrast, Model (5), which examines NOIB cities, reports a significantly negative coefficient for NTUP (−1.209, p < 0.01), suggesting a strong air quality improvement effect. Model (6) includes the interaction term between NTUP and OIB, with a coefficient of −0.929 that is statistically significant at the 5% level. This result implies that, compared to NOIB cities, the marginal emission reduction effect of NTUP is substantially lower in OIB cities. These findings reveal pronounced regional heterogeneity, likely driven by structural constraints inherent to OIB cities in terms of industrial composition, infrastructure, and institutional capacity. First, OIB areas typically rely heavily on pollution-intensive industries such as heavy chemicals, coal, and steel, exhibiting strong path dependence and limited flexibility for industrial transformation. Second, outdated infrastructure and low energy efficiency hinder the adoption of clean technologies and weaken the enforcement of green transition policies. Lastly, these cities often face fiscal stress and limited administrative resources, impeding their ability to undertake systemic pollution abatement and infrastructure upgrades. More importantly, while NTUP emphasizes intensive, efficient, and sustainable development, OIB cities tend to prioritize “stability maintenance” and “growth preservation,” resulting in a mismatch between the “new policy” goals and the “old logic” of governance. This disconnect ultimately undermines the effectiveness of the policy. Figure 8b illustrates the geographic distribution of OIB and NOIB cities.

5.4. Heterogeneity of Industrial Structure

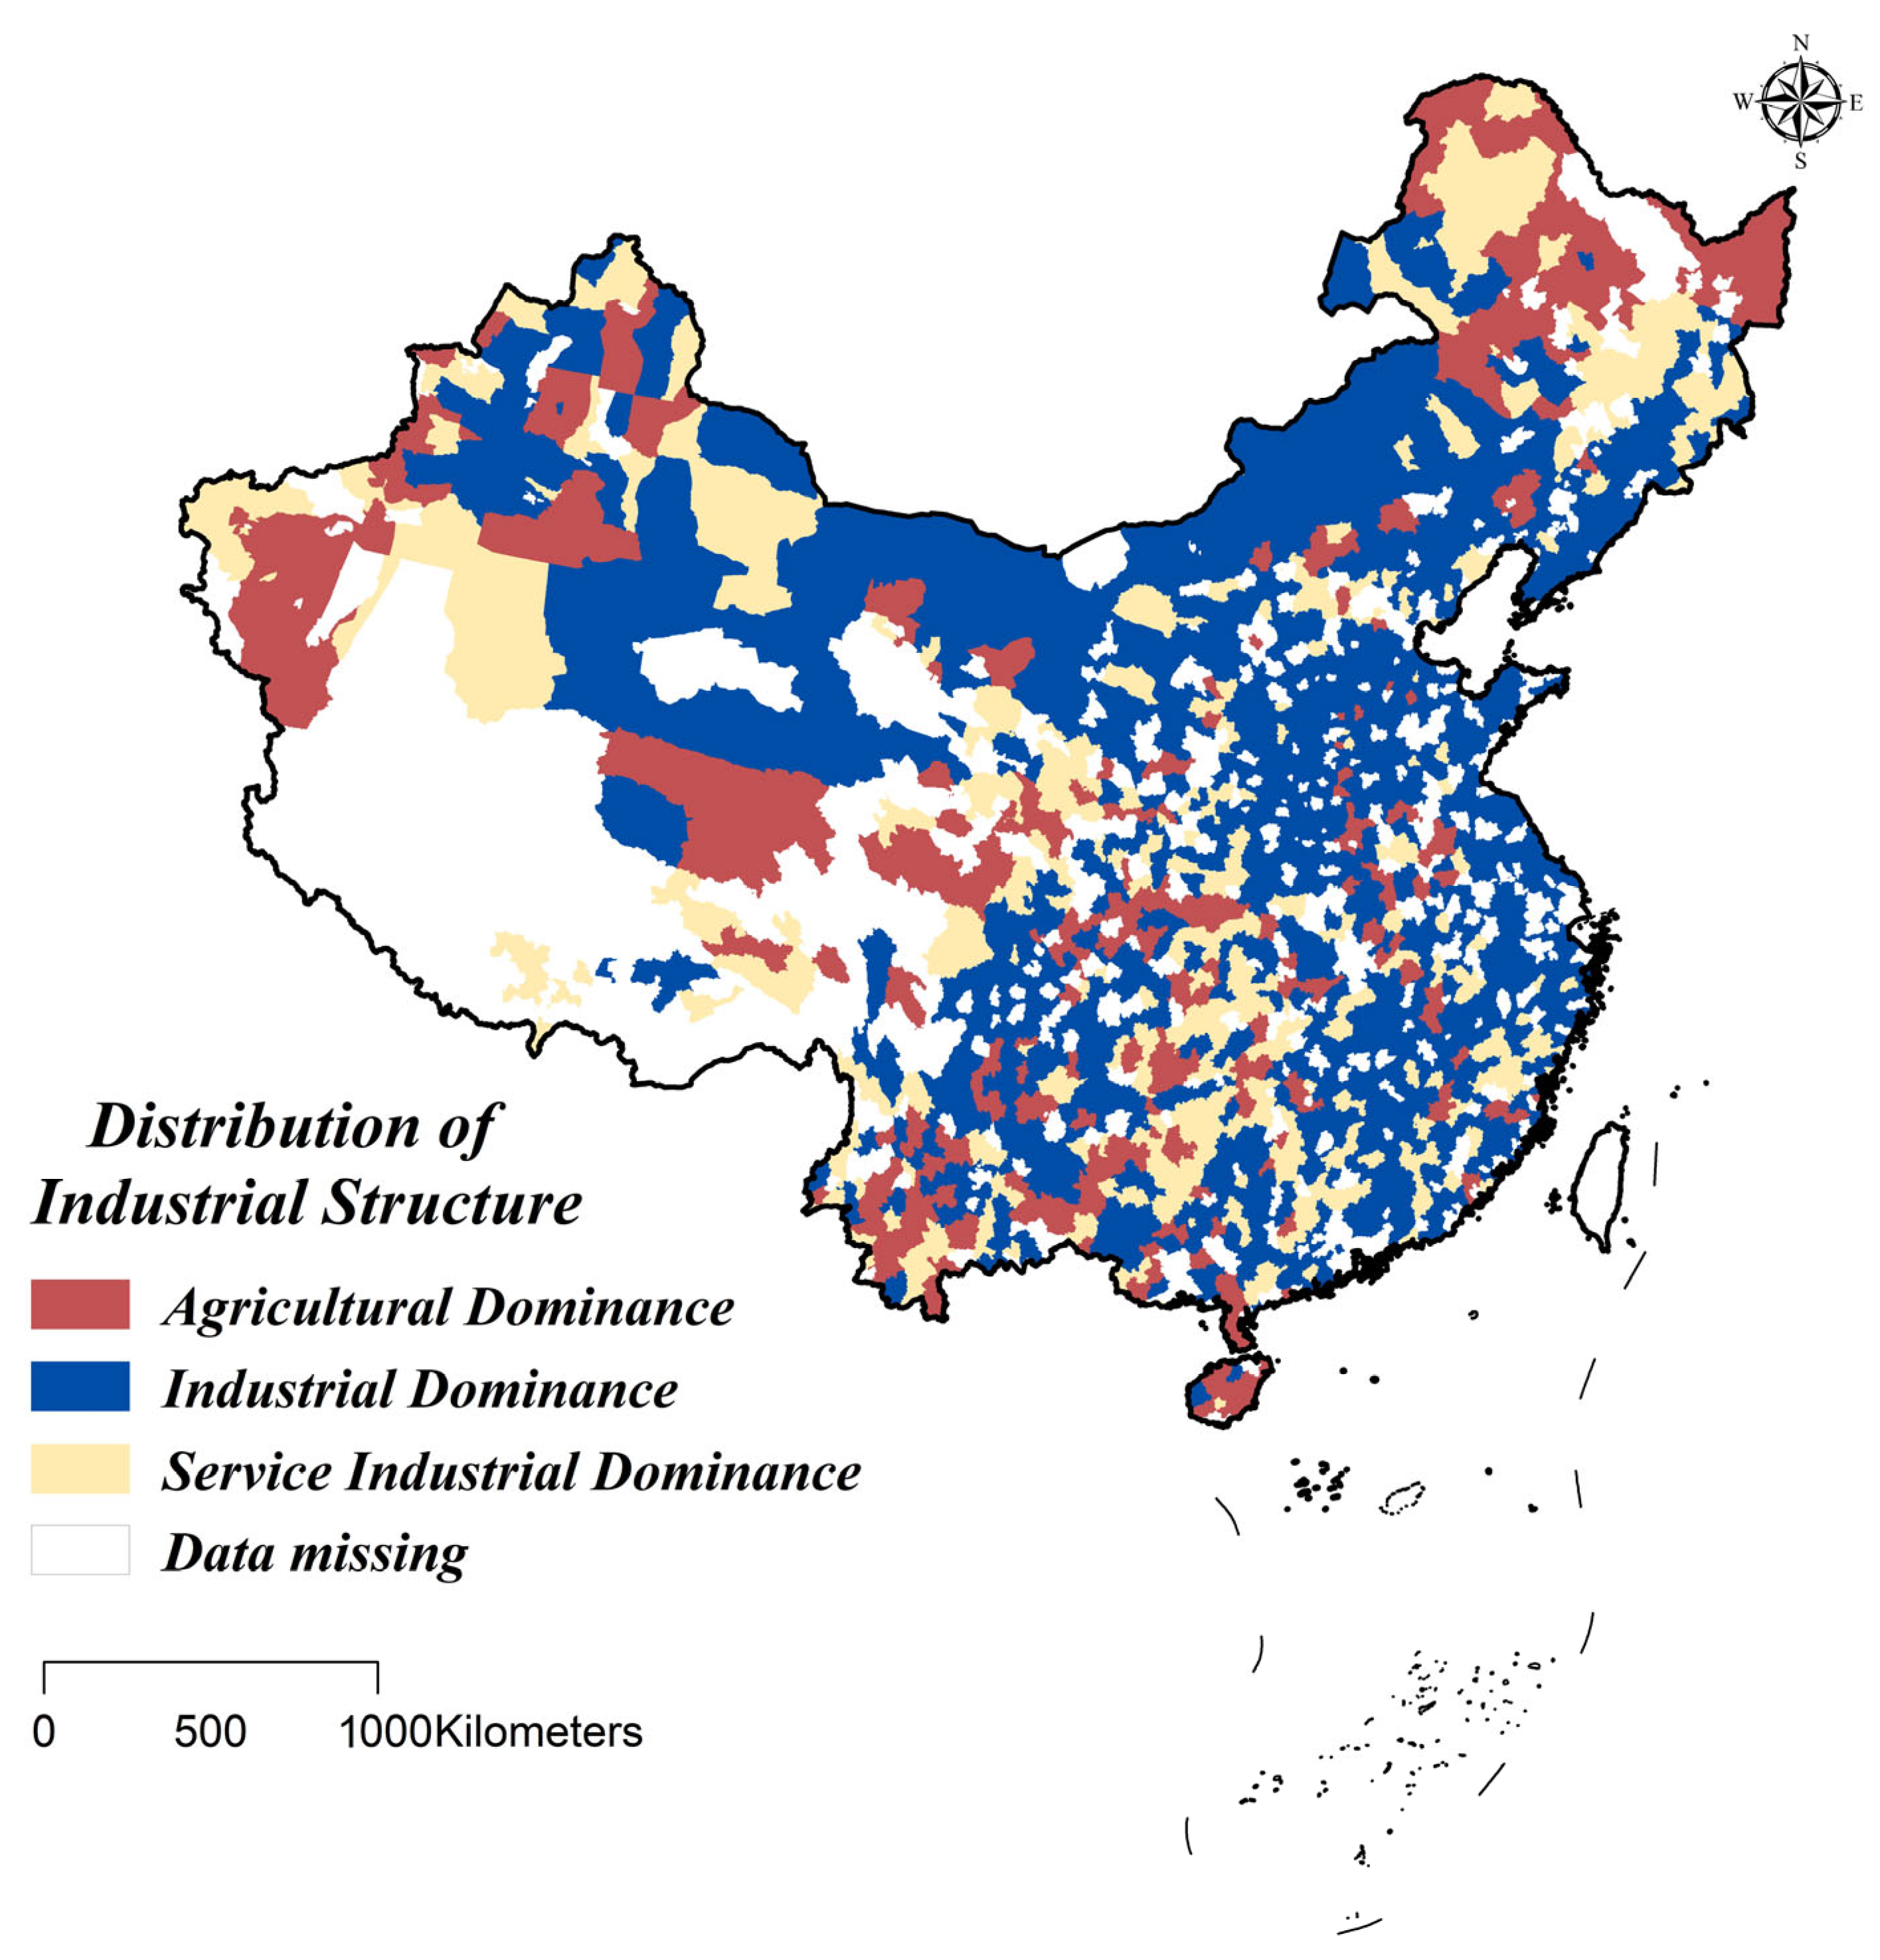
To further investigate the governance effects of the NTUP under varying industrial structures, this study classifies counties into three categories based on the value-added share of their primary, secondary, and tertiary industries: Agricultural Dominance (AD), Industrial Dominance (ID), and Service Industrial Dominance (SID). Separate regressions are conducted for each group. As shown in Columns (1) to (3) of Table 9, the NTUP coefficients are −0.181 for AD regions, −0.122 for ID regions, and −0.694 for SID regions. Among them, only the coefficient for SID cities is statistically significant at the 10% level, suggesting that NTUP has not produced significant pollution control effects in agricultural and industrial cities, while it has notably improved PM2.5 concentrations in service-oriented cities. This heterogeneity may stem from differences in pollution sources, governance capacity, and policy adaptability across industrial structures. First, agricultural-dominant counties are primarily engaged in crop farming and animal husbandry, with relatively few industrial pollution sources. PM2.5 pollution in such areas tends to be seasonal and related to daily activities, leaving limited room for marginal policy interventions to generate observable outcomes. Second, industrial-dominant regions are typically characterized by high-pollution and high-energy-consuming sectors, with emissions concentrated in manufacturing and heavy industries. Although the NTUP is implemented, strong path dependence and high transformation costs hinder effective emissions reduction in the short term, suppressing the policy’s observable impact. Additionally, some industrial cities prioritize economic stability and growth over environmental concerns, reflecting a trade-off that undermines the actual effectiveness of the policy.
By contrast, Service Industrial Dominance (SID) cities—where the tertiary sector constitutes the primary economic base—exhibit fewer industrial pollution sources, enabling policy interventions to target environmental issues more directly and effectively. These cities are often located in eastern coastal or emerging regions, characterized by stronger governance capacities, more advanced environmental infrastructure, and more responsive policy implementation mechanisms. The rollout of the New-Type Urbanization Policy (NTUP) in such contexts is more likely to trigger a “structural optimization–emission reduction” chain effect, thereby contributing to a significant decrease in PM2.5 concentrations. Figure 9 illustrates the spatial distribution of cities across different dominant industrial structures.

6. Discussion and Conclusions

6.1. Discussion

This study confirms that the implementation of the New-Type Urbanization Policy (NTUP) has a significant and favorable effect on reducing urban PM2.5 concentrations, with an estimated coefficient of −1.188 that is statistically significant at the 1% level. This finding is consistent with the results reported by Li J. et al. [75]. However, this study provides more universal and robust empirical evidence for the effectiveness of NTUP in improving air quality by utilizing longer time-span observation data and a broader sample of county-level units. These findings further underscore the importance of NTUP as a critical policy instrument for pollution mitigation and offer stronger empirical support for policymakers considering the promotion or optimization of similar interventions.
In contrast to international experiences, European countries typically rely on end-of-pipe control measures to address PM2.5 pollution [76], while the United States emphasizes source control through institutional frameworks such as the Clean Air Act [77]. In both contexts, improving land use efficiency and promoting green technological innovation are regarded as key long-term strategies for emission reduction. From an empirical perspective, this study demonstrates that China’s New-Type Urbanization Policy (NTUP) has also led to improvements in air quality through institutional innovation. This provides a viable “institution-structure synergy” pathway for other developing economies that are still in the midst of industrialization.
Moreover, this study identifies two key mediating mechanisms through which the New-Type Urbanization Policy (NTUP) influences pollution reduction: enhancing land use efficiency and promoting innovation efficiency. Recognizing these mechanisms helps deepen the understanding of how NTUP operates in practice and provides valuable guidance for future urban policy design. Regarding land use efficiency, regression results show that the estimated coefficient of NTUP on LUE is 10.361 and statistically significant at the 1% level. Additionally, the impact of LUE on PM2.5 concentrations is −0.043, also significant at the 1% level. The Sobel Z-value reaches 10.53, and the Bootstrap test also passes at the 1% significance level, indicating that NTUP significantly reduces pollution emissions by improving the economic output per unit of land. These findings are consistent with the results of Niu B [78] and Wen H.M [79]. In terms of technological and green innovation, NTUP significantly increases the number of granted green patents (gp) and invention patents (ip), with coefficients of 54.597 and 2.996, respectively, both statistically significant. Meanwhile, gp and ip are shown to reduce PM2.5 concentrations, with coefficients of −0.007 and −0.073, respectively, both highly significant. The corresponding Sobel Z-values are −6.882 and −5.61, and the Bootstrap tests confirm the robustness of these results, verifying that innovation efficiency serves as a significant mediating variable between NTUP and pollution control. Together, these findings further demonstrate that NTUP not only promotes high-quality development but also plays a significant role in pollution and carbon reduction, aligning with the conclusions drawn by Zhao C. et al. [23].
In addition, the study reveals significant heterogeneity in the effects of the New-Type Urbanization Policy (NTUP) across city hierarchy, industrial base, and dominant industries. Compared to sub-provincial and higher-level cities, the policy effect is more pronounced in general prefecture-level cities (coefficient = −1.418, p < 0.01). In terms of industrial base, cities classified as Non-Old Industrial Bases (NOIB) exhibit a stronger reduction in PM2.5 concentrations (coefficient = −1.209), while the policy effect is statistically insignificant in Old Industrial Bases (OIB). Regarding dominant industries, NTUP significantly reduces PM2.5 emissions in cities led by the service sector, but its effect is not significant in counties dominated by agriculture or industry. Taken together, this study not only confirms the effectiveness of China’s NTUP in pollution control using micro-level data, but it also demonstrates the international adaptability of its “land use efficiency + innovation incentives” mechanism. Compared with global practices, China’s experience provides a practical policy model for emerging economies seeking sustainable pollution governance during urbanization. Moving forward, enhancing region-specific implementation and optimizing institutional coordination will be key strategies for promoting sustainable urbanization and improving air quality worldwide.

6.2. Limitations

Admittedly, this study employed robust econometric methods and a large-scale dataset to assess the effect of the New-Type Urbanization Policy (NTUP) on PM2.5 concentrations. Nevertheless, certain limitations still exist in the research, and these issues require more in-depth examination and analysis in subsequent studies. First, the analysis mainly focuses on the effects of NTUP and its underlying mechanisms—namely, land use efficiency and innovation efficiency—on air quality. However, the concentration of PM2.5 may also be affected by factors such as the structure of energy consumption and natural environmental conditions that have not been included as variables. Given that the absence of the above factors may impose limitations on the model’s explanatory power, future research should actively incorporate more control variables such as precipitation and energy efficiency, thereby enhancing the comprehensiveness and internal validity of the model. Second, although a DID model is employed to identify the causal effect of NTUP on PM2.5 pollution, and 2014 is set as a uniform policy initiation year, the actual implementation time and intensity of NTUP vary significantly across regions. Relying on a fixed treatment year may lead to an underestimation of the policy effects arising from staggered implementation. Therefore, future research could consider constructing a region-specific policy intensity index based on policy documents to enhance the accuracy of estimation. Third, the mechanism analysis relies primarily on county-level panel data to examine land use and innovation efficiency, lacking support from micro-level data. This limits the ability to fully uncover the transmission pathways of the policy effects. Future work may benefit from integrating data at the enterprise, household, or government levels to improve the depth and granularity of mediation mechanism identification. Lastly, this study does not control for spatial spillover effects of the policy or potential interference from concurrent environmental policies. For example, phenomena such as industrial relocation or pollution substitution may threaten the independence of the estimated results. Subsequent studies are advised to employ spatial econometric models or multi-policy identification frameworks to enhance the robustness of the estimations and the scientific validity of the policy implications.

6.3. Conclusions

As the New-Type Urbanization Policy (NTUP) has been progressively implemented across China, the nation has undergone a strategic shift from traditional rapid urbanization toward a more sustainable and human-centered urbanization paradigm. The policy shift notably decreased PM2.5 concentrations, dovetailing with the Clean Air Initiative’s goals. Against the backdrop of China’s commitment to achieving its dual carbon goals, this study comprehensively examines the impact of NTUP on urban PM2.5 concentrations. Based on the panel data of 1462 counties from 2006 to 2020, this study conducted a systematic exploration of the correlation between the two. A difference-in-differences (DID) approach was employed, supplemented by rigorous parallel trend tests, multiple robustness checks, and placebo tests to validate the empirical findings. Mechanism analysis and heterogeneity tests were further conducted to explore the underlying pathways and differentiated effects.
The primary conclusions of this paper are as follows: (1) Results from the benchmark regression indicate that the implementation of NTUP has significantly decreased urban PM2.5 concentrations. This finding remains robust after controlling for outliers, intra-county correlations, concurrent policy interferences, and other potential confounding factors. (2) Mechanism analysis reveals that NTUP lowers PM2.5 concentrations by enhancing land use efficiency and fostering innovation efficiency. These results are validated by both the Sobel test and Bootstrap procedures, confirming the robustness of the identified mediating channels. (3) Heterogeneity analysis demonstrates that the negative impact of NTUP on PM2.5 emissions varies across regions. The policy is particularly effective in General Cities, Non-old Industrial Base areas, and regions dominated by the Service Industrial Structure. These findings collectively highlight the efficacy of NTUP in advancing environmental governance and improving air quality, while also shedding light on its transmission mechanisms and region-specific outcomes.

6.4. Policy Recommendations

This research reveals that the New-Type Urbanization Policy (NTUP) plays a crucial role in lowering PM2.5 concentrations, shedding new light on what drives urban air pollution while providing actionable recommendations for shaping smarter city planning policies. From both a theoretical and practical perspective, this study extends the discourse on the determinants of urban PM2.5 pollution and provides robust empirical evidence to support policy enhancement. Specifically, the conclusions drawn here carry three key policy implications for China’s “dual carbon” targets and broader regional sustainable development goals.

6.4.1. Reducing PM2.5 Concentrations to Advance Air Pollution Mitigation

This study provides empirical evidence that the New-Type Urbanization Policy (NTUP) has a significant effect in reducing PM2.5 concentrations, indicating strong potential for emission reduction at the national level. However, the results also reveal substantial heterogeneity in policy effectiveness across regions, industrial bases, and city hierarchies, suggesting that a uniform nationwide implementation approach faces practical challenges. In terms of policy promotion, NTUP should continue to serve as a key instrument in advancing the national goals of pollution and carbon reduction. Clear, phased targets for air quality improvement should be established, accompanied by central fiscal incentives and performance evaluation mechanisms to enhance the motivation of local governments in executing the policy. Furthermore, the policy’s role in ecological and environmental governance should be strengthened by incorporating PM2.5 mitigation outcomes into the performance assessment framework for NTUP. Given that the policy demonstrates more pronounced effects in county-level cities and non-old industrial bases, these areas can serve as priority zones for replicating successful governance models. Additionally, interregional coordination mechanisms should be developed to promote joint pollution control efforts, helping to mitigate border effects that may arise during policy implementation.

6.4.2. Establishing Standards and Regulations for Land Use Management

The mechanism analysis reveals that land use efficiency serves as a key mediating variable through which the New-Type Urbanization Policy (NTUP) influences PM2.5 concentrations, playing a crucial role in the policy’s effect pathway. Therefore, it is imperative to establish more scientific and operable standards for land use management during the implementation of NTUP. It is recommended that local governments, in alignment with regional development stages and resource endowments, develop land use evaluation mechanisms oriented toward green development. For instance, a green land certification system could be introduced for land projects that meet the criteria for green buildings, eco-industrial parks, or low-carbon communities. Priority in approval processes and fiscal subsidies could be provided to guide enterprises toward improving land use efficiency. In regions such as old industrial bases, where land use efficiency remains low, strict environmental regulations should be enforced, including exit mechanisms for underperforming land projects, in order to prevent resource misallocation and pollution spillovers. Moreover, a dynamic land use performance evaluation platform should be established, incorporating indicators such as pollution emission intensity, construction density, and energy use efficiency into the land resource approval system. This shift from incremental expansion to stock optimization will not only contribute to air quality improvement but also enhance the role of land as a strategic factor in supporting high-quality regional development.

6.4.3. Formulating Customized New-Type Urbanization Policies

This study’s subregional heterogeneity analysis reveals that the marginal effects of the New-Type Urbanization Policy (NTUP) are more pronounced in high-tier cities and non-old industrial base (NOIB) regions, whereas the effects are not statistically significant in old industrial bases (OIBs) and some traditional industrial areas. It can be seen from this that the implementation of regional policies is to a large extent restricted by factors such as industrial path dependence and differences in resource endowments. Accordingly, when promoting NTUP nationwide, a one-size-fits-all approach should be avoided. Instead, a differentiated policy design framework characterized by “zonal classification and context-specific adaptation” is recommended. In NOIB cities and regions with relatively abundant resources, emphasis should be placed on driving green transformation through technological innovation and the agglomeration of green industries to amplify policy multiplier effects. Conversely, in OIBs and areas with entrenched high-pollution industries, parallel efforts should be made to upgrade traditional sectors, improve fiscal incentive mechanisms, and implement talent attraction strategies to alleviate structural constraints in policy execution. In addition, it is advisable to construct an index system to measure policy implementation intensity. This system should quantify differences based on dimensions such as policy content, financial support, the number of supplementary local regulations, and execution timeliness. By integrating “universal promotion” with “localized adaptation,” NTUP can achieve coordinated emission reduction goals on a national scale and enhance the systemic, targeted, and sustainable nature of urban air quality governance in China.

Author Contributions

All authors contributed to this study conception and design. Material preparation, data collection, and analysis were performed by Y.W., S.C., Z.Z. and S.Z. The first draft of this manuscript was written by Y.W. and all authors commented on previous versions of this manuscript. All authors have read and agreed to the published version of the manuscript.

Funding

This study is supported by the Research Planning Project of Philosophy and Social Sciences in Heilongjiang Province: “Research on the Evolution Mechanism and Realization Path of New Quality Productivity in Manufacturing Empowered by Digital-Physical Integration in Heilongjiang Province” Project Number: SW042301.

Institutional Review Board Statement

Not applicable.

Informed Consent Statement

Not applicable.

Data Availability Statement

All data used in this study are available from the corresponding author upon request.

Conflicts of Interest

The authors declare no conflicts of interest.

Abbreviations

NTUPNew-Type Urbanization Policy
PM2.5Particulate Matter 2.5
LUELand Use Efficiency

References

  1. Feng, Y.; Castro, E.; Wei, Y.; Jin, T.; Qiu, X.; Dominici, F.; Schwartz, J. Long-Term Exposure to Ambient PM2.5, Particulate Constituents and Hospital Admissions from Non-Respiratory Infection. Nat. Commun. 2024, 15, 1518. [Google Scholar] [CrossRef]
  2. Hill, W.; Lim, E.L.; Weeden, C.E.; Lee, C.; Augustine, M.; Chen, K.; Kuan, F.-C.; Marongiu, F.; Evans, E.J.; Moore, D.A.; et al. Lung Adenocarcinoma Promotion by Air Pollutants. Nature 2023, 616, 159–167. [Google Scholar] [CrossRef]
  3. Li, G.; Fang, C.; Wang, S.; Sun, S. The Effect of Economic Growth, Urbanization, and Industrialization on Fine Particulate Matter (PM2.5) Concentrations in China. Environ. Sci. Technol. 2016, 50, 11452–11459. [Google Scholar] [CrossRef] [PubMed]
  4. Dong, F.; Li, J.; Zhang, X.; Zhu, J. Decoupling Relationship between Haze Pollution and Economic Growth: A New Decoupling Index. Ecol. Indic. 2021, 129, 107859. [Google Scholar] [CrossRef]
  5. Fang, D.; Yu, B. Driving Mechanism and Decoupling Effect of PM2.5 Emissions: Empirical Evidence from China’s Industrial Sector. Energy Policy 2021, 149, 112017. [Google Scholar] [CrossRef]
  6. Feng, T.; Du, H.; Lin, Z.; Zuo, J. Spatial Spillover Effects of Environmental Regulations on Air Pollution: Evidence from Urban Agglomerations in China. J. Environ. Manag. 2020, 272, 110998. [Google Scholar] [CrossRef]
  7. Gupta, M.; Saini, S.; Sahoo, M. Determinants of Ecological Footprint and PM2.5: Role of Urbanization, Natural Resources and Technological Innovation. Environ. Chall. 2022, 7, 100467. [Google Scholar] [CrossRef]
  8. Zhang, M.; Tan, S.; Pan, Z.; Hao, D.; Zhang, X.; Chen, Z. The Spatial Spillover Effect and Nonlinear Relationship Analysis between Land Resource Misallocation and Environmental Pollution: Evidence from China. J. Environ. Manag. 2022, 321, 115873. [Google Scholar] [CrossRef]
  9. Wang, Y.; Yuan, Y.; Wang, Q.; Liu, C.; Zhi, Q.; Cao, J. Changes in Air Quality Related to the Control of Coronavirus in China: Implications for Traffic and Industrial Emissions. Sci. Total Environ. 2020, 731, 139133. [Google Scholar] [CrossRef]
  10. Shisong, C.; Wenji, Z.; Hongliang, G.; Deyong, H.; You, M.; Wenhui, Z.; Shanshan, L. Comparison of Remotely Sensed PM2.5 Concentrations between Developed and Developing Countries: Results from the US, Europe, China, and India. J. Clean. Prod. 2018, 182, 672–681. [Google Scholar] [CrossRef]
  11. Shi, Y.; Bilal, M.; Ho, H.C.; Omar, A. Urbanization and Regional Air Pollution across South Asian Developing Countries—A Nationwide Land Use Regression for Ambient PM2.5 Assessment in Pakistan. Environ. Pollut. 2020, 266, 115145. [Google Scholar] [CrossRef] [PubMed]
  12. Li, C.; Sampene, A.K.; Agyeman, F.O.; Brenya, R.; Wiredu, J. The Role of Green Finance and Energy Innovation in Neutralizing Environmental Pollution: Empirical Evidence from the MINT Economies. J. Environ. Manag. 2022, 317, 115500. [Google Scholar] [CrossRef] [PubMed]
  13. Zhang, X.; Geng, Y.; Shao, S.; Wilson, J.; Song, X.; You, W. China’s Non-Fossil Energy Development and Its 2030 CO2 Reduction Targets: The Role of Urbanization. Appl. Energy 2020, 261, 114353. [Google Scholar] [CrossRef]
  14. Sun, B.; Fang, C.; Liao, X.; Guo, X.; Liu, Z. The Relationship between Urbanization and Air Pollution Affected by Intercity Factor Mobility: A Case of the Yangtze River Delta Region. Environ. Impact Assess. Rev. 2023, 100, 107092. [Google Scholar] [CrossRef]
  15. Xu, B.; Lin, B. What Cause Large Regional Differences in PM2.5 Pollutions in China? Evidence from Quantile Regression Model. J. Clean. Prod. 2018, 174, 447–461. [Google Scholar] [CrossRef]
  16. Zhu, L.; Hao, Y.; Lu, Z.-N.; Wu, H.; Ran, Q. Do Economic Activities Cause Air Pollution? Evidence from China’s Major Cities. Sustain. Cities Soc. 2019, 49, 101593. [Google Scholar] [CrossRef]
  17. Cárdenas Rodríguez, M.; Dupont-Courtade, L.; Oueslati, W. Air Pollution and Urban Structure Linkages: Evidence from European Cities. Renew. Sustain. Energy Rev. 2016, 53, 1–9. [Google Scholar] [CrossRef]
  18. Gaigné, C.; Riou, S.; Thisse, J.-F. Are Compact Cities Environmentally Friendly? J. Urban Econ. 2012, 72, 123–136. [Google Scholar] [CrossRef]
  19. Gao, K.; Yuan, Y. The Effect of Innovation-Driven Development on Pollution Reduction: Empirical Evidence from a Quasi-Natural Experiment in China. Technol. Forecast. Soc. Change 2021, 172, 121047. [Google Scholar] [CrossRef]
  20. Chu, Z.; Cheng, M.; Yu, N.N. A Smart City Is a Less Polluted City. Technol. Forecast. Soc. Change 2021, 172, 121037. [Google Scholar] [CrossRef]
  21. Dong, F.; Li, Y.; Qin, C.; Zhang, X.; Chen, Y.; Zhao, X.; Wang, C. Information Infrastructure and Greenhouse Gas Emission Performance in Urban China: A Difference-in-Differences Analysis. J. Environ. Manage. 2022, 316, 115252. [Google Scholar] [CrossRef]
  22. Yu, B. Ecological Effects of New-Type Urbanization in China. Renew. Sustain. Energy Rev. 2021, 135, 110239. [Google Scholar] [CrossRef]
  23. Zhao, C.; Wang, B. How Does New-Type Urbanization Affect Air Pollution? Empirical Evidence Based on Spatial Spillover Effect and Spatial Durbin Model. Environ. Int. 2022, 165, 107304. [Google Scholar] [CrossRef] [PubMed]
  24. Lin, H.; Zhu, J.; Jiang, P.; Cai, Z.; Yang, X.; Yang, X.; Zhou, Z.; Wei, J. Assessing Drivers of Coordinated Control of Ozone and Fine Particulate Pollution: Evidence from Yangtze River Delta in China. Environ. Impact Assess. Rev. 2022, 96, 106840. [Google Scholar] [CrossRef]
  25. Dong, G.; Ge, Y.; Liu, J.; Kong, X.; Zhai, R. Evaluation of Coupling Relationship between Urbanization and Air Quality Based on Improved Coupling Coordination Degree Model in Shandong Province, China. Ecol. Indic. 2023, 154, 110578. [Google Scholar] [CrossRef]
  26. Wang, Z.; Sun, Y.; Wang, B. How Does the New-Type Urbanisation Affect CO2 Emissions in China? An Empirical Analysis from the Perspective of Technological Progress. Energy Econ. 2019, 80, 917–927. [Google Scholar] [CrossRef]
  27. Mitchell, C.; Connor, P. Renewable Energy Policy in the UK 1990–2003. Energy Policy 2004, 32, 1935–1947. [Google Scholar] [CrossRef]
  28. Hao, Y.; Zheng, S.; Zhao, M.; Wu, H.; Guo, Y.; Li, Y. Reexamining the Relationships among Urbanization, Industrial Structure, and Environmental Pollution in China—New Evidence Using the Dynamic Threshold Panel Model. Energy Rep. 2020, 6, 28–39. [Google Scholar] [CrossRef]
  29. Chuang, M.-T.; Ooi, M.C.G.; Lin, N.-H.; Fu, J.S.; Lee, C.-T.; Wang, S.-H.; Yen, M.-C.; Kong, S.S.-K.; Huang, W.-S. Study on the Impact of Three Asian Industrial Regions on PM2.5 in Taiwan and the Process Analysis during Transport. Atmos. Chem. Phys. 2020, 20, 14947–14967. [Google Scholar] [CrossRef]
  30. Xie, D.; Gou, Z.; Gui, X. How Electric Vehicles Benefit Urban Air Quality Improvement: A Study in Wuhan. Sci. Total Environ. 2024, 906, 167584. [Google Scholar] [CrossRef]
  31. Cheng, Z.; Li, X.; Zhang, Q. Can New-Type Urbanization Promote the Green Intensive Use of Land? J. Environ. Manag. 2023, 342, 118150. [Google Scholar] [CrossRef] [PubMed]
  32. Fan, J.; Wang, J.; Qiu, J.; Li, N. Stage Effects of Energy Consumption and Carbon Emissions in the Process of Urbanization: Evidence from 30 Provinces in China. Energy 2023, 276, 127655. [Google Scholar] [CrossRef]
  33. Rabito, F.A.; Werthmann, D.W.; Straubing, R.; Adamkiewicz, G.; Reponen, T.; Ashley, P.J.; Chew, G.L. A Multi-City Study of Indoor Air Quality in Green vs. Non-Green Low-Income Housing. Environ. Res. 2024, 240, 117576. [Google Scholar] [CrossRef]
  34. Choy, L.H.T.; Lai, Y.; Lok, W. Economic Performance of Industrial Development on Collective Land in the Urbanization Process in China: Empirical Evidence from Shenzhen. Habitat Int. 2013, 40, 184–193. [Google Scholar] [CrossRef]
  35. Wu, Y.; Zhang, X.; Shen, L. The Impact of Urbanization Policy on Land Use Change: A Scenario Analysis. Cities 2011, 28, 147–159. [Google Scholar] [CrossRef]
  36. Liu, X.; Wang, Y.; Li, Y.; Liu, F.; Shen, J.; Wang, J.; Xiao, R.; Wu, J. Changes in Arable Land in Response to Township Urbanization in a Chinese Low Hilly Region: Scale Effects and Spatial Interactions. Appl. Geogr. 2017, 88, 24–37. [Google Scholar] [CrossRef]
  37. Li, W.; Wang, D.; Li, H.; Wang, J.; Zhu, Y.; Yang, Y. Quantifying the Spatial Arrangement of Underutilized Land in a Rapidly Urbanized Rust Belt City: The Case of Changchun City. Land Use Policy 2019, 83, 113–123. [Google Scholar] [CrossRef]
  38. Zhang, J.; Zhang, D.; Huang, L.; Wen, H.; Zhao, G.; Zhan, D. Spatial Distribution and Influential Factors of Industrial Land Productivity in China’s Rapid Urbanization. J. Clean. Prod. 2019, 234, 1287–1295. [Google Scholar] [CrossRef]
  39. Zhu, F.; Zhang, F.; Ke, X. Rural Industrial Restructuring in China’s Metropolitan Suburbs: Evidence from the Land Use Transition of Rural Enterprises in Suburban Beijing. Land Use Policy 2018, 74, 121–129. [Google Scholar] [CrossRef]
  40. Li, Q.; Wang, Y.; Chen, W.; Li, M.; Fang, X. Does Improvement of Industrial Land Use Efficiency Reduce PM2.5 Pollution? Evidence from a Spatiotemporal Analysis of China. Ecol. Indic. 2021, 132, 108333. [Google Scholar] [CrossRef]
  41. Yang, D.; Meng, F.; Liu, Y.; Dong, G.; Lu, D. Scale Effects and Regional Disparities of Land Use in Influencing PM2.5 Concentrations: A Case Study in the Zhengzhou Metropolitan Area, China. Land 2022, 11, 1538. [Google Scholar] [CrossRef]
  42. Qi, X.; Chen, J.; Wang, J.; Liu, H.; Ding, B. The Impact of Urbanization on the Alleviation of Energy Poverty: Evidence from China. Cities 2024, 151, 105130. [Google Scholar] [CrossRef]
  43. Zhang, H. How Does Agglomeration Promote the Product Innovation of Chinese Firms? China Econ. Rev. 2015, 35, 105–120. [Google Scholar] [CrossRef]
  44. Brunt, L.; García-Peñalosa, C. Urbanisation and the Onset of Modern Economic Growth. Econ. J. 2022, 132, 512–545. [Google Scholar] [CrossRef]
  45. Liu, X.; Zhang, X. Industrial Agglomeration, Technological Innovation and Carbon Productivity: Evidence from China. Resour. Conserv. Recycl. 2021, 166, 105330. [Google Scholar] [CrossRef]
  46. Ouyang, X.; Li, Q.; Du, K. How Does Environmental Regulation Promote Technological Innovations in the Industrial Sector? Evidence from Chinese Provincial Panel Data. Energy Policy 2020, 139, 111310. [Google Scholar] [CrossRef]
  47. Chen, J.; Wang, S.; Zhou, C.; Li, M. Does the Path of Technological Progress Matter in Mitigating China’s PM2.5 Concentrations? Evidence from Three Urban Agglomerations in China. Environ. Pollut. 2019, 254, 113012. [Google Scholar] [CrossRef] [PubMed]
  48. Wang, H.; Wang, M. Effects of Technological Innovation on Energy Efficiency in China: Evidence from Dynamic Panel of 284 Cities. Sci. Total Environ. 2020, 709, 136172. [Google Scholar] [CrossRef]
  49. Miao, Z.; Baležentis, T.; Shao, S.; Chang, D. Energy Use, Industrial Soot and Vehicle Exhaust Pollution—China’s Regional Air Pollution Recognition, Performance Decomposition and Governance. Energy Econ. 2019, 83, 501–514. [Google Scholar] [CrossRef]
  50. Shen, Y.; Zhang, X. Intelligent Manufacturing, Green Technological Innovation and Environmental Pollution. J. Innov. Knowl. 2023, 8, 100384. [Google Scholar] [CrossRef]
  51. Card, D.; Krueger, A.B. Minimum Wages and Employment: A Case Study of the Fast-Food Industry in New Jersey and Pennsylvania: Reply. Am. Econ. Rev. 2000, 90, 1397–1420. [Google Scholar] [CrossRef]
  52. Baker, A.C.; Larcker, D.F.; Wang, C.C.Y. How Much Should We Trust Staggered Difference-in-Differences Estimates? J. Financ. Econ. 2022, 144, 370–395. [Google Scholar] [CrossRef]
  53. Callaway, B.; Sant’Anna, P.H.C. Difference-in-Differences with Multiple Time Periods. J. Econom. 2021, 225, 200–230. [Google Scholar] [CrossRef]
  54. Baron, R.M.; Kenny, D.A. The Moderator–Mediator Variable Distinction in Social Psychological Research: Conceptual, Strategic, and Statistical Considerations. J. Pers. Soc. Psychol. 1986, 51, 1173–1182. [Google Scholar] [CrossRef]
  55. Van Donkelaar, A.; Hammer, M.S.; Bindle, L.; Brauer, M.; Brook, J.R.; Garay, M.J.; Hsu, N.C.; Kalashnikova, O.V.; Kahn, R.A.; Lee, C.; et al. Monthly Global Estimates of Fine Particulate Matter and Their Uncertainty. Environ. Sci. Technol. 2021, 55, 15287–15300. [Google Scholar] [CrossRef]
  56. Shen, S.; Li, C.; Van Donkelaar, A.; Jacobs, N.; Wang, C.; Martin, R.V. Enhancing Global Estimation of Fine Particulate Matter Concentrations by Including Geophysical a Priori Information in Deep Learning. ACS EST Air 2024, 1, 332–345. [Google Scholar] [CrossRef] [PubMed]
  57. Zhong, S.; Zhou, Z.; Zhang, X.; Jin, D. Green Fiscal Interventions and Air Quality Improvement: Empirical Insights on PM2.5 Reduction from Chinese Counties. Clean Technol. Environ. Policy 2025. [Google Scholar] [CrossRef]
  58. Han, D.; Attipoe, S.G.; Han, D.; Cao, J. Does Transportation Infrastructure Construction Promote Population Agglomeration? Evidence from 1838 Chinese County-Level Administrative Units. Cities 2023, 140, 104409. [Google Scholar] [CrossRef]
  59. Tian, Z.; Hu, A.; Yang, Z.; Lin, Y. Highway Networks and Regional Poverty: Evidence from Chinese Counties. Struct. Change Econ. Dyn. 2024, 69, 224–231. [Google Scholar] [CrossRef]
  60. Qin, Q.; Guo, H.; Shi, X.; Chen, K. Rural E-commerce and County Economic Development in China. China World Econ. 2023, 31, 26–60. [Google Scholar] [CrossRef]
  61. Chen, M.; Liu, X.; Xiong, X.; Wu, J. Has the Opening of High-Speed Rail Narrowed the Inter-County Economic Gap? The Perspective of China’s State-Designated Poor Counties. Int. Rev. Econ. Financ. 2023, 88, 1–13. [Google Scholar] [CrossRef]
  62. Rambachan, A.; Roth, J. A More Credible Approach to Parallel Trends. Rev. Econom. Stud. 2023, 90, 2555–2591. [Google Scholar] [CrossRef]
  63. What’s Trending in Difference-in-Differences? A Synthesis of the Recent Econometrics Literature. J. Econom. 2023, 235, 2218–2244. [CrossRef]
  64. He, G.; Pan, Y.; Tanaka, T. The Short-Term Impacts of COVID-19 Lockdown on Urban Air Pollution in China. Nat. Sustain. 2020, 3, 1005–1011. [Google Scholar] [CrossRef]
  65. Lyu, C.; Xie, Z.; Li, Z. Market Supervision, Innovation Offsets and Energy Efficiency: Evidence from Environmental Pollution Liability Insurance in China. Energy Policy 2022, 171, 113267. [Google Scholar] [CrossRef]
  66. Heckman, J.J.; Ichimura, H.; Todd, P. Matching as an Econometric Evaluation Estimator. Rev. Econom. Stud. 1998, 65, 261–294. [Google Scholar] [CrossRef]
  67. Autor, D.H. Outsourcing at Will: The Contribution of Unjust Dismissal Doctrine to the Growth of Employment Outsourcing. SSRN Electron J. 2001. [Google Scholar] [CrossRef]
  68. Bertrand, M.; Duflo, E.; Mullainathan, S. How Much Should We Trust Differences-in-Differences Estimates? SSRN Electron. J. 2001. [Google Scholar] [CrossRef]
  69. Galiani, S.; Gertler, P.; Schargrodsky, E. Water for Life: The Impact of the Privatization of Water Services on Child Mortality. J. Polit. Econ. 2005, 113, 83–120. [Google Scholar] [CrossRef]
  70. Lyu, Y.; Xiao, X.; Zhang, J. Does the Digital Economy Enhance Green Total Factor Productivity in China? The Evidence from a National Big Data Comprehensive Pilot Zone. Struct. Change Econ. Dyn. 2024, 69, 183–196. [Google Scholar] [CrossRef]
  71. La Ferrara, E.; Chong, A.; Duryea, S. Soap Operas and Fertility: Evidence from Brazil. Am. Econ. J. Appl. Econ. 2012, 4, 1–31. [Google Scholar] [CrossRef]
  72. Chetty, R.; Looney, A.; Kroft, K. Salience and Taxation: Theory and Evidence. Am. Econ. Rev. 2009, 99, 1145–1177. [Google Scholar] [CrossRef]
  73. He, S.; Yu, S.; Li, G.; Zhang, J. Exploring the Influence of Urban Form on Land-Use Efficiency from a Spatiotemporal Heterogeneity Perspective: Evidence from 336 Chinese Cities. Land Use Policy 2020, 95, 104576. [Google Scholar] [CrossRef]
  74. Elliott, R.J.R.; Kuai, W.; Maddison, D.; Ozgen, C. Eco-Innovation and (Green) Employment: A Task-Based Approach to Measuring the Composition of Work in Firms. J. Environ. Econ. Manag. 2024, 127, 103015. [Google Scholar] [CrossRef]
  75. Li, J.; Li, F.; Li, J. Does New-Type Urbanization Help Reduce Haze Pollution Damage? Evidence from China’s County-Level Panel Data. Environ. Sci. Pollut. Res. 2022, 29, 47123–47136. [Google Scholar] [CrossRef] [PubMed]
  76. Crippa, M.; Janssens-Maenhout, G.; Dentener, F.; Guizzardi, D.; Sindelarova, K.; Muntean, M.; Van Dingenen, R.; Granier, C. Forty Years of Improvements in European Air Quality: Regional Policy-Industry Interactions with Global Impacts. Atmos. Chem. Phys. 2016, 16, 3825–3841. [Google Scholar] [CrossRef]
  77. Shapiro, J.S.; Walker, R. Why Is Pollution from US Manufacturing Declining? The Roles of Environmental Regulation, Productivity, and Trade. Am. Econ. Rev. 2018, 108, 3814–3854. [Google Scholar] [CrossRef]
  78. Niu, B.; Ge, D.; Yan, R.; Ma, Y.; Sun, D.; Lu, M.; Lu, Y. The Evolution of the Interactive Relationship between Urbanization and Land-Use Transition: A Case Study of the Yangtze River Delta. Land 2021, 10, 804. [Google Scholar] [CrossRef]
  79. Wen, H.; Wu, Y.; Zhou, Z.; Zhong, S. The Impact of Land Use Efficiency on County-Level PM2.5: Evidence from 1125 Counties in China. Sustainability 2025, 17, 2682. [Google Scholar] [CrossRef]
Figure 1. Geographical distribution of NTUP pilot regions (GS(2019)182).
Sustainability 17 07585 g001
Figure 2. Spatial distribution of PM2.5 concentrations (GS(2019)182).
Sustainability 17 07585 g002
Figure 3. Theoretical Framework.
Sustainability 17 07585 g003
Figure 4. Parallel trends test.
Sustainability 17 07585 g004
Figure 5. Parallel trends test after adjusting policy implementation timing.
Sustainability 17 07585 g005
Figure 6. Balance test.
Sustainability 17 07585 g006
Figure 7. Placebo test.
Sustainability 17 07585 g007
Figure 8. Distribution of city level (a) and industrial base (b) (GS(2019)182).
Sustainability 17 07585 g008
Figure 9. Distribution of industrial structure (GS(2019)182).
Sustainability 17 07585 g009
Table 1. Variable definitions.
VariableAbbreviationDefinitionData Source
Dependent VariablePM2.5PM2.5Average PM2.5 ConcentrationNASA GES DISC
Independent VariableNew-Type Urbanization PolicyNTUPWhether the City Implements the New-Type Urbanization PolicyList of National Comprehensive Pilot Regions for the New-Type Urbanization Policy
Control VariablesFiscal budget levelbudgetThe proportion of local general budget revenue and expenditure to regional GDPChina County Statistical Yearbook
Household savings levelsavThe proportion of urban and rural household savings deposits to regional GDP
Welfare provisionwelfareThe ratio of beds in social welfare and adoption institutions to the registered population
Educational attainmentstudentShare of secondary school students in total population
Healthcare capacityhosNumber of hospital beds per registered capita
Industrial development levelindNumber of above-scale industrial enterprises per registered capita
Industrial productivityivaIndustrial value added per registered capita (divided by 100)
Mechanism VariableLand use efficiencyLUECombined output of secondary and tertiary industries per unit of administrative land area
Invention patentsipNumber of invention patentsChina National Intellectual Property Administration
Green patentsgpNumber of green patents
Table 2. Descriptive statistics.
VariableNMeanSDMinMax
PM2.513,08245.7219.351.273139.3
NTUP13,1480.04900.21601
budget13,1480.3160.2500.04503.099
sav13,1480.6520.3190.005003.142
welfare13,1480.2660.25404.776
student13,1480.5150.1590.02202.036
hos13,1480.3110.1800.006003.248
ind13,1480.02500.032000.345
iva13,148135.0225.7−9.2243682
Table 3. Results of the multicollinearity test.
VariableNTUPBudgetSavWelfareStudentHosIndIvaMean VIF
VIF1.0901.2401.2601.2501.0701.3401.6101.8201.330
1/VIF0.9200.8090.7920.8010.9330.7470.6220.551
Table 4. Baseline regression results.
(1)(2)(3)(4)(5)(6)(7)(8)
PM2.5PM2.5PM2.5PM2.5PM2.5PM2.5PM2.5PM2.5
NTUP−1.317 ***−1.265 ***−1.254 ***−1.246 ***−1.218 ***−1.189 ***−1.227 ***−1.188 ***
(−6.508)(−6.271)(−6.228)(−6.199)(−6.013)(−5.873)(−6.074)(−5.868)
budget 1.917 ***1.749 ***1.745 ***1.709 ***1.646 ***1.690 ***1.527 ***
(5.529)(4.615)(4.605)(4.486)(4.374)(4.478)(4.087)
sav 0.3540.3480.3700.3830.536 *0.309
(1.148)(1.127)(1.196)(1.243)(1.736)(0.985)
welfare −0.187−0.187−0.145−0.109−0.030
(−0.736)(−0.737)(−0.576)(−0.435)(−0.119)
student 0.5480.749 *0.814 *0.863 *
(1.216)(1.648)(1.789)(1.900)
hos −2.129 ***−2.184 ***−2.089 ***
(−3.477)(−3.552)(−3.423)
ind 22.517 ***24.004 ***
(5.854)(6.280)
iva −0.001 ***
(−3.855)
_cons45.741 ***45.132 ***44.954 ***45.009 ***44.723 ***45.281 ***44.589 ***44.873 ***
CountyYESYESYESYESYESYESYESYES
YearYESYESYESYESYESYESYESYES
N12,99012,99012,99012,99012,99012,99012,99012,990
R20.9660.9660.9660.9660.9660.9660.9670.967
Standard errors in parentheses. * p < 0.1; *** p < 0.01.
Table 5. Robustness test 1.
(1)(2)(3)(4)(5)
PM2.5MINPM2.5MAXPM2.5PM2.5PM2.5
NTUP−1.053 ***−1.116 ***−1.257 ***−1.257 ***
(−5.660)(−4.746)(−3.783)(−6.358)
L.NTUP −0.965 ***
(−4.213)
budget1.761 ***1.878 ***2.045 ***2.045 ***2.251 ***
(4.253)(3.094)(3.507)(4.374)(3.752)
sav0.1940.3480.1340.1340.094
(0.595)(0.804)(0.283)(0.405)(0.205)
welfare−0.593 **−0.241−0.403−0.4030.430
(−2.121)(−0.636)(−1.034)(−1.391)(1.118)
student1.073 ***0.7821.228 **1.228 ***0.786
(2.634)(1.358)(2.155)(2.832)(1.341)
hos−3.012 ***−3.396 ***−2.743 ***−2.743 ***−3.138 ***
(−5.411)(−3.645)(−3.147)(−4.202)(−3.585)
ind18.988 ***34.213 ***25.433 ***25.433 ***23.957 ***
(4.730)(5.908)(4.419)(5.705)(4.085)
iva−0.003 ***−0.002 *−0.002 **−0.002 ***−0.003 ***
(−4.624)(−1.956)(−2.097)(−3.540)(−3.647)
_cons38.001 ***52.965 ***44.948 ***44.948 ***44.346 ***
(103.047)(96.151)(84.488)(112.984)(85.852)
CountyYESYESYESYESYES
YearYESYESYESYESYES
N12,99012,99012,99012,9907801
R20.9700.9610.9700.9700.971
Standard errors in parentheses. * p < 0.1, ** p < 0.05, *** p < 0.01.
Table 6. Robustness test 2.
(1) (2) (3) (4) (5)
PM2.5 PM2.5
(NIC)
PM2.5
(Smart)
PM2.5
(BBC)
PM2.5
NTUP−1.055 ***−1.303 ***−1.224 ***−0.966 ***−1.050 ***
(−5.073)(−5.547)(−5.089)(−3.767)(−5.154)
budget1.856 ***1.673 ***1.125 ***1.288 ***1.601 ***
(4.820)(4.449)(2.716)(3.116)(3.253)
sav0.2030.019−0.656 *−0.1430.127
(0.598)(0.060)(−1.851)(−0.402)(0.382)
welfare0.3220.196−0.627 **0.499 *−0.113
(1.252)(0.748)(−2.017)(1.740)(−0.372)
student0.6740.3981.448 ***0.3170.481
(1.428)(0.838)(2.696)(0.581)(0.927)
hos−1.731 ***−1.598 ***−1.022−2.901 ***−2.073 ***
(−2.699)(−2.595)(−1.572)(−3.674)(−3.299)
ind23.590 ***24.641 ***18.291 ***12.598 ***22.255 ***
(6.552)(5.476)(4.065)(2.578)(5.911)
iva−0.001 ***−0.001 **−0.002 ***−0.001−0.001 ***
(−3.528)(−2.564)(−3.597)(−1.038)(−3.601)
_cons45.717 ***44.226 ***44.084 ***44.918 ***45.245 ***
(116.327)(112.223)(102.662)(99.577)(113.048)
CountyYESYESYESYESYES
YearYESYESYESYESYES
N12,28511,6048629922012,571
R20.9670.9680.9690.9680.967
Standard errors in parentheses. * p < 0.1, ** p < 0.05, *** p < 0.01.
Table 7. Mechanism test: Land use efficiency and innovation efficiency.
(1)(2)(3)(4)(5)(6)
LUEPM2.5gpPM2.5ipPM2.5
NTUP10.361 ***−0.746 ***54.597 ***−0.673 ***2.996 ***−0.827 ***
(13.210)(−3.625)(9.581)(−3.331)(5.810)(−4.112)
LUE −0.043 ***
(−7.964)
gp −0.007 ***
(−10.085)
ip −0.073 ***
(−10.851)
budget−0.8721.484 ***6.5301.648 ***−0.991 **1.530 ***
(−1.378)(4.025)(1.378)(3.357)(−2.499)(3.133)
sav−7.189 ***0.012−20.086 ***−0.009−0.5500.088
(−7.404)(0.039)(−3.539)(−0.028)(−1.140)(0.266)
welfare4.434 ***0.16128.387 ***0.0802.700 ***0.082
(6.334)(0.652)(4.991)(0.265)(4.734)(0.272)
student2.2800.970 **7.7670.532−0.1250.470
(1.504)(2.137)(1.071)(1.032)(−0.184)(0.911)
hos5.448 ***−1.796 ***51.256 ***−1.723 ***2.188 ***−1.908 ***
(3.619)(−3.016)(6.138)(−2.759)(3.110)(−3.063)
ind−109.727 ***18.885 ***−958.851 ***15.709 ***−83.966 ***15.992 ***
(−5.330)(4.942)(−5.773)(4.441)(−5.419)(4.400)
iva0.026 ***−0.0000.081 ***−0.001 **0.008 ***−0.001 **
(7.561)(−0.977)(6.997)(−2.236)(6.107)(−2.135)
Sobel Z10.53 *** −6.882 *** −5.61 ***
Number of Bootstrap Replications1000 1000 1000
Ind_eff1.597 *** −0.293 *** −0.544 ***
(5.743) (−3.686) (−4.972)
_cons9.659 ***45.206 ***8.39745.301 ***2.807 ***45.452 ***
(6.574)(118.827)(0.991)(115.312)(3.184)(114.703)
CountyYESYESYESYESYESYES
YearYESYESYESYESYESYES
N13,01212,94612,63712,57112,63712,571
R20.9030.9670.5720.9670.7610.967
Standard errors in parentheses. ** p < 0.05, *** p < 0.01.
Table 8. Heterogeneity test: City level and industrial base.
(1)(2)(3)(4)(5)(6)
PM2.5
(HC)
PM2.5
(GC)
PM2.5
(CL ×NTUP)
PM2.5
(OIB)
PM2.5
(NOIB)
PM2.5
(IB ×NTUP)
NTUP−1.638−1.418 ***−0.755 ***−0.531−1.209 ***−0.986 ***
(−1.602)(−7.409)(−3.946)(−1.095)(−5.313)(−4.395)
budget5.742 **1.557 ***1.659 ***1.8431.484 ***1.521 ***
(2.540)(4.225)(3.367)(1.616)(3.780)(4.071)
sav5.449 ***−0.669 **0.0321.0640.2160.327
(4.316)(−2.190)(0.097)(1.158)(0.657)(1.041)
welfare1.420−0.083−0.1011.650 **−0.567 **−0.025
(1.514)(−0.324)(−0.333)(2.186)(−2.224)(−0.100)
student2.6780.3110.494−1.4801.257 **0.796 *
(1.528)(0.681)(0.954)(−1.362)(2.526)(1.748)
hos−9.674 ***−1.292 **−2.153 ***−3.206 *−2.039 ***−2.127 ***
(−4.879)(−2.174)(−3.427)(−1.732)(−3.202)(−3.471)
ind5.23023.748 ***21.912 ***1.54722.414 ***24.140 ***
(0.635)(5.714)(5.920)(0.122)(5.588)(6.308)
iva0.003 *−0.002 ***−0.001 ***−0.006 ***−0.001 ***−0.001 ***
(1.909)(−4.273)(−3.690)(−4.160)(−2.903)(−3.866)
CL ×NTUP −3.779 ***
(−3.475)
IB ×NTUP −0.929 **
(−2.399)
_cons45.929 ***44.993 ***45.316 ***56.212 ***41.896 ***44.906 ***
(31.358)(118.479)(113.893)(51.915)(102.263)(117.286)
CountyYESYESYESYESYESYES
YearYESYESYESYESYESYES
N148811,50212,990295510,03512,990
R20.9610.9690.9670.9650.9650.967
Standard errors in parentheses. * p < 0.1, ** p < 0.05, *** p < 0.01.
Table 9. Heterogeneity test: Industrial structure.
(5) (6) (7)
PM2.5
(AD)
PM2.5
(ID)
PM2.5
(SID)
NTUP−0.181−0.122−0.694 *
(−0.209)(−0.583)(−1.867)
budget3.244 ***3.066 ***0.303
(2.899)(6.583)(1.451)
sav−2.883 ***−5.029 ***−1.926 ***
(−4.091)(−10.187)(−6.387)
welfare2.164 ***2.257 ***1.086 ***
(3.013)(7.329)(3.317)
student−0.619−0.853 *−1.817 ***
(−0.525)(−1.770)(−3.068)
hos−3.354 **−3.844 ***−2.092 ***
(−2.488)(−6.438)(−4.370)
ind−0.0370.377 ***0.601 ***
(−0.150)(3.836)(10.439)
iva−0.007−0.0000.001
(−1.175)(−0.750)(0.567)
_cons40.051 ***51.152 ***39.217 ***
(45.210)(112.382)(79.518)
CountyYESYESYES
YearYESYESYES
N265816,78210,594
R20.9710.9540.945
Standard errors in parentheses. * p < 0.1, ** p < 0.05, *** p < 0.01.
Disclaimer/Publisher’s Note: The statements, opinions and data contained in all publications are solely those of the individual author(s) and contributor(s) and not of MDPI and/or the editor(s). MDPI and/or the editor(s) disclaim responsibility for any injury to people or property resulting from any ideas, methods, instructions or products referred to in the content.