Article

Evaluating the Performance of Multiple Precipitation Datasets over the Transboundary Ili River Basin Between China and Kazakhstan

1
School of Information Technology and Engineering, Kazakh-British Technical University, Almaty 050000, Kazakhstan
2
Department of Water Resources and Melioration, Kazakh National Agrarian Research University, Almaty 050010, Kazakhstan
3
Natural Resource Ecology Laboratory (NREL), Colorado State University, Fort Collins, CO 80523, USA
4
U.S. Geological Survey (USGS) Earth Resources Observation and Science Center, Fort Collins Science Center, Fort Collins, CO 80526, USA
5
USGS North Central Climate Adaptation Science Center, Fort Collins, CO 80528, USA
6
State Key Laboratory of Soil and Water Conservation Science and Engineering, Northwest A&F University, Yangling 712100, China
7
Key Laboratory of Western China’s Environmental Systems (Ministry of Education), College of Earth and Environmental Sciences, Lanzhou University, Lanzhou 730000, China
*
Author to whom correspondence should be addressed.
Sustainability 2025, 17(16), 7418; https://doi.org/10.3390/su17167418 (registering DOI)
Submission received: 25 June 2025 / Revised: 12 August 2025 / Accepted: 14 August 2025 / Published: 16 August 2025

Abstract

The Ili River Basin is characterized by complex topography and diverse climatic zones with limited in situ observations. This study evaluates the performance of six widely used precipitation datasets, CHIRPS (Climate Hazards Group InfraRed Precipitation with Station data), ERA5_Land (European Centre for Medium-Range Weather Forecasts—ECMWF Reanalysis 5_Land), GPCC (Global Precipitation Climatology Centre), IMERG (Integrated Multi-satellite Retrievals for GPM), PERSIANN (Precipitation Estimation from Remotely Sensed Information using Artificial Neural Networks), and TerraClimate, against ground-based data from 2001 to 2023. The evaluation is conducted across multiple spatial scales and temporal resolutions. At the basin scale, most datasets exhibit strong correlations with in situ observations across all temporal scales (r > 0.7), except for PERSIANN, which demonstrates a relatively weaker performance during summer and winter (r < 0.6). All datasets except ERA5_ Land show low annual and monthly bias (<5%), although larger errors are observed during summer, particularly for IMERG and PERSIANN. Dataset performance generally declines with increasing elevation. Basin-wide gridded evaluations reveal distinct spatial variations across all elevation zones, with CHIRPS showing the strongest ability to capture orographic precipitation gradients throughout the basin. All datasets correctly identified 2008 as a drought year and 2016 as a wet year, even though the magnitude and spatial resolution of the anomalies varied among them. These findings highlight the importance of selecting precipitation datasets that are suited to the complex topographic and climatic characteristics of transboundary basins. Our study provides valuable insights for improving hydrological modeling and can be used for water sustainability and flood–drought mitigation support activities in the Ili River Basin.

1. Introduction

Water sustainability is a critical issue related to national security and for planning development strategies regionally and nationally. The sustainability of water resources and water availability are complicated issues in Central Asia. Being located downstream of the most river basins of Central Asia, Kazakhstan depends greatly on neighboring countries for transboundary river basin water movements. Transboundary water movements are challenging for negotiations and regulations. One such river basin is the Ili River, an endorheic basin of Central Asia [1], and a primary water resource that has influenced regional development in the Ili region of China and the Almaty region of Kazakhstan. The Ili River Basin has issues with water conservation during the summer drought seasons as well as flood emergencies. The Ili River is fed by transmountain streams, is the largest tributary to Lake Balkhash, one of the largest lakes in Central Asia, and is characterized by complex topography and diverse climatic conditions that challenge the accuracy of conventional and satellite-based precipitation datasets. Given the scarcity and uneven spatial distribution of ground-based observations, the evaluation of multiple precipitation datasets can be helpful to support water sustainability as well as flood and drought mitigation activities for communities within the Ili River Basin. This study aims to systematically evaluate the accuracy and applicability of multiple gridded precipitation datasets over the Ili transboundary River Basin using a suite of statistical metrics (e.g., correlation, bias, normalized root mean square error) in comparison with ground-based observations. The results could provide insights into the relative strengths and limitations of each dataset, informing us of their suitability for regional-scale hydrological modeling, flood–drought monitoring and mitigation, and sustainable water use program development for communities within the Ili River Basin.
Accurate precipitation data are essential for effective water resource management, hydrological modeling, and climate change impact assessments, particularly in transboundary river basins where shared resources necessitate coordinated planning and monitoring [2]. CHIRPS (Climate Hazards Group InfraRed Precipitation with Station data) has demonstrated reasonable accuracy estimating precipitation in arid and semi-arid regions and is often used because of its long temporal coverage and consistency [3]. Studies have shown CHIRPS effectively captures seasonal and interannual precipitation variability in including Central Asia, although biases may occur in areas with complex terrain or sparse station data [4,5,6]. ERA5_Land (ECMWF Reanalysis 5) precipitation data are derived from model outputs constrained by observations, offering consistency and global coverage [7]. However, ERA5_Land has been shown to overestimate precipitation in arid regions and underestimate extreme rainfall events, due to its reliance on parameterized convective processes [8,9]. Due to its reliance on ground-based data, GPCC (Global Precipitation Climatology Centre) accurately estimates precipitation in areas with dense station networks but may lack accuracy in data-sparse or mountainous regions [10,11]. GPCC is commonly used as a benchmark in performance validation studies [12]. IMERG (Integrated Multi-satellite Retrievals for Global Precipitation Measurement) can be used for real-time monitoring and short-term hydrological modeling [13]. However, its accuracy can be limited by surface characteristics such as snow cover or orographic effects, especially in mountainous basins [14,15,16]. PERSIANN (Precipitation Estimation from Remotely Sensed Information using Artificial Neural Networks) by [17] can be used for near-real-time applications, but several studies have reported its tendency to underestimate high-intensity precipitation events and overestimate light rainfall, particularly in tropical and mountainous regions [18,19,20]. TerraClimate offers good spatial coverage and incorporates both station and model-derived data, but TerraClimate’s precipitation estimates may be less responsive to sub-monthly variability and often rely heavily on downscaling procedures, which can introduce biases in mountainous terrain [21,22]. Overall, these datasets show varying degrees of accuracy depending on regional topography, climate, and the density of observation networks. Comparative assessments suggest that combining multiple datasets or applying region-specific bias correction methods can substantially enhance the reliability of precipitation estimates for hydrological and climate applications [23,24].
Several studies have examined hydrological variability, water resource management, and climate impacts in the Lake Balkhash Basin and its sub-basins, particularly the Ili River Basin. For instance, Ref. [25] assessed hydroclimatic changes and their impacts on streamflow in the IRB, revealing clear shifts in precipitation and temperature patterns influencing seasonal runoff. Refs. [26,27,28] investigated water governance challenges, emphasizing the institutional and political complexities that affect transboundary water management in the broader Balkhash system. Ref. [29] provided critical insights into the role of snow and glacier melt in sustaining river discharge from the Tianshan Mountains’ headwaters, highlighting the sensitivity of the region’s water supply to cryospheric changes. More recently, Ref. [30] used remote sensing and model-based approaches to quantify water balance components across the transboundary basin, demonstrating spatial disparities in runoff contributions. Additionally, Ref. [31] focused on the verification and refinement of climate data in the Almaty region, supporting more reliable detection of climate change signals critical for regional water and environmental planning. Parallel to these hydrological assessments, several studies have addressed drought and flood monitoring to identify regional risks and support mitigation strategies. For example, Ref. [32] analyzed meteorological and hydrological drought regimes, while Ref. [33] examined flood hazards under climate-induced hydrological changes. Also, Ref. [34] examined the impacts of climate change on agricultural production and crop water requirements through modeling approaches and emphasized the importance of adopting agricultural adaptation measures in response to climate change. Using satellite-based indices, Ref. [35] demonstrated the utility of remote sensing in large-scale drought monitoring across the Lake Balkhash Basin. Ref. [36] investigated the response of Lake Balkhash water levels to drought events, and Ref. [37] introduced advanced flood vulnerability assessments in the IRB using novel statistical metrics. Moreover, Ref. [38] emphasized on the anthropogenic issues related to the flood issues importance of industry engagement in flood water management.
Recent developments in satellite remote sensing and reanalysis have yielded a suite of high-resolution global precipitation datasets, such as CHIRPS, ERA5_Land, GPCC, IMERG, PERSIANN-CDR, and TerraClimate, that are increasingly applied in climate and water studies [3,11,13]. When coupled with in situ observations, these developments can enhance hydrological modeling, mitigation planning for droughts and flooding occurrences and sustainable water management. However, their performance can vary significantly depending on seasonality, topography, and data-scarcity, particularly in complex environments such as the mountainous and semi-arid Ili River Basin. Therefore, evaluating the accuracy and applicability of multiple gridded precipitation datasets over the transboundary Ili River Basin, in comparison with ground-based observations, is crucial. The results will contribute to broader studies aimed at promoting hydrological modeling, hazard monitoring, and sustainable water management at the regional scale.

2. Study Area

The Ili River Basin (hereafter referred to as “the Basin”) is a significant transboundary watershed shared between the southeastern region of Kazakhstan and the Xinjiang Uyghur Autonomous Region of China (Figure 1). The Ili river (1439 km) originates from the Kax, Künes, and Tekes Rivers in the eastern Tianshan Mountains (Figure 1). Covering a total area of approximately 140,000 km2 (with around 60% in Kazakhstan and 40% in China), the basin plays a critical role in supporting agricultural productivity, regional ecosystems, and water supply for millions of people across both countries. The river originates from the Tekes and Kunes rivers in the Tianshan Mountains of western China and flows northwestward into Kazakhstan, ultimately discharging into Lake Balkhash, which is one of Central Asia’s largest inland water bodies.
The basin exhibits a diverse range of topographic, climatic, and hydrological conditions. Elevation in the basin ranges from over 3000 m above sea level (m) in the mountainous eastern upstream regions to below 200 m in the lowland floodplains of the western basin (Figure 1). This elevation gradient result in substantial climatic variation from alpine and subalpine climates in the upper reaches to semi-arid and arid environments downstream with variations in isotopic composition of different water sources [39,40].
Land use/land cover (LULC) within the basin varies widely, with forested and alpine zones in the upstream areas, and extensive agricultural zones in the midstream and downstream areas, particularly grassland (Figure 1). Irrigation-intensive agriculture, supported in part by groundwater wells and surface water diversions, exerts considerable pressure on the region’s water resources, especially in China (Figure 1). Due to increasing water demand, climate variability, and transboundary water governance challenges, the IRB has become a focal point for hydrological and environmental research [41,42].
The Basin is characterized by a continental climate, featuring cold winters and hot summers. The seasonal and elevational precipitation gradients (Figure 1 and Figure 2) suggest that spring is the dominant wet season in the lowland and mid-altitude regions, while summer dominates in the upper mountainous areas (Figure 2). The contribution of snowmelt and glacier runoff from the Tianshan Mountains is especially significant during spring and early summer, driving seasonal peaks in river discharge [43,44]. The basin’s complex topography, steep climatic gradients, and spaced distribution of meteorological stations, particularly in remote high-elevation zones, pose substantial challenges for reliable precipitation monitoring. As such, the basin represents a critical testbed for evaluating the performance of satellite- and model-based precipitation datasets under diverse hydroclimatic and topographic conditions.
Figure 1. Study area showing the Ili River Basin between China and Kazakhstan. (a) Digital Elevation Model (DEM) from SRTM (~30 m resolution); (b) LULC classification from ESA WorldCover 2021 (10 m) by [45]; (c) average annual precipitation (2001–2020) interpolated from meteorological station data using Inverse Distance Weighting (IDW); (d) average annual actual evapotranspiration (ETa) for 2013–2023 derived from VIIRS-SSEBop ET data. Base map: Esri.
Sustainability 17 07418 g001
Figure 2. Annual, monthly, and seasonal (December–January–February, DJF; March–April–May, MAM; Jun–July–August, JJA; September–October–November, SON) precipitation from rain gauges across three elevation zones: low (0–800 m), mid (800–1600 m), and high (>1600 m) elevations. The number of stations in 0–800 m, 800–1600 m, and >1600 m elevation ranges is 15, 8, and 7, respectively.
Sustainability 17 07418 g002

3. Data and Methods

3.1. Data

We utilized monthly and annual precipitation data from approximately 30 meteorological stations spanning the period 2001–2023, comprising records from around 20 stations in Kazakhstan and 10 in China (Figure 1 and Figure 2). The data for Kazakhstan were obtained from the publicly accessible Kazhydromet platform (https://www.kazhydromet.kz/en/interactive_cards, accessed on 20 January 2025), while the Chinese station data were sourced from the China Meteorological Administration (CMA) website (http://data.cma.cn, accessed on 22 January 2025). These ground-based observations served as the reference dataset for evaluating the performance of various precipitation datasets.
In this study, we conducted a comprehensive evaluation of six precipitation datasets, including satellite-, reanalysis-, and gauge-based datasets: CHIRPS, ERA5_Land, GPCC, IMERG, PERSIANN, and TerraClimate. Detailed characteristics of these datasets are provided in Table 1. With the exception of GPCC, these datasets, available as point or gridded raster data, can be accessed through their respective web portals or platforms such as Google Earth Engine [46] and Climate Engine [47]. GPCC point data are available for download at https://opendata.dwd.de/climate_environment/GPCC/html/download_gate.html accessed on 5 December 2024). All analyses and visualizations were conducted using R [48] programming environments, complemented by QGIS [49] for geospatial mapping and analysis.

3.2. Methods

We employed statistical metrics such as Pearson’s correlation coefficient (r), percent bias (PBIAS), and normalized root mean square error (NRMSE) to assess the relationship between observed and estimated precipitation values.
Pearson’s Correlation Coefficient (r):
Pearson’s r measures the linear correlation between two variables, indicating the strength and direction of their relationship. It ranges from −1 (perfect negative correlation) to +1 (perfect positive correlation), with 0 indicating no linear correlation, which is calculated by an equation (Equation (1)).
r = i = 1 n O i O ¯ S i S ¯ i = 1 n O i O ¯ 2 × i = 1 n ( S i S ¯ ) 2
where O i is the observed precipitation value; S i is the estimated precipitation value; O ¯ is the mean of the observed values; S ¯ is the mean of the estimated values, and n is the number of observed or simulated values. Interpretation guidelines vary by field.
Percent Bias (PBIAS):
PBIAS evaluates the average tendency of model estimates to overestimate or underestimate observed values. It is calculated as follows (Equation (2)):
PBIAS = i = 1 n S i O i i = 1 n O i
where O i is the observed precipitation value, S i is the estimated precipitation value, and n is the number of observed or simulated values.
A percent bias (PBIAS) value close to 0% indicates minimal bias, meaning the model’s estimates align closely with observed values. Positive PBIAS values suggest a tendency for the model to underestimate observed data, while negative values indicate a propensity to overestimate observed data. Understanding PBIAS is crucial for assessing and improving model accuracy in representing observed phenomena.
Normalized Root Mean Square Error (NRMSE)
The normalized root mean square error (NRMSE) is calculated by dividing the root mean square error (RMSE) by the range of the observed values. A smaller NRMSE value indicates a better model fit.
Equation:
NRMSE = RMSE/(Max(observed) − Min(observed))
where NRMSE is the normalized root mean square error; RMSE is the root mean square error, calculated as the square root of the mean of the squared differences between predicted and actual values; Max(observed) is the maximum value in the observed data; Min(observed) is the minimum value in the observed data.
RMSE = 1 n i = 1 n ( S i O i ) 2
To analyze the spatial variability of precipitation across the study area, we applied Inverse Distance Weighting (IDW) interpolation using observed precipitation data from ground-based meteorological stations. IDW is a commonly used spatial interpolation method that estimates values at unsampled locations by weighing surrounding data points inversely to their distance. The interpolation was performed using QGIS, with the power parameter set to 2 and a fixed search radius to balance local detail and smoothness.
To evaluate the spatial performance of gridded precipitation datasets, we selected one dry year (2008) and one wet year (2016) for detailed anomaly analysis. Precipitation anomalies were computed for each gridded dataset by subtracting the long-term mean precipitation (2001–2023) from the annual total for each selected year. All anomaly calculations and map visualizations were performed using QGIS, enabling spatial overlay, raster calculations, and comparison of anomaly distributions.

4. Results and Discussion

4.1. Spatiotemporal Characteristics of Observed Precipitation
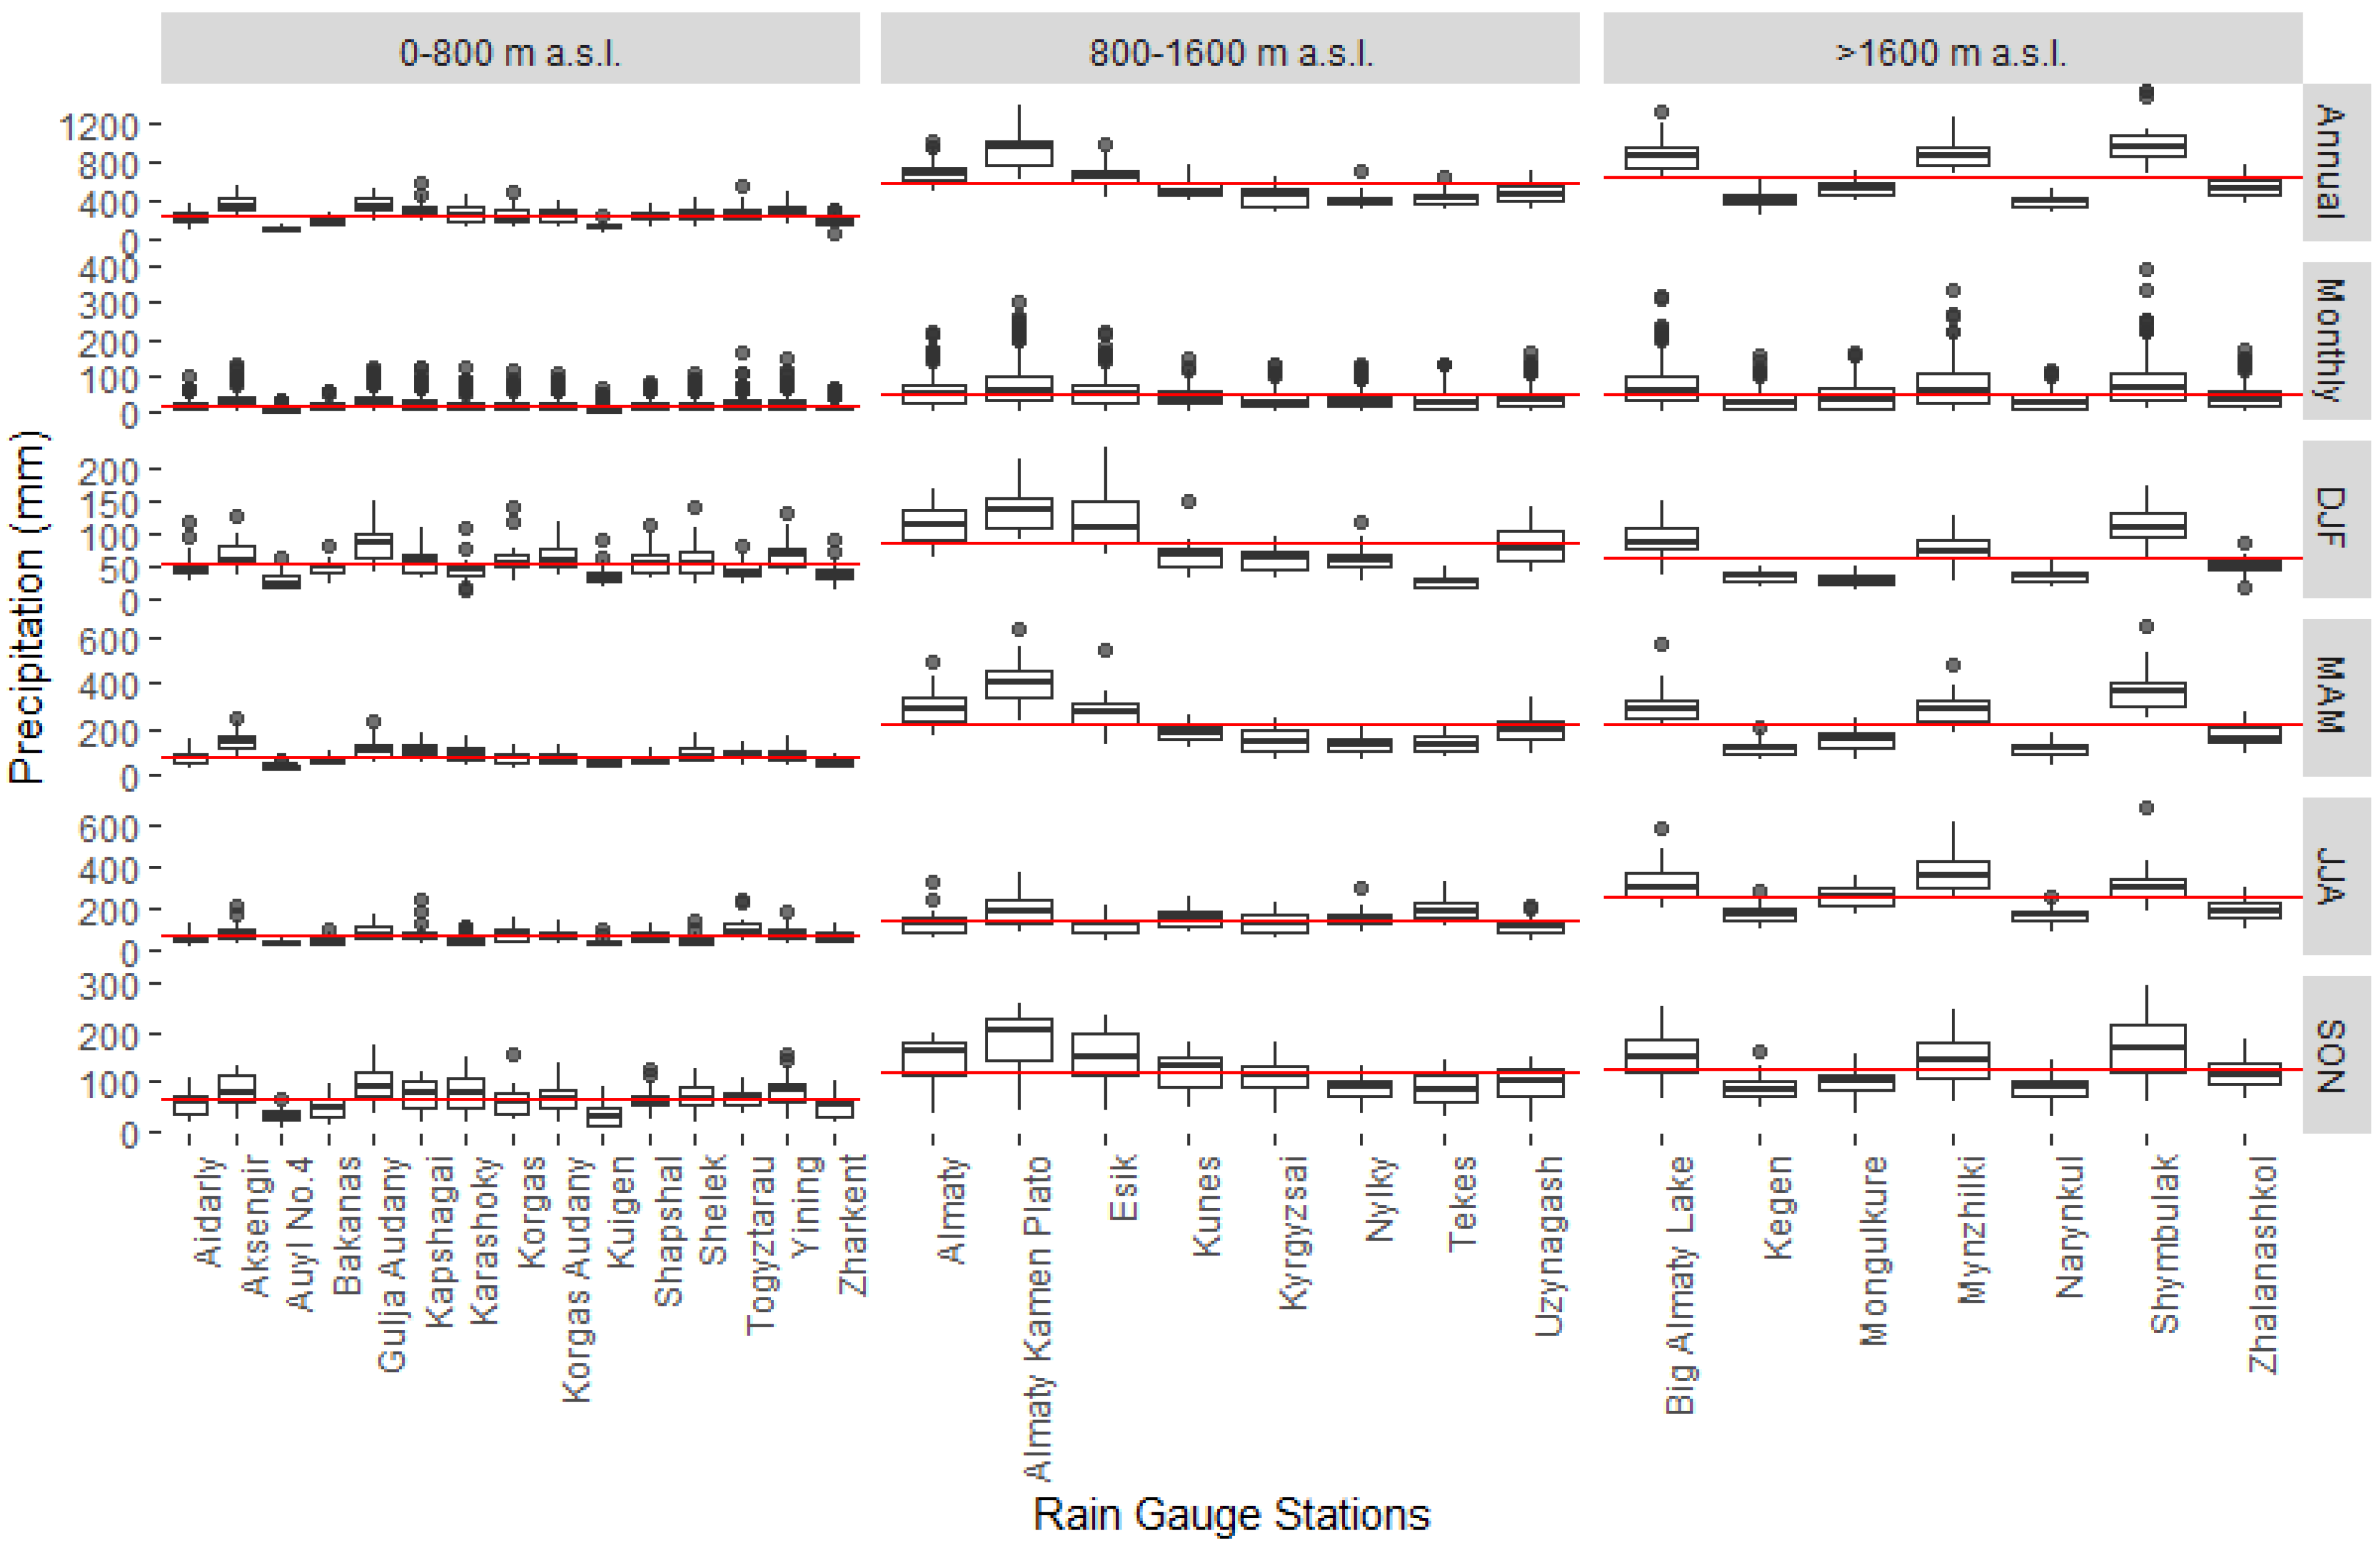
Precipitation is distributed unevenly across the basin, with annual totals exceeding 1000 mm in the mountainous regions and falling below 200 mm in the arid lowlands (Figure 1 and Figure 2). Based on aggregated data (Figure 2) from 30 rain gauges, the lowland zone (0–800 m) receives an average annual precipitation of 260 mm, with the highest seasonal precipitation occurring in spring (March–April–May, MAM, 80 mm) and the lowest in winter (December–January–February, DJF, 53 mm); summer (Jun–July–August, JJA) contributes 60 mm to the annual total. In the mid-elevation zone (800–1600 m), the average annual precipitation increases to 576 mm, peaking in spring (MAM, 220 mm) and reaching a minimum in winter (DJF, 83 mm); summer precipitation totals 143 mm. In contrast, the high-altitude zone (>1600 m) receives an average of 661 mm annually, with the highest precipitation in summer (JJA, 251 mm) and the lowest in winter (DJF, 60 mm).

4.2. Point-Based Evaluation

4.2.1. Long-Term Monthly Mean and Anomaly

The long-term analysis of monthly mean precipitation (Figure 3) reveals distinct seasonal patterns across both ground-based observations and satellite-derived datasets in the basin. Observational data indicate that precipitation peaks during the warm season, particularly from April to June, followed by a gradual decline from July to September, and winter months (December to February). All satellite and reanalysis datasets successfully capture this general seasonal cycle; however, notable discrepancies remain in terms of magnitude and timing. For instance, GPCC and CHIRPS exhibit strong agreement with in situ observations during the peak precipitation months, accurately representing both seasonal peaks and transitions. In contrast, ERA5_Land and PERSIANN systematically overestimate monthly precipitation during spring and early summer, but winter estimates align more closely with observed values.
These discrepancies can largely be attributed to the inherent differences in data acquisition methods, spatial resolutions, and underlying retrieval algorithms among the datasets. Reanalysis datasets such as ERA5_Land often rely on numerical weather prediction models, which may not fully resolve localized orographic influences and convective precipitation, particularly in data-scarce and topographically complex regions [2,11]. PERSIANN, being based on infrared satellite imagery, may misclassify cold cloud tops associated with non-precipitating systems (e.g., cirrus or shallow convection) as rainfall, especially during spring when cloudiness is high but actual precipitation may be low [18]. The biases are particularly pronounced at high elevations and during transitional seasons, underscoring the limitations of model-driven datasets in mountainous basins like the Ili River Basin.
The comparative analysis of monthly climatology not only highlights the relative strengths and weaknesses of each dataset but also demonstrates the importance of bias correction and multi-source data fusion to improve precipitation estimates [50,51]. This is especially critical in hydrologically sensitive regions where sparse rain-gauge coverage limits the reliability of single-source data.
The evaluation of long-term annual precipitation anomalies, referenced against the 2001–2023 climatological baseline, highlights pronounced interannual variability in observed precipitation across the basin (Figure 4). Most of the examined datasets successfully capture the temporal dynamics and relative magnitudes of these anomalies. This includes the accurate identification of 2008 as the driest year and 2016 as the wettest year across the basin. While PERSIANN markedly overestimates precipitation during the wet year (2016), it closely captures the magnitude of the dry year (2008). In contrast, ERA5_Land exhibits limited skill in representing the magnitude of both dry and wet years, indicating potential challenges in reproducing extreme precipitation variability in the region.
The ability of most datasets to replicate such hydrologically critical years demonstrates their applicability for a wide range of environmental and water management applications. Accurate anomaly detection is particularly vital for drought monitoring, agricultural planning, and the design of early warning systems in data-scarce, transboundary basins such as the Ili River Basin [11,52]. Among the datasets, GPCC and TerraClimate most accurately estimated the mean and range monthly precipitation patterns based on percent anomaly data (Figure 4). CHIRPS and IMERG accurately estimated the mean, but were less dynamic in the ranges of precipitation that they simulated. In contrast, ERA5_Land and PERSIANN tended to either overestimate or smooth the extremes, which may limit their effectiveness in capturing localized climatic shocks, particularly in mountainous or snow-influenced areas. Nevertheless, the observed differences in anomaly magnitude and spatial detail among datasets suggest that careful dataset selection and, where possible, bias correction remain essential for operational applications.

4.2.2. Basin Scale Performance

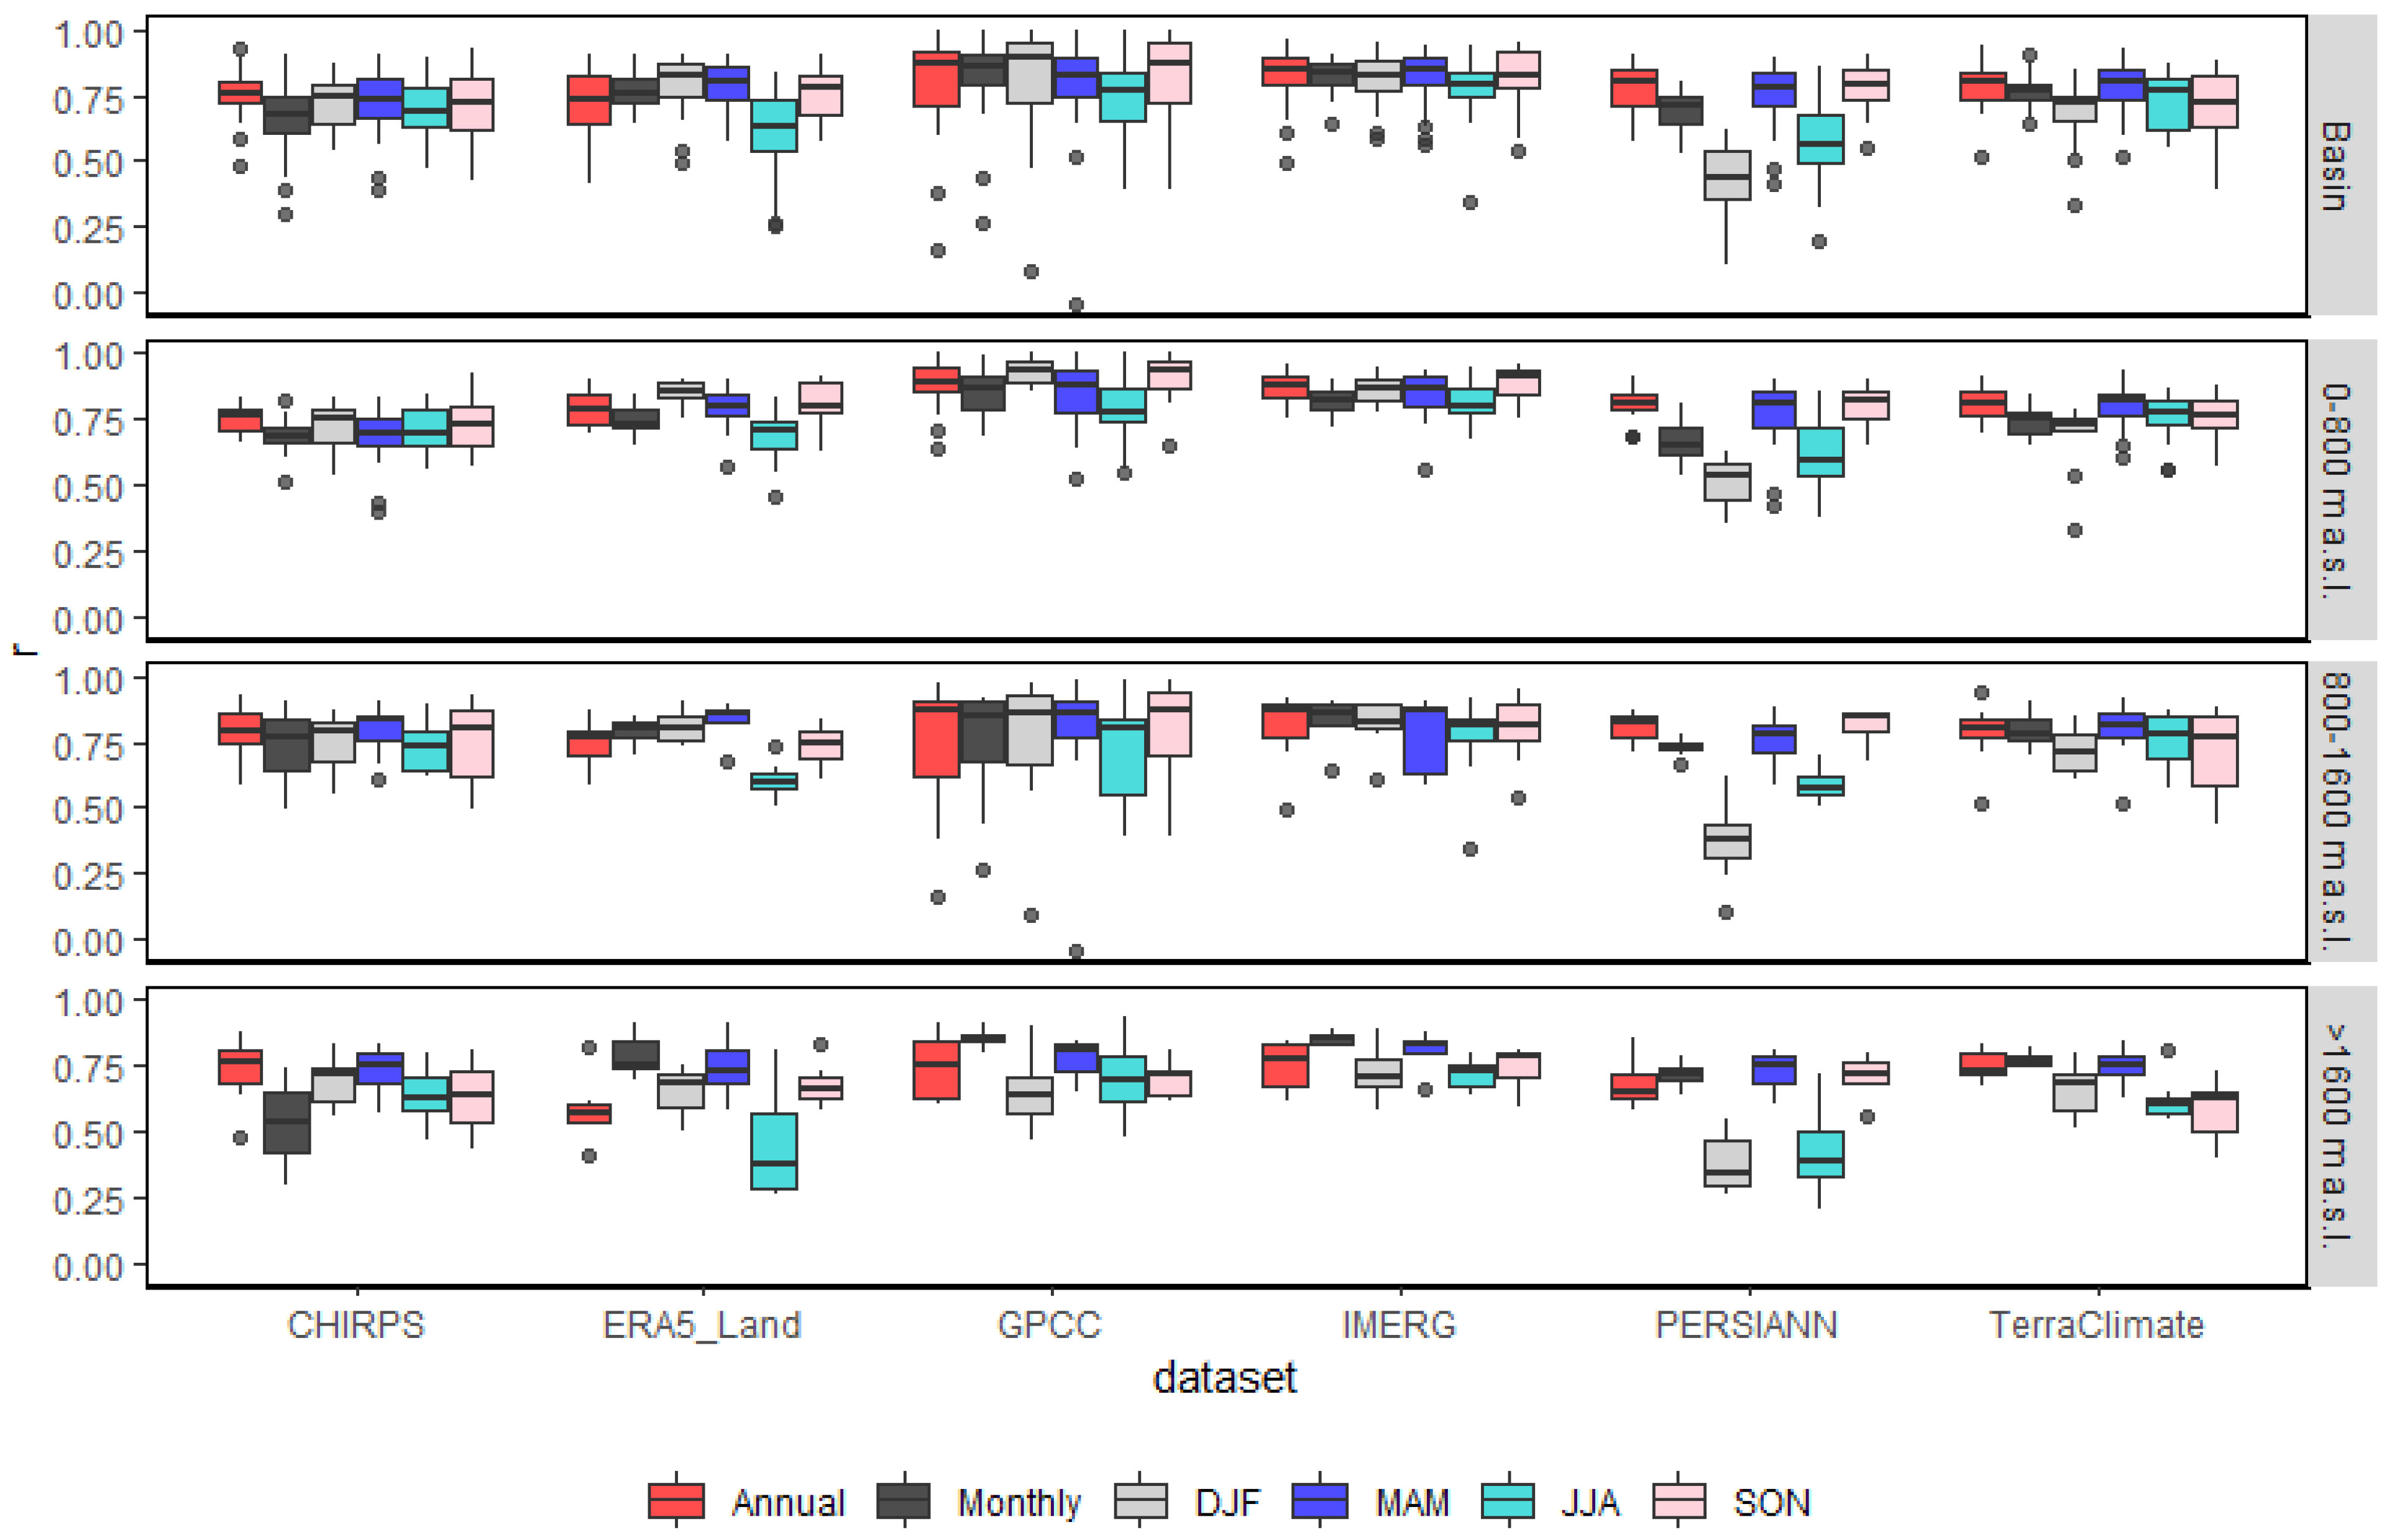
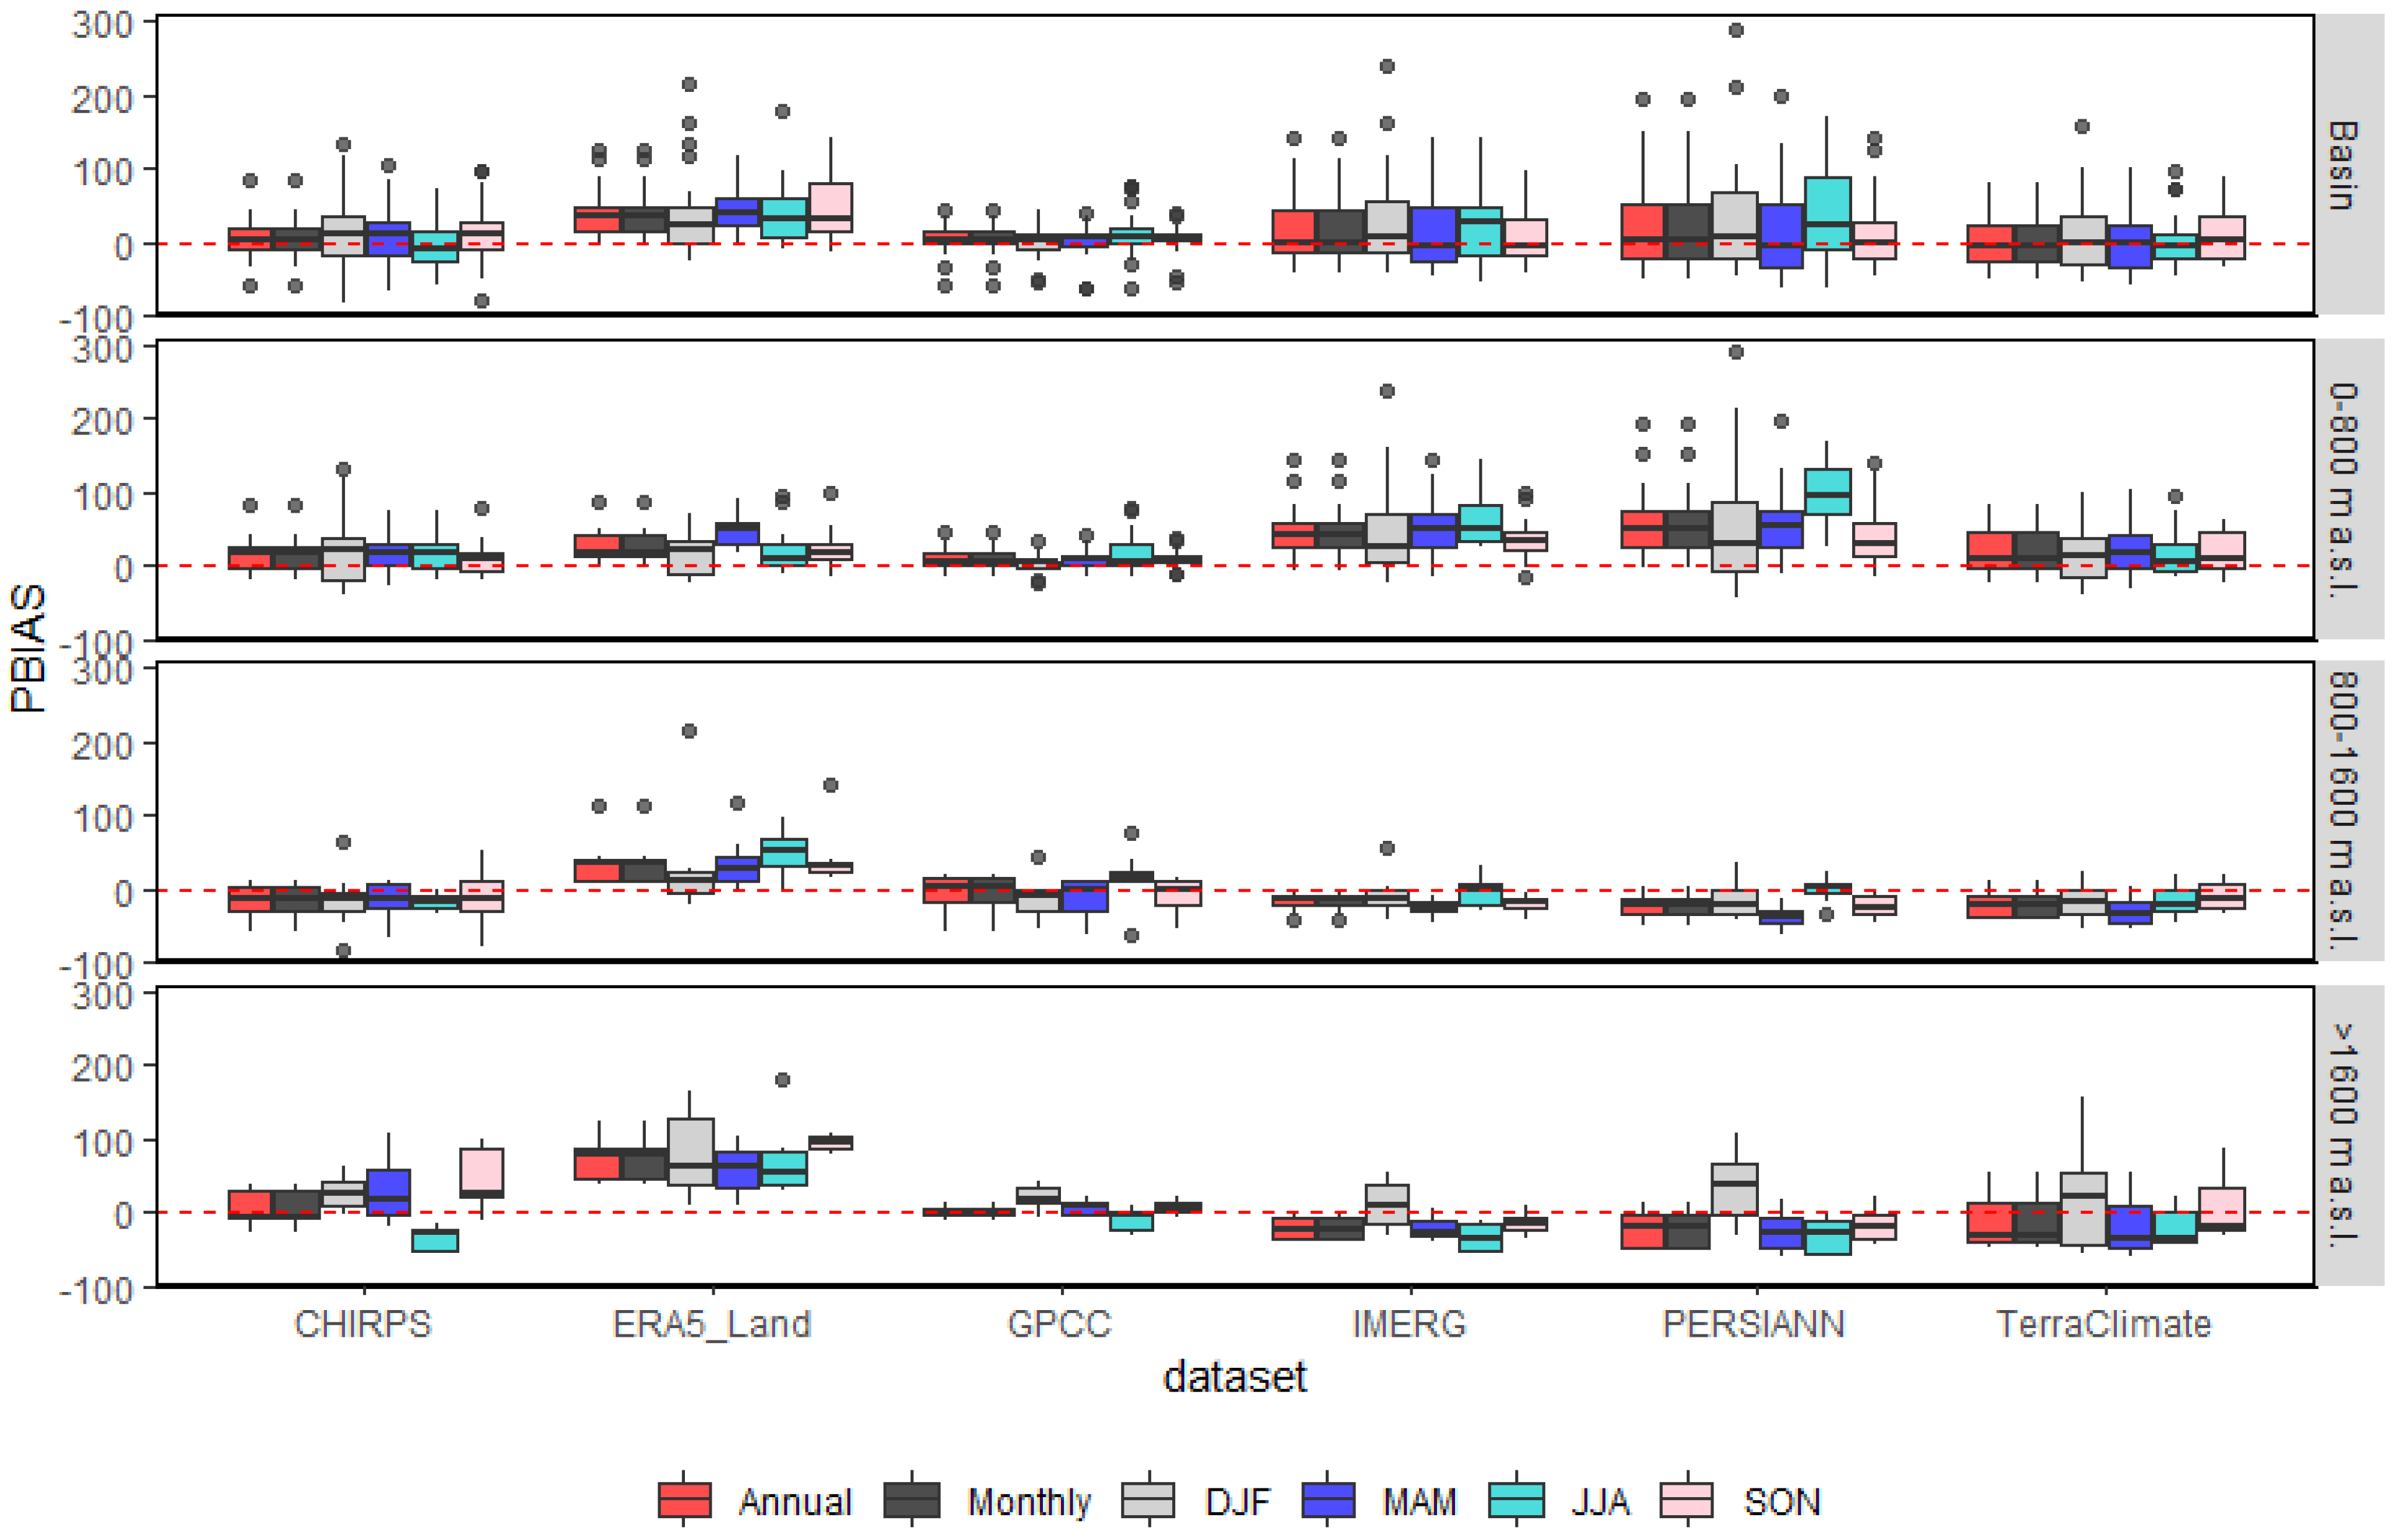
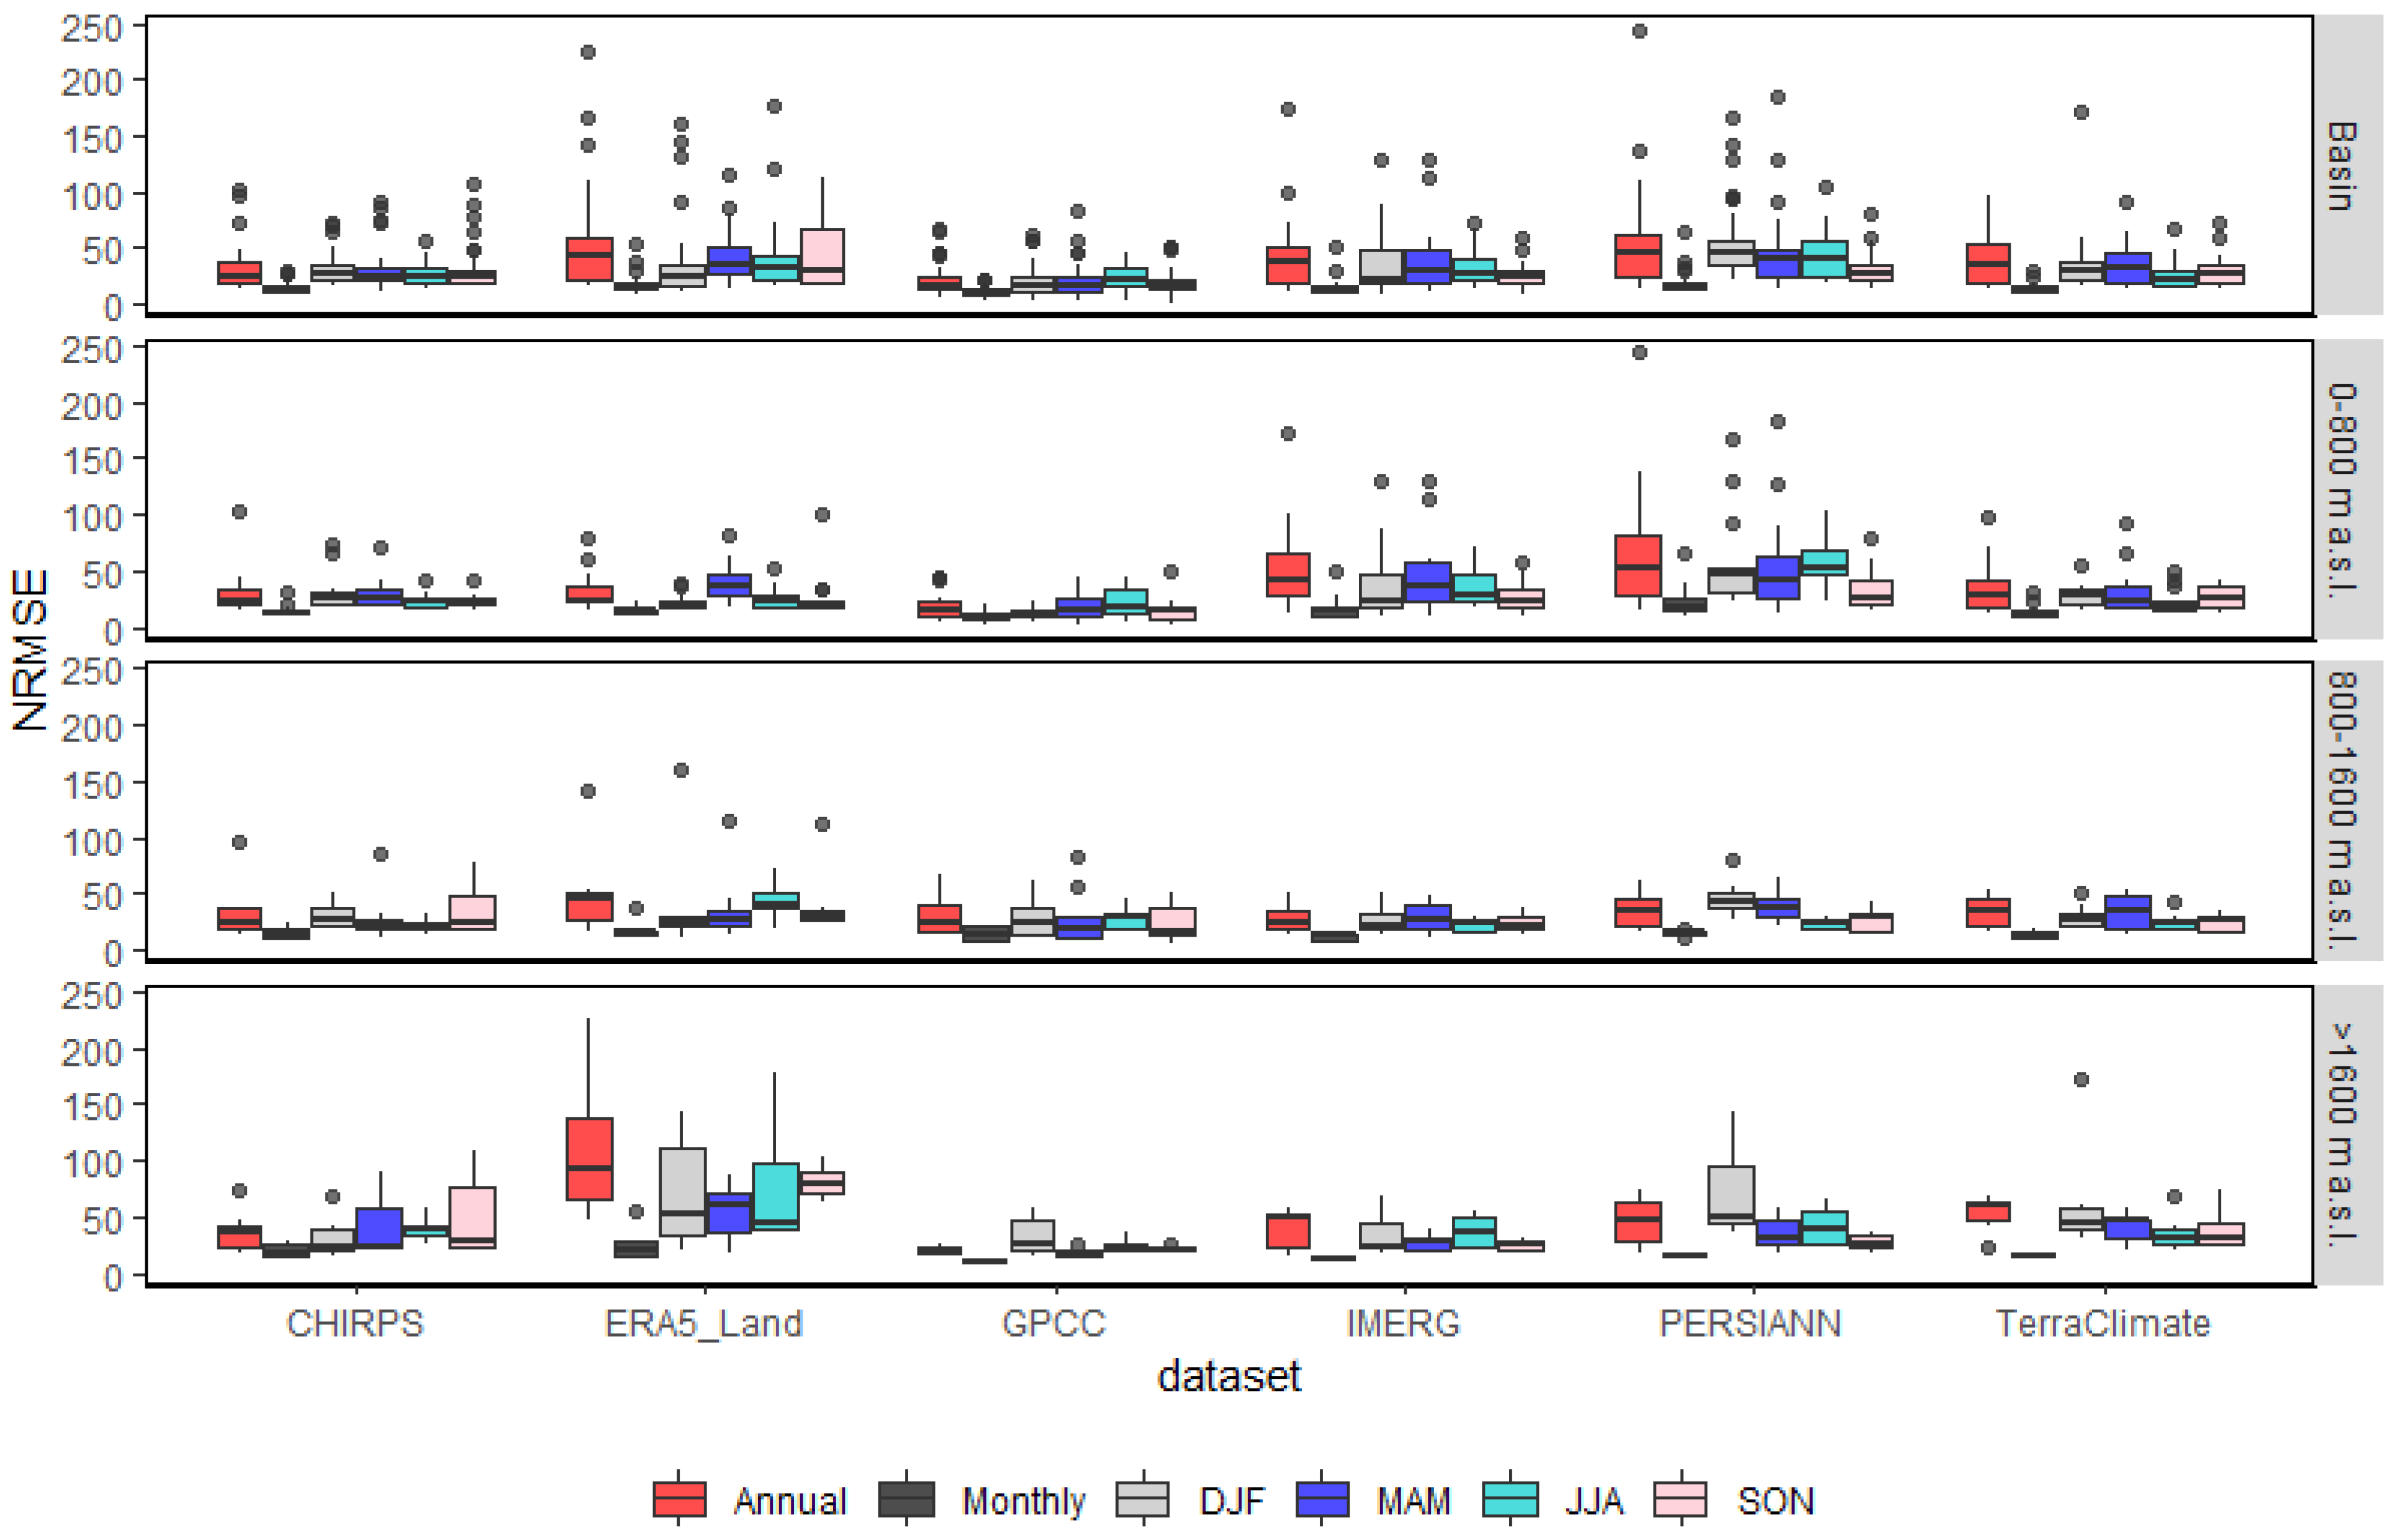
At the basin scale, most precipitation datasets demonstrate strong temporal agreement with station observations. Annual correlations exceed r > 0.74, and monthly correlations are similarly high, with r > 0.68 across all datasets (Table 2 and Figure 5). Notably, GPCC and IMERG show particularly high annual correlations (r > 0.80), underscoring their strong performance in capturing temporal precipitation variability. With the exception of ERA5_Land, all datasets show relatively low annual and monthly precipitation bias (PBIAS < ±5%) (Table 3 and Figure 6), indicating reasonable agreement with ground-based observations. CHIRPS exhibits the lowest annual and monthly biases (~1%), making it the most consistent with observations. In contrast, ERA5_Land shows a positive bias (~30%), a trend aligned with previous studies highlighting its tendency to overestimate orographic precipitation in mountainous regions [6,50,53]. IMERG and TerraClimate display moderate negative biases overall; CHIRPS, GPCC, and PERSIANN tend to overestimate precipitation slightly, although their seasonal dynamics differ. A similar pattern is noted in South Asia where IMERG and TerraClimate exhibit slight negative biases, whereas other datasets exhibit slight positive biases [54]. NRMSE results align with correlation and bias analyses that GPCC and CHIRPS report the lower annual error magnitudes at 17.6% and 25.1% (Table 4 and Figure 7), respectively, while the remaining datasets range from 35% to 45%, indicating higher levels of dispersion relative to observed values. In general, all evaluated precipitation datasets demonstrate sufficient reliability for direct application in water resource management, hydrological modeling, and climate impact assessments at both monthly and annual timescales. However, ERA5_Land, despite exhibiting relatively high correlation with observed data, presents notably high PBIAS and NRMSE values, indicating a consistent overestimation of precipitation. This suggests that ERA5_Land may require bias correction prior to its use in applications where accurate precipitation magnitude is critical, such as drought monitoring, flood risk assessment, or hydrological modeling for planning and infrastructure development.
Seasonal accuracy was more variable across datasets than basin scale performance While most datasets maintain relatively high seasonal correlations (r > 0.69) with rain-gauge observations (Table 2 and Figure 5), discrepancies become evident under specific seasonal conditions. For instance, PERSIANN shows relatively weak correlations during both winter (DJF) and summer (JJA), with correlations r < 0.60. Similarly, ERA5_Land exhibits comparatively low correlation during JJA (r = 0.63), reflecting its difficulty in resolving convective precipitation patterns typical of the warm season. These findings are consistent with previous evaluations highlighting the seasonal weaknesses of satellite and reanalysis datasets, particularly in mountainous or semi-arid regions [6,50].
Bias patterns are similarly more pronounced at the seasonal level. All datasets output tend to overestimate winter (DJF) precipitation (Table 3 and Figure 6), which may stem from challenges in accurately detecting snow events using satellite-based sensors, especially where ground station density is low at high altitudes. This behavior is echoed in regional studies across Central Asia and the Himalayas, where solid precipitation remains a significant source of uncertainty in remote sensing datasets [4,55]. In contrast, during summer (JJA), CHIRPS and TerraClimate consistently underestimate precipitation (−10.1% and −6.3%, respectively), while IMERG and PERSIANN substantially overestimate it (+26.2% and +24.6%, respectively). These deviations likely indicate difficulties in capturing intense and short-lived convective rainfall, which is a dominant process during warm seasons in semi-arid and mountainous terrains. Similar seasonal patterns were reported by [11] in arid basins and [56] in Central Asia, emphasizing the need for regionally adapted validation strategies. Among all evaluated datasets, TerraClimate demonstrates the most consistent seasonal accuracy, maintaining biases within ±6.3%, thereby supporting its robustness across different climatic regimes. This aligns with global studies [53,57] which have recognized TerraClimate as a reliable dataset in both tropical and mountainous settings due to its hybrid data assimilation framework. Normalized root mean square error (NRMSE) results also underscore the seasonal limitations of some datasets. While most datasets show lower seasonal NRMSE values compared to annual values, PERSIANN reports high error rates during DJF and SON exceeding 40% (Table 4 and Figure 7), reinforcing its limited accuracy during cold and transitional seasons. This is consistent with findings by [6,56,58] who found high dispersion in PERSIANN outputs during low-precipitation or snowfall-dominated periods. Overall, except for ERA5_Land and the JJA seasons of IMERG and PERSIANN, which exhibit large bias and may require correction, most precipitation datasets display satisfactory seasonal skill and can be applied directly for hydrological modeling, water resource management, and climate assessments at sub-seasonal to annual timescales.
These findings align with similar validation studies in data-scarce and topographically complex regions. For example, Refs. [6,23] found limited seasonal performance of PERSIANN and ERA5_Land in CA, particularly in high-elevation and arid zones. Ref. [59] emphasized IMERG’s strong performance across Central Asian basins but noted seasonal inconsistencies. Globally, Refs. [53,60] identified CHIRPS and GPCC as highly consistent across diverse hydroclimatic regions, while Ref. [50] documented ERA5_Land’s bias in the Andes. These cross-regional comparisons highlight the importance of region-specific validation when selecting precipitation datasets for hydrological and climate studies.

4.2.3. Elevation-Dependent Performance

Low elevations (0–800 m)
Most precipitation datasets are strongly correlated with rain-gauge observations across annual and monthly timescales, with correlation coefficients exceeding r > 0.76 annually and r > 0.64 monthly (Table 2 and Figure 5), indicating a robust ability to capture temporal precipitation variability in lowland regions. On seasonal timescales, all datasets maintain correlations above r > 0.69, except PERSIANN, which exhibits weaker correlations during winter (DJF) and summer (JJA) (r < 0.60). This seasonal reduction in correlation is likely due to PERSIANN’s known limitations in detecting solid precipitation during winter and its tendency to overestimate convective rainfall during the summer months [61,62].
Bias analysis reveals pronounced overestimations of precipitation among most datasets, particularly IMERG and PERSIANN, which demonstrate the largest positive seasonal biases, especially in JJA, exceeding +50% (Table 3 and Figure 6). These overestimations are likely due to challenges in accurately capturing intense convective events common in summer, a well-documented issue in satellite-derived datasets lacking sufficient ground-based calibration [14]. Similarly, ERA5_Land shows a marked spring overestimation (MAM), exceeding +50%, which may stem from its coarse-resolution land-atmosphere coupling and limitations in representing transitional season dynamics in semi-arid settings [6,50]. These patterns align with findings from other semi-arid lowland regions, such as the Himalaya Mountains Basin, where satellite datasets like IMERG and PERSIANN were found to significantly overestimate summer rainfall due to convective misrepresentation [63]. In contrast, GPCC and TerraClimate exhibit relatively low seasonal biases, remaining below 8% and between 3.7 and 18% (Table 3 and Figure 6), respectively, suggesting rain-gauge observations in lowland zones were consistently and accurately estimated. CHIRPS also accurately estimated precipitation consistently across seasons with biases typically ranging from 10% to 20%, attributed to its gauge-blending algorithm that integrates station data with satellite observations to enhance regional accuracy [3,53]. NRMSE results further support these findings. While most datasets show acceptable annual NRMSE values (<30%); however, the NRMSEs for PERSIANN and IMERG exceeded 40% (Table 4 and Figure 7) with largest exceedances occurring during DJF and SON, demonstrating substantial dispersion in seasonally dynamic climates.
Overall, these findings underscore that GPCC, CHIRPS, and TerraClimate are suitable for hydrological modeling, agricultural planning, and water management in lowland areas of the basin, where accurate precipitation estimates are critical for irrigation scheduling, drought risk monitoring, and long-term climate adaptation strategies.
Mid-elevations (800–1600 m)
Most precipitation datasets output were strongly correlated with rain-gauge observations, with correlation coefficients (r) exceeding 0.77 annually and 0.73 monthly (Table 2 and Figure 5). On seasonal scales, most datasets maintain r > 0.73, again except PERSIANN, which drops below r = 0.60 during DJF and JJA. This seasonal reduction in correlation for PERSIANN likely stems from persistent difficulties in capturing snowfall during winter and convective rainfall during summer, limitations frequently observed in PERSIANN and similar infrared-based satellite datasets [6,56,62].
Bias patterns become more variable at mid-elevation. GPCC records a moderate positive summer bias (+16.2%) and slight negative in winter bias (−9.0%) (Table 3 and Figure 6), suggesting it adapts well to modest terrain complexity. CHIRPS consistently maintains biases <15%, similar to its demonstrated accuracy in similar topographies such as the Ethiopian Highlands and Central Asian piedmont [6,64]. IMERG reasonably estimates precipitation but tends to overestimate summer rainfall, a recurring issue also observed in the mountainous southwestern China [65]. TerraClimate displays seasonal biases often exceeding 20% that demonstrate limitations in its empirical downscaling techniques in terrain with steep gradients [21,22]. NRMSE values remain <30% for most datasets (Table 4 and Figure 7), except for PERSIANN and ERA5_Land, which exceed 40% during DJF and JJA, respectively. This reduced the accuracy of these datasets during key hydrometeorological transition periods.
In summary, CHIRPS and GPCC continue to demonstrate the highest accuracies at mid-elevations, offering a balanced performance in terms of correlation, bias, and error dispersion. Their reliability makes them suitable for hydrological modeling, flood forecasting, and watershed planning in montane environments of the basin.
High elevations (>1600 m)
The performance of most precipitation datasets declines substantially at high elevations, although annual and monthly correlations remain moderate to high for some datasets (r > 0.65 annually and r > 0.71 monthly) (Table 2 and Figure 5). Notably, ERA5_Land demonstrates reduced correlation (r = 0.57) compared to correlations at low and mid-elevations, and CHIRPS demonstrates reduced monthly correlation (r = 0.53) compared to correlations at low and mid-elevations (Table 2). Seasonal correlation is even more challenging: ERA5_Land drops to r ≈ 0.40 during JJA, while PERSIANN correlation coefficients are low in both DJF and JJA (r < 0.40).
Biases at high elevations are large and complex. ERA5_Land and TerraClimate exhibit substantial annual deviations (+76% and −33%, respectively) (Table 3 and Figure 6), driven by misrepresentation of orographic uplift, snow/rain partitioning issues, and the paucity of high-altitude stations. Similar issues have been identified in the Tianshan Mountains [23], Andes [50], and Qilian Mountains [66]. These challenges are compounded by data scarcity and extreme precipitation heterogeneity in alpine microclimates highlighting the importance of bias correction [67]. CHIRPS shows relatively low annual and monthly bias (<−10%), and GPCC outperforms all datasets at this elevation with a near-zero annual bias (<1%). This supports prior studies that highlight the strength of gauge-based and hybrid datasets for high-elevation hydrology [3,53,68].
Seasonal bias patterns are notably divergent. Most datasets display positive biases during winter (DJF) (Table 3 and Figure 6), likely stemming from the overestimation of snowfall, misclassification of the precipitation phase (rain vs. snow), or limitations in accurately representing snow accumulation and sublimation processes under frozen conditions. For instance, DJF biases range from a modest +10% for GPCC to a pronounced +63% for ERA5_Land, suggesting that reanalysis and satellite-driven datasets may not accurately simulate cold-season hydrometeorology. These winter biases align with documented issues in cryospheric regions, where passive microwave retrievals struggle with snow-covered terrain and reanalysis datasets tend to overestimate precipitation due to coarse resolution and simplified land–atmosphere coupling [53,66,69]. In contrast, summer (JJA) biases are predominantly negative, demonstrating widespread underestimation of convective precipitation. GPCC remains relatively stable (−2%); however, most datasets indicate strong negative biases from −28.3% for PERSIANN to −36% for both TerraClimate and IMERG. This pattern suggests that many datasets do not capture the short-lived, high-intensity summer storms typical of continental interior and mountainous regions [6,13,18]. These storms are often spatially localized and driven by thermal convection and orographic uplift, phenomena poorly resolved by coarse-scale satellite sensors or gridded interpolation datasets [6,23,50]. Additionally, ERA5_Land exhibits the highest seasonal bias during autumn (SON), reaching +96%, a substantial overestimation likely caused by its known issues with transitional seasons, where model physics overpredict post-summer convective activity and soil moisture feedback [70,71]. Such seasonal discrepancies are consistent with previous evaluations in other alpine and cryospheric regions, including the Hindu Kush–Karakoram Shan–Himalaya Mountains, European Alps, and Andes, where satellite and reanalysis datasets consistently underestimate summer precipitation due to their limitations in capturing high-frequency convective events and fine-scale orographic effects [53,68].
NRMSE further demonstrates degradations in accuracy at high elevations, exceeding 30% for all datasets except GPCC, which remains below this threshold (Table 4 and Figure 7). The elevated NRMSE values highlight compounded uncertainties from both bias and random errors, especially in regions with high spatial and temporal variability in precipitation regimes [72].
Ultimately, all datasets face substantial limitations in high-altitude settings. However, GPCC and CHIRPS demonstrate high accuracy annually, monthly, and across seasons, making them suitable for cryosphere-related hydrological modeling, glacier melt estimations, and climate vulnerability assessments in mountain headwater of the basin.

4.2.4. Cumulative Distribution Analysis of Annual Precipitation

The empirical cumulative distribution function (ECDF) analysis provides a robust, non-parametric approach for assessing how well satellite- and reanalysis-based precipitation datasets replicate the long-term distribution of observed rainfall. In this study, ECDFs were used to evaluate the cumulative probabilities of annual precipitation from six datasets, CHIRPS, ERA5-Land, GPCC, IMERG, PERSIANN, and TerraClimate, against observed station data across the basin. As shown in Figure 8, the observed ECDF curve provides a benchmark to compare the fidelity of each dataset in capturing both central tendencies and variability.
At the basin-wide scale, most datasets demonstrate reasonable agreement with observations at the median (50th percentile) value of annual precipitation. Notably, while ERA5-Land exhibits noticeable deviation, all other datasets closely follow the observed distribution near the central quantiles. This suggests that, with the exception of ERA5-Land, the datasets generally perform well in reproducing the mean hydroclimatic conditions. Such alignment in the mid-range of the distribution indicates an accurate capture of the long-term climatological average [73].
However, when stratified by elevation bands, more pronounced discrepancies emerge between precipitation datasets and rain-gauge observations. In the low-elevation zone (<800 m), all datasets consistently overestimate precipitation compared to observations. In the mid-elevation range (800–1600 m), all datasets except ERA5-Land underestimate precipitation, potentially demonstrating the under-capture of orographic effects in satellite retrievals [74]. Conversely, in the high-elevation zone (>1600 m), CHIRPS and ERA5-Land overestimate precipitation, while the other datasets underestimate it, indicating varying sensitivity to complex topography and snow-dominated processes.
These systematic differences demonstrate elevation-dependent biases and limitations in each dataset’s retrieval algorithms, spatial resolution, and assimilation methods. The ECDF approach highlights these biases effectively by providing insights into the entire distribution, not just mean or total values. Therefore, the ECDF approach can be used for evaluating the performance of precipitation datasets in representing interannual variability and extreme events [23].
Overall, ECDF-based analysis complements traditional performance metrics (e.g., correlation, PBIAS, RMSE) by focusing on distributional similarity. This is especially important in hydroclimatic applications such as drought monitoring, water resource modeling, and climate change impact assessments, where accurate representation of long-term precipitation variability and extremes is critical. For instance, deviations in the tails of the ECDF curves could indicate underrepresentation of drought years or extreme wet events, both of which are essential for risk assessment and adaptation planning in climate-sensitive transboundary basins like the basin.

4.3. Basin-Wide Gridded Evaluation

The gridded evaluation of long-term mean precipitation reveals substantial spatial variability in the performance of satellite and reanalysis datasets across the basin. All datasets broadly replicate the spatial distribution of precipitation, with higher values in mountainous regions and lower values in the plains. However, the accuracy and bias of these estimates vary significantly among datasets.
Among the datasets, GPCC substantially underestimates precipitation and exhibits a strong negative bias in the high-altitude eastern regions (Figure 9). This underestimation is likely due to the scarcity of ground stations in alpine zones and the interpolation techniques used by GPCC, which rely heavily on in situ data [53]. This pattern is consistent with other evaluations in mountainous regions, where GPCC was found to underrepresent orographic precipitation due to sparse station density and limited representativeness at high elevations [56,69].
CHIRPS demonstrates the closest agreement with the spatial pattern and magnitude of observed precipitation, particularly in its ability to replicate orographic gradients and localized high-elevation maxima. This can be attributed to CHIRPS’ semi-empirical design, which blends high-resolution satellite imagery with ground-based observations and incorporates terrain-sensitive calibration algorithms [3,64]. A similarly high performance of CHIRPS has been reported in other topographically complex regions, including the Ethiopian Highlands [64], Central Asia [6], and the mountainous basin of Turkey [75], where CHIRPS consistently demonstrated higher spatial fidelity compared to other gridded datasets.
TerraClimate demonstrates good spatial agreement with moderate biases but tends to smooth extreme values and underrepresent peak precipitation zones in mountainous areas. This smoothing effect is a known limitation of its downscaling approach, which relies on climatological norms and interpolation that may dilute localized extremes [21,70]. While suitable for broad climatological assessments, such smoothing limits its applicability for high-resolution hydrological modeling in rugged terrain.
ERA5_Land exhibits a systematic positive bias across most of the basin, particularly in the high-altitude southern ranges. This overestimation is consistent with other evaluations of ERA5_Land and reanalysis datasets in complex terrain, where model dynamics often overestimate precipitation due to unresolved topographic detail and convective parameterization biases [23,66,71].
PERSIANN tends to overestimate precipitation in lowland and mid-elevation zones and underestimate precipitation in upper elevations. These patterns are typical of infrared-based satellite retrievals, which often fail to detect cold cloud-top precipitation associated with snow or stratiform rainfall in mountainous areas [18,63].
IMERG accurately estimates broad spatial patterns. However, IMERG underestimates precipitation in high-altitude zones as observed in other high-mountain evaluations, where IMERG struggled to resolve localized convective and orographic precipitation due to sensor limitations and insufficient gauge calibration [24,50,71].
In summary, the CHIRPS dataset estimates long-term mean precipitation with the highest spatial accuracy across the basin, followed by IMERG, and TerraClimate. These findings emphasize the importance of spatial resolution, topographic sensitivity, gauge integration, and calibration algorithms in determining the reliability of gridded precipitation datasets. The consistency and robustness of CHIRPS demonstrates its suitability for basin-scale applications, including hydrological modeling, water resource management, and transboundary climate risk assessments in mountainous, data-scarce environments of the basin.
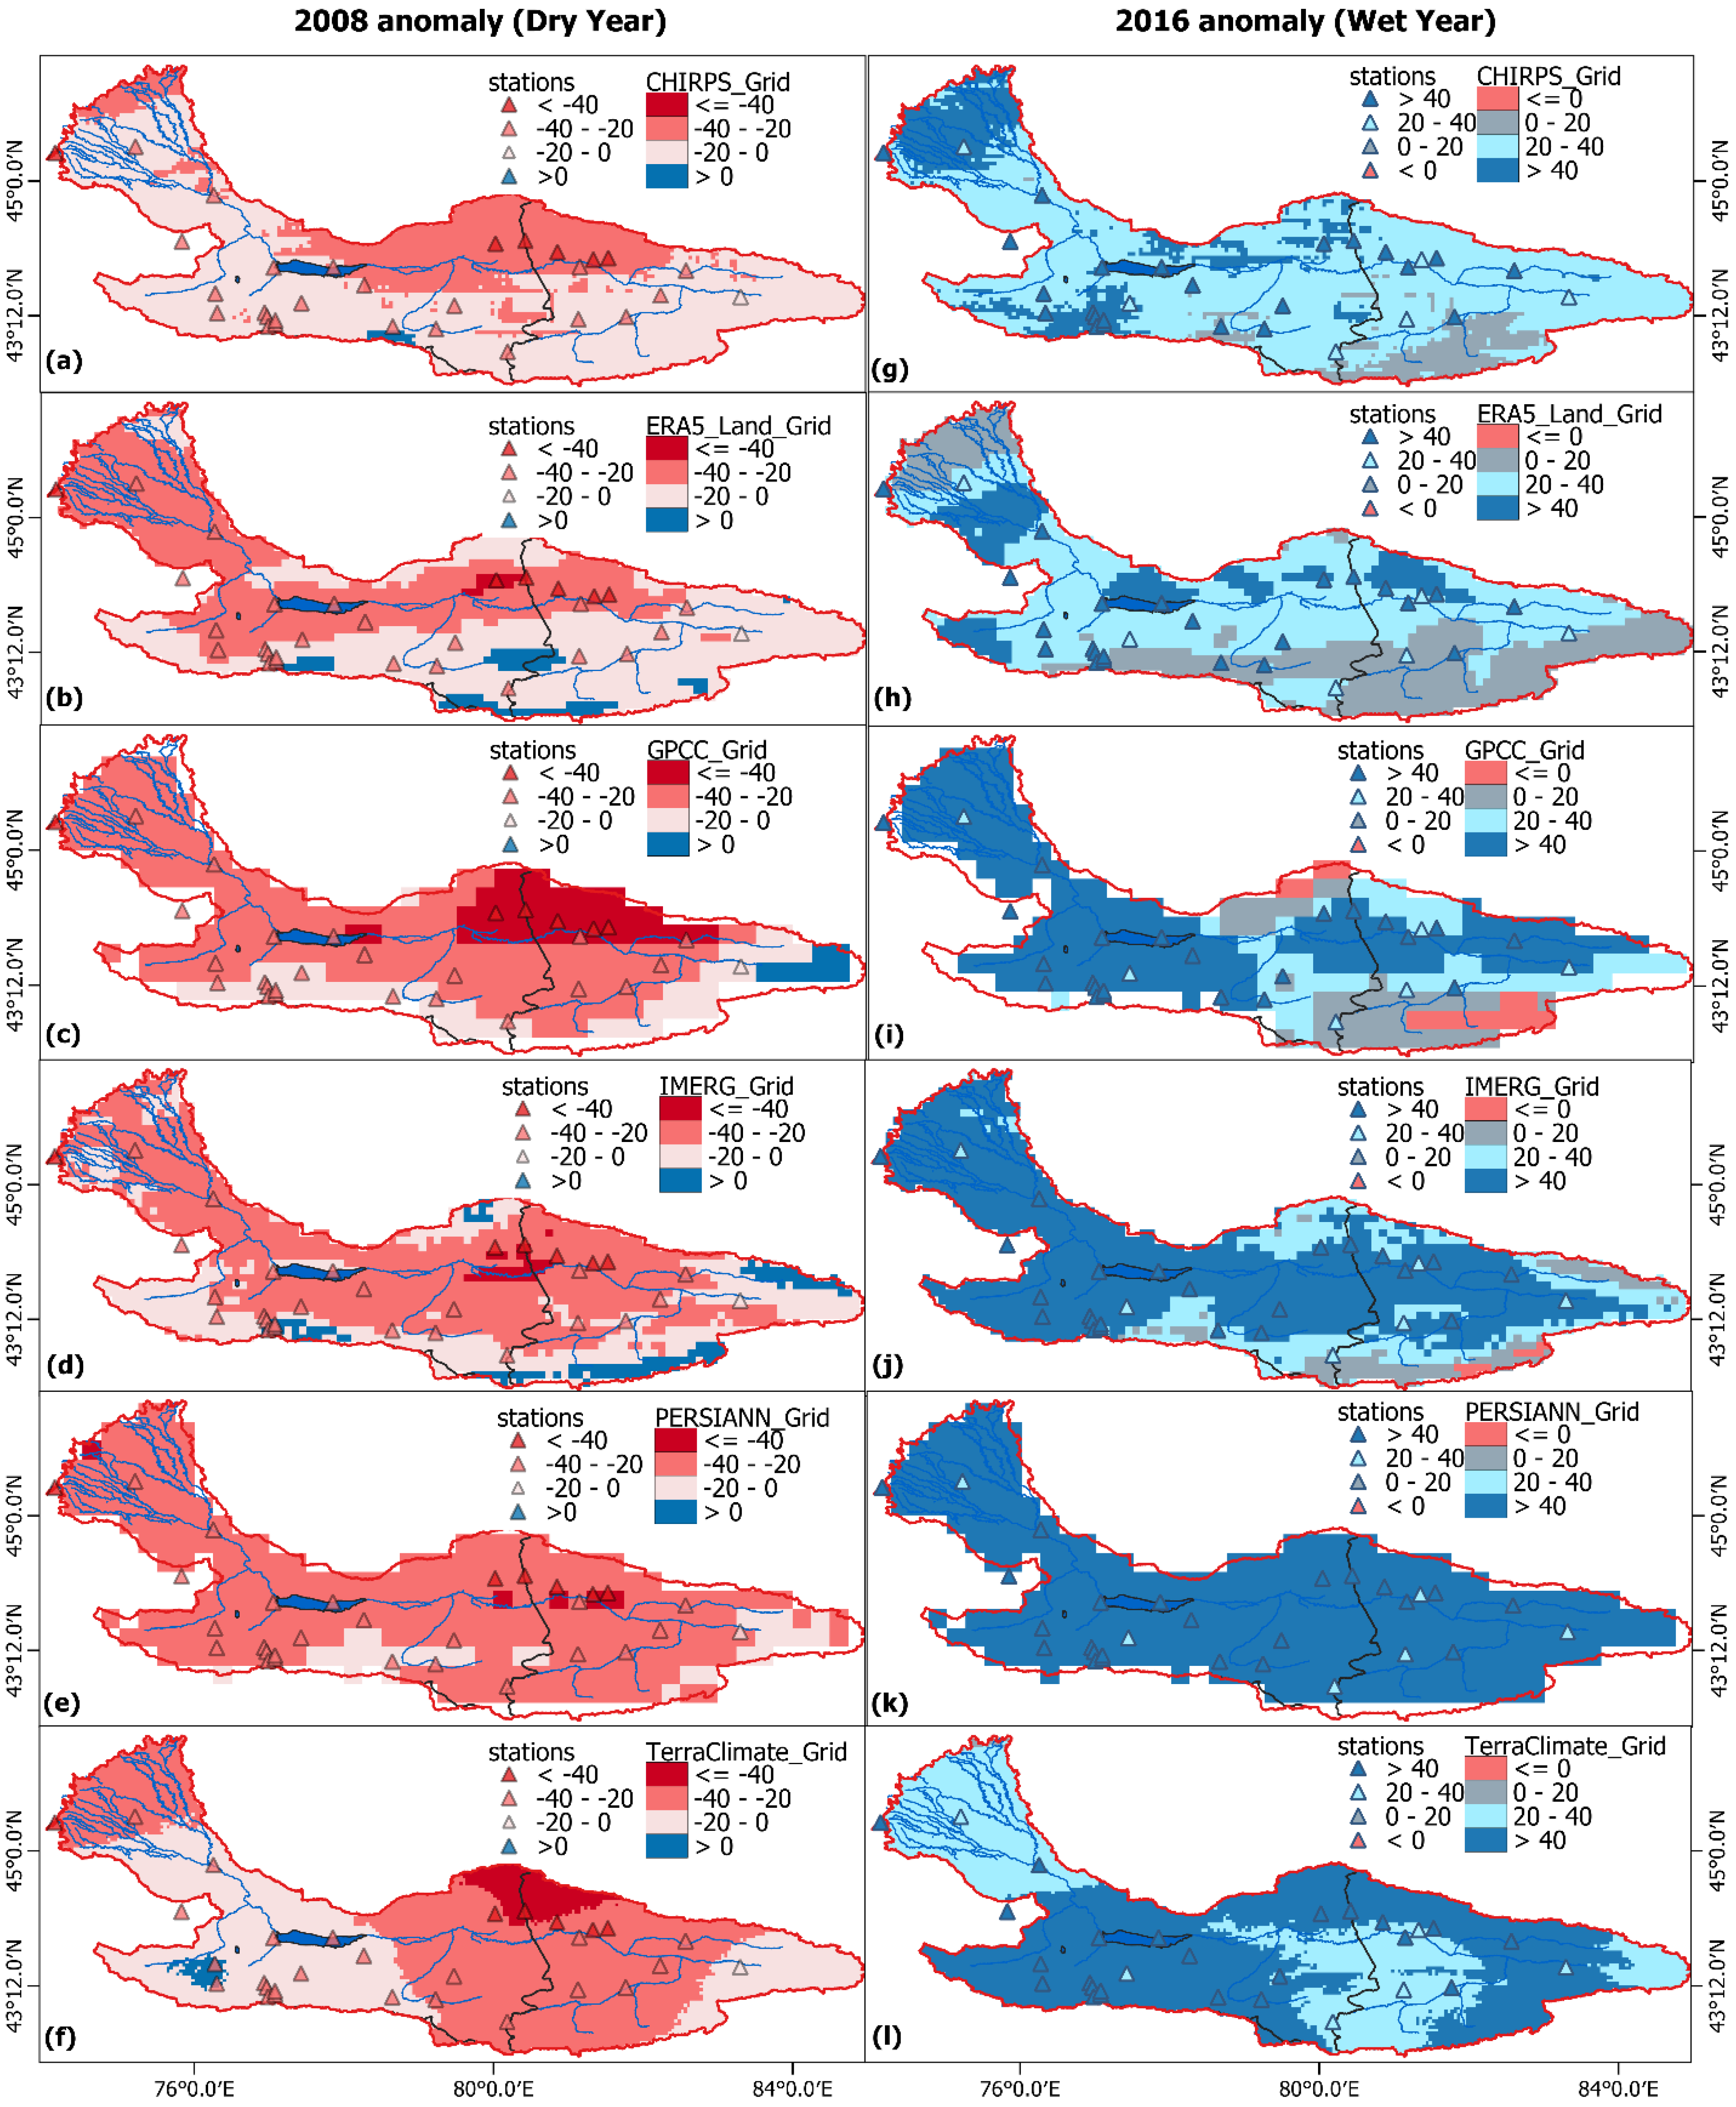
The anomaly-based evaluation of annual precipitation over the basin confirms 2008 as a distinctly dry year and 2016 as an anomalously wet year (Figure 10), with consistent signals across all datasets. Anomalies were computed relative to the 2001–2023 climatological mean, and gridded anomaly maps were compared with station-based interpolations and a topographically distributed reference map to assess spatial consistency and elevation-dependent patterns.
In 2008, station observations uniformly indicated significant drought conditions, with negative precipitation anomalies ranging from 19% to 60%, affirming it as one of the driest years in the study period. Gridded datasets generally reproduce this dry signal, although they differ in the magnitude and spatial extent of anomalies. CHIRPS indicates relatively moderate drought conditions, with most basin areas showing precipitation deficits below 20%, while PERSIANN indicates more severe dryness, with widespread anomalies exceeding 20%. IMERG indicates slightly wetter conditions in small portions of the high-altitude terrain, and GPCC shows limited wetness in the eastern highlands but still indicates overall dryness below the 40% threshold. ERA5_Land, in contrast, highlights stronger drought conditions in the lowland regions, with deficits over 20%, and minor wet anomalies in select high-altitude zones. TerraClimate exhibits a distinct spatial pattern, emphasizing substantial dryness in wetland areas (anomalies > 20%) and more subdued deficits in parts of the eastern highlands. Additionally, TerraClimate captures severe dryness (>40%) in certain northern high-elevation areas. Most datasets consistently depict greater drought severity in the lowland and mid-altitude areas compared to high-altitude regions, likely due to elevation-dependent error propagation and the influence of orographic precipitation processes. These findings collectively confirm that 2008 was a year of basin-wide drought, though spatial distributions and magnitudes vary significantly among datasets.
In 2016, the precipitation anomalies reveal a basin-wide wet year, confirmed by station observations showing anomalies from 30% to 82% above the long-term mean. All gridded datasets successfully captured this hydrologically wet period, although the magnitude and spatial distribution of anomalies varied substantially. ERA5_Land indicates relatively moderate increases in precipitation, with most basin areas exhibiting anomalies below 40% and some highland and wetland zones remaining below 20%. PERSIANN, in contrast, indicates a more pronounced and widespread wet signal, with anomalies exceeding 40% across nearly the entire basin, including high-altitude regions. CHIRPS indicates moderately wet conditions, with anomalies mostly below 40%, except for a small area in the southeastern highlands showing weaker signals (<20%) and distinct high anomalies (>40%) in some wetland zones. IMERG indicates a clear elevation-dependent gradient, with the strongest wet anomalies (>40%) concentrated in lowland regions and much weaker or even negative anomalies in localized high-elevation areas. GPCC indicates a heterogeneous anomaly pattern, with strong wetness in certain lowland areas, reduced anomalies in the mid-altitudes, and weak or slightly negative anomalies in parts of the northern and southeastern highlands. TerraClimate indicates a distinct anomaly distribution, with moderate wetness (<40%) in the eastern lowlands and stronger anomalies (>40%) across the central and western Basin.
Overall, all datasets classify 2016 as a wet year but differ in their portrayals of the spatial variability and intensity of precipitation surpluses. These differences are likely attributable to variations in algorithm design, calibration data, spatial resolution, and the treatment of orographic and convective precipitation processes.

4.4. The Role of Accurate Precipitation Data for Sustainable Water Management Under Climate Stress

Accurate precipitation data are critical for sustainable water management in regions facing climate variability, water scarcity, and data scarcity, such as Central Asia and other mountainous or arid areas globally. Advancing sustainable water management under climate stress in Central Asia and similar global regions requires prioritizing high-accuracy precipitation datasets, strengthening in situ monitoring, and applying regionally validated datasets tailored to seasonal and elevation-specific dynamics [23,53]. Such approaches will support effective drought preparedness, flood risk reduction, and long-term adaptation strategies.
Global assessments confirm that runoff and evapotranspiration models are highly sensitive to input precipitation, with uncertainty cascading through water balance estimates [2,76]. This sensitivity underscores the critical role of accurate precipitation data in ensuring reliable hydrological modeling, which is essential for sustainable water management under climate variability and change. However, scholars argue that no single dataset is universally reliable; instead, integrated approaches, combining satellite, reanalysis, and ground observations with regional bias corrections, are essential for developing robust, climate-resilient water governance systems [6,60]. These integrated approaches are apparent in policy frameworks which underscores the need for improved hydroclimatic data infrastructure to support sustainable land and water management in vulnerable regions [77]. Ultimately, improving precipitation data accuracy through rigorous evaluation enables more robust hydrological modeling and climate impact assessments. This supports adaptive water governance, drought risk reduction, and equitable transboundary cooperation across Central Asia and other vulnerable mountainous or arid regions worldwide [23].
Our study provides a foundational evaluation of satellite and reanalysis-based precipitation datasets, offering critical insights that enhance decision-making for sustainable water resource management and climate adaptation. The findings are relevant for the basin and offer transferable value to other mountain-fed transboundary river systems across Central Asia, where data scarcity and climatic variability pose significant challenges to water security and cooperative basin management.

5. Conclusions

At basin-wide stations, all datasets demonstrated strong annual correlations with ground observations (r > 0.75), although correlation coefficients slightly decreased for seasonal analyses. PERSIANN outputs were more weakly correlated with rain-gauge observations during winter and summer, likely due to limitations in capturing convective and snow-related precipitation events. Percent bias (PBIAS) results revealed that most datasets exhibited low annual biases (<5%), but errors increased seasonally, particularly in summer, with IMERG and PERSIANN exhibiting the highest positive biases. The accuracies of precipitation predictions generally declined in the high-elevation zone (>1600 m) for all datasets, highlighting the challenges of monitoring precipitation in complex mountainous regions.
Basin-wide gridded evaluations highlighted substantial differences in the spatial distribution of precipitation among datasets. CHIRPS most accurately estimated topographically driven precipitation patterns, particularly orographic gradients, more accurately than others. GPCC showed excellent point-based correlation with station data but was less accurate for predicting precipitation patterns in gridded spatial evaluations, especially in the eastern high-altitude regions. This is attributed to the scarcity of ground stations in those areas, leading to weak interpolation performance.
All datasets successfully identified 2008 as a drought year and 2016 as a wet year, confirming their general capability to detect interannual variability. However, differences in the magnitude and spatial detail of anomalies were evident. PERSIANN often overestimated wet or dry conditions, limiting its reliability for extreme event analysis.
In conclusion, CHIRPS, GPCC, and TerraClimate emerge as the most spatially and temporally accurate datasets across diverse spatial and temporal conditions in the basin (based on Pearson’s correlation coefficients, percent bias, and normalized root mean square error), followed by IMERG, PERSIANN, and ERA5_Land. These datasets provide inputs that can be used for hydrological modeling, climate impact assessments, and water resource management, particularly in data-scarce, topographically complex regions. However, no single dataset performs optimally under all conditions, highlighting the need for multi-source integration approaches to improve precipitation monitoring.
To enhance the performance of remote sensing and reanalysis datasets, future efforts should prioritize expanding the network of ground-based observation stations, especially in high-altitude areas. These regions are critical for water supply through snow and glacier melt that substantially contributes to early runoff and summer irrigation demands. Improved in situ data coverage would enhance the calibration and validation of satellite datasets, ultimately supporting more accurate hydrological modeling, water sustainability, and flood–drought mitigation activities for communities within the Ili River Basin.

Author Contributions

Conceptualization, B.D., G.B.S., and D.S.O.; Resources, T.Z.; Writing—original draft, B.D.; Writing—review and editing, G.B.S., D.S.O., J.S., T.Z., and X.W.; Supervision, G.B.S. All authors have read and agreed to the published version of the manuscript.

Funding

This research was supported by the Science Committee of the Ministry of Science and Higher Education of the Republic of Kazakhstan under Grant No. AP22685406 (Zhas-Halym); project grant No. BR27197639 “Development of Innovative Hydrogeological Methods for Water Resource Management in the Zhambyl, Almaty, Zhetysu, Abay, and East Kazakhstan Regions”, and the Fulbright Visiting Scholar Program.

Institutional Review Board Statement

Not applicable.

Informed Consent Statement

Not applicable.

Data Availability Statement

The original contributions presented in this study are included in the article. Further inquiries can be directed to the corresponding author.

Acknowledgments

The lead author gratefully acknowledges the support of the Natural Resource Ecology Laboratory (NREL) at Colorado State University for providing an excellent research environment and institutional support. Tibin Zhang was supported by Shanghai Cooperation Institute of Modern Agriculture Development (SCO24A001). The authors sincerely thank Gabriel E.L. Parrish (U.S. Geological Survey peer reviewer) for his valuable review and editorial contributions to improve the manuscript, and Leonardo Laipelt (Universidade Federal do Rio Grande do Sul) for technical assistance in data analysis. The authors also express their gratitude to the teams of Google Earth Engine, the Climate Engine, and Global Watersheds platforms for providing free access to datasets and tools. Any use of trade, firm, or product names is for descriptive purposes only and does not imply endorsement by the U.S. Government.

Conflicts of Interest

The authors declare no conflicts of interest.

References

  1. Yapiyev, V.; Sagintayev, Z.; Inglezakis, V.J.; Samarkhanov, K.; Verhoef, A. Essentials of Endorheic Basins and Lakes: A Review in the Context of Current and Future Water Resource Management and Mitigation Activities in Central Asia. Water 2017, 9, 798. [Google Scholar] [CrossRef]
  2. Beck, H.E.; Van Dijk, A.I.; Levizzani, V.; Schellekens, J.; Miralles, D.G.; Martens, B.; De Roo, A. MSWEP: 3-hourly 0.25 global gridded precipitation (1979–2015) by merging gauge, satellite, and reanalysis data. Hydrol. Earth Syst. Sci. 2017, 21, 589–615. [Google Scholar] [CrossRef]
  3. Funk, C.; Peterson, P.; Landsfeld, M.; Pedreros, D.; Verdin, J.; Shukla, S.; Husak, G.; Rowland, J.; Harrison, L.; Hoell, A.; et al. The climate hazards infrared precipitation with stations—A new environmental record for monitoring extremes. Sci. Data 2015, 2, 150066. [Google Scholar] [CrossRef]
  4. Peña-Guerrero, M.D.; Umirbekov, A.; Tarasova, L.; Müller, D. Comparing the performance of high-resolution global precipitation products across topographic and climatic gradients of Central Asia. Int. J. Clim. 2022, 42, 5554–5569. [Google Scholar] [CrossRef]
  5. Peng, J.; Liu, T.; Huang, Y.; Ling, Y.; Li, Z.; Bao, A.; Chen, X.; Kurban, A.; De Maeyer, P. Satellite-based precipitation datasets evaluation using gauge observation and hydrological modeling in a typical arid land watershed of Central Asia. Remote Sens. 2021, 13, 221. [Google Scholar] [CrossRef]
  6. Zandler, H.; Haag, I.; Samimi, C. Evaluation needs and temporal performance differences of gridded precipitation products in peripheral mountain regions. Sci. Rep. 2019, 9, 15118. [Google Scholar] [CrossRef]
  7. Muñoz-Sabater, J.; Dutra, E.; Agustí-Panareda, A.; Albergel, C.; Arduini, G.; Balsamo, G.; Boussetta, S.; Choulga, M.; Harrigan, S.; Hersbach, H.; et al. ERA5-Land: A state-of-the-art global reanalysis dataset for land applications. Earth Syst. Sci. Data 2021, 13, 4349–4383. [Google Scholar] [CrossRef]
  8. Hersbach, H.; Bell, B.; Berrisford, P.; Hirahara, S.; Horányi, A.; Muñoz-Sabater, J.; Nicolas, J.; Peubey, C.; Radu, R.; Schepers, D.; et al. The ERA5 global reanalysis. Q. J. R. Meteorol. Soc. 2020, 146, 1999–2049. [Google Scholar] [CrossRef]
  9. Beck, H.E.; Van Dijk, A.I.; Larraondo, P.R.; McVicar, T.R.; Pan, M.; Dutra, E.; Miralles, D.G. MSWX: Global 3-Hourly 0.1° Bias-Corrected Meteorological Data Including Near-Real-Time Updates and Forecast Ensembles. Bull. Am. Meteorol. Soc. 2022, 103, E710–E732. [Google Scholar] [CrossRef]
  10. Schneider, U.; Becker, A.; Finger, P.; Meyer-Christoffer, A.; Ziese, M.; Rudolf, B. GPCC’s new land surface precipitation climatology based on quality-controlled in situ data and its role in quantifying the global water cycle. Theor. Appl. Clim. 2014, 115, 15–40. [Google Scholar] [CrossRef]
  11. Sun, Q.; Miao, C.; Duan, Q.; Ashouri, H.; Sorooshian, S.; Hsu, K.-L. A review of global precipitation data sets: Data sources, estimation, and intercomparisons. Rev. Geophys. 2018, 56, 79–107. [Google Scholar] [CrossRef]
  12. Schneider, D.P.; Deser, C.; Fasullo, J.; Trenberth, K.E. Climate data guide spurs discovery and understanding. Eos Trans. Am. Geophys. Union 2013, 94, 121–122. [Google Scholar] [CrossRef]
  13. Huffman, G.J.; Bolvin, D.T.; Braithwaite, D.; Hsu, K.L.; Joyce, R.; Kidd, C.; Hsu, K.; Kelley, O.A.; Nguyen, P.; Sorooshian, S.; et al. NASA Global Precipitation Measurement (GPM) Integrated Multi-Satellite Retrievals for GPM (IMERG) Version 07. In Algorithm Theoretica Basis Documen; National Aeronautics and Space Administration (NASA): Houston, TX, USA, 2023. [Google Scholar]
  14. Tang, G.; Clark, M.P.; Papalexiou, S.M.; Ma, Z.; Hong, Y. Have satellite precipitation products improved over last two decades? A comprehensive comparison of GPM IMERG with nine satellite and reanalysis datasets. Remote Sens. Environ. 2020, 240, 111697. [Google Scholar] [CrossRef]
  15. Pradhan, R.K.; Markonis, Y.; Godoy, M.R.; Villalba-Pradas, A.; Andreadis, K.M.; Nikolopoulos, E.I.; Papalexiou, S.M.; Rahim, A.; Tapiador, F.J.; Hanel, M. Review of GPM IMERG performance: A global perspective. Remote Sens. Environ. 2022, 268, 112754. [Google Scholar] [CrossRef]
  16. Mahmoud, M.T.; Mohammed, S.A.; Hamouda, M.A.; Mohamed, M.M. Impact of topography and rainfall intensity on the accuracy of imerg precipitation estimates in an arid region. Remote Sens. 2020, 13, 13. [Google Scholar] [CrossRef]
  17. Hsu, K.-L.; Gao, X.; Sorooshian, S.; Gupta, H.V. Precipitation Estimation from Remotely Sensed Information Using Artificial Neural Networks. J. Appl. Meteorol. 1997, 36, 1176–1190. [Google Scholar] [CrossRef]
  18. Nguyen, P.; Ombadi, M.; Sorooshian, S.; Hsu, K.; AghaKouchak, A.; Braithwaite, D.; Ashouri, H.; Thorstensen, A.R. The PERSIANN family of global satellite precipitation data: A review and evaluation of products. Hydrol. Earth Syst. Sci. 2018, 22, 5801–5816. [Google Scholar] [CrossRef]
  19. Alijanian, M.; Rakhshandehroo, G.R.; Mishra, A.K.; Dehghani, M. Evaluation of satellite rainfall climatology using CMORPH, PERSIANN-CDR, PERSIANN, TRMM, MSWEP over Iran. Int. J. Climatol. 2017, 37, 4896–4914. [Google Scholar] [CrossRef]
  20. Miao, C.; Ashouri, H.; Hsu, K.-L.; Sorooshian, S.; Duan, Q. Evaluation of the PERSIANN-CDR Daily Rainfall Estimates in Capturing the Behavior of Extreme Precipitation Events over China. J. Hydrometeorol. 2015, 16, 1387–1396. [Google Scholar] [CrossRef]
  21. Abatzoglou, J.T.; Dobrowski, S.Z.; Parks, S.A.; Hegewisch, K.C. TerraClimate, a high-resolution global dataset of monthly climate and climatic water balance from 1958–2015. Sci. Data 2018, 5, 170191. [Google Scholar] [CrossRef]
  22. Cepeda Arias, E.; Cañon Barriga, J. Performance of high-resolution precipitation datasets CHIRPS and TerraClimate in a Colombian high Andean Basin. Geocarto Int. 2022, 37, 17382–17402. [Google Scholar] [CrossRef]
  23. Sun, Y.; Wendi, D.; Kim, D.E.; Liong, S.Y. Evaluation of PERSIANN-CCS-CDR daily precipitation estimates in capturing rainfall extremes over the Asian monsoon region. J. Hydrol. 2022, 612, 128157. [Google Scholar]
  24. Derin, Y.; Anagnostou, E.; Berne, A.; Borga, M.; Boudevillain, B.; Buytaert, W.; Chang, C.-H.; Chen, H.; Delrieu, G.; Hsu, Y.C.; et al. Evaluation of GPM-era global satellite precipitation products over multiple complex terrain regions. Remote Sens. 2019, 11, 2936. [Google Scholar] [CrossRef]
  25. de Boer, T.; Paltan, H.; Sternberg, T.; Wheeler, K. Evaluating vulnerability of Central Asian water resources under uncertain climate and development conditions: The case of the Ili-Balkhash Basin. Water 2021, 13, 615. [Google Scholar] [CrossRef]
  26. Zhupankhan, A.; Tussupova, K.; Berndtsson, R. Water in Kazakhstan, a key in Central Asian water management. Hydrol. Sci. J. 2018, 63, 752–762. [Google Scholar] [CrossRef]
  27. Prniyazova, A.; Turaeva, S.; Turgunov, D.; Jarihani, B. Sustainable Transboundary Water Governance in Central Asia: Challenges, Conflicts, and Regional Cooperation. Sustainability 2025, 17, 4968. [Google Scholar] [CrossRef]
  28. Wang, X.; Chen, Y.; Li, Z.; Fang, G.; Wang, F.; Hao, H. Water resources management and dynamic changes in water politics in the transboundary river basins of Central Asia. Hydrol. Earth Syst. Sci. 2021, 25, 3281–3299. [Google Scholar] [CrossRef]
  29. Shahgedanova, M.; Afzal, M.; Hagg, W.; Kapitsa, V.; Kasatkin, N.; Mayr, E.; Rybak, O.; Saidaliyeva, Z.; Severskiy, I.; Usmanova, Z.; et al. Emptying water towers? Impacts of future climate and glacier change on river discharge in the Northern Tien Shan, Central Asia. Water 2020, 12, 627. [Google Scholar] [CrossRef]
  30. Liu, S.; Long, A.; Yan, D.; Luo, G.; Wang, H. Predicting Ili River streamflow change and identifying the major drivers with a novel hybrid model. J. Hydrol. Reg. Stud. 2024, 53, 101807. [Google Scholar] [CrossRef]
  31. Kyrgyzbay, K.; Kakimzhanov, Y.; Sagin, J. Climate data verification for assessing climate change in Almaty region of the Republic of Kazakhstan. Clim. Serv. 2023, 32, 100423. [Google Scholar] [CrossRef]
  32. Zhu, Y.; Yang, P.; Xia, J.; Huang, H.; Chen, Y.; Li, Z.; Sun, K.; Song, J.; Shi, X.; Lu, X. Drought propagation and its driving forces in central Asia under climate change. J. Hydrol. 2024, 636, 131260. [Google Scholar] [CrossRef]
  33. Nzabarinda, V.; Bao, A.; Tie, L.; Ochege, F.U.; Uwamahoro, S.; Kayiranga, A.; Bao, J.; Sindikubwabo, C.; Li, T. The monsoon’s influence on Central Asia’s subsequent periods of drought and flooding. J. Geophys. Res. Atmos. 2024, 129, e2023JD040291. [Google Scholar] [CrossRef]
  34. Duisebek, B. Modelling Impacts of Climate Change on Maize Production in South-Eastern Kazakhstan. Ph.D. Thesis, University of Reading, Reading, UK, 2022. [Google Scholar]
  35. Yegizbayeva, A.; Koshim, A.G.; Bekmuhamedov, N.; Aliaskarov, D.T.; Alimzhanova, N.; Aitekeyeva, N. Satellite-based drought assessment in the endorheic basin of Lake Balkhash. Front. Environ. Sci. 2024, 11, 1291993. [Google Scholar] [CrossRef]
  36. Alimkulov, S.; Makhmudova, L.; Talipova, E.K.; Baspakova, G.; Tigkas, D.; Gulsaira, I. Response of the water level of the Balkash Lake to the distribution of meteorological and hydrological droughts under the conditions of climate change. J. Water Clim. Chang. 2024, 15, 3395–3408. [Google Scholar] [CrossRef]
  37. Liu, J.; Li, Y.; Yuan, X.; Li, X. Flood vulnerability assessment in the Ili River Basin based on the comprehensive symmetric Kullback–Leibler distance. Sci. Rep. 2025, 15, 7420. [Google Scholar] [CrossRef]
  38. Issakov, Y.; Shynbergenova, K.; Qasenuly, M.; Gajić, T.; Skakova, A. A systematic review of programs and mechanisms for industry engagement in flood water management: Global challenges and perspectives. Water 2025, 17, 1155. [Google Scholar] [CrossRef]
  39. Yapiyev, V.; Ongdas, N.; Pinkerneil, S.; Samarkhanov, K.; Kabdeshev, A.; Karakulov, Y.; Muzdybaev, M.; Atalikhova, A.; Stefan, C.; Sagin, J.; et al. The exploratory dataset of isotopic composition of different water sources across Kazakhstan. Data Brief. 2024, 54, 110360. [Google Scholar] [CrossRef]
  40. Saidaliyeva, Z.; Shahgedanova, M.; Yapiyev, V.; Wade, A.J.; Akbarov, F.; Uulu, M.E.; Kalashnikova, O.; Kapitsa, V.; Kasatkin, N.; Rakhimov, I.; et al. Precipitation in the mountains of Central Asia: Isotopic composition and source regions. Atmos. Chem. Phys. 2024, 24, 12203–12224. [Google Scholar] [CrossRef]
  41. Pueppke, S.G.; Zhang, Q.; Nurtazin, S.T. Irrigation in the Ili River Basin of Central Asia: From Ditches to Dams and Diversion. Water 2018, 10, 1650. [Google Scholar] [CrossRef]
  42. Huang, F.; Ochoa, C.G.; Jarvis, W.T.; Zhong, R.; Guo, L. Evolution of landscape pattern and the association with ecosystem services in the Ili-Balkhash Basin. Environ. Monit. Assess. 2022, 194, 171. [Google Scholar] [CrossRef]
  43. Liu, S.; Wang, F.; Wang, X.; Luo, H.; Wang, L.; Zhou, P.; Xu, C. Modeling the impact of climate change on streamflow in glacier/snow-fed northern Tianshan basin. J. Hydrol. Reg. Stud. 2023, 50, 101552. [Google Scholar] [CrossRef]
  44. Shahgedanova, M.; Afzal, M.; Severskiy, I.; Usmanova, Z.; Saidaliyeva, Z.; Kapitsa, V.; Kasatkin, N.; Dolgikh, S. Changes in the mountain river discharge in the northern Tien Shan since the mid-20th Century: Results from the analysis of a homogeneous daily streamflow data set from seven catchments. J. Hydrol. 2018, 564, 1133–1152. [Google Scholar] [CrossRef]
  45. Zanaga, D.; Van De Kerchove, R.; Daems, D.; De Keersmaecker, W.; Brockmann, C.; Kirches, G.; Wevers, J.; Cartus, O.; Santoro, M.; Fritz, S.; et al. ESA WorldCover 10 m 2021 v200. 2022. Available online: https://zenodo.org/records/7254221 (accessed on 20 January 2025).
  46. Gorelick, N.; Hancher, M.; Dixon, M.; Ilyushchenko, S.; Thau, D.; Moore, R. Google Earth Engine: Planetary-scale geospatial analysis for everyone. Remote Sens. Environ. 2017, 202, 18–27. [Google Scholar] [CrossRef]
  47. Huntington, J.L.; Hegewisch, K.C.; Daudert, B.; Morton, C.G.; Abatzoglou, J.T.; McEvoy, D.J.; Erickson, T. Climate Engine: Cloud Computing and Visualization of Climate and Remote Sensing Data for Advanced Natural Resource Monitoring and Process Understanding. Bull. Am. Meteorol. Soc. 2017, 98, 2397–2410. [Google Scholar] [CrossRef]
  48. R Core Team. R: A Language and Environment for Statistical Computing; R Foundation for Statistical Computing: Vienna, Austria, 2024; Available online: https://www.r-project.org/ (accessed on 20 January 2025).
  49. QGIS.org. QGIS Geographic Information System. QGIS Association. 2025. Available online: https://www.qgis.org/ (accessed on 20 January 2025).
  50. Satgé, F.; Ruelland, D.; Bonnet, M.-P.; Molina, J.; Pillco, R. Consistency of satellite-based precipitation products in space and over time compared with gauge observations and snow- hydrological modelling in the Lake Titicaca region. Hydrol. Earth Syst. Sci. 2020, 24, 595–619. [Google Scholar] [CrossRef]
  51. Javanmard, S.; Yatagai, A.; Nodzu, M.I.; BodaghJamali, J.; Kawamoto, H. Comparing high-resolution gridded precipitation data with satellite rainfall estimates of TRMM_3B42 over Iran. Adv. Geosci. 2010, 25, 119–125. [Google Scholar] [CrossRef]
  52. Duan, Z.; Liu, J.; Tuo, Y.; Chiogna, G.; Disse, M. Evaluation of eight high spatial resolution gridded precipitation products in Adige Basin (Italy) at multiple temporal and spatial scales. Sci. Total Environ. 2016, 573, 1536–1553. [Google Scholar] [CrossRef]
  53. Beck, H.E.; Wood, E.F.; Pan, M.; Fisher, C.K.; Miralles, D.G.; Van Dijk, A.I.; McVicar, T.R.; Adler, R.F. MSWEP V2 Global 3-Hourly 0.1° Precipitation: Methodology and Quantitative Assessment. Bull. Am. Meteorol. Soc. 2019, 100, 473–500. [Google Scholar] [CrossRef]
  54. Ahmed, K.; Shahid, S.; Wang, X.; Nawaz, N.; Najeebullah, K. Evaluation of Gridded Precipitation Datasets over Arid Regions of Pakistan. Water 2019, 11, 210. [Google Scholar] [CrossRef]
  55. Kumar, M.; Hodnebrog, Ø.; Daloz, A.S.; Sen, S.; Badiger, S.; Krishnaswamy, J. Measuring precipitation in Eastern Himalaya: Ground validation of eleven satellite, model and gauge interpolated gridded products. J. Hydrol. 2021, 599, 126252. [Google Scholar] [CrossRef]
  56. Song, L.; Xu, C.; Long, Y.; Lei, X.; Suo, N.; Cao, L. Performance of Seven Gridded Precipitation Products over Arid Central Asia and Subregions. Remote Sens. 2022, 14, 6039. [Google Scholar] [CrossRef]
  57. Gebrechorkos, S.H.; Leyland, J.; Dadson, S.J.; Cohen, S.; Slater, L.; Wortmann, M.; Ashworth, P.J.; Bennett, G.L.; Boothroyd, R.; Cloke, H.; et al. Global-scale evaluation of precipitation datasets for hydrological modelling. Hydrol. Earth Syst. Sci. 2023, 28, 3099–3118. [Google Scholar] [CrossRef]
  58. Gao, F.; Zhang, Y.; Chen, Q.; Wang, P.; Yang, H.; Yao, Y.; Cai, W. Comparison of two long-term and high-resolution satellite precipitation datasets in Xinjiang, China. Atmos. Res. 2018, 212, 150–157. [Google Scholar] [CrossRef]
  59. Guo, H.; Chen, S.; Bao, A.; Hu, J.; Yang, B.; Stepanian, P.M. Comprehensive evaluation of high-resolution satellite-based precipitation products over China. Atmosphere 2015, 7, 6. [Google Scholar] [CrossRef]
  60. Mishra, B.; Panthi, S.; Ghimire, B.R.; Poudel, S.; Maharjan, B.; Muhammad, S.; Mishra, Y. Gridded precipitation products on the Hindu Kush-Himalaya: Performance and accuracy of seven precipitation products. PLoS Water 2023, 2, e0000145. [Google Scholar] [CrossRef]
  61. Ashouri, H.; Hsu, K.-L.; Sorooshian, S.; Braithwaite, D.K.; Knapp, K.R.; Cecil, L.D.; Nelson, B.R.; Prat, O.P. PERSIANN-CDR: Daily precipitation climate data record from multisatellite observations for hydrological and climate studies. Bull. Am. Meteorol. Soc. 2015, 96, 69–83. [Google Scholar] [CrossRef]
  62. Kumar, S.; Amarnath, G.; Ghosh, S.; Park, E.; Baghel, T.; Wang, J.; Pramanik, M.; Belbase, D. Assessing the performance of the satellite-based precipitation products (SPP) in the data-sparse Himalayan Terrain. Remote Sens. 2022, 14, 4810. [Google Scholar] [CrossRef]
  63. Nadeem, M.U.; Anjum, M.N.; Afzal, A.; Azam, M.; Hussain, F.; Usman, M.; Javaid, M.M.; Mukhtar, M.A.; Majeed, F. Assessment of MULTI-satellite precipitation products over the Himalayan mountains of Pakistan, South Asia. Sustainability 2022, 14, 8490. [Google Scholar] [CrossRef]
  64. Dinku, T.; Funk, C.; Peterson, P.; Maidment, R.; Tadesse, T.; Gadain, H.; Ceccato, P. Validation of the CHIRPS satellite rainfall estimates over eastern Africa. Q. J. R. Meteorol. Soc. 2018, 144, 292–312. [Google Scholar] [CrossRef]
  65. Tang, X.; Li, H.; Qin, G.; Huang, Y.; Qi, Y. Evaluation of satellite-based precipitation products over complex topography in mountainous southwestern China. Remote Sens. 2023, 15, 473. [Google Scholar] [CrossRef]
  66. You, Q.; Cai, Z.; Pepin, N.; Chen, D.; Ahrens, B.; Jiang, Z.; Wu, F.; Kang, S.; Zhang, R.; Wu, T.; et al. Warming amplification over the Arctic Pole and Third Pole: Trends, mechanisms and consequences. Earth-Sci. Rev. 2020, 217, 103625. [Google Scholar] [CrossRef]
  67. de Padua, V.M.N.; Ahn, K.H. Toward the reliable use of reanalysis data as a reference for bias correction in climate models: A multivariate perspective. J. Hydrol. 2024, 644, 32102. [Google Scholar] [CrossRef]
  68. Tapiador, F.J.; Navarro, A.; Levizzani, V.; García-Ortega, E.; Huffman, G.J.; Kidd, C.; Kucera, P.; Kummerow, C.; Masunaga, H.; Petersen, W.; et al. Global precipitation measurements for validating climate models. Atmos. Res. 2017, 197, 1–20. [Google Scholar] [CrossRef]
  69. Gao, Y.; Chen, F.; Lettenmaier, D.P.; Xu, J.; Xiao, L.; Li, X. Does elevation-dependent warming hold true above 5000 m elevation? Lessons from the Tibetan Plateau. NPJ Clim. Atmos. Sci. 2018, 1, 19. [Google Scholar] [CrossRef]
  70. Tarek, M.; Brissette, F.P.; Arsenault, R. Evaluation of the ERA5 reanalysis as a potential reference dataset for hydrological modelling over North America. Hydrol. Earth Syst. Sci. 2020, 24, 2527–2544. [Google Scholar] [CrossRef]
  71. Xu, L.; Chen, N.; Moradkhani, H.; Zhang, X.; Hu, C. Improving Global Monthly and Daily Precipitation Estimation by Fusing Gauge Observations, Remote Sensing, and Reanalysis Data Sets. Water Resour. Res. 2020, 56, e2019WR026444. [Google Scholar] [CrossRef]
  72. Uttarwar, S.B.; Napoli, A.; Avesani, D.; Majone, B. Elevation-driven biases in seasonal weather forecasts: Insights from the Alpine region. Phys. Chem. Earth Parts A/B/C 2025, 139, 103957. [Google Scholar] [CrossRef]
  73. Zambrano-Bigiarini, M.; Nauditt, A.; Birkel, C.; Verbist, K.; Ribbe, L. Temporal and spatial evaluation of satellite-based rainfall estimates across the complex topographical and climatic gradients of Chile. Hydrol. Earth Syst. Sci. 2017, 21, 1295–1320. [Google Scholar] [CrossRef]
  74. Behrangi, A.; Guan, B.; Neiman, P.J.; Schreier, M.; Lambrigtsen, B. On the Quantification of Atmospheric Rivers Precipitation from Space: Composite Assessments and Case Studies over the Eastern North Pacific Ocean and the Western United States. J. Hydrometeorol. 2015, 17, 369–382. [Google Scholar] [CrossRef]
  75. Hafizi, H.; Sorman, A.A. Assessment of 13 gridded precipitation datasets for hydrological modeling in a mountainous basin. Atmosphere 2022, 13, 143. [Google Scholar] [CrossRef]
  76. Senay, G.B.; Kagone, S.; Velpuri, N.M. Operational global actual evapotranspiration: Development, evaluation, and dissemination. Sensors 2020, 20, 1915. [Google Scholar] [CrossRef] [PubMed]
  77. The State of the World’s Land and Water Resources for Food and Agriculture—Systems at Breaking Point (SOLAW 2021); Food and Agriculture Organization of the United Nations (FAO): Rome, Italy, 2021. [CrossRef]
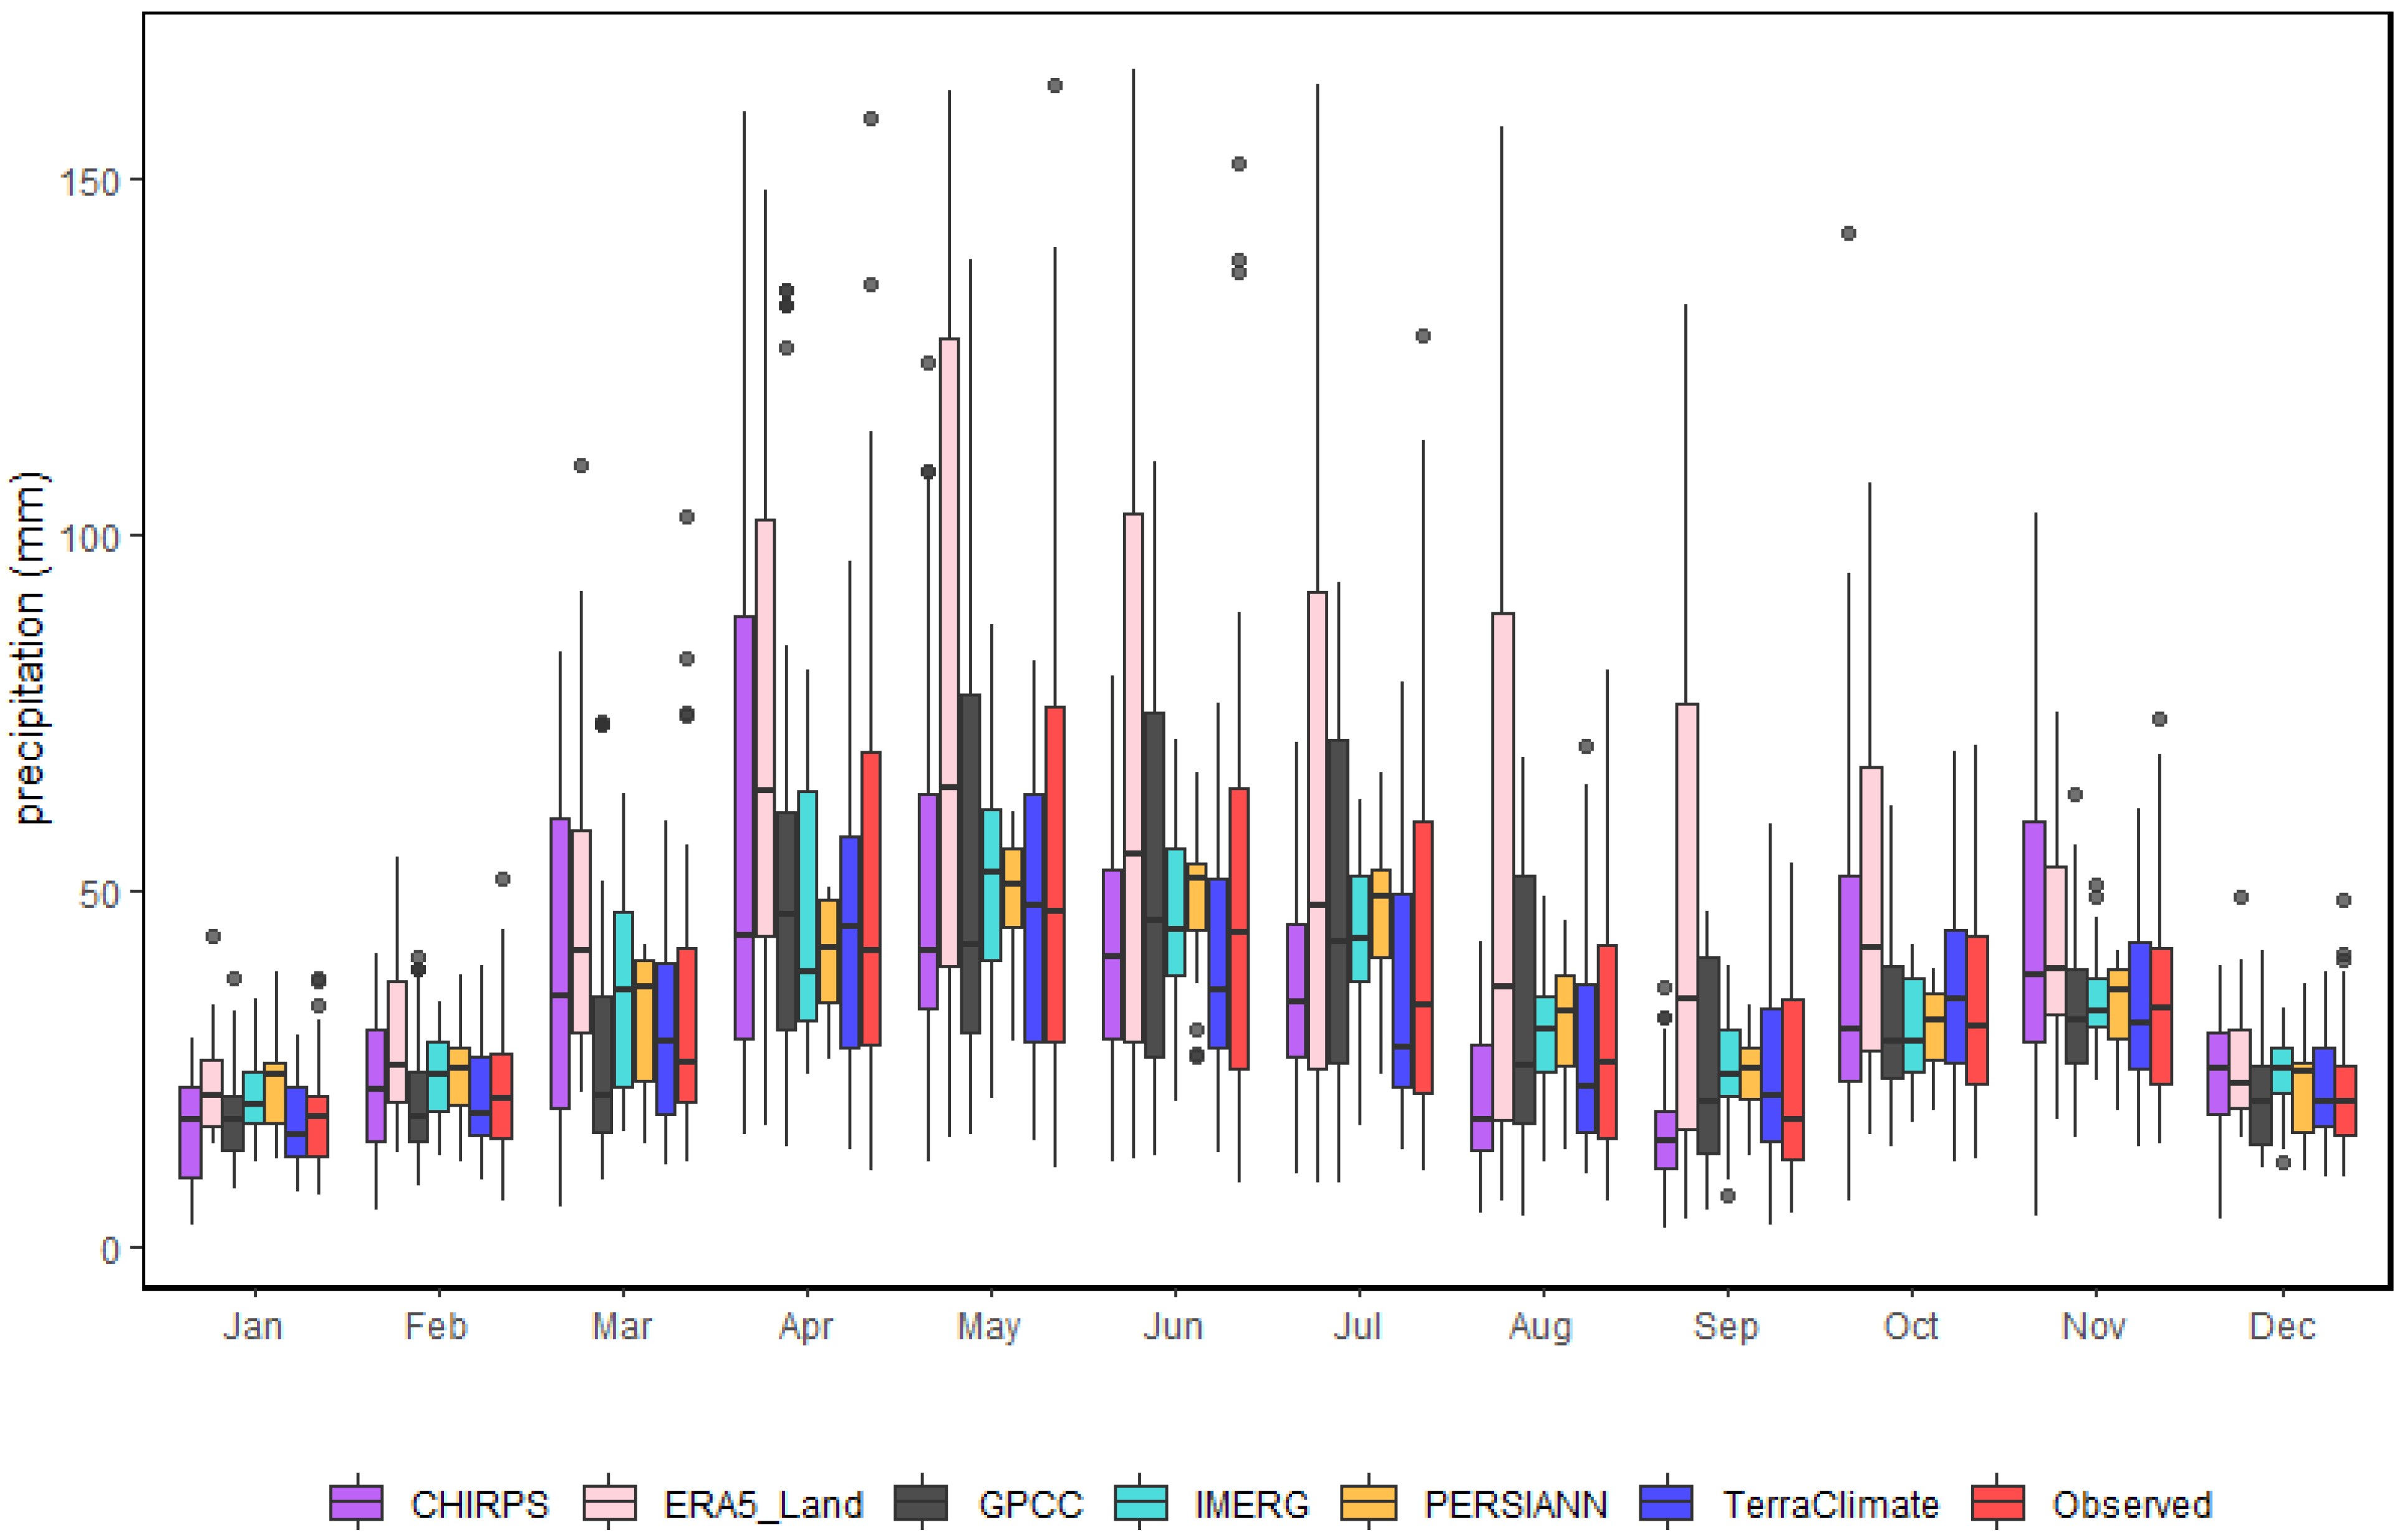
Figure 3. Long-term average monthly precipitation (2001–2023) from rain-gauge observations and various satellite and reanalysis precipitation datasets.
Sustainability 17 07418 g003
Figure 4. Annual precipitation anomalies relative to the 2001–2023 mean for observed data and various precipitation products.
Sustainability 17 07418 g004
Figure 5. Correlation coefficients (r) of different precipitation datasets in relation to station observations across temporal and spatial scales.
Sustainability 17 07418 g005
Figure 6. PBIAS (%) of different precipitation datasets in relation to station observations across temporal and spatial scales.
Sustainability 17 07418 g006
Figure 7. NRMSE (%) of different precipitation datasets in relation to station observations across temporal and spatial scales.
Sustainability 17 07418 g007
Figure 8. Cumulative probability distributions of annual precipitation for the observed dataset and five satellite-based precipitation datasets, shown for the entire Ili River Basin and across different elevation zones.
Sustainability 17 07418 g008
Figure 9. (a) Elevation range of the Ili River Basin; (b) average annual observed precipitation; (ch) average annual precipitation from CHIRPS, ERA5_Land, IMERG, GPCC, PERSIANN, and TerraClimate datasets. All panels include observed station-based average annual precipitation (2001–2023), represented by triangles for comparison.
Sustainability 17 07418 g009
Figure 10. (af) Basin-wide gridded precipitation anomaly maps for 2008 (dry year) derived from CHIRPS, ERA5_Land, IMERG, GPCC, PERSIANN, and TerraClimate datasets; (gl) basin-wide gridded precipitation anomaly maps for 2016 (wet year) from the same datasets. Observed station-based anomalies (2001–2023 baseline) are overlaid and represented by triangles.
Sustainability 17 07418 g010
Table 1. Data types and key characteristics.
DatasetDescriptionSpatial ResolutionTemporal ResolutionCoverageData AvailabilityCitation
CHIRPS (Climate Hazards Group InfraRed Precipitation with Station data)Merged satellite and station-based precipitation dataset0.05° (~5 km)Daily, MonthlyGlobal (50° S–50° N)1981–present[3]
ERA5 (ECMWF Reanalysis 5) _LandGlobal reanalysis dataset from ECMWF, includes multiple atmospheric and land variables0.1° (~9 km)Hourly, MonthlyGlobal1950–present[7]
GPCC (Global Precipitation Climatology Centre)Gauge-based global precipitation dataset0.25° to 2.5°MonthlyGlobal1891–2020[10]
IMERG (Integrated Multi-satellite Retrievals for GPM)Satellite-based precipitation estimates using GPM and TRMM data0.1° (~10 km)30-min, Daily, MonthlyGlobal (60° S–60° N)2000–present[13]
PERSIANN (Precipitation Estimation from Remotely Sensed Information using Artificial Neural Networks)Satellite-based precipitation estimates using infrared and microwave sensors0.25° (~25 km)Daily, MonthlyGlobal (60° S–60° N)1983–present[17]
TerraClimateClimate and water balance dataset derived from multiple sources0.04° (~4 km)MonthlyGlobal1958–present[21]
Table 2. Median correlation coefficients (r) of different precipitation datasets in relation to station observations across temporal and spatial scales. The number of stations in the entire basin, 0–800 m, 800–1600 m, and >1600 m elevation ranges is 30, 15, 8, and 7, respectively.
SpatialTemporalNumber of ObservationsCHIRPSERA5_LandGPCCIMERGPERSIANNTerraClimate
BasinAnnual6900.760.740.870.850.80.8
BasinMonthly82800.680.760.860.830.710.76
BasinDJF20700.740.820.890.820.450.72
BasinMAM20700.740.80.830.850.780.8
BasinJJA20700.690.630.770.790.560.77
BasinSON20700.720.780.870.820.790.72
0–800 mAnnual3450.760.790.890.870.810.8
0–800 mMonthly41400.680.730.860.820.640.75
0–800 mDJF10350.750.850.930.860.540.72
0–800 mMAM10350.690.80.880.860.810.82
0–800 mJJA10350.690.710.780.80.590.77
0–800 mSON10350.730.80.930.910.820.76
800–1600 mAnnual1840.790.770.870.870.820.8
800–1600 mMonthly22080.770.810.840.860.730.78
800–1600 mDJF5520.790.80.860.830.370.71
800–1600 mMAM5520.840.860.860.870.780.82
800–1600 mJJA5520.730.60.80.810.570.78
800–1600 mSON5520.80.750.860.810.850.77
>1600 mAnnual1610.770.570.750.780.650.72
>1600 mMonthly19320.530.750.850.850.710.76
>1600 mDJF4830.720.680.630.70.340.68
>1600 mMAM4830.740.720.80.830.750.75
>1600 mJJA4830.630.370.70.730.380.6
>1600 mSON4830.630.660.720.780.720.63
Table 3. Median PBIAS (%) of different precipitation datasets in relation to station observations across temporal and spatial scales. The number of stations in the entire basin, 0–800 m, 800–1600 m, and >1600 m elevation ranges is 30, 15, 8, and 7, respectively.
SpatialTemporalNumber of ObservationsCHIRPSERA5_LandGPCCIMERGPERSIANNTerraClimate
BasinAnnual6900.933.64.6−3.14.4−3.6
BasinMonthly82800.933.64.6−3.14.4−3.6
BasinDJF20709.122.62.48.88.30.2
BasinMAM20709.740.86.5−5.3−4.5−2.4
BasinJJA2070−10.131.86.926.224.6−6.3
BasinSON207010.530.64.3−3.4−1.43.5
0–800 mAnnual34517.518.45.843.351.210.5
0–800 mMonthly414017.518.45.843.351.210.5
0–800 mDJF103519.320.44.425.329.613.3
0–800 mMAM10351851.58.148.254.417.8
0–800 mJJA103518.78.35.849.492.73.7
0–800 mSON10359.7175.433.329.610.8
800–1600 mAnnual184−14.833.62.5−14.6−21.5−20.7
800–1600 mMonthly2208−14.833.62.5−14.6−21.5−20.7
800–1600 mDJF552−14.711.3−9−15−23−16.1
800–1600 mMAM552−15.427.5−3.2−24.7−36.9−33.3
800–1600 mJJA552−18.352.416.2−1.31.4−20.2
800–1600 mSON552−13.831−1.4−17−26.2−13.5
>1600 mAnnual161−676.4−0.3−25.9−21.9−33.3
>1600 mMonthly1932−676.4−0.3−25.9−21.9−33.3
>1600 mDJF48323.463.418.110.138.220.5
>1600 mMAM48317.961.37.5−28.6−29.8−34.8
>1600 mJJA483−29.953.7−1.9−36−28.3−36.1
>1600 mSON48326.696.23.9−17.9−18.5−18.1
Table 4. Median NRMSE (%) of different precipitation datasets in relation to station observations across temporal and spatial scales. The number of stations in the entire basin, 0–800 m, 800–1600 m, and >1600 m elevation ranges is 30, 15, 8, and 7, respectively.
SpatialTemporalNumber of ObservationsCHIRPSERA5_LandGPCCIMERGPERSIANNTerraClimate
BasinAnnual69025.144.117.636.845.135.4
BasinMonthly828014.115.11013.215.813.7
BasinDJF207025.923.216.42346.530.6
BasinMAM207024.735.616.931.240.231.5
BasinJJA207024.228.516.724.42727.6
BasinSON207024.433.62125.940.521.5
0–800 mAnnual34522.224.115.74151.628.3
0–800 mMonthly414012.813.99151812.9
0–800 mDJF103526.819.210.822.546.928.1
0–800 mMAM103525.735.615.536.44223
0–800 mJJA103522.721.816.828.953.717.7
0–800 mSON103521.718.51524.12525.9
800–1600 mAnnual18425.345.823.824.835.233.9
800–1600 mMonthly220813.91613.212.615.314.3
800–1600 mDJF55226.424.225.12141.926
800–1600 mMAM5522227.219.128.138.133.9
800–1600 mJJA55221.640.428.624.324.223.2
800–1600 mSON55225.329.416.32329.327.4
>1600 mAnnual16136.591.218.450.648.159.2
>1600 mMonthly193216.720.29.712.815.614.9
>1600 mDJF4832459.118.328.230.347
>1600 mMAM48323.45325.223.948.444.1
>1600 mJJA48337.944.222.135.138.831.3
>1600 mSON48329.178.620.124.626.730.1
Disclaimer/Publisher’s Note: The statements, opinions and data contained in all publications are solely those of the individual author(s) and contributor(s) and not of MDPI and/or the editor(s). MDPI and/or the editor(s) disclaim responsibility for any injury to people or property resulting from any ideas, methods, instructions or products referred to in the content.