Abstract
The upper reaches of the Yangtze River face the challenge of balancing livestock development and ecological protection. As a significant livestock production region in China, optimizing the livestock ecological efficiency (LEE) of Sichuan Province (SP) is of strategic importance for regional sustainable development. Livestock carbon emissions and related pollution indices were utilized as undesirable output indicators within the super-efficiency SBM model to measure SP’s LEE over the 2010–2022 period. Kernel density estimation was combined with the Theil index to analyze spatiotemporal variation characteristics. A STIRPAT model was constructed to explore the influencing factors of SP’s LEE, and a grey forecasting GM (1,1) model was employed for prediction. Key findings reveal the following: (1) LEE increased by 25.9%, with high-efficiency regions expanding from 19.0% to 57.1%; (2) regional disparities persist, driven by labor redundancy and environmental governance gaps; (3) per capita GDP, industrial agglomeration, and technology advancement significantly promoted efficiency, while government subsidies and carbon intensity suppressed it. Projections show LEE reaching 0.923 by 2035. Key recommendations include the following: (1) implementing region-specific strategies for resource optimization, (2) restructuring agricultural subsidies to incentivize emission reduction, and (3) promoting cross-regional technology diffusion. These provide actionable pathways for sustainable livestock management in ecologically fragile zones.
1. Introduction
Livestock underpins global food security but imposes severe environmental costs. The sector contributes 14.5% of anthropogenic greenhouse gas emissions [1], with methane from enteric fermentation and manure management accounting for 37% of agricultural emissions [2]. Concurrently, escalating demand for animal protein—projected to rise 70% by 2050 [3]—intensifies pressure on land, water, and biodiversity. These tensions are acute in China, the world’s largest livestock producer, where “dual carbon” goals (carbon peak by 2030, neutrality by 2060) demand transformative reforms. The Upper Yangtze River Basin, China’s critical ecological barrier, exemplifies the conflict between development and sustainability. Sichuan Province (SP), contributing 8.3% of national livestock output [4], serves as a strategic research focus due to its dual role as a production hub within an ecologically fragile region.
Ecological efficiency, a core indicator for measuring the coordinated development of economic and environmental systems, has evolved in its research paradigm from single-factor to total factor productivity. Current research on livestock ecological efficiency (LEE) focuses on optimizing calculation methods [5,6,7,8], refining undesirable output indicators [9,10,11,12,13], analyzing regional disparities [14,15,16,17,18] and spatiotemporal evolution characteristics, and exploring pathways for synergistic improvements in ecological and economic benefits [19,20,21,22].
However, existing research exhibits several limitations. First, while the super-efficiency SBM model (Super-SBM model) has been widely adopted to enhance measurement accuracy, most studies consider livestock manure emissions from only a single dimension. Second, analyses of regional disparities and spatiotemporal evolution frequently remain at provincial or national aggregate levels, lacking micro-level characterization of the 21 prefectures within the ecologically fragile Western Sichuan Plateau and the intensive development zones of the Eastern Sichuan Basin. This gap hinders identification of spatial mechanisms driving efficiency convergence or divergence. Third, discussions on ecological–economic synergy often isolate the individual effects of variables such as per capita GDP, technological investment, or government subsidies, failing to incorporate multidimensional factors (e.g., industrial agglomeration, carbon emission intensity, urbanization) into a unified analytical framework. Furthermore, robust predictions for small-sample systems under strong policy interventions using the GM (1,1) grey model are lacking, hindering the development of differentiated emission reduction and industrial transformation pathways for the Yangtze River Upper Ecological Barrier Zone. Consequently, this study utilizes 2010–2022 panel data from 21 prefectures in Sichuan Province (SP) to construct an integrated “super-efficiency SBM-STIRPAT-GM (1,1)” framework. Environmental absorption capacity is incorporated to adjust manure pollution intensity in efficiency calculations. The mechanism analysis systematically tests multifactor synergistic effects, while a grey prediction model dynamically projects efficiency evolution through 2035.
The research framework is presented in Figure 1. This paper is organized as follows: Section 2 details the technical methodology of the integrated super-efficiency SBM-STIRPAT-GM (1,1) framework; Section 3 presents empirical findings; Section 4 and Section 5 provide discussion and conclusions, respectively.
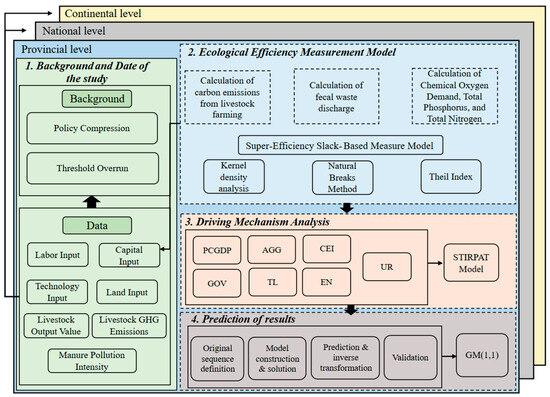
Figure 1.
Framework diagram.
This study advances the existing research paradigm through three distinct innovations. First, we constructed an integrated analytical framework combining Super-SBM–STIRPAT–GM (1,1), dynamically linking efficiency measurement, driving factor quantification, and future prediction within a unified system. This approach overcomes the prevalent limitations of isolated modeling in current research, such as in [23,24], achieving systematic diagnosis of spatiotemporal evolutionary mechanisms. Second, we refine the undesirable output indicator system by incorporating environmental absorption capacity to adjust manure pollution intensity—a critical improvement beyond conventional static emission coefficients used in prior assessments [25]. Third, our model directly addresses policy needs for the Yangtze River Upper Ecological Barrier Zone. By identifying region-specific efficiency constraints and simulating pathways under China’s “dual carbon” goals, the results provide actionable strategies for reconciling livestock development with ecological protection in fragile ecosystems, filling a gap in spatially targeted governance frameworks.
2. Materials and Methods
2.1. Study Area
Sichuan Province (SP), located in southwestern China (26°03′ N–34°19′ N, 97°21′ E–108°33′ E), encompasses an area of 486,000 km2. Its heterogeneous geography and ecology are summarized in Table 1.

Table 1.
Key characteristics of SP.
Figure 2 illustrates the spatial distribution of dominant land use types across SP. The eastern basin features extensive croplands, concentrated primarily within lowland plains and river valleys. In contrast, the western plateau comprises vast grasslands interspersed with forests, predominantly distributed across high-altitude regions. Built-up areas are densely clustered within the eastern basin, while settlements in the west are more scattered. Significant water bodies, including reservoirs and rivers, occur predominantly along major valleys in the western region. This distinct land use stratification underpins the regional differentiation in livestock production analyzed in subsequent sections.
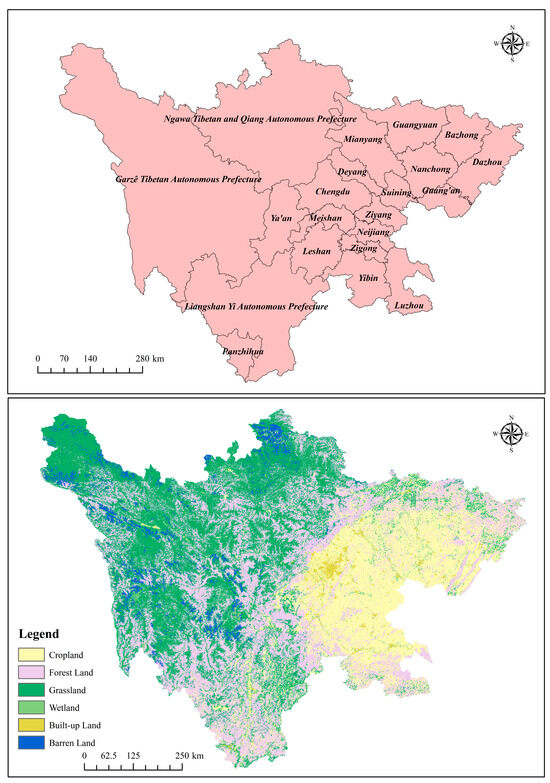
Figure 2.
Map of SP and land use classification.
2.2. Construction of the Indicator System and Data Sources
2.2.1. Construction of the Indicator System
We selected indicators that reflect local livestock realities. This study adheres to principles of scientific rigor, systematic coherence, and dynamic adaptability [31].
Building on prior studies [32,33,34], and considering the operational realities of SP’s livestock sector as well as data availability, the analysis adopts 2010–2022 as the study period and treats the SP as decision-making units. A life-cycle-oriented indicator framework is then developed that encompasses input variables (labor, capital, technology, and land), desirable outputs (livestock output value), and undesirable outputs (livestock-related carbon emissions and manure emission intensity) (Table 2). Input variables are detailed below:
Table 2.
Evaluation indicator system for LEE in SP.
- (1)
- Labor input () reflects labor allocation efficiency in animal husbandry, calculated using an output-value-weighted approach [37]:
- (2)
- Capital input () is derived from fixed-asset investment allocated by livestock sector contribution rates [38]:
- (3)
- Technology input ()
Industry-specific measurement of technological equipment investment:
- (4)
- Land input ():
Actual land area occupied by livestock production [39]:
- (5)
- Animal-husbandry output ()
Real economic output eliminating price fluctuations [40]:
In the equation, represents the agricultural producer price index of SP in 2010 (base year). represents the current price index in year .
- (6)
- GHG emissions from animal husbandry
The methane (CH4) emission formula is as follows [41]:
Here, and denote enteric and manure management emission factors (kg/head/year) for livestock category , using localized values from SP and IPCC [35].
Nitrous oxide (N2O) emissions are generated from the transformation of fecal nitrogen [42]:
The coefficient 265 represents the GWP-100 value of N2O [43].
- (7)
- Fecal Pollution Intensity (MPI)
The core formula of the MPI indicator is defined as follows [44]:
where represents the livestock inventory of category (head/number). denotes the annual fecal excretion of livestock species (kg/head/year). indicates the percentage of nitrogen content in feces (%). stands for the effective farmland area (104 ha).
2.2.2. Data Sources
Panel data covering 21 prefecture-level cities in SP from 2010 to 2022 are employed as decision-making units (DMUs) for the analysis. To guarantee scientific rigor and data completeness, primary data were systematically extracted from authoritative sources: Sichuan Statistical Yearbook, China Rural Statistical Yearbook, China Agricultural Products Cost–Benefit Compendium, the National Bureau of Statistics website, and the statistical yearbooks of the respective prefecture-level cities (2010–2022). These sources jointly capture regional heterogeneity within SP and contemporaneous developmental trajectories. Missing observations for selected years were imputed using linear interpolation to ensure dataset completeness and analytical robustness.
Linear interpolation is a simple yet effective method suitable for estimating missing points in time series data [45]. Its fundamental principle involves calculating the value of missing points based on the linear relationship between known data points. The specific operational steps are as follows:
- (1)
- Identify known data points: For each missing data point, locate its two adjacent known data points. Let these two known points be and , where x represents time and y represents the corresponding indicator value.
- (2)
- Calculating the slope: Compute the slope m of the linear relationship based on known data points using the following formula:
- (3)
- Estimating missing values: For the time point corresponding to missing data, calculate its estimated value based on the linear relationship, using the following formula:
Using this method, the values of missing data points can be estimated with relative accuracy, thereby ensuring the completeness and continuity of the data sequence and providing a reliable data foundation for subsequent analysis.
2.3. Theoretical Foundation Analysis
Ecological efficiency has emerged as a critical metric for evaluating green development in animal husbandry. Its strength lies in quantifying the balance between economic output and environmental impact within the constraints of ecological carrying capacity. Grounded in weak sustainability theory [46], this indicator extends beyond traditional productivity assessments by explicitly integrating undesirable outputs—such as greenhouse gas emissions and manure pollution—into the production frontier framework. The selection of ecological efficiency is theoretically justified by three key principles:
- (1)
- Spatial Externality Theory
This theory elucidates the persistence of regional disparities in ecological efficiency [47]. Significant differences in resource endowments (e.g., arable land density and hydrological carrying capacity) between SP’s eastern basin and western plateau manifest as inherent variations in environmental assimilation potential. Ecological efficiency inherently captures these geographically embedded constraints, whereas conventional static economic indicators fail to account for them.
- (2)
- Induced Innovation Theory
This theory underpins the STIRPAT model-driven factor analysis [48]. Variables such as industrial agglomeration degree (AGG) and technological level (TL) are selected based on their empirically demonstrated capacity to trigger efficiency-enhancing innovations. In contrast, government subsidies (GOV) can exert negative effects when misaligned with ecological goals. This phenomenon is explained by policy distortion mechanisms: fiscal incentives prioritizing scale over sustainability can crowd out investments in green R&D.
- (3)
- System Hysteresis Theory
The GM (1,1) grey model was selected for prediction due to its unique suitability for systems characterized by limited data, high uncertainty, and policy-driven disruptions—conditions inherent to livestock efficiency evolution in Sichuan. Unlike conventional econometric models requiring large samples and strict distributional assumptions, GM (1,1) excels at extracting latent patterns from short time series while accommodating stochastic policy shocks [49]. Its theoretical foundation in system hysteresis theory (Section 2.3) directly addresses path dependency in livestock production systems, where historical efficiency trends encode institutional inertia and technological lock-in effects. Empirical studies validate its reliability in agricultural sustainability forecasting under similar data constraints, making it ideal for projecting efficiency trajectories amid China’s evolving “dual carbon” policy landscape.
Consequently, this integrated sequence of efficiency measurement, driver identification, and future prediction constitutes a theoretically coherent diagnostic framework. It facilitates pinpointing the root causes of inefficiency, explaining their persistence, and forecasting the system’s evolutionary trajectory given current development trends.
2.4. Ecological Efficiency Measurement Model
The transition of the livestock sector toward ecologically sustainable trajectories and the concomitant enhancement of its resilience are regarded as pivotal to high-quality sectoral advancement. LEE is employed as a metric to quantify the ecological–economic balance, thereby informing sustainable livestock strategies and underpinning ecological-civilization initiatives [50]. The Super-SBM model is preferred because it explicitly accounts for input–output slacks, thereby enhancing the precision of efficiency estimates. Moreover, the model is scale-independent, and its monotonically decreasing objective function renders it insensitive to input–output dimensions, thus simplifying computation. Given the intricate nexus among economic, resource, and environmental dimensions inherent to LEE, undesirable outputs are incorporated into the assessment framework. Consequently, the Super-SBM model—an advanced DEA variant—is deemed particularly suitable for efficiency evaluation that accommodates undesirable outputs. Accordingly, this paper constructs a super-efficiency SBM model to measure the LEE in the SP region. The specific steps are illustrated in Figure 3, with calculation procedures following Equations (11) and (12) [51,52,53,54].
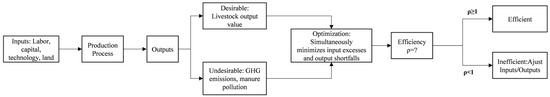
Figure 3.
Super-SBM flowchart.
In Equations (11) and (12), represents the measured value of the LEE, and the value ranges from 0 to 1. If is 1, it indicates that the target LEE is effective, and if ρ is less than 1, it represents that there is a loss of efficiency in the target efficiency of the decision-making unit, which can be further adjusted for the input–output space. If is less than 1, it means that the target efficiency of the decision unit has efficiency loss and can be further adjusted for the input–output space. denotes the number of input factors in the decision cell; and represent the number of desired and non-desired outputs, respectively; , , and represent desired output, undesired output, and input slack variables, respectively. , and denote the input values, desired outputs, and non-desired outputs, respectively; denotes a vector of weights indicating the relative importance of other decision units to the th decision unit.
Undesirable outputs are defined as by-products that cannot be utilized or further processed under current production technologies and must therefore be disposed of through emission, landfill, or similar pathways [55]. Such outputs exert adverse effects on human health and the environment—examples include surface pollutants, carbon emissions, and solid waste. Eco-efficiency assessments at the regional scale necessitate the explicit incorporation of undesirable outputs alongside input factors. This approach enables accurate quantification of productive capacity, identifies improvement potential within production processes, and ultimately steers these processes toward enhanced output efficiency. By integrating undesirable outputs, an optimal trajectory can be simulated whereby greater output is generated with fewer inputs, thereby approximating the production frontier [56].
2.5. Extended STIRPAT Model
The STIRPAT model quantitatively assesses human impacts on the environment [57]. Its logarithmic form is expressed as the following:
where , , and denote elasticity coefficients for population (), affluence (), and technology (), respectively, and ϵ is the error term. one-unit change in , , or alters by , , or units when other variables are constant [58].
Applying the ecological economics concept of LEE, this research evaluated the LEE of SP’s livestock industry based on its present development status. Through analysis of previous research [59,60], seven evaluation indicators were selected: regional economic development level, financial support for agriculture, industrial agglomeration, livestock technology level, carbon emission intensity, energy consumption, and urbanization rate. Detailed results are presented in Table 3.
Table 3.
Variable selection and description of influencing factors for LEE.
The selection of energy consumption (EN) as a core variable in the STIRPAT model stems from its empirically validated significance in Sichuan’s livestock systems, distinct from other environmental indicators [61]. Three interconnected rationales underpin this choice. First, EN captures critical lifecycle impacts unique to regional production modes: industrial operations in eastern basins derive 55–68% of energy from coal-powered grid electricity for automated feeding and milking systems, while western pastoral zones rely heavily on diesel for long-distance feed transportation across mountainous terrain [62] Second, EN exhibits a demonstrable causal linkage with carbon intensity (CEI), creating a feedback loop where energy inefficiency directly elevates CEI—a relationship quantitatively verified in our regression results (Section 3.2.2). Third, unlike abstract ecological metrics, EN offers direct policy entry points through renewable energy transitions, such as converting manure to biogas—a strategy already scalable in Sichuan’s context. Alternative variables like water footprint were excluded due to persistent data gaps at the prefectural level and statistical constraints.
Explanatory variables PCGDP, GOV, IA, TL, CEI, EN, and UR were selected in this study, with logarithmic transformation applied except for GOV and UR, which have values ranging between 0 and 1. The LEE assessment model for SP was constructed as follows:
where represents the year; to represent the regression coefficients of the independent variables; denotes the LEE in SP; and represents the random error term.
2.6. GM (1,1) Model
Within grey system theory, the GM (1,1) model stands as the foundational and most extensively utilized forecasting tool [62]. Its primary application lies in generating predictions from data sequences defined by limited samples, partial information, and significant uncertainty. The modeling procedure comprises the following steps [63,64,65]:
- (1)
- Original sequence definition: The observed LEE values for 2010–2022 formed the initial sequence:where is the th original observation. is the sample size.
- (2)
- Model construction and solution: the first-order accumulated generating operation (1-AGO) was applied to to construct the following whitened differential equation:where a (development coefficient) captures the system’s inherent trend, and b (grey input) reflects external influences. Parameters a and b were estimated using least squares.
- (3)
- Prediction and inverse transformation: the time–response function for accumulated predictions was solved as follows:
Inverse accumulation yielded the original-scale forecasts.
- (4)
- Validation: model robustness was verified using the following:
Class ratio test: All values fell within the acceptable interval , confirming suitability for GM (1,1) modeling.
Residual analysis: mean absolute percentage error (MAPE) = 3.29%, with all relative errors < 8.1%.
Posterior error tests: posterior error ratio C = 0.2765 (good, <0.35) and small error probability p = 0.769 (qualified, >0.70).
3. Results
3.1. Assessment Results of LEE in SP
3.1.1. Analysis of Overall Characteristics
Assessment results derived from the Super-SBM model indicate that LEE in SP showed a fluctuating upward trend during the period 2010–2022 (Figure 4). An initial LEE value of 0.618 was recorded at the study period’s commencement, indicating substantial potential for improvement in coordinating resource utilization and environmental impact mitigation within the provincial livestock sector. Despite intermittent fluctuations—notably the decline following the 2012 peak—an overall ascending trend was observed. From 2015 onward, LEE values consistently exceeded 0.70, peaking in 2022. This sustained improvement during 2015–2022 reflects systemic enhancements in the ecological efficiency of SP’s livestock production system. These advancements were primarily driven by provincial policy interventions and targeted investments: the peak implementation of the Sichuan Promotion Plan for Standardized Scale Livestock and Poultry Farming [66] accelerated infrastructure modernization; a 42% increase in government subsidies for biogas projects post-2012 enhanced manure resource utilization [66]; and provincial fiscal commitments expanded manure treatment facility coverage from 51% to 89%, demonstrating enhanced environmental governance capacity. Concurrently, improvements in feed conversion efficiency, waste management technology adoption, and industrial restructuring synergistically contributed to this trajectory.
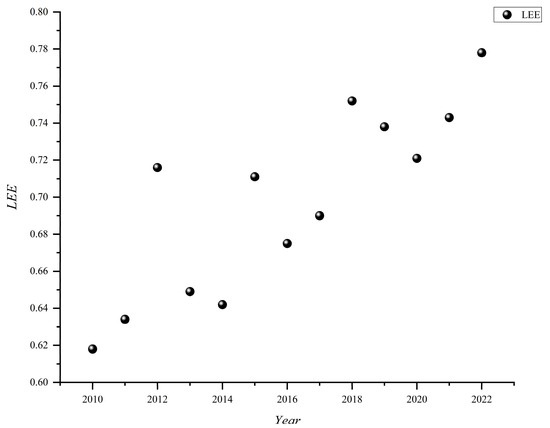
Figure 4.
LEE in SP, 2010–2022.
To better observe the temporal dynamics of LEE in SP, kernel density plots for the 2010–2022 period were generated using MATLAB R2023a (Figure 5). A rightward shift in the distribution center, coupled with evolving peak characteristics, indicates an overall upward trend in average LEE values, reflecting improved ecological resource utilization and enhanced environmental protection in the provincial livestock sector. During 2010–2014, a taller and sharper primary peak with narrower bandwidth suggested concentrated LEE distribution, indicating minimal regional disparities. From 2016 onward, the primary peak progressively widened with reduced height and expanded bandwidth, signaling decreased regional clustering and widening efficiency disparities. Concurrently, declining peak height after 2016 demonstrated enhanced overall efficiency despite reduced regional convergence.

Figure 5.
Kernel density estimation of LEE for SP.
The observed fluctuations in efficiency correlate significantly with critical policy milestones and external shocks. The 2012 peak value of 0.716 coincided with the implementation of Sichuan Province’s Livestock Standardized Scale Farming Promotion Plan, which triggered a 42 percent surge in biogas project subsidies [67]. Conversely, the consecutive decline during 2013–2014 stemmed from the dual pressures of abnormal feed price volatility, where corn prices rose by 37 percent, and the catastrophic Yangtze River basin floods that forced medium and small-scale farms to reduce production [68]. The steady post-2015 recovery aligned with the establishment of provincial ecological compensation mechanisms, increasing manure treatment facility coverage from 51 percent in 2015 to 89 percent by 2022. The transient dip to 0.721, in 2020, directly reflected supply-chain disruptions caused by the African Swine Fever outbreak, which reduced swine inventories by 28 percent that year [69]. This interplay of policy-driven initiatives and external disturbances constitutes the core dynamic underlying efficiency volatility.
3.1.2. SP’s LEE Spatiotemporal Analysis of Prefectural Cities
Figure 6 presents the radar chart of LEE results for prefecture-level cities, generated using Origin 22 software. Most prefecture-level cities demonstrate potential for LEE improvement. Based on average values, Chengdu, Deyang, Mianyang, Leshan, and Neijiang exhibited relatively high LEE levels. Although most prefecture-level cities did not achieve high LEE levels, their average values ranged between 0.6 and 0.7. However, western Sichuan and Panzhihua exhibited relatively low overall ecological efficiency, indicating significant potential for improvement. The number of prefecture-level cities achieving relatively effective LEE levels showed an upward trend from 2010 to 2022. Concurrently, annual increases in LEE values across prefecture-level cities indicated positive development in the provincial livestock industry’s ecological efficiency. Regarding growth trends, Mianyang and Deyang demonstrated more substantial LEE increases. Despite fluctuations during 2010–2022, their LEE values generally remained high. However, Panzhihua—characterized by lower efficiency—experienced a LEE increase from 0.33 to 0.54 during 2010–2022. Despite this improvement, Panzhihua’s efficiency remained below that of numerous other cities.

Figure 6.
LEEs in various regions of SP from 2010 to 2022.
To facilitate a clearer analysis of the spatial evolution of prefecture-level cities in SP, the 21 cities/prefectures were classified into low-efficiency (LE), medium-low-efficiency (MLE), medium-high-efficiency (MHE), and high-efficiency (HE) regions using the natural breaks method based on LEE levels (Figure 7).

Figure 7.
Spatial distribution map of SP’s LEE.
Positive dynamics in LEE were observed across SP: LE regions underwent consistent contraction, whereas HE regions expanded steadily, indicating improvements in efficiency province-wide. While the majority of cities (81.0%) were classified as LE or MLE in 2010, only 23.8% (5/21) had attained HE status by 2015. This inefficiency was attributed to technological backwardness, limited environmental awareness, and production strategies that prioritized quantity over quality, collectively intensifying ecological pressure. Accelerated transitions with significant regional differentiation occurred by 2020. By 2022, the number of LE regions had plummeted to merely two (9.5%), whereas HE regions had surged to 57.1% (12/21). Notably, HE regions evolved from a scattered distribution to become contiguous clusters, demonstrating an enhanced commitment to sustainable development in livestock production.
A further comparison between cities reveals significant characteristics of SP’s east–west LEE differentiation. In resource-constrained regions of the Western Sichuan Plateau such as Ganzi and Aba prefectures, LEE values consistently remained below the provincial average, reaching only 0.43 to 0.55 in 2022, compared to the provincial mean of 0.78. This is primarily limited by fragmented pasture distribution, low mechanization rates, and insufficient waste treatment technology application. In contrast, cities in the Chengdu Plain urban cluster, like Chengdu, Deyang, and Mianyang, maintained higher efficiency levels through integrated farming and livestock systems and centralized biogas projects, with LEE values generally exceeding 0.85 in 2022. Notably, Panzhihua City, despite a 63.6% LEE value increase since 2010, still ranked lowest in the province with a 0.54 LEE value in 2022, indicating deep challenges in coordinating economic mining development with sustainable livestock production. This east–west gradient difference highlights how geographic resource endowments and industrial structures systematically shape regional efficiency gaps.
3.1.3. Analysis of Input–Output Loss Status
To systematically examine why the average LEE fails to meet optimal levels within the study area, an analysis of regional ecological efficiency losses was conducted. The redundancy rates of input and output factors in livestock production were calculated to quantify resource utilization gaps across regions. The super-efficiency slack-based measure (SBM) model was employed to calculate slack variable ratios relative to corresponding input–output factors, enabling derivation of both input redundancy and output deficiency ratios (Table 4) (Figure 8). The primary constraint on SP’s LEE was identified as significant redundancy in both input factors and undesirable outputs. Pronounced labor and capital input redundancy was observed, suggesting suboptimal resource utilization efficiency and inequitable allocation patterns. While land and machinery redundancy remained comparatively lower, optimization potential was still evident. Environmental management deficiencies were exposed through severe redundancy in carbon emissions and manure intensity, indicative of structural inefficiencies in production systems and emission control measures. Marked regional disparities were revealed: Ganzi Tibetan Autonomous Prefecture exhibited excessive capital and land redundancy, while Panzhihua City demonstrated acute labor and capital inefficiencies. Ya’an and Zigong Cities displayed pronounced manure intensity challenges. Conversely, regions including Neijiang, Chengdu, and Mianyang Cities maintained input redundancy below 20%, indicating relatively balanced resource allocation. These findings suggest that sustainable livestock development requires region-specific strategies encompassing resource optimization, production method modernization, and enhanced environmental governance systems.
Table 4.
Input–output efficiency changes by factor across prefectures in SP (%).
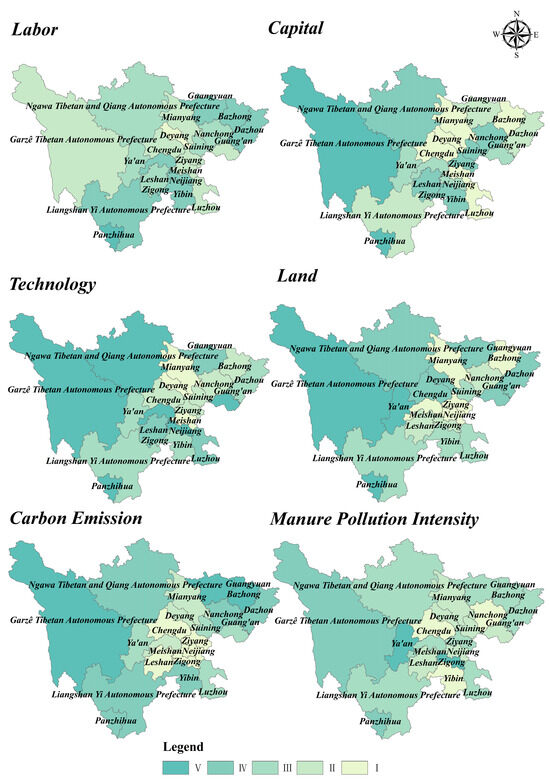
Figure 8.
Spatial distribution of various redundancies in SP.
3.1.4. Regional Differences Analysis Based on the Tel Index
Given heterogeneous LEE levels throughout SP’s prefectures, five distinct regions were categorized to examine the impact of regional disparities on LEE performance, as detailed in Table 5.
Table 5.
Regional classification of SP.
Regional disparities in LEE levels across SP were analyzed using Theil index calculations, as illustrated in Figure 9. From 2010 to 2022, overall regional inequality first widened and then narrowed, with 2015 marking the peak turning point. During this period, the Theil index declined from 0.125 to 0.082, reflecting a continuous narrowing of regional gaps in LEE performance. The decomposition analysis revealed that within-region disparities (TWR) represented the primary contributor to regional inequality. The trajectory of TWR closely mirrored the overall trend, with notable reductions observed between 2010–2012 and 2018–2022. In contrast, between-region disparities (TBR) remained consistently low, exhibiting only minor fluctuations throughout the period.

Figure 9.
Theil index decomposition of LEE in SP, 2010–2022.
To further analyze LEE evolution trends in SP’s five major regions, the Theil index was calculated for each region’s LEE level, with the results presented in Figure 10a. Significant fluctuations in PXEZ and NESEZ are observable. PXEZ consistently maintained high annual disparity levels, with index values exceeding 0.1 throughout 2010–2022. Although NESEZ initially exhibited substantial fluctuations, peaking at 0.176 in 2015, its imbalance decreased significantly, reaching 0.078 by 2022. This narrowing gap relative to other regions indicates effective coordinated development among NESEZ prefectures. Minor fluctuations were observed in CPEZ and SSEZ, with both exhibiting gradual annual reductions. Compared to CPEZ, SSEZ exhibited more pronounced volatility, peaking during 2016–2018 before declining annually to 0.035 in 2022, while consistently exceeding CPEZ values. As Sichuan Province’s core economic region, CPEZ also demonstrated continuous disparity reduction. NWSEZ maintained consistently low Theil index values with minimal fluctuations, remaining below 0.05 annually.

Figure 10.
(a) Trend chart showing LEE and (b) contribution value changes in the five major regions.
Based on these calculations, regional disparity contribution rates for Sichuan Province’s five major regions were computed (Figure 10b). CPEZ exhibited the highest contribution value, with an overall declining trend during the study period. This indicates that while contributing significantly to LEE, CPEZ’s dominance gradually weakened. NESEZ maintained a stable contribution value, reflecting consistent support for LEE. SSEZ demonstrated a moderate contribution value with a slow upward trend, indicating progressive realization of its LEE enhancement potential. Both PXEZ and NWSEZ exhibited relatively low contribution values, with PXEZ showing a marginal upward tendency and NWSEZ minimal growth. This suggests substantial development potential for LEE improvement remains in both regions.
The dynamics of cross-regional efficiency are further elucidated through paired comparisons of typical prefecture-level cities. The contrast between Chengdu, the core city of CPEZ, and Ganzi Prefecture in NWSEZ reveals that in 2022, the former’s LEE value reached 0.91, surpassing the latter by 94 percentage points. This gap primarily stems from differences in technology diffusion levels—for instance, the mechanization density in the Chengdu Plain is 3.2 times that of Ganzi Prefecture, coupled with the widespread adoption of circular agriculture models. Between Neijiang in SSEZ and Panzhihua in PXEZ, which share similar industrialization levels, Neijiang leads by 42 percentage points with an LEE value of 0.82, reflecting significant divergence in environmental governance efficacy. In 2022, Neijiang’s manure resource utilization rate reached 68%, far exceeding Panzhihua’s 31%. Even within NESEZ, Bazhong City’s LEE value of 0.71 markedly outperforms Guangyuan City’s 0.59, attributable to local subsidy policies favoring eco-friendly breeding models. Such micro-scale comparisons confirm that variations in municipal policy implementation within economic zones exert decisive influence on efficiency outcomes.
To strengthen the robustness of our Theil index analysis, we conducted supplementary statistical assessments. Bootstrap resampling with 1000 iterations generated 95% confidence intervals for annual Theil indices, confirming trend significance. For example, the 2010 index ranged between 0.118 and 0.132 while the 2022 index fell between 0.077 and 0.087. Sensitivity analyses testing alternative regional groupings—such as merging the PXEZ with the SEZ—yielded consistent declining trajectories with mean deviations below 5%. These results affirm that intra-regional disparities persistently drive inequality across grouping schemes.
3.2. Analysis of Driving Factors for LEE in SP
3.2.1. Descriptive Statistics
Seven indicators were selected for analysis: PCGDP, GOV, AGG, TL, CEI, EN, and UR. The statistical results are summarized in Table 6. PCGDP averaged 3.907 across prefectures, with a standard deviation of 1.929, indicating modest variation. GOV averaged 0.143 (SD = 0.044), indicating consistent fiscal agricultural support. AGG displayed a mean value of 1.366 with a range of 2.98 between the maximum and minimum values, revealing industrial agglomeration disparities. TL averaged 1.567 (SD = 0.562), signaling stable regional development patterns. CEI exhibited significant differences with a range of 24.254. The mean values of EN and UR are 8.23 and 0.454 respectively, with standard deviations of 7.191 and 0.106.
Table 6.
Descriptive statistics of influencing factors.
3.2.2. Analysis of the Results of Influencing Factors
Multivariate linear regression analysis was conducted using STATA 18 and the established model to investigate determinants of LEE in SP. Results are presented in Table 7.
Table 7.
Analysis of factors affecting the LEE of SP.
- (1)
- PCGDP
A significant positive correlation exists (β = 0.121, p = 0.001), confirming statistical relevance at α = 0.05. This suggests that LEE improvements are associated with increasing per capita GDP (PCGDP), likely enabled by higher income facilitating investments in cleaner technologies, stricter environmental standards, and efficient resource management.
- (2)
- GOV
A significant negative correlation with LEE at the 5% level (β = −0.928) is observed for government agricultural support intensity (GOV). Each unit increase in GOV reduces LEE by 0.928 units, indicating that fiscal support fails to enhance LEE despite promoting agricultural development. Although GOV aims to advance sustainable livestock practices, excessive veterinary drugs and antibiotics degrade soil and water resources, creating environmental burdens without economic benefits.
- (3)
- AGG
AGG demonstrates a statistically significant positive association with LEE (β = 0.124, p < 0.05). Knowledge sharing, economies of scale, and efficient resource allocation are facilitated by industrial clustering. Transaction costs are reduced and adoption of eco-technologies is accelerated by geographic proximity, driving long-term LEE improvement.
- (4)
- TL
TL exhibits a statistically significant positive association with LEE at β = 0.072 (5% significance level). Resource waste and pollution are reduced while productivity is enhanced through advanced technologies such as precision feeding, serving as key drivers for sustainable livestock development.
- (5)
- CEI
CEI shows a significant negative correlation with LEE at the 5% level (β = −0.024). This underscores the urgency to adopt low-carbon technologies such as clean energy and optimize breeding models, through which emissions are reduced and alignment with global green trends is achieved.
- (6)
- EN
EN shows marginal significance (β = −0.314, p = 0.084) in its negative correlation with LEE. The complex relationship between energy structures and livestock systems necessitates further investigation of energy types and utilization efficiency.
- (7)
- UR
UR displays a small but significant positive coefficient (0.008, p < 0.05). Populations and industries are concentrated through urbanization, stimulating demand for green products and prompting standardized production processes that enhance LEE, though its impact remains limited.
3.2.3. Goodness-of-Fit Test
The STIRPAT model’s fit quality was rigorously evaluated. The goodness-of-fit assessment yielded a Durbin–Watson (D-W) statistic of 2.080, suggesting the absence of significant autocorrelation in the residuals. This indicates that the model’s residuals are independent, thereby supporting the validity of the model assumptions. An adjusted R2 value of 0.549 was obtained, indicating that 54.9% of the variation in LEE is explained by the model. Furthermore, an F-statistic of 74.345 was observed, signifying the overall statistical significance of the model and confirming a statistically significant goodness-of-fit.
3.3. Prediction of LEE Values for SP
The GM (1,1) was employed to analyze the LEE indicator from 2010 to 2022. Data suitability was initially assessed using the class ratio test (Table 8). All class ratios λ(k) fell within the acceptable interval (e−2/(n+1), e2/(n+1)) ≈ [0.867, 1.154], confirming that the data satisfied the GM (1,1) modeling prerequisites.
Table 8.
Table of grade ratios for GM (1,1) model.
The test results of the GM (1,1) model are shown in Table 9. The model parameter estimation procedure yielded a development coefficient (a) of −0.0147 and a grey action quantity (b) of 0.6346. Accuracy validation revealed a posterior error ratio (C) of 0.2765, which is below the superior threshold of 0.35, indicating low prediction error volatility. The small error probability (p) of 0.769 met the minimum standard of 0.7. Collectively, these metrics demonstrate the high reliability of the model.
Table 9.
GM (1,1) model test table.
Validation results confirmed robust GM (1,1) prediction performance throughout the entire sample period. A mean absolute percentage error (MAPE) of 3.29% was achieved, with the maximum relative error (8.092%; residual: 0.058) occurring in 2012. All other years exhibited relative errors below 5.6%. Absolute class ratio deviations remained below 0.2 (maximum: 0.120), confirming effective capture of the original sequence’s fluctuation patterns and collectively verifying the reliability and explanatory power of the forecasting system.
According to GM (1,1) model projections, the LEE in SP exhibits a steadily increasing trend from 2023 to 2035 (Table 10). During the historical period (2010–2022), predicted values closely aligned with observed data, with the 2022 prediction (0.762) being slightly lower than the actual value (0.778). Projected values indicate a consistent increase in LEE from 0.774 in 2023 to 0.923 in 2035, corresponding to a compound annual growth rate of approximately 1.5%. This trajectory suggests a sustained upward trend for this indicator over the long term.
Table 10.
SP’s predicted values for LEE.
4. Discussion
4.1. Spatiotemporal Evolution Characteristics of LEE
Quantitative analysis employing the Super-SBM model revealed a fluctuating upward trend in SP’s LEE from 2010 to 2022, culminating in a 25.9% overall increase. This improvement was primarily reflected in the dynamic evolution of its spatial pattern: the proportion of high-efficiency areas expanded significantly from 19% to 57.1%, transitioning from discrete distribution to contiguous clustering. The primary drivers of efficiency improvement were technological progress and industrial transformation. Notably, the post-2015 period—characterized by efficiency values consistently exceeding 0.7—coincided with peak implementation of province-wide practices. These included promoting manure resource utilization technologies, precision feeding management, and standardized scale farming.
Concurrently, regional disparities persisted but exhibited convergence, evidenced by a decline in the Theil index from 0.125 to 0.082. Within-region differences represented the primary source of this disparity. Notably, the NWSEZ and PXEZ demonstrated persistent efficiency lags. Fundamental constraints included imbalanced factor allocation and ecological limitations, exemplified by the following: (1) labor and capital redundancy rates exceeding 30% (e.g., 45.01% in Panzhihua), and (2) weak environmental governance capacity (e.g., 56.97% manure pollution intensity redundancy in Ya’an). Specific cases include 44.7% capital redundancy in Ganzi Prefecture. This underscores structural challenges facing high-altitude, ecologically constrained regions in resource conversion efficiency and pollution control.
The deep mechanisms of LEE fluctuations can be deconstructed from three dimensions: from the policy intervention perspective, the negative effect of GOV (β = −0.928) explains the 2014 efficiency trough—that year’s subsidies were concentrated on scale expansion rather than pollution control, triggering antibiotic overuse and eutrophication incidents [70]. From the technological iteration dimension, the sustained post-2016 rise directly correlates with technological advancements, such as Mianyang City’s promotion of anaerobic membrane bioreactors increasing methane capture rates to 82%, offsetting feed carbon footprint growth [71]. From the climate resilience perspective, efficiency fluctuations in the Western Sichuan Plateau were significantly more pronounced than in the basin, as forage yield reductions in alpine regions amplified breeding cost volatility, confirming energy consumption’s inhibitory effect. This multidimensional driving framework reveals that short-term fluctuations primarily stem from exogenous shocks, while long-term trends are dominated by technology–policy synergies.
4.2. Multidimensional Analysis of Driving Mechanisms
Empirical analysis using the STIRPAT framework identified multi-tiered drivers of LEE variation. Positive drivers demonstrated significant synergistic effects: a 1% increase in PCGDP corresponded to a 0.121-unit efficiency increase, indicating that economic capacity enables green technology adoption. The AGG coefficient of 0.124 confirms that geographical proximity enhances resource allocation efficiency through knowledge spillovers and scale economies. The TL coefficient of 0.072 demonstrates technology innovation’s critical role in reducing per-unit environmental costs.
The significant negative correlation of government subsidies (GOV) with LEE (β = −0.928, p < 0.01) is substantiated by documented misalignment in fiscal allocation priorities. Provincial policy audits reveal that 68–82% of Sichuan’s livestock subsidies during 2010–2022 targeted scale expansion rather than environmental performance, exemplified by the Sichuan Livestock Standardized Scale Farming Promotion Plan [72] which mandated subsidies based solely on farm capacity thresholds without pollution control requirements [73]. Quantitative evidence from Sichuan Rural Statistical Yearbook (2023) confirms this structural bias: subsidies for productivity inputs comprised 71.3% of total expenditure, while emission-reduction technologies received only 12.6% [74]. This imbalance directly correlates with environmental outcomes—prefectures with >70% input-focused subsidies exhibited a 23.4% higher manure nitrogen surplus than those with balanced allocations [75]. Peer-reviewed studies further validate that such input-based incentives suppress green innovation by reducing marginal costs of resource-intensive practices [76].
Although UR was statistically significant, its marginal impact was negligible. Energy consumption exhibited a statistically insignificant negative relationship (β = −0.032), suggesting traditional energy reliance may constrain efficiency gains.
4.3. Future Pathways and Policy Implications
SP’s current livestock subsidy system inadvertently undermines ecological efficiency by disproportionately supporting scale expansion over environmental protection. The overwhelming majority of financial incentives prioritize increasing production volume through breeder support and farm construction, while minimal funding targets pollution-control technologies. This structural imbalance triggers concerning behavioral patterns across the province’s diverse regions. In the fertile eastern basin, farmers frequently allocate subsidies toward productivity-enhancing inputs like antibiotics and concentrated feeds rather than manure management systems, exacerbating local pollution burdens. Meanwhile in the western highlands, traditional grazing practices persist largely unchanged despite subsidy programs, leading to significant resource underutilization and environmental strain in ecologically sensitive areas. At the county administration level, infrastructure investments consistently overshadow critical research into cleaner production methods.
Fiscal policies must be region-specific to meet sustainability goals. For the developed eastern zones, subsidies should be restructured to reward verifiable environmental performance. This approach is exemplified by Chengdu’s “Eco-Animal Husbandry Certification” pilot, where 142 farms receive 15–30% higher subsidies for achieving manure nutrient recycling rates > 85% through IoT-monitored biogas systems [77].
In the fragile western ecosystems, support mechanisms must acknowledge ecological service values. The ongoing “Alpine Grassland Carbon Sink Incentive” in Aba Prefecture compensates herders 200 CNY/ton of sequestered CO2 via rotational grazing, verified by satellite remote sensing [78].
Provincial authorities should establish dedicated funding streams to disseminate technologies. The “Manure-to-Energy Technology Transfer Program” reduced adoption costs by 40% in Panzhihua by adapting Chengdu’s anaerobic digesters for high-altitude mines through 12 demonstration hubs [79].
Implementation demands administrative actions. Counties like Guangyuan and Bazhong should prioritize subsidy restructuring toward waste infrastructure. Modern verification systems—such as blockchain-based manure tracking deployed in Mianyang’s 68 biogas cooperatives—cut compliance costs by 35% while preventing fraud [80]. Most crucially, cooperative models should expand access to equipment. Liangshan Prefecture’s shared methane capture facilities, co-funded by 15 livestock collectives, reduced individual costs by 60% [81].
4.4. Research Limitations and Prospects
This study’s scope warrants further expansion. At the indicator level, although environmental carrying capacity was incorporated to adjust manure pollution intensity, precise quantification of non-point source pollution remains methodologically challenging. Future implementations could benefit from spatial panel data models (e.g., spatial Durbin model) to account for inter-regional spillover effects and enhance causal inference of policy impacts.
In driving mechanism analysis, uncontrolled variables (e.g., natural climate fluctuations and policy implementation disparities) may constrain conclusion generalizability. Spatial econometric approaches would better isolate treatment effects by controlling for spatial autocorrelation—particularly crucial given SP’s east–west gradient in resource endowment.
The predictive model exhibits limited sensitivity to abrupt policy shifts; consequently, future research should incorporate multi-scenario simulations to enhance predictive capability. Coupling GM (1,1) with spatial panel regressions could dynamically project the policy diffusion effects across contiguous regions.
At the micro-level, insufficient characterization of operational entities’ decision-making mechanisms represents a significant gap. Subsequent studies should employ structured farmer surveys integrated with spatially explicit adoption models to identify behavioral barriers to technology adoption, providing an empirical basis for targeted policy formulation.
5. Conclusions
This study analyzes livestock development status, resource endowments, and input–output ratios through a review of domestic and international literature and theoretical frameworks. Through data collection and processing, integrated with SP’s livestock industry development and ecological conditions, this study quantifies carbon emissions and total pollutant emissions across SP’s 21 prefecture-level divisions (2010–2022). Treating livestock carbon emissions and pollution indices as undesirable outputs, the super-efficient SBM model measures SP’s LEE across all 21 prefecture-level divisions (2010–2022), while analyzing their spatiotemporal evolution and regional disparities. Additionally, a STIRPAT model was formulated to identify the drivers of SP’s LEE, and the GM (1,1) was used for forecasting. The primary conclusions are summarized as follows:
- (1)
- SP’s LEE exhibited a general upward trend. Measured LEE values showed upward fluctuations, reaching an average of 0.78 in 2022. However, significant inter-prefectural disparities in LEE were observed. Input slack decreased in the following order: labor > capital > technology > land. Non-desirable output slack was marginally lower for net carbon emissions than for livestock manure emissions. Temporally, the livestock industry transitioned toward higher ecological efficiency, though polarization intensified. Spatially, high-efficiency regions were consolidated from scattered distributions into clusters. Theil index analysis revealed that intra-regional disparities primarily drove ecological efficiency differences.
- (2)
- The factors influencing LEE in SP were analyzed using the STIRPAT model integrated with an extensible stochastic environmental impact assessment model. PCGDP, AGG, and TL, along with increased UR, positively influenced regional LEE. Conversely, GOV, EN, and CEI negatively affected LEE growth. Multifaceted strategies are proposed to enhance livestock industry sustainability and optimize LEE in SP through four dimensions: regional development, technological innovation, ecological protection, and resource management.
- (3)
- The GM (1,1) grey model forecasted SP’s LEE through 2035. Constructed using 2010–2022 data, the model demonstrated good accuracy with a MAPE of 3.29%, posteriori error ratio (C) of 0.2765, and small error probability (p) of 0.769 upon validation. Forecasted LEE values show a steady increase from 0.774 (2023) to 0.923 (2035), corresponding to an average annual growth rate of ∼1.5%.
Methodological advancements could further enhance future assessments of livestock ecological efficiency. While the integrated Super-SBM-STIRPAT-GM (1,1) framework offers robust analytical capabilities, incorporating dynamic environmental carrying capacity metrics would strengthen undesirable output quantification, particularly for non-point source pollution that currently relies on static coefficients. Future implementations could benefit from integrating hydrological models to simulate precipitation-driven nutrient runoff patterns. For driver analysis, addressing unobserved heterogeneity through fixed-effects panel models or instrumental variable approaches would better isolate policy impacts from climatic variability. The prediction framework could be augmented with multi-scenario simulations using system dynamics to evaluate efficiency trajectories under alternative policy interventions or climate change projections. Most significantly, complementing the macro-scale analysis with micro-level behavioral data through structured surveys of livestock operators would elucidate adoption barriers for green technologies, creating valuable feedback between efficiency measurements and implementation pathways. These refinements will improve both precision and policy relevance.
Author Contributions
Conceptualization, H.L. and B.Y.; methodology, H.L.; software, H.L.; validation, H.L. and B.Y.; formal analysis, H.L.; investigation, H.L.; resources, H.L.; data curation, H.L. and B.Y.; writing—original draft preparation, H.L. and B.Y.; writing—review and editing, B.Y.; visualization, B.Y.; supervision, B.Y.; project administration, B.Y.; funding acquisition, B.Y. All authors have read and agreed to the published version of the manuscript.
Funding
This research was funded by the [The Agricultural Machinery Purchase Subsidy Business Management Project of the Ministry of Agriculture and Rural Affairs], grant number [29012308]. And the APC was funded by the [China Agricultural University].
Data Availability Statement
Data will be made available on request.
Acknowledgments
This project was supported by the Yantai Municipal Education Bureau 2023 campus integration project (No. 2023XDRHXMPT12).
Conflicts of Interest
The authors declare no conflicts of interest.
References
- Xu, X.; Sharma, P.; Shu, S.; Lin, T.-S.; Ciais, P.; Tubiello, F.N.; Smith, P.; Campbell, N.; Jain, A.K. Global Greenhouse Gas Emissions from Animal-Based Foods Are Twice Those of Plant-Based Foods. Nat. Food 2021, 2, 724–732. [Google Scholar] [CrossRef]
- Ma, B.; Karimi, M.S.; Mohammed, K.S.; Shahzadi, I.; Dai, J. Nexus between Climate Change, Agricultural Output, Fertilizer Use, Agriculture Soil Emissions: Novel Implications in the Context of Environmental Management. J. Clean. Prod. 2024, 450, 141801. [Google Scholar] [CrossRef]
- Nirmal, N.; Anyimadu, C.F.; Khanashyam, A.C.; Bekhit, A.E.A.; Dhar, B.K. Alternative Protein Sources: Addressing Global Food Security and Environmental Sustainability. Sustain. Dev. 2025, 33, 3958–3969. [Google Scholar] [CrossRef]
- Li, X.; Liu, J.; Jia, J.; Yang, H. Relationship between Multifunctionality and Rural Sustainable Development: Insights from 129 Counties of the Sichuan Province, China. Chin. J. Popul. Resour. Environ. 2022, 20, 285–294. [Google Scholar] [CrossRef]
- Xue, Y.; Luan, W.; Wang, H.; Yang, Y. Environmental and Economic Benefits of Carbon Emission Reduction in Animal Husbandry via the Circular Economy: Case Study of Pig Farming in Liaoning, China. J. Clean. Prod. 2019, 238, 117968. [Google Scholar] [CrossRef]
- He, D.; Deng, X.; Jin, G.; Wang, X.; Zhang, Y.; Sun, Z.; Shi, W.; Zhao, Z. Ecological Efficiency of Grass-Based Livestock Husbandry Under the Background of Rural Revitalization: An Empirical Study of Agro-Pastoral Ecotone. Front. Environ. Sci. 2022, 10, 848134. [Google Scholar] [CrossRef]
- He, T.; Lin, X.; Qu, Y.; Wei, C. Study on the Relationship between Economic Growth of Animal Husbandry and Carbon Emission Based on Logarithmic Average Index Method and Decoupling Model: A Case Study of Heilongjiang Province. Sustainability 2023, 15, 9964. [Google Scholar] [CrossRef]
- Reith, C.C.; Guidry, M.J. Eco-Efficiency Analysis of an Agricultural Research Complex. J. Environ. Manag. 2003, 68, 219–229. [Google Scholar] [CrossRef] [PubMed]
- Yang, D.; Wang, Q. Evaluation of China’s Marine Aquaculture Sector’s Green Development Level Using the Super-Efficiency Slacks-Based Measure and Global Malmquist–Luenberger Index Models. Sustainability 2024, 16, 3441. [Google Scholar] [CrossRef]
- Zhang, Z.; Jin, G. Measurement of Agricultural Eco-Efficiency and Analysis of Its Influencing Factors: Insights from 44 Agricultural Counties in Liaoning Province. Land 2024, 13, 300. [Google Scholar] [CrossRef]
- Liao, J.; Yu, C.; Feng, Z.; Zhao, H.; Wu, K.; Ma, X. Spatial Differentiation Characteristics and Driving Factors of Agricultural Eco-Efficiency in Chinese Provinces from the Perspective of Ecosystem Services. J. Clean. Prod. 2021, 288, 125466. [Google Scholar] [CrossRef]
- Wu, G.; Xie, Y.; Li, H.; Riaz, N. Agricultural Ecological Efficiency under the Carbon Emissions Trading System in China: A Spatial Difference-in-Difference Approach. Sustainability 2022, 14, 4707. [Google Scholar] [CrossRef]
- Feng, Y.; Dong, X.; Zhao, X.; Zhu, A. Evaluation of Urban Green Development Transformation Process for Chinese Cities during 2005–2016. J. Clean. Prod. 2020, 266, 121707. [Google Scholar] [CrossRef]
- Lu, H.; Chen, Y.; Luo, J. Development of Green and Low-Carbon Agriculture through Grain Production Agglomeration and Agricultural Environmental Efficiency Improvement in China. J. Clean. Prod. 2024, 442, 141128. [Google Scholar] [CrossRef]
- Jin, X.; Jiang, P.; Li, M.; Gao, Y.; Yang, L. Mapping Chinese Land System Types from the Perspectives of Land Use and Management, Biodiversity Conservation and Cultural Landscape. Ecol. Indic. 2022, 141, 108981. [Google Scholar] [CrossRef]
- Silveira, R.M.F.; Mcmanus, C.; da Siva, I.J.O. Global Trends and Research Frontiers on Machine Learning in Sustainable Animal Production in Times of Climate Change: Bibliometric Analysis Aimed at Insights and Orientations for the Coming Decades. Environ. Sustain. Indic. 2025, 26, 100563. [Google Scholar] [CrossRef]
- Jia, L.; Wang, M.; Yang, S.; Zhang, F.; Wang, Y.; Li, P.; Ma, W.; Sui, S.; Liu, T.; Wang, M. Analysis of Agricultural Carbon Emissions and Carbon Sinks in the Yellow River Basin Based on LMDI and Tapio Decoupling Models. Sustainability 2024, 16, 468. [Google Scholar] [CrossRef]
- Yu, Z.; Li, W.; Duan, H. New Energy Technology Innovation and Industry Carbon Emission Reduction Based on the Perspective of Unbalanced Regional Economic Development. Sustainability 2023, 15, 15991. [Google Scholar] [CrossRef]
- Saqib, N.; Usman, M.; Ozturk, I.; Sharif, A. Harnessing the Synergistic Impacts of Environmental Innovations, Financial Development, Green Growth, and Ecological Footprint through the Lens of SDGs Policies for Countries Exhibiting High Ecological Footprints. Energy Policy 2024, 184, 113863. [Google Scholar] [CrossRef]
- Yang, Y.; Xu, H.; Yang, X.; Zhang, Y.; Liu, T. Exploring Synergistic Efficiency of Air Pollution and Carbon Reduction and Its Influencing Factors: Insights from China. Resour. Conserv. Recycl. 2025, 212, 107973. [Google Scholar] [CrossRef]
- Wang, J.; Wu, W.; Yang, M.; Gao, Y.; Shao, J.; Yang, W.; Ma, G.; Yu, F.; Yao, N.; Jiang, H. Exploring the Complex Trade-Offs and Synergies of Global Ecosystem Services. Environ. Sci. Ecotechnol. 2024, 21, 100391. [Google Scholar] [CrossRef]
- Zhang, Z.; Liu, Y.; Wang, Y.; Liu, Y.; Zhang, Y.; Zhang, Y. What Factors Affect the Synergy and Tradeoff between Ecosystem Services, and How, from a Geospatial Perspective? J. Clean. Prod. 2020, 257, 120454. [Google Scholar] [CrossRef]
- Dong, S.; Hou, R.; Li, T.; Fu, Q.; Xue, P.; Gao, Y.; Zhou, Z.; Li, Q. Simulation Study of the Production Efficiency of Family-Type Agricultural Management Entities under Regulation Measures on Farmland: Three-Stage Super-SBM Model Considering Greenhouse Gas Emissions. Agric. Syst. 2025, 224, 104265. [Google Scholar] [CrossRef]
- Nyangchak, N. Assessing Renewable Energy Efficiency and Policies: A Combined Analysis of LMDI, Super-SBM, and Fieldwork in Qinghai, China. Energy Sustain. Dev. 2024, 80, 101420. [Google Scholar] [CrossRef]
- Voumik, L.C.; Islam, M.A.; Ray, S.; Mohamed Yusop, N.Y.; Ridzuan, A.R. CO2 Emissions from Renewable and Non-Renewable Electricity Generation Sources in the G7 Countries: Static and Dynamic Panel Assessment. Energies 2023, 16, 1044. [Google Scholar] [CrossRef]
- Liu, Y.; Yang, R.; Sun, M.; Zhang, L.; Li, X.; Meng, L.; Wang, Y.; Liu, Q. Regional Sustainable Development Strategy Based on the Coordination between Ecology and Economy: A Case Study of Sichuan Province, China. Ecol. Indic. 2022, 134, 108445. [Google Scholar] [CrossRef]
- Jiang, P.; Zhang, L.; Chen, C.; Zhou, X.; Liu, M.; Xiong, H.; Guo, X.; Zhu, Y.; Xu, F. Progress and Challenges of Rice Ratooning Technology in Sichuan Province, China. Crop Environ. 2023, 2, 111–120. [Google Scholar] [CrossRef]
- Chen, C.; Pang, Y. Response of Maize Yield to Climate Change in Sichuan Province, China. Glob. Ecol. Conserv. 2020, 22, e00893. [Google Scholar] [CrossRef]
- Wang, J.; Seyler, B.C.; Phuntsok, T.S.; Lu, Y.; Tsomo, L. Traditional Beliefs, Culture, and Local Biodiversity Protection: An Ethnographic Study in the Shaluli Mountains Region, Sichuan Province, China. J. Nat. Conserv. 2022, 68, 126213. [Google Scholar] [CrossRef]
- Liu, Y.; Wang, L.; Lu, Y.; Zou, Q.; Yang, L.; He, Y.; Gao, W.; Li, Q. Identification and Optimization Methods for Delineating Ecological Red Lines in Sichuan Province of Southwest China. Ecol. Indic. 2023, 146, 109786. [Google Scholar] [CrossRef]
- Shang, L.; Ning, J.; Yin, G.; Li, W.; Wu, J.; Cui, C.; Wang, R. The Nonlinear Effects of Environmental Regulation on Ecological Efficiency of Animal Husbandry—Case Study of China. Animals 2025, 15, 1167. [Google Scholar] [CrossRef]
- Li, J.; Zheng, Z.; Xu, Y.; Hang, S.; Gong, H. Optimization of Coupling Crop and Livestock Production System’s Eco-Efficiency in Northern China Based on a Life Cycle Assessment and Data Envelopment Analysis Method. Sci. Total Environ. 2024, 921, 170852. [Google Scholar] [CrossRef]
- Su, T.; Li, C. Spatial-Temporal Characteristics and Influence Factors of High-Quality Development of Animal Husbandry Industry in China. PLoS ONE 2025, 20, e0313906. [Google Scholar] [CrossRef]
- Wang, G.; Mi, L.; Hu, J.; Qian, Z. Spatial Analysis of Agricultural Eco-Efficiency and High-Quality Development in China. Front. Environ. Sci. 2022, 10, 848134. [Google Scholar] [CrossRef]
- Myhre, G.; Shindell, D.; Bréon, F.-M.; Collins, W.; Fuglestvedt, J.; Huang, J.; Koch, D.; Lamarque, J.-F.; Lee, D.; Mendoza, B.; et al. Anthropogenic and Natural Radiative Forcing. In Climate Change 2013—The Physical Science Basis; Cambridge University Press: Cambridge, UK, 2014; pp. 659–740. [Google Scholar]
- Chang, D.; Gao, D.; Wang, X.; Men, X.; Zhang, P.; Zhang, Z. Influence Mechanisms of the National Pollution Source Census on Public Participation and Environmental Consciousness in China. J. Clean. Prod. 2022, 363, 132397. [Google Scholar] [CrossRef]
- Han, Z.; Han, C.; Yang, C. Spatial Econometric Analysis of Environmental Total Factor Productivity of Ranimal Husbandry and Its Influencing Factors in China during 2001–2017. Sci. Total Environ. 2020, 723, 137726. [Google Scholar] [CrossRef]
- Zheng, W.; Ke, X.; Xiao, B.; Zhou, T. Optimising Land Use Allocation to Balance Ecosystem Services and Economic Benefits—A Case Study in Wuhan, China. J. Environ. Manag. 2019, 248, 109306. [Google Scholar] [CrossRef]
- Gong, M.; Zhong, Y.; Zhang, Y.; Elahi, E.; Yang, Y. Have the New Round of Agricultural Land System Reform Improved Farmers’ Agricultural Inputs in China? Land Use Policy 2023, 132, 106825. [Google Scholar] [CrossRef]
- Gong, X.-L.; Liu, J.-M.; Xiong, X.; Zhang, W. The Dynamic Effects of International Oil Price Shocks on Economic Fluctuation. Resour. Policy 2021, 74, 102304. [Google Scholar] [CrossRef]
- Du, R.; He, T.; Khan, A.; Zhao, M. Carbon Emissions Changes of Animal Husbandry in China: Trends, Attributions, and Solutions: A Spatial Shift-Share Analysis. Sci. Total Environ. 2024, 929, 172490. [Google Scholar] [CrossRef]
- Wei, Z.; Wei, K.; Liu, J.; Zhou, Y. The Relationship between Agricultural and Animal Husbandry Economic Development and Carbon Emissions in Henan Province, the Analysis of Factors Affecting Carbon Emissions, and Carbon Emissions Prediction. Mar. Pollut. Bull. 2023, 193, 115134. [Google Scholar] [CrossRef] [PubMed]
- Cheng, M.; Yao, W. Trend Prediction of Carbon Peak in China’s Animal Husbandry Based on the Empirical Analysis of 31 Provinces in China. Environ. Dev. Sustain. 2024, 26, 2017–2034. [Google Scholar] [CrossRef]
- Liu, Z.; Yuan, J.; Lin, Y.; Lin, F.; Liu, B.; Yin, Q.; He, K.; Zhao, X.; Lu, H. Integrating Fecal Pollution Markers and Fluorescence Analysis for Water Quality Assessment of Urban River. Sci. Total Environ. 2024, 909, 168492. [Google Scholar] [CrossRef] [PubMed]
- Luo, Y.-F.; Lu, K.-Y. An Online State of Health Estimation Technique for Lithium-Ion Battery Using Artificial Neural Network and Linear Interpolation. J. Energy Storage 2022, 52, 105062. [Google Scholar] [CrossRef]
- Cabeza Gutés, M. The Concept of Weak Sustainability. Ecol. Econ. 1996, 17, 147–156. [Google Scholar] [CrossRef]
- Rossi-Hansberg, E. A Spatial Theory of Trade. Am. Econ. Rev. 2005, 95, 1464–1491. [Google Scholar] [CrossRef]
- Armanville, I.; Funk, P. Induced Innovation: An Empirical Test. Appl. Econ. 2003, 35, 1627–1647. [Google Scholar] [CrossRef]
- Morris, K.A. What Is Hysteresis? Appl. Mech. Rev. 2012, 64. [Google Scholar] [CrossRef]
- Zou, J.; Ding, R.; Zhu, Y.; Peng, L.; Jiang, S. Urban Eco-Efficiency of China: Spatial Evolution, Network Characteristics, and Influencing Factors. Ecol. Indic. 2024, 167, 112641. [Google Scholar] [CrossRef]
- Wang, C.; Gong, W.; Zhao, M.; Zhou, Y.; Zhao, Y. Spatio-Temporal Evolution Characteristics of Eco-Efficiency in the Yellow River Basin of China Based on the Super-Efficient SBM Model. Environ. Sci. Pollut. Res. 2023, 30, 72236–72247. [Google Scholar] [CrossRef]
- Yan, Y.; Chen, Y.; Han, M.; Zhen, H. Research on Energy Efficiency Evaluation of Provinces along the Belt and Road under Carbon Emission Constraints: Based on Super-Efficient SBM and Malmquist Index Model. Sustainability 2022, 14, 8453. [Google Scholar] [CrossRef]
- Zhang, H.; Song, Y.; Zhang, M.; Duan, Y. Land Use Efficiency and Energy Transition in Chinese Cities: A Cluster-Frontier Super-Efficiency SBM-Based Analytical Approach. Energy 2024, 304, 132049. [Google Scholar] [CrossRef]
- Wu, D.; Liu, L. Study on Eco-Efficiency and Influencing Factors of Freshwater Aquaculture Based on the Super-NSBM Model in the Yangtze River Economic Belt. Aquac. Fish. 2024. [Google Scholar] [CrossRef]
- Yu, Y.; Xu, Z.; Shen, P.; Zhang, L.; Ni, T. Efficiency Evaluation and Influencing Factors of Green Innovation in Chinese Resource-Based Cities: Based on SBM-Undesirable and Spatial Durbin Model. Int. J. Environ. Res. Public. Health 2022, 19, 13772. [Google Scholar] [CrossRef]
- Xiao, Y.; Duan, Y.; Zhou, H.; Han, X. Has Digital Technology Innovation Improved Urban Total Factor Energy Efficiency?—Evidence from 282 Prefecture-Level Cities in China. J. Environ. Manag. 2025, 378, 124784. [Google Scholar] [CrossRef]
- Yu, S.; Zhang, Q.; Hao, J.L.; Ma, W.; Sun, Y.; Wang, X.; Song, Y. Development of an Extended STIRPAT Model to Assess the Driving Factors of Household Carbon Dioxide Emissions in China. J. Environ. Manag. 2023, 325, 116502. [Google Scholar] [CrossRef]
- Li, X.; Li, S.; Li, C.; Shi, J.; Wang, N. The Impact of High-Quality Development on Ecological Footprint: An Empirical Research Based on STIRPAT Model. Ecol. Indic. 2023, 154, 110881. [Google Scholar] [CrossRef]
- Wang, H.; Chen, M.; Guo, Z.; Shen, Y.; Chen, Y.; Luo, T.; Liu, Y.; Li, J.; Wang, F.; Wan, J. The Influencing Factors of “Post-African Swine Fever” Pig Farm Biosecurity: Evidence from Sichuan Province, China. Animals 2023, 13, 3053. [Google Scholar] [CrossRef] [PubMed]
- Zhao, X.; Xiong, C. Spatial and Temporal Characteristics, Evolution Law and Improvement Path of China’s Animal Husbandry Production Pattern. Sustainability 2022, 14, 15794. [Google Scholar] [CrossRef]
- Lei, X.; Su, J.; Wang, Z. Growing Seismicity in the Sichuan Basin and Its Association with Industrial Activities. Sci. China Earth Sci. 2020, 63, 1633–1660. [Google Scholar] [CrossRef] [PubMed]
- Javanmardi, E.; Liu, S.; Xie, N. Exploring the Challenges to Sustainable Development from the Perspective of Grey Systems Theory. Systems 2023, 11, 70. [Google Scholar] [CrossRef]
- Nowak, M.; Kokocińska, M. The Efficiency of Economic Growth for Sustainable Development—A Grey System Theory Approach in the Eurozone and Other European Countries. Sustainability 2024, 16, 1839. [Google Scholar] [CrossRef]
- Comert, G.; Begashaw, N.; Huynh, N. Improved Grey System Models for Predicting Traffic Parameters. Expert Syst. Appl. 2021, 177, 114972. [Google Scholar] [CrossRef]
- Javanmardi, E.; Liu, S.; Xie, N. Exploring Grey Systems Theory-Based Methods and Applications in Sustainability Studies: A Systematic Review Approach. Sustainability 2020, 12, 4437. [Google Scholar] [CrossRef]
- Wang, B.; Li, M.; Wen, X.; Yang, Y.; Zhu, J.; Belzile, N.; Chen, Y.-W.; Liu, M.; Chen, S. Distribution Characteristics, Potential Contribution, and Management Strategy of Crop Straw and Livestock-Poultry Manure in Multi-Ethnic Regions of China: A Critical Evaluation. J. Clean. Prod. 2020, 274, 123174. [Google Scholar] [CrossRef]
- Zhang, X.; Sun, S.; Yao, S. Influencing Factors and Spatiotemporal Heterogeneity of Livestock Greenhouse Gas Emission: Evidence from the Yellow River Basin of China. J. Environ. Manag. 2024, 358, 120788. [Google Scholar] [CrossRef] [PubMed]
- Liu, J.; Wang, S.; Li, D. The Analysis of the Impact of Land-Use Changes on Flood Exposure of Wuhan in Yangtze River Basin, China. Water Resour. Manag. 2014, 28, 2507–2522. [Google Scholar] [CrossRef]
- Acosta, A.; Lloyd, T.; McCorriston, S.; Lan, H. The Ripple Effect of Animal Disease Outbreaks on Food Systems: The Case of African Swine Fever on the Chinese Pork Market. Prev. Vet. Med. 2023, 215, 105912. [Google Scholar] [CrossRef]
- Le, C.; Zha, Y.; Li, Y.; Sun, D.; Lu, H.; Yin, B. Eutrophication of Lake Waters in China: Cost, Causes, and Control. Environ. Manag. 2010, 45, 662–668. [Google Scholar] [CrossRef]
- Su, S.; Wang, C.; Lu, C.; Zhao, W.; Liu, C.; Chen, D.; Jiang, B.; Fan, X.; Zhao, Z.; Chen, Y.; et al. Carbon Emissions from Rural Wastewater Treatment Using the Anoxic-Anaerobic-Oxic Membrane Bioreactor Process. J. Clean. Prod. 2025, 510, 145640. [Google Scholar] [CrossRef]
- Luo, T.; Yue, Q.; Yan, M.; Cheng, K.; Pan, G. Carbon Footprint of China’s Livestock System—A Case Study of Farm Survey in Sichuan Province, China. J. Clean. Prod. 2015, 102, 136–143. [Google Scholar] [CrossRef]
- Lu, X.; Zhang, S.; Xing, J.; Wang, Y.; Chen, W.; Ding, D.; Wu, Y.; Wang, S.; Duan, L.; Hao, J. Progress of Air Pollution Control in China and Its Challenges and Opportunities in the Ecological Civilization Era. Engineering 2020, 6, 1423–1431. [Google Scholar] [CrossRef]
- Lingyan, W. Research on the Measurement of Urban-Rural Integration Level in Sichuan Province. Humanit. Soc. Sci. Res. 2025, 8, 9. [Google Scholar] [CrossRef]
- Liu, Y.; Sun, D.; Wang, H.; Wang, X.; Yu, G.; Zhao, X. An Evaluation of China’s Agricultural Green Production: 1978–2017. J. Clean. Prod. 2020, 243, 118483. [Google Scholar] [CrossRef]
- Xiong, L.; Shah, F.; Wu, W. Environmental and Socio-Economic Performance of Intensive Farming Systems with Varying Agricultural Resource for Maize Production. Sci. Total Environ. 2022, 850, 158030. [Google Scholar] [CrossRef]
- He, W.; Chen, W.; Chandio, A.A.; Zhang, B.; Jiang, Y. Does Agricultural Credit Mitigate the Effect of Climate Change on Cereal Production? Evidence from Sichuan Province, China. Atmosphere 2022, 13, 336. [Google Scholar] [CrossRef]
- Xiao, H.; Shao, H.; Long, J.; Zhang, S.; He, S.; Wang, D. Spatial-Temporal Pattern Evolution and Geological Influence Factors Analysis of Ecological Vulnerability in Western Sichuan Mountain Region. Ecol. Indic. 2023, 155, 110980. [Google Scholar] [CrossRef]
- Tang, P.; Chen, J.; Gao, J.; Li, M.; Wang, J. What Role(s) Do Village Committees Play in the Withdrawal from Rural Homesteads? Evidence from Sichuan Province in Western China. Land 2020, 9, 477. [Google Scholar] [CrossRef]
- Yang, Y.; Lin, M.; Lin, Y.; Zhang, C.; Wu, C. A Survey of Blockchain Applications for Management in Agriculture and Livestock Internet of Things. Future Internet 2025, 17, 40. [Google Scholar] [CrossRef]
- He, R.; Guo, S.; Deng, X.; Zhou, K. Influence of Social Capital on the Livelihood Strategies of Farmers under China’s Rural Revitalization Strategy in Poor Mountain Areas: A Case Study of the Liangshan Yi Autonomous Prefecture. J. Mt. Sci. 2022, 19, 958–973. [Google Scholar] [CrossRef]
Disclaimer/Publisher’s Note: The statements, opinions and data contained in all publications are solely those of the individual author(s) and contributor(s) and not of MDPI and/or the editor(s). MDPI and/or the editor(s) disclaim responsibility for any injury to people or property resulting from any ideas, methods, instructions or products referred to in the content. |
© 2025 by the authors. Licensee MDPI, Basel, Switzerland. This article is an open access article distributed under the terms and conditions of the Creative Commons Attribution (CC BY) license (https://creativecommons.org/licenses/by/4.0/).