Article

Pareto-Based Optimization of PV and Battery in Home-PV-BES-EV System with Integrated Dynamic Energy Management Strategy

by
Abd Alrzak Aldaliee
1,
Nurulafiqah Nadzirah Mansor
1,
Hazlie Mokhlis
1,2,*,
Agileswari K. Ramasamy
3 and
Lilik Jamilatul Awalin
2,*
1
UM Power & Energy System Research Group, Department of Electrical Engineering, Faculty of Engineering, Universiti Malaya, Kuala Lumpur 50603, Malaysia
2
Faculty of Advanced Technology and Multidiscipline, Universitas Airlangga, Gedung Kuliah Bersama, Kampus, C UNAIR, Jl. Mulyorejo, Surabaya 60155, Indonesia
3
Institute of Power Engineering, Universiti Tenaga Nasional, Kajang 43000, Selangor, Malaysia
*
Authors to whom correspondence should be addressed.
Sustainability 2025, 17(16), 7364; https://doi.org/10.3390/su17167364
Submission received: 14 July 2025 / Revised: 8 August 2025 / Accepted: 9 August 2025 / Published: 14 August 2025
(This article belongs to the Section Energy Sustainability)

Abstract

The assessment of grid-connected systems depends on their cost efficiency, reliability, and greenhouse gas (GHG) reduction potential. This study presents a multi-objective optimization framework for designing a grid-connected photovoltaic (PV) and battery energy storage (BES) system integrated with an electric vehicle (EV) for a household in Riyadh, Saudi Arabia. The framework aims to minimize the Cost of Energy (COE) and Loss of Power Supply Probability (LPSP) while maximizing the Renewable Energy Fraction (REF). Additionally, GHG emissions are evaluated as a result of these objectives. The EV operates in Vehicle-to-Home (V2H) mode, enhancing system flexibility and energy management. The optimization process employs two advanced metaheuristic techniques, Multi-Objective Particle Swarm Optimization (MOPSO) and Multi-Objective Harris Hawks Optimization (MOHHO), to identify Pareto front solutions. Fuzzy logic is then applied to determine a balanced compromise among the economically optimal (minimum COE), renewable energy-oriented (maximum REF), and environmentally optimal (minimum GHG emissions) solutions. Simulation results show that the proposed system achieves a COE of USD 0.0554/kWh, a LPSP of 1.96%, and an REF of 92.55%. Although the COE is slightly higher than that of the grid, the system provides significant environmental and renewable energy benefits. This study highlights the potential of integrating dynamic EV management and advanced optimization techniques to enhance the performance of grid-connected systems. The findings demonstrate the effectiveness of combining Pareto-based optimization with fuzzy logic to achieve balanced solutions addressing economic, environmental, and renewable energy objectives, paving the way for sustainable energy systems in urban households.

1. Introduction

Global warming and climate change are among the global issues that emphasize the significance of sustainable energy resources and their role in reducing reliance on fossil fuels. According to the IEA, the residential and transportation sectors are responsible for 30% and 28% of worldwide energy consumption and 28% and 23% of worldwide carbon emissions, respectively [1]. In efforts to mitigate these environmental challenges, sustainable energy technologies and the use of green energy resources have been advancing and making significant progress. Hybrid systems that integrate renewable energy sources like wind turbines and photovoltaic panels are becoming increasingly popular [2,3]. Additionally, there is a significant increase in integrating distributed energy resources such as energy storage systems (ESS) and electric vehicles into the national grid. Globally, the most commonly used renewable energy sources are wind turbines and photovoltaic systems as they are environmentally friendly and cost-effective resources [4,5,6]. However, these types of renewable energy sources are well known for their intermittent character, and thus they need to be used together with battery systems to smooth power output and provide backup power [4,7].
Rooftop photovoltaic systems have quickly become a significant renewable energy source in many nations. The installation of residential PV systems along with battery storage in homes and buildings has grown rapidly in recent years, and this upward trend is expected to continue [8,9]. In 2017, PV systems contributed 114 TWh to the EU’s electricity demand, based on an installed capacity of 107 GW [10]. The share of residential and commercial rooftop systems accounted for approximately 28% and 18% of the installed photovoltaic capacity contributing to the EU’s electricity demand, respectively [10]. The installation of rooftop solar PV systems for households not only reduces harmful emissions, but also cuts electricity bills [11]. Researchers in Ref. [12] conducted a study on households in California and concluded that using solar-only systems can lower their annual lifecycle greenhouse gas emissions by 110 to 570 kg CO2, corresponding to a 5% to 39% reduction compared to homes without solar systems.
Based on these benefits, the Saudi Arabian government has set ambitious goals to shift the economy away from dependence on fossil fuels. Among the notable goals in Vision 2030 is the incorporation of renewable energy systems into the national grid [13]. According to studies by the King Abdullah Petroleum Studies and Research Center (KAPSARC), residential buildings represent 50% of the total energy consumption in the kingdom [14]. The authorities in Saudi Arabia have taken significant steps to promote sustainability in the energy sector. Since 2018, the Saudi Electricity Regulatory Authority (SERA) and Saudi Electricity Company (SEC) issued regulations to promote the adoption of grid-connected rooftop solar photovoltaic systems (RSPV) by individuals [15,16]. Considering that the country is the largest oil exporter in the world, it is committed to the Paris Agreement. Consequently, the energy sector in Saudi Arabia is experiencing a lot of significant transformations. The target of these transformations is to have 50% of the energy consumed domestically coming from renewable sources by 2030 [17,18]. Acknowledging the possibility of decreasing emissions using a more sustainable energy mix, the government set a target to achieve 30% of electric vehicles in Riyadh city by 2030 [18]. Also, the government demonstrated its commitments towards Paris Agreement through regulations, investments in charging infrastructure and encouraged electric vehicles manufacturers to set up their facilities in Saudi Arabia. Furthermore, KSA has founded the first local EV manufacturer CEER [19,20]. Considering the transitions in the country, it is important to study the optimal planning of rooftop solar PV systems with EV, focusing on the sizing of PV panels and batteries, and managing power flow through a home energy management system (HEMS) to minimize COE, reduce LPSP, and maximize REF. Additionally, cost reductions and advancements in PV and Battery Energy Storage technologies encourage greater adoption by homeowners. Incorporating EVs into the household adds further advantages, as they can operate bidirectionally, supplying power back to the system.
The integration of rooftop solar PV systems and bidirectional EVs essentially creates a home microgrid, where optimal sizing and efficient energy management are crucial. To tackle the complexity of such systems, metaheuristic algorithms have been widely employed due to their efficiency in solving nonlinear problems and providing reasonable computational times. There are different tools that can be used for the optimization of the system such as HOMER [21], PSAT [22], and SeDuMi [23]. Furthermore, different metaheuristic algorithms are used for optimal sizing such as Particle Swarm Optimization (PSO), Genetic Algorithm (GA), and Cuckoo Search Algorithm (CSA) [24]. One of the recent metaheuristic optimization techniques is Harris Hawks Optimization (HHO), which was used for sizing the microgrid components (PV-WT-BES-DG) [25]. All these optimization methods can operate in MATLAB. However, the previously mentioned tools are not all suitable for solving sizing problems because of the specific characteristics of each tool [26]. The contribution of renewable energy sources in the country is very low [27]. Most solar projects are in industrial applications including hydrogen production facilities, water desalination plants, and food drying equipment [28]. Vehicle-to-home is a prominent topic in the realm of sustainable electric vehicle development [29]. V2H technology, first proposed by AC Propulsion in the early 1990s, enables electric vehicles to supply power to a home. It allows the electric vehicle to work as a mobile energy storage device. This technology can assist in managing the intermittent production of renewable energy sources (RES) [30,31]. Besides, various services can be provided by V2H technology such as: energy cost saving, peak shaving, load balancing, backup energy during outages, grid stabilization, and enhanced energy independence [30]. In summary, there are a lot of ancillary services provided to the system. Many studies combined PV/BES/EV with optimal sizing of renewable sources and batteries to ensure economic and reliable systems. In [29], the authors introduced an innovative approach for optimizing household energy costs in a grid-connected home equipped with an electric vehicle, a renewable energy source, and battery energy storage. The focus in [32] was on incorporating residential photovoltaic systems and electric vehicles into a home energy management system with an occupant-centered approach, considering factors such as occupants’ thermal comfort, clothing habits, and concerns regarding the state of charge (SOC) of EVs. To the best of the authors’ knowledge, several studies have explored EV charging, V2H systems, and PV-BES-EV systems for households. However, the majority of these studies do not emphasize the dynamic management of EVs integrated with V2H for determining the optimal sizing of PV and BES while aiming to minimize LPSP and COE and maximize REF.
In order to help the decision-makers, the authors in [33] used technical, social, economic, political, and environmental criteria to assess the sustainability of the microgrid. Similarly, in [34], the authors applied an Analytic Hierarchy Process (AHP) approach to prioritize the criteria for optimizing the hybrid energy system. The authors in [35] developed a multi-criteria decision analysis (MCDA) framework to incorporate renewable energy into the utility grid. The paper conducted techno-economic optimization considering seasonal variations to identify the optimal configuration using the Analytic Hierarchy Process (AHP) framework. Additionally, TOPSIS, along with various weighting methods, was proposed in [33] to select the final design from a range of non-dominated solutions. A review of the literature reveals that the fuzzy compromise solution method has been underexplored for decision-making problems for multi-objective optimal sizing of household components. The fuzzy logic method provides a logical and mathematical framework that helps decision-makers in determining the best compromise solution. It is a simple and effective tool because it is straightforward, computationally efficient, and provides a flexible framework for decision-makers in energy systems.

Novelty and Contribution

Despite significant research efforts on hybrid PV-BES-EV systems, several critical gaps remain unaddressed. First, most studies assume fixed EV participation without accounting for the stochastic nature of EV availability, including arrival, departure, and state-of-charge fluctuations. Second, while several works have optimized PV-BES-EV systems using single- or bi-objective methods, there is limited exploration of a comprehensive tri-objective framework that simultaneously considers COE, LPSP, and REF, thereby addressing economic, reliability, and environmental perspectives. Third, although fuzzy logic methods have been used in decision-making for energy systems, their application to multi-objective Pareto front selection in PV-BES-EV optimization is scarce. Finally, few studies have focused on Riyadh, Saudi Arabia, where the unique climatic, policy, and market conditions demand context-specific solutions. This study addresses these gaps by developing a comprehensive optimization and decision-making framework for the optimal sizing and operation of PV-BES-EV systems in Riyadh, Saudi Arabia.
This study analyzes the feasibility of a grid-connected household with PV-BES-EV configuration in Riyadh city. The objectives of this study are to minimize COE and LPSP and to maximize (REF). The study focuses on determining the optimal sizing of the PV and battery energy storage systems, employing a novel rule-based home energy management system to manage the energy flow throughout the system. This study used a set of measured data on hourly Global Horizontal Irradiance (GHI), load demand, and ambient temperature for Riyadh, Saudi Arabia. The load demand data for this location were sourced from the Saudi Electricity Company (SEC). The other data were sourced from King Abdullah City for Atomic and Renewable Energy (KACARE) [36]. The study area is located at latitude 24.7619° N and longitude 46.7539° E and benefits from abundant solar insolation.
The contributions of this paper are:
  • A practical and comprehensive mathematical model employing two metaheuristic optimization techniques for optimal sizing of grid-connected PV and BES of the system with EV.
  • A novel rule-based home energy management system that combines PV-BES-EV to enable the user to efficiently utilize the system. In the proposed HEMS, EV is addressed as a secondary load during charging and as an energy storage system that can supply power to the household load (V2H).
  • A dynamic management of EV (charging/discharging based on SoC and TOU tariffs) in the proposed home energy management based on EV state of charge.
  • Applying a fuzzy logic approach to find a compromised solution out of the Pareto fronts resulted from MOPSO and MOHHO.

2. Proposed System Configuration and Operation

The proposed home system integrates multiple power sources and components to ensure efficient energy distribution within the household, as shown in Figure 1. The primary source of power is a photovoltaic system, which generates energy during sunlight hours. This energy is fed into the DC bus, where it can either be stored in battery energy storage or converted by a bidirectional DC/AC converter for use by AC loads, including household appliances. The battery energy storage unit is a Nickel–Iron (NiFe) battery, which serves as a backup storage unit, capable of storing excess PV energy and discharging it when PV production is insufficient. The bidirectional converter allows energy to flow in both directions, enabling the battery to supply power to the home during times of need, and also to charge from the PV system when excess energy is available. An electric vehicle connected to the system can operate in both Vehicle-to-Home (V2H) and Home-to-Vehicle (H2V) modes. In V2H mode, the EV acts as a secondary energy source, supplying power back to the home when needed, while in H2V mode, the EV charges from the home’s energy sources. The system is managed by a Rule-Based Home Energy Management System (RB-HEMS) central controller, which coordinates power distribution across the different energy sources and loads. The controller monitors and optimizes the energy flow between the PV system, battery, grid, household load, and electric vehicle. In case the available energy sources are unable to meet the household’s demand, the system can import power from the grid, acting as a backup source. The RB-HEMS ensures optimal operation by controlling and balancing the power flow from all sources and managing the EV’s role as both a load and a source, thereby reducing grid dependency while maximizing the use of renewable energy and minimizing costs.
The parameters and costs of the components of the proposed system used in this study are shown in Table 1. The table includes details on the photovoltaic system, battery energy storage, electric grid tariffs, and inverter specifications, along with the economic parameters governing the project’s financial outlook.

3. Mathematical Modeling of the Proposed System

Several studies have explored the mathematical equations to model grid-connected systems incorporating V2H technology with PV and BES [29,39,40,41]. These modeling equations for PV and batteries are commonly used by researchers to account for all system components [42,43,44,45]. The PV system operates at its maximum power point, while the batteries serve as storage and can operate in line with the EV battery to enhance reliability [46,47,48]. The discounted cash flow analysis method is used to calculate the cost of the energy produced by the system, considering the project’s lifetime and its components.

3.1. PV System

This research focuses on polycrystalline solar panels (LG305N1C-G4). The manufacturer’s specifications for these panels, as well as solar parameters, are detailed in [49,50,51]. The PV output power is presented for a one-year period (8760 h) in [24,43,51,52,53] and can be expressed as shown in Equation (1):
P p v = t = 1 8760 P p v r × N p v × D F p v G t G B a s e 1 + K T T a m b t + G t × N O C T 20 800 × 1000 T b a s e
where P p v r is the rated output of the module (kW), N p v represents the number of PV panels, and D F p v refers to the PV derating factor. G(t) denotes the global irradiance (kW/m2), G B a s e is the solar radiation under standard conditions (1 kW/m2), and the temperature coefficient for maximum power is K T = 3.7     10 3 (1/°C). T a m b is the ambient temperature in (°C), NOCT refers to the Normal Operating Cell Temperature (°C), and T b a s e represents the temperature at reference condition (°C).
The net present cost (NPC) of the PV, denoted as N P C p v , consists of the initial cost ( I C p v ) ; I P R p v is investment cost per PV panel (USD/panel) operation and maintenance cost ( O & M p v ), I f is the inflation rate (%), and I r is the interest rate (%). The PV lifetime is the same as the project lifetime, and thus there is no replacement cost. Accordingly, N P C p v is calculated as follows:
N P C p v = I C p v + O & C p v = N p v × I P R p v + n = 0 25 O M P p v 1 + I r I f 1 + I f n 1

3.2. Battery Energy Storage (BES) System

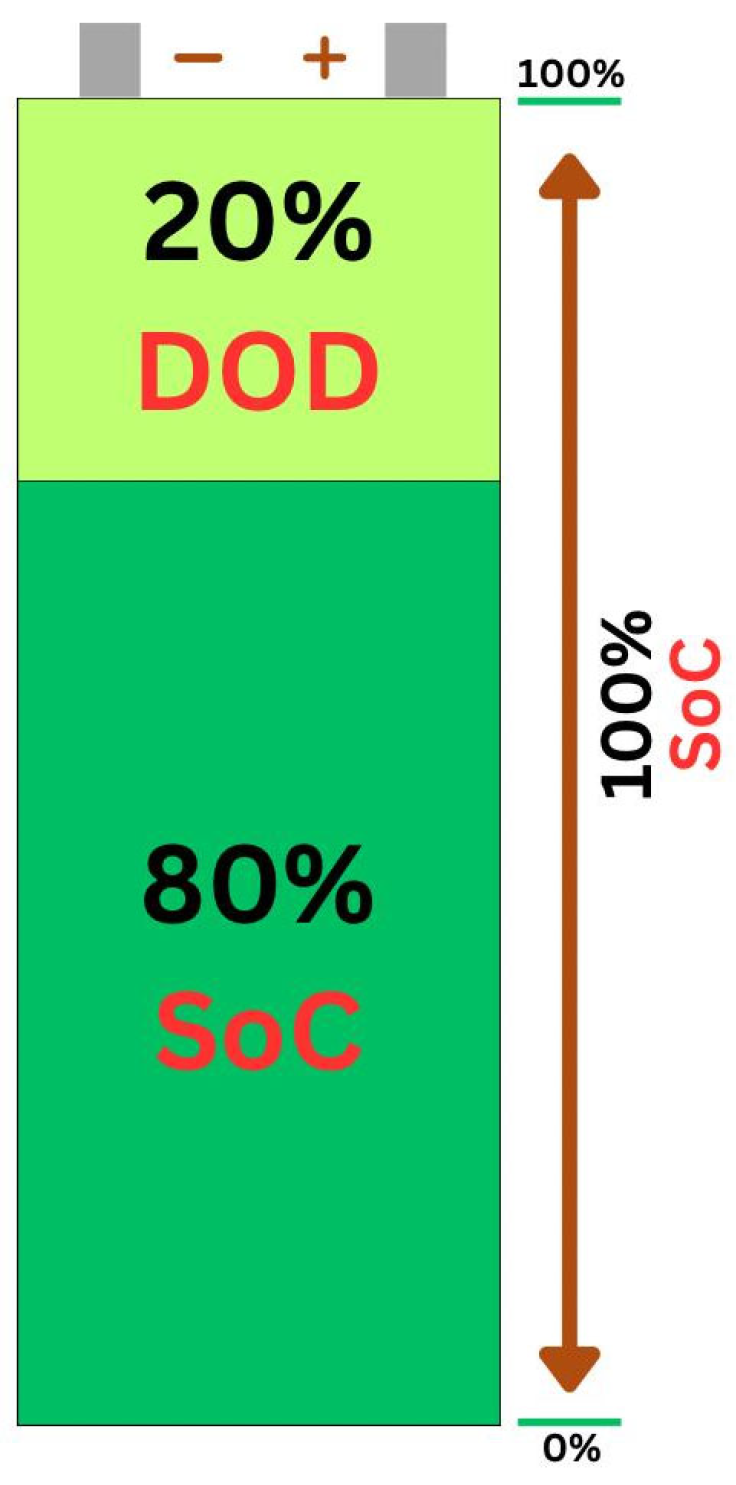
A battery energy storage system is utilized to store energy and discharge it when the grid and PV power are unavailable. The storage system mitigates the intermittent nature of the system and improves its reliability and efficiency. The State of Charge of a battery denotes the level of energy stored in it, whereas the Depth of Discharge (DoD) indicates the amount of energy that has been consumed from the battery as illustrated in Figure 2 [54,55]. This proposed system is subjected to the following constraints:
E B a t , m i n E B a t ( t ) E B a t , m a x
E B a t , m a x = E B a t , c a p
E B a t , m i n = E B a t , m a x ( 1 D O D )
The energy output from the battery can be mathematically represented by Equation (6).
E B a t ( t ) = P p v ( t ) P l ( t ) η i n v
where E B a t t is the energy delivered by the battery (kWh), E B a t , m i n is the minimum allowable energy in the battery, and E B a t , m a x is the maximum allowable energy in the battery, which is equal to the rated capacity of the battery bank E B a t , c a p . P p v is the power produced by the PV panels (kW), P l ( t ) is the total load demand (kW), and η i n v is the inverter efficiency. During the charging period, when the power generated by the PV system exceeds the load demand, the battery’s energy capacity can be described in Equation (7) [24,43,56]. The energy capacity of the battery in discharging mode is utilized when the load demand surpasses the power output generated by the system, expressed in Equation (8) [24,43].
E B a t ( t ) = E B a t ( t 1 ) ( 1 σ ) + P p v ( t ) P l ( t ) η i n v η b
E B a t ( t ) = E B a t ( t 1 ) ( 1 σ ) P l ( t ) η i n v P p v ( t ) η b
where ( σ ) is self-discharge of 1% per day. The battery efficiency ( η b ) selected is 80%, and the inverter efficiency is ( η i n v ) 90%. The battery energy storage system is assumed to have a lifespan of 10 years, with a replacement cost of USD500 [37]. The net present cost of the battery energy storage is given as follows:
N P C B a t = I C B a t + O & C B a t = N B a t × I P R B a t + n = 0 25 O M P B a t 1 + I r I f 1 + I f n 1

3.3. EV Charging/Discharging

When the electric vehicle is connected to a home through a bidirectional AC/DC converter, it can be utilized in Vehicle-to-Home (V2H) mode to improve household reliability. V2H operation can reduce a homeowner’s operating costs, provided there is an effective charging and discharging strategy. However, the level of EV participation in V2H mode depends on customer preferences and the availability of the State of Charge. In this study, the Nissan Leaf EV, equipped with a 40-kWh battery [57], was selected for analysis due to its prominent position in the electric vehicle market [58]. The charging/discharging capacity of the EV’s battery at any hour can be modeled in terms of its rated power as described in Equations (10) and (11), respectively [59,60]:
S O C E V ( t ) = S O C E V ( t 1 ) + η E V P E V C E V , b a t t e r y × 100
S O C E V ( t ) = S O C E V ( t 1 ) P V 2 H η E V C E V , b a t t e r y × 100
where S O C E V ( t ) is the state of charge of the EV’s battery at hour (t), η E V is the EV charging/discharging efficiency which is 92%, P E V is the charging rate of EV (kW), P V 2 H is the discharging rate of EV to home (kW), and C E V , b a t t e r y is the EV battery capacity (kWh). Additionally, the state of charge of the EV battery at each hour (t) is subject to the following constraint:
S O C E V , m i n S O C E V ( t ) S O C E V , m a x
where S O C E V , m i n and S O C E V , m a x represent the minimum and maximum allowable state of charge for the EV battery, respectively.

3.4. Inverter

The inverter is an essential component for transferring power between sources and loads, operating with an efficiency of 90% [61]. Its rating is selected to optimize the total annual cost of the system and is determined by Equation (13) [38].
P i n v = P L m ( t ) η i n v
where P L m ( t ) represents the peak load demand (kW) and η i n v is the inverter efficiency.

3.5. Power Grid

The electrical grid is essential for ensuring a reliable and continuous energy supply. It acts as a supplementary source of energy, especially when renewable energy sources (PV panels) and the battery energy storage are insufficient to meet the total household load demand [24,38]. The system prioritizes the use of photovoltaic generated electricity for charging EVs to optimize energy efficiency, minimize electricity costs, and maximize the use of renewable energy. When PV energy is insufficient or unavailable (e.g., during nighttime or cloudy days), the grid supplies the required energy for EV charging through the home charger. Although Saudi Arabia currently uses a flat electricity tariff, this study applies a Time-of-Use (TOU) tariff structure adapted from countries like Malaysia to simulate realistic peak demand scenarios in hot climates. The load values in Table 2 are allocated across three tariff periods (off-peak, mid-peak, and on-peak) to reflect typical daily household consumption patterns, especially influenced by air conditioning usage. This allows the simulation to evaluate the cost impact of grid consumption based on time-sensitive pricing and to optimize energy dispatch decisions. The grid energy consumption for EV charging is managed based on time zones, as shown in Table 2. The system will be tested for both a flat rate and TOU rates. The flat rate used for buying and selling is illustrated in the following two equations.
Integrating the grid into the system allows for strategic energy management. To calculate the revenue from selling energy back to the national grid, the following equation will be used [24]:
R g r i d = t = 1 8760 r a t e f e e d i n × E g r i d ( s e l l i n g )
where r a t e f e e d i n is the feed-in tariff rate (USD 0.0670/kWh) and E g r i d ( s e l l i n g ) is the amount of energy sold to the grid (kWh). Furthermore, the cost of energy consumption from the grid is calculated by Equation (15) [24]:
C g r i d = C p × t = 1 8760 E g r i d ( p u r c h a s e d )
where C p is the cost of purchasing 1 kW from the grid in Saudi Arabia, which is USD 0.0480/kWh, and E g r i d ( p u r c h a s e d ) is the energy drawn from the grid at time t (kWh). In this study, the household owner is both a buyer (purchasing energy from the grid) and a seller (selling excess PV energy to the grid). The higher feed-in tariff is a proposed rate designed to incentivize renewable energy exports, in line with net metering practices adopted in the Saudi Arabia market.

3.6. Greenhouse Gas (GHG) Emission Estimation

The analysis calculates GHG emissions for the base case scenario, where only the grid is used to meet the household and EV load. This result is then compared to the proposed system that uses PV to supply the house load and EV. This comparison is applied to calculate the net savings in GHG emissions of the entire system.
G H G   E m i s s i o n s B a s e   C a s e = T o t a l   L o a d × G r i d   e l e c t r i c i t y s p e c i f i c   f a c t o r × G W P
Greenhouse gases vary in their impact on global warming due to their unique properties. To facilitate comparison, emissions are expressed in terms of carbon dioxide equivalents (CO2e). This scale uses CO2 as the reference point with a global warming potential (GWP) of 1, while all other GHGs identified in the Kyoto Protocol have higher GWP values than CO2 [62]. As outlined in the 2014 Fifth Assessment Report (AR5) by the International Panel on Climate Change (IPCC) (Myhre et al., 2013) [63], Methane (CH4) has a GWP of 21, nitrous oxide (N2O) has a GWP of 310, and sulfur hexafluoride (SF6) has a GWP of 23,900.
G r i d   G H G   E m i s s i o n s = T o t a l   L o a d   s u p p i e d   b y   g r i d × G r i d e f × G W P
where the grid emission factor specific to Saudi Arabia is 0.795591 kgCO2/kWh [64]. It is well known that PV panels generate electricity directly from sunlight and do not have GHG emissions when they are in operation. However, the system emits some GHGs throughout its life cycle, during manufacturing, assembly, balance of system (BOS), material transport, installation, and during disposal or recycling phases [65]. The following equation can be applied to determine the emissions related to the PV system E m p v :
E m p v   =   t = 1 8760 P p v ( t )   ×   e p v ×   G W P
where P p v is the annual power produced by the PV system (kW), and e p v is the emission factor of the PV system, which equals 0.050 ( k g C O 2 e q / k W h ) for poly-Si PV [66]. The total GHG emission reduction by the system is estimated as:
S y s t e m T o t a l   G H G   =   P V G H G   ×   G r i d G H G
N e t S a v i n g   G H G = B a s e   C a s e G H G × S y s t e m T o t a l   G H G

3.7. Component Availability in the System

The reliability of a Home Energy Management System is significantly influenced by the availability of its component photovoltaic systems, electric vehicles, and the grid. These components might not be available due to planned maintenance or unexpected failures. To assess system reliability, the probability of availability (PA) for each component is considered, reflecting the likelihood that the component will be operational at any given time. The PV system’s availability is subject to factors such as weather conditions, maintenance schedules, and technical failures. Based on industry standards and studies, the PA of the PV system is typically around 96% [67].
P p v   =   0.96   ×   P p v
The availability of EVs for charging at home is less consistent than that of stationary systems like PV. It depends on the owner’s driving habits, the times of arrival and departure of the EV, and its state of charge, which are all modelled randomly. This reflects the fact that the EV might only be at home and available for charging/discharging during certain hours of the day, influenced by the user’s routine. The EV is only available for charging/discharging during this window:
E V   A v a i l a b i l i t y = 1 ,     A r r i v a l   T i m e   t D e p a r t u r e   T i m e 0 ,     O t h e r w i s e
Grid availability is affected by the reliability of the utility provider, including factors like grid outages, maintenance, and failures. In this paper, the availability of the grid is assumed to be 90%, reflecting a strong grid infrastructure with rare periods of downtime [24].

4. Data Collection

This system is a grid-connected household or home microgrid that can be described as a cluster of renewable energy sources and battery units designed to manage energy consumption and generation within the household. Even though it is grid-connected system, it can operate in either on-grid or off-grid mode depending on the availability of the grid and renewable energy sources [68]. Data collected from SEC and KACARE for the system are analyzed to identify peak periods for the generation and consumption of renewable energy, allowing for the efficient scheduling of energy use and storage. The collected data correspond to the year 2024.

4.1. Solar Irradiance

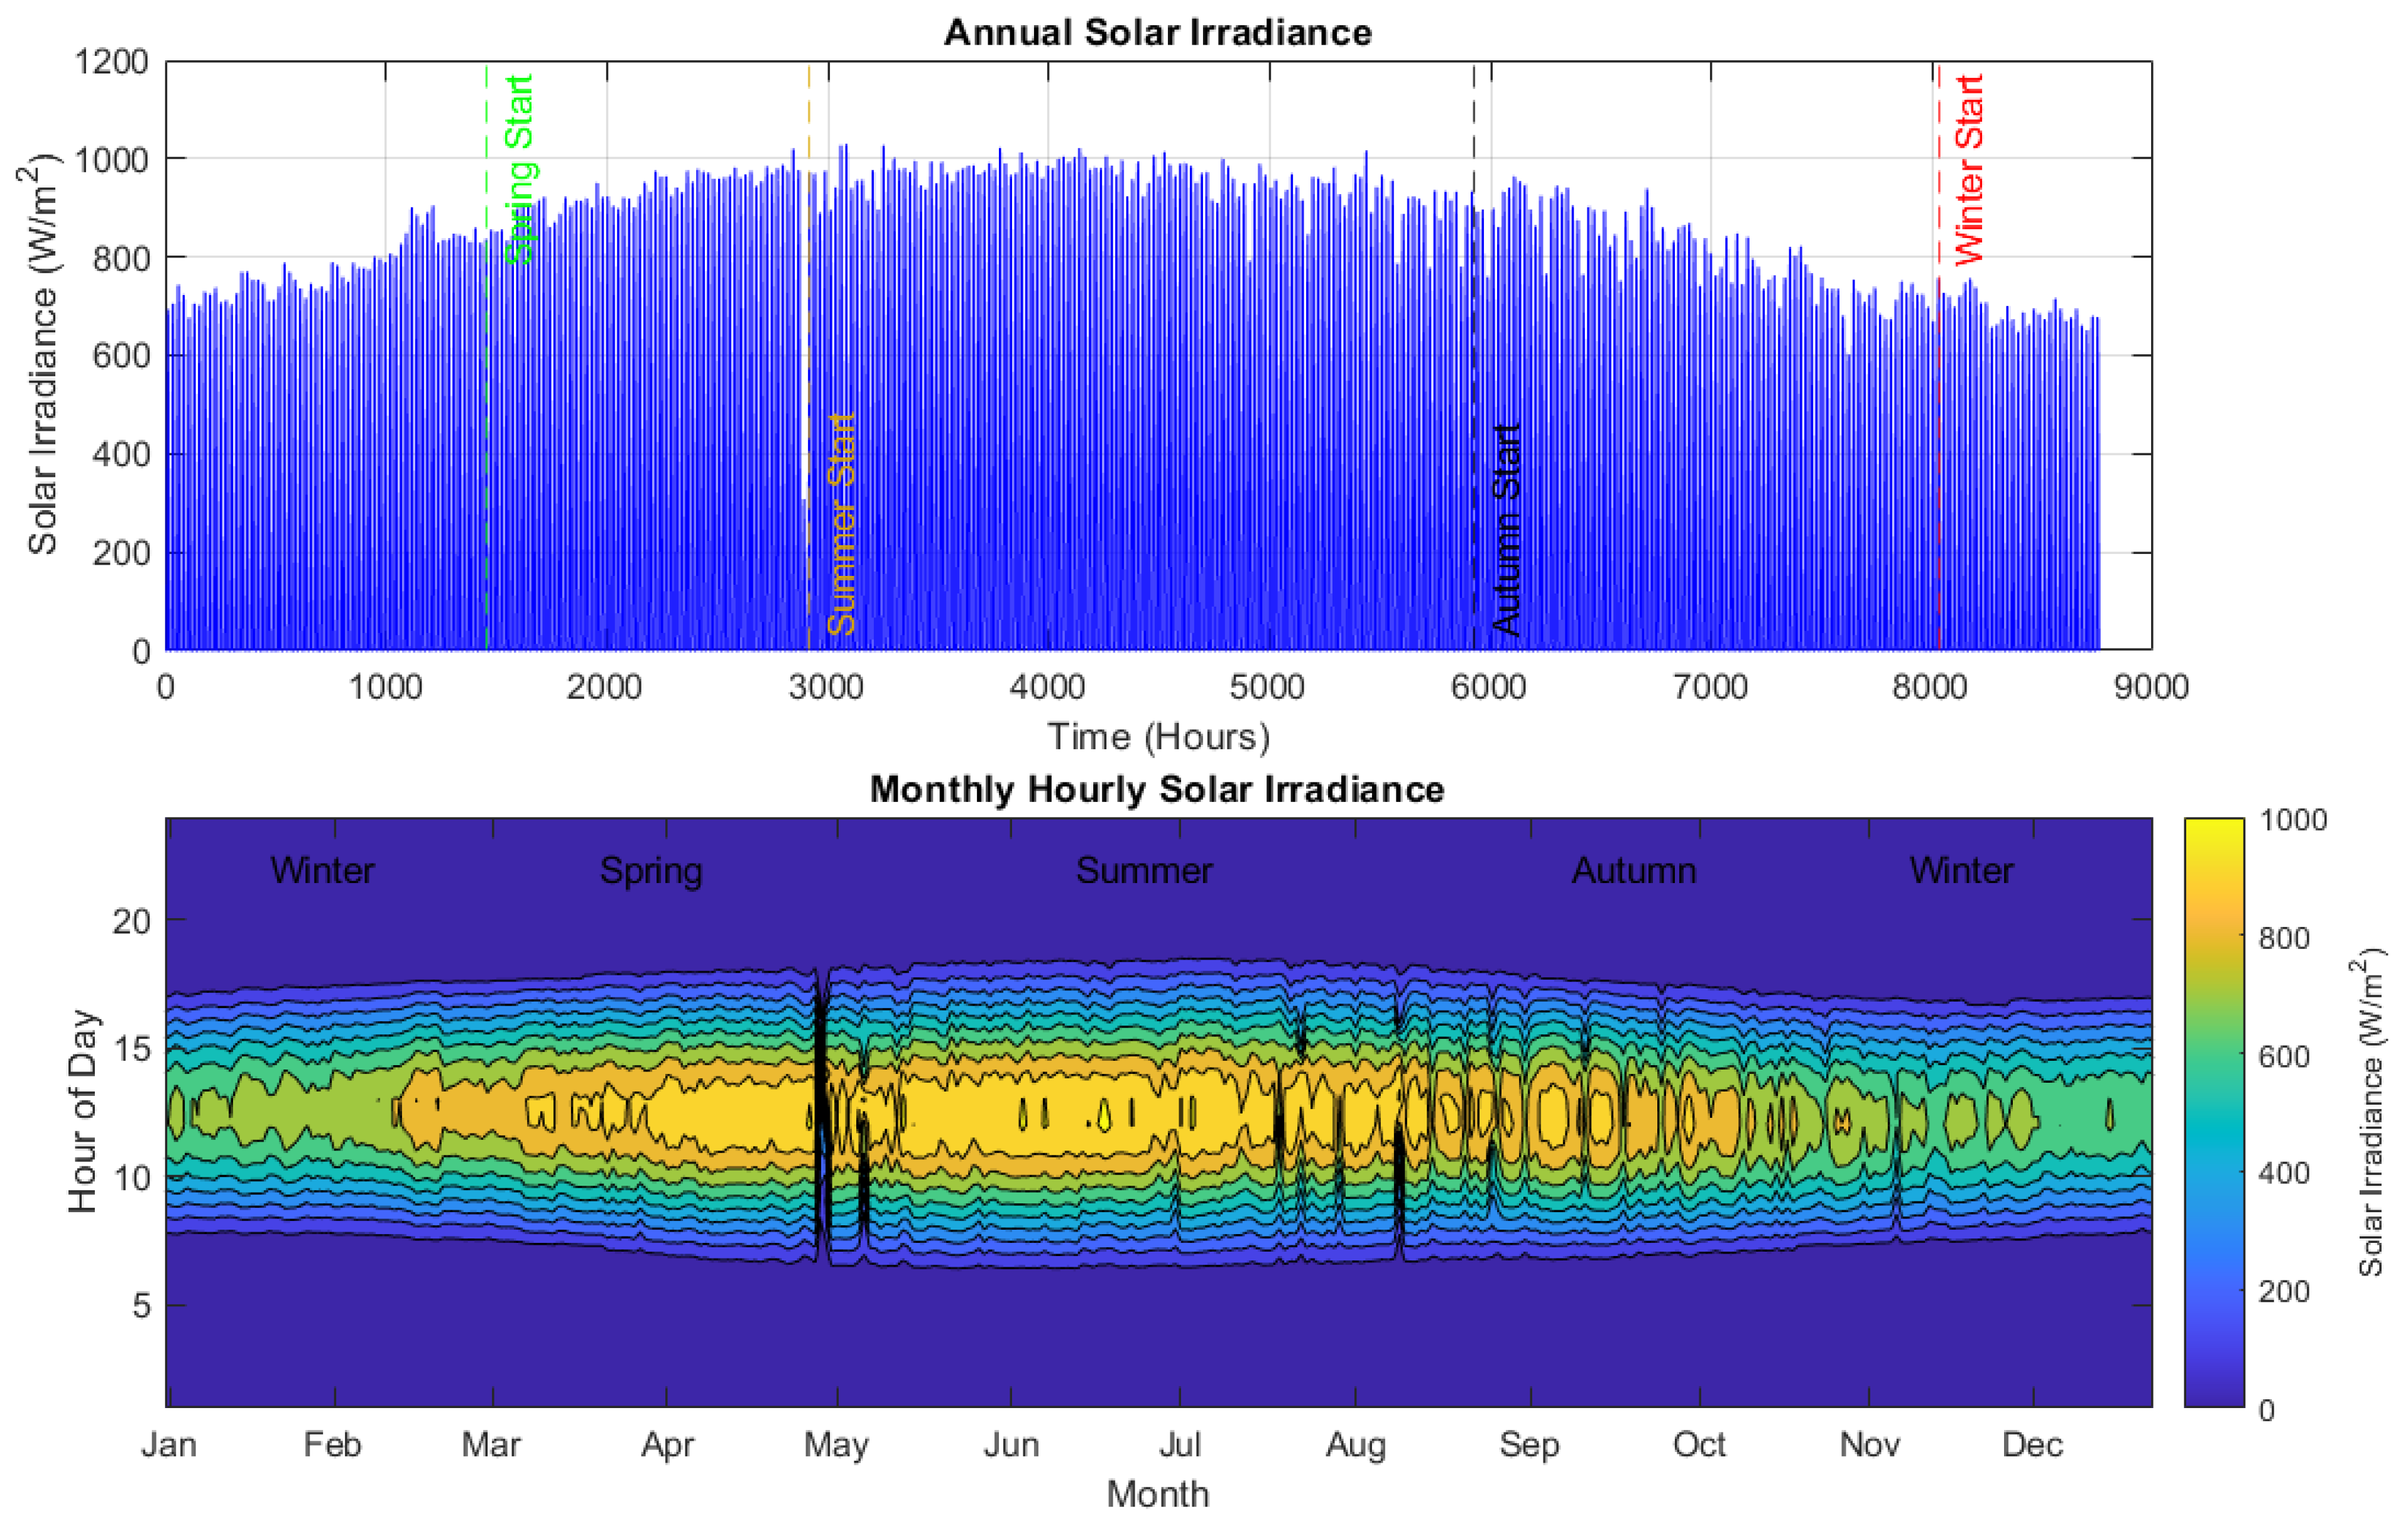
Figure 3 shows the solar irradiance data for the study location. The peak monthly solar irradiance for the location is presented in Table 3. The variations in solar irradiance in different days, even within the same month, can be due to several factors related to changes in weather conditions such as cloud cover and dust storms.

4.2. Ambient Temperature

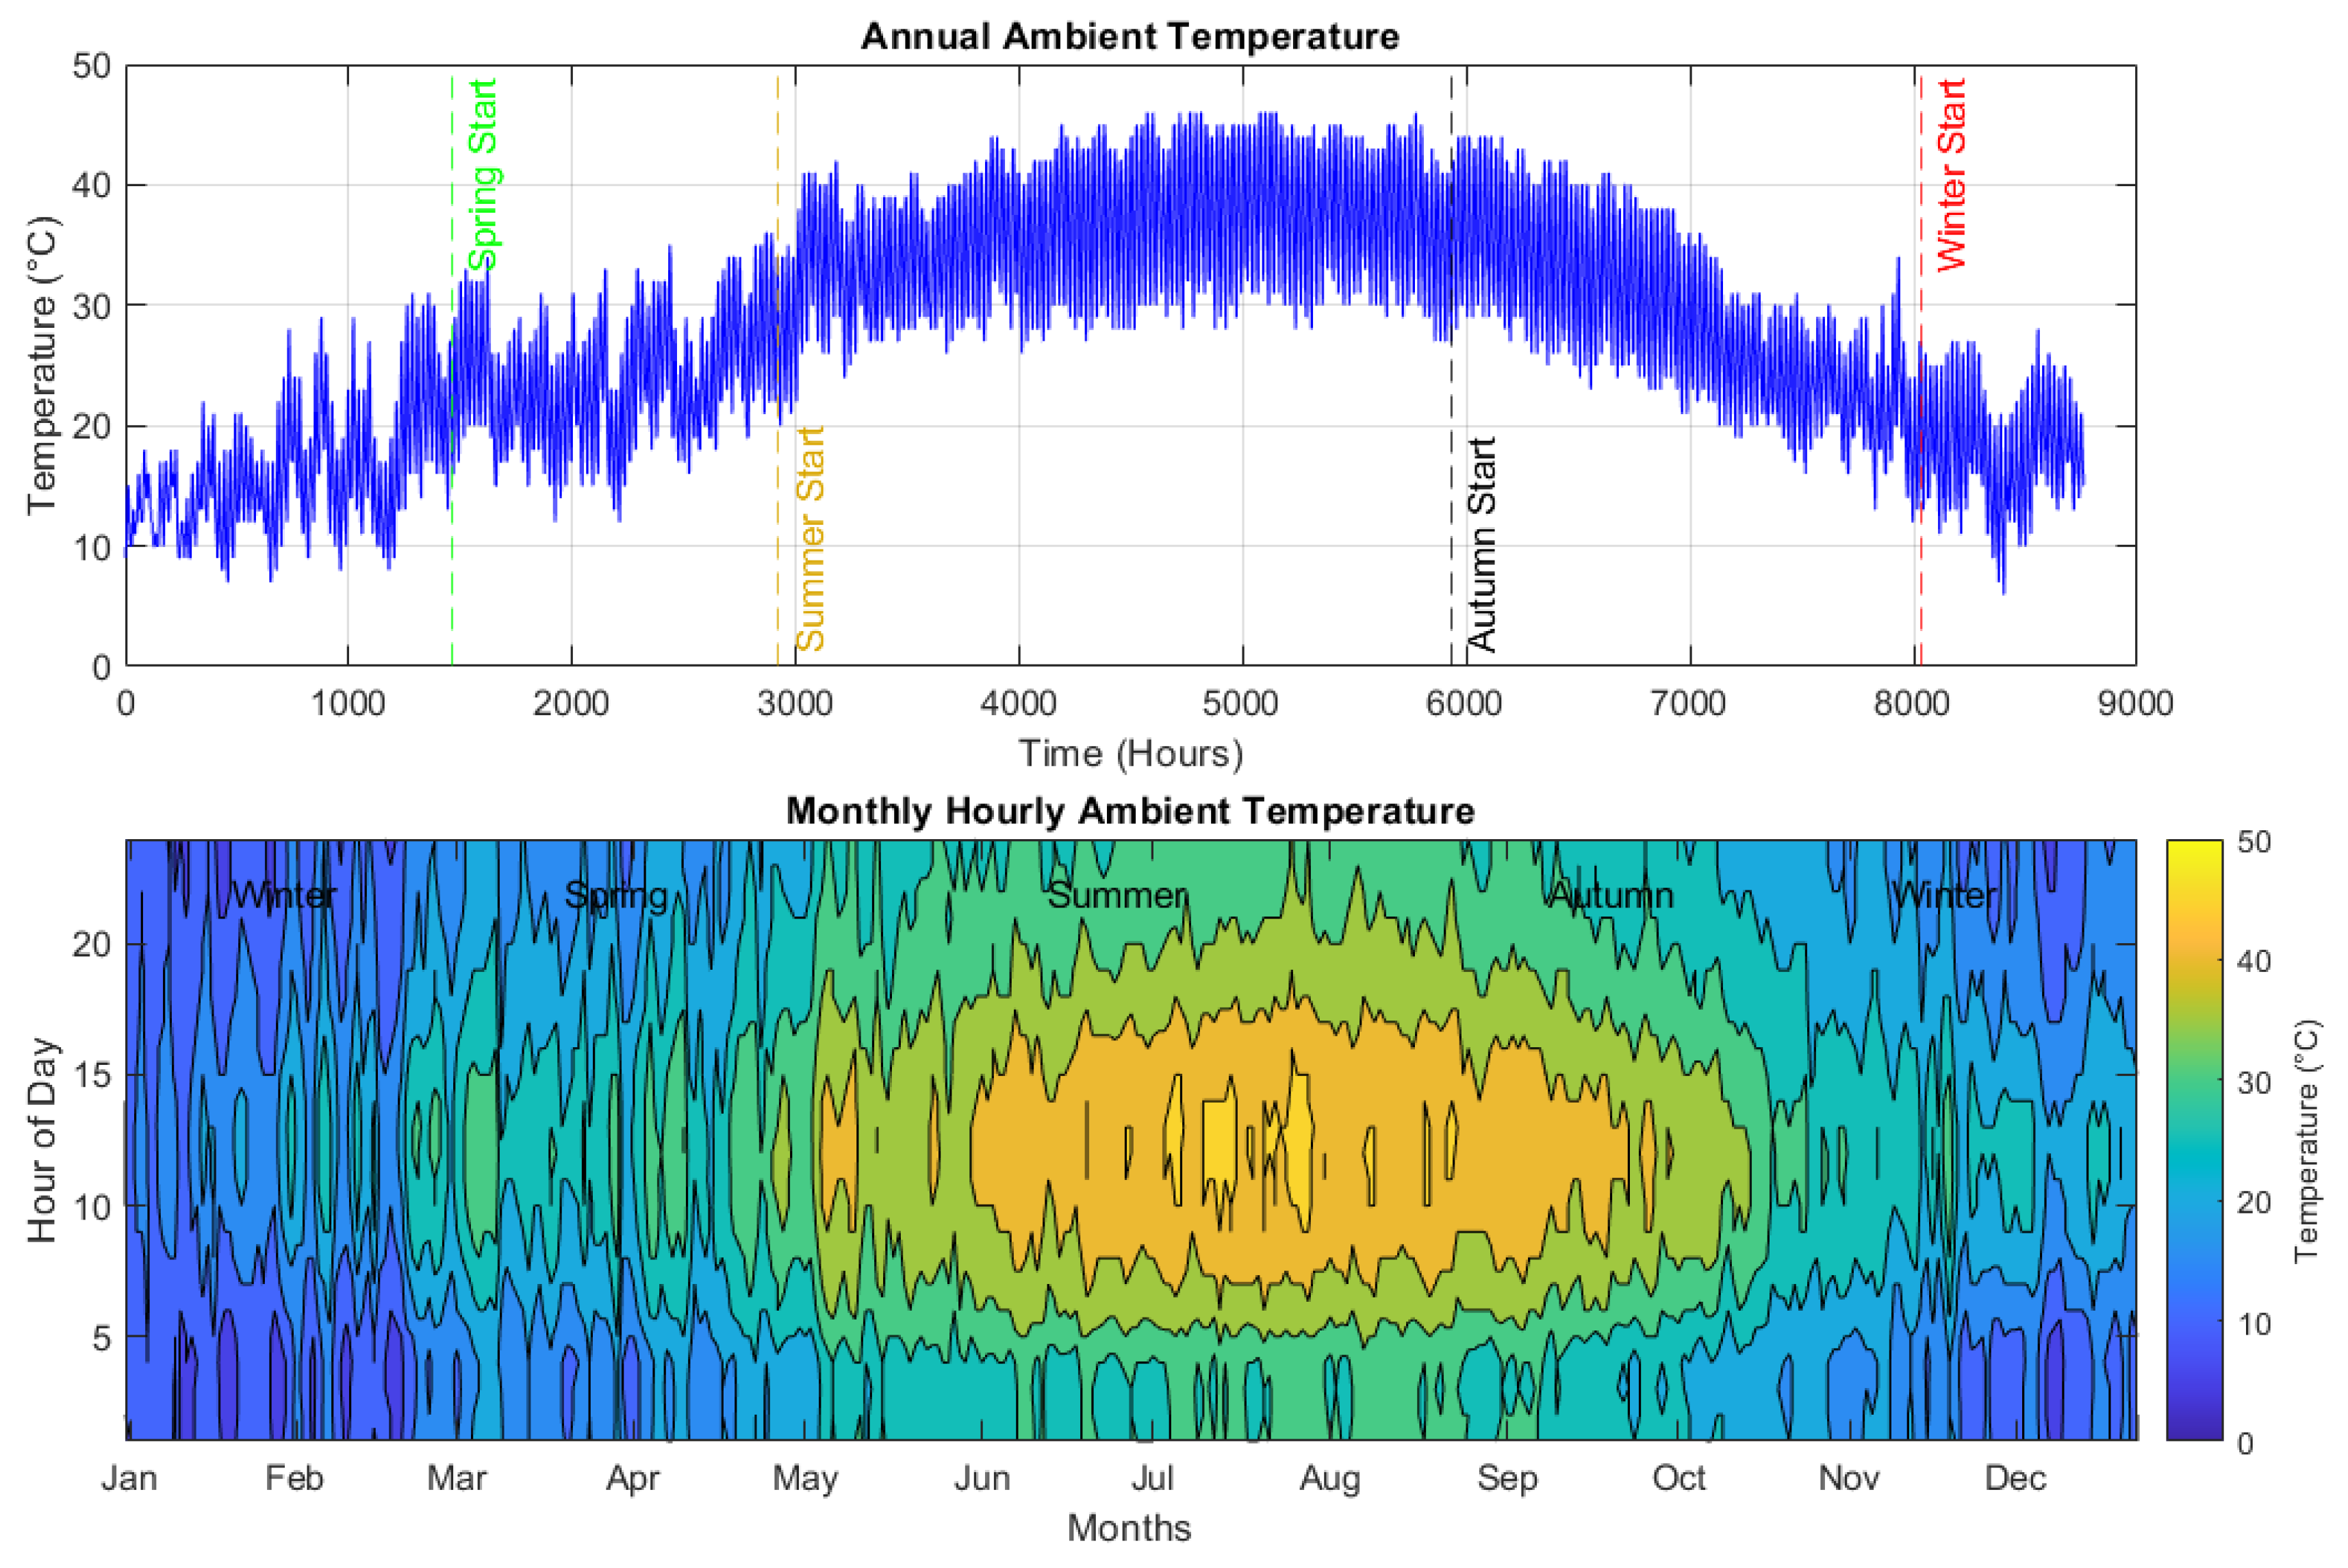
The collected climatic data show significant variations throughout the year, with a notable temperature spike during the summer when the highest temperature (46 °C) is recorded. Figure 4 illustrates the ambient temperature for the studied location, while Table 4 details the monthly maximum and minimum temperatures (°C).

4.3. Electric Vehicle and Charger

The flow of electricity between the home system and EV is facilitated by the battery. EV batteries can operate as a load or storage, providing benefits such as improved power quality, reliability control, power frequency regulation, and voltage frequency regulation [6]. Various battery types are used in EV, including lead–acid batteries [69], lithium-ion batteries [70], and flywheel batteries [71]. Among these, lithium-ion batteries are the most commonly used in EV due to their advantages, such as being lightweight, reducing peak load [72], offering high specific power and energy density, and charging quickly [70]. For simulation, the electric vehicle used for this study is a Nissan Leaf. Specifications of the electric vehicle and its charger are elaborated in Table 5 [57].

4.4. Load Profile

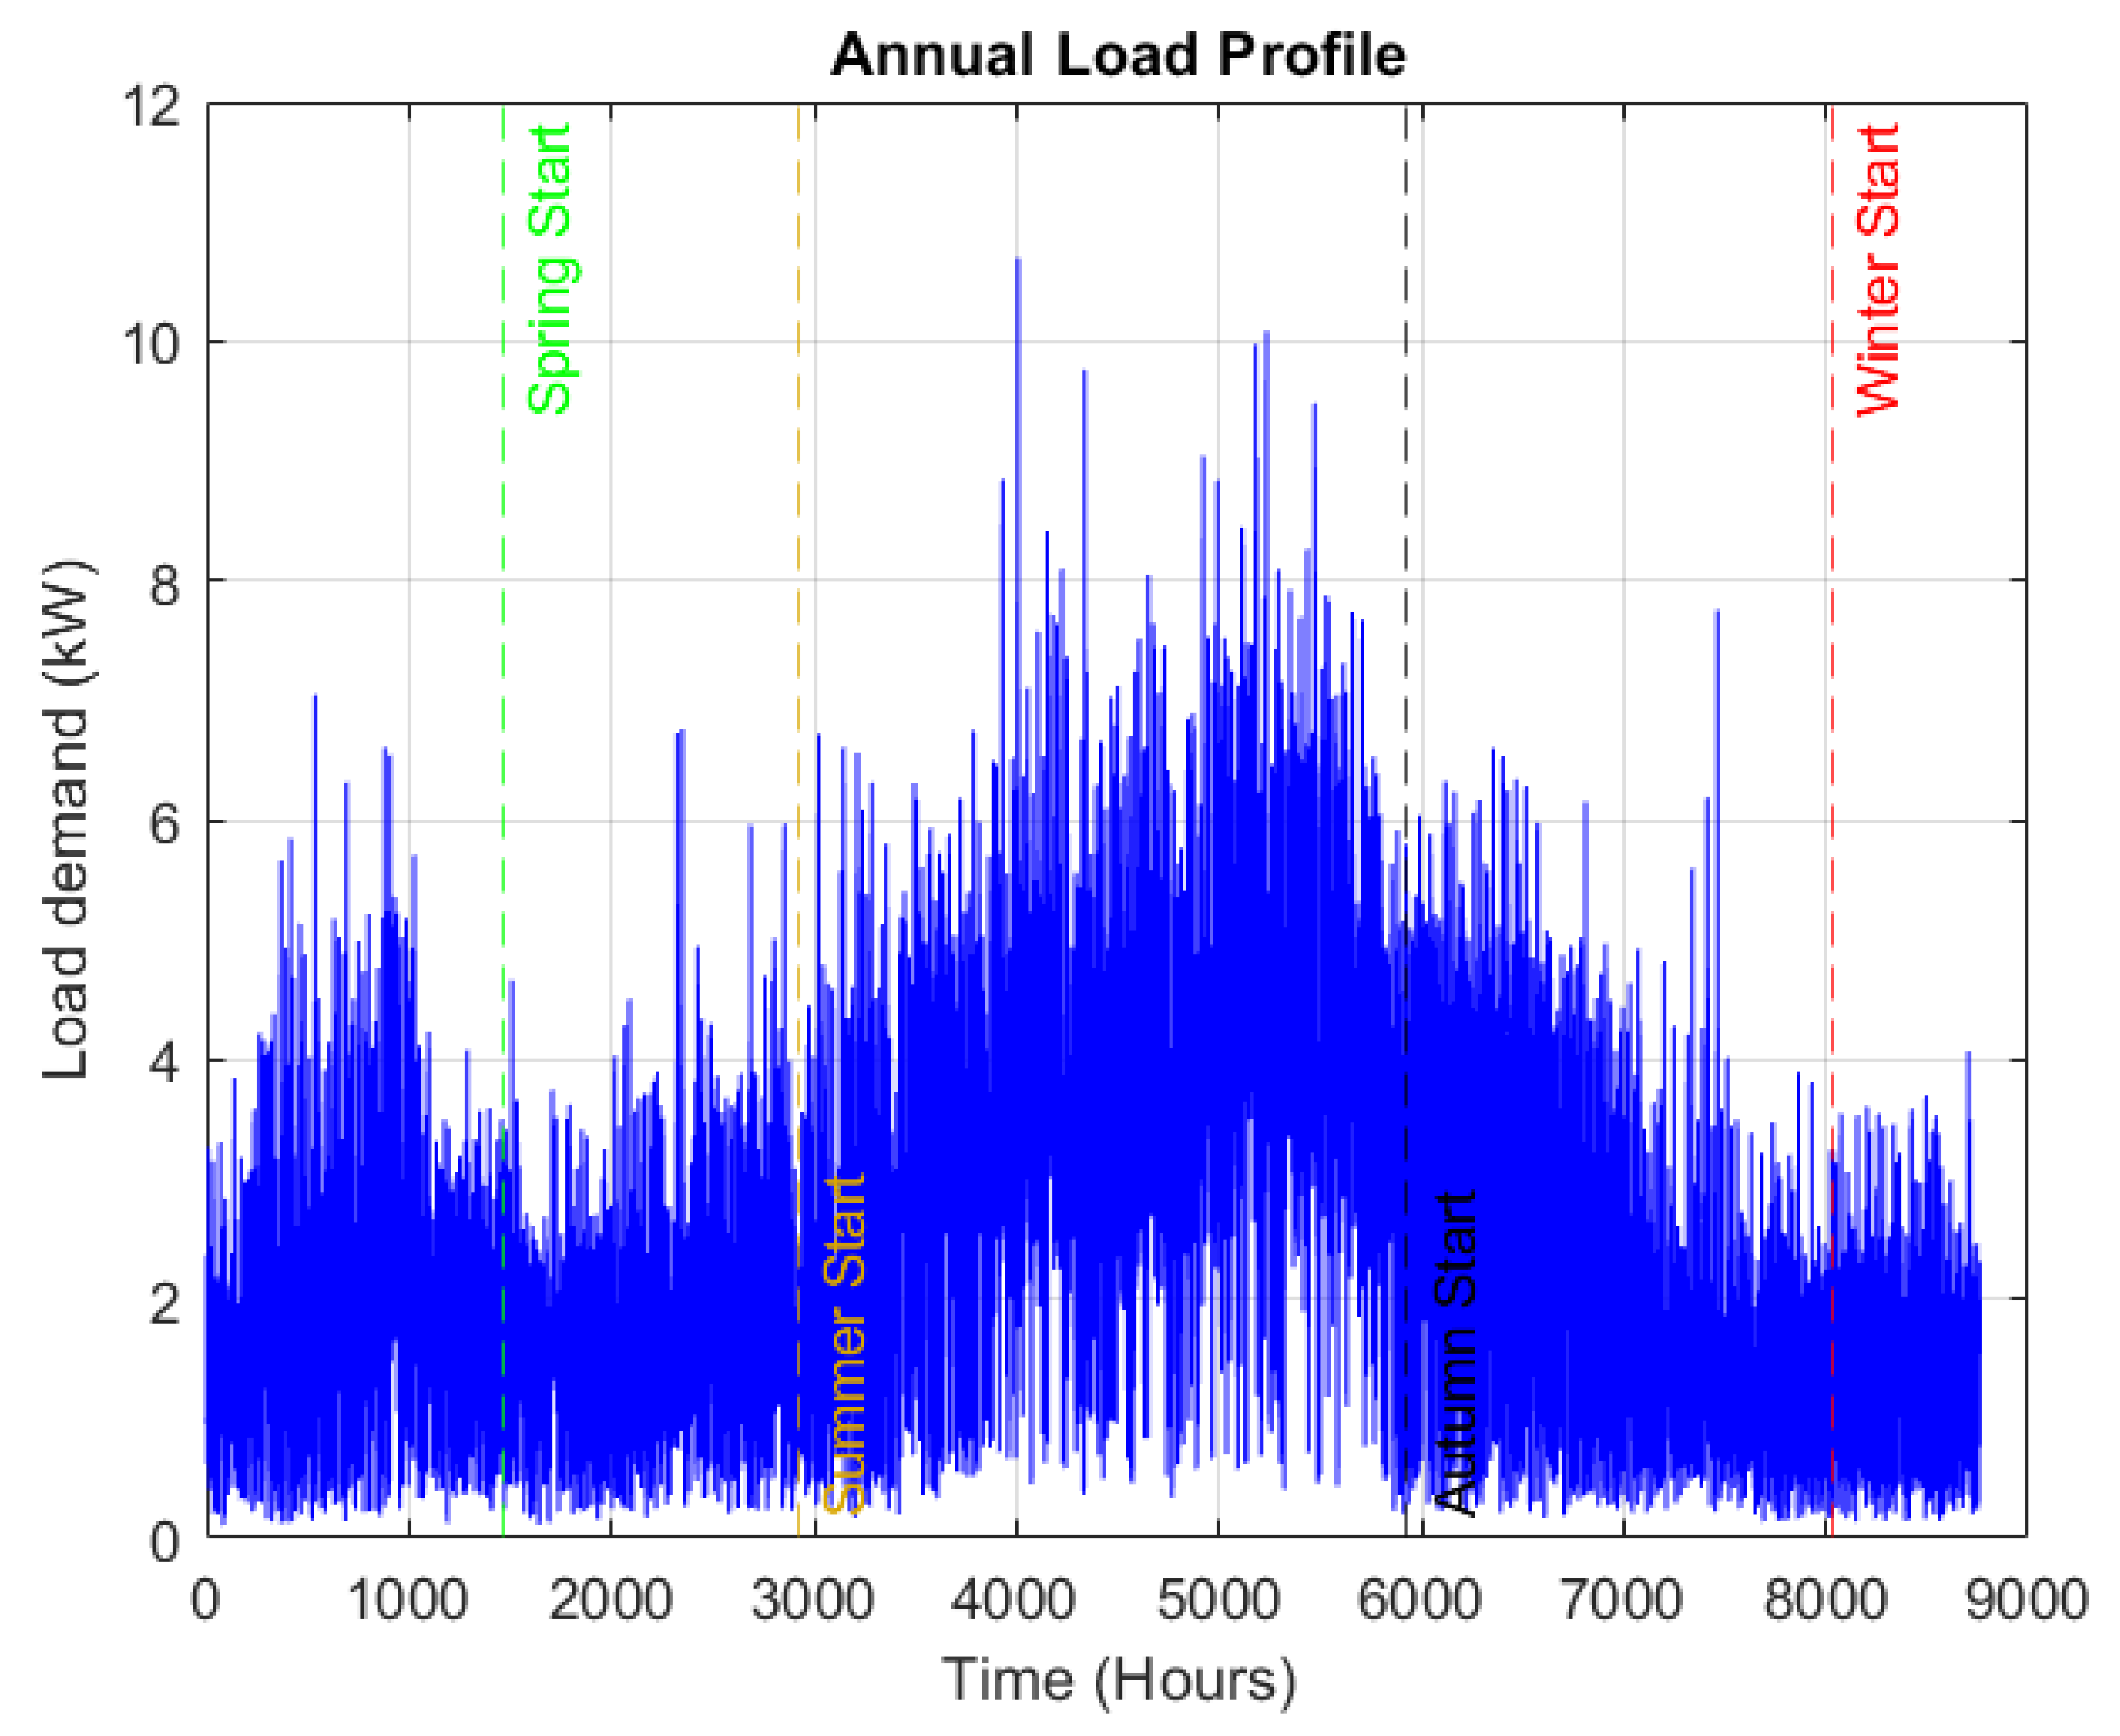
The study area benefits from abundant solar irradiance throughout the year, with peak levels observed in June. The average solar irradiance is highest during the summer, making it the most favorable season for generating electricity from PV systems, followed by spring, autumn, and winter. In winter, most consumers use heaters, while air conditioning is prevalent during the summer. Figure 5 shows the annual load profile of the household on an hourly basis. The analysis of the seasonal data is presented in Table 6, and the daily and monthly solar irradiance data are shown in Table 7.

5. Objective Functions

The main goal of this research is to determine the optimal number of components (PV and battery) in a grid-connected household system. Two different metaheuristic optimization techniques are applied (MOPSO and MOHHO) and their performance is evaluated. All optimization procedures and simulations were implemented using MATLAB software. The goal is to minimize two objective functions: Loss of Power Supply Probability and Cost of Energy, while maximizing the Renewable Energy Fraction as the third objective. A trade-off exists between these three objectives, as decreasing LPSP and increasing REF typically result in higher overall system costs, which in turn increase the COE. Therefore, the decision-maker must balance these objectives to find the best solution.
The Cost of Energy is calculated using the Discounted Cash Flow (DCF) analysis method, which estimates the value of investments based on projected future cash flows [73]. The COE is expressed in Equation (23) and incorporates the Net Present Cost (NPC) in US dollars, which includes costs such as operation and maintenance (O&M), replacement, and present costs, as well as the Capital Recovery Factor (CRF). The key goal is to maximize REF while minimizing LPSP and the COE.
C O E = C R F × x N P C x + C g r i d R g r i d E s e r v e d + E g r i d ( s e l l i n g )
where COE is the cost of energy (USD/kWh), Net Present Cost (NPC) in dollars can be calculated using Equation (24), E g r i d ( s e l l i n g ) represents the energy sold (kWh/year), and E s e r v e d denotes the primary load served (kWh/year) [24].
N P C $ = T A C C R F
where TAC represents the total annual system cost in U S D / y e a r , and the Capital Recovery Factor (CRF) is calculated using Equation (25) [24]. Here, i denotes the real interest rate, and n refers to the amortization period or system life, which is the lifetime of the solar panels.
C R F = i 1 + i n 1 + i n 1
The reliability of the system is assessed using the Loss of Power Supply Probability, which is the second objective function to be minimized and is calculated using Equation (26) [24].
L P S P = 1 8760 P d e f i c i t t × Δ t 1 8760 P d e m a n d t × Δ t ,   Δ t = 1
where P d e f i c i t is the power deficit (kW), and P d e m a n d is the load demand over the same period (kW) [74]. The LPSP value ranges from 0 to 1, where 1 indicates that the load is not met and 0 indicates that the load is fully met [75]. A lower LPSP value reflects higher system reliability [76].
The third objective function to be maximized is the Renewable Energy Fraction [24]. REF is the amount of energy supplied to the load generated from renewable energy sources and can be determined using Equation (27).
R E F = 1 8760 P p v + V 2 H × Δ t 1 8760 P p v + V 2 H + E g r i d ( p u r c h a s e d ) × Δ t ,   Δ t = 1
where Δ t indicates the time change, set to 1, and E g r i d ( s e l l i n g ) represents the annual electricity purchased from the grid. The Grid Contribution Factor (GCF) is utilized to minimize REF. Since GCF is the inverse of REF, it reflects the grid contribution to fulfilling the energy demand and can be expressed as shown in Equation (28). By decreasing GCF, the REF value increases, thereby maximizing the use of renewable energy [24].
G C F = 1 R E F

5.1. Limits of Decision Variables

The objective functions are subjected to the following constraints:
N x m i n N x N x m a x ,   x P V , B a t
where N x represents the number of component x. The setting of upper and lower limits for decision variables is highly dependent on the problem (including the complexity of the search space and the number of variables). In all optimization algorithms, these bounds have been established through a process of trial and error. For this research, the upper and lower limits of the variables are specified in Equation (30):
1 N P V 100 1 N B a t 25

5.2. Energy Balance of the System

The energy balance in the system ensures that at every time step, the total energy supplied by various sources matches the total energy demanded by the household loads and the EV load. The energy balance equation can be expressed as follows:
I n p u t   E n e r g y     O u t p u t   E n e r g y
where input energy and output energy are expressed as shown in (32) and (33), respectively
I n p u t   E n e r g y = E p v ( t ) + E p u r c h a s e d ( t ) + E d i s c h a r g e ( t ) + E V 2 H ( t )
O u t p u t   E n e r g y = E H o u s e _ L o a d ( t ) + E E V _ L o a d ( t ) + E s o l d ( t ) + E c h a r g e ( t ) + E d u m p ( t )
where:
E p v : energy generated by the PV system
E p u r c h a s e d : energy purchased from the grid
E d i s c h a r g e : energy discharged from the battery
E V 2 H : energy provided by the electric vehicle to the house (vehicle-to-home energy)
E H o u s e _ L o a d : household load demand
E E V _ L o a d : EV load demand
E s o l d : energy sold back to the grid
E d u m p : energy dumped (excess energy that cannot be utilized or stored)
The Equation (31) must be true for every time step t. If there is any imbalance, it is tracked using (LPSP) metric, indicating a failure in meeting the load demand.

6. Energy Management and Optimization

6.1. Home Energy Management Strategy

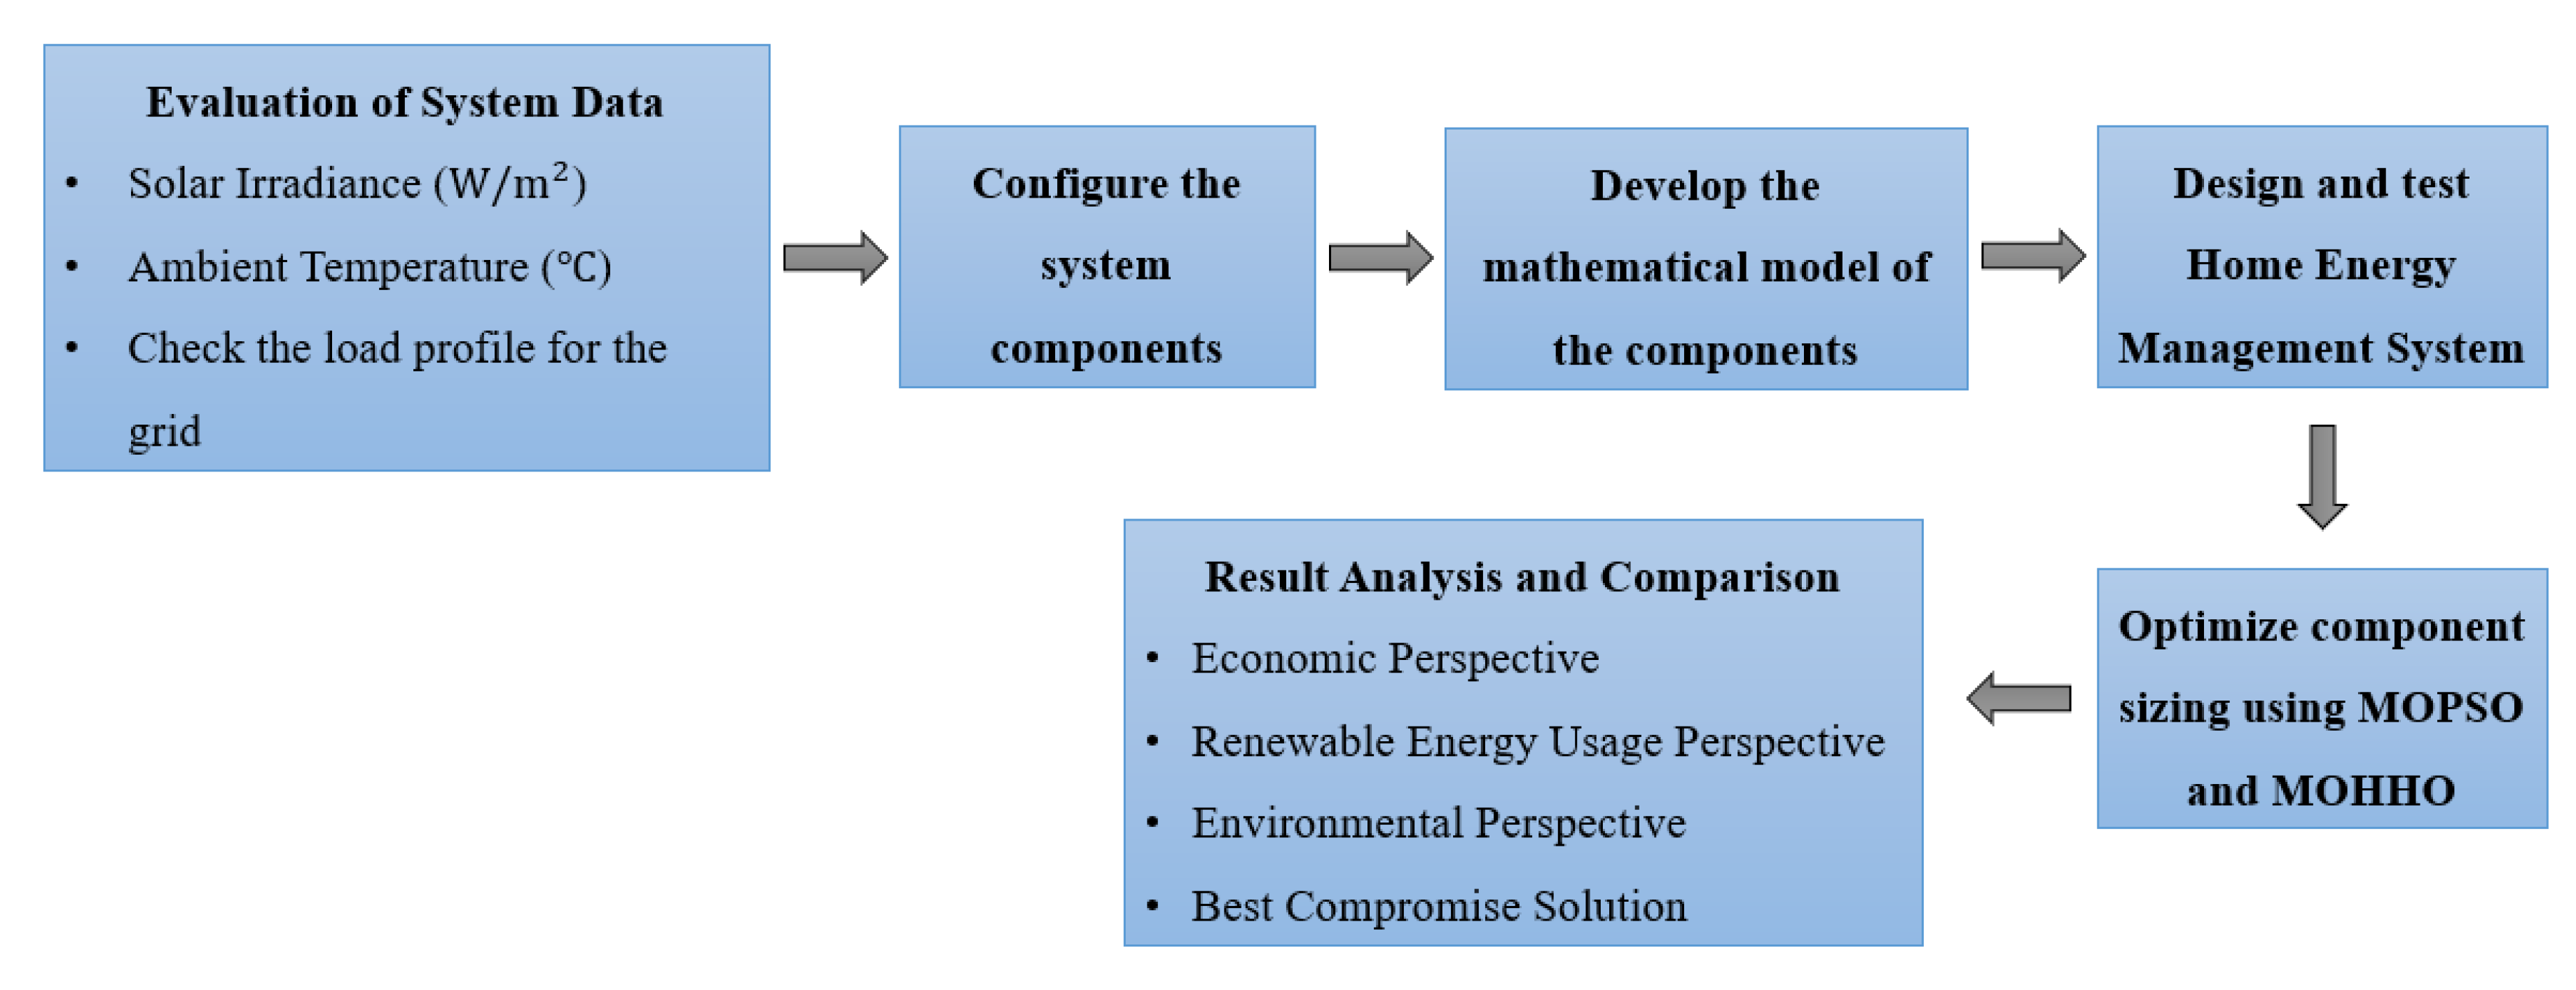
The energy management dilemma is defined mathematically as the overall control method involving inputs, outputs, objectives, and constraints. There are two approaches to addressing this challenge: rule-based (RB) and optimization-based methods [77]. Even though the optimization-based approach is effective, it is limited by its high computational requirements and the complexity of the mathematical equations required, making it less favorable. Conversely, the rule-based approach, which is considered in this study, is preferred due to its advantages, such as providing exact solutions and enabling fast decision-making to meet load demand at minimal operating cost. To achieve the objectives in this study, the metaheuristic method is utilized for the sizing of the system configuration (PV-BES-EV), as outlined in the flowchart in Figure 6.
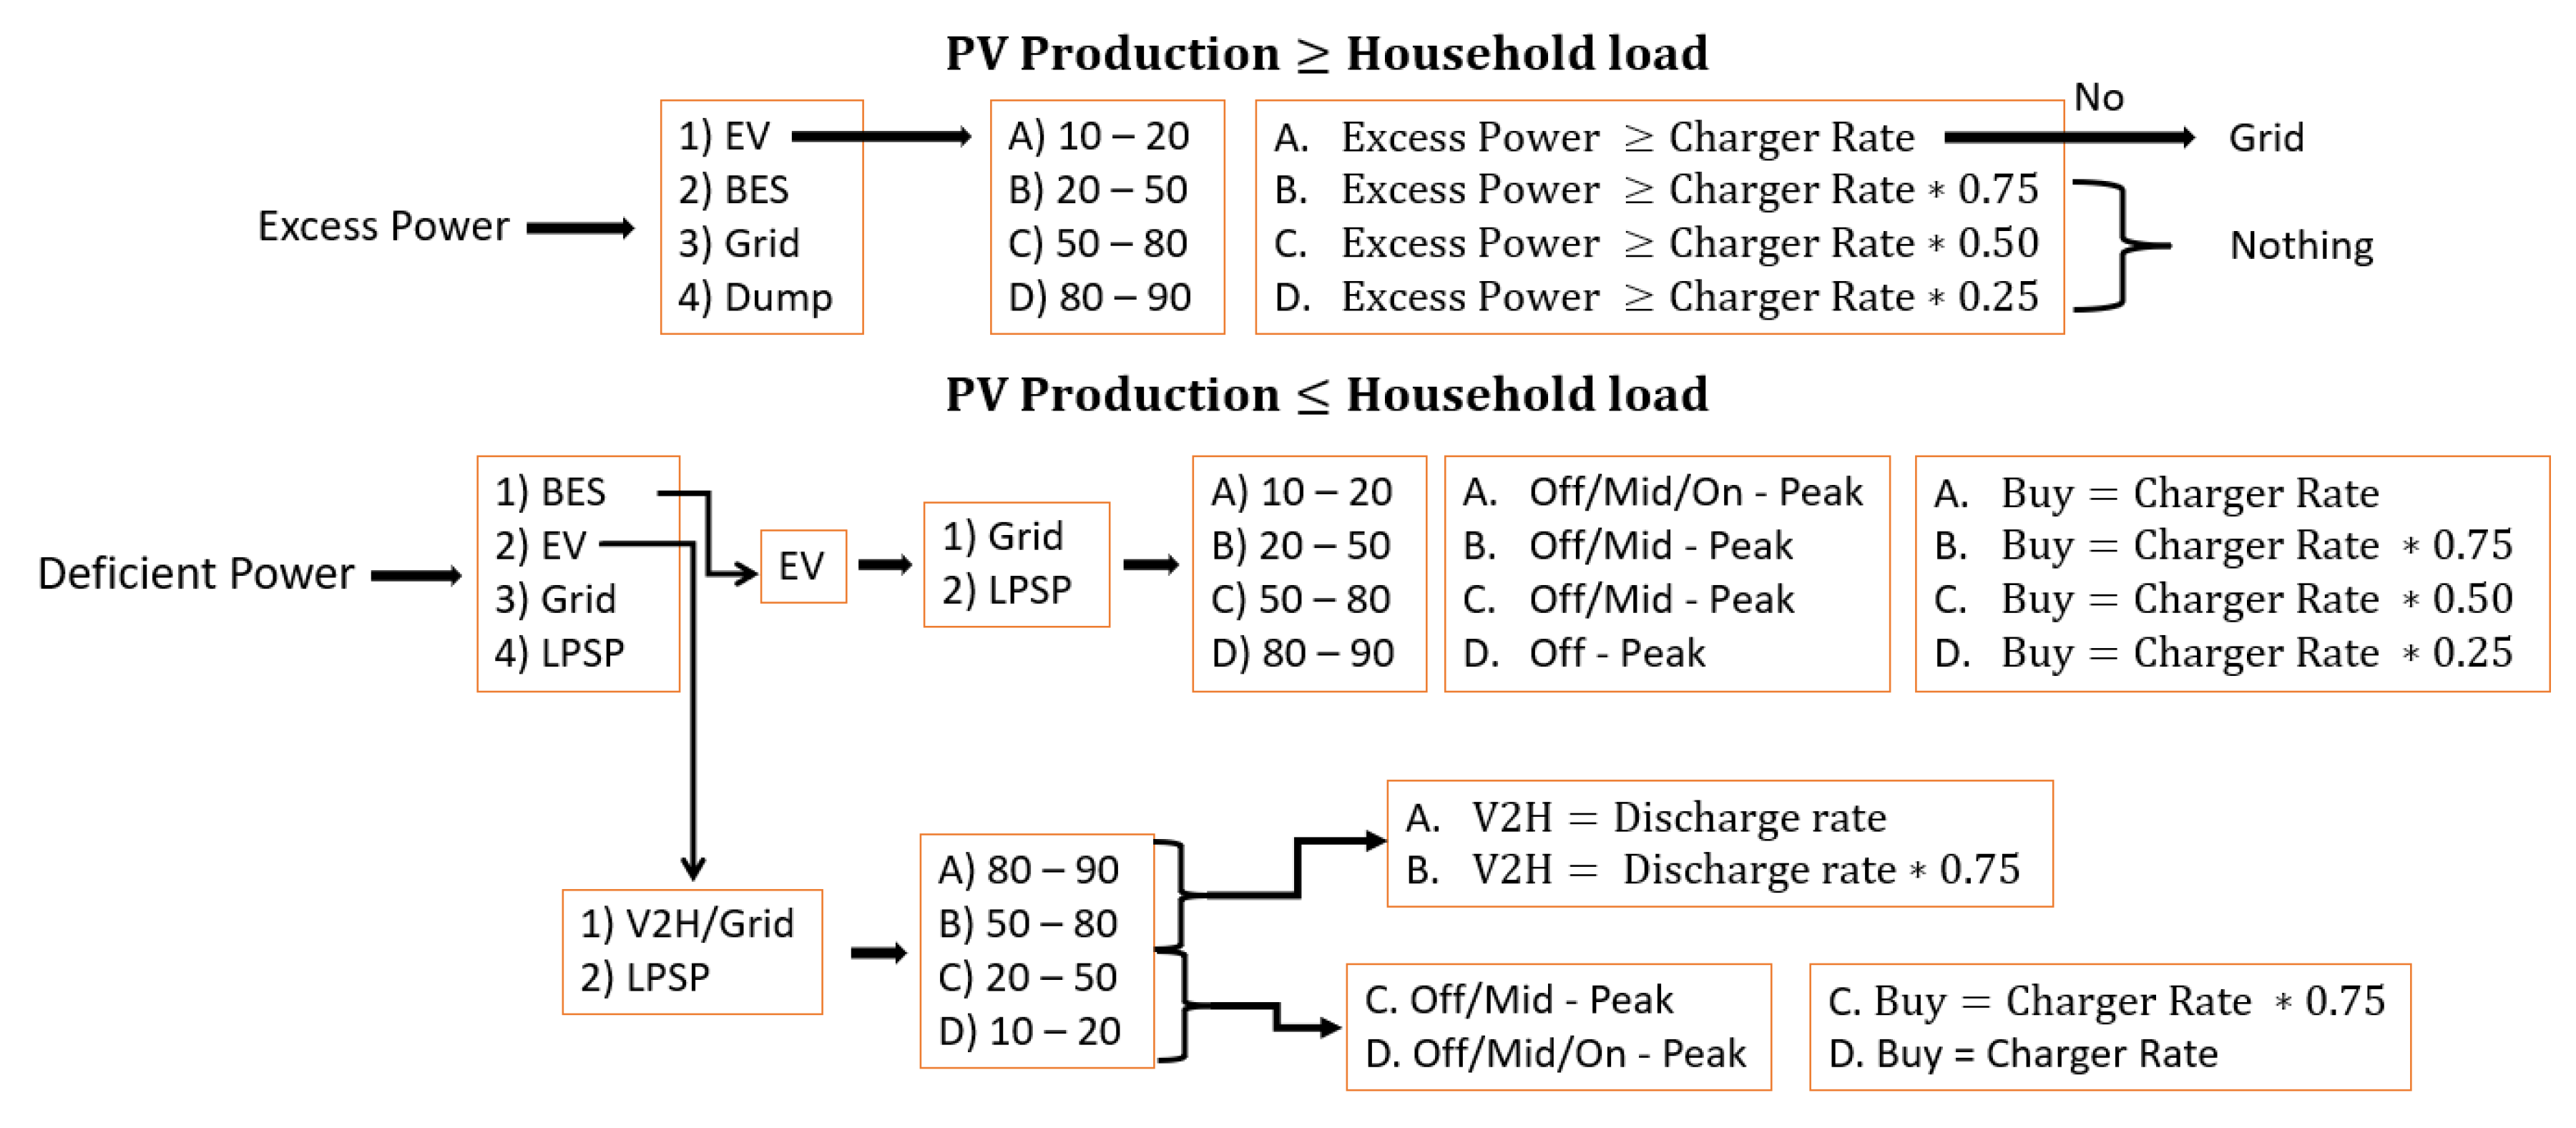
To minimize COE and LPSP while maximizing REF, the proposed rule-based home energy management system strategy exploits the TOU tariff to serve the system load demand in coordination with the PV generation, BES charging/discharging, EV charging, V2H and import/export of electricity from/to the grid, as summarized in the flowchart in Figure 7.
When PV power output exceeds household demand, the proposed energy management strategy distributes the excess power according to a defined priority sequence. First, any excessive power is allocated to charging the EV, if it is available. The EV charging process is managed based on its state of charge, categorized into scenarios A, B, C, and D. In Scenario A (critical SoC level), the EV requires the full charger rate, and if the excess PV power falls short, additional power is purchased from the grid if available. In Scenarios B, C, and D (non-critical SoC levels), the EV charging proceeds solely from the PV surplus, with no additional grid support needed. If the EV is unavailable, the excess power is directed to the Battery Energy Storage. Should the BES reach full capacity and be unable to store the excess energy, the remaining excess power is either exported to the grid if allowed, or is dumped to maintain system balance.
When PV power output falls short of household demand, the energy management strategy addresses this power deficit through a defined priority sequence. First, the system checks the Battery Energy Storage for available energy. If the BES has sufficient charge, it discharges to meet the household demand. In cases where the BES can fully cover the household demand but the Electric Vehicle is also available and requires charging, the EV is charged directly from the grid. Charging is managed based on Time-of-Use (TOU) tariffs and the EV’s state of charge. Lower SoC levels allow charging across more periods, while higher SoC levels restrict charging to off-peak times to minimize the grid costs. If the BES cannot fully satisfy household demand, the system checks if the EV is available for Vehicle-to-Home support. If the EV’s SoC is above a specified threshold (Scenarios A and B), it discharges to supply the household. Should both the BES and V2H support from the EV be insufficient to meet demand, the system imports power from the grid. Finally, if no other sources can fulfill the household load, the system accepts a temporary shortfall, marking it as a Loss of Power Supply Probability.

6.2. MOPSO and MOHHO Optimization Techniques

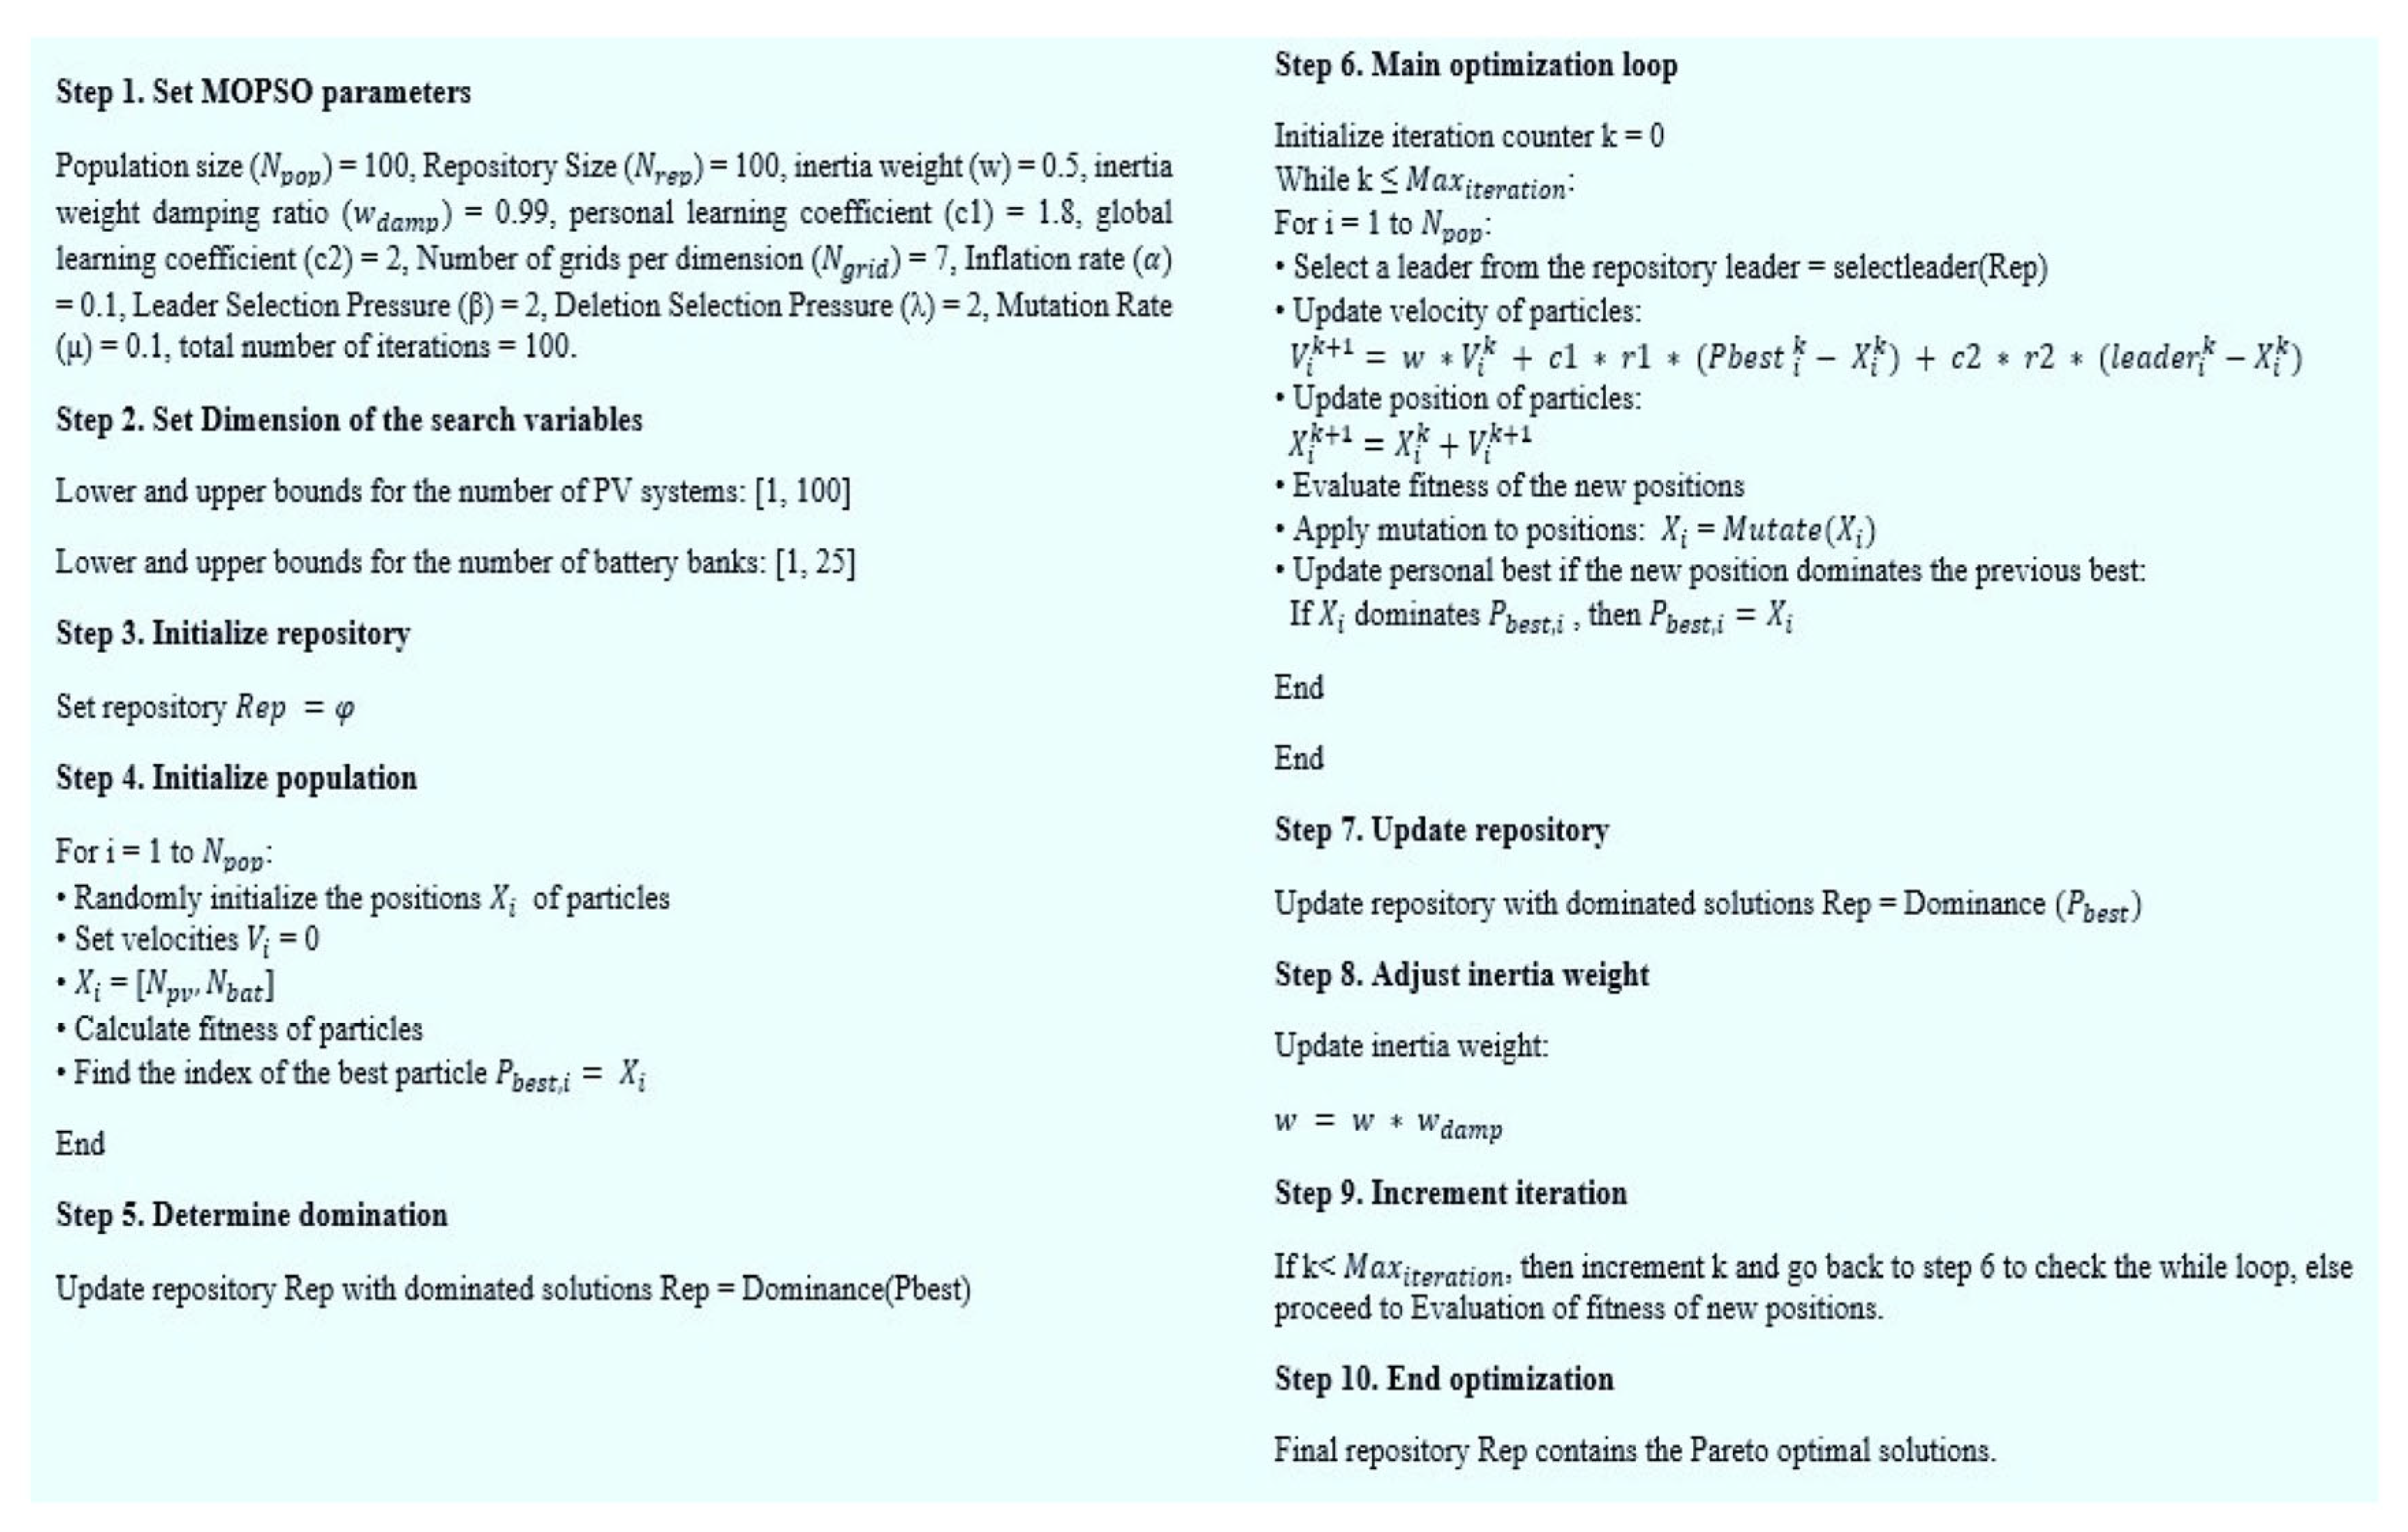
This section explains the implementation of MOPSO and MOHHO algorithms for optimizing the system’s configuration (Figure 8 and Figure 9). MOPSO is fast and easy, and balances exploration and exploitation, but it can get stuck in local optima and is sensitive to parameter settings. MOHHO offers better global search and avoids local traps, though it may converge slower and needs more computation.

6.3. Best Compromise Solution

Many studies have focused on developing methods to select the best compromise, or preferred solution. In this paper, the fuzzy set method is used to identify the best compromise solution from the generated Pareto front (PF). Once MOPSO and MOHHO produce their PFs, Equations (34) and (35) are applied for membership functions [78,79,80,81]:
For COE and LPSP (minimizing functions),
μ j = 1 ,   F j F j m i n F j m a x F j F j m a x F j m i n , F j m i n < 0 ,   F j F j m a x F j < F j m a x
For REF (maximizing function),
μ j = 0 ,   F j F j m i n F j F j m i n F j m a x F j m i n , F j m i n < 1 ,   F j F j m a x F j < F j m a x
where μ j represents the membership function, F j is the j-th objective function, and F j m i n and F j m a x are its minimum and maximum values, respectively. Then, the normalized membership function is calculated as in Equation (36):
μ k   = j = 1 3 μ j k l = 1 M j = 1 3 μ j l
where M denotes the number of solutions in the Pareto front. The solution with the highest μ k value is considered the best compromise solution.

7. Results and Discussions

The proposed procedure was carried out to investigate a grid-connected household system in Riyadh, consisting of PV, BES, and EV components, designed to meet household energy demands. The simulation was performed using MATLAB code with a one-hour time step, operating on one year of data (8760 samples/year). The optimization techniques were implemented using MATLAB R2022b on an Intel(R) Core (TM) i7-7700HQ CPU @ 2.80 GHz. In this section, the results are obtained for both flat rate and TOU rates and categorized into three perspectives:
  • Economically optimal solution (lowest COE)
  • Renewable energy usage perspective (highest REF)
  • Environmentally optimal solution (lowest GHG emission)

7.1. Flat Rate

Table 8 presents the results from the MOPSO and MOHHO analysis of the sizing problem, and Table 9 presents the best compromise solution found for both techniques. Where the flat rate used is 0.048 USD/kWh for the buying price and 0.067 USD/kWh for the selling price.

7.2. TOU Rates

Table 10 presents the results from the MOPSO and MOHHO analysis of the sizing problem, where Time of Use (TOU) rates are applied.
From an economic perspective, MOPSO achieves a lower COE of USD 0.0210/kWh compared to MOHHO of USD 0.0226/kWh. Additionally, MOPSO results in a lower net present cost (NPC) of USD 24,257, while NPC of MOHHO is USD 26,595. However, this cost-saving solution is at the expense of lower REF of 50.86% and higher GHG emissions of 2595 t C O 2 e . Moreover, MOPSO has a higher LPSP of 7.15%, compared to MOHHO at 6.13%, indicating reduced system reliability. In MOPSO and MOHHO, the same number of PV panels are used, but in MOHHO two additional battery units are used compared to MOPSO using one unit, which explains the lower capital and operational costs, but this also limits the amount of renewable energy generated or stored, leading to increased reliance on the grid and consequently higher GHG emissions.
From a renewable energy usage perspective, both MOPSO and MOHHO achieve near identical results, with a REF of 97.37% and 97.30% respectively, demonstrating that the household energy demand is almost entirely powered by renewable energy sources. The COE for MOPSO is USD 0.0845/kWh, with a significantly higher net present cost of USD 106,035 compared to the economic perspective. This high NPC is because of the system configuration, which includes 100 PV panels and 23 batteries, ensuring high renewable energy use but requiring a substantial capital investment. Additionally, both techniques show a relatively low LPSP of 1.80% and 2.11% of MOPSO and MOHHO respectively, indicating improved reliability in comparison to the economic perspective. GHG emissions are reduced to 1086 and 1071 t C O 2 in MOPSO and MOHHO respectively, making this option more environmentally sustainable. This consistency between both techniques emphasizes the robustness of the solution when considering renewable energy usage where the selection of either technique does not affect the solution.
From an environmental perspective, MOHHO and MOPSO achieve near identical results, with lower GHG emissions of 928 t C O 2 e of MOPSO compared to MOHHO of 929 t C O 2 e . MOPSO slightly outperforms MOHHO across most metrics, particularly in REF, COE, and LPSP.
It is worth noting that the significant increase in system costs in both the renewable energy usage and environmental perspectives is due to the goal of increasing reliance on renewable energy sources, rather than purchasing energy from the grid, which is the most cost-effective option. The heavy dependence on photovoltaic systems directly contributes to the overall high cost of the system. The comparison between MOPSO and MOHHO highlights trade-offs depending on the perspective. MOPSO seems to be the better option for users focusing on cost-effectiveness and marginally higher reliability.
Table 11 provides additional insights into the system performance across each perspective, focusing on PV energy production, grid interaction, energy dumping, energy shares (PV, grid, V2H), and net CO2 savings.
From the economic perspective, MOPSO and MOHHO produce the same PV energy (12.45 MWh), resulting in a higher PV share of 48.53% in MOHHO, while MOPSO achieves a lower share at 45.80%. Although both have lower-than-allowable shares of PV, the system still allows for some energy to be sold back to the grid (3.02 MWh) in MOPSO compared to MOHHO (1.30 MWh). However, the low PV generation leads to heavy reliance on the grid. MOPSO depends more on grid purchases (13.36 MWh in MOPSO and 12.15 MWh in MOHHO). In both techniques, Vehicle-to-Home (V2H) compensates for the energy not purchased from the grid, with MOPSO and MOHHO showing V2H shares of 5.05% and 4.11%, respectively. MOHHO achieves higher net CO2 emission savings of 36.73% compared to MOPSO 30.97%, because MOHHO relies more on renewable energy generated or stored in the battery and less on grid power.
From the renewable energy perspective, both MOPSO and MOHHO show much better results, generating 51.89 MWh and 50.85 MWh of PV power in MOPSO and MOHHO respectively. As a result, there is a significant amount of energy sold back to the grid. The PV share is nearly full, showing that the system primarily relies on renewable energy to meet household and EV demands. Due to the high power generated by PV, it can be observed that the grid share is reduced to 2.62% and 2.69% in MOPSO and MOHHO, respectively. Both methods achieve a net CO2 emissions savings of 71.09% in MOPSO and 71.51% in MOHHO, emphasizing the significant environmental benefits when prioritizing renewable energy usage.
From the environmental perspective, MOPSO produces a little more PV power compared to MOHHO, resulting in a slightly higher PV share of 95.31%. This additional PV generation in MOPSO also leads to more energy being sold back to the grid. Grid purchases are slightly lower in MOPSO (1.82 MWh) compared to MOHHO (1.92 MWh), indicating a marginally higher reliance on renewable energy in MOPSO. Despite these small differences, both techniques show almost similar improvements in environmental performance, with MOHHO achieving a net CO2 saving of 75.28%, compared to 75.31% for MOPSO.
It is worth noting that V2H’s share in renewable energy usage and environmental perspectives in both techniques is very low, indicating that the integration of V2H in the system is minimal. In this system, V2H’s share is influenced by several factors including EV availability, and initial SoC of EV upon arrival. The EV may not be available when the system needs energy, limiting its contribution. V2H is limited to when the EV’s SoC is between 50% and 90%. If the EV often arrives with a SoC outside this range (less than 50%), it will not contribute to V2H. In these perspectives, the system prioritizes the use of PV and battery storage first, so V2H is only used as a backup.
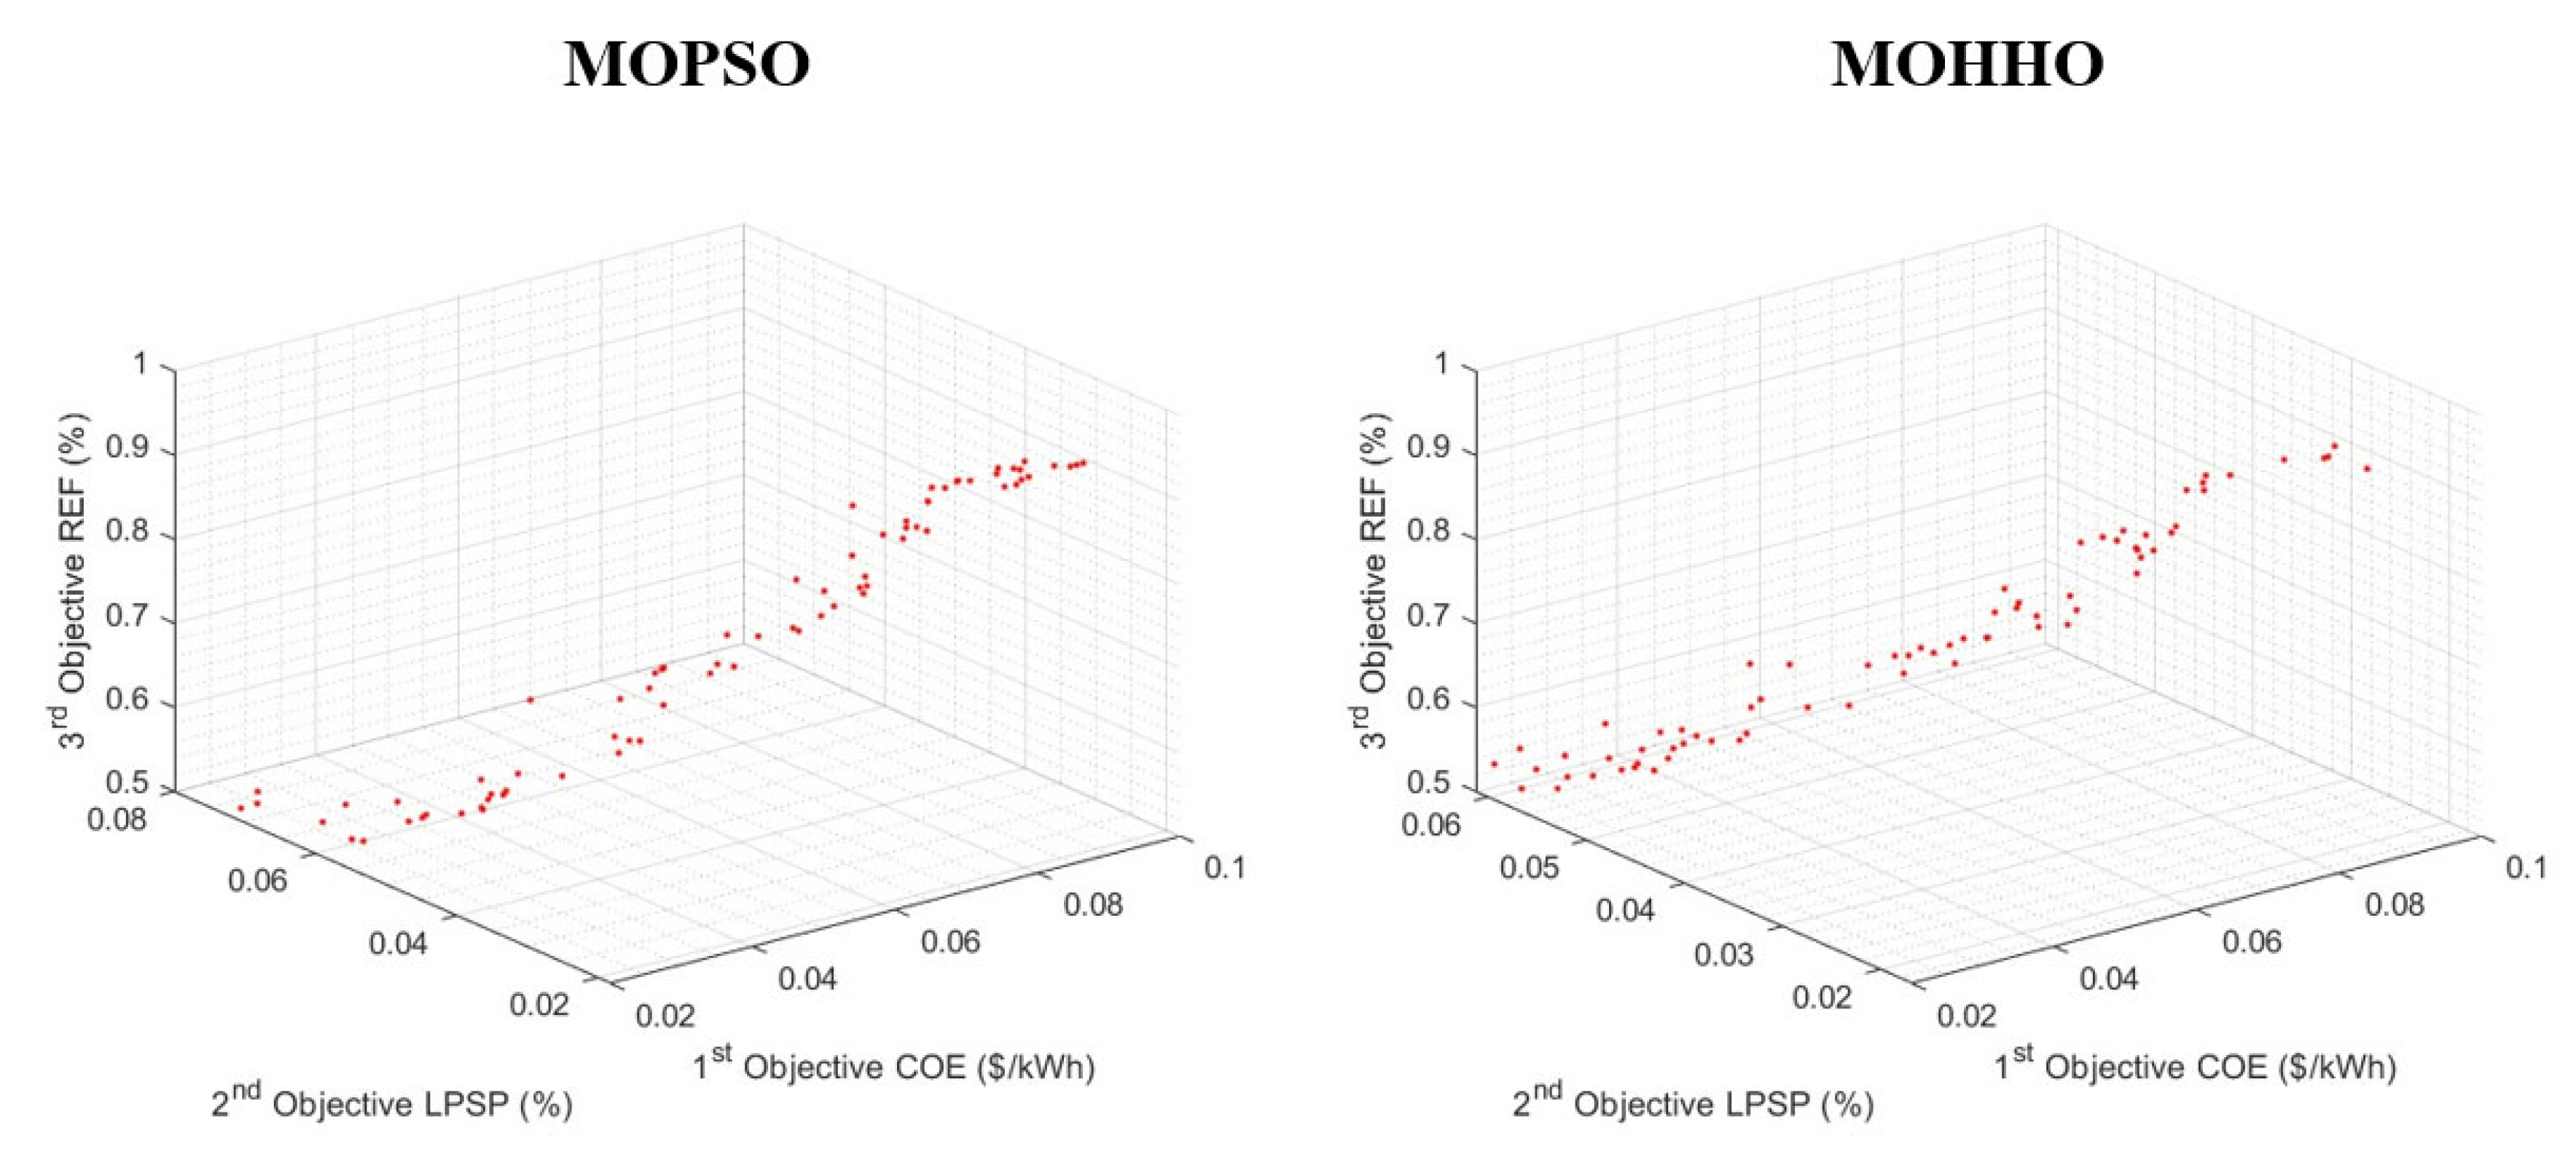
The Pareto front for the three objectives (COE, LPSP, and REF) is illustrated in Figure 10. It can be observed that as the REF ratio increases, the COE also increases, while the LPSP decreases. This is due to the fact that higher REF values require more PV panels, leading to higher COE and lower LPSP.
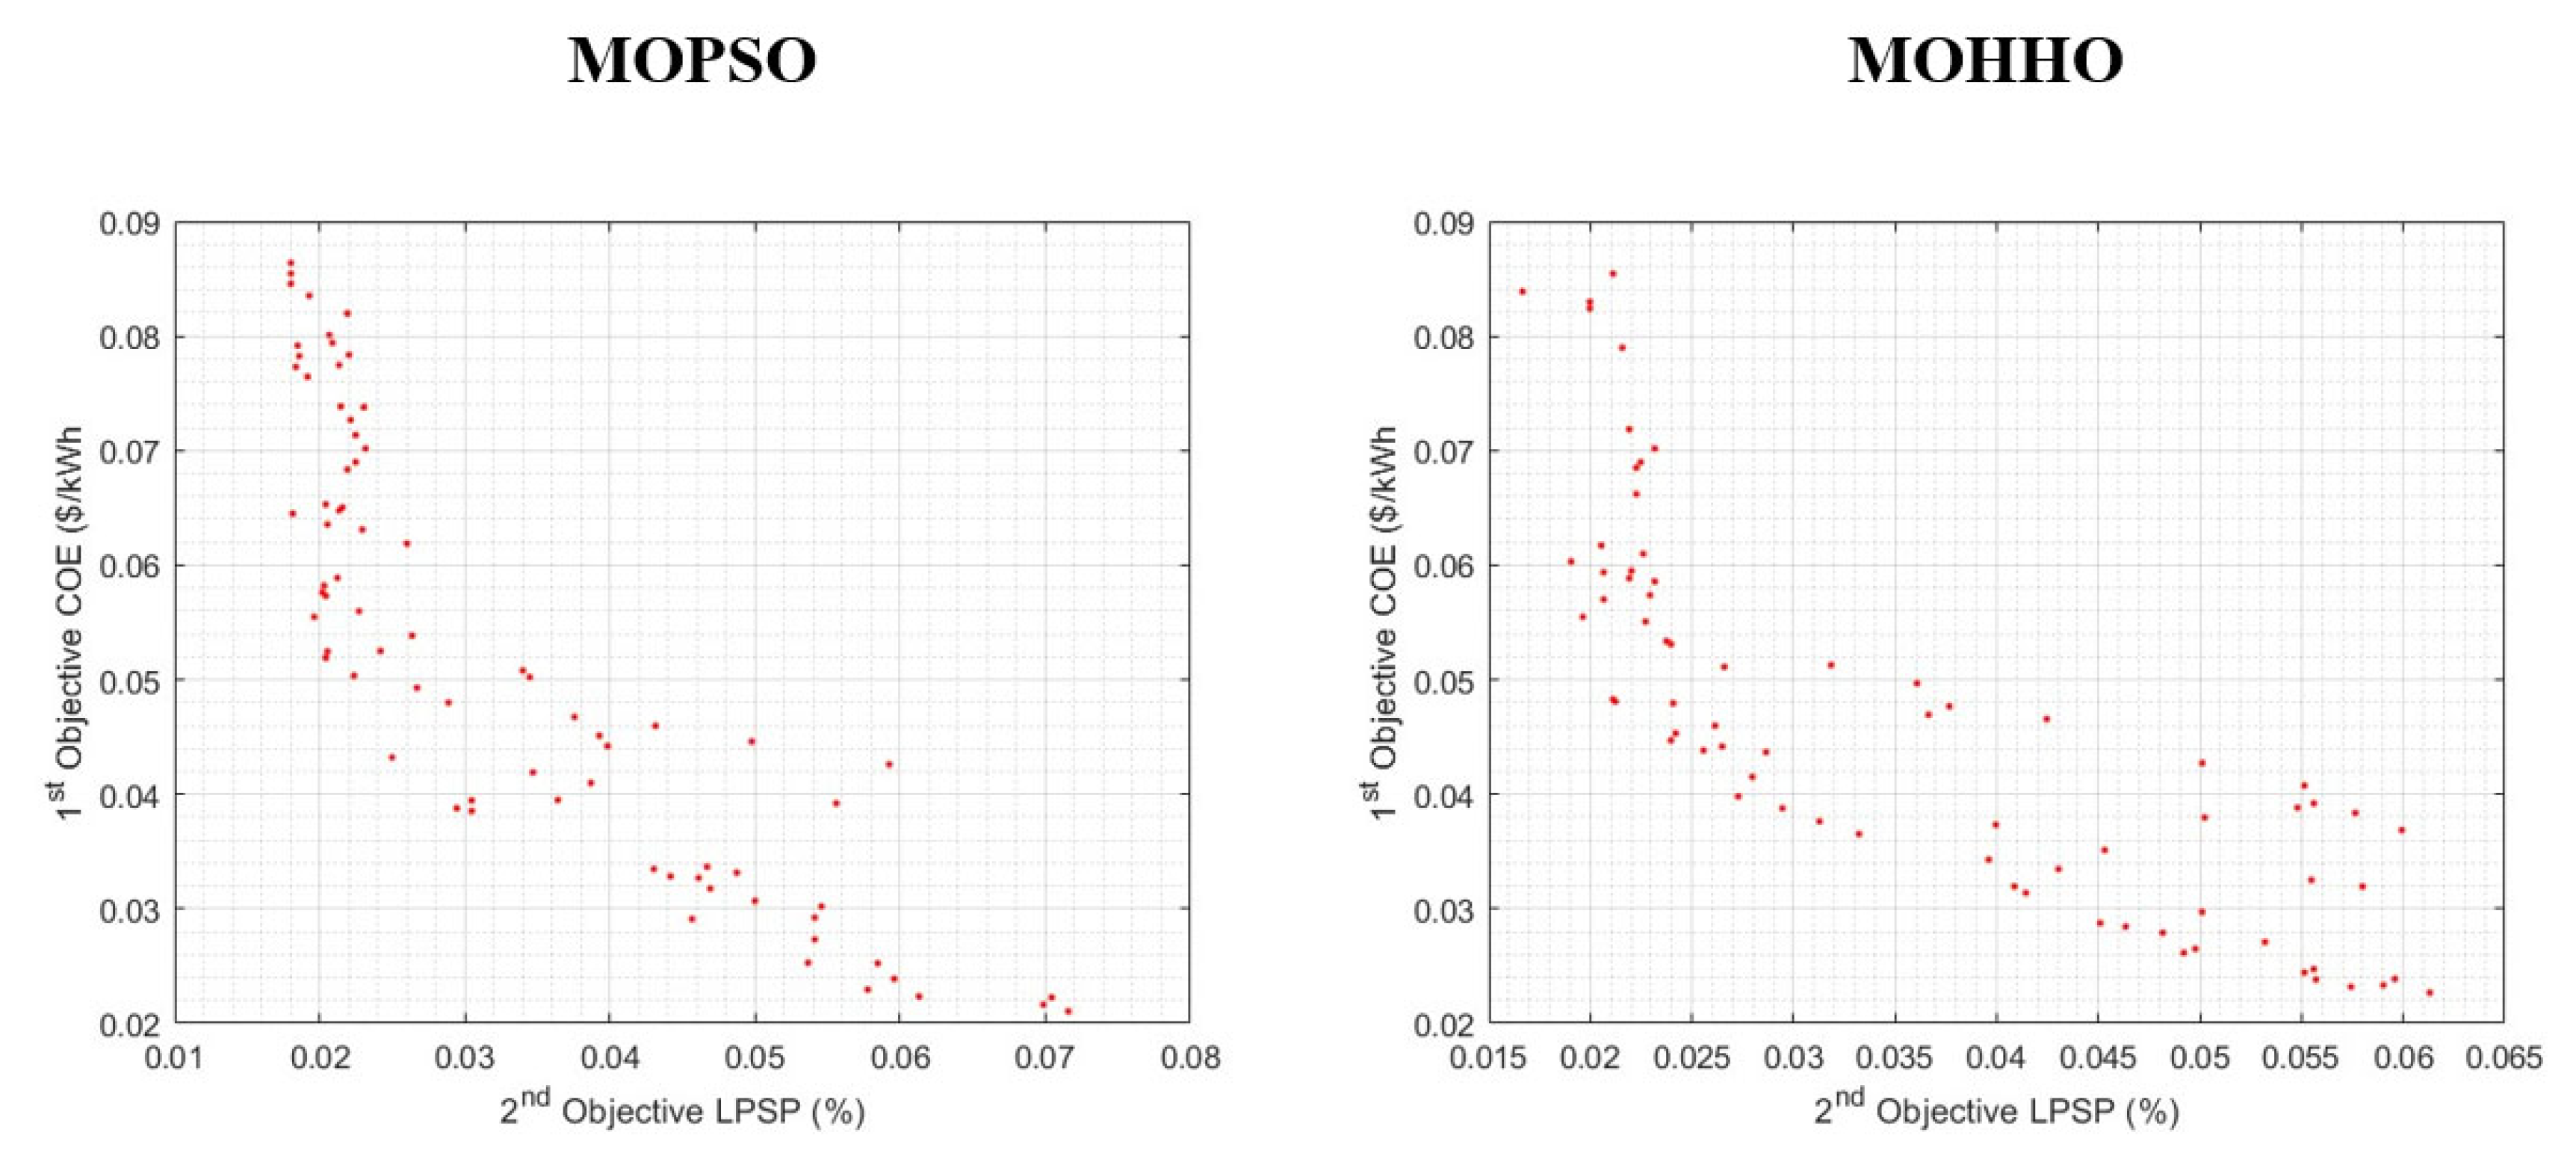
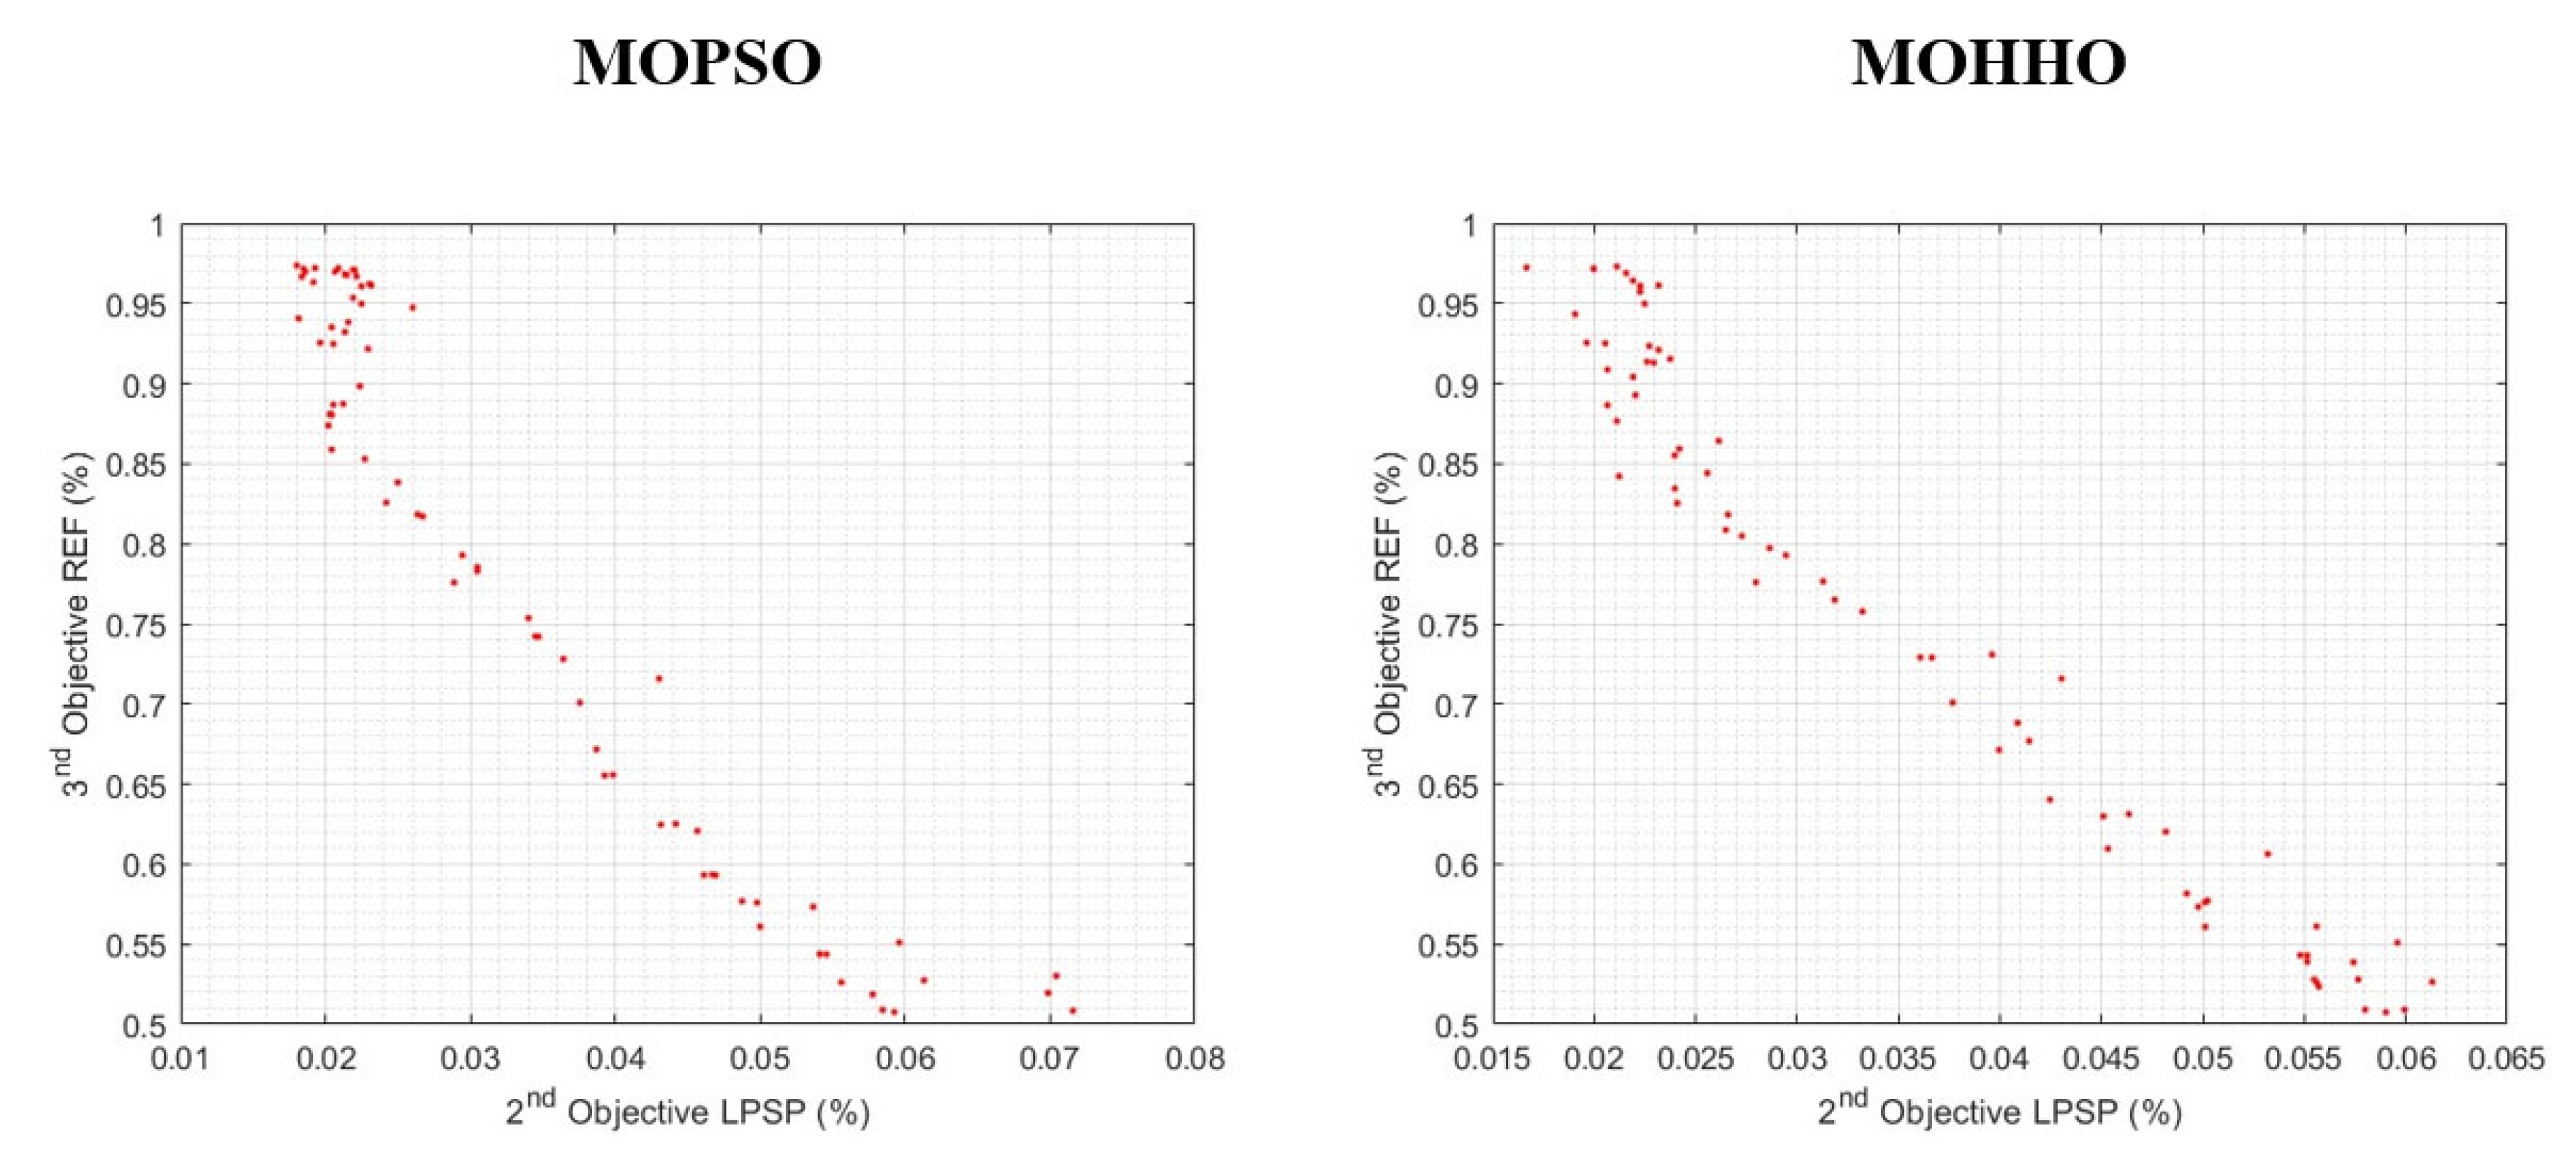
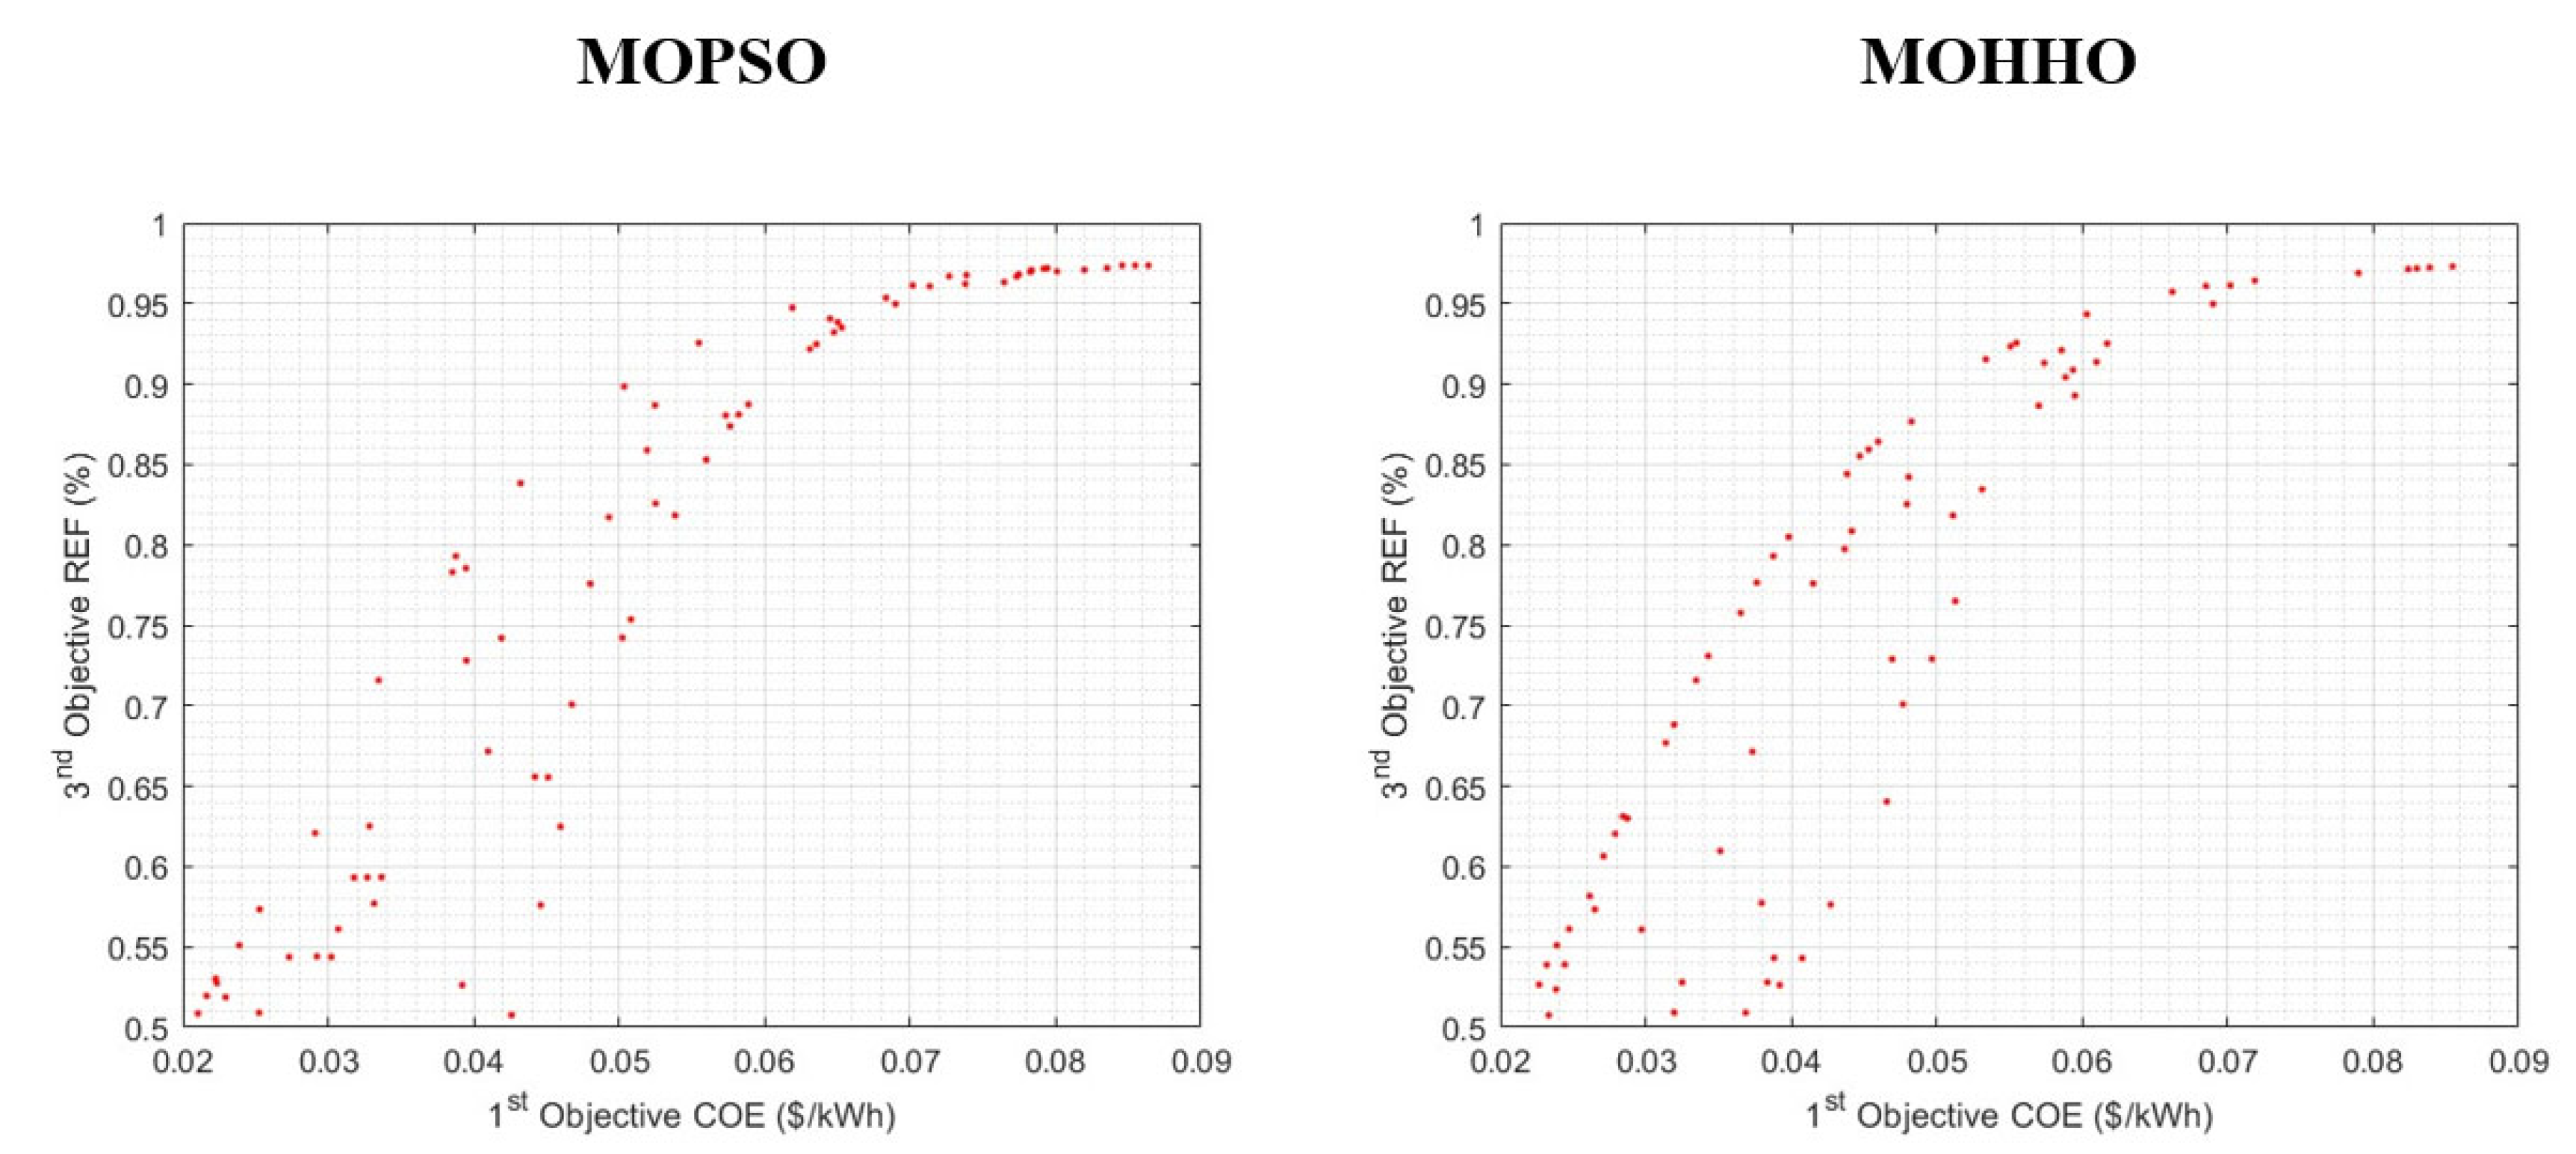
To provide a clearer understanding of the relationship between the three objective functions, Figure 11 shows the Pareto front for LPSP and COE, while Figure 12 shows the PF for LPSP and REF, and Figure 13 shows the PF of REF and COE.
Figure 11 shows that MOPSO highlights a predictable trade-off between LPSP and COE, where reducing COE increases LPSP, making it better for a highly reliable system. In contrast, MOHHO provides more flexibility and diverse low-cost solutions with acceptable reliability, making it better for a cost-effective system.
From Figure 12, it can be observed that MOPSO and MOHHO show consistent trade-off between LPSP and REF. MOPSO is concentrated at lower LPSP with high REF, making it suitable for the system where reliability is crucial. MOHHO, on the other hand, provides more flexibility in trade-offs, exploring moderate reliability solutions more effectively. This makes it suitable for the system where sacrificing reliability is tolerable for the sake of a higher renewable energy fraction.
As illustrated in Figure 13, COE increases with the increase in REF. MOPSO offers a more concentrated set of solutions, making it suitable for systems where renewable energy usage is prioritized. However, MOHHO offers more flexibility, exploring trade-offs between cost and renewable energy fractions. This makes it a better choice if the system requires balance between cost and the renewable energy fraction.
While optimizing each individual perspective provides valuable results, real-world decision-making requires a more comprehensive approach that balances the three objective functions. The Pareto front provides a set of optimal trade-offs between the conflicting objectives, but it is still a challenge for the decision-makers to select the most suitable solution based on their priorities. To overcome this, a compromise solution that effectively balances all objectives must be identified. Table A1 presents the solutions of the PF and their normalized membership values for MOPSO and MOHHO. It can be observed that the maximum values of normalized membership are on solutions 89 and 30 for MOPSO and MOHHO, respectively. These solutions represent the best compromise solutions for both techniques. The results obtained by using the best compromise solutions are given in Table 12 and Table 13.

7.3. Performance Evaluation of MOPSO and MOHHO Techniques

The performance evaluation of MOPSO and MOHHO differed from that of single-objective PSO and HHO because there are multiple optimal solutions generated. To evaluate the performance, statistical metrics such as minimum, maximum, range, standard deviation, and mean of the Pareto solutions were used. These evaluation results are provided in Table 14.

7.4. Comparison with Recent Optimization Studies

A comparative analysis between this study and the work in [82] reveals both methodological distinctions and overlapping insights in the evaluation of grid-connected PV systems across various cities in Saudi Arabia. This study employs a multi-objective optimization approach that incorporates economic, reliability, and renewable energy indicators. These objectives are examined from three key perspectives (economic, renewable, and environmental) allowing for a balanced evaluation of cost, system performance, greenhouse gas (GHG) reduction, and grid interactions. In contrast, ref. [82] addresses a dual-criteria evaluation focusing primarily on REF and NPC, comparing these metrics across different cities in the Kingdom. The findings indicated that locations such as Hail, Sakaka, and Jeddah offer optimal trade-offs, with moderate NPC (USD 18.4k) and REF (47%), while other cities like Al Batin and Al Wajh show more extreme values in both cost and renewable contribution. Sensitivity analysis in [82] demonstrates that increasing GHI significantly reduces both COE (from USD 0.057/kWh to USD 0.047/kWh) and NPC (from USD 82k to USD 68k). In contrast, this study confirms that optimal PV-battery sizing combined with integrated EV-grid interaction can achieve desirable performance targets—COE below USD 0.1/kWh, LPSP under 10%, and REF exceeding 50%. While [82] provides a location-based evaluation for strategic deployment, this paper emphasizes system-level design and operational optimization. Both studies highlight the importance of renewable energy integration in improving economic feasibility; however, the present work offers a more comprehensive framework by also incorporating grid dynamics and environmental considerations, contributing to the development of smart residential energy systems.

7.5. Impacts on Urban Energy Sustainability and Resilience

The optimized Home-PV-BES-EV system discussed in this study shows important impacts in terms of economics, environment, and reliability. Economically, the system achieved a Cost of Energy of USD 0.0554/kWh, making it competitive when compared to other renewable systems and offering long-term savings by reducing the use of grid electricity. Although the COE could be slightly higher than direct grid electricity, the long-term benefits, such as energy independence and protection against price increases, prove that the system is still a good option. Policy-makers could encourage its adoption by providing subsidies or introducing net metering programs. Environmentally, the system reached a Renewable Energy Fraction of 92.55%, meaning most of the home’s energy needs were met by solar PV. This reduces dependence on fossil fuels and results in significant GHG emission reductions. The use of Vehicle-to-Home (V2H) technology further supports environmental benefits by making good use of excess PV energy stored in electric vehicles. In terms of reliability, the system achieved a low LPSP of 1.96%, showing that it can meet household energy demands with fewer power interruptions. The V2H feature makes the system more resilient by providing backup power when PV generation is low, which reduces dependence on the grid. Additionally, the optimal charging and discharging strategies employed in the system enable dynamic grid interaction, allowing households to sell excess energy and charge electric vehicles during off-peak hours. These results suggest that the system could be expanded to larger communities or microgrids. Overall, this work paves the way for sustainable, reliable, and economically viable home energy solutions in urban environments.

8. Conclusions

In conclusion, this study demonstrates the feasibility and effectiveness of a grid-connected household energy system combining photovoltaic panels, battery energy storage, and electric vehicle integration for a household in Riyadh, Saudi Arabia. Using advanced metaheuristic optimization techniques, namely Multi-Objective Particle Swarm Optimization and Multi-Objective Harris Hawks Optimization, the system was optimized to minimize the Cost of Energy and Loss of Power Supply Probability while maximizing the Renewable Energy Fraction. The results indicate that the proposed system design, supported by a rule-based Home Energy Management System, effectively meets energy demand with a COE as low as USD 0.055/kWh and an REF of approximately 92%. The integration of dynamic EV management, including Vehicle-to-Home (V2H) and Home-to-Vehicle (H2V) operations, further enhances the system’s flexibility and efficiency. The proposed system demonstrates that high renewable energy contributions can be achieved in Riyadh, supported by the region’s abundant solar resources. The use of fuzzy logic to refine Pareto front solutions ensures a balanced compromise among the competing objectives, highlighting the potential of such methodologies in advancing sustainable household energy systems.

Author Contributions

Conceptualization, A.A.A. and H.M.; Methodology, A.A.A., N.N.M. and H.M.; Software, A.A.A.; Validation, A.A.A.; Formal analysis, A.A.A. and N.N.M.; Investigation, A.A.A.; Resources, A.A.A., N.N.M. and H.M.; Data curation, A.A.A.; Writing–original draft, A.A.A.; Writing–review & editing, A.A.A., N.N.M., H.M., A.K.R. and L.J.A.; Visualization, A.A.A., N.N.M. and H.M.; Supervision, N.N.M. and H.M.; Project administration, N.N.M. and H.M.; Funding acquisition, N.N.M. and H.M. All authors have read and agreed to the published version of the manuscript.

Funding

This work is supported by Universiti Malaya under UM International Collaboration Grant, (Grant code: ST051-2023) and Dato’ Low Tuck Kwong International Energy Transition Grant, (Grant code: ETG 202205001).

Institutional Review Board Statement

Not applicable.

Informed Consent Statement

Not applicable.

Data Availability Statement

The data presented in this study are available on request from the corresponding authors. The data are not publicly available due to institutional restrictions.

Conflicts of Interest

The authors declare that they have no known competing financial interests or personal relationships that could have appeared to influence the work reported in this paper.

Appendix A

Table A1. F solutions and their relative normalized membership values.
MOPSOMOHHO
SolLPSPCOEREFNormalizedSolLPSPCOEREFNormalized
10.06130.02240.52750.006710.05570.02380.52360.0065
20.07040.02230.53030.005820.06130.02270.52650.0059
30.07160.02110.50860.005630.05010.04270.57630.0062
40.05780.02300.51880.006940.05510.02440.53910.0067
50.05960.02390.55110.007150.02230.06850.96090.0121
60.06990.02160.51950.005860.04530.03510.60970.0079
70.06990.02160.51950.005870.05560.03920.52630.0052
80.05000.03070.56110.007680.02110.04830.87660.013
90.01860.07830.96970.011790.02400.05310.83450.0117
100.07160.02110.50860.0056100.04980.02650.57330.0076
110.05410.02730.54380.0073110.01960.05550.92560.0132
120.02250.07140.96080.0117120.02000.08300.97180.0112
130.07040.02230.53030.0058130.02200.05950.89290.0121
140.04610.03270.59330.0082140.02420.04530.85920.0127
150.02160.06500.93840.0121150.02370.05340.91540.0127
160.02040.05730.88040.0122160.02110.08540.97310.0108
170.06990.02160.51950.0058170.04630.02840.63120.0086
180.02290.06310.92170.0119180.02070.05700.88650.0124
190.04690.03180.59310.0082190.04090.03200.68820.0097
200.02130.06480.93220.0121200.04250.04660.64030.0076
210.03400.05080.75370.0098210.02190.07190.96430.0119
220.02420.05250.82570.0116220.02070.05940.90870.0125
230.06990.02160.51950.0058230.03180.05130.76500.01
240.04870.03320.57700.0077240.01910.06030.94340.013
250.05920.04260.50770.005250.02870.04370.79730.0115
260.01840.07730.96680.0117260.03130.03760.77650.0115
270.05840.02530.50900.0066270.02660.05110.81820.0114
280.07160.02110.50860.0056280.03960.03430.73090.0101
290.02030.05820.88100.0121290.02400.04470.85520.0127
300.01920.07640.96330.0117300.02260.06100.91370.0121
310.02050.06360.92470.0122310.02730.03980.80490.0121
320.02130.06480.93220.0121320.05560.03920.52630.0052
330.01800.08640.97370.0111330.02190.05890.90420.0123
340.02640.05380.81830.0111340.02320.05860.92100.0124
350.05460.03020.54380.007350.05510.04080.54300.0053
360.02500.04320.83830.0124360.04820.02790.62030.0083
370.02120.05890.88730.0121370.02870.04370.79730.0115
380.05410.02920.54400.0071380.04000.03730.67140.0091
390.02200.07840.97080.0113390.02270.05510.92340.0128
400.04570.02910.62080.0089400.02950.03880.79290.0118
410.02670.04930.81710.0115410.02610.04600.86420.0124
420.01800.08460.97370.0112420.02290.05740.91300.0124
430.02050.05250.88680.0127430.04140.03140.67690.0095
440.02070.08010.97000.0113440.05760.03840.52810.005
450.07040.02230.53030.0058450.04510.02870.62990.0087
460.02130.06480.93220.0121460.02120.04810.84210.0126
470.02090.07940.97210.0114470.01910.06030.94340.013
480.01860.07830.96970.0117480.04090.03200.68820.0097
490.04980.04460.57600.0066490.05020.03800.57730.0066
500.03930.04510.65540.0086500.02420.04530.85920.0127
510.02250.06900.94980.0118510.04920.02620.58170.0078
520.04300.03350.71580.0099520.02160.07900.96900.0113
530.02890.04800.77580.0109530.02230.06620.95730.0122
540.03980.04420.65580.0086540.02650.04420.80860.0119
550.03760.04670.70080.0092550.02050.06170.92510.0125
560.01800.08640.97370.0111560.04920.02620.58170.0078
570.01800.08640.97370.0111570.05560.02470.56120.0069
580.03050.03950.78550.0115580.02000.08240.97140.0112
590.03470.04190.74210.0104590.02560.04380.84410.0125
600.04420.03280.62520.0088600.04300.03350.71580.0096
610.04690.03180.59310.0082610.02320.07020.96130.0118
620.03450.05020.74230.0097620.05550.03250.52800.0058
630.02190.08200.97110.011630.02950.03880.79290.0118
640.03640.03950.72810.0102640.06130.02270.52650.0059
650.01850.07920.97160.0116650.03610.04970.72910.0092
660.01800.08550.97370.0112660.03320.03650.75770.0111
670.01930.08350.97210.0112670.05900.02330.50760.0059
680.01800.08550.97370.0112680.05510.02440.53910.0067
690.03870.04100.67170.0092690.02200.05950.89290.0121
700.02600.06190.94740.012700.02260.06100.91370.0121
710.01800.08640.97370.0111710.02120.04810.84210.0126
720.02150.07390.96770.0117720.05010.02970.56080.0071
730.02270.05600.85290.0117730.05990.03690.50910.0046
740.04870.03320.57700.0077740.03130.03760.77650.0115
750.02240.05030.89840.0128750.02110.08540.97310.0108
760.01860.07830.96970.0117760.01670.08390.97240.0115
770.05370.02530.57340.0078770.04980.02650.57330.0076
780.01800.08640.97370.0111780.05480.03880.54310.0055
790.01800.08640.97370.0111790.02800.04150.77600.0115
800.05560.03920.52630.0059800.04000.03730.67140.0091
810.01800.08640.97370.0111810.02290.05740.91300.0124
820.01800.08640.97370.0111820.02410.04790.82530.0121
830.01820.06450.94070.0125830.02400.04470.85520.0127
840.02190.06830.95360.012840.05320.02710.60640.0075
850.02310.07380.96220.0115850.05740.02320.53890.0065
860.02130.07750.96820.0114860.01960.05550.92560.0132
870.02040.06530.93510.0122870.02650.04420.80860.0119
880.02020.05760.87380.0121880.02190.05890.90420.0123
890.02190.08200.97110.011890.05320.02710.60640.0075
900.02040.05190.85880.0124900.05800.03200.50920.0053
910.03050.03850.78310.0116910.03770.04770.70090.0088
920.02210.07270.96690.0117920.02660.05110.81820.0114
930.02250.06900.94980.0118930.02230.06850.96090.0121
940.02320.07020.96130.0118940.03960.03430.73090.0101
950.04670.03370.59350.0081950.03660.04690.72890.0094
960.02130.06480.93220.0121960.04510.02870.62990.0087
970.01960.05550.92560.0130970.05960.02390.55110.0063
980.02250.06900.94980.0118980.02160.07900.96900.0113
990.02950.03880.79290.0118990.05570.02380.52360.0065
1000.04320.04600.62470.00781000.02250.06900.94980.0119
Background colors in the table highlight the solutions with the highest normalized membership values for each optimization technique—Solution 97 for MOPSO and Solution 11 for MOHHO—which represent the best compromise solutions identified in the analysis.

References

  1. IEA—International Energy Agency. Available online: https://www.iea.org/ (accessed on 4 August 2025).
  2. Zhang, W.; Maleki, A.; Rosen, M.A. A heuristic-based approach for optimizing a small independent solar and wind hybrid power scheme incorporating load forecasting. J. Clean. Prod. 2019, 241, 117920. [Google Scholar] [CrossRef]
  3. IEEE Industrial Electronics Society. IECON 2019-45th Annual Conference of the IEEE Industrial Electronics Society: Convention Center, Lisbon, Portugal, 14–17 October 2019; Universidade Nova de Lisboa, Institute of Electrical and Electronics Engineers, and IEEE Industrial Electronics Society: Lisbon, Portugal, 2019. [Google Scholar]
  4. Bhatti, R.; Salam, Z.; Ashique, R.H. Electric Vehicle Charging Using Photovoltaic based Microgrid for Remote Islands. Energy Procedia 2016, 103, 213–218. [Google Scholar] [CrossRef]
  5. Olatomiwa, L.; Mekhilef, S.; Ismail, M.S.; Moghavvemi, M. Energy management strategies in hybrid renewable energy systems: A review. Renew. Sustain. Energy Rev. 2016, 62, 821–835. [Google Scholar] [CrossRef]
  6. Lehtola, T.; Zahedi, A. Solar energy and wind power supply supported by storage technology: A review. Sustain. Energy Technol. Assess. 2019, 35, 25–31. [Google Scholar] [CrossRef]
  7. Richardson, D.B. Electric vehicles and the electric grid: A review of modeling approaches, Impacts, and renewable energy integration. Renew. Sustain. Energy Rev. 2013, 19, 247–254. [Google Scholar] [CrossRef]
  8. Monna, S.; Abdallah, R.; Juaidi, A.; Albatayneh, A.; Zapata-Sierra, A.J.; Manzano-Agugliaro, F. Potential Electricity Production by Installing Photovoltaic Systems on the Rooftops of Residential Buildings in Jordan: An Approach to Climate Change Mitigation. Energies 2022, 15, 496. [Google Scholar] [CrossRef]
  9. Zhu, Z.; Wang, Y.; Yuan, M.; Zhang, R.; Chen, Y.; Lou, G.; Sun, Y. Energy saving and carbon reduction schemes for families with the household PV-BES-EV system. Energy Build. 2023, 288, 113007. [Google Scholar] [CrossRef]
  10. Bódis, K.; Kougias, I.; Jäger-Waldau, A.; Taylor, N.; Szabó, S. A high-resolution geospatial assessment of the rooftop solar photovoltaic potential in the European Union. Renew. Sustain. Energy Rev. 2019, 114, 109309. [Google Scholar] [CrossRef]
  11. Khezri, R.; Mahmoudi, A.; Aki, H. Optimal planning of solar photovoltaic and battery storage systems for grid-connected residential sector: Review, challenges and new perspectives. Renew. Sustain. Energy Rev. 2022, 153, 111763. [Google Scholar] [CrossRef]
  12. Zheng, J.; Lin, Z.E.; Masanet, E.; Deshmukh, R.; Suh, S. Lifecycle cost and carbon implications of residential solar-plus-storage in California. iScience 2021, 24, 103492. [Google Scholar] [CrossRef]
  13. Zubair, M. PV energy penetration in Saudi Arabia: Current status, residential, and commercial users, local investment, use in modern agriculture. Int. J. Sustain. Eng. 2024, 17, 39–51. [Google Scholar] [CrossRef]
  14. KAPSARC. King Abdullah Petroleum Studies and Research Center. Home. Available online: https://www.kapsarc.org/ (accessed on 26 August 2024).
  15. Saudi Electricity Company. Available online: https://www.se.com.sa/en (accessed on 26 August 2024).
  16. Saudi Electricity Regulatory Authority. Available online: https://sera.gov.sa/ (accessed on 27 August 2024).
  17. Information About Saudi Green Initiative. Available online: https://www.greeninitiatives.gov.sa/about-sgi/ (accessed on 27 August 2024).
  18. Alyamani, R.; Pappelis, D.; Kamargianni, M. Modelling the determinants of electrical vehicles adoption in Riyadh, Saudi Arabia. Energy Policy 2024, 188, 114072. [Google Scholar] [CrossRef]
  19. Klabi, F.; Binzafrah, F. Exploring the relationships between Islam, some personal values, environmental concern, and electric vehicle purchase intention: The case of Saudi Arabia. J. Islam. Mark. 2023, 14, 366–393. [Google Scholar] [CrossRef]
  20. Shaher; Alqahtani, S.; Garada, A.; Cipcigan, L. Rooftop Solar Photovoltaic in Saudi Arabia to Supply Electricity Demand in Localised Urban Areas: A Study of the City of Abha. Energies 2023, 16, 4310. [Google Scholar] [CrossRef]
  21. Zhang, W.; Wang, J.; Du, S.; Ma, H.; Zhao, W.; Li, H. Energy Management Strategies for Hybrid Construction Machinery: Evolution, Classification, Comparison and Future Trends. Energies 2019, 12, 2024. [Google Scholar] [CrossRef]
  22. Mahmud, K.; Town, G.E.; Morsalin, S.; Hossain, M.J. Integration of electric vehicles and management in the internet of energy. Renew. Sustain. Energy Rev. 2018, 82, 4179–4203. [Google Scholar] [CrossRef]
  23. Shi, Y.; Tuan, H.D.; Savkin, A.V.; Duong, T.Q.; Poor, H.V. Model Predictive Control for Smart Grids With Multiple Electric-Vehicle Charging Stations. IEEE Trans. Smart Grid 2019, 10, 2127–2136. [Google Scholar] [CrossRef]
  24. Barakat, S.; Ibrahim, H.; Elbaset, A.A. Multi-objective optimization of grid-connected PV-wind hybrid system considering reliability, cost, and environmental aspects. Sustain. Cities Soc. 2020, 60, 102178. [Google Scholar] [CrossRef]
  25. Çetinbaş, İ.; Tamyürek, B.; Demirtaş, M. Sizing optimization and design of an autonomous AC microgrid for commercial loads using Harris Hawks Optimization algorithm. Energy Convers. Manag. 2021, 245, 114562. [Google Scholar] [CrossRef]
  26. Aziz, N.I.A.; Sulaiman, S.I.; Shaari, S.; Musirin, I.; Sopian, K. Optimal sizing of stand-alone photovoltaic system by minimizing the loss of power supply probability. Sol. Energy 2017, 150, 220–228. [Google Scholar] [CrossRef]
  27. Almulhim, I. Understanding public awareness and attitudes toward renewable energy resources in Saudi Arabia. Renew. Energy 2022, 192, 572–582. [Google Scholar] [CrossRef]
  28. Amran, Y.H.A.; Amran, Y.H.M.; Alyousef, R.; Alabduljabbar, H. Renewable and sustainable energy production in Saudi Arabia according to Saudi Vision 2030; Current status and future prospects. J. Clean. Prod. 2020, 247, 119602. [Google Scholar] [CrossRef]
  29. Wu, Y.; Aziz, S.M.; Haque, M.H. Vehicle-to-home operation and multi-location charging of electric vehicles for energy cost optimisation of households with photovoltaic system and battery energy storage. Renew. Energy 2024, 221, 119729. [Google Scholar] [CrossRef]
  30. Borge-Diez, D.; Icaza, D.; Açıkkalp, E.; Amaris, H. Combined vehicle to building (V2B) and vehicle to home (V2H) strategy to increase electric vehicle market share. Energy 2021, 237, 121608. [Google Scholar] [CrossRef]
  31. Mohamed, A.S.; Zulkefli, A.M.; Sagar, S.M.V.; Gajjarapu, U.M.; Thomas, A.; Bhavaraju, V. Smart Vehicle-to-Home (V2H) Platform Enabled Home Energy Management System (HEMS) for Backup Supply. In Proceedings of the 2023 IEEE Green Technologies Conference (GreenTech), Denver, Colorado, 19–21 April 2023; pp. 73–77. [Google Scholar] [CrossRef]
  32. Liu, X.; Wu, Y.; Wu, H. PV-EV Integrated Home Energy Management Considering Residential Occupant Behaviors. Sustainability 2021, 13, 13826. [Google Scholar] [CrossRef]
  33. Kumar; Sah, B.; Deng, Y.; He, X.; Kumar, P.; Bansal, R.C. Application of multi-criteria decision analysis tool for design of a sustainable micro-grid for a remote village in the Himalayas. J. Eng. 2017, 2017, 2108–2113. [Google Scholar] [CrossRef]
  34. Nsafon, E.K.; Butu, H.M.; Owolabi, A.B.; Roh, J.W.; Suh, D.; Huh, J.S. Integrating multi-criteria analysis with PDCA cycle for sustainable energy planning in Africa: Application to hybrid mini-grid system in Cameroon. Sustain. Energy Technol. Assess. 2020, 37, 100628. [Google Scholar] [CrossRef]
  35. Abdmouleh, Z.; Gastli, A.; Ben-Brahim, L.; Haouari, M.; Al-Emadi, N.A. Review of optimization techniques applied for the integration of distributed generation from renewable energy sources. Renew. Energy 2017, 113, 266–280. [Google Scholar] [CrossRef]
  36. King Abdullah City for Atomic and Renewable Energy. Available online: https://apps.energy.gov.sa/tlc/home (accessed on 27 August 2024).
  37. Samy, M.; Barakat, S. Application of MOPSO to the Optimisation of an Off-Grid Photovoltaic System in a Rural Fruit Farm. J. Eng. Sci. Sustain. Ind. Technol. 2023, 1, 7–13. [Google Scholar] [CrossRef]
  38. Alsharif; Tan, C.W.; Ayop, R.; Lau, K.Y.; Dobi, A.M.D. A rule-based power management strategy for Vehicle-to-Grid system using antlion sizing optimization. J. Energy Storage 2021, 41, 102913. [Google Scholar] [CrossRef]
  39. Al Wahedi, A.; Bicer, Y. Development of an off-grid electrical vehicle charging station hybridized with renewables including battery cooling system and multiple energy storage units. Energy Rep. 2020, 6, 2006–2021. [Google Scholar] [CrossRef]
  40. Khan, W.; Ahmad, F.; Alam, M.S. Fast EV charging station integration with grid ensuring optimal and quality power exchange. Eng. Sci. Technol. Int. J. 2019, 22, 143–152. [Google Scholar] [CrossRef]
  41. Solanke, T.U.; Ramachandaramurthy, V.K.; Yong, J.Y.; Pasupuleti, J.; Kasinathan, P.; Rajagopalan, A. A review of strategic charging–discharging control of grid-connected electric vehicles. J. Energy Storage 2020, 28, 101193. [Google Scholar] [CrossRef]
  42. Luna, C.; Diaz, N.L.; Graells, M.; Vasquez, J.C.; Guerrero, J.M. Mixed-integer-linear-programming-based energy management system for hybrid PV-wind-battery microgrids: Modeling, design, and experimental verification. IEEE Trans. Power Electron. 2017, 32, 2769–2783. [Google Scholar] [CrossRef]
  43. Diaf, S.; Diaf, D.; Belhamel, M.; Haddadi, M.; Louche, A. A methodology for optimal sizing of autonomous hybrid PV/wind system. Energy Policy 2007, 35, 5708–5718. [Google Scholar] [CrossRef]
  44. Ogunjuyigbe, S.O.; Ayodele, T.R.; Akinola, O.A. Optimal allocation and sizing of PV/Wind/Split-diesel/Battery hybrid energy system for minimizing life cycle cost, carbon emission and dump energy of remote residential building. Appl. Energy 2016, 171, 153–171. [Google Scholar] [CrossRef]
  45. Mohseni, S.; Brent, A.C.; Burmester, D. A demand response-centred approach to the long-term equipment capacity planning of grid-independent micro-grids optimized by the moth-flame optimization algorithm. Energy Convers. Manag. 2019, 200, 112105. [Google Scholar] [CrossRef]
  46. García, P.; Torreglosa, J.P.; Fernández, L.M.; Jurado, F. Optimal energy management system for stand-alone wind turbine/photovoltaic/hydrogen/battery hybrid system with supervisory control based on fuzzy logic. Int. J. Hydrogen Energy 2013, 38, 14146–14158. [Google Scholar] [CrossRef]
  47. Sarker, M.T.; Haram, M.H.S.M.; Shern, S.J.; Ramasamy, G.; Al Farid, F. Second-Life Electric Vehicle Batteries for Home Photovoltaic Systems: Transforming Energy Storage and Sustainability. Energies 2024, 17, 2345. [Google Scholar] [CrossRef]
  48. Zafar, B.; Slama, S.A.B. PV-EV integrated home energy management using vehicle-to-home (V2H) technology and household occupant behaviors. Energy Strategy Rev. 2022, 44, 101001. [Google Scholar] [CrossRef]
  49. LG LG305N1C-G4 (305W) Solar Panel. Available online: http://www.solardesigntool.com/components/module-panel-solar/LG/3124/LG305N1C-G4/specification-data-sheet.html;jsessionid=4B1D60DE7ED94D02888A9B90F5D56123 (accessed on 27 August 2024).
  50. Mouli, G.R.C.; Bauer, P.; Zeman, M. System design for a solar powered electric vehicle charging station for workplaces. Appl. Energy 2016, 168, 434–443. [Google Scholar] [CrossRef]
  51. Bhatti, R.; Salam, Z. A rule-based energy management scheme for uninterrupted electric vehicles charging at constant price using photovoltaic-grid system. Renew. Energy 2018, 125, 384–400. [Google Scholar] [CrossRef]
  52. Bukar, L.; Tan, C.W.; Lau, K.Y. Optimal sizing of an autonomous photovoltaic/wind/battery/diesel generator microgrid using grasshopper optimization algorithm. Sol. Energy 2019, 188, 685–696. [Google Scholar] [CrossRef]
  53. Mallikarjun, P.; Thulasiraman, S.R.G.; Balachandran, P.K.; Zainuri, M.A.A.M. Economic energy optimization in microgrid with PV/wind/battery integrated wireless electric vehicle battery charging system using improved Harris Hawk Optimization. Sci. Rep. 2025, 15, 10028. [Google Scholar] [CrossRef]
  54. Borhanazad, H.; Mekhilef, S.; Ganapathy, V.G.; Modiri-Delshad, M.; Mirtaheri, A. Optimization of micro-grid system using MOPSO. Renew. Energy 2014, 71, 295–306. [Google Scholar] [CrossRef]
  55. Maleki; Khajeh, M.G.; Ameri, M. Optimal sizing of a grid independent hybrid renewable energy system incorporating resource uncertainty, and load uncertainty. Int. J. Electr. Power Energy Syst. 2016, 83, 514–524. [Google Scholar] [CrossRef]
  56. Ruan, H.; Berna-Escriche, C.; Álvarez-Piñeiro, L.; Blanco, D. Optimization of Solar Generation and Battery Storage for Electric Vehicle Charging with Demand-Side Management Strategies. World Electr. Veh. J. 2025, 16, 312. [Google Scholar] [CrossRef]
  57. Nissan Leaf (2022–2024) Price and Specifications—EV Database. Available online: https://ev-database.org/car/1656/Nissan-Leaf (accessed on 27 August 2024).
  58. Zhang, Y.; Qian, Z.; Li, B. The impact of car specifications, prices and incentives for battery electric vehicles in Norway: Choices of heterogeneous consumers. Transp. Res. Part C Emerg. Technol. 2016, 69, 386–401. [Google Scholar] [CrossRef]
  59. Al-Buraiki, S.; Al-Sharafi, A. Technoeconomic analysis and optimization of hybrid solar/wind/battery systems for a standalone house integrated with electric vehicle in Saudi Arabia. Energy Convers. Manag. 2021, 250, 114899. [Google Scholar] [CrossRef]
  60. Azarbakhsh, G.; Mahmoudi, A.; Kahourzade, S.; Yazdani, A.; Mahmud, A. Optimal Sizing of Photovoltaic and Battery Energy Storage for Residential Houses in South Australia by Considering Vehicle-to-Home Operation. IET Renew. Power Gener. 2025, 19, e70053. [Google Scholar] [CrossRef]
  61. Dufo-López, R.; Bernal-Agustín, J.L. Multi-objective design of PV–wind–diesel–hydrogen–battery systems. Renew. Energy 2008, 33, 2559–2572. [Google Scholar] [CrossRef]
  62. Solomon, S.; Change, C. 2007: The Physical Science Basis: Contribution of Working Group I to the Fourth Assessment Report of the Intergovernmental Panel Climate Change; Cambridge University Press: Cambridge, UK, 2007. [Google Scholar]
  63. Myhre, G.; Shindell, D.; Bréon, F.M.; Collins, W.; Fuglestvedt, J.; Huang, J.; Koch, D.; Lamarque, J.F.; Lee, D.; Mendoza, B.; et al. Anthropogenic and Natural Radiative Forcing. In Climate Change 2013: The Physical Science Basis; Contribution of Working Group I; IPCC: Genva, Switzerland, 2013. [Google Scholar]
  64. Brander, M.; Sood, A.; Wylie, C.; Haughton, A.; Lovell, J. Technical Paper: Electricity-Specific Emission Factors for Grid Electricity. 2011. Available online: https://bravenewclimate.com/files/assets/media/pdf/electricity_factors_paper.pdf (accessed on 27 August 2024).
  65. Daniela-Abigail, H.L.; Vega-De-Lille, M.I.; Sacramento-Rivero, J.C.; Ponce-Caballero, C.; El-Mekaoui, A.; Navarro-Pineda, F. Life cycle assessment of photovoltaic panels including transportation and two end-of-life scenarios: Shaping a sustainable future for renewable energy. Renew. Energy Focus 2024, 51, 100649. [Google Scholar] [CrossRef]
  66. Life Cycle Greenhouse Gas Emissions. Available online: https://www.nrel.gov/docs/fy13osti/56487.pdf (accessed on 29 October 2024).
  67. Kaviani, K.; Baghaee, H.R.; Riahy, G.H. Optimal Sizing of a Stand-alone Wind/Photovoltaic Generation Unit using Particle Swarm Optimization. Simulation 2009, 85, 89–99. [Google Scholar] [CrossRef]
  68. Kumar, G.R.P.; Sattianadan, D.; Vijayakumar, K. A survey on power management strategies of hybrid energy systems in microgrid. Int. J. Electr. Comput. Eng. (IJECE) 2020, 10, 1667–1673. [Google Scholar] [CrossRef]
  69. Andwari, M.; Pesiridis, A.; Rajoo, S.; Martinez-Botas, R.; Esfahanian, V. A review of Battery Electric Vehicle technology and readiness levels. Renew. Sustain. Energy Rev. 2017, 78, 414–430. [Google Scholar] [CrossRef]
  70. Hannan, M.A.; Hoque, M.M.; Hussain, A.; Yusof, Y.; Ker, P.J. State-of-the-Art and Energy Management System of Lithium-Ion Batteries in Electric Vehicle Applications: Issues and Recommendations. IEEE Access 2018, 6, 19362–19378. [Google Scholar] [CrossRef]
  71. Dragičević, T.; Sučić, S.; Vasquez, J.C.; Guerrero, J.M. Flywheel-based distributed bus signalling strategy for the public fast charging station. IEEE Trans. Smart Grid 2014, 5, 2825–2835. [Google Scholar] [CrossRef]
  72. Aziz, M.; Oda, T.; Mitani, T.; Watanabe, Y.; Kashiwagi, T. Utilization of Electric Vehicles and Their Used Batteries for Peak-Load Shifting. Energies 2015, 8, 3720–3738. [Google Scholar] [CrossRef]
  73. Mohseni, S.; Brent, A.C.; Burmester, D. A comparison of metaheuristics for the optimal capacity planning of an isolated, battery-less, hydrogen-based micro-grid. Appl. Energy 2020, 259, 114224. [Google Scholar] [CrossRef]
  74. Bandopadhyay, J.; Roy, P.K. Application of hybrid multi-objective moth flame optimization technique for optimal performance of hybrid micro-grid system. Appl. Soft Comput. 2020, 95, 106487. [Google Scholar] [CrossRef]
  75. Mahdi, S.; Baygi, H.; Farzaneh, J. Application of Artificial intelligence techniques for optimum design of hybrid grid-independent PV/WT/battery power system. Int. J. Ind. Electron. Control Optim. 2020, 3, 275–289. [Google Scholar] [CrossRef]
  76. Ayop, R.; Isa, N.M.; Tan, C.W. Components sizing of photovoltaic stand-alone system based on loss of power supply probability. Renew. Sustain. Energy Rev. 2018, 81, 2731–2743. [Google Scholar] [CrossRef]
  77. Zhou, Z.; Sun, C.; Shi, R.; Chang, Z.; Zhou, S.; Li, Y. Robust Energy Scheduling in Vehicle-To-Grid Networks. IEEE Netw. 2017, 31, 30–37. [Google Scholar] [CrossRef]
  78. Qu, Y.; Zhu, Y.S.; Jiao, Y.C.; Wu, M.Y.; Suganthan, P.N.; Liang, J.J. A survey on multi-objective evolutionary algorithms for the solution of the environmental/economic dispatch problems. Swarm Evol. Comput. 2018, 38, 1–11. [Google Scholar] [CrossRef]
  79. Abido, M.A. Multiobjective evolutionary algorithms for electric power dispatch problem. IEEE Trans. Evol. Comput. 2006, 10, 315–329. [Google Scholar] [CrossRef]
  80. Sakawa, M.; Hitoshiyano, H.; Yumine, T. An Interactive Fuzzy Satisficing Method for Multiobjective Linear-Programming Problems and Its Application. IEEE Trans. Syst. Man. Cybern. 1987, 17, 654–661. [Google Scholar] [CrossRef]
  81. Mellal, M.A.; Pecht, M. A multi-objective design optimization framework for wind turbines under altitude consideration. Energy Convers. Manag. 2020, 222, 113212. [Google Scholar] [CrossRef]
  82. Almohammadi, K.M.; Allouhi, A. Techno-economic assessment and optimization of grid-connected solar PV systems in Saudi Arabia’s building sector. Util. Policy 2025, 93, 101885. [Google Scholar] [CrossRef]
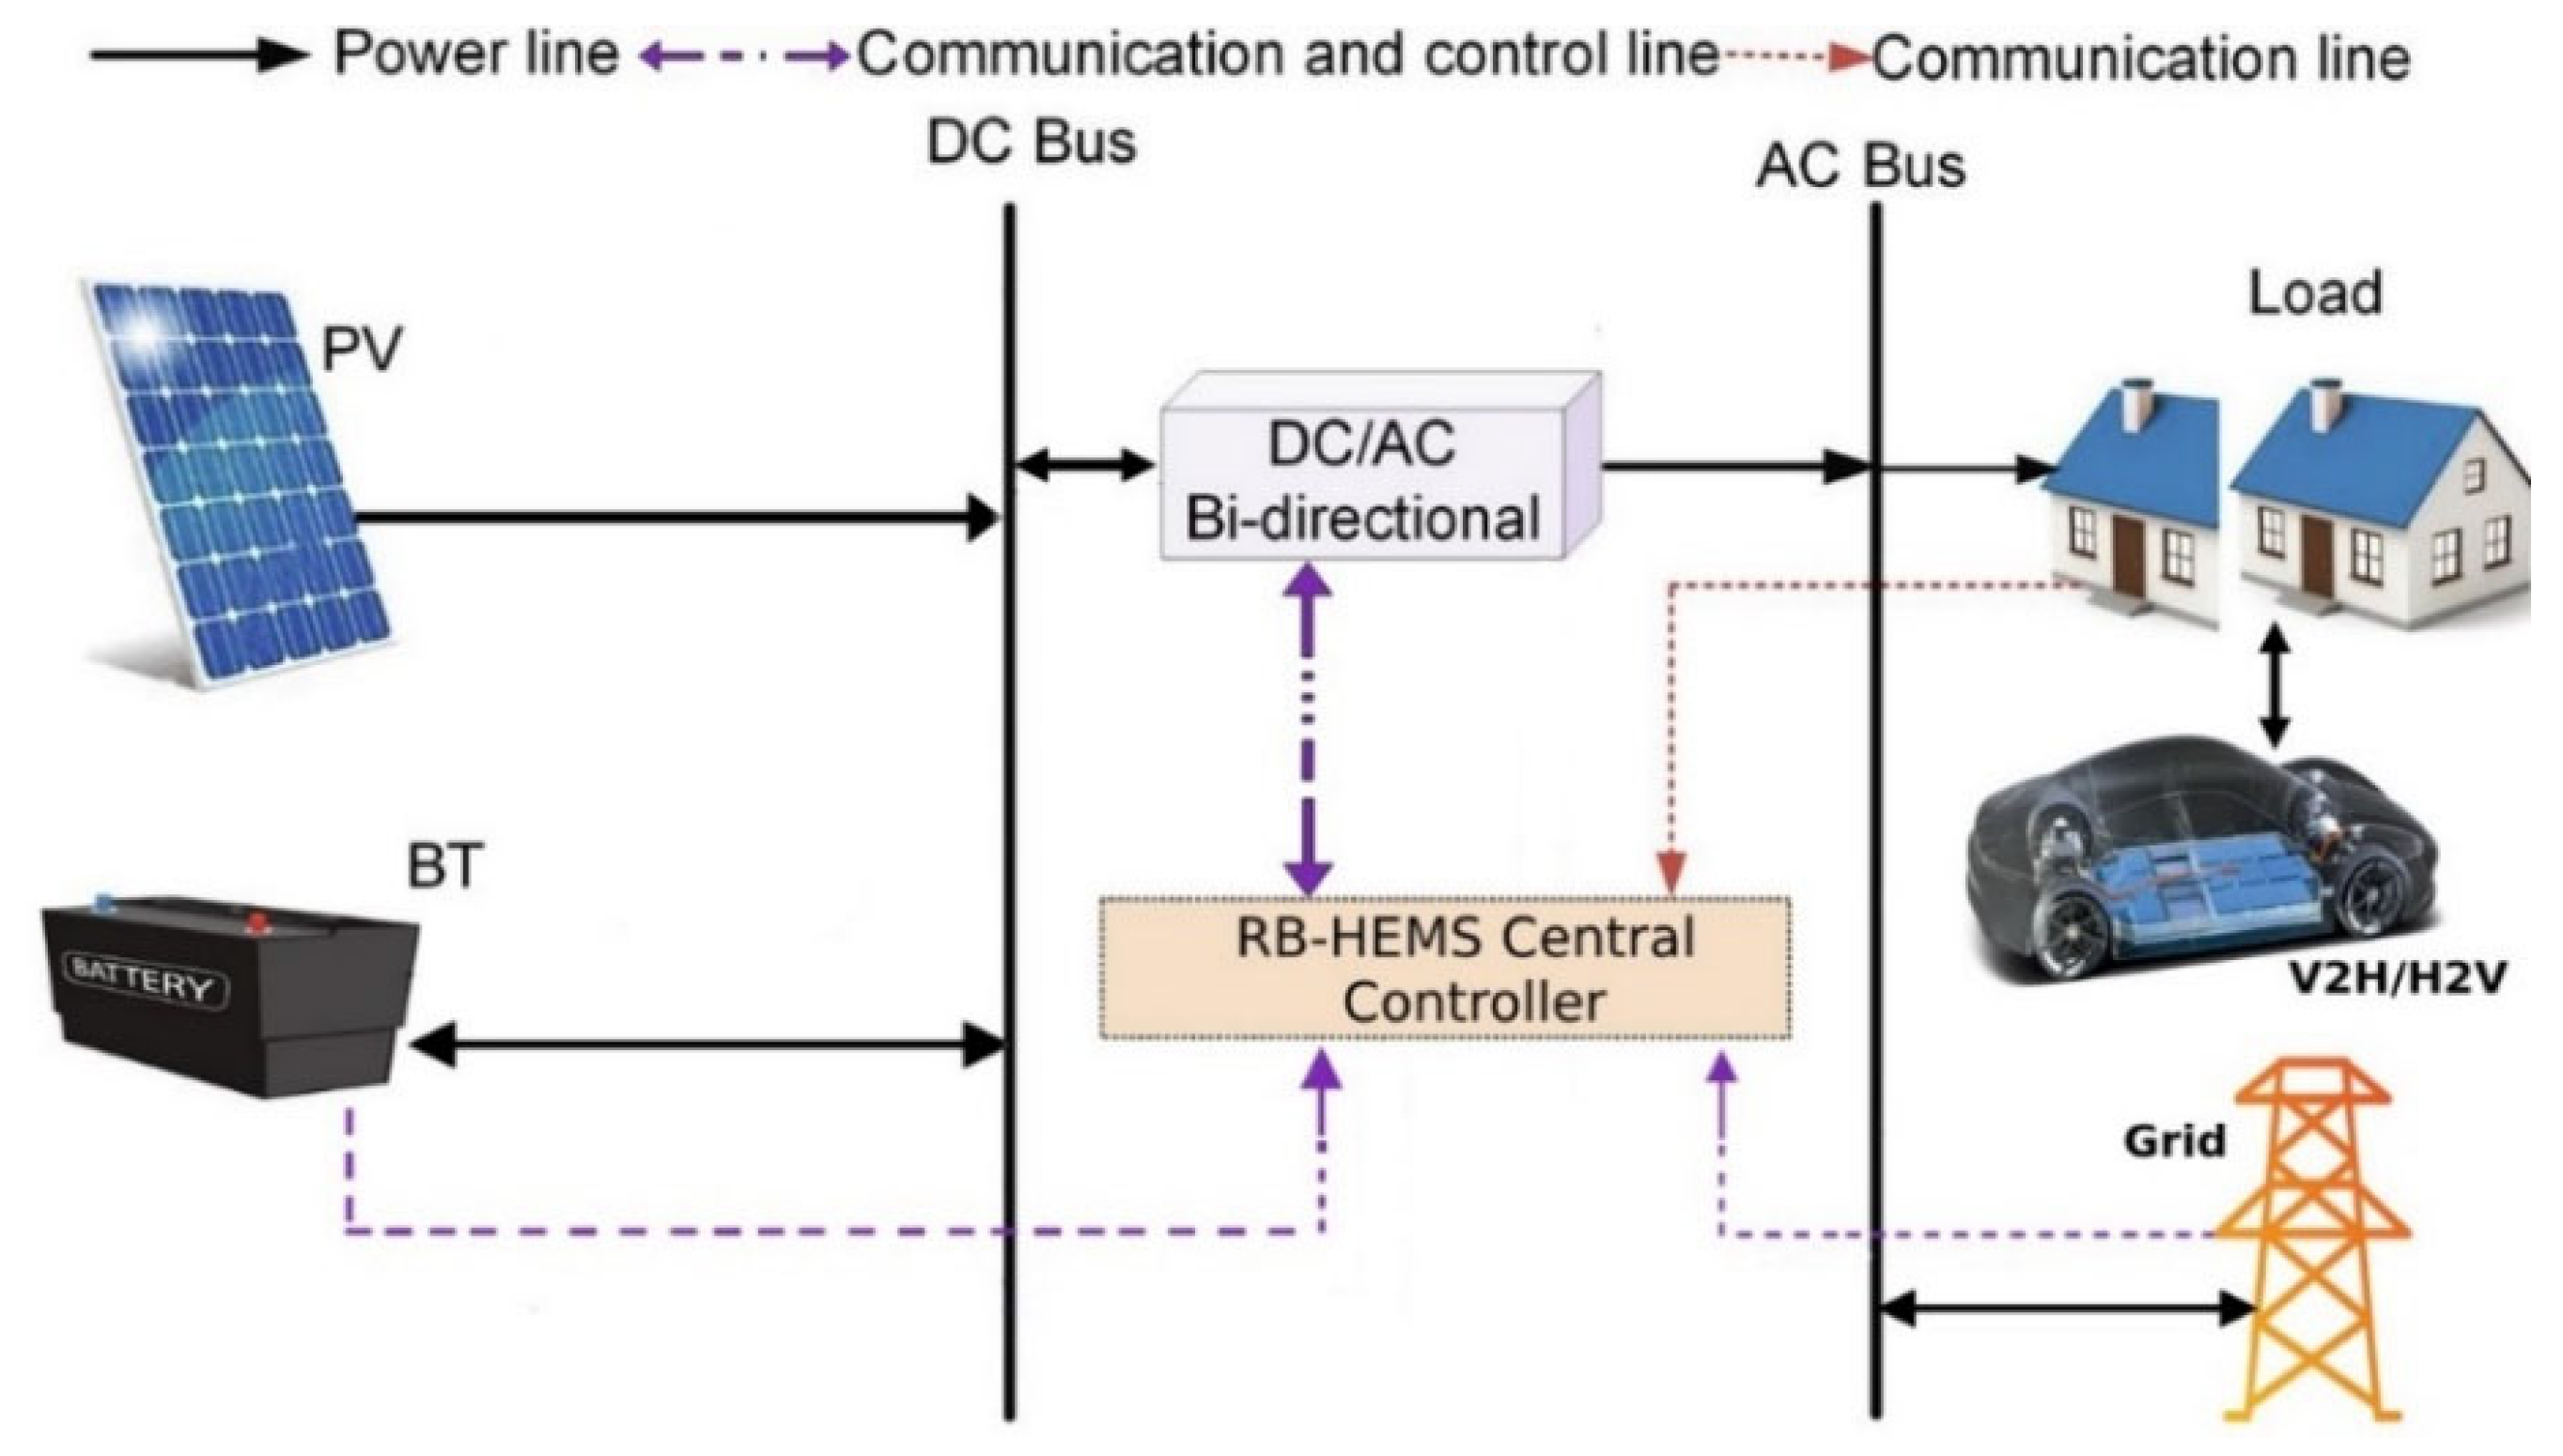
Figure 1. Proposed smart home system.
Sustainability 17 07364 g001
Figure 2. Battery DOD and SoC concepts [38].
Sustainability 17 07364 g002
Figure 3. Global horizontal irradiance of the study area.
Sustainability 17 07364 g003
Figure 4. Ambient temperature of the study area.
Sustainability 17 07364 g004
Figure 5. Load profile (one year).
Sustainability 17 07364 g005
Figure 6. Flowchart of the research methodology.
Sustainability 17 07364 g006
Figure 7. RB-HEMS implementation on the household system.
Sustainability 17 07364 g007
Figure 8. Implementation procedures for MOPSO.
Sustainability 17 07364 g008
Figure 9. Implementation procedures for MOHHO.
Sustainability 17 07364 g009
Figure 10. Pareto front of the three objectives (COE, LPSP, REF).
Sustainability 17 07364 g010
Figure 11. Pareto front of LPSP and COE.
Sustainability 17 07364 g011
Figure 12. Pareto front of LPSP and REF.
Sustainability 17 07364 g012
Figure 13. Pareto front of COE and REF.
Sustainability 17 07364 g013
Table 1. Technical and economic parameters.
ComponentsParametersValueUnit
PV system [37]Lifetime25y
Rated power 0.305kW
Capital cost550USD/Unit
O&M cost5USD/y
Replacement cost0USD
Temperature coefficient 3.7     10 7 1/°C
Derating factor0.9-
NOCT47°C
Battery Energy Storage (BES) [37]Lifetime10y
Initial SOC100%
S O C m i n 20%
S O C m a x 80%
Rate capacity4.8kWh
Capital cost672USD
O&M cost10USD/y
Replacement cost500USD
Self-discharge1%/day
DOD80%
Electric GridImporting priceOff-peak0.032USD/kWh
Mid-peak0.048
On-peak0.080
Exporting priceOff-peak0.040USD/kWh
Mid-peak0.067
On-peak0.11
Inverter [38]Capacity115kW
Capital cost2500USD
O&M cost1USD/y
Efficiency 92%
Lifetime20y
Economic parametersProject life25Y
Annual interest rate3%
Annual inflation rate8%
Table 2. Time zones.
Time Intervals (Hours)00:00–8:008:00–11:0011:00–12:0012:00–14:0014:00–17:0017:00–22:0022:00–00:00
Period TypeOff—PeakMid—PeakOn—PeakMid—PeakOn—PeakMid—PeakOff—Peak
Table 3. Maximum monthly solar irradiance for the area (W/ m 2 ).
MonthJanFebMarAprMayJunJulAugSepOctNovDec
Maximum78790495110191029102210131016964939822755
Table 4. Maximum and minimum temperature in the area.
MonthJanFebMarAprMayJunJulAugSepOctNovDec
Maximum283134364245464644413428
Minimum781212202628282419126
Table 5. Specifications of EV model and charger.
Battery TypeCapacity (kWh)Range (km)Energy Consumption (Wh/km)Charge PortCharging Power
(kW AC)
Lithium-ion40235166Type 23.6
Table 6. Seasonal analysis of data collected.
SeasonPeriodMean Solar
Irradiance (W/m2)
Max Solar
Irradiance (W/m2)
Mean Ambient Temperature (°C)Max Ambient Temperature (°C)Mean Energy Demand (kW)Peak Energy Demand (kW)Min Energy Demand (kW)
WinterDec–Feb202.750190416.7392311.69227.0460.11
SpringMar–Apr274.756101923.8534361.64526.7560.114
SummerMay–Aug299.5369102935.9874463.52210.6940.172
Sep–Nov231.554596428.7840442.03227.7540.138
Table 7. Daily solar irradiance and monthly data for the study area.
MonthsIndex Total Daily G (kWh/m2)Mean Solar
Irradiance (W/m2)
Mean Ambient Temperature (°C)Mean Energy
Demand (kW)
Peak Energy
Demand (kW)
Jan4.732195.760813.77671.7247.046
Feb5.447230.257018.35751.9686.606
Mar6.340260.562122.57951.4614.662
Apr6.899289.670525.14251.8286.756
May7.258298.519332.71372.4586.720
Jun7.584316.607835.84383.48310.694
Jul7.328305.853337.84383.8759.042
Aug6.777279.087937.63294.33110.086
Sep6.413271.315834.93012.9126.598
Oct5.610230.585129.37672.0206.154
Nov4.713199.194222.82331.2827.754
Dec4.386181.354518.05481.3854.066
Table 8. MOPSO and MOHHO results of the sizing problem under flat rate.
TechniqueProspectiveCOE (USD/kWh)NPCLPSP (%)REF (%) N P V N B a t Total GHG Emissions (Tone)
MOPSOEconomic0.0210 6.8750.702412616
Renewable0.0866108,6521.8097.37100251086
Environment0.071889,2322.6795.577425927
MOHHOEconomic0.021725,5886.0851.352422525
Renewable0.0860107,9091.9097.2799251085
Environment0.071489,2152.2495.977723943
Table 9. MOPSO and MOHHO results using best compromise solutions under flat rate.
TechniqueCOE (USD/kWh)NPCLPSP (%)REF (%) N P V N B a t Total GHG Emissions (Tone)
MOPSO0.046858,4522.1086.8751131152
MOHHO0.058273,0761.8893.586616972
Table 10. MOPSO and MOHHO results of the sizing problem under TOU rates.
TechniqueProspectiveCOE (USD/kWh)NPCLPSP (%)REF (%) N P V N B a t Total GHG Emissions (Tone)
MOPSOEconomic0.021024,2577.1550.862412595
Renewable0.0845106,0351.8097.37100231086
Environment0.068385,2922.1995.357223928
MOHHOEconomic0.022626,5956.1352.652432379
Renewable0.0854106,8192.1197.3098251071
Environment0.068986,0692.2494.987025929
Table 11. Generated power of each element in MOPSO and MOHHO.
TechniqueProspective P P V (MWh)Grid Sell (MWh)Grid Purchase (MWh)PV Share (%)V2H Share (%)Grid Share (%)Net Saving in CO2 Emission (%)
MOPSOEconomic12.453.0213.3645.805.0549.1330.97
Renewable51.8925.431.4097.370.002.6271.09
Environment37.3612.401.8295.310.044.6475.31
MOHHOEconomic12.451.3012.1548.534.1147.3436.73
Renewable50.8524.421.4097.300.002.6971.51
Environment36.3211.511.9294.910.065.0175.28
Table 12. MOPSO and MOHHO results using best compromise solutions under TOU rates.
TechniqueCOE (USD/kWh)NPCLPSP (%)REF (%) N P V N B a t Total GHG Emissions (Tone)
MOPSO0.055469,5031.9692.5566131046
MOHHO0.055469,5031.9692.5566131046
Table 13. Generated power of each element using best compromise solutions.
Technique P P V (MWh) Grid Sell (MWh)Grid Purchase (MWh)PV Share (%)V2H Share (%)Grid Share (%)Net Saving in CO2 Emission (%)
MOPSO34.2510.562.7692.310.237.4472.16
MOHHO34.2510.562.7692.310.237.4472.16
Table 14. Performance metrics of Pareto solutions obtained by MOPSO and MOHHO.
TechniqueMetricMinMaxRangeMeanSTDTime
MOPSOLPSP0.0180.0710.0530.0340.017381
COE0.0210.0860.0650.0530.021
REF0.5070.9730.4650.7900.180
MOHHOLPSP0.0160.0610.0440.0350.014664
COE0.0220.0850.0620.0450.016
REF0.5070.9730.4650.7570.158
Disclaimer/Publisher’s Note: The statements, opinions and data contained in all publications are solely those of the individual author(s) and contributor(s) and not of MDPI and/or the editor(s). MDPI and/or the editor(s) disclaim responsibility for any injury to people or property resulting from any ideas, methods, instructions or products referred to in the content.