Article

A CFD Study of Pollution Dispersion in a Historic Ventilation Corridor with an Evolving Urban Complex

by
Alicja Szmelter
1 and
Joanna Szmelter
2,*
1
Faculty of Architecture of Technology, Warsaw University, 00-659 Warszawa, Poland
2
Wolfson School, Loughborough University, Loughborough LE11 3TU, UK
*
Author to whom correspondence should be addressed.
Sustainability 2025, 17(16), 7348; https://doi.org/10.3390/su17167348
Submission received: 10 July 2025 / Revised: 31 July 2025 / Accepted: 11 August 2025 / Published: 14 August 2025

Abstract

Ventilation corridors can play an important role in removing harmful air pollution in cities; however, there are social pressures to use this corridor land for new buildings. The presented study employs RANS fluid flow simulations with the k- ϵ turbulence model to investigate how the addition of buildings in the historical ventilation corridor impedes CO traced pollution removal. The urban complex situated near Raclawicka Street in Warsaw is selected as a case study for which two urban layouts dating from 2006 and 2017 are compared. The investigation includes varying ambient wind speeds and direction, with a prescribed CO-air mixture source representing a supply of road pollution. The results provide aerodynamic and dispersion characteristics and identify several generic trends indicating that the orthogonal urban layouts help to remove the pollution faster, especially when compared to courtyard building configurations, and that the introduction of occasional wide gaps between buildings can also speed up the pollution removal in the direction perpendicular to the gaps. Furthermore, for this urban complex the addition of new buildings had predominantly a local impact. The results showed that for light and mild winds, ambient speeds have little impact on dispersion patterns, but the effects of a dynamic ambient wind reversal are pronounced.

1. Introduction

A responsible approach to changes in urban structure ensures the well-being of future inhabitants. Sustainable development, based on the concept of balanced city planning, aims to meet basic needs, including access to water and energy supplies, an efficient transport system, green spaces, and clean air. Although the complex influence of green spaces on environmental sustainability in urban areas has been recognised, there is growing concern that urbanisation and intensification of urban areas impact their preservation [1]. This concern extends to historic ventilation corridors, where a deep understanding of how new buildings impact the dispersion of pollution is still incomplete. Decisions influencing sustainable planning need to balance two tendencies. On the one hand, the development of new building complexes on undeveloped land within central urban areas is included within the concept of sustainable land use, with the aim of minimising urban sprawl. On the other hand, poor air quality related to accelerated urbanisation affects the sustainability of the urban environment and is linked to health problems. By studying the flow through the urban complex, it is possible to positively control the efficiency of ventilation in the future urban layout. Thus, knowledge of the effects of airflow on surrounding buildings is one of the important areas of sustainable architecture [2]. Urban airflow can involve different aspects that affect the health and comfort of the population. Aerodynamic characterisation depends on many factors. Examples include changes in the wind regime at the pedestrian level, noise, wind loads on buildings, heating, ventilation, and pollution dispersion. In this context, sustainable development requires information about the effects of urban layouts on the pollution removal and the aerodynamic interaction between buildings that can be gained by numerical modelling. The building density of horizontal urban layout has been shown to have a significant impact on the concentration of pollution, e.g., [3]. These effects are often studied with AI-driven models that can be limited by the availability of sampling data and canopy models with statistical representation of buildings [4]. In contrast, the presented study investigates an urban complex on a scale where the accurate geometry of the buildings is taken into account. This allows for a detailed analysis of intricate local flow features for typical building groupings and mutual locations and, in turn, identifies recommendations for sustainable building planning that facilitates efficient removal of pollution.
The paper reports a numerical study on carbon monoxide (CO) dispersion using a range of selected airflow scenarios within an urban complex inspired by buildings situated near Raclawicka Street (Ulica Racławicka) in Warsaw, Poland, placed in a historical ventilation corridor intended to aid the escape of air pollution from the central area of the city.
The ventilation corridor, also known as a “green wedge”, was designed in 1916 as one of the elements of the first modern urban development plan of Warsaw, called the “Preliminary Sketch of the Regulation Plan of the Capital Town Warsaw” [5]. It was developed by a team of Polish urban designers and engineers, coordinated by Tadeusz Tolwinski, and designed according to the novel, at that time, principles aiming to benefit living conditions in the city. To improve the quality of air in the congested city, a complex of several “green wedges” was created that were to draw fresh air from the outskirts to the city centre and to discharge outside the polluted air. These “green wedges” converging towards the city centre from farmland and forests were to remain free of buildings and connected to the existing green areas in the city. The principle of ventilating a town by a system of ventilation corridors started to be obligatory in the subsequent urban development plans of Warsaw during the interwar period and after the Second World War, when Warsaw was both being rebuilt and developed. Developments in unbuilt areas of ventilation corridors located close to the city centre started to be considered in the early 1990s, and the idea of ventilating Warsaw with "green wedges” was being questioned [6].
The area examined in this study is located in the ventilation corridor leading approximately from the south to the city centre of Warsaw. Raclawicka Street was primarily a road connecting the XIX century forts of the defensive system of Warsaw. This area is part of the closed housing complex called “Marina Mokotów”, which spreads over 20 hectares between Raclawicka Street to the north, Milobedzka Street to the east, Woronicza Street to the south, and Avenue Zwirki i Wigury to the west. The complex comprises a variety of houses: from multifamily apartment blocks to urban villas and detached and semi-detached houses with small private gardens. The estate is steeped in greenery (approx. 60% of the whole area). The construction of the first buildings started in 2003 and is ongoing. The presented study focuses on two urban layouts representing the added buildings from 2006 and 2017.
In general, urban flows are complex, and their simulations may consider many factors, discussed extensively in earlier [7] and more recent [8,9] reviews of air pollution dispersion modelling in the urban environment. Taking into account details of geometrical representation, the number of buildings, and aiming to shed a light on the general trends in pollution dispersion, the presented study assumed simplifications necessary to ensure realistic computing time for the simulations. Consequently, the flows were treated as incompressible, isothermal, and non-stratified. The latter is justified due to the moderate heights of the buildings. Small differences in terrain height and the influence of vegetation were also neglected, although they are likely to have some impact on the results [10], as is the omitting of heat transfer, discussed, e.g., in [2], precipitation, and the effect of urban neighbourhoods on upstream flow; refer to [11] for a further insight.
For practical CFD predictions of urban flows, it is generally recommended to use meteorological data to define ambient wind profiles for initial and boundary conditions [7]. A representation of ambient meteorological conditions at the building scale is not straightforward [12], but there are meteorological tools [7] that can provide boundary layer parameters, including wind speed and direction, near-surface temperature and cloud cover. However, the majority of computational studies assume adiabatic flows with static ambient wind boundary conditions for which meteorological data (if taken into account) is provided from statistically averaged wind profiles. Only some investigations include dynamic changes in the ambient wind. For example, ref. [13] employs a nested approach for which boundary conditions are modified, typically hourly, by the wind profiles obtained for the selected area from the global atmospheric WRF model. Herein, we consider both static and time-varying wind velocity boundary conditions. Due to the scale of the considered buildings and the focus on the trends of pollution dispersion, the ambient wind conditions are idealised. Initially, two uniform ambient wind speeds were assumed to be characteristic of typical conditions at the pedestrian level, 2 m/s, corresponding to a light breeze when the wind would be felt on the face and the leaves would rustle, and 10 m/s, representing a fresh breeze when small trees begin to sway. The partial slowdown of the flow was also accounted for, as was the reversal of the wind direction. However, this neglects the complexities of non-uniform ambient wind speeds that, in reality, could enter the region from multiple directions.
For simplified urban configurations, e.g., ref. [14] modelling of reactive pollutant dispersion with different chemical mechanisms has been investigated. Some of the most common pollutants in urban air are nitrous oxides (NOx) and carbon monoxide (CO), as these are the main components of traffic pollution. Nitrous oxides are reactive, whereas carbon monoxide can be considered inert [14]. This study focuses on more complex urban layouts and dispersion tendencies only; therefore, pollutant reactions with the air are not taken into account, and carbon monoxide alone is simulated as a contributing pollutant.
All documented computations utilised the CFD software Simcenter Star CCM+ version 2306 to provide unsteady solutions of three-dimensional Reynolds-Averaged Navier–Stokes (RANS) equations with the k- ϵ turbulence model. The investigation illustrates the impact of the intensified in-time build-up in the ventilation corridor on the flow characteristics and pollution dispersion and the type of building designs which delay the removal of polluted air from the local area.
The remainder of the paper is organised as follows: Section 2 defines the problem formulation that provides information about the urban landscape and the numerical model adopted. The results of simulations are documented in Section 3, and Section 4 draws conclusions of the paper.

2. Problem Formulation

2.1. Urban Landscape Geometry

For the selected urban landscape case study of the Raclawicka Street area in Warsaw, a CAD model (the geometry generated for this study is available on request) reflecting the buildings’ geometry (Figure 1) was created using the NX.11 software. The dimensions in CAD geometry were taken from the area map [15] and information obtained from Map Data © 2024 Google, for which the “measure distance” feature was used to determine the buildings’ dimensions. In [12], it has been concluded that only the main elements of the building structure noticeably affect the flow patterns at distances larger than the building height, and the shape details influence only the vicinity of the buildings. Therefore, minor simplifications and measurement inaccuracies introduced in this process are too small to have a meaningful impact on results. The level of geometrical detail and the mesh quality are illustrated in Figure 2 showing a fragment of the surface mesh.
In Figure 1, the height of buildings is colour-coded such that pink indicates 24 m, dark-yellow 21 m, pale-yellow 15 m, and red shows 9 m. Two configurations of the buildings have been considered. The first, from 2006, in which the grey buildings at the bottom of Figure 1 had not been built yet, and the second is where they were added in 2017. The new buildings are 24 m in height.

2.2. Methodology

The time-dependent solutions used RANS calculations and the k- ϵ turbulence model. When small-scale flow characteristics are required to predict short time-averaged properties of pollutants, and an accurate representation of the transient nature of mixing processes is essential, then the Large Eddy Simulations (LES) are preferred for transport and dispersion problems [16]. Indeed, the LES approach has increasingly been used for flows past a single building or a small building complex, but due to computational expense, it is less frequently used for larger areas [16,17]. As long-term pollutant dispersion patterns are of the main interest here, the time-dependent RANS calculations are judged to be adequate. RANS methods have previously been used successfully for the modelling of larger urban areas. For example, in [11] it was found that the full-scale urban landscape RANS simulation produced urban wind flow predictions of speeds only 20% different from the experimentally measured values. In particular, the Star CCM+ option of RANS with the k- ϵ turbulence model has a proven record in the modelling of urban flows, e.g., [13,14], and has been validated against experiments [18].
In the absence of measured data for the Raclawicka complex, validation of the adopted CFD approach has been performed for the case of an isolated building. Comparisons of numerical results with wind tunnel measurements reported in [19] are provided in Appendix B. The details of the model specification required to reproduce the presented results are provided in Appendix A.
In general, the primary emission pollutants produced by road transport include carbon dioxide, hydrocarbons, particulate matter, nitrogen oxides, and carbon monoxide. In the context of this study, the odourless gas CO was chosen as the sole pollutant. This choice was made to simplify the simulations and because higher concentrations of CO in the outside air are linked to early mortality [20]. Moreover, currently most CO emissions outdoors come from fossil-fuelled road vehicles [21].

3. Results and Discussion

The investigation considered several scenarios of pollution dispersion described in the following sections.

3.1. Forward Flows with a Pollution Source

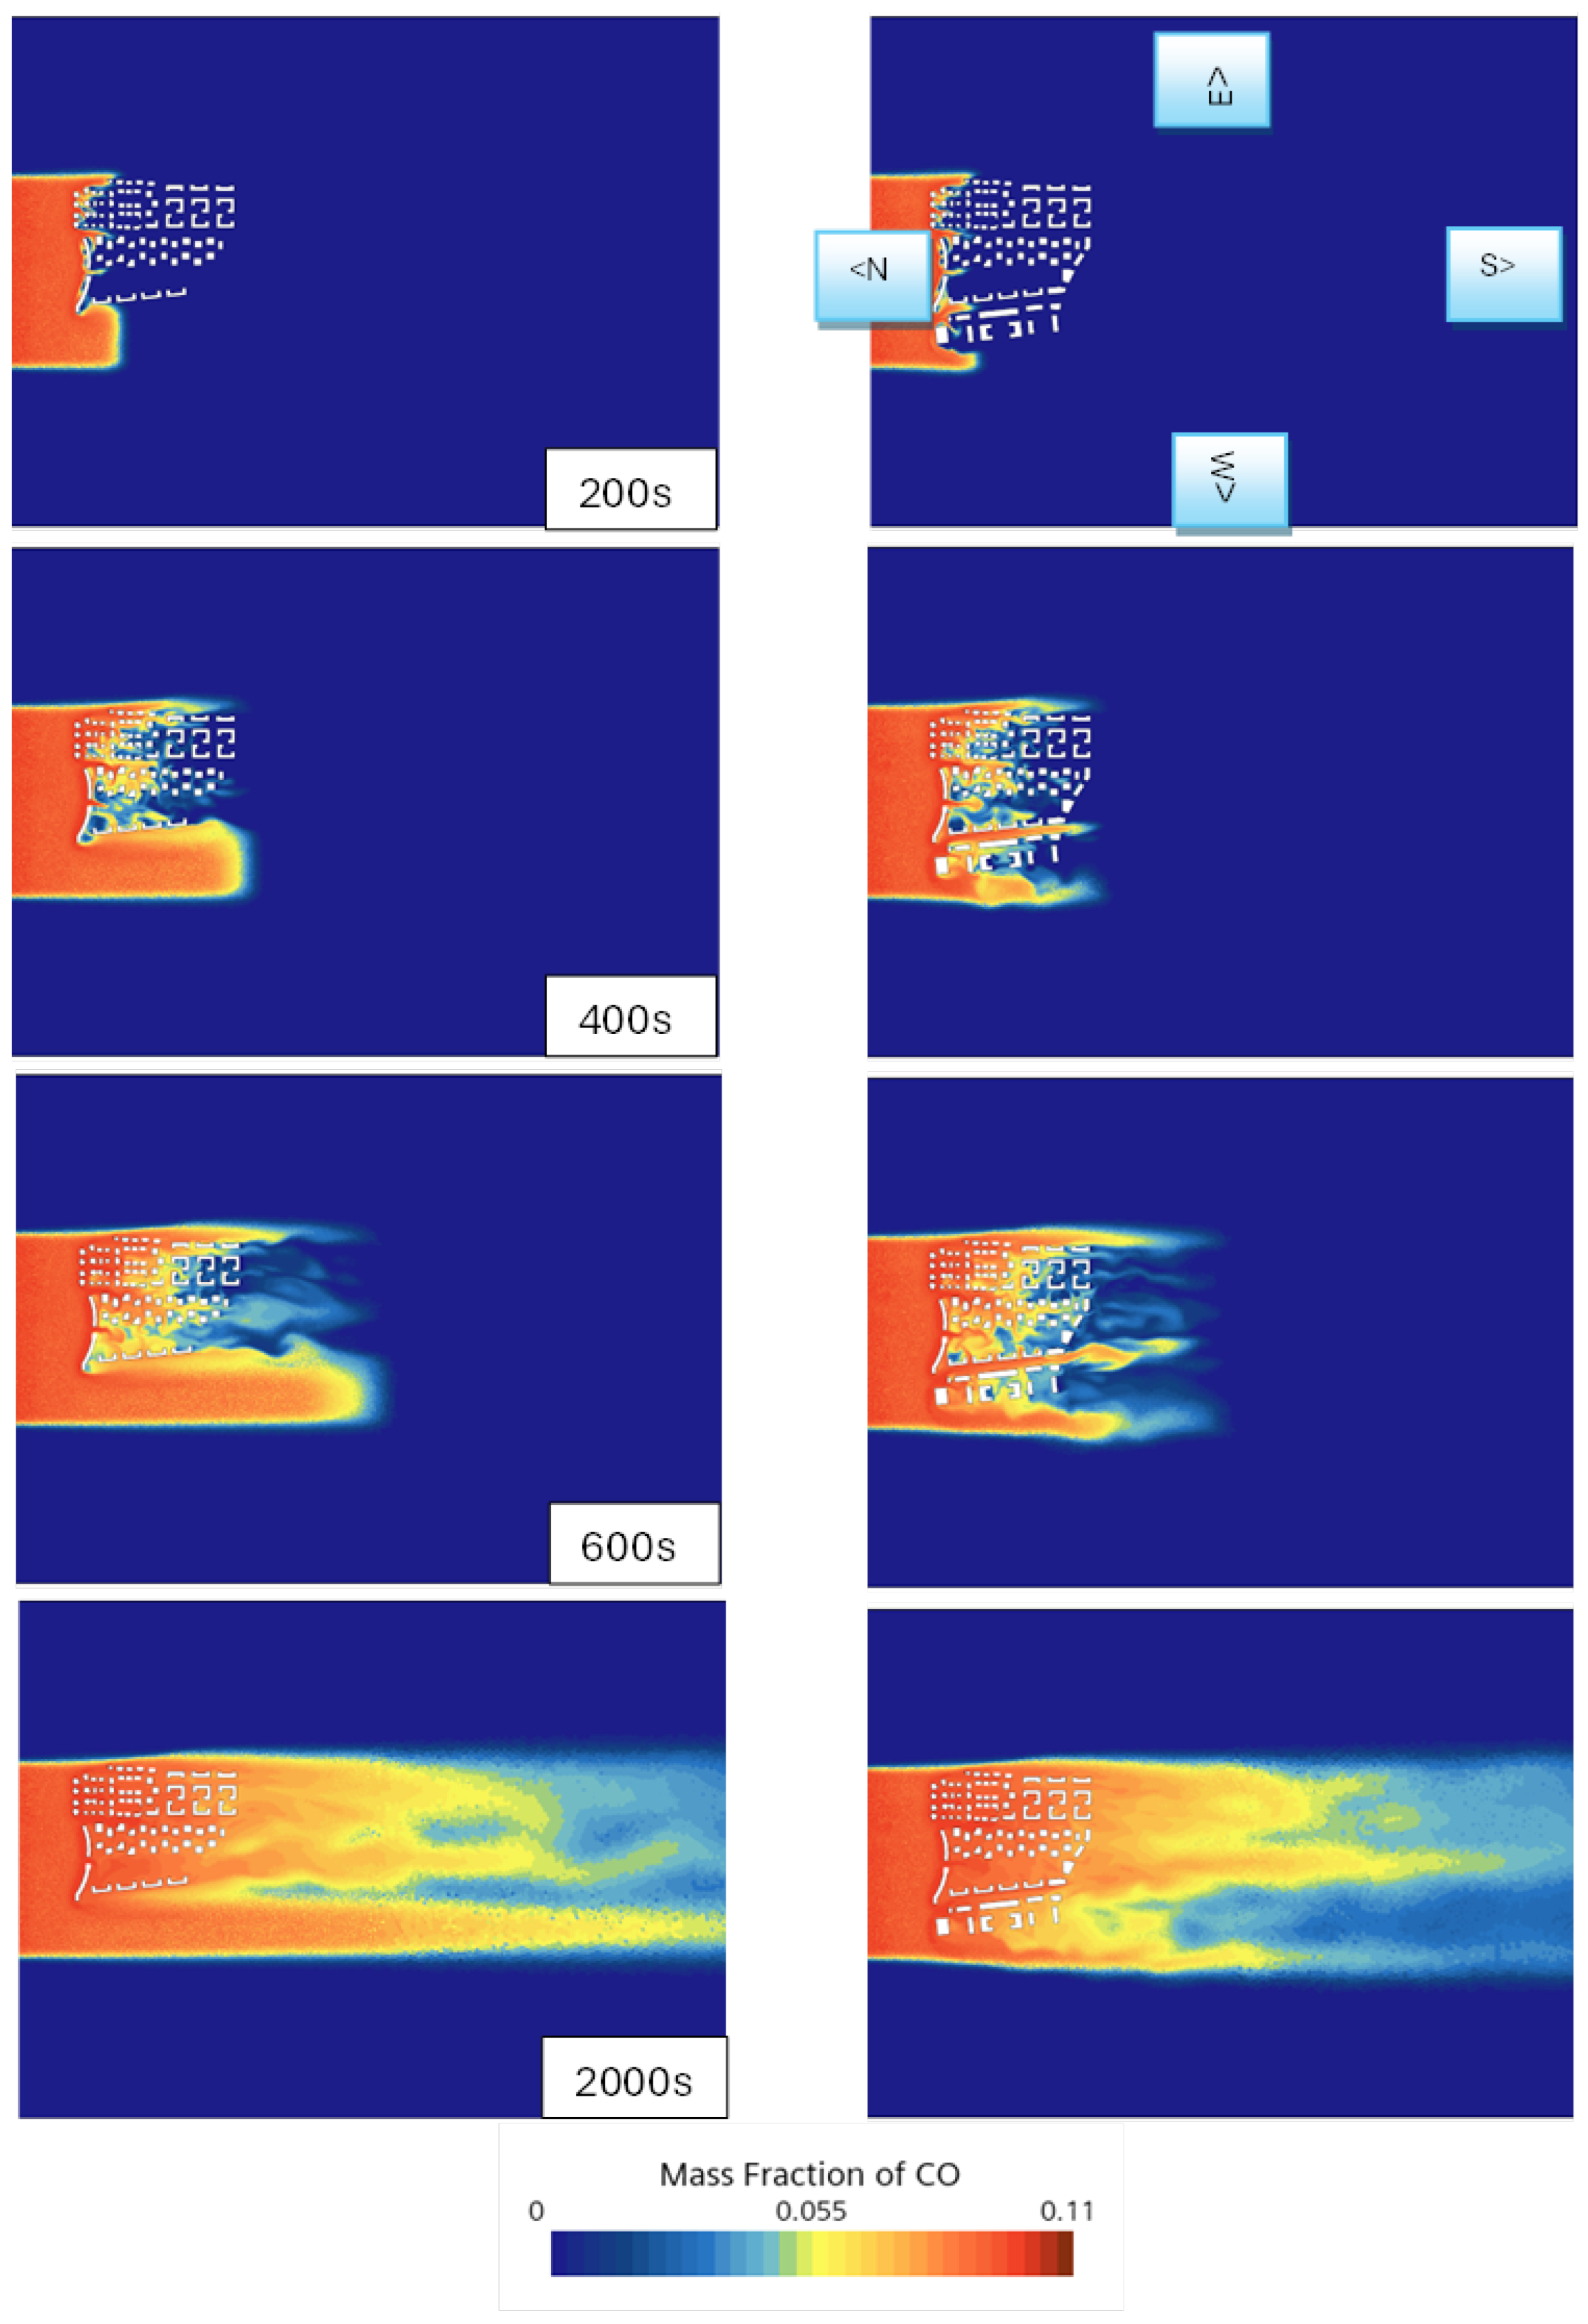
Figure 3 illustrates the evolution of the CO dispersion patterns obtained for 2 m/s ambient wind blowing from the north to the south, with the pollution source located on Raclawicka Street, i.e., the north of the computational domain. The source provides a supply of CO at a constant rate for a duration of 2000 s. After the 2000 s, the pollution is advected throughout the whole building complex. The air in the computational domain is assumed to be initially pure and at rest. The patterns are presented in the horizontal plane, placed at 5 m above ground level. Despite the formation of a boundary layer near the ground, the transport of pollution is largely undisturbed until about 200 s, when it reaches the first obstacles. As expected, locally, the pollutant motion slows down as particles reach building walls, where pressure and CO concentration start to build up. Particles with sufficient kinetic energy travel over the buildings, while the remaining particles find their way around them. The 21 m high, long, curved building initially blocks the pollution from entering the main part of the complex. After 400 s, the distribution of the CO mass fraction is more affected by the presence of new buildings (from 2017) in the western part of the complex. In this area, for the 2006 configuration, the travel of pollution remains undisturbed and continues to do so for most of the 2000 s.
For both layouts, pollution has the highest concentration on the building walls facing the wind and in the gaps between the buildings which are located parallel to the wind’s direction, where the velocity of the particles accelerates. The concentration is low behind the buildings, but the pollution can still reach these areas through the side gaps between the buildings and due to recirculations forming behind them. These trends continue at 600 s. The pollution levels remain low in the cavities formed in the courtyards of the rotated C/L-shaped group of buildings in the south-east corner of the complex. It reaches the centre of the cavities mainly by being drawn in by the vertically recirculating flow.
Figure 4 shows the line integral convolution of velocity vectors obtained after 2000 s in the horizontal plane located 5 m above the ground and for a central part of the 2017 urban layout. It demonstrates a local formation of typical vortexes in the vicinity of all buildings consistent with those investigated extensively, both numerically and experimentally, e.g., [19,22], for isolated buildings. However, interactions between vortexes, local streams of flow, and confluent wakes form a displayed complex flow pattern in Figure 4. The key features include the formation of high-speed streams in wide gaps between buildings parallel to the wind’s direction and streams of flow formed in the gaps perpendicular to them. The latter are caused by particles moving around buildings that can be further accelerated by a recirculated flow if the surroundings provide enough space to allow vortexes to form. This also explains the strong effects of building density on pollution dispersion reported in the context of sustainable urban planning [3]. Further typical flow features include multiple vortexes formed in partially enclosed building courtyards. Their formation is consistent with the recirculating mechanisms observed in the classical benchmarks of 3D lid-driven cavity flows, while their specific patterns are affected by the configuration and varying sizes of neighbouring buildings.
In general, the presence of new buildings slows the transport of pollution in the western part of the complex and has a limited effect on the pollution distribution in other regions. Similarly, as reported in [23], the results confirm that long spaces between buildings create increasingly high velocity flow that causes a “flushing effect on pollutant distribution”.
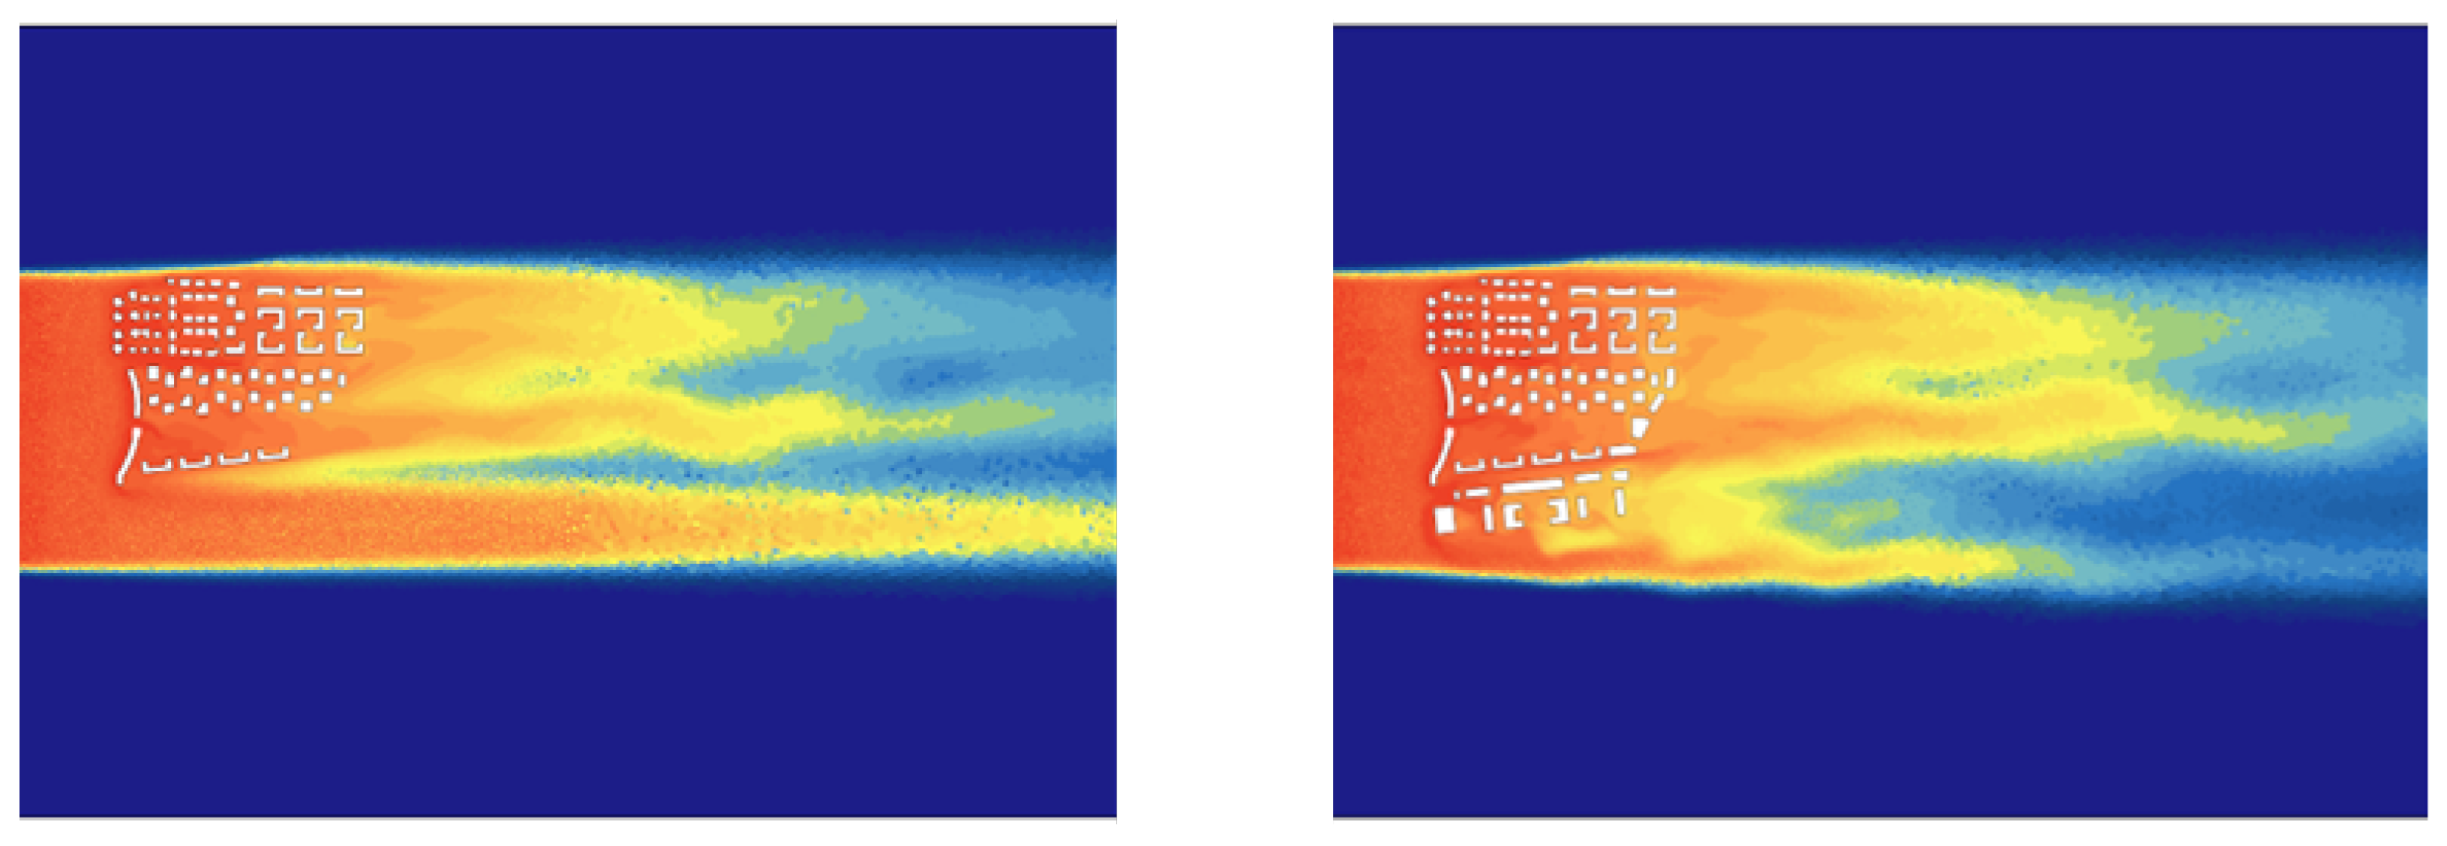
The simulation was repeated with the wind velocity increased to 10 m/s. The resulting dispersion patterns (not shown) were close to those obtained for 2 m/s when visualised at corresponding times, i.e., the 10 m/s inlet velocity snapshots were taken at time intervals five times shorter compared to the snapshots taken at the 2 m/s wind speed. This is illustrated by comparing a display of the mass fraction of CO after 400 s, for a wind velocity equal to 10 m/s in Figure 5, with the corresponding display at 2000 s for the 2 m/s velocity in Figure 3.
For both configurations, Figure 6 shows a representative vertical CO mass fraction distribution after 2000 s for the 2 m/s wind velocity and the corresponding 400 s for the 10 m/s velocity. The dispersion patterns are similar and exhibit signatures of the underlying ensemble of narrow confluent turbulent wakes forming behind the buildings. The results are illustrated in a vertical plane, parallel to the ambient flow and positioned 30 m to the east from the centre of the inlet. The results for the 2006 buildings’ layout also show some signatures of vortex shedding. However, in all cases, the pollution is contained below 100 m from the ground. Therefore, it is concluded that in this scenario, for mild winds at different speeds, the distributions of pollution remain similar if compared at appropriately scaled times.

3.2. Forward Flow with the Pollution Source Removed

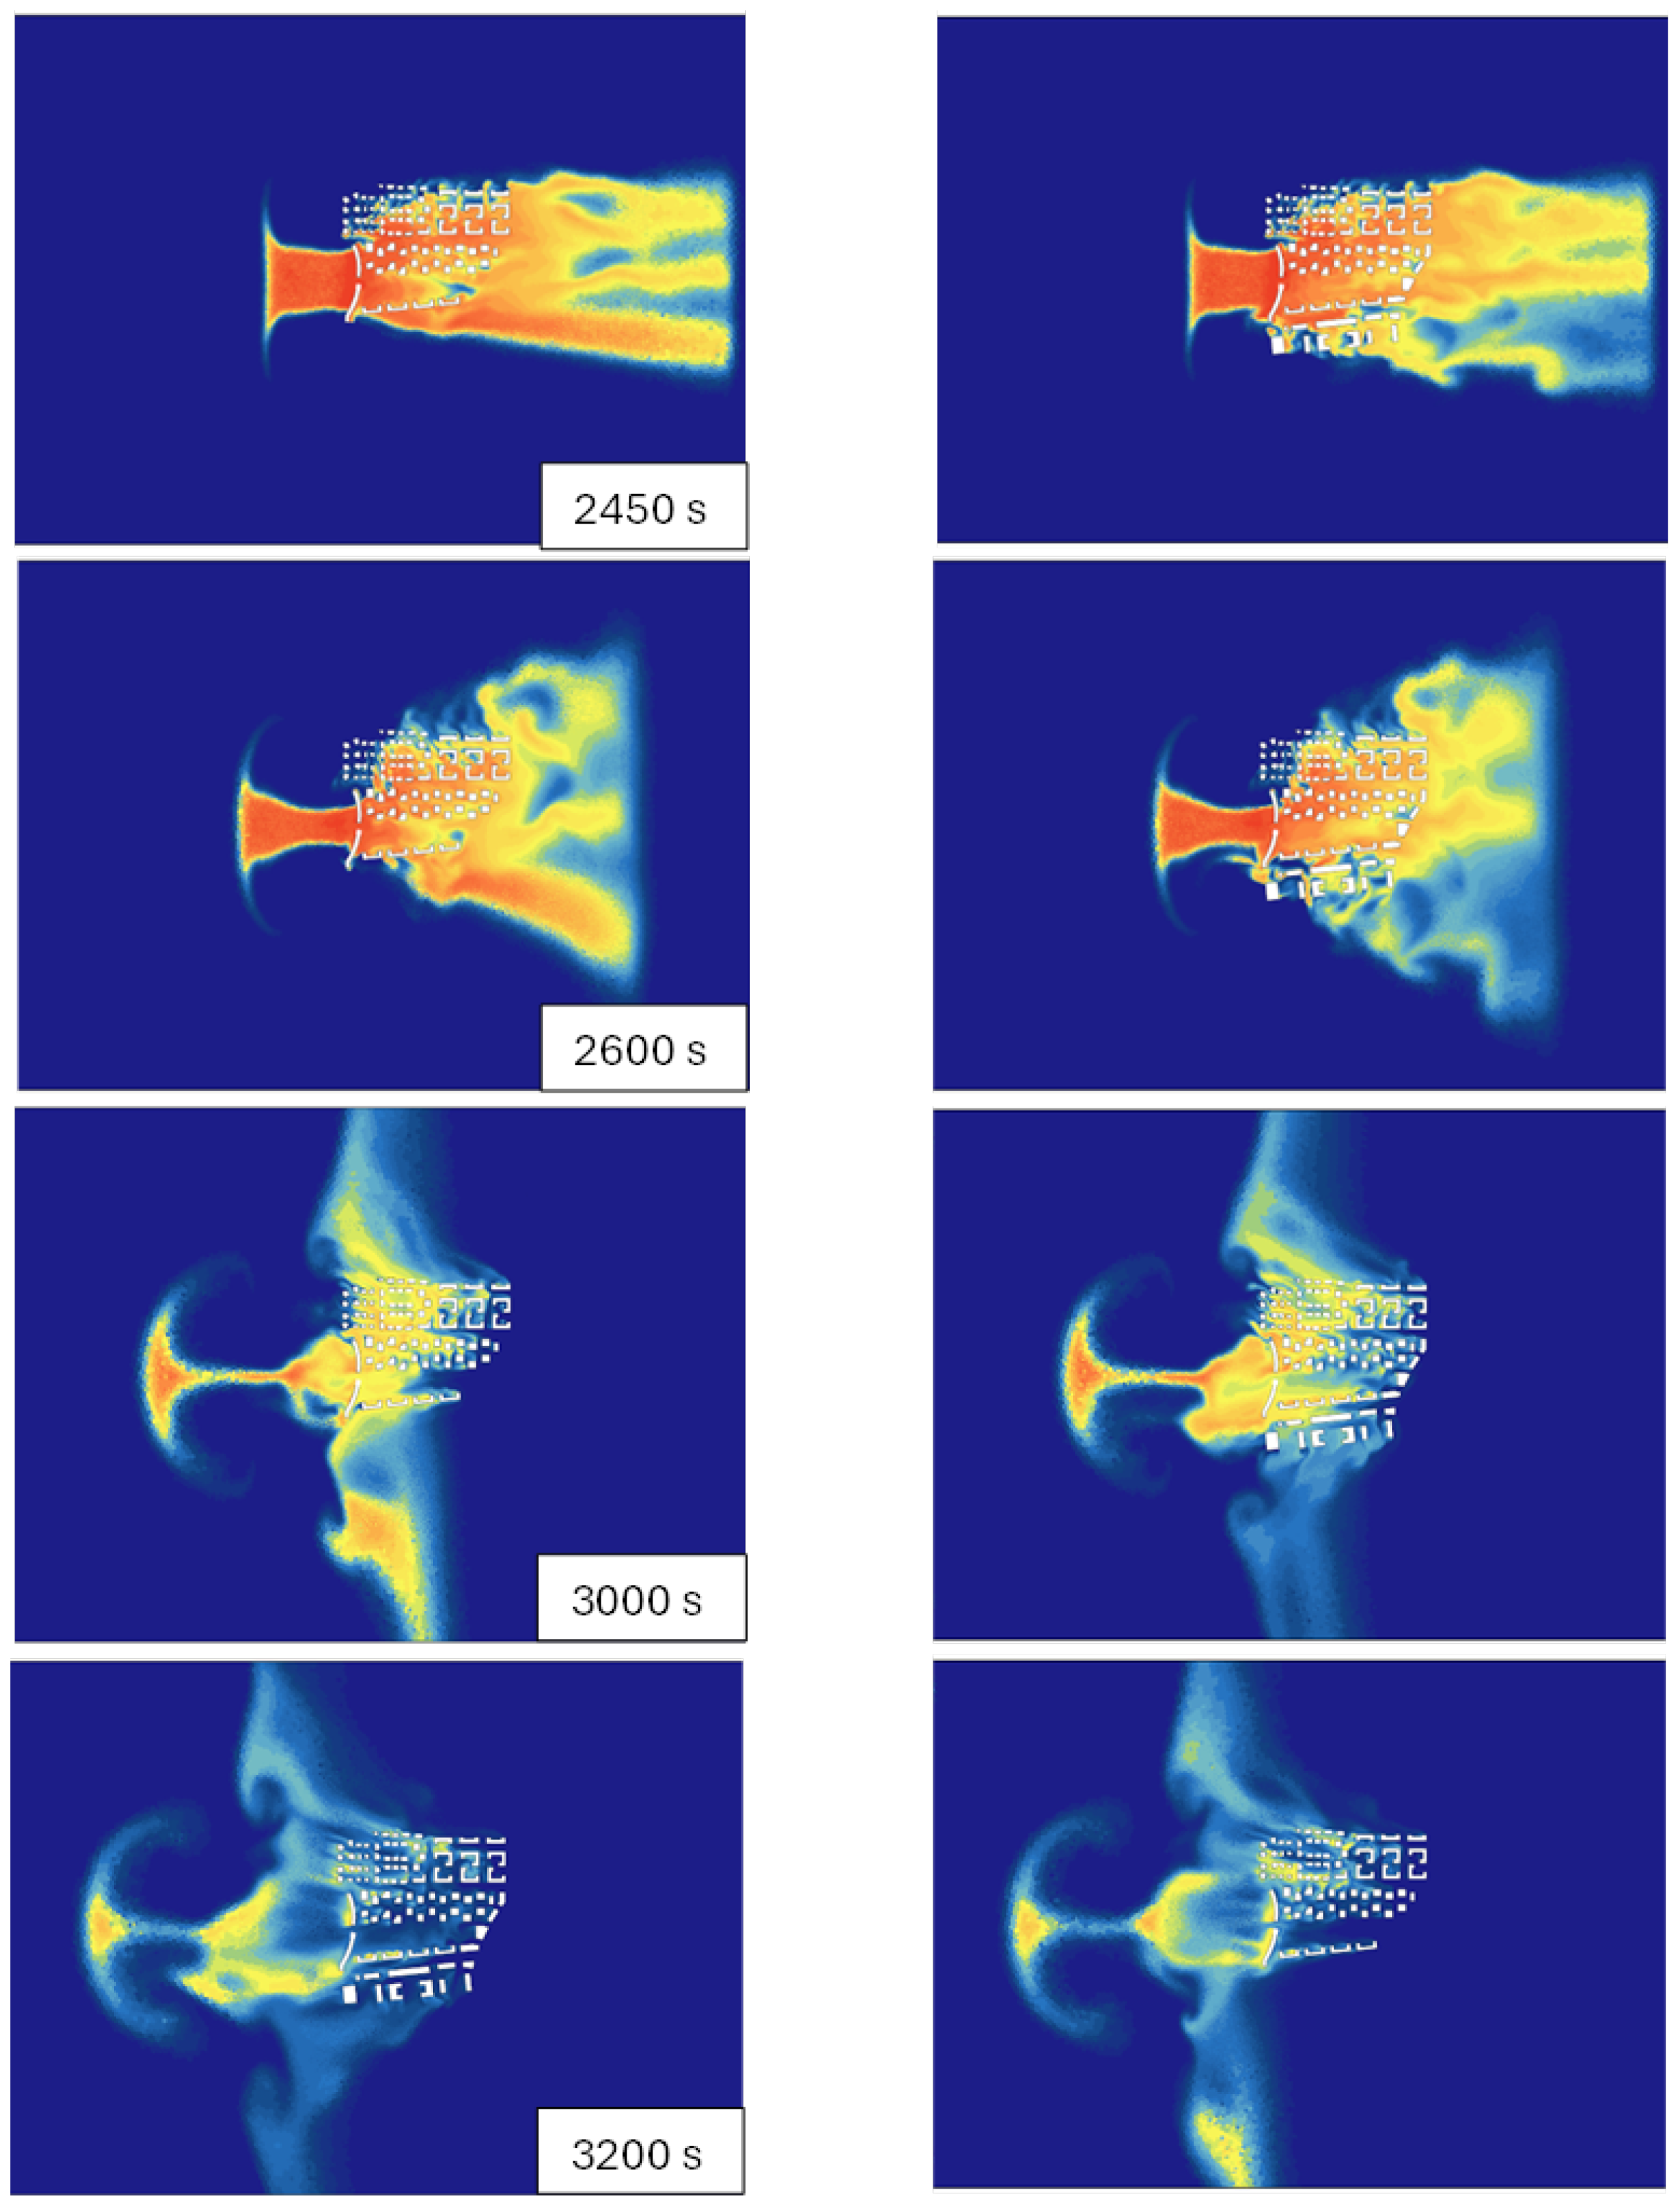
The simulations continued; however, the pollution source at the inlet was substituted by pure air. This would represent a situation when the traffic on Raclawicka Street stopped but the wind continued to blow with the same speed. Figure 7 illustrates how the pollution accumulated in the previous simulation is removed. Fresh air was prescribed in the entire inlet area and entered the computational domain with an ambient velocity of 2 m/s. For the 2006 landscape, it is evident that the pollution is quickly removed when the wind is not blocked by any buildings. This can be observed on the western side of the complex. However, the pollution remains trapped for longer between the new buildings in the 2017 landscape. The distribution of pollution in the farther east region is very similar for both landscapes, while the central part of the landscape is visibly affected by the new buildings. This is especially apparent in the earlier stages of the simulations at 2400 and 2600 s and is caused by new buildings blocking flow which would otherwise flow unobstructed through the gaps perpendicular to the direction of the wind. Such flows are akin to the case illustrated in Figure 4 and are aided by recirculated/separated regions formed behind buildings. However, in the 2017 landscape, the passage between old and new buildings is too narrow for the recirculation regions to form freely. This extends the time required to remove the pollution from the central part of the 2017 landscape.
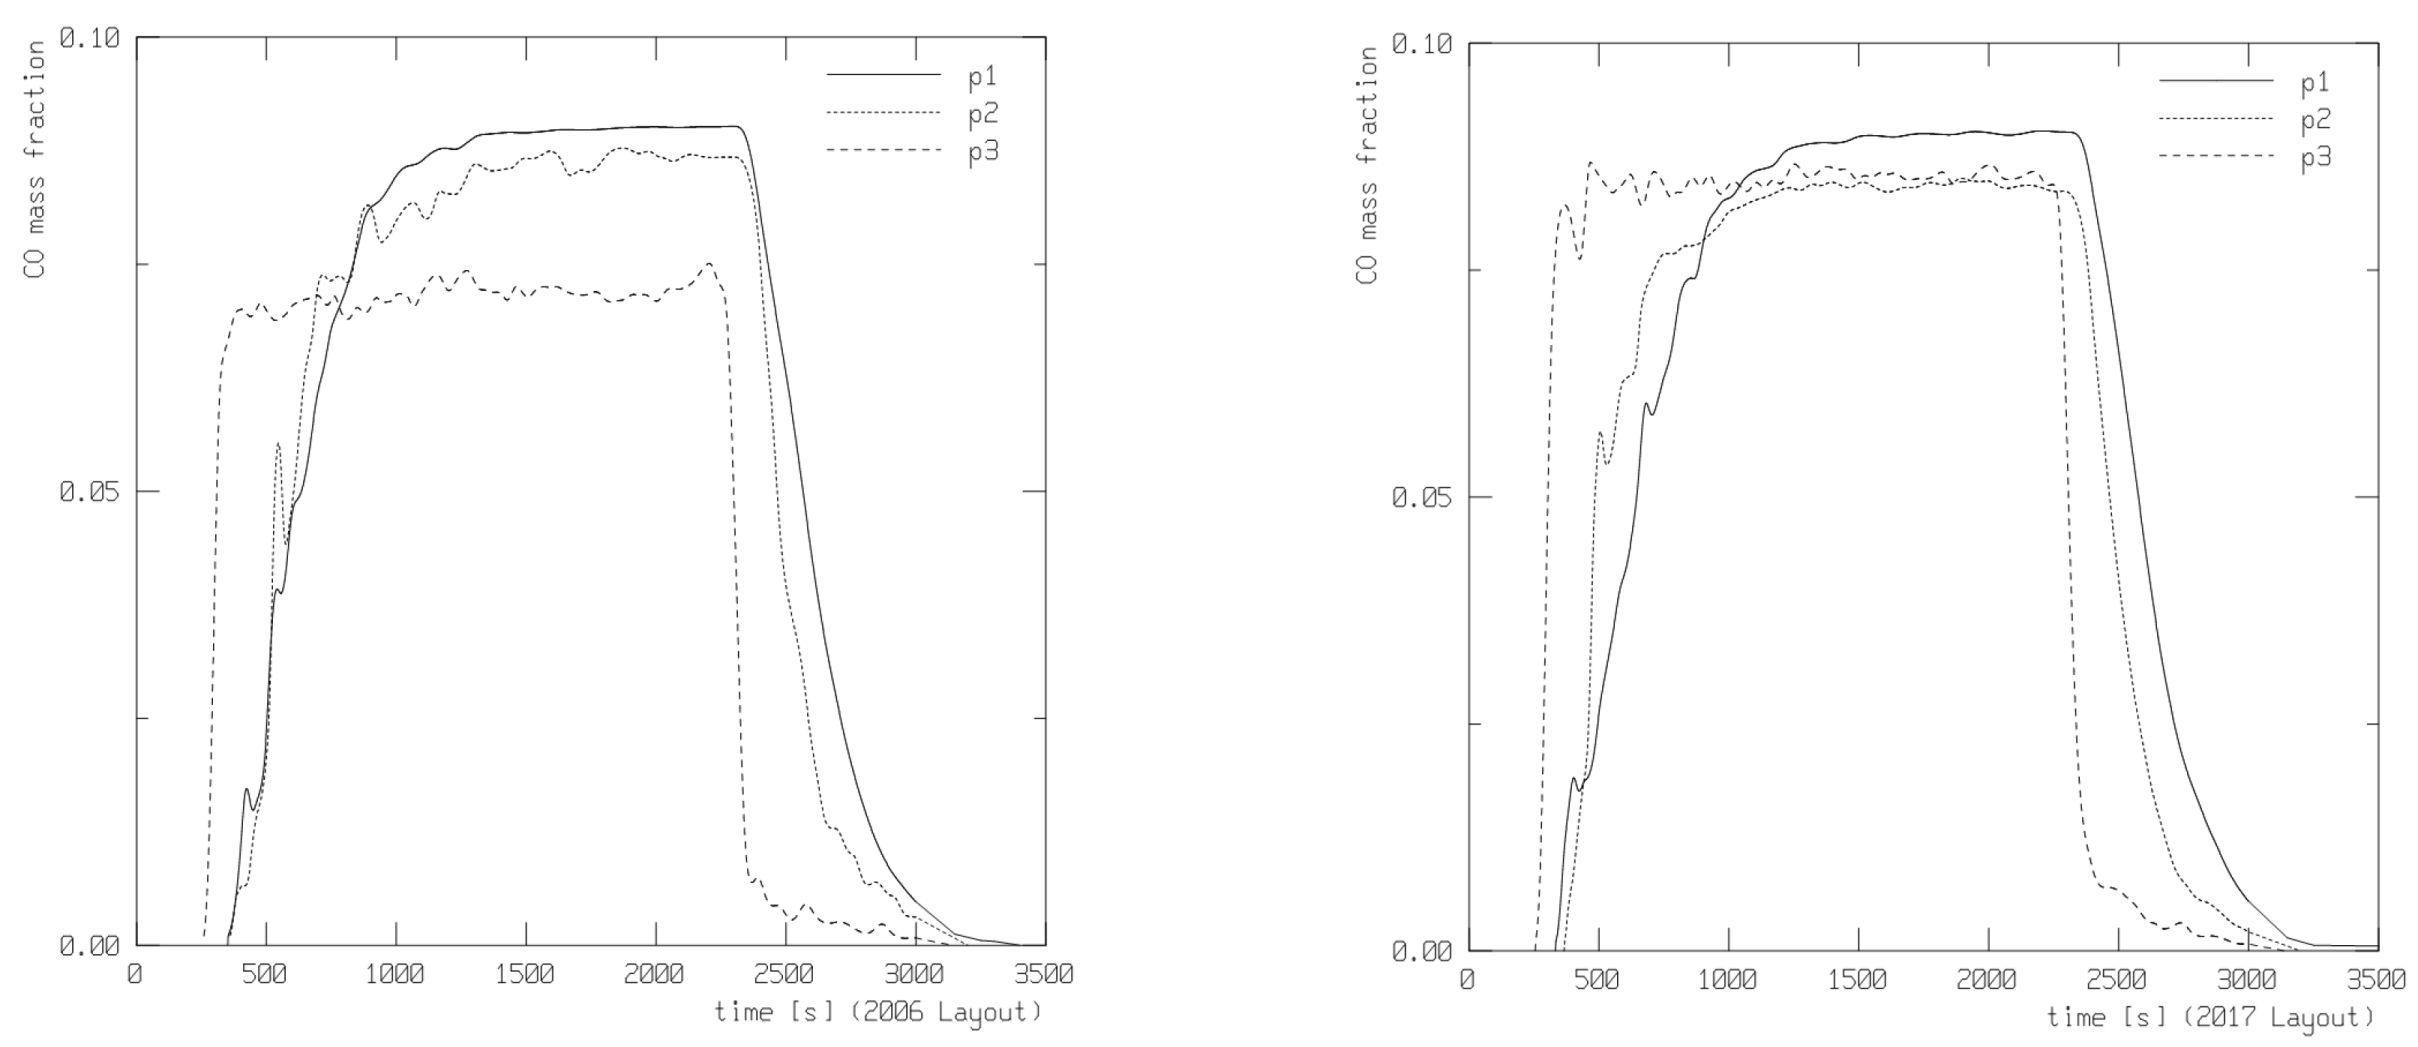
In general, the pollution is first removed along unblocked gaps between buildings positioned parallel to the direction of the wind. Its removal behind buildings is slower, and the pollution is removed even slower from areas of cavities formed by some combinations of building geometries. After 3800 s (not shown), the CO mass fraction reached levels below 0.005, and the simulations were terminated. The highest remaining concentration of pollution occurred in the courtyards of the rotated C/L-shaped buildings in the east/south part of the complex. This effect is already visible after 2800 s. An additional observation is that velocity patterns are influenced mainly by the geometrical configuration of the buildings and remain similar throughout the whole simulation, regardless of the CO being supplied or removed. These findings are further corroborated in Figure 8 showing histories of the CO mass fraction for three probes located as shown in Appendix B in Figure A3. They confirm that the addition of new buildings is localised and has little effect on the CO monitored by probes P1 and P2 in the western part of the complex, but the levels of CO monitored by probe P3 in the centre of the complex are much higher in the urban layout from 2017. All probes also show that the removal time of pollution is longest for probe P1, located near the semi-closed courtyards, and shortest for probe P3, located in the least built-on area.
The simulations were repeated for an ambient wind velocity of 10 m/s, but as in the forward simulations in Appendix B, their patterns at the corresponding (5 times shorter) times were very similar and therefore are not shown.

3.3. Reversed Flow with the Pollution Source Removed

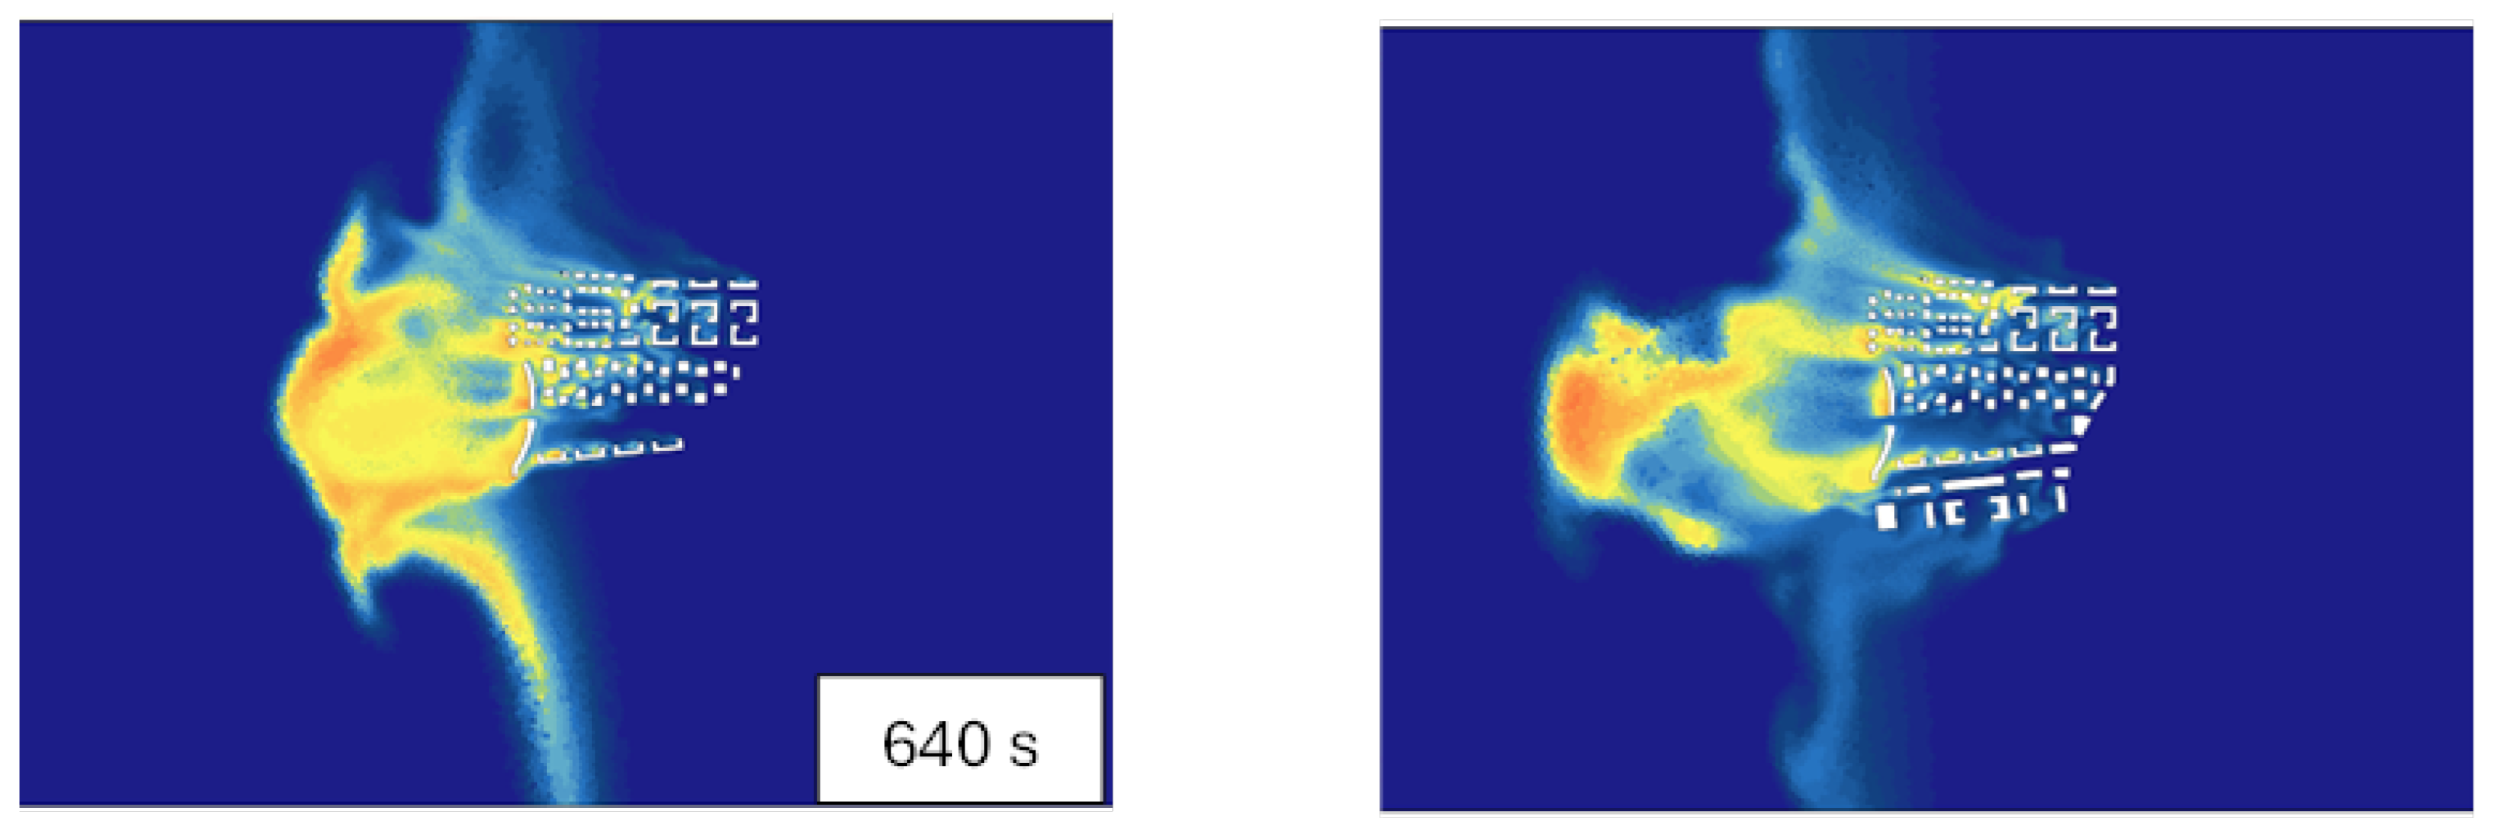
It has been observed that flows through urban structures can vary significantly, depending on the direction of a wind [24]. This is also confirmed in the present study, but with the additional insight of a dynamically reversing, slowing, and accelerating ambient wind speed. The simulation starts with the flow field obtained after 2000 s in the forward flow with 2 m/s ambient velocity, shown in Figure 3. To avoid nonphysical abrupt changes in atmospheric conditions and the creation of a front of locally excessive high pressure, the inlet wind speed is gradually decreased before the wind velocity is reversed and then its magnitude gradually increased from zero to 2 m/s. Specifically, the pure air was set at the whole inlet to be 1 m/s in the simulation between 2000 s and 2010 s. Then, the inlet velocity was set to zero for the next 30 s. During this time the pollution was still transported with non-zero field velocities triggered by the earlier calculations. Next, the positions of the left and right boundaries of the computational domain have been translated by 600 m to the left (Figure 9) to allow for formation of wakes, and the north and south boundary conditions were reversed, as detailed in Section 2.2. The inlet velocity of pure air was prescribed on the south face of the domain to be −1 m/s for the simulation, which lasted 10 s, before being increased to −2 m/s for the remaining duration of the calculations.
Figure 9 shows that while the pollution is transported in the direction of the prescribed at the inlet ambient wind (−2 m/s), its advection is partially opposed by the particles with positive velocities resulting from the preceding simulations in the regions in the north. Consequently, in the region between the opposing flow velocities, acting both from the south and the north, the pollution partially disperses sideways and upright, reaching heights of up to 150 m, i.e., 50 % higher compared to the idealised forward flow. For both landscapes, for the duration of the simulation, the pollution patterns are very similar in the eastern part of the complex. After 3200 s, the levels of pollution on the western side of the complex become low. The largest discrepancy in the pollution pattern is observed in the central part of the complex, where the presence of new buildings partially reduces the flow transverse to the direction of the ambient wind. Consequently, it is harder for the flow to remove CO from the northern side of buildings. This is particularly pronounced for long-curved buildings, where at 3000 s and 3200 s the levels of CO mass concentration on the lee side are still high. Simulations have continued until the CO mass fraction reached levels below 0.005, which occurred after 3600 s (not shown), when the highest remaining concentration of pollution occurred again in the vicinity of the rotated C/L-shaped buildings in the east/south part of the complex. However, for the reversed flow, the underlying velocity patterns (not shown) are significantly different from those in Figure 4.
For the 10 m/s ambient flow scenario, the pollution distribution for the reverse flow is different, as illustrated in Figure 10. This is due to the gentler way the flow was slowed and then accelerated. Namely, starting from the conditions obtained from the forward flow run at 400 s, the inlet velocity was decreased to 7.5, then 5 and 2.5 m/s for every 2 s of the simulation, and then to 0 m/s for another 10 s. After that, the flow was reversed, and the inlet velocity on the south face was prescribed to be −2.5, then −5 and −7.5 m/s for 2 s at each speed, followed by −10 m/s for the rest of the simulation. Despite the differences, general trends in pollution dispersion remained similar between the 2006 and 2017 landscapes, as in the previous case in Figure 9.

4. Conclusions

The paper reports the first study of the pollution dispersion in a large complex of buildings inspired by the urban landscape located in a historic ventilation corridor near Raclawicka Street in Warsaw, Poland, and identifies the following trends.
The results show that orthogonal urban layouts with linear locations of buildings, typical of modernist designs from the 1970s, promote effective ventilation, hence sustainable designs. This can be further enhanced by the provision of occasional wide gaps between buildings allowing for the formation of large vortexes, which facilitate pollution removal in the direction perpendicular to the ambient wind. In contrast, current common designs, which create residential buildings around partly enclosed courtyards, associated with a return to the city’s development with traditional peripheral buildings, delay the removal of pollution.
Two magnitudes of ambient wind velocities, representative of wind speed on an average day, have been investigated. The results indicate that for buildings with moderate height and at mild speeds, the variation in wind speed does not have a significant impact on CO concentration (taken at appropriately scaled times). However, simulations confirm earlier findings that flows and, consequently, pollution patterns through urban structures can vary significantly, depending on the direction of a wind.
Uncommonly, this study also investigated the dynamic reversal of the ambient wind. It showed that the dynamic change in wind direction creates areas where small fronts of opposing local velocities force the transport of CO sideways and vertically and can further delay the removal of pollution. Such effects cannot be observed with static ambient wind profiles, and their impact on pollution removal needs to be further studied.
The findings highlight how CFD modelling can provide a useful tool for evaluating developments within historic ventilation corridors, at least in terms of general trends in pollution dispersion. These could be relevant in sustainable planning both at the strategic stage, during the preparation of the urban development plan, and at the subsequent stage of detailed urban design. The current basic guidance does not account for the complex three-dimensional flow and pollution environment illustrated in this study, where the simulation of flows through a realistic urban landscape resulted in a range of vortexes, local streams of flow, and strongly interacting wakes.

Author Contributions

Conceptualization, A.S. and J.S.; methodology, A.S. and J.S.; software validation, J.S.; formal analysis, A.S. and J.S.; investigation, A.S. and J.S.; resources, J.S.; data curation, J.S.; writing—original draft preparation, A.S. and J.S.; writing—review and editing, A.S. and J.S.; visualization, J.S. All authors have read and agreed to the published version of the manuscript.

Funding

This research received no external funding.

Data Availability Statement

Numerical results are available on request.

Acknowledgments

The authors wish to acknowledge that Lovelace HPC services were provided at Loughborough University.

Conflicts of Interest

The authors declare no conflicts of interest.

Abbreviations

The following abbreviations are used in this manuscript:
RANSReynolds-Averaged Navier–Stokes
LESLarge Eddy Simulations

Appendix A. Method Validation

To validate the suitability of the Star CCM+ software with the software options selected in this work, a test case was chosen that reproduces the experimental study [19] of the flow past a cube in a fully developed channel flow, which is representative of a flow past an isolated building. Following [19], the dimensions of the wind tunnel are 390 cm × 60 cm × 5 cm, and the building is placed 52 channel heights downstream of the inlet. The cube is 2.5 cm high (also taken as a reference length H), and the turbulent flow is set with the Reynolds number of 40,000. The density and dynamic viscosity of the air are assumed to be at sea level ( 1.22 kg / m 3 and 1.73 · 10 5 Ns / m 2 , respectively). The inlet velocity is equal to 22.6 m/s and the outlet pressure boundary condition is assumed. Boundary conditions are set as no-slip on the surface of the cube, tunnel walls, and floor.
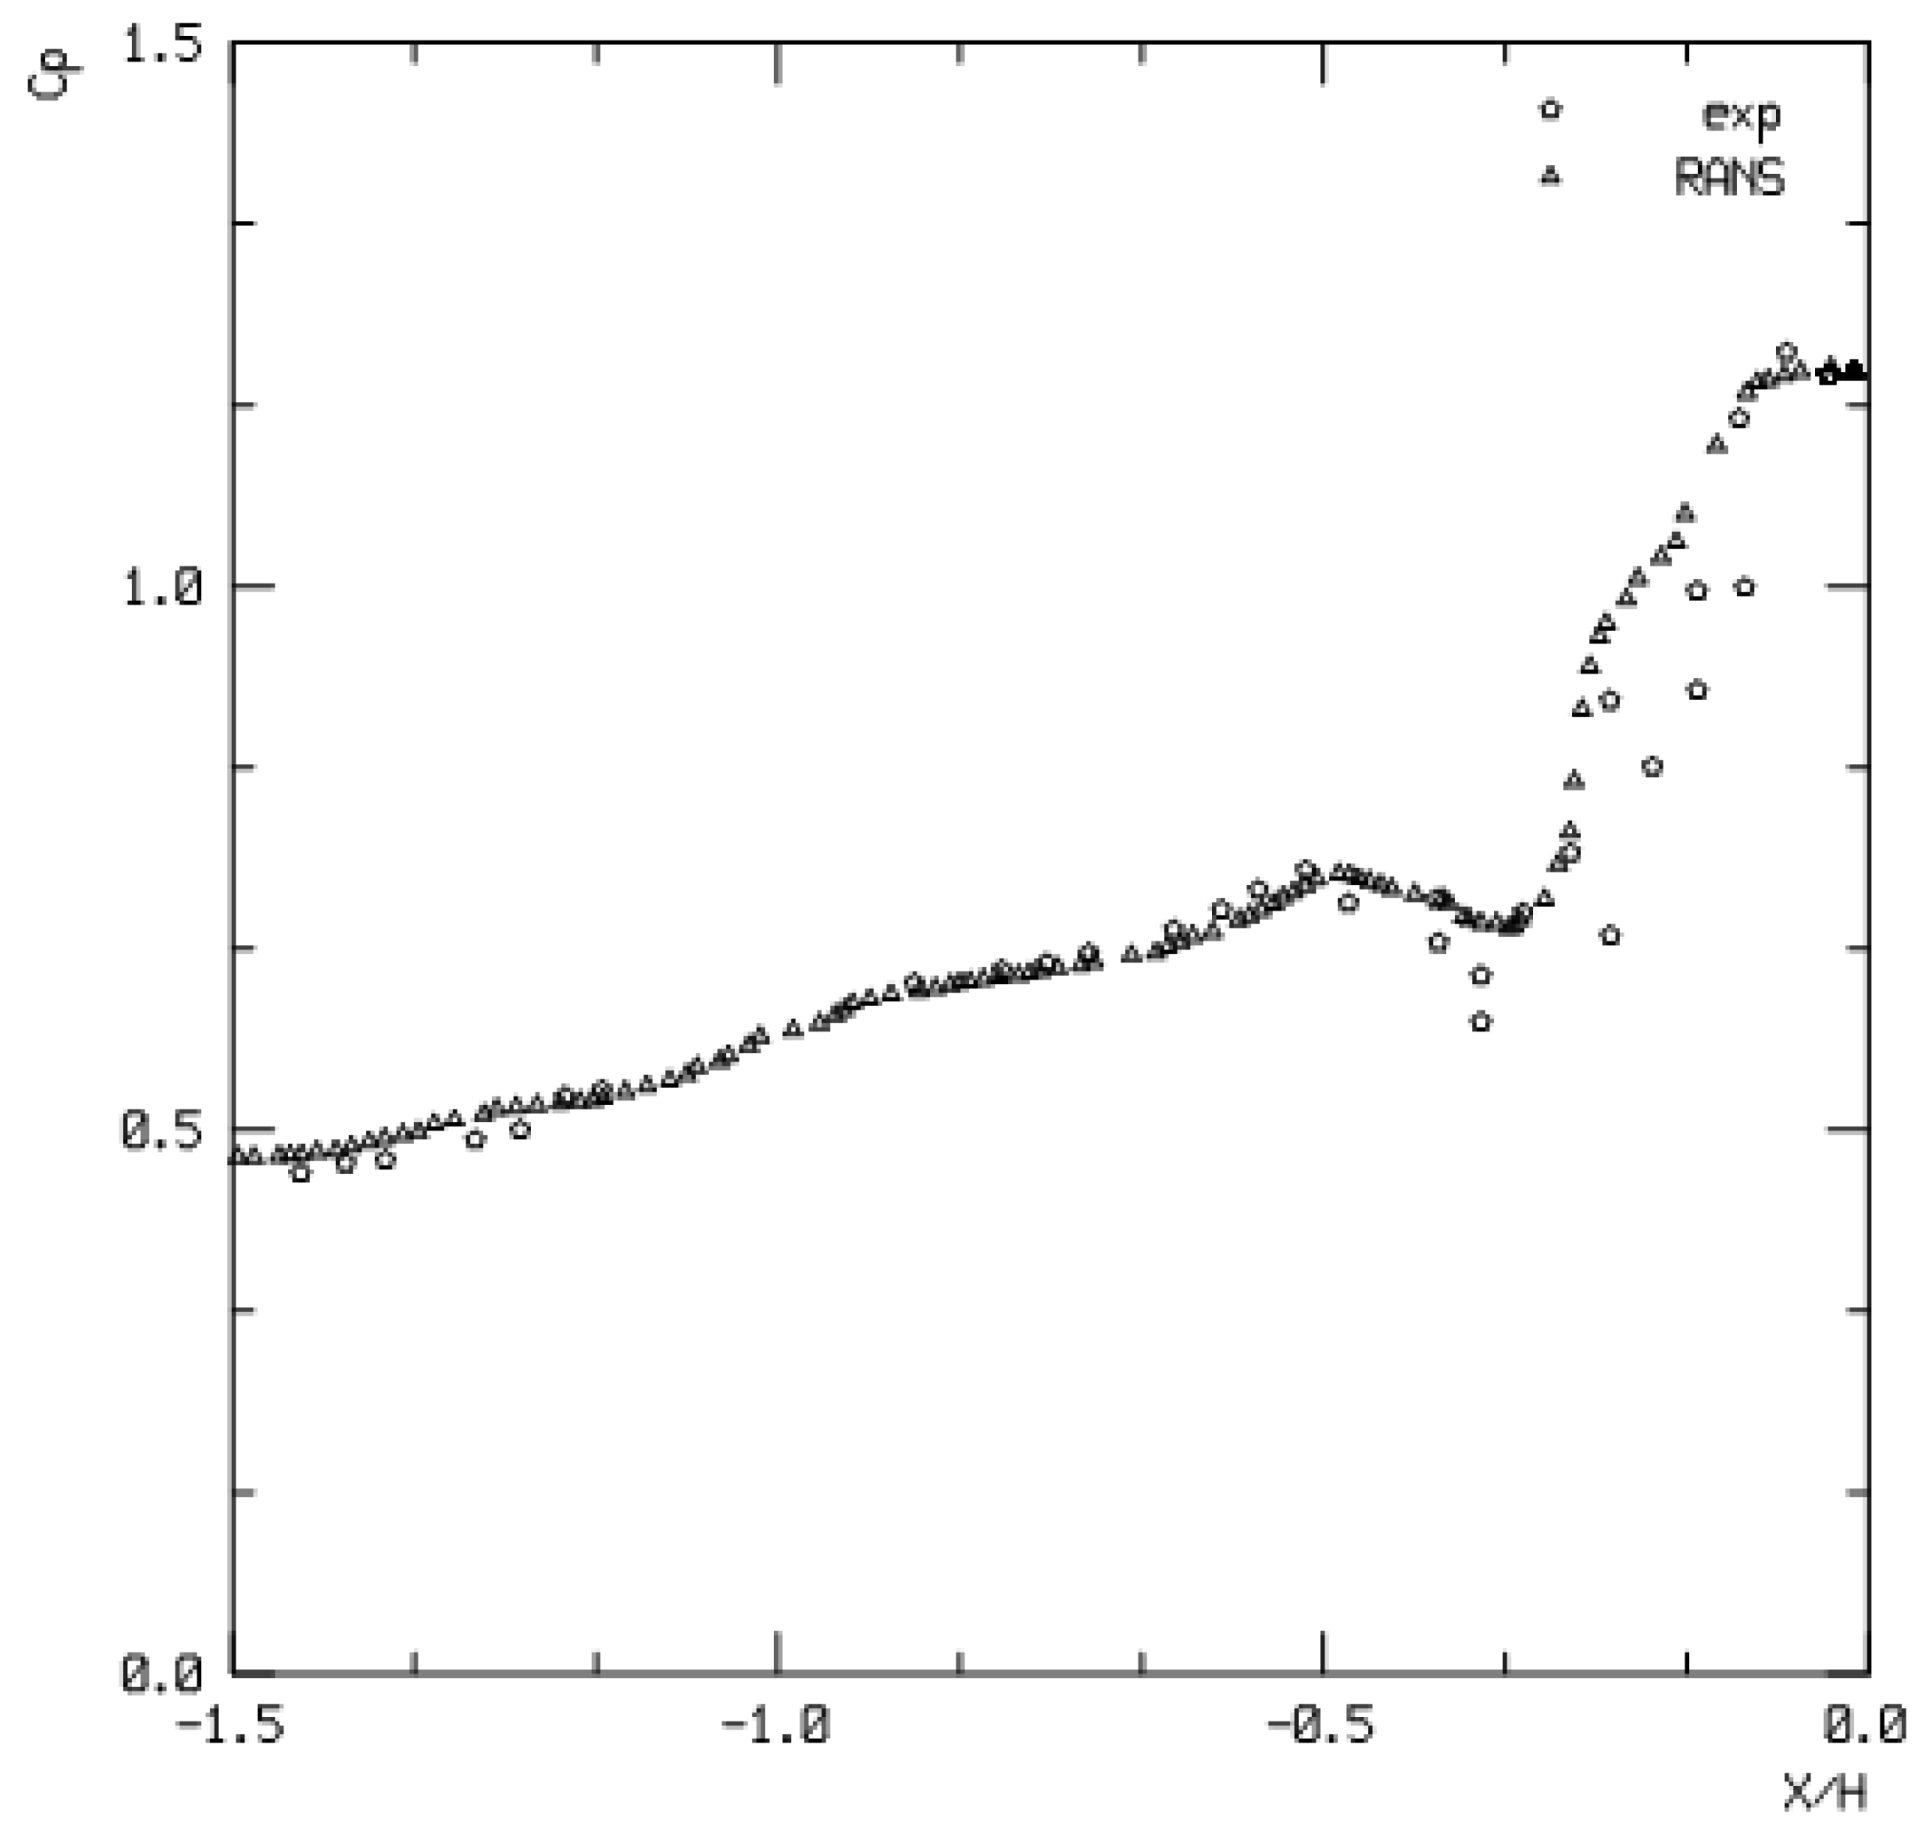
Figure A1 provides a qualitative comparison between the flow features in the simulation and the experiment, correctly reproducing the characteristic vortices from the laser-sheet visualisation in the experiment (shown in Figures 7a,b and 8 in [19]). The frontal vortex represents the cross section of a typical large horseshoe vortex. Figure A2, shows a good agreement between the resulting pressure coefficient (Cp) in the region upstream of the cube from the simulation and the experimental graph of Cp in Figure 9 in [19], which provides quantitative validation of the CFD software.
Figure A1. Line integral convolution of vector velocity in the vertical plane passing through the center of the cube.
Sustainability 17 07348 g0a1
Figure A2. Cp versus X/H along the vertical central plane in the region upstream of the cube; triangles represent the numerical solution and circles the experimental results.
Sustainability 17 07348 g0a2

Appendix B. Model Specification

The CAD geometry was imported into Star CCM+. A hexagonal computational domain is chosen to have a length, width, and height of 2300 m, 1600 m, 600 m, respectively. The building complex measures approximately 600 by 600 m. The inlet, where uniform air velocities are specified, is located 400 m away from the nearest building to the north (the geographical orientation of the complex is only approximate.) (left in Figure 1). The distance is sufficient for the boundary layer to develop near the ground before the flow reaches the buildings. A pressure outlet is specified on the opposite end of the domain. The no-slip boundary conditions are prescribed on the walls of all buildings and on the ground. On the east, west, and top boundaries of the domain, the free-slip boundary conditions are assumed to replicate open air. The impact of buildings on pollution dispersion is simulated by the introduction of carbon monoxide pollution. Following [14], the pollution source is placed at ground level to imitate traffic emissions. The source is rectangular in shape, centrally located in the inlet plane. It is 600 m wide to match the width of the complex and 30 m tall. It emanates the non-reacting multi-component gas consisting of both air ( 90 % ) and carbon monoxide (10%) in terms of mass fractions. The gas comprises air with density 1.18415  kg / m 3 , dynamic viscosity of 1.85508 · 10 5 Pa·s and molecular weight of 28.9664 kg/kmol. The carbon monoxide density is set at 1.145  kg / m 3 , the dynamic viscosity at 1.7897 · 10 5 Pa·s and the molecular weight at 28.0105 kg/kmol. Air ( 100 % ) was assumed on the remaining part of the inlet. The mass fraction at the outlet is specified as 90% air and 10% CO.
For computations when emissions from the source stop but the pollution gas needs to be able to leave the domain, the entire area of the inlet is set to ( 100 % ) air, but at the outlet 90% of air and 10% of CO are assumed. Finally, in reversed flow simulations, the computational domain is translated by 600 m to the north relative to the architectural complex, the direction of the flow is reversed, and the inlet is located on the southern face of the domain with the outlet placed on its northern face.
The solutions are obtained on polyhedral meshes, with prismatic layers used near buildings and the ground, where the smallest prismatic mesh resolution is on average equal to 0.2 m. The mesh becomes gradually coarser towards the outer boundaries. Depending on the building configuration and flow scenario, the total number of nodes in computational meshes ranges between 7.6 and 9.1 million nodes. For illustration, Figure 2 shows details of the polygonal surface mesh on the building walls.
Finally, Figure A3 provides the location of three probes used to monitor the history of the CO mass fraction displayed in Figure A3 during the forward flow simulations described in Section 3.1 and Section 3.2. All probes are placed at a height of 0.5 m from the ground.
Figure A3. Location of the CO mass fraction probes (marked by red dots); P1 (top), P2 (centre), P3 (bottom).
Sustainability 17 07348 g0a3

References

  1. Salvia, G.; Pluchinotta, I.; Tsoulou, I.; Moore, G.; Zimmermann, N. Understanding Urban Green Space Usage through Systems Thinking: A Case Study in Thamesmead, London. Sustainability 2022, 14, 2575. [Google Scholar] [CrossRef] [PubMed]
  2. Michalcová, V.; Kotrasová, K. The Numerical Diffusion Effect on the CFD Simulation Accuracy of Velocity and Temperature Field for the Application of Sustainable Architecture Methodology. Sustainability 2020, 12, 10173. [Google Scholar] [CrossRef]
  3. Cui, P.; Dai, C.; Zhang, J.; Li, T. Assessing the Effects of Urban Morphology Parameters on PM2.5 Distribution in Northeast China Based on Gradient Boosted Regression Trees Method. Sustainability 2022, 14, 2618. [Google Scholar] [CrossRef]
  4. Qu, Y.; Milliez, M.; Musson-Genon, L.; Carissimo, B. Modelling Radiative and Convective Thermal Exchanges over a European City Center and Their Effects on Atmospheric Dispersion. Sustainability 2022, 14, 7295. [Google Scholar] [CrossRef]
  5. Szmelter, A. Poczatki urbanistyki wspolczesnej. In Doswiadczenia Zagraniczne a Srodowisko Warszawskich Urbanistow Przelomu XIX i XX w; Oficyna Wydawnicza Politechniki Warszawskiej: Warszawskiej, Poland, 2019; ISBN 9788378149187. [Google Scholar]
  6. Szmelter, A.; Zdunek-Wielgołaska, J. Pre-war Inspirations in Shaping Green Spaces in Post-war Warsaw. In Proceedings of the IOP Conference Series: Materials Science and Engineering, 5th World Multidisciplinary Civil Engineering-Architecture-Urban Planning Symposium—WMCAUS, Prague, Czech Republic, 15–19 June 2020; Volume 960, p. 042003. [Google Scholar] [CrossRef]
  7. Belcher, S.E.; Coceal, O.; Hunt, J.C.R.; Carruthers, D.J.; Robins, A.G. A review of urban dispersion modelling, Version 2. Technical Report Prepared for the ADMLC. 5 December 2012. Available online: https://core.ac.uk/download/pdf/42150177.pdf (accessed on 1 May 2025).
  8. Pantusheva, M.; Mitkov, R.; Hristov, P.O.; Petrova-Antonova, D. Air Pollution Dispersion Modelling in Urban Environment Using CFD: A Systematic Review. Atmosphere 2022, 13, 1640. [Google Scholar] [CrossRef]
  9. Li, Z.; Ming, T.; Liu, S.; Peng, C.; de Richter, R.; Li, W.; Zhang, H.; Wen, C.Y. Review on pollutant dispersion in urban areas-part A: Effects of mechanical factors and urban morphology. Build. Environ. 2021, 190, 107534. [Google Scholar] [CrossRef]
  10. Xing, Y.; Brimblecombe, P. Traffic-derived noise, air pollution and urban park design. J. Urban Des. 2020, 25, 590–606. [Google Scholar] [CrossRef]
  11. Liu, S.; Pan, W.; Zhang, H.; Cheng, X.; Long, Z.; Chen, Q. CFD simulations of wind distribution in an urban community with a full-scale geometrical model. Build. Environ. 2017, 117, 11–23. [Google Scholar] [CrossRef]
  12. Korycki, M.; Łobocki, L.; Wyszogrodzki, A.A. Numerical simulation of stratified flow around a tall building of a complex shape. Environ. Fluid Mech. 2016, 16, 1143–1171. [Google Scholar] [CrossRef]
  13. Zhang, H.; Gong1, S.; Zhang, L.; He1, J.; Wang, Y.; Shi, L.; Mo, J.; Ke, H.; Lu, S. Development and application of a street-level meteorology and pollutant tracking system (S-TRACK). Chem. Atmos. Phys. 2022, 22, 2221–2236. [Google Scholar] [CrossRef]
  14. Sanchez, B.; Santiago, J.; Martilli, A.; Palacios, M.; Kirchner, F. CFD modeling of reactive pollutant dispersion in simplified urban configurations with different chemical mechanisms. Atmos. Chem. Phys. 2016, 16, 12143–12157. [Google Scholar] [CrossRef]
  15. Warszawa, Architektura, Planowanie Przestrzenne, Geodezja i Zabytki, No Date. Available online: https://architektura.um.warszawa.pl (accessed on 1 May 2025).
  16. Smolarkiewicz, P.K.; Sharman, R.; Weil, J.; Perry, S.G.; Heist, D.; Bowker, G. Building resolving large-eddy simulations and comparison with wind tunnel experiments. J. Comput. Phys. 2007, 227, 633–653. [Google Scholar] [CrossRef]
  17. Wyszogrodzki, A.A.; Miao, S.; Chen, F. Evaluation of the coupling between mesoscale-WRF and LES-EULAG models for simulating fine-scale urban dispersion. Atmos. Res. 2012, 118, 324–345. [Google Scholar] [CrossRef]
  18. Xiong, M.; Chen, B.; Zhang, H.; Yao, Q. Study on Accuracy of CFD Simulations of Wind Environment around High-Rise Buildings: A Comparative Study of k-ϵ Turbulence Models Based on Polyhedral Meshes and Wind Tunnel Experiments. Appl. Sci. 2022, 12, 7105. [Google Scholar] [CrossRef]
  19. Martinuzzi, R.; Tropea, C. The Flow Around Surface-Mounted, Prismatic Obstacles Placed in a Fully Developed Channel Flow (Data Bank Contribution). J. Fluids Eng. 1993, 115, 5–92. [Google Scholar] [CrossRef]
  20. Lee, K.K.; Spath, N.; Miller, M.R.; Mills, N.L.; Shah, A.S.V. Short-term exposure to carbon monoxide and myocardial infarction: A systematic review and meta-analysis. Environ. Int. 2020, 143, 105901. [Google Scholar] [CrossRef]
  21. US EPA, Basic Information About Carbon Monoxide (CO) Outdoor Air Pollution. Available online: https://www.epa.gov/co-pollution/basic-information-about-carbon-monoxide-co-outdoor-air-pollution (accessed on 1 May 2025).
  22. Rodi, W. Comparison of LES and RANS calculations of the flow around bluff bodies. J. Wind. Eng. Ind. Aerodyn. 1997, 69–71, 55–75. [Google Scholar] [CrossRef]
  23. Wang, Y.; Zhong, K.; He, J.; Xu, J.; Kang, Y. Impacts of wind flow across street-side building gaps on traffic pollutant dispersion at pedestrian level with different block heights. Build. Environ. 2023, 246, 110972. [Google Scholar] [CrossRef]
  24. Soulhac, L.; Garbero, V.; Salizzoni, P.; Mejean, P.; Perkins, R.J. Flow and Dispersion in Street Intersections. Atmos. Environ. 2009, 43, 2981–2996. [Google Scholar] [CrossRef]
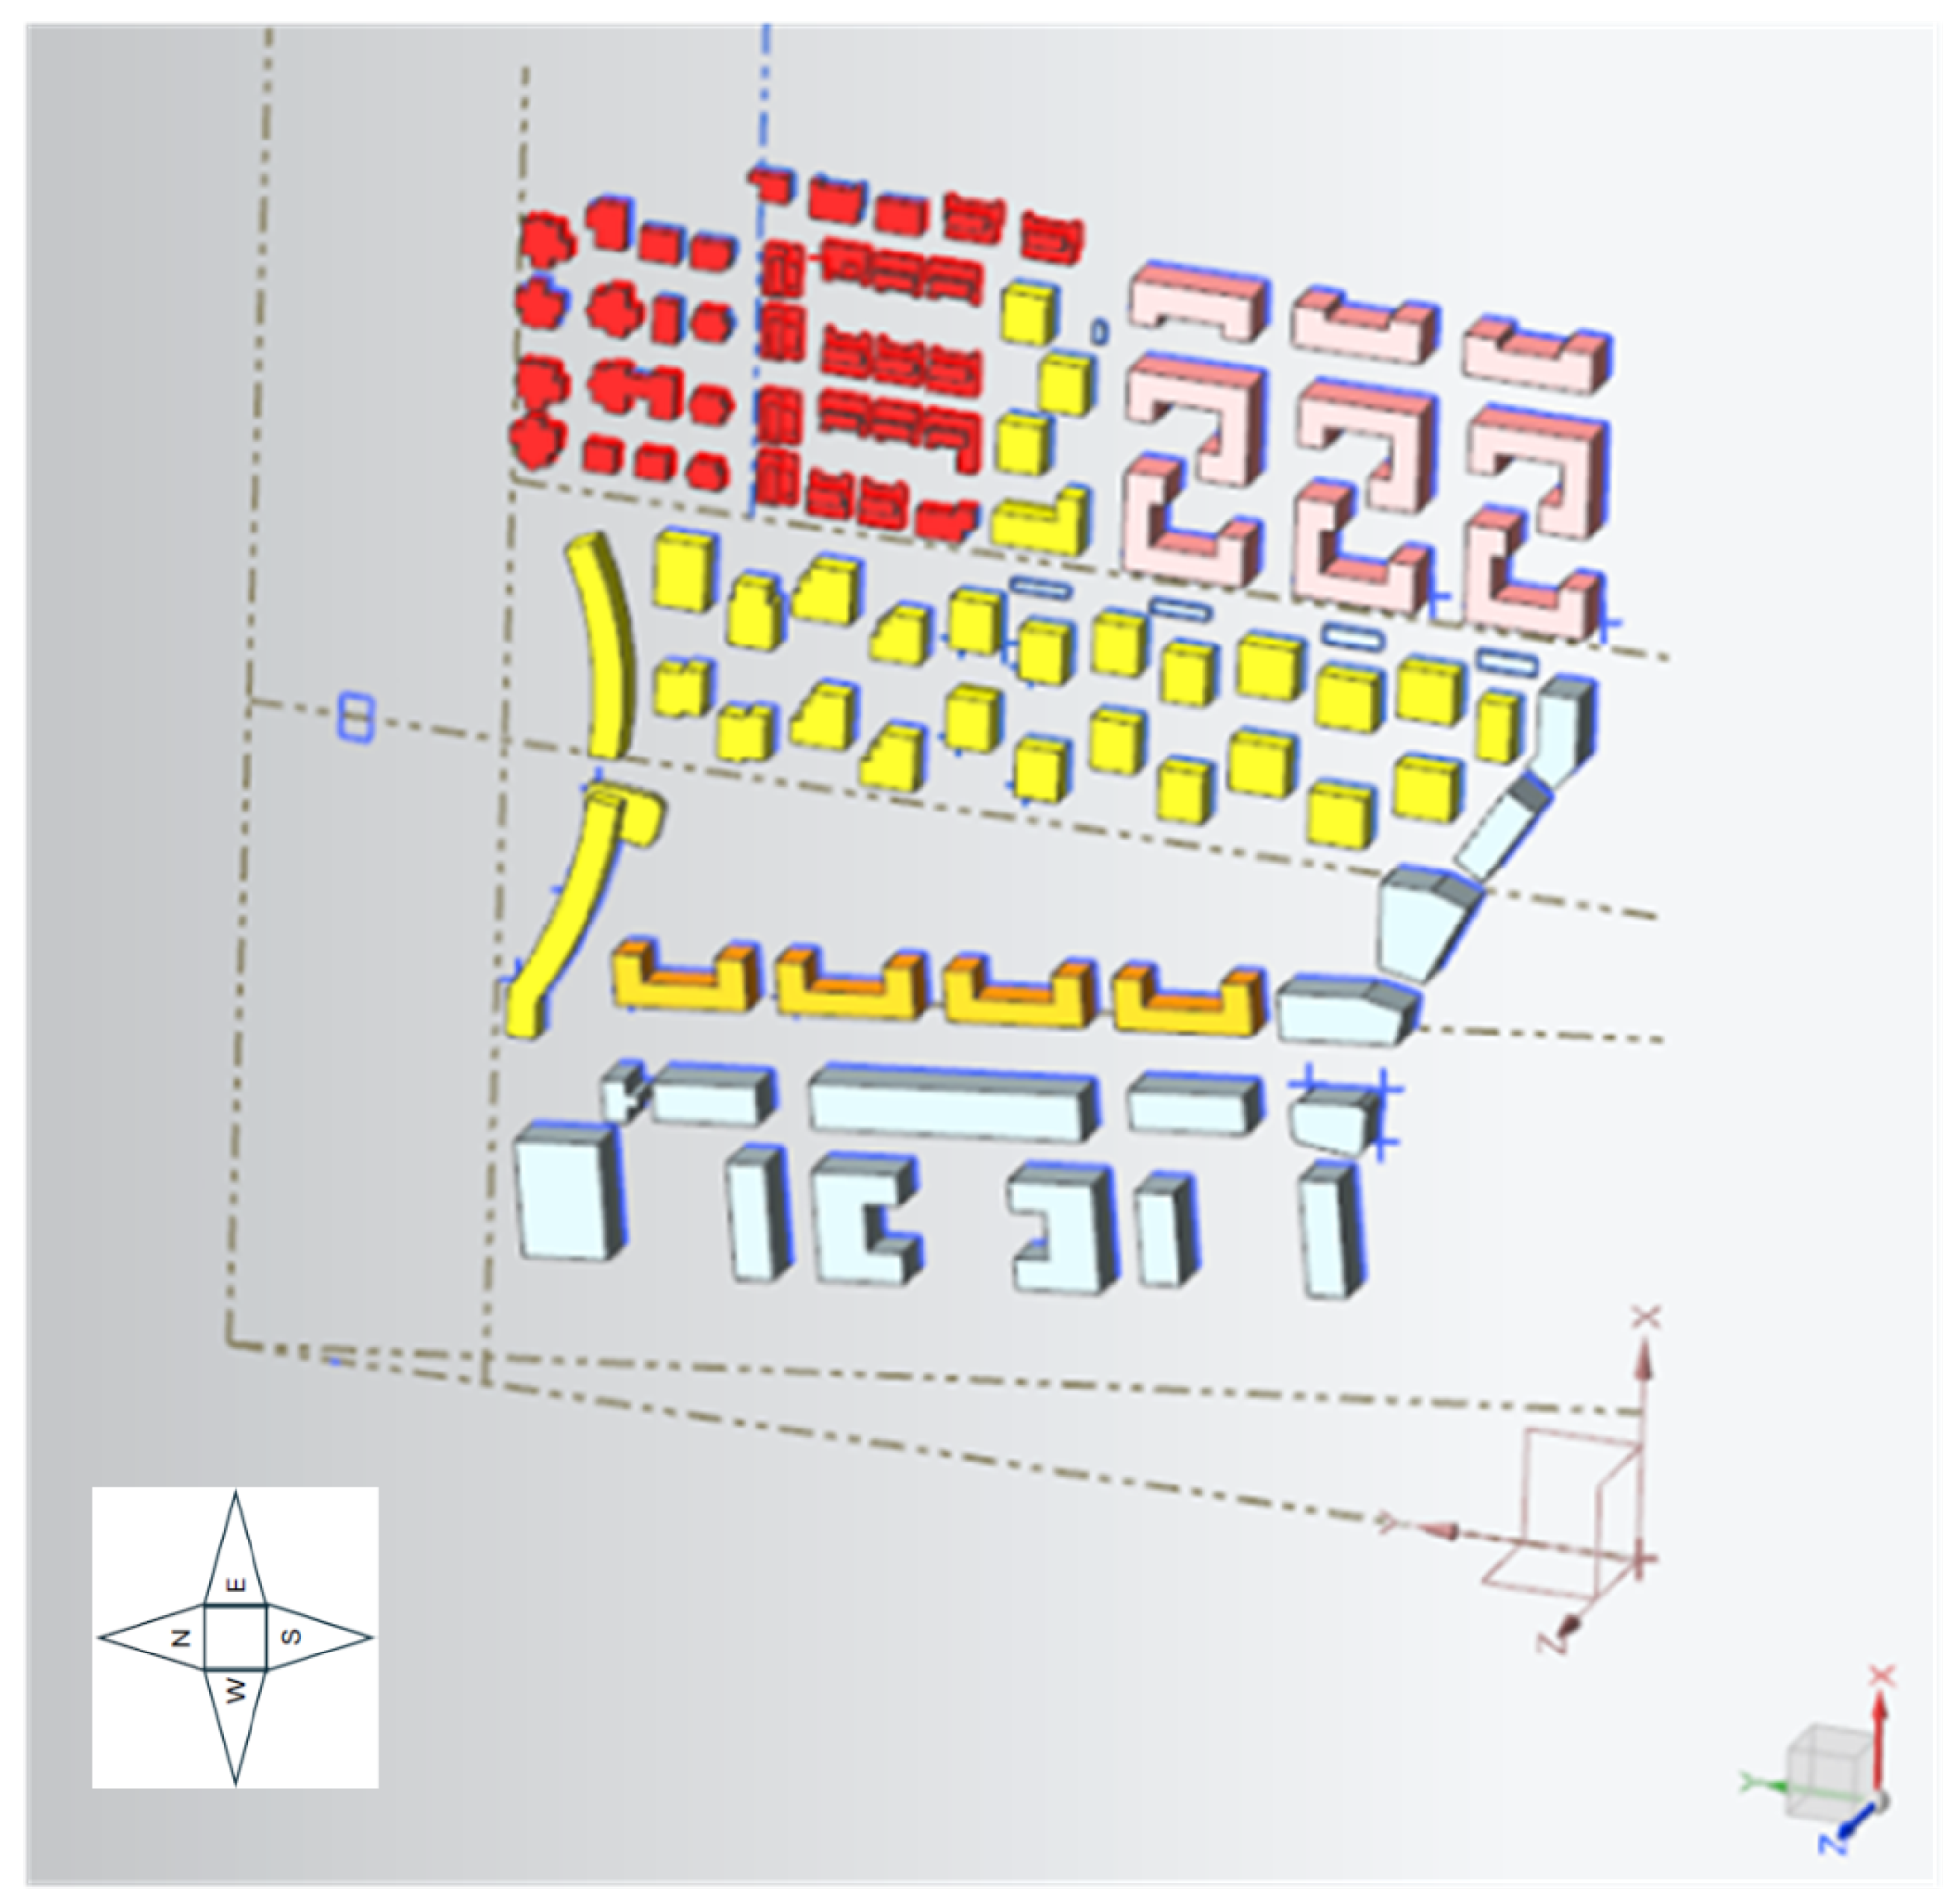
Figure 1. CAD geometry model; tilted view of the landscape existing in 2017.
Sustainability 17 07348 g001
Figure 2. A fragment of a representative surface mesh shown on the building walls.
Sustainability 17 07348 g002
Figure 3. CO mass fraction evolution for a 2 m/s ambient wind, displayed on the horizontal plane placed at 5 m above the ground. Layouts: 2006 (left), 2017 (right).
Sustainability 17 07348 g003
Figure 4. Line integral convolution of vector velocity. Enlarged view of the central part of the 2017 layout for 2 m/s ambient wind at the horizontal plane, positioned 5 m above the ground.
Sustainability 17 07348 g004
Figure 5. CO mass fraction evolution after 400 s for a 10 m/s ambient wind, displayed on the horizontal plane placed at 5 m above the ground. Layouts: 2006 (left), 2017 (right); (color scale as in Figure 3).
Sustainability 17 07348 g005
Figure 6. Mass fraction of CO, displayed in a vertical plane, for the ambient wind of 2 m/s after 2000 s (top) and 10 m/s after 400 s (bottom); the 2006 and 2017 landscapes are shown on the left and right, respectively; (color scale as in Figure 3).
Sustainability 17 07348 g006
Figure 7. CO mass fraction evolution, after the pollution source was replaced by pure air, for a 2 m/s ambient wind on the horizontal plane placed at 5 m above the ground. Layouts: 2006 (left), 2017 (right); (color scale as in Figure 3).
Sustainability 17 07348 g007
Figure 8. CO mass fraction history monitored in three probes.
Sustainability 17 07348 g008
Figure 9. CO mass fraction evolution displayed on the horizontal plane placed at 5 m above the ground, after the pollution source was removed and the ambient flow was reversed (speed = −2 m/s) Layouts: 2006 (left), 2017 (right); (color scale as in Figure 3).
Sustainability 17 07348 g009
Figure 10. CO mass fraction evolution displayed on the horizontal plane placed at 5 m above the ground, the pollution source is removed, and the ambient flow is reversed reaching −10 m/s at the southern inlet; (color scale as in Figure 3).
Sustainability 17 07348 g010
Disclaimer/Publisher’s Note: The statements, opinions and data contained in all publications are solely those of the individual author(s) and contributor(s) and not of MDPI and/or the editor(s). MDPI and/or the editor(s) disclaim responsibility for any injury to people or property resulting from any ideas, methods, instructions or products referred to in the content.