Article

Socio-Economic Benefits of Different Indonesian Crops: Opportunities for Sago Starch in Bioplastic Development

Earth Systems and Global Change Group, Wageningen University & Research, 6700 AA Wageningen, The Netherlands
*
Authors to whom correspondence should be addressed.
Sustainability 2025, 17(16), 7351; https://doi.org/10.3390/su17167351
Submission received: 9 July 2025 / Revised: 7 August 2025 / Accepted: 10 August 2025 / Published: 14 August 2025
(This article belongs to the Section Resources and Sustainable Utilization)

Abstract

The growing global demand for bioplastics highlights the need for sustainable starch sources, and Indonesia has considerable potential for cultivating such feedstock. While cassava has been widely promoted, there is limited scientific justification for prioritizing it over alternatives such as sago. An important distinction is that cassava is grown on mineral soils, where many alternative crops are viable, whereas sago is cultivated on peatlands, where relatively few crops can be grown sustainably. This study compares the socio-economic benefits of cassava and sago, considering their competitiveness against their main competing crops (i.e., corn on mineral soils and oil palm on peatlands). For new plantations, sago generated lower farm-level benefits than cassava, with net present values of 1534 EUR/ha and 5719 EUR/ha, respectively. However, when integrating starch processing and environmental impacts, sago provided greater benefits than cassava (4166 EUR/ha vs. 3555 EUR/ha). In the long term, sago may become more profitable than cassava due to its low maintenance and lack of replanting needs. Additionally, sago offers broader societal and environmental advantages, as it thrives on undrained peatlands, for which few alternatives exist. This study concludes that sago, as a paludiculture crop, is a sustainable option for bioplastic feedstock and can support peatland restoration.

Graphical Abstract

1. Introduction

Bioplastics, referring specifically to biobased biodegradable plastics in this study, among various definitions [1], have been established as an alternative to fossil-based conventional plastics. Produced from renewable organic materials, these plastics decrease the dependency on fossil fuels and mitigate global waste problems. Additionally, transitioning from fossil-based to biobased materials promotes diversified sources of energy and raw materials, reduces greenhouse gas emissions, and creates opportunities for rural and regional development [2]. Bioplastics can be made from various natural organic materials, such as polysaccharides (starch, chitin, lignin, and cellulose), proteins (gelatine, casein, and gluten), and lipids (plant oils and animal fats) [3]. Among these organic materials, starch has gained popularity as a source of biobased materials due to the abundant opportunities to produce starch with a range of high-yielding crops and because it is the most economically affordable material to produce with current technology [1].
Indonesia is one of the largest countries experiencing both high plastic demand and plastic waste problems [4,5]. The rising demand for plastics is currently fulfilled with conventional plastics, which are still dependent on imported raw materials [6]. Moreover, these plastics mostly accumulate in rivers, coastal areas, and open seas. Transitioning to bioplastics is crucial as they enable end-of-life management options (such as biodegradation) that are not possible with conventional plastics, offering a promising pathway to mitigating the plastic pollution crisis and better plastic waste management [7]. Currently, bioplastic products that are widely available in the Indonesian market are those made from cassava starch [8]. On the other hand, there is a high demand for cassava as a food staple, and local production has not been able to meet the demand. Between 2014 and 2023, Indonesia imported an average of 257,483 t of cassava starch net per year [9]. The increase in the population’s demand for starch as food leads to competition between food and biomaterials [1]. Moreover, the production costs of bioplastics make the transition even more challenging. The production costs of bioplastics can be up to 50% higher than those of fossil-based plastics, with retail prices reaching up to three times higher [10,11]. Therefore, it is essential to better understand the costs and benefits of diverse starch sources.
Previous research has indicated several types of starch as bioplastic materials, such as potato, rice, and corn [1]. However, these starches are also not sufficiently supplied domestically. One of the potential alternatives to starch sources in Indonesia which is still underutilized is sago. The starch potential yield of sago is 25–40 t/ha/year, nearly 10 times higher than the cassava starch yield [12]. Additionally, the local demand for sago remains low, and Indonesia has been a long-standing sago net exporter [9,13]. Sago also faces less competition as a food source compared with cassava. In some parts of Indonesia, people who have traditionally consumed sago have switched to rice as their primary food source [14,15]. In terms of technical properties, sago starch plastics can substitute for conventional plastic functions [16,17,18]. Bioplastics’ properties can be adjusted by adding additives such as plasticizers or modifiers, which are comparable to cassava starch or other starch plastics [19,20].
Furthermore, sago is widely recognized as beneficial to peatland restoration. Indonesia has over 13 million hectares of peat [21], and most of these are currently not sustainably used. Indonesia’s peat fires and peat oxidation are one of the major sources of greenhouse gas emissions globally [22,23,24]. Sago is an ideal paludiculture plant that grows well in undrained peatlands and remains productive even in rewetted degraded peatlands [25,26]. It offers an alternative to current plantation crops that require drainage, such as oil palm, which leads to significant CO2 emissions through peat oxidation and increases the risk of peat fires. Optimizing sago as a raw material for bioplastic production can reduce reliance on fossil fuels and help restore peatlands, avoiding peatland degradation and improving the economic benefits for local communities [25].
Given the potential for sago starch to complement or replace cassava starch as the primary feedstock for bioplastics, it is important to compare the socio-economic benefits of cassava and sago farming. Although some studies have explored the economic benefits and challenges of sago farming in Indonesia [13,27,28], these studies focused solely on comparing sago with other crops in peatlands, rather than with other comparable starch-producing crops.
The objective of this study is to analyze the costs and benefits of sago and cassava production, both for farmers and for society at large. Considering two different agroecosystem conditions in the areas used for growing cassava and sago, this study also assesses the opportunity costs incurred by farmers and society in growing sago compared with oil palm on peatlands and cassava compared with corn on mineral soils. Hence, our research questions are (1) “What is, at the farm level, the profitability of growing sago, oil palm, cassava, and corn?”; (2) “What are the societal benefits of growing these products?”; and (3) “How do the benefits of different crops compare in different crop management scenarios?”
The novelty of this study lies in its integrated approach to analyzing the sustainability of agricultural practices across different agrosystems by examining their financial and socio-economic benefits. It is important for sustainability, given the magnitude of the challenges faced by Indonesia. In principle, growing sago on Indonesian peatlands would address these two issues simultaneously while also providing local employment and economic development opportunities based on a novel application of a species endemic to Indonesia. Understanding the benefits of sago versus its currently promoted alternative, i.e., cassava, is therefore critically important to inform the sustainability debate in Indonesia.

2. Materials and Methods

2.1. Study Areas

This study was conducted in three locations to examine the characteristics of smallholder cassava and corn farming on mineral soils, as well as sago and oil palm farming on peat soils. In addition to crop production, data on processing costs and revenues for cassava and sago starch were also collected. The study areas were selected based on their relevance to specific crop types and geographic characteristics. For cassava and corn, data collection was carried out on smallholder farms in Bogor Regency, West Java. Bogor was selected because of its proximity to bioplastic manufacturers; it is also the fifth largest producer of cassava in West Java Province [29]. Farmers in this region also cultivate corn, which competes with cassava as a source of income. Meranti Islands Regency was selected for sago production as it is the largest sago producer in Indonesia. While sago cultivation has been known since the 19th century, large commercial sago plantations were not established here until 1996 [30,31]. As oil palm cultivation was not present in Meranti Islands Regency, data on independent smallholder oil palm producers were collected from Siak Regency, which is geographically adjacent to Meranti Islands Regency and contains peat soils.
Figure 1 shows the study sites. It also highlights the contrasting production environments and processing methods. Cassava was grown on mineral soil. After harvesting, the roots were peeled on the farm and transported to nearby small-scale starch mills. Starch was extracted using traditional techniques, including washing, rasping, soaking, and sun-drying, to produce dry starch. These methods are commonly used in smallholder cassava processing, though soaking time and drying duration may vary depending on local weather conditions. In contrast, sago was cultivated on undrained peat soils without the use of fertilizers. Once mature, the trunks were harvested and cut into 42-inch logs, based on standard local milling dimensions. These logs were tied into rafts and floated downstream via canals to nearby sago mills. At the mills, the logs were debarked, and the pith was rasped. The resulting pith was soaked in a circular chamber to separate the starch, which settled in ponds. The starch was sold in wet form.

2.2. Data Collection

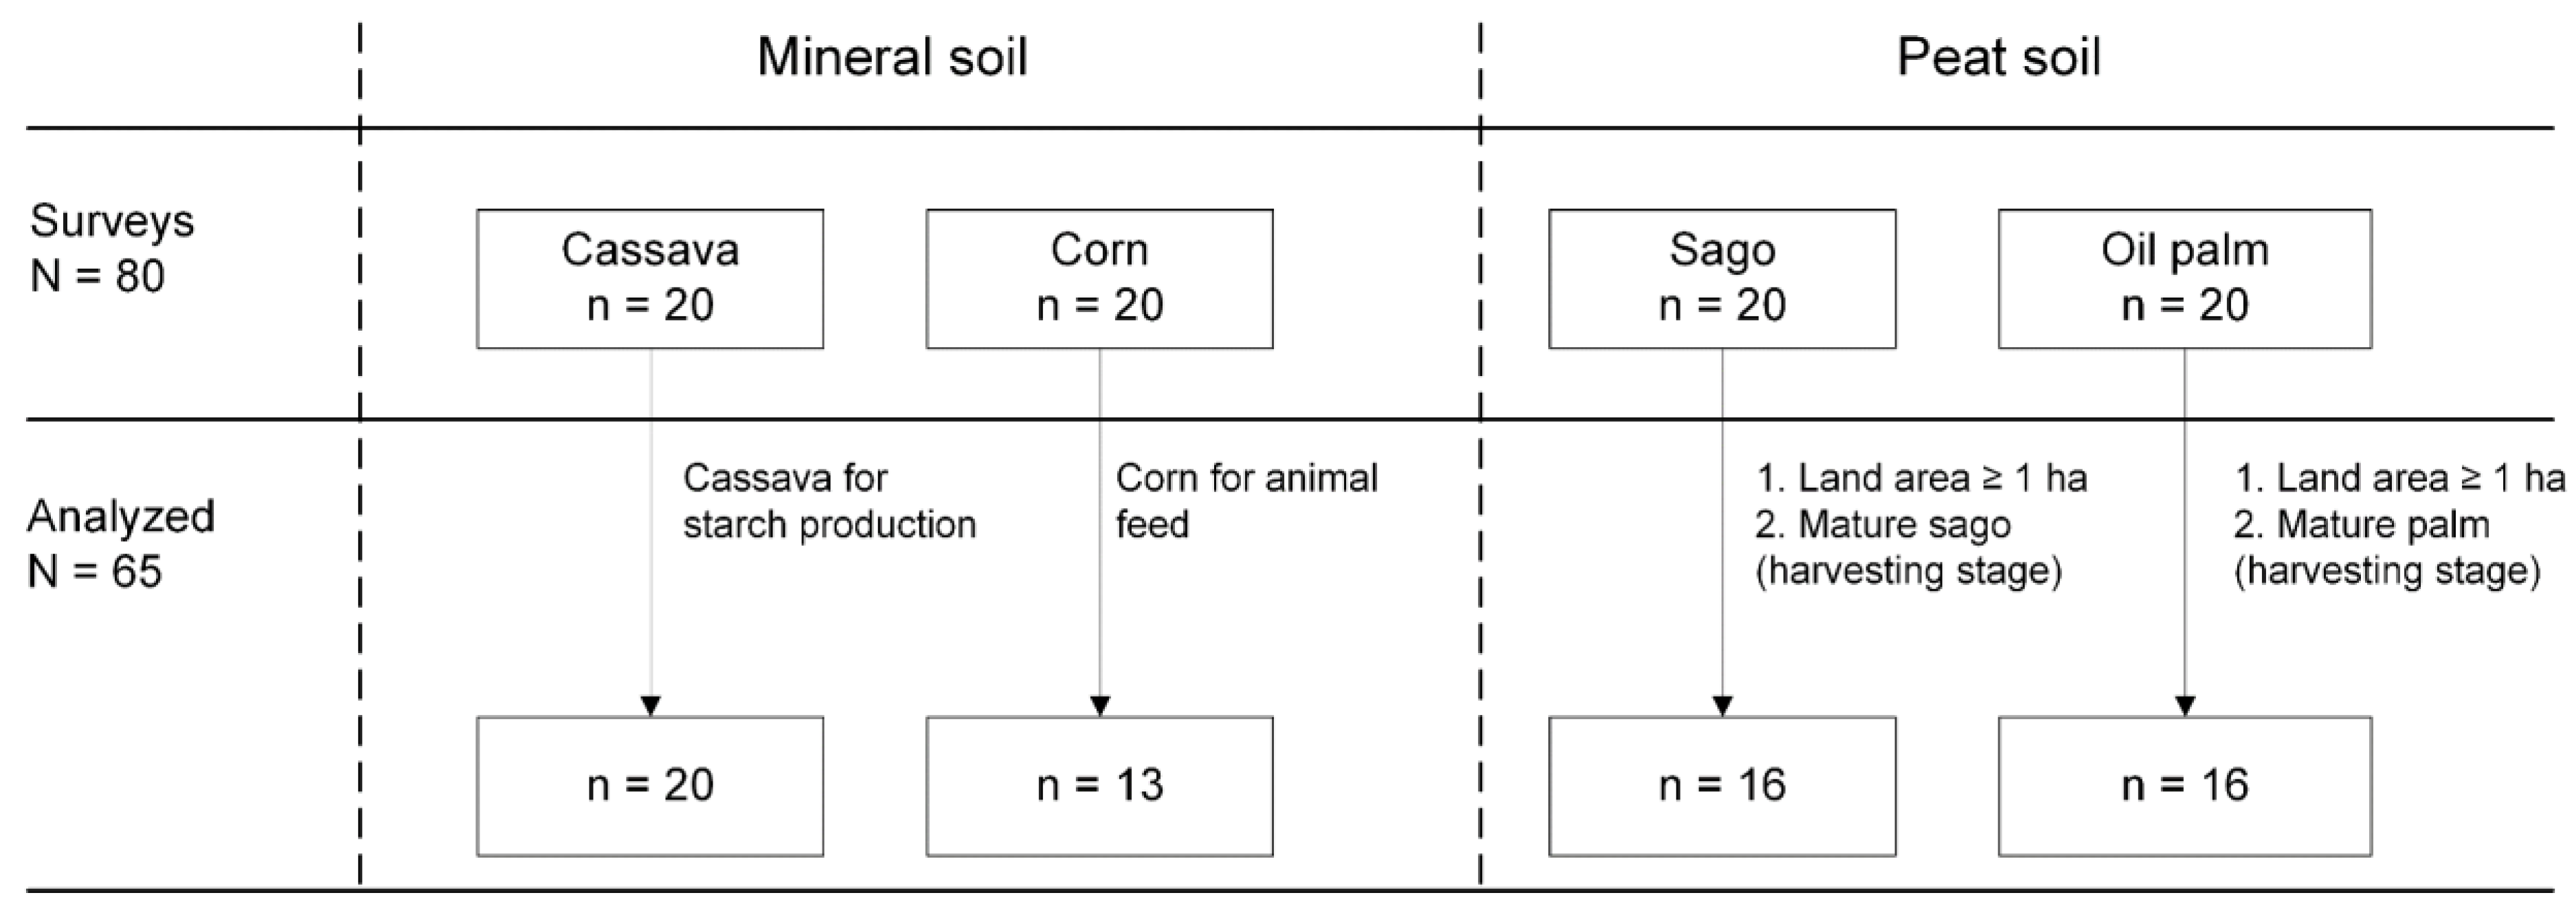
Primary data were collected through surveys conducted with 80 smallholder farmers (20 cassava farmers, 20 corn farmers, 20 sago farmers, and 20 oil palm farmers) from September to November 2023. The information elicited from the farmers included all costs incurred and revenues earned under their production systems. The farmers were selected randomly with the help of farmer group leaders or local village officials as key informants. Surveys were conducted individually or in groups, based on the respondents’ preferences, and all respondents were asked to provide informed consent before participating. Additionally, relevant information was obtained from scientific publications, statistical reports, policy documents, and government reports. Specific to each crop, we only included cassava farmers who grew cassava for starch production, corn farmers who consistently cultivated corn for feed, and sago and oil palm farmers with mature plants in a minimum of 1 ha of land plots. These criteria resulted in 65 total respondents (Figure 2).
We collected primary data on the production processes of two small-scale cassava mills in Bogor and two small-scale sago mills in the Meranti Islands. Initial capital costs were estimated by the mill owners based on the current price levels for building similar facilities. Operational and maintenance costs were based on the owners’ own estimates and were converted to annual figures. As the exact raw material input and starch output were generally not recorded by the mill owners, we observed seven production cycles to compare the owners’ estimates with the actual extraction rates of their facilities. We used the observed starch extraction rates for our calculation. However, we used the mill owners’ estimates of the mill’s annual capacity due to irregular daily inputs and the absence of long-term production records. For sago mill rental costs, we inquired about the specific charges that farmers must pay when renting the mills.

2.3. Analysis Framework

All benefit comparisons in our study were performed by comparing the net present values (NPVs) of the respective crops and processes. We calculated the NPVs on a per ha basis using the following equation:
N P V = t = 0 T R t 1 + r t
where Rt is the net revenue in year t, r is the discount rate (%), and T is the project time period calculated (i.e., 25 years).
A 25-year period was selected as it aligns with the typical life cycle of the oil palm. Monetary values were converted using the average IDR to EUR exchange rate in 2023 (EUR 1 equivalent to IDR 16,479.62).
The private discount rate was used for the financial analysis of the benefits for farmers and companies, while the social discount rate was used to analyze the societal benefits that would impact society as a whole (i.e., the impact of greenhouse gas (GHG) emissions). The discount rates used are explained in the following subsections.

2.4. Analysis of Benefits Received by Farmers at the Farm Level

Net revenues were calculated using weighted average inputs and outputs per ha per year. The farm-level NPV was calculated using actual costs and revenues based on fieldwork data, including subsidies received by farmers, which are referred to as baseline benefits throughout our study. A discount rate of 15% was applied, based on the assumption that smallholder farmers usually have less access to bank loans and face high interest rates on loans.
Investment associated with land costs and taxes was excluded since most farmers did not own the land, in line with our objective to understand the costs and benefits of different land uses. However, land rental costs were included, as these were one of the key factors influencing farmers’ decisions to rent or not rent a given parcel. For farmers working on their farms, an opportunity cost was added to labor costs to account for self-employed labor. The opportunity cost was estimated by multiplying the number of person-days provided by the farmers by the average daily wage they typically paid to hired workers on their own farms. In cases where female workers were employed, their quantity and wages were equalized to those of male workers, with two females equal to one male, as this is the general norm.
All crop yields were converted into units of kg, except for sago, which was measured in the number of sago trunks. Specifically, the units were converted into kg of peeled cassava, kg of corn grains, number of sago trunks, and kg of oil palm fresh fruit bunches (FFBs). Corn grains were assumed to have a 14% moisture content, using a 55.94% conversion rate from corn on the cob [32], and eight sago log cuts were considered equivalent to one trunk of sago [26].
For cassava and corn production, all inputs, prices, and productivity levels were assumed to remain constant over the 25-year period. In sago and oil palm farming, yields varied based on the plant’s age. However, since we did not have complete life cycle data for these crops, certain assumptions were made. Sago was assumed to be first harvested 8 years after planting (YAPs) [33], with yields remaining constant in subsequent years. For oil palm, a yield normalization factor [34] was applied, as detailed in Tables S1 and S2 of the Supplementary Materials.
In our analysis, both tool and land preparation (or land clearing) costs were considered as upfront investments, with expenses being spread evenly over the period they provided agronomic benefits. Tool purchases were depreciated on a straight-line basis over each tool’s useful life, and land preparation was amortized to match each crop’s cycle (annually for cassava and corn, 25 years for oil palm, and 100 years for sago). We applied the same principle to seedling and planting costs for sago and oil palm, recognizing these expenses only in year 1 but spreading them over the stand’s useful life. All other operating costs, such as labor, maintenance, and inputs, remained constant each year, except for harvesting expenses, which were incurred only during harvest years.
We also compared the benefits of all crops in the absence of subsidies to explore the impact of subsidies by using market prices. Corn farmers received subsidies for seeds, fertilizers, pesticides, and government-provided machinery, including tractors and post-harvesting equipment. When no machinery was given to the corn farmers, it was assumed that the farmers incurred costs for renting the machinery. In cases where cassava farmers were officially ineligible for subsidized fertilizers, they reportedly benefited from subsidized fertilizers by using fertilizers subsidized for other crops, albeit at higher prices than the official subsidized rate, but still lower than the prices of non-subsidized fertilizers. In contrast, sago and oil palm farmers did not receive any subsidies.

2.5. Analysis of the Social Cost of Carbon Dioxide (SC-CO2)

We focused our analysis on the SC-CO2 resulting from crop cultivation. We calculated GHG emissions based on direct and indirect emissions in the form of nitrous oxide (N2O) and carbon dioxide (CO2) from synthetic fertilizer and manure inputs using the Tier 1 2019 refinement to the IPCC 2006 emission factors [35]. Specifically for manure use, the marketed manure was generally a mixture of fresh poultry (chicken) manure and rice husk. We assumed a 1:1 volume ratio of manure to rice husk, with nitrogen (N) content based on [36]. For peatland crops (sago and oil palm), we also considered CO2 emitted from peat oxidation as a result of peat drainage [37]. The Indonesian government regulation requires plantations on peatlands to maintain a water level not lower than 40 cm below the peat surface, so we used this assumption in our calculation. All GHG emissions were converted into global warming potential (GWP) relative to CO2 (CO2eq) over a 100-year horizon [38]. Table S3 in the Supplementary Materials provides the variables used in the SC-CO2 analysis.
CO2 emissions were then valued using the US EPA SC-CO2 2025 at 43 EUR/tCO2eq. We applied a social discount rate of 3% for a 25-year period, which is in line with the discount rate used for the US EPA SC-CO2 estimation.
We did not have data to analyze two associated risks of peatland drainage, i.e., soil subsidence and fires. These aspects are discussed in qualitative terms in the Section 4.

2.6. Value Added and Net Societal Benefit

In assessing the value added, we calculated the benefits of further processing yields up until the furthest reachable market in the study areas, still in their primary products, which included processing cassava roots into cassava starch, sago logs into wet sago starch, and oil palm FFBs into crude palm oil (CPO). CPO production also generated palm kernels (PKs); thus, these outputs were also included in the value added to CPO production. Only corn grains were produced in their final product form and sold to the end users (poultry farms); thus, no further value added could be derived from this crop.
As this study focused on understanding how land management decisions lead to economic benefits across the agricultural value chain and how these benefits can be expressed on a per ha basis, we translated the benefits generated by the processing mill for each crop into the benefits per ha of cropland (NPVperHa). This was achieved by first calculating the mill’s NPV at full capacity over a 25-year period (NPVmill) and then converting this value to land productivity. To perform the conversion, we multiplied the NPVmill by the crop’s productivity (A) and divided it by the mill’s raw input per year (I), as shown in the following equation:
N P V p e r H a = N P V m i l l A I .
Fieldwork data provided the basis for most of the value-added calculations for all crops, except for FFB transport and CPO production data, which were sourced from the literature. FFB transport and ramp costs for the intermediary process were based on [39], with the nearest commercial CPO mill approximately 100 km away. All costs were converted to 2023 figures using the consumer price index (CPI). CPO price was based on the 2023 daily Malaysian Palm Oil Board (MPOB) average, and PK price was based on the average PK price in Riau Province. The discount rate applied was 6%, in line with the interest rate set by the Indonesian Central Bank in 2023. This discount rate was lower than typical farmer lending rates, as companies generally have greater access to capital.
The net societal benefit was calculated by combining farm-level benefits without subsidies with the value added of the yield process and subtracting the SC-CO2. Specifically for sago, the societal benefit only accounted for the benefit in the mill owner scenario.

2.7. Optimum Yield Scenarios of Sago and Oil Palm Farm-Level Benefits

Under ideal conditions, 278 clusters of sago palms per ha can yield 136 trunks annually [33]. Based on these ideal farming conditions, we developed three scenarios to analyze the benefits of improving the yield to the potential optimum level of sago cultivation compared with oil palm on peat soils.
The first scenario involved calculations with mature sago plants. The average age of the sago palms in our study was over 33 years. Sago palms are planted only once and can yield for an extended, nearly unlimited period. Given this characteristic, this scenario focuses on the benefits of mature sago plants under the existing conditions. This scenario is unique to sago, as oil palm does not share the same long-term productivity without replanting requirements.
The second scenario assessed new sago and oil palm production in optimal yield conditions. Two yield scenarios were tested for sago: achieving 50% of the optimum yield (O50 scenario, 68 trunks) through manual labor input based on [40] without fertilizers, and achieving 90% of the optimum yield (O90 scenario, 122 trunks) with fertilizer application based on Jong and Flach [41]. Fertilizers are best applied during the dry season when the water level is below the peat surface and with circular soil piles around sago clusters to prevent fertilizer washout.
Under optimal agronomic conditions, 150 oil palms can produce up to 25 t of FFBs per hectare annually on peatlands [42,43]. For oil palms, the baseline data show that the yield already exceeded 50% of the optimum potential yield; therefore, only the 90% yield scenario (O90) was analyzed for oil palm with fertilizer use based on Khasanah and van Noordwijk [44], RSPO [42], and Woittiez et al. [43], and with labor estimates based on Castellanos-Navarrete et al. [45]. Labor requirements for oil palm fertilization (two person days per ha per year) were also used as a proxy for sago fertilization labor.
Lastly, we assessed the benefits of improving the yield of existing mature sago plantations. We proportionally allocated the input costs of both old and new clusters to the O50 and O90 scenarios. As we found 154 clusters per ha in our study, 55% of the optimum scenario input costs were allocated to current mature plots, and 45% were allocated to newly planted sago. More details of the scenario are provided in Section S3 of the Supplementary Materials.

3. Results

3.1. Costs and Revenues at the Farm Level

We found that farmers using mineral soils generally earned higher annual returns compared with those using peat soils (Table 1); however, this was accompanied by greater annual expenditures. Cassava and corn cultivation involved notable costs linked to inputs and operations throughout the growing season. On peatlands, sago and oil palm farmers experienced high costs primarily during the initial planting phase, with lower costs thereafter. Harvesting costs for these peatland crops were only incurred once the maturation period began. Sago cultivation was characterized by particularly low maintenance costs, as it requires minimal inputs and no fertilizer or pesticide use. In addition to selling sago in its raw form, sago farmers could rent a sago mill and sell their yield in starch form. In this case, the sago mill rent was 16.08 EUR/t of starch produced, and farmers still needed to cover the operational costs (e.g., labor, fuel, etc.). The sago palms belonging to our respondents ranged in age from 11 to over 40 years, with an average yield of 36 trunks per year. The oil palms were generally younger—between 5 and just over 20 years—with an average yield of 14.9 tonnes of fresh fruit bunches (FFBs) per year. Detailed data on the inputs and yields are provided in Table S9 of the Supplementary Materials.
Corn farmers received direct government subsidies for seeds and pesticides, covering almost one-fifth of their annual costs. They were also the only farmers eligible for subsidized fertilizers (Table S10 of the Supplementary Materials), reducing an input cost that would otherwise account for roughly two-fifths of their overall expenditure. The subsidized fertilizers in 2024 were Urea and NPK fertilizers, while Profenofos was an insecticide provided by the local government for corn farmers in the study area. The subsidized fertilizers were intended for use in the cultivation of rice, corn, soybeans, chili, onions, garlic, sugarcane, cacao, and coffee. Cassava farmers were not officially entitled to subsidized fertilizers, but occasionally accessed supplies intended for other crops. Without access to these subsidized fertilizers, the fertilizer costs for cassava farmers would increase by more than 60%.
In addition, corn farmers benefited from government support for modern agricultural equipment, particularly machinery used for land preparation, such as tractors, hand-seeders, and corn strippers, provided through farmer groups. This support accounted for nearly 10% of their total costs. Without this support, they would have needed to rent similar machinery or hire additional labor for land preparation. All corn farmers were members of farmer groups, as subsidies were channeled exclusively through these groups, which required payment of a membership fee. This fee was generally used for tool maintenance, which meant that individual farmers did not bear the maintenance costs themselves.
We found substantial variations in revenue and costs, particularly for corn cultivation. Corn revenue mainly varied due to differences in productivity (yield). Membership costs also showed considerable variability, primarily because there was no minimum fee imposed by the farmers’ group; instead, farmers were required to pay a fee at harvest time based on their willingness and yield. Fertilizer costs varied significantly, as they depended on each farmer’s capital, which in turn affected yield. Additionally, there was considerable variation in harvesting, post-harvesting, and transport costs. Farmers who sold corn on the cob did not process it further and typically sold their yield on the farm, whereas those selling corn in grain form processed it by stripping, drying, and transporting the dry grain to buyers. These different practices contributed to high variability in associated costs.
In comparison, less variability was observed for cassava. However, fertilizer costs showed moderate variation due to differing farming practices. For peatland crops (i.e., sago and oil palm), only moderate variation was noted, primarily in harvesting costs for oil palm due to differences in timing and location. Costs increased when fewer harvesters were available and on farms located farther from main roads (a detailed figure on the revenue and costs is provided in Figure S1 of the Supplementary Materials).

3.2. Benefits Received by Farmers at the Farm Level

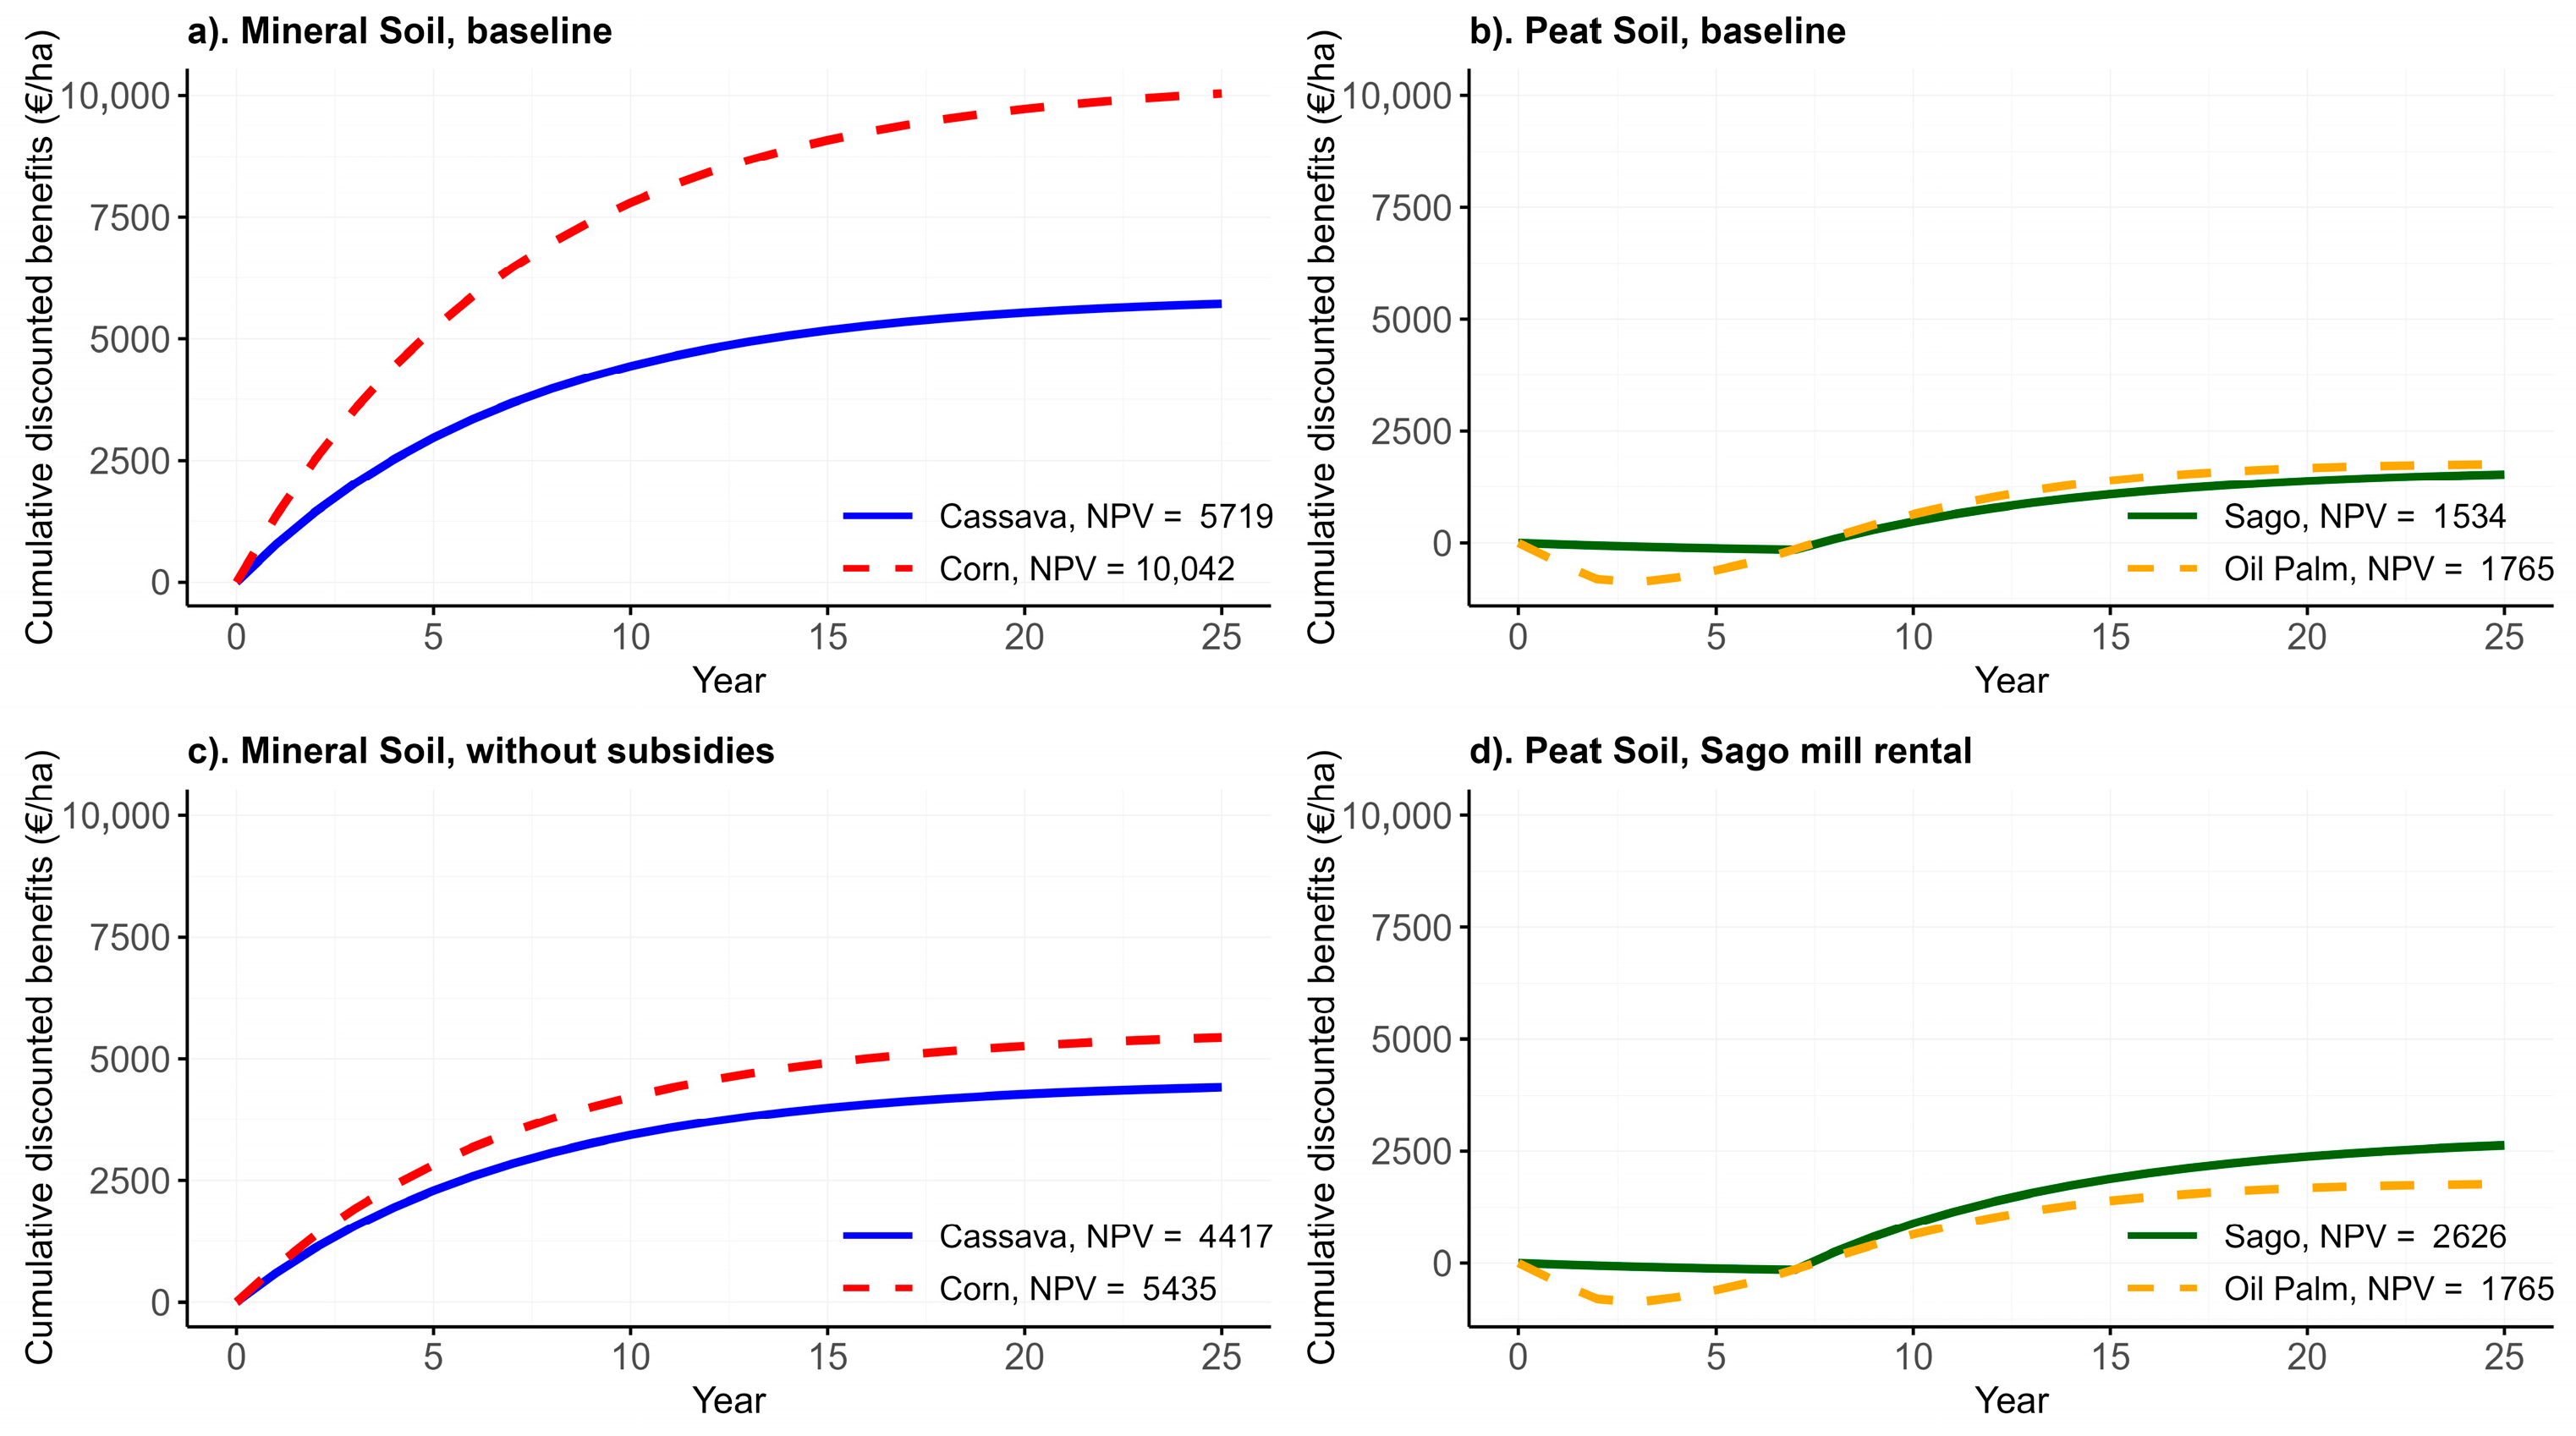
Based on the baseline net present value (NPV), mineral soil crops generated much higher benefits than peatland crops (sago and oil palm) over the 25-year planting period. As annual crops, corn and cassava had a positive cumulative discounted benefit from the beginning, while sago and oil palm required 9 and 12 years before turning positive, respectively (Figure 3). Corn was the most profitable crop overall, with an NPV nearly three times that of cassava and more than six times that of sago. Tables S11 and S12 in the Supplementary Materials provide details on the cash flows for all crops.
On peatlands, oil palm was slightly more profitable than sago. Despite sago’s minimal maintenance requirements, oil palm offered a shorter time to first harvest, requiring three years compared to eight years for sago. It also had a much more frequent harvesting cycle, with harvesting occurring every two weeks, while sago was harvested only once every one to two years. Several oil palm farmers in our study had previously cultivated sago but shifted to oil palm as declining yields made sago less viable. This decline was linked to peat drainage in surrounding areas for oil palm and acacia plantations, which dried their plots and reduced sago productivity. However, new oil palm farmers consistently favored oil palm over sago, primarily because of its earlier returns and more regular income from frequent harvests.
Figure 3 also illustrates that farm-level benefits for crops grown on mineral soils were heavily influenced by government subsidies. The most significant decline occurred in corn farming, where the NPV dropped by 46% when subsidies were excluded. This considerable difference shows that the high benefits of corn farming are highly dependent on subsidies. The exclusion of subsidies led to a 47% increase in total costs, primarily due to the need to purchase seeds and rent mechanized equipment, such as tractors, corn strippers, and electric sprayers, along with considerably higher fertilizer expenses. Cassava cultivation was only impacted by fertilizer subsidies. Even without access to subsidized fertilizers, cassava remained a more beneficial starch source than sago.
Comparing the starch crops, sago’s profitability was lower than cassava’s due to its lower productivity and long maturation period before the first harvest. Cassava provided a stable annual net benefit of 885 EUR/ha/year, while sago had a lower benefit of 732 EUR/ha/year, which did not start until year 8. Nevertheless, sago farmers could rent a sago mill and sell wet starch instead of sago logs. This mill rental scheme could increase the farmers’ NPV by 71%. However, the availability of rental sago mills was limited, as mill owners usually prioritized processing their own sago over renting out their facilities.

3.3. Social Cost of Carbon

Table 2 outlines the annual CO2 emissions and the social cost of carbon (SC-CO2) for each crop system. Sago cultivation was the only farming practice that did not emit CO2 emissions from external inputs (fertilizers). Sago with no fertilizer inputs and no drainage on the peatlands potentially creates a net-zero carbon balance. However, we used the IPCC [46] emission factor for sago plantation of 2.2 t CO2eq/ha/year (from CO2 and CH4) for moderate estimation. In contrast, oil palm cultivation on peatlands generated high CO2 emissions. Although emissions from fertilizer use were low, the emissions from peat oxidation were extremely high compared with other crops. These results show that peat drainage leads to notable carbon emissions, even under regulated water-level management.

3.4. Value Added Created and Net Societal Benefit

All outputs from the raw material processes in our value-added analysis (starch, corn grains, and CPO) were the final products, except for wet sago starch. Wet sago starch could be further processed into dry starch; however, the wet starch produced in our study area was sold to a large buyer who exported it to Malaysia. Due to limited information on the subsequent supply chain, we limited the value-added calculation for sago processing at this point. There used to be an option to produce dry starch after an integrated processing facility was built in the area, which could convert 1 kg of wet starch into 0.5 kg of dry starch (3.9 t/ha) with a 79.75% starch content and a 15.77% water content. However, the facility had ceased its operations by January 2024.
All costs and revenues in the product value chains per ha of crops are presented in Table 3. Processing of oil palm FFBs into CPO achieved the highest NPV of 16,078 EUR/ha, with 7632 EUR/ha accrued to the middle trader. The FFB value chain included FFB collectors locally known as “peron”, as independent smallholder oil palm farmers could not sell FFBs directly to oil palm mills [47]. Only delivery order (DO) holders, usually the perons, were allowed to supply FFBs to the mills. CPO production also generated palm kernels (PKs), which were sold separately, further contributing to the production revenue. In contrast, sago mills generated a lower NPV, with 4228 EUR/ha for the mill’s owner.
Meanwhile, cassava starch milling provided the lowest value added, with an NPV of only 794 EUR/ha. Due to high production costs, where approximately 98% of the revenue was spent on milling expenses, the low profitability of cassava starch production made small-scale cassava mills particularly vulnerable to market fluctuations.
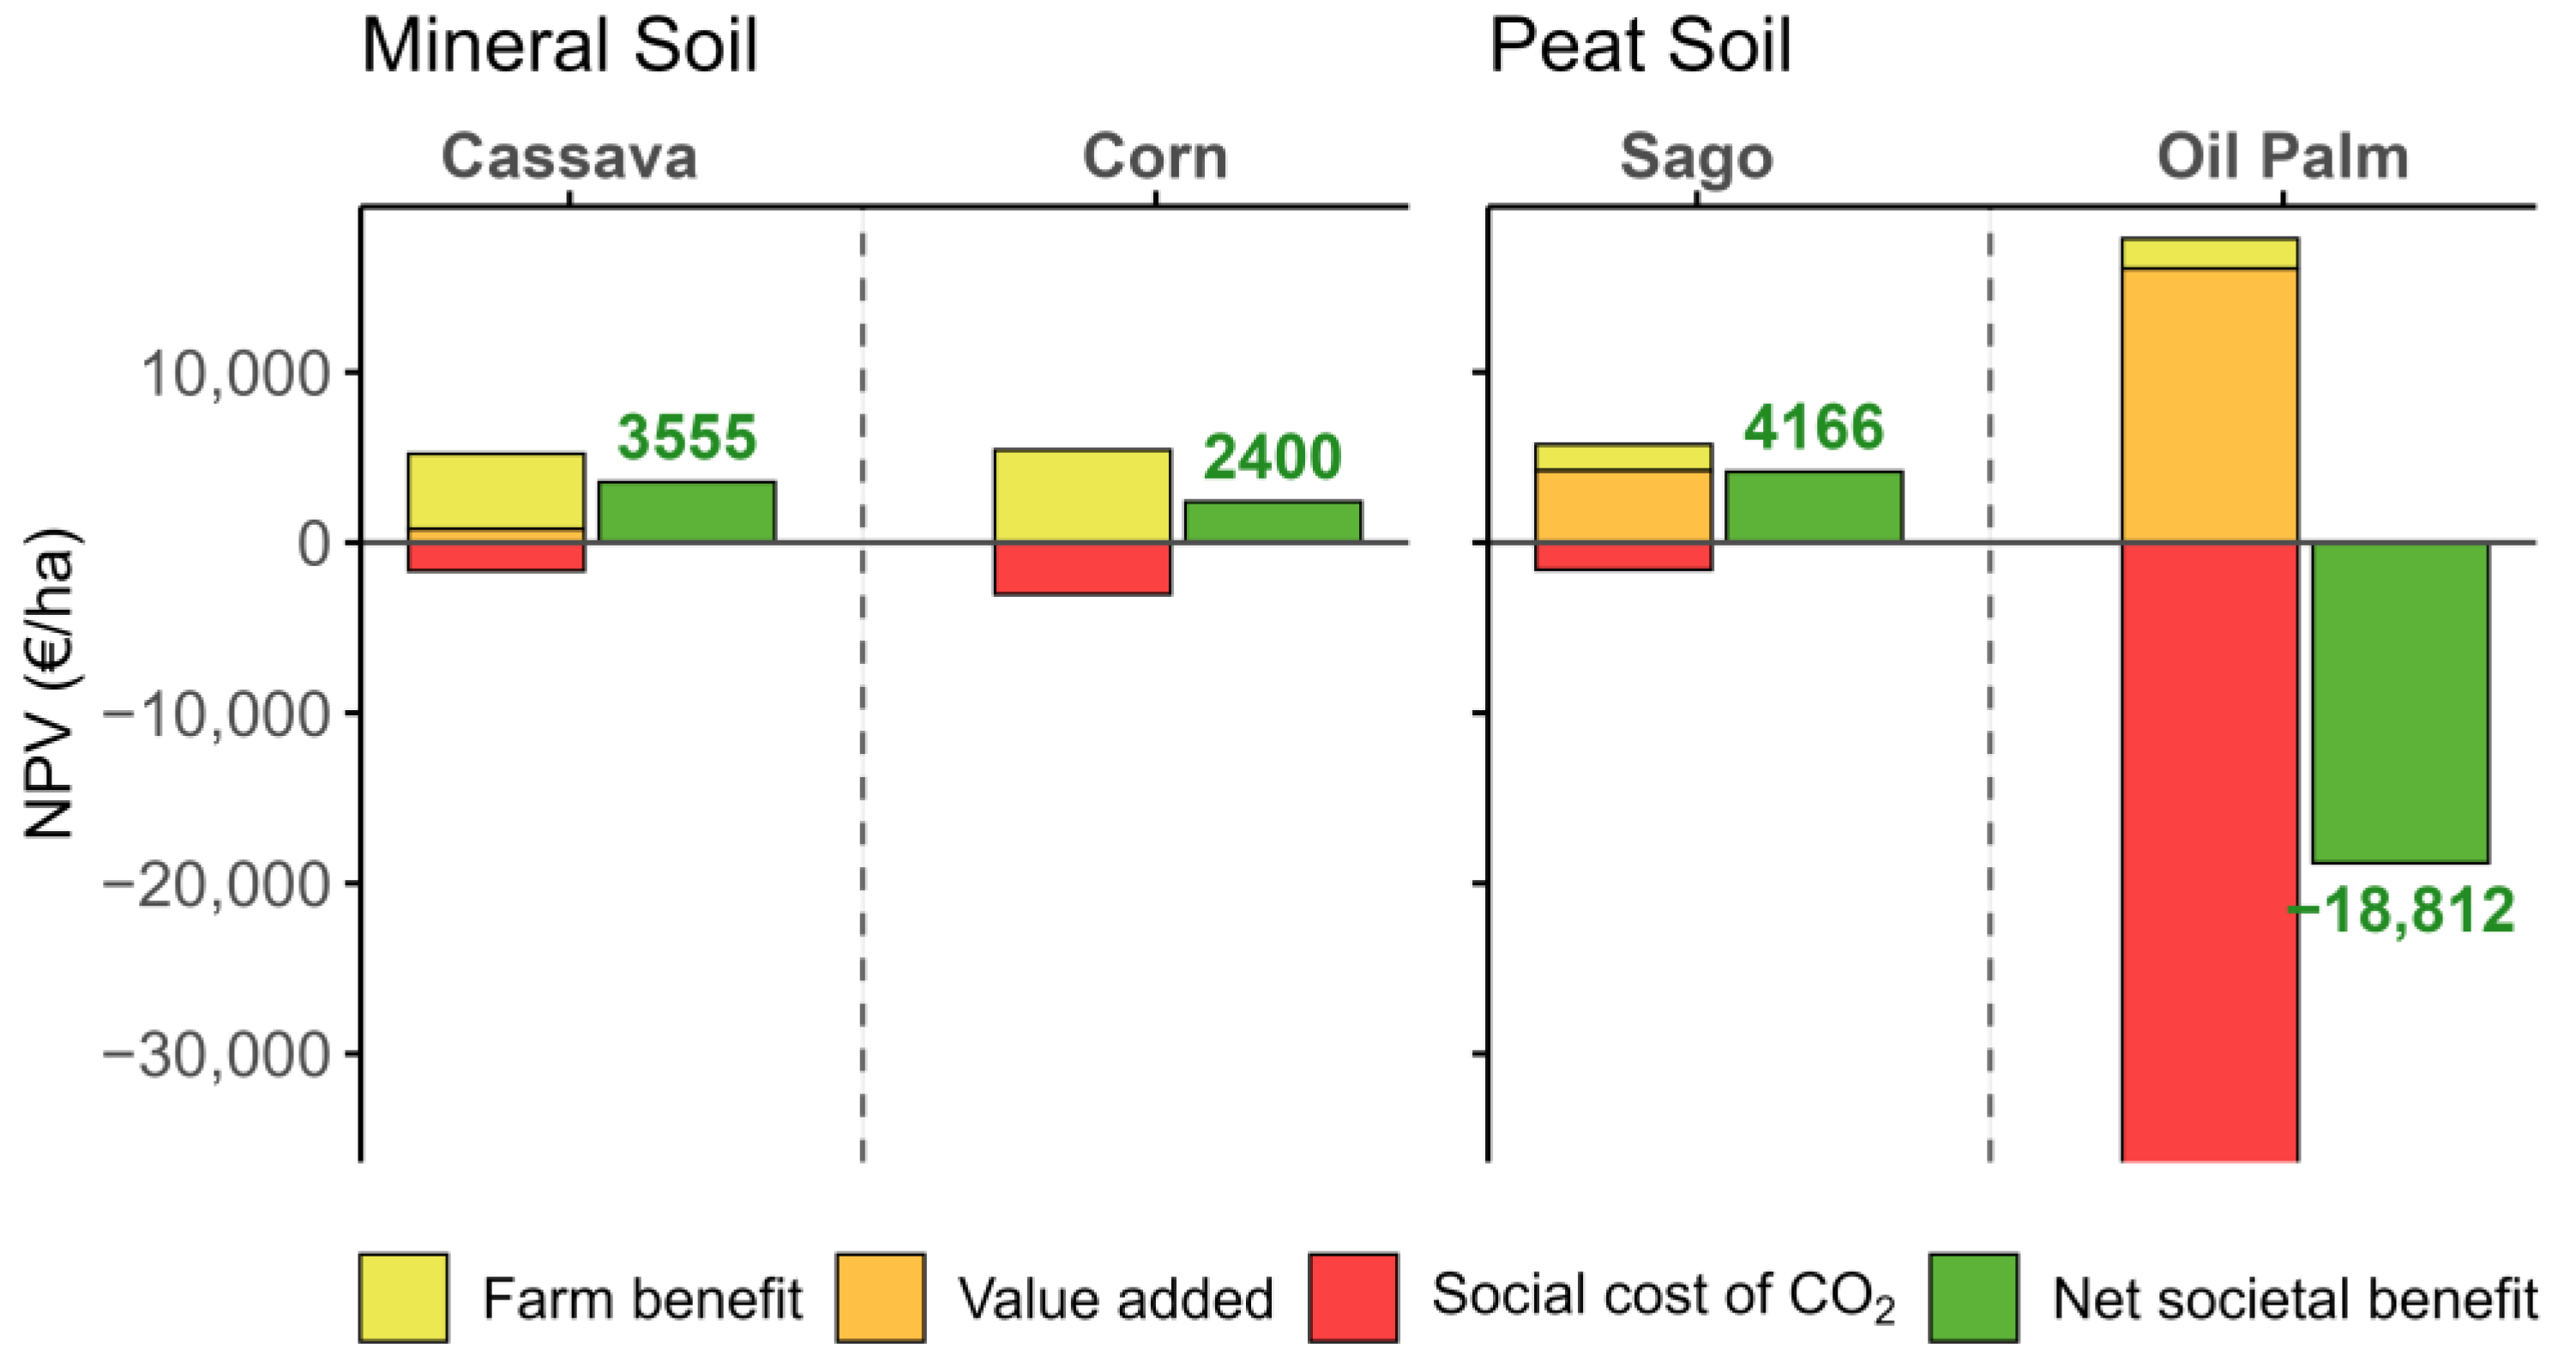
Considering the integration of farm-level benefits, value added, and SC-CO2 as societal benefits, the results show that sago starch production, which includes both crop cultivation and starch processing, provided the highest net societal benefit among all crops (Figure 4). A considerable shift was observed in the case of CPO production. Despite having the highest financial benefits, more than three times those of sago starch, the net societal benefit became negative when the FFBs were sourced from oil palm plantations on peat soils. This outcome was primarily driven by the extremely high SC-CO2 associated with peatland drainage.
The findings also reveal a marked contrast between crops grown on mineral and peat soils. On mineral soils, cassava and corn production generated relatively high farm-level returns compared with the value added from downstream processing, and the associated emissions remained below the farm-level benefits. In contrast, crops cultivated on peat soils displayed lower farm-level benefits relative to their value-added benefits. This was particularly evident for oil palm, which showed substantially lower farm-level returns. Moreover, the emission costs for oil palm were approximately 21 times greater than its farm-level benefits. This highlights the low productivity but considerable environmental burden associated with peatland-based agriculture.

3.5. Optimum Yield Scenario of Sago and Oil Palm Farm Level Benefits

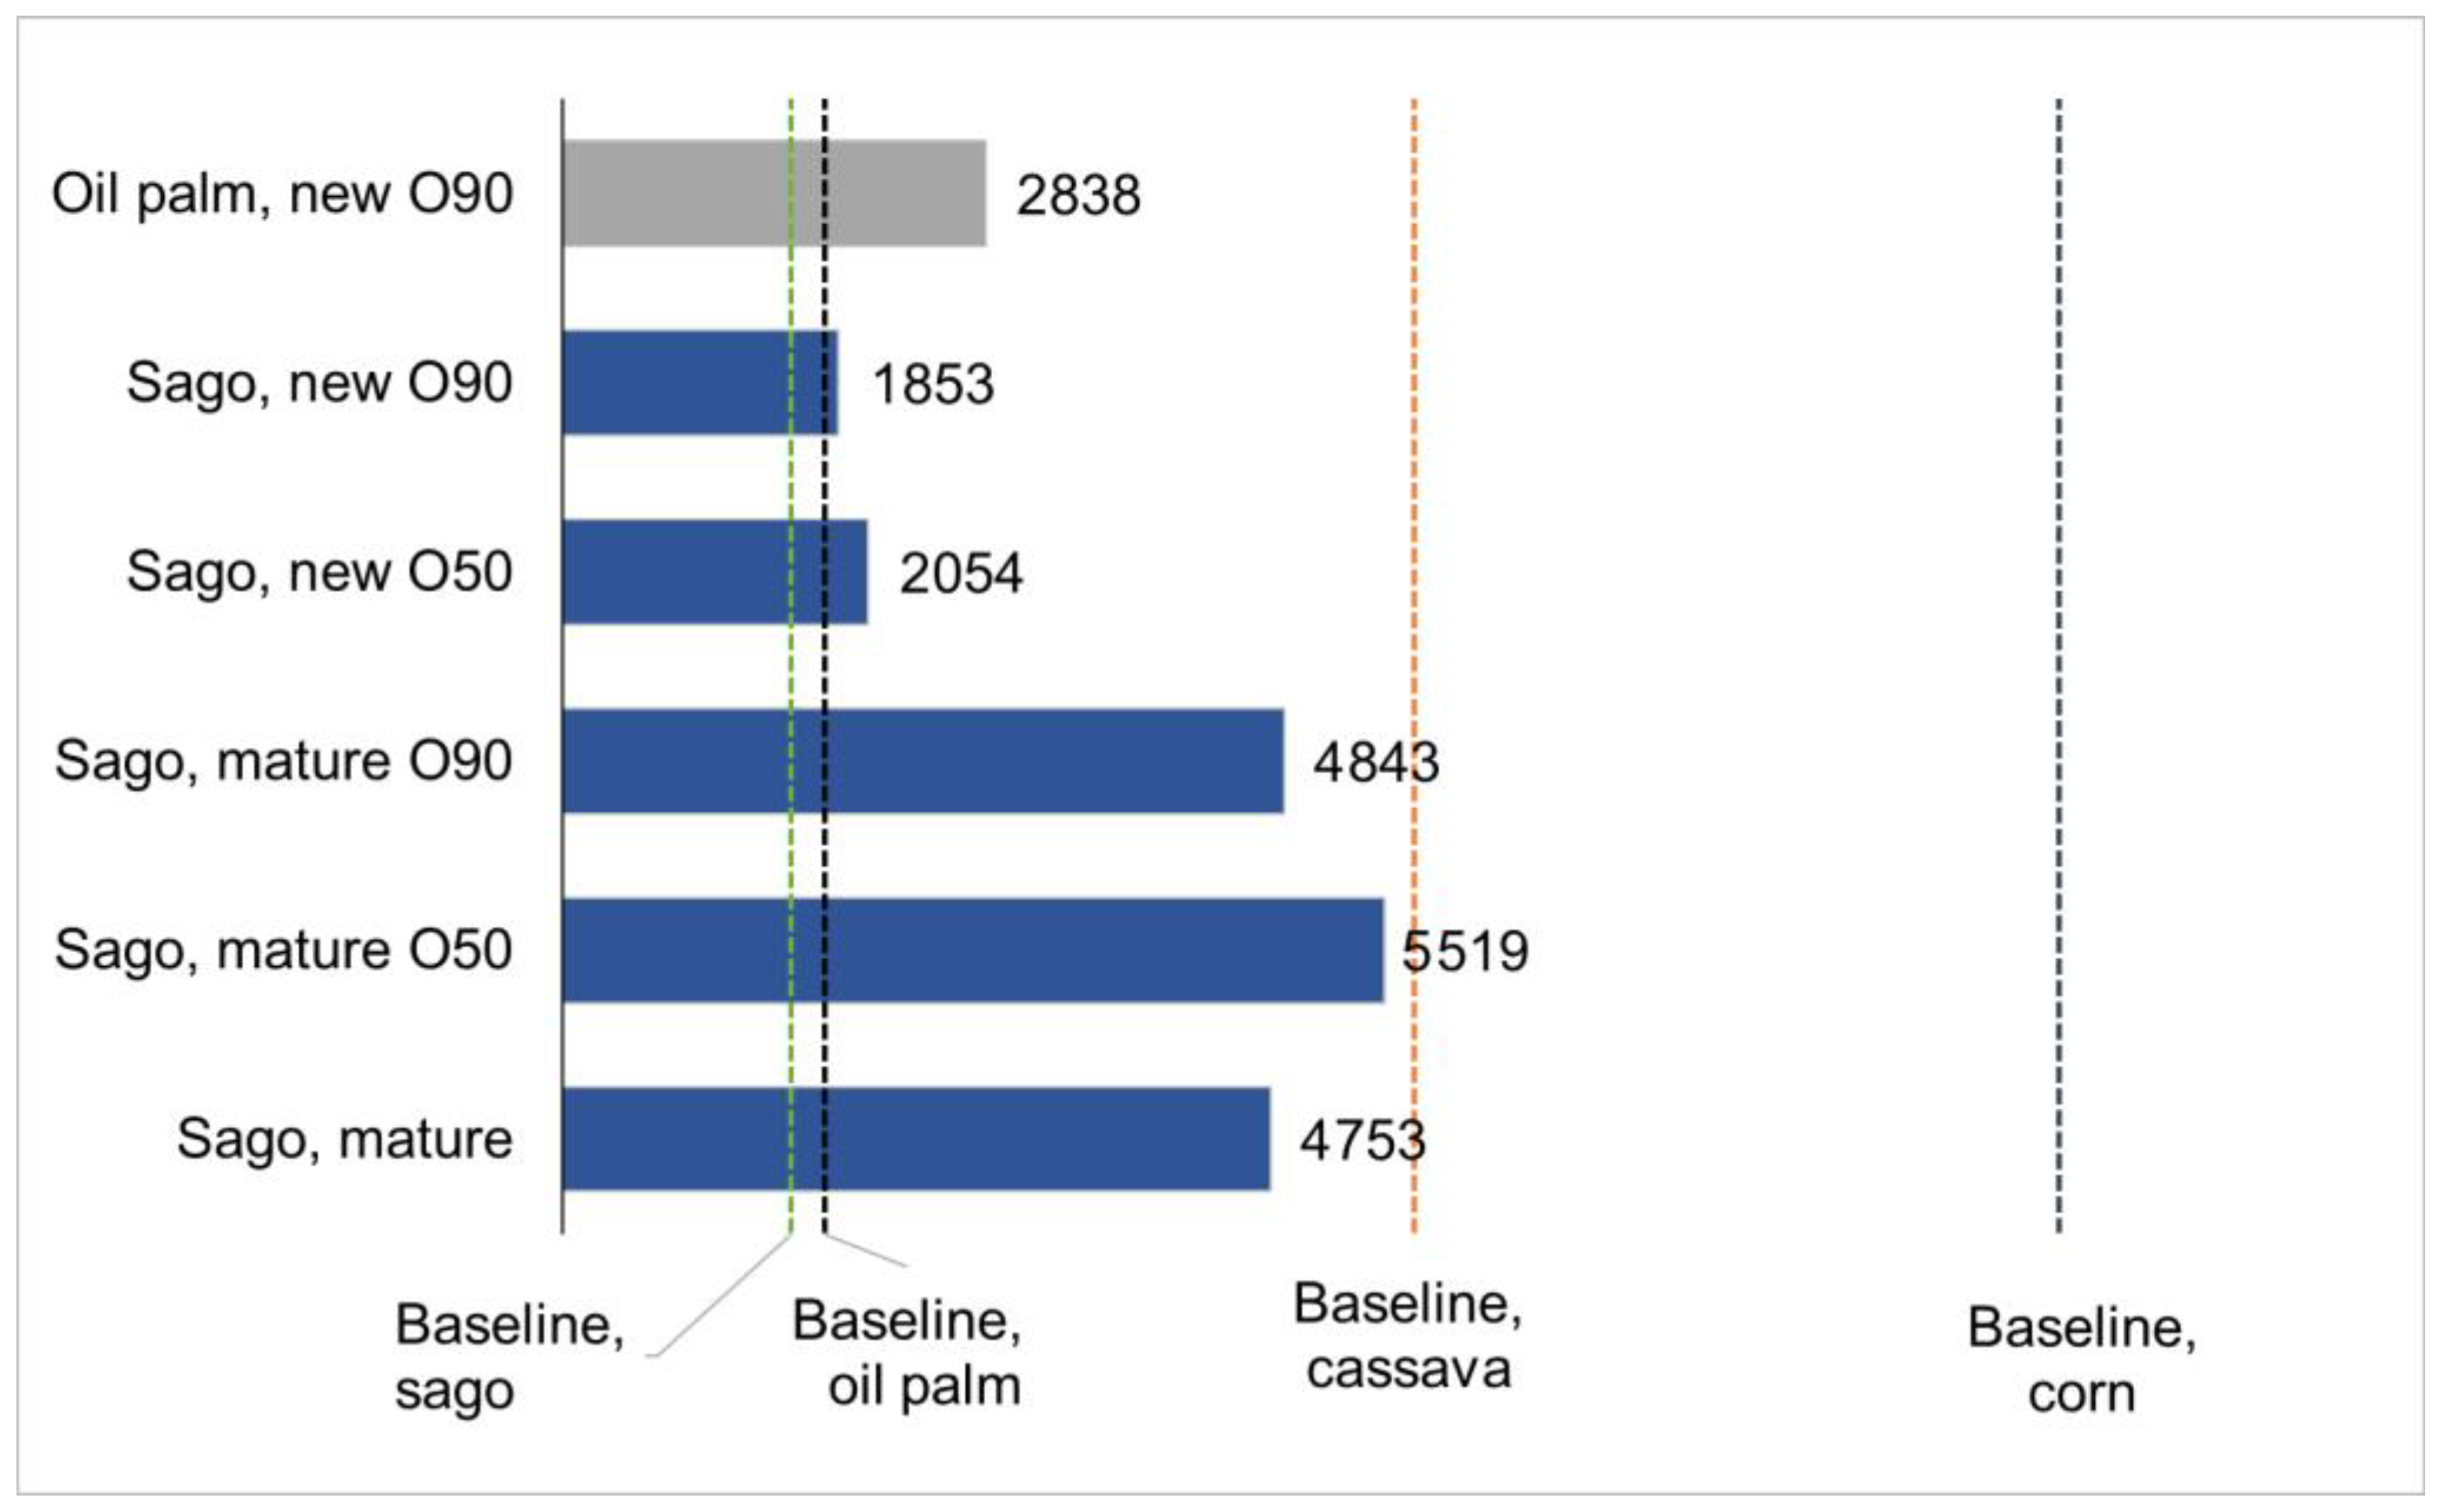
Surprisingly, increasing the productivity of newly planted sago to 90% of its optimum yield (scenario O90) did not result in a higher NPV than scenario O50 (50% of sago optimum yield) (Figure 5). This outcome was largely due to the higher costs of fertilizers and labor needed in scenario O90 to achieve maximum yield. The high cost of fertilizers and their uncertain effectiveness due to high water table conditions limit their benefit. In comparison, scenario O50 led to a 25% increase in NPV over the sago baseline. Both newly planted sago scenarios (O50 and O90) outperformed the oil palm baseline, and increasing oil palm yields to the O90 level resulted in a significantly higher NPV than either sago scenario. This suggests that, over a 25-year period, newly planted sago is unlikely to surpass oil palm in financial performance.
Figure 5 further illustrates that existing mature sago plantations, representing long-term agricultural farming, demonstrated considerably higher benefits than oil palm on peatlands. The NPV of mature sago more than doubled that of sago at baseline, despite being achieved without any management improvements. When improved to 50% of the optimum yield (scenario O50), mature sago produced an NPV nearly twice as high as that of oil palm under its optimum yield scenario (O90). These findings highlight the long-term profitability of sago cultivation, suggesting that it can outperform oil palm on peatlands over time. Notably, none of the sago farmers in our study expressed willingness to convert their mature sago to oil palm, unless productivity had declined, as occurred in some oil palm plots previously planted with sago, where surrounding areas had been drained to support other crops. Nonetheless, when comparing across soil types, crops cultivated on mineral soils (i.e., cassava and corn) remained more profitable than sago on peat soils.

4. Discussion

4.1. Uncertainties and Limitations

The main limitation of this study is the potential bias in farmers’ self-reported data, particularly recall bias, as no records of productivity were kept by farmers. This may have led to misreported costs, revenues, and labor inputs. Farmers often overestimate small plots and underestimated larger ones [52]. Additionally, multiple harvest cycles, such as one in which oil palms were harvested at two-week intervals, may have introduced uncertainties in yield estimation. While smallholders in Indonesia generally prefer a two-week harvest interval for oil palm fresh fruit bunches (FFBs), various factors can extend the actual interval, with an average of 17 days reported [53]. However, some studies suggest that recall bias does not always have a significant impact on the reliability of agricultural data [54,55]. While these limitations should be considered, the findings offer useful indications, and further research could help improve data accuracy.
There is also uncertainty in valuing the opportunity cost of self-employed work. Self-employment is common on small-scale smallholder farms where the owners and their family members provide the labor. In our study, we incorporated costs associated with self-employment by assuming that the time (person-day quantity) and costs were similar to those they would incur if hiring paid workers. In reality, the farmers may work longer than hired workers, who often work for less than a full day. This is supported by the fact that paid workers are typically paid below the regency minimum wage. Our study’s assumption of equivalent labor costs between self-employed and hired workers might, therefore, lead to an underestimation of actual labor costs, particularly for crops grown through labor-intensive cultivation, such as cassava and corn.
High levels of uncertainty also result from the social cost of carbon dioxide (SC-CO2) used in the analysis. Our SC-CO2 was very conservative, as the most recent studies suggest a much higher SC-CO2. The latest US EPA SC-CO2 suggests 176 EUR/tCO2eq (190 USD/tCO2eq), while others suggest 171 EUR/tCO2eq (185 USD/tCO2eq) with a 2.2% increase per year [56,57]. However, in a developing economy like Indonesia, it is more appropriate to use lower carbon costs to avoid overestimating the cost of CO2. Additionally, the monthly average carbon price in 2024 ranged between 3.57 and 3.74 EUR/tCO2eq (58,800–61,587 IDR/tCO2eq) in the newly developed Indonesian carbon exchange. We noted that this was still very low compared with the carbon price found on other carbon markets. For example, in the EU Emissions Trading System (EU ETS), the average price in 2024 was 64.74 EUR/tCO2eq.
We were also aware of the uncertainty surrounding the calculation of CO2 emissions associated with peat drainage. Our assumption that oil palm cultivation had an average water level 40 cm below the peat surface was very conservative, as in reality, this rarely happens, particularly in smallholder farms (e.g., [58]). Smallholder farmers generally have limited capacity to manage water levels, avoid flooding during the rainy season, and maintain high yields. On many farms, the drainage may often be deeper than 40 cm. Therefore, we may have underestimated the CO2 emission rate from drainage peatlands.
We also did not include the emissions of mechanized machine use, such as in land clearing or land preparation and post-harvest processing, due to the difficulty in quantifying the actual fuel used during the process. Generally, mechanized agricultural processes involve contract-based payments, i.e., paid per ha or yield quantity. Moreover, fertilizers add a substantial greenhouse gas (GHG) burden. Our results show that fertilizer application alone generates large on-farm GHG emissions, and these emissions might further increase once the upstream emissions from fertilizer and pesticide production are included, as shown in previous life cycle assessments on agricultural practices [59,60]. Additionally, the emissions from the process after crop products left the farm were not included. From the supply chains, oil palm would have more emissions than others due to the intensive mechanized land clearing process and the extensive transport involved, especially the transport of the FFBs to the crude palm oil (CPO) mill. Meanwhile, sago, given that the cultivation process was generally manual, with only short-distance starch product transport involved, would have the least fuel emissions. In semi-mechanized starch production, sago starch has lower emissions compared with cassava starch, 37.9 kgCO2eq/t vs. 292 kgCO2eq/t, respectively [61]. Applying life cycle assessment (LCA) enables a more comprehensive estimation of emissions and environmental impacts across the agricultural supply chains [62] and is therefore recommended for future research to better understand the full environmental implications of each crop.
We did not include the costs of other impacts associated with peat drainage, such as peat subsidence and peat fires, due to a lack of available data. However, these impacts have been widely studied and are known to have significant consequences. Peatland subsidence occurs due to compaction, consolidation, and oxidation of drained peatlands [37]. This process lowers the peatland surface, making it more prone to flooding during the rainy season. Seasonal flooding significantly affects oil palm productivity. For example, a flood impact model indicates that in current plantation practices in Sumatran peatlands, oil palm production could decline by 21% within 30 years, during the early part of the second cycle [63]. As the peat surface becomes lower than the levels of surrounding water bodies (e.g., rivers), the risk of flooding from these sources increases, leading to nearly permanent inundation. Permanent flooding may occur even after just one oil palm plantation rotation [64]. At this point, oil palms die, rendering the peatlands unsuitable for cultivation, resulting in significant economic losses for farmers who depend on peatlands for their livelihoods.
Excessive peat drainage has also been linked to an increased fire risk [65,66]. Peat fires in drained peatlands are a major source of air pollution, contributing to approximately 33,100 premature adult deaths and 2900 premature infant deaths annually in Sumatra and Kalimantan [67]. These numbers indicate that peatland fires reduce life expectancy by 0.9 years and 1.2 years in Sumatra and Kalimantan, respectively [67]. The economic impact of these fires is also substantial. During the 2004 and 2015 fire events, restoring drained and degraded peatlands could have saved EUR 7.8 billion (USD 8.4 billion) in economic losses related to health, crops, forests, and CO2 emissions [68]. Thus, our study only accounted for peatland drainage’s indicative minimum societal impact.

4.2. Opportunity for Sago Starch Utilization as Bioplastic Feedstock

This study has demonstrated that, at its current low productivity, sago starch production provides societal benefits higher than those of cassava, primarily due to the lower emissions associated with sago cultivation and starch processing, as well as the potential to improve sago starch production profitability. Compared with sago, increasing starch production by scaling up cassava starch production is less attractive for cassava or starch producers, as it requires large investments, subsidies, and high operational costs while yielding low profitability. In contrast, sago cultivation on peatlands is not only more environmentally sustainable but also offers economic potential if productivity and processing improve, supporting conservation by providing economic benefits without degrading the ecosystem.
Expanding starch production from other mineral crops such as corn and potatoes is limited by land availability and competition with food supply [69]. In contrast, large plots are more commonly available on peatlands than on mineral soils, making it more feasible for farmers to scale up sago cultivation. As shown by our results, for sago to be economically sufficient in sustaining a rural household, the plot needs to be bigger than three hectares (for a family size of four), given that in 2023 the average expenditure in the Meranti Islands was EUR 523 (IDR 8,613,000) per capita. Having large plots on peatlands is common as opposed to having large mineral soil plots; thus, the chance to gain sufficient income is high [26]. Another advantage is the relatively low demand for sago as a food source, which reduces competition between starch for human consumption and starch for biomaterials. Currently, the demand for sago is relatively low in Indonesia, and farmers’ processing capacities are sub-optimal. Hence, our estimate for sago, based on the average for 16 farmers, should be viewed as an underestimate of the potential revenues should the market become more mature.
From the perspective of society, we noted that growing cassava to produce starch results in a high cost for the farmers, and its benefits are lower than those generated from cultivating a competing crop, i.e., corn. However, while newly planted oil palm on peatland generates higher benefits than newly planted sago, this advantage comes at a substantial societal cost due to high CO2 emissions. Replacing oil palm with sago yields net benefits for both farmers and society. Farmers can generate more income from sago in the long term compared with oil palm on peat, and society does not bear the high costs of CO2 emissions from oil palm grown on peat. We specifically note that our analysis focuses on smallholder cultivation of oil palm on peat, where the management of soil and water levels is often complex for smallholders and where production conditions are generally less favorable compared with oil palm cultivation on mineral land [43,70]. Hence, our analysis shows that it is in Indonesia’s economic interest not to increase starch production from cassava and instead to promote starch production from sago. In addition, replacing oil palm production on peat with undrained cultivation of sago is also of interest to Indonesia in the long term, since soil subsidence of peatlands irreversibly decreases long-term production possibilities [63].
Several factors constrain the large-scale conversion of peatland use to sago cultivation. First, the long waiting period before the initial harvest results in a prolonged negative cash flow. Farmers without substantial off-farm income frequently borrow at planting and then sell their sago logs at low prices (up to a 50% loss) for quick and advanced cash, perpetuating a cycle of debt known locally as the “ijon” or “pajak” system [71]. Second, low productivity on sago farms, mainly due to traditional farming methods, further limits profitability. Although new sago plantations with the highest yield (as demonstrated in the optimum scenario) could not achieve benefits as high as cassava’s baseline, in the long term, sago has the potential to generate greater benefits, as it does not require replanting after establishment, as shown in our mature sago scenarios. Third, the value of sago starch per ha is relatively low, with wet starch sold at only 0.18 EUR/kg (32% of the value of cassava dry starch). This is associated with the farmers’ lack of capacity to dry and process sago to a higher quality. Moreover, traditional harvesting and extraction systems suffer substantial starch loss. Up to 20% of the starch may remain in the stumps (tops and bottoms of felled trunks) when cutting is imprecise, and mistimed harvesting (whether too early or too late) can further reduce yields [71]. Traditional rasping methods can lose as much as 50% of the available starch during processing [71,72]. Modernizing agronomic practices, i.e., optimized harvesting time and method, and upgrading extraction techniques would recover these losses.
Sago can be a more beneficial crop compared with oil palm on peatland for smallholders. However, due to sago’s long period of harvesting time and oil palm’s successful economic returns for supported smallholdings (i.e., plasma scheme), new farmers are likely to favor oil palm [73]. Hence, an option is to examine if money from carbon credits can be used to compensate farmers who want to convert to sago for the long waiting time between planting and the first harvest. The minimum compensation can be set at 732 EUR/ha/year, based on the gross profit from mature plantations in our study, or alternatively at 889 EUR/ha/year, as estimated by [40]. Potentially, this can be combined with intercropping with compatible low-growing crops or adopting agrosilvofishery. Intercropping with short-cycle crops without drainage, such as water spinach and edible ferns, can provide income during sago’s non-productive stages [28]. Agrosilvofishery, which combines agricultural crops, forestry, and fish farming, has shown promise for increasing both ecological sustainability and farmers’ income. In particular, the cultivation of the pangas catfish (Pangasius pangasius) can be combined well with agroforestry in peatlands [74,75].
The lower cost of sago starch production could help reduce the high production costs of biobased plastics, which remain a barrier to widespread adoption [1,76]. Improving crop productivity and starch extraction methods could enhance the economic viability of sago starch production without significantly increasing its price. Moreover, there is a lot of land available to scale up sago production in Indonesia, which helps ensure price stability. Approximately 2.6 million ha of degraded peatland (non-protected or non-conservation forest areas) is potentially suitable for growing sago [77]. Therefore, future development efforts for sago should focus on improving its productivity and expanding the area used for its cultivation.
In addition to its economic advantages, sago starch also shows strong technical potential as a bioplastic feedstock. Starch physicochemical properties, including amylose content, granule size, and gelatinization behavior, affect the bioplastic characteristics [78,79,80]. Sago starch compares well with other starch alternatives: its amylose content (24–31%) aligns closely with that of maize (22–30%), and its average granule size (32 μm) falls between that of cassava and potato [79,81]. Moreover, its gelatinization and hot paste properties resemble those of corn and potato starches, both of which are known to produce films with good strength and flexibility [82]. These parallels suggest that sago starch can serve similar functional roles in bioplastic applications.
The implications of these comparable properties are significant. As with other starches, sago starch can be modified, through blending with biopolymers or the addition of plasticizers and crosslinking agents, to enhance its thermal stability, water resistance, and mechanical performance [17,18,78,83]. This versatility opens up a range of potential applications, from flexible packaging to disposable products, particularly in regions where sago is locally abundant. Harnessing both the economic and technical advantages of sago could strengthen biobased industries while supporting sustainable land use. To fully realize this potential, future research should focus on empirically testing and optimizing sago starch formulations.

4.3. Policy Implications

The Indonesian government has set ambitious targets to reduce waste by 30% and manage 70% of waste by 2025, along with a specific goal of reducing plastic marine debris by 70% by 2025 and achieving a plastic pollution-free environment by 2040. However, by the end of 2023, 38% of waste was still leaking into the environment [84]. Despite discrepancies in the baseline data used, which may underestimate the actual extent of waste pollution (as shown in [85]), it is clear that large amounts of plastic are still being discharged into the environment, posing a long-term challenge.
Household plastic packaging is the most abundant source of plastic waste [86,87], highlighting the urgent need to accelerate the transition to bioplastics. A comprehensive and integrated policy is needed to address this gap to prevent burden shifting. Promoting sago starch as an alternative to biodegradable plastics could help address plastic pollution and GHG emissions, although the extent of GHG reduction depends on the types of additives used and the overall plastic production process, contributing to Indonesia’s Nationally Determined Contributions (NDCs) target through economically sustainable peatland restoration.
To reduce peatland degradation, the Indonesian government issued Presidential Instruction No. 10 of 2011, which imposed a moratorium on new permits for the exploitation of natural primary forests and peatlands. This moratorium was extended every two years and became permanent in 2019 with the issuance of Presidential Instruction No. 05 of 2019. For peatland restoration to succeed, it must be accompanied by profitable and sustainable peatland use that is accessible to local communities. Without viable alternative livelihoods, there is a risk that local communities will intensify their use of peatland forest resources through burning or exploitation, which could lead to the failure of restoration initiatives [88].
There is an urgent need for peatland farmers to shift from oil palm to more sustainable undrained crops, such as sago, to reduce peatland emissions, especially since rewetted peatlands only reach stable low-emission states after 13–16 years [28,64,89]. Substantial emission reductions are possible if both company and smallholder oil palm plantations are withdrawn from peatlands [90]. However, given that smallholders in peatlands generally have low incomes, lack capital, and struggle with poverty, an immediate transition from oil palm to sago cultivation poses challenges. To facilitate this transition, several measures are needed. First, sago cultivation should be promoted among oil palm farmers whose plantations are nearing the end of their productive cycles. Second, incentives should be provided to new sago farmers, for example, through the REDD+ scheme, to stimulate the opening of new sago plantations, particularly given the long waiting period before the first harvest. Third, farmers’ capacity in non-drainage farming systems should be enhanced. As highlighted in our study, current sago farming practices are often passed down through generations, with limited knowledge among farmers of best management practices. Implementing good agricultural practices can significantly enhance sago productivity. Fourth, to break the cycle of debt caused by the “ijon” system and the lack of formal financing, it is crucial to establish accessible, low-interest village loan schemes with simple credit procedures. Strengthening the role of small-scale domestic traders through transparent pricing and grading would also help farmers obtain cash when needed [71]. Fifth, local development projects could be co-financed by government, nongovernment, and international partners to support sago cultivation. As shown by successful peatland initiatives in Indonesia (e.g., [91,92]), such partnerships can mobilize capital, technical expertise, and long-term support, in line with SDG 17. While partnerships can accelerate peatland rehabilitation and improve socio-economic welfare [93], they require shared goals, strong governance, and coordination to succeed [94]. Lastly, farmers’ ability to intercrop and apply agrosilvofishery on peatlands should be improved (e.g., [90]).
Although this study is situated within the Indonesian context, the insights into the environmental trade-offs associated with peatland use are applicable to other tropical regions with comparable agro-ecological and socio-economic conditions, particularly in efforts to promote sago starch as a biomaterial feedstock. Sago cultivation is one of the missing components of sustainable agriculture on peatlands. This is especially relevant in Southeast Asia, which accounts for nearly half of the world’s tropical peatlands and where carbon losses from drained and degraded peatlands are among the highest globally [95,96,97]. In many of these areas, peatland ecosystems continue to play a vital role in supporting local livelihoods, despite ongoing ecological degradation. In this context, paludiculture has been proposed as a theoretically sound, cost-effective land use strategy that simultaneously supports peatland restoration, reduces fire and carbon emissions, and contributes to poverty alleviation [25].

5. Conclusions

The rising demand for bioplastics has raised concerns about the environmental impact, continuity of supply, and production costs associated with large-scale starch production. This study compared the costs and benefits of starch produced from cassava on mineral soils and sago on peat soils, as well as the opportunity costs associated with growing corn on mineral soils and oil palm on peatlands, focusing on the financial and societal benefits of starch production. Our analysis highlights three key findings: first, although cassava farming is more financially profitable at the farm level, sago offers higher societal benefits when value added and the cost of emissions are considered. Second, sago cultivation supports peatland restoration by avoiding drainage. In contrast, oil palm cultivation on peatlands requires drainage and contributes to long-term peat degradation and carbon emissions, despite offering attractive short-term returns. Third, sago provides long-term economic opportunities for local communities through decentralized starch processing and reduced replanting needs. Thus, we advocate replacing cassava starch with sago starch and promoting starch production from sago grown on peatlands. An innovative aspect of this study is the integration of financial, social, and environmental indicators across different agrosystems to assess the broader value of starch crops, offering a holistic framework that can inform both national and international sustainability strategies.
To promote sago cultivation, several policy interventions are needed. These include providing incentives to compensate for the long waiting period before the first harvest, enhancing current and future farmers’ capacity for best management practices and intercropping, and developing a more efficient ‘smallholder–local processing unit–trader–bioplastic manufacturer’ value chain. Specific attention is needed for the quality assurance of local sago processing and the optimization of bioplastic production from sago. Such measures could position sago as a viable competitor to oil palm or other drainage crops, especially in degraded peatlands. The transition should begin with ageing oil palm plantations and be supported through financial incentives (e.g., REDD+), farmer training in non-drainage practices, improved access to low-interest credit, and strengthened domestic trade networks. Encouraging intercropping and agrosilvofishery practices will further enhance resilience. Furthermore, a clear policy framework is required to guide and accelerate the transition to bioplastic development.

Supplementary Materials

The following supporting information can be downloaded at https://www.mdpi.com/article/10.3390/su17167351/s1: Figure S1: Boxplots of the annual revenue and costs for all crops (EUR/ha); Table S1: Oil palm yield normalization factor; Table S2: Normalized baseline annual yield of oil palm FFB (kg/ha); Table S3: Values of the variables in the calculations; Table S4: Annual fertilizer requirement per ha for the new sago O90 scenario; Table S5: Annual labor costs per ha for new sago cultivation in O50 and O90 scenarios; Table S6: Annual transition costs per ha for the mature sago O50 and O90 scenarios; Table S7: Annual fertilizer costs per ha for the oil palm O90 scenario; Table S8: Annual labor costs for the oil palm O90 scenario, Table S9: Average annual inputs and yields in this study; Table S10: Subsidized vs non-subsidized fertilizer costs at the farm gate (EUR/kg); Table S11: Baseline annual cash flows for all crops (EUR/ha, before discounting); Table S12: Baseline annual cash flows for all crops (EUR/ha, after discounting).

Author Contributions

Conceptualization: I.B.G.S., A.S. and L.H.; methodology: I.B.G.S., A.S. and L.H.; formal analysis: I.B.G.S.; investigation: I.B.G.S.; data curation: I.B.G.S.; writing—original draft preparation: I.B.G.S.; writing—review and editing: I.B.G.S., A.S. and L.H.; visualization: I.B.G.S.; supervision: A.S. and L.H.; project administration: I.B.G.S. and A.S. All authors have read and agreed to the published version of the manuscript.

Funding

This research was supported by the Indonesia Endowment Fund for Education (LPDP) (KEP-1231/LPDP/LPDP.3/2022).

Institutional Review Board Statement

This research does not involve medical research with human subjects. The research focused on agricultural inputs and outputs, such as crop types, fertilizer use, labor, yields, and associated costs and revenue, not on the farmers themselves. The questionnaire was non-interventional and only collected non-sensitive, non-identifiable information.

Informed Consent Statement

Informed consent was obtained from all subjects involved in this study.

Data Availability Statement

Data are contained within this article or its Supplementary Materials. Further inquiries can be directed to the corresponding authors.

Acknowledgments

The authors thank LPDP for providing scholarships and supporting this research, the farmers for sharing their information, and the key informants for their valuable assistance during the fieldwork.

Conflicts of Interest

The authors declare no conflicts of interest.

Abbreviations

The following abbreviations are used in this manuscript:
CPOCrude palm oil
FFBFresh fruit bunch
GHGGreenhouse gas
NPVNet present value
PKPalm kernel
SC-CO2Social cost of carbon dioxide
US EPAUnited States Environmental Protection Agency
YAPYear after planting

References

  1. Sid, S.; Mor, R.S.; Kishore, A.; Sharanagat, V.S. Bio-Sourced Polymers as Alternatives to Conventional Food Packaging Materials: A Review. Trends Food Sci. Technol. 2021, 115, 87–104. [Google Scholar] [CrossRef]
  2. Langeveld, H.; Meeusen, M.; Sanders, J. The Biobased Economy: Biofuels, Materials and Chemicals in the Post-Oil Era; Earthscan: London, UK, 2010; ISBN 9781849774802. [Google Scholar]
  3. Song, J.H.; Murphy, R.J.; Narayan, R.; Davies, G.B.H. Biodegradable and Compostable Alternatives to Conventional Plastics. Philos. Trans. R. Soc. B Biol. Sci. 2009, 364, 2127–2139. [Google Scholar] [CrossRef]
  4. Jambeck, J.R.; Geyer, R.; Wilcox, C.; Siegler, T.R.; Perryman, M.; Andrady, A.; Narayan, R.; Law, K.L. Plastic Waste Inputs from Land into the Ocean. Science 2015, 347, 768–771. [Google Scholar] [CrossRef] [PubMed]
  5. Lebreton, L.C.M.; van der Zwet, J.; Damsteeg, J.-W.; Slat, B.; Andrady, A.; Reisser, J. River Plastic Emissions to the World’s Oceans. Nat. Commun. 2017, 8, 15611. [Google Scholar] [CrossRef] [PubMed]
  6. Alexander, I.; Putri, M.M.W.; Simatupang, R.; Soepardjo, T. Plastic and Recycling Industry Outlook in Indonesia: An Assessment on Capacity and Capability; USAID/Indonesia: Jakarta, Indonesia, 2022.
  7. Narancic, T.; Verstichel, S.; Reddy Chaganti, S.; Morales-Gamez, L.; Kenny, S.T.; De Wilde, B.; Babu Padamati, R.; O’Connor, K.E. Biodegradable Plastic Blends Create New Possibilities for End-of-Life Management of Plastics but They Are Not a Panacea for Plastic Pollution. Environ. Sci. Technol. 2018, 52, 10441–10452. [Google Scholar] [CrossRef] [PubMed]
  8. Karjoko, L.; Handayani, I.; Jaelani, A.K.; Hayat, M.J. Indonesia’s Sustainable Development Goals Resolving Waste Problem: Informal to Formal Policy. Int. J. Sustain. Dev. Plan. 2022, 17, 649–658. [Google Scholar] [CrossRef]
  9. BPS National Export Import Data. Available online: https://www.bps.go.id/en/exim (accessed on 30 March 2025).
  10. Bakkalapulo, M. Can Bioplastics Turn the Tide on Indonesia’s Waste Problem? Available online: https://www.wbur.org/hereandnow/2018/10/24/indonesia-plastic-pollution (accessed on 14 February 2023).
  11. Mediatama, G. Kantong Singkong Naik Kelas. Available online: https://insight.kontan.co.id/news/kantong-singkong-naik-kelas (accessed on 15 February 2024).
  12. Yamamoto, Y. Evaluation and Development of Sago Palm as a Natural Starch Resource in the Tropics. Sago Palm 2019, 26, 44–52. [Google Scholar]
  13. van der Meer, P.J.; Tata, H.; Rachmanadi, D.; Arifin, Y.F.; Suwarno, A.; van Arensbergen, P. Developing Sustainable and Profitable Solutions for Peatland Restoration. IOP Conf. Ser. Earth Environ. Sci. 2021, 914, 012032. [Google Scholar] [CrossRef]
  14. Wardis, G. Socio-Economic Factors That Have Influenced the Decline of Sago Consumption in Small Islands: A Case in Rural Maluku, Indonesia. South Pac. Stud. 2014, 34, 99–116. [Google Scholar]
  15. Sidiq, F.F.; Coles, D.; Hubbard, C.; Clark, B.; Frewer, L.J. Sago and the Indigenous Peoples of Papua, Indonesia: A Review. J. Agric. Appl. Biol. 2021, 2, 138–149. [Google Scholar] [CrossRef]
  16. Amni, C.; Ismet; Aprilia, S. Mariana Study on Biodegradable Plastic from Sago with Addition of Glycerol and Serbitor. IOP Conf. Ser. Earth Environ. Sci. 2019, 365, 012052. [Google Scholar] [CrossRef]
  17. Ismail, H.; Zaaba, N.F. Tensile Properties, Degradation Behavior, and Water Absorption of Sago Starch Plastic Films. J. Vinyl Addit. Technol. 2012, 18, 235–240. [Google Scholar] [CrossRef]
  18. Ismail, H.; Zaaba, N.F. The Mechanical Properties, Water Resistance and Degradation Behaviour of Silica-Filled Sago Starch/PVA Plastic Films. J. Elastomers Plast. 2014, 46, 96–109. [Google Scholar] [CrossRef]
  19. de Léis, C.M.; Nogueira, A.R.; Kulay, L.; Tadini, C.C. Environmental and Energy Analysis of Biopolymer Film Based on Cassava Starch in Brazil. J. Clean. Prod. 2017, 143, 76–89. [Google Scholar] [CrossRef]
  20. Molenveld, K.; Post, W.; Ferreira, S.F.; de Sévaux, G.; Hartstra, M. Paving the Way for Biobased Materials: A Roadmap for the Market Introduction of PHAs; Wageningen Food & Biobased Research: Wageningen, The Netherlands, 2022. [Google Scholar]
  21. Anda, M.; Ritung, S.; Suryani, E.; Sukarman; Hikmat, M.; Yatno, E.; Mulyani, A.; Subandiono, R.E. Suratman Husnain Revisiting Tropical Peatlands in Indonesia: Semi-Detailed Mapping, Extent and Depth Distribution Assessment. Geoderma 2021, 402, 115235. [Google Scholar] [CrossRef]
  22. Mattila, T.J. The Role of Peatlands in Carbon Footprints of Countries and Products. Sci. Total Environ. 2024, 947, 174552. [Google Scholar] [CrossRef] [PubMed]
  23. Hooijer, A.; Page, S.; Canadell, J.G.; Silvius, M.; Kwadijk, J.; Wösten, H.; Jauhiainen, J. Current and Future CO2 Emissions from Drained Peatlands in Southeast Asia. Biogeosciences 2010, 7, 1505–1514. [Google Scholar] [CrossRef]
  24. UNEP Global Peatlands Assessment—The State of the World’s Peatlands: Evidence for Action Toward the Conservation, Restoration, and Sustainable Management of Peatlands; Global Peatlands Initiative; United Nations Environment Programme: Nairobi, Kenya, 2022.
  25. Budiman, I.; Bastoni; Sari, E.N.; Hadi, E.E.; Asmaliyah; Siahaan, H.; Januar, R.; Hapsari, R.D. Progress of Paludiculture Projects in Supporting Peatland Ecosystem Restoration in Indonesia. Glob. Ecol. Conserv. 2020, 23, e01084. [Google Scholar] [CrossRef]
  26. Monda, Y.; Kuwahara, S.; Aoki, Y.; Suzuki, H.; Kaneko, T.; Kozan, O.; Muhammad, A.; Susanti, R.; Gunawan, H.; Kanzaki, M. Productivity of Sago Palms on Smallholder Plantations after Rewetting in Previously Drained Peatland: A Case Study on Tebing Tinggi Island, Riau Province, Indonesia. Tropics 2022, 31, 11–32. [Google Scholar] [CrossRef]
  27. Pazli, P.; Pardhana, F. Crude Oil, Palm Oil and Sago Riau: For the Capitalists or the Residents to Stay? J. Econ. Coop. Dev. 2023, 44, 51–78. [Google Scholar]
  28. Uda, S.K.; Hein, L.; Adventa, A. Towards Better Use of Indonesian Peatlands with Paludiculture and Low-Drainage Food Crops. Wetl. Ecol. Manag. 2020, 28, 509–526. [Google Scholar] [CrossRef]
  29. Jabar, P. Produksi Ubi Kayu Berdasarkan Kabupaten/Kota Di Jawa Barat. Available online: https://opendata.jabarprov.go.id/id/dataset/produksi-ubi-kayu-berdasarkan-kabupatenkota-di-jawa-barat (accessed on 28 March 2023).
  30. Jong, F.S. An Overview of Sago Industry Development, 1980s–2015. In Sago Palm: Multiple Contributions to Food Security and Sustainable Livelihoods; Ehara, H., Toyoda, Y., Johnson, D.V., Eds.; Springer: Singapore, 2018; pp. 75–89. ISBN 978-981-10-5269-9. [Google Scholar]
  31. Swastiwi, A.W. Sagu Lingga: Kebijakan Ketahanan Pangan Masa Lalu dan Warisannya. J. Sos. Dan Sains 2021, 1, 1.423–1.435. [Google Scholar] [CrossRef]
  32. Muliany, P.H. Pusat Data Dan Sistem Informasi Pertanian; Ministry of Agriculture RI: Jakarta, Indonesia, 2021; p. 3.
  33. Schuiling, D.L. Growth and Development of True Sago Palm (Metroxylon Sagu Rottbøll) with Special Reference to Accumulation of Starch in the Trunk: A Study on Morphology, Genetic Variation and Ecophysiology, and Their Implications for Cultivation. Ph.D. Thesis, Wageningen University, Wageningen, The Netherlands, 2009. [Google Scholar]
  34. Butler, R.A.; Koh, L.P.; Ghazoul, J. REDD in the Red: Palm Oil Could Undermine Carbon Payment Schemes. Conserv. Lett. 2009, 2, 67–73. [Google Scholar] [CrossRef]
  35. Calvo Buendia, E.; Tanabe, K.; Kranjc, A.; Baasansuren, J.; Fukuda, M.; Ngarize, S.; Osako, A.; Pyrozhenko, Y.; Shermanau, P.; Federici, S. 2019 Refinement to the 2006 IPCC Guidelines for National Greenhouse Gas Inventories; IPCC: Geneva, Switzerland, 2019. [Google Scholar]
  36. Leconte, M.C.; Mazzarino, M.J.; Satti, P.; Iglesias, M.C.; Laos, F. Co-Composting Rice Hulls and/or Sawdust with Poultry Manure in NE Argentina. Waste Manag. 2009, 29, 2446–2453. [Google Scholar] [CrossRef]
  37. Hooijer, A.; Page, S.; Jauhiainen, J.; Lee, W.A.; Lu, X.X.; Idris, A.; Anshari, G. Subsidence and Carbon Loss in Drained Tropical Peatlands. Available online: https://bg.copernicus.org/articles/9/1053/2012/ (accessed on 3 August 2023).
  38. IPCC. IPCC Fourth Assessment Report. IPCC Geneva 2007, 2007, 044023. [Google Scholar]
  39. Suswatiningsih, T.E.; Yulistiana, E.; Sayekti, A.A.S. Struktur biaya dan penentuan harga angkut TBS kelapa sawit oleh kontraktor. Agritech J. Fak. Pertan. Univ. Muhammadiyah Purwok. 2021, 23, 84–90. [Google Scholar] [CrossRef]
  40. Orentlicher, N. Carbon, Palms and Peat: Assessing the Environmental and Economic Sustainability of Sago. Master’s Thesis, Wageningen University & Research, Wageningen, The Netherlands, 2019. [Google Scholar]
  41. Jong, F.S.; Flach, M. The Sustainability of Sago Palm (Metroxylon Sagu) Cultivation on Deep Peat in Sarawak. Sago Palm 1995, 3, 13–20. [Google Scholar]
  42. RSPO. RSPO Smallholder Peat Best Management Practices Handbooks and Flood Risk Assessment Template; Roundtable on Sustainable Palm Oil: Kuala Lumpur, Malaysia, 2022. [Google Scholar]
  43. Woittiez, L.S.; van Wijk, M.T.; Slingerland, M.; van Noordwijk, M.; Giller, K.E. Yield Gaps in Oil Palm: A Quantitative Review of Contributing Factors. Eur. J. Agron. 2017, 83, 57–77. [Google Scholar] [CrossRef]
  44. Khasanah, N.; van Noordwijk, M. Subsidence and Carbon Dioxide Emissions in a Smallholder Peatland Mosaic in Sumatra, Indonesia. Mitig. Adapt. Strateg. Glob. Change 2019, 24, 147–163. [Google Scholar] [CrossRef] [PubMed]
  45. Castellanos-Navarrete, A.; Tobar-Tomás, W.V.; López-Monzón, C.E. Development without Change: Oil Palm Labour Regimes, Development Narratives, and Disputed Moral Economies in Mesoamerica. J. Rural Stud. 2019, 71, 169–180. [Google Scholar] [CrossRef]
  46. Hiraishi, T.; Krug, T.; Tanabe, K.; Srivastava, N.; Baasansuren, J.; Fukuda, M.; Troxler, T.G. (Eds.) IPCC 2013 Supplement to the 2006 IPCC Guidelines for National Greenhouse Gas Inventories: Wetlands; IPCC: Geneva, Switzerland, 2014. [Google Scholar]
  47. YKHI. Studi Rantai Pasok TBS Petani Kelapa Sawit Swadaya; Yayasan Keanekaragaman Hayati Indonesia: Jakarta, Indonesia, 2019. [Google Scholar]
  48. Harahap, F.; Silveira, S.; Khatiwada, D. Cost Competitiveness of Palm Oil Biodiesel Production in Indonesia. Energy 2019, 170, 62–72. [Google Scholar] [CrossRef]
  49. Simangunsong, B.C.H.; Fidela; Sitanggang, V.J.; Manurung, E.G.T.; Tambunan, A.H. Economic Value of Fresh Fruit Bunch from Oil Palm Plantation as Feedstock for Bioenergy in Indonesia. J. Jpn. Inst. Energy 2019, 98, 144–148. [Google Scholar] [CrossRef]
  50. MPOB Malaysia Prices of Crude Palm Oil 2023, Malaysian Palm Oil Board. Available online: https://bepi.mpob.gov.my/admin2/price_local_daily_view_cpo_msia.php?more=Y&jenis=1Y&tahun=2023 (accessed on 17 December 2024).
  51. Disbun Riau Harga TBS 2023, Dinas Perkebunan Riau. Available online: https://disbun.riau.go.id/rekap_harga_tbs (accessed on 17 December 2024).
  52. Carletto, C.; Gourlay, S.; Murray, S.; Zezza, A. Land Area Measurement in Household Surveys: Empirical Evidence and Practical Guidance for Effective Data Collection; World Bank: Washington, DC, USA, 2024. [Google Scholar]
  53. de Vos, R.E.; Nurfalah, L.; Tenorio, F.A.; Lim, Y.L.; Monzon, J.P.; Donough, C.R.; Sugianto, H.; Dwiyahreni, A.A.; Winarni, N.L.; Mulani, N.; et al. Shortening Harvest Interval, Reaping Benefits? A Study on Harvest Practices in Oil Palm Smallholder Farming Systems in Indonesia. Agric. Syst. 2023, 211, 103753. [Google Scholar] [CrossRef]
  54. Beegle, K.; Carletto, C.; Himelein, K. Reliability of Recall in Agricultural Data. J. Dev. Econ. 2012, 98, 34–41. [Google Scholar] [CrossRef]
  55. Kosmowski, F.; Chamberlin, J.; Ayalew, H.; Sida, T.; Abay, K.; Craufurd, P. How Accurate Are Yield Estimates from Crop Cuts? Evidence from Smallholder Maize Farms in Ethiopia. Food Policy 2021, 102, 102122. [Google Scholar] [CrossRef] [PubMed]
  56. Rennert, K.; Errickson, F.; Prest, B.C.; Rennels, L.; Newell, R.G.; Pizer, W.; Kingdon, C.; Wingenroth, J.; Cooke, R.; Parthum, B.; et al. Comprehensive Evidence Implies a Higher Social Cost of CO2. Nature 2022, 610, 687–692. [Google Scholar] [CrossRef] [PubMed]
  57. Tol, R.S.J. Social Cost of Carbon Estimates Have Increased over Time. Nat. Clim. Change 2023, 13, 532–536. [Google Scholar] [CrossRef]
  58. Couwenberg, J.; Hooijer, A. Towards Robust Subsidence-Based Soil Carbon Emission Factors for Peat Soils in South-East Asia, with Special Reference to Oil Palm Plantations. Mires Peat 2013, 12, 1–13. [Google Scholar]
  59. Evans, C.D.; Callaghan, N.; Jaya, A.; Grinham, A.; Sjogersten, S.; Page, S.E.; Harrison, M.E.; Kusin, K.; Kho, L.K.; Ledger, M.; et al. A Novel Low-Cost, High-Resolution Camera System for Measuring Peat Subsidence and Water Table Dynamics. Front. Environ. Sci. 2021, 9, 630752. [Google Scholar] [CrossRef]
  60. Mankong, P.; Fantke, P.; Ghose, A.; Soheilifard, F.; Oginah, S.A.; Phenrat, T.; Mungkalasiri, J.; Gheewala, S.H.; Prapaspongsa, T. Assessing Life Cycle Impacts from Toxic Substance Emissions in Major Crop Production Systems in Thailand. Sustain. Prod. Consum. 2024, 46, 717–732. [Google Scholar] [CrossRef]
  61. Boschiero, M.; De Laurentiis, V.; Caldeira, C.; Sala, S. Comparison of Organic and Conventional Cropping Systems: A Systematic Review of Life Cycle Assessment Studies. Environ. Impact Assess. Rev. 2023, 102, 107187. [Google Scholar] [CrossRef]
  62. Yusuf, M.A.; Romli, M.; Suprihatin, S.; Wiloso, E.I. Carbon Footprint of Semi-Mechanical Sago Starch Production. J. Ecol. Eng. 2019, 20, 159–166. [Google Scholar] [CrossRef]
  63. van der Werf, H.M.G.; Knudsen, M.T.; Cederberg, C. Towards Better Representation of Organic Agriculture in Life Cycle Assessment. Nat. Sustain. 2020, 3, 419–425. [Google Scholar] [CrossRef]
  64. Hein, L.; Sumarga, E.; Quiñones, M.; Suwarno, A. Effects of Soil Subsidence on Plantation Agriculture in Indonesian Peatlands. Reg. Environ. Change 2022, 22, 121. [Google Scholar] [CrossRef]
  65. Sumarga, E.; Hein, L.; Hooijer, A.; Vernimmen, R. Hydrological and Economic Effects of Oil Palm Cultivation in Indonesian Peatlands. Ecol. Soc. 2016, 21, 52. [Google Scholar] [CrossRef]
  66. Taufik, M.; Setiawan, B.I.; Van Lanen, H.A. Increased Fire Hazard in Human-Modified Wetlands in Southeast Asia. Ambio 2019, 48, 363–373. [Google Scholar] [CrossRef] [PubMed]
  67. Wösten, J.H.M.; Van Den Berg, J.; Van Eijk, P.; Gevers, G.; Giesen, W.; Hooijer, A.; Idris, A.; Leenman, P.; Rais, D.S.; Siderius, C. Interrelationships between Hydrology and Ecology in Fire Degraded Tropical Peat Swamp Forests. Water Resour. Dev. 2006, 22, 157–174. [Google Scholar] [CrossRef]
  68. Hein, L.; Spadaro, J.V.; Ostro, B.; Hammer, M.; Sumarga, E.; Salmayenti, R.; Boer, R.; Tata, H.; Atmoko, D.; Castañeda, J.-P. The Health Impacts of Indonesian Peatland Fires. Environ. Health 2022, 21, 62. [Google Scholar] [CrossRef]
  69. Kiely, L.; Spracklen, D.V.; Arnold, S.R.; Papargyropoulou, E.; Conibear, L.; Wiedinmyer, C.; Knote, C.; Adrianto, H.A. Assessing Costs of Indonesian Fires and the Benefits of Restoring Peatland. Nat. Commun. 2021, 12, 7044. [Google Scholar] [CrossRef]
  70. Newby, J.; Smith, D.; Cramb, R.; Delaquis, E.; Yadav, L. Cassava Value Chains and Livelihoods in South-East Asia; ACIAR Proceedings Series, No. 148; Australian Centre for International Agricultural Research: Canberra, Australia, 2020; p. 114.
  71. Budidarsono, S.; Rahmanulloh, A.; Sofiyuddin, M. Economics Assessment of Palm Oil Production; Palm Oil Series; World Agroforestry Centre (ICRAF): Bogor, Indonesia, 2012; p. 6. [Google Scholar]
  72. Trisia, M.A.; Tachikawa, M.; Ehara, H. The Role of the Sago Supply Chain for Rural Development in Indonesia: A Review and Perspective. Rev. Agric. Sci. 2021, 9, 143–156. [Google Scholar] [CrossRef]
  73. Yamamoto, Y.; Yoshida, T.; Goto, Y.; Nitta, Y.; Kakuda, K.; Jong, F.S.; Hilary, L.B.; Hassan, A.H. Differences in Growth and Starch Yield of Sago Palms (Metroxylon Sagu Rottb.) among Soil Types in Sarawak, Malaysia. Jpn. J. Trop. Agric. 2003, 47, 250–259. [Google Scholar]
  74. Euler, M.; Hoffmann, M.P.; Fathoni, Z.; Schwarze, S. Exploring Yield Gaps in Smallholder Oil Palm Production Systems in Eastern Sumatra, Indonesia. Agric. Syst. 2016, 146, 111–119. [Google Scholar] [CrossRef]
  75. Adriani, D.; Yazid, M.; Riswani; Damayanthy, D.; Choi, E.; Yang, H. Livelihood Alternatives in Restored Peatland Areas in South Sumatra Province, Indonesia. Land 2024, 13, 643. [Google Scholar] [CrossRef]
  76. FAO. Beje Aquaculture and Inland Fishery in Tropical Peatland of Indonesia; Mitigation of Climate Change in Agriculture (MICCA) Programme of FAO; Food and Agriculture Organization of the United Nations: Rome, Italy, 2016. [Google Scholar]
  77. do Val Siqueira, L.; Arias, C.I.L.F.; Maniglia, B.C.; Tadini, C.C. Starch-Based Biodegradable Plastics: Methods of Production, Challenges and Future Perspectives. Curr. Opin. Food Sci. 2021, 38, 122–130. [Google Scholar] [CrossRef]
  78. Satya, A.; Amalia, A.; Armanto, A.N.; Mutaqin, D.J.; Afriyanti, D.; Priyanto, E.B.; Prasetio, H.; Nasution, M.I.; Lusiana, S.; Gumilang, R.S. National Strategy on Wetland Management: Peatland Ecosystems and Mangroves; Ministry of National Development Planning of the Republic of Indonesia: Jakarta, Indonesia, 2022.
  79. Henning, F.G.; Ito, V.C.; Demiate, I.M.; Lacerda, L.G. Non-Conventional Starches for Biodegradable Films: A Review Focussing on Characterisation and Recent Applications in Food Packaging. Carbohydr. Polym. Technol. Appl. 2022, 4, 100157. [Google Scholar] [CrossRef]
  80. Seung, D. Amylose in Starch: Towards an Understanding of Biosynthesis, Structure and Function. New Phytol. 2020, 228, 1490–1504. [Google Scholar] [CrossRef]
  81. Jha, P.; Dharmalingam, K.; Nishizu, T.; Katsuno, N.; Anandalakshmi, R. Effect of Amylose–Amylopectin Ratios on Physical, Mechanical, and Thermal Properties of Starch—based Bionanocomposite Films Incorporated with CMC and Nanoclay. Starch—Stärke 2020, 72, 1900121. [Google Scholar] [CrossRef]
  82. Karim, A.A.; Tie, A.P.L.; Manan, D.M.A.; Zaidul, I.S.M. Starch from the Sago (Metroxylon Sagu) Palm Tree—Properties, Prospects, and Challenges as a New Industrial Source for Food and Other Uses. Compr. Rev. Food Sci. Food Saf. 2008, 7, 215–228. [Google Scholar] [CrossRef]
  83. Ahmad, F.B.; Williams, P.A.; Doublier, J.-L.; Durand, S.; Buleon, A. Physico-Chemical Characterisation of Sago Starch. Carbohydr. Polym. 1999, 38, 361–370. [Google Scholar] [CrossRef]
  84. Ismail, H.; Zaaba, N. Effect of Unmodified and Modified Sago Starch on Properties of (Sago Starch)/Silica/PVA Plastic Films. J. Vinyl Addit. Technol. 2014, 20, 185–192. [Google Scholar] [CrossRef]
  85. Sistem Informasi Pengelolaan Sampah Nasional, National Waste Management Information System. Available online: https://sipsn.menlhk.go.id/sipsn/ (accessed on 1 November 2024).
  86. Global Plastic Action Partnership and National Plastic Action Partnership. Radically Reducing Plastic Pollution in Indonesia: A Multistakeholder Action Plan; World Economic Forum: Cologny, Switzerland; Geneva, Switzerland, 2020. [Google Scholar]
  87. Cordova, M.R.; Nurhati, I.S. Major Sources and Monthly Variations in the Release of Land-Derived Marine Debris from the Greater Jakarta Area, Indonesia. Sci. Rep. 2019, 9, 18730. [Google Scholar] [CrossRef]
  88. Purba, N.P.; Faizal, I.; Christie, D.; Pratama, M.B.; Valino, D.A.; Martasuganda, M.K.; Herawati, T.; Wulandari, A.; Utami, S.T.; Aryanto, N.C.D.; et al. Mapping the Sources and Strands of Marine Debris via Particle Modelling and In-Situ Sampling Approaches in Archipelagic Countries. Sci. Rep. 2024, 14, 25804. [Google Scholar] [CrossRef] [PubMed]
  89. Dohong, A.; Abdul Aziz, A.; Dargusch, P. A Review of Techniques for Effective Tropical Peatland Restoration. Wetlands 2018, 38, 275–292. [Google Scholar] [CrossRef]
  90. Kalhori, A.; Wille, C.; Gottschalk, P.; Li, Z.; Hashemi, J.; Kemper, K.; Sachs, T. Temporally Dynamic Carbon Dioxide and Methane Emission Factors for Rewetted Peatlands. Commun. Earth Environ. 2024, 5, 62. [Google Scholar] [CrossRef]
  91. Afriyanti, D.; Hein, L.; Kroeze, C.; Zuhdi, M.; Saad, A. Scenarios for Withdrawal of Oil Palm Plantations from Peatlands in Jambi Province, Sumatra, Indonesia. Reg. Environ. Change 2019, 19, 1201–1215. [Google Scholar] [CrossRef]
  92. Winrock Protecting Peatlands While Shifting Toward Sustainable Palm Oil Production. Available online: https://winrock.org/protecting-peatlands-while-shifting-toward-sustainable-palm-oil-production/ (accessed on 28 July 2025).
  93. GEF Working Together to Conserve the Irreplaceable Peat Forests of Borneo. Available online: https://www.thegef.org/newsroom/feature-stories/working-together-conserve-irreplaceable-peat-forests-borneo (accessed on 28 July 2025).
  94. Zulkamaini, Z.; Nasution, M.S.; Rinto, R.; Meiwanda, G.; Bedasari, H. Public Private Partnerships in Peatland Management: A Design for Sustainable Practices; EDP Sciences: Les Ulis, France, 2024; Volume 506, p. 08001. [Google Scholar] [CrossRef]
  95. Miller, M.A.; Tonoto, P.; Taylor, D. Sustainable Development of Carbon Sinks? Lessons from Three Types of Peatland Partnerships in Indonesia. Sustain. Dev. 2022, 30, 241–255. [Google Scholar] [CrossRef]
  96. Anshari, G.Z.; Gusmayanti, E.; Afifudin, M.; Ruwaimana, M.; Hendricks, L.; Gavin, D.G. Carbon Loss from a Deforested and Drained Tropical Peatland over Four Years as Assessed from Peat Stratigraphy. Catena 2022, 208, 105719. [Google Scholar] [CrossRef]
  97. Mishra, S.; Page, S.E.; Cobb, A.R.; Lee, J.S.H.; Jovani-Sancho, A.J.; Sjögersten, S.; Jaya, A.; Aswandi; Wardle, D.A. Degradation of Southeast Asian Tropical Peatlands and Integrated Strategies for Their Better Management and Restoration. J. Appl. Ecol. 2021, 58, 1370–1387. [Google Scholar] [CrossRef]
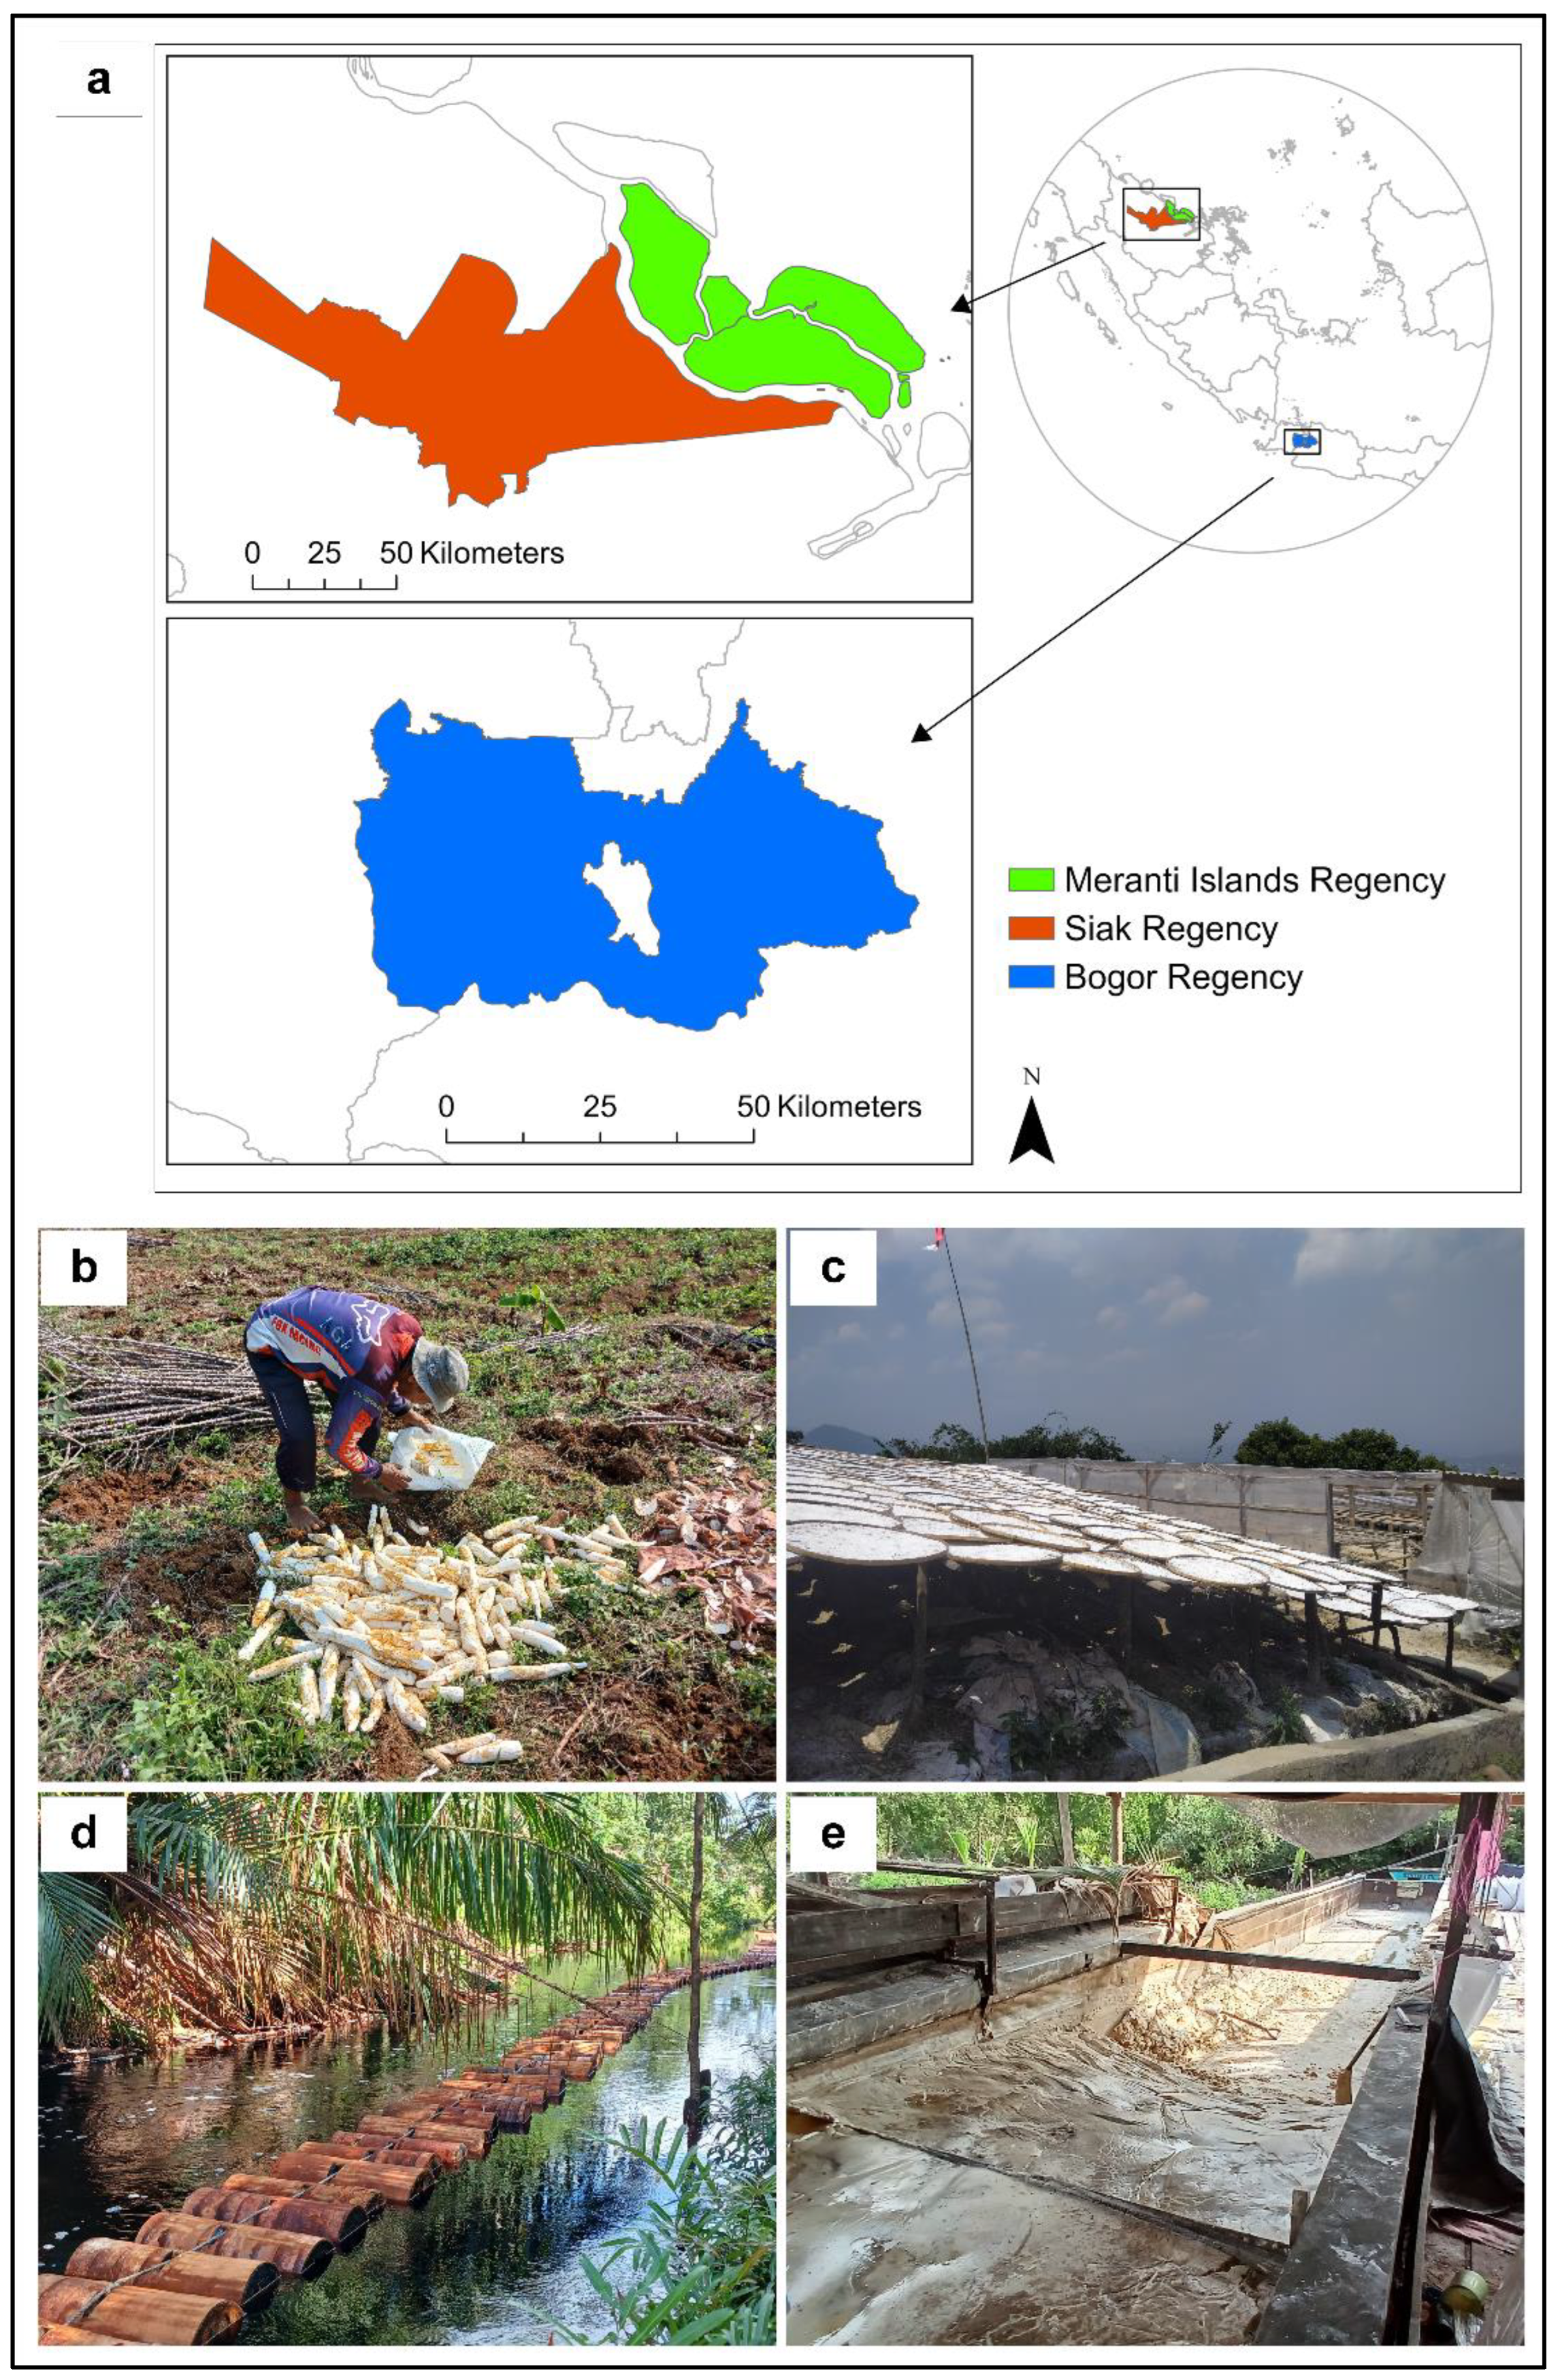
Figure 1. Case study locations and starch production systems in this study. (a) Case study locations; (b) harvested and peeled cassava on the farm; (c) traditional cassava sun-drying; (d) sago logs rafted to a mill via the canal; (e) wet sago starch in the starch collection tank.
Sustainability 17 07351 g001
Figure 2. Input and output data on cultivation included in the analysis.
Sustainability 17 07351 g002
Figure 3. Farm-level cumulative discounted benefits. (a,b) The baseline farm-level benefits, (c) the farm-level benefits when government subsidies were excluded for mineral crops, and (d) the benefits received by sago farmers when they rented the mill and sold starch instead of sago logs compared with oil palm cultivation.
Sustainability 17 07351 g003
Figure 4. Net societal benefits per ha of crop, combining benefits at the farm level (without subsidies), the value added of the final product, and the social costs of carbon (SC-CO2).
Sustainability 17 07351 g004
Figure 5. Sago and oil palm cultivation within optimum yield scenarios. ‘Mature sago’ refers to a mature plantation with productive sago palms, while ‘New sago’ refers to newly planted sago palms. O50 denotes a scenario with 50% optimum yield, and O90 denotes a scenario with 90% optimum yield. For oil palm, only the newly planted palms within the 90% optimum yield scenario (oil palm, O90) are included, as current productivity already exceeds the 50% (O50) threshold.
Sustainability 17 07351 g005
Table 1. Average annual revenues and costs at the farm level based on input and output data of all crops (EUR/ha).
Revenue or CostCassavaCornSago **Oil Palm **
abab
Revenues1905.21905.23085.53085.5887.31346.3
Fixed costs
Land clearing or preparation287.6287.6127.5 *248.81.3 ***16.9 ***
Tool14.714.714.6 *15.63.75.8
Membership0011.6000
Tool maintenance000003.4
Land rental73.073.0120.4120.400
Variable costs
Seed/seedling + planting70.170.130.6 *215.22.3 ***17.6 ***
Fertilizer330.7 *532.0286.9 *912.80205.7
Pesticide29.529.579.3 *101.1050.6
Maintenance labor215.0215.0230.2230.229.2193.2
Harvesting + post-harvesting00500.2500.2119.2233.7
Fuel0045.945.900
Transport0084.884.800
Note: Cassava and corn farmers greatly benefited from subsidies, as shown in column a. Column b shows non-subsidized costs. * Subsidized inputs. ** The inputs and outputs for sago and oil palm differ annually depending on age. The values provided here are average values across all farms at varied crop ages. *** Land clearing and Seedling + planting costs for sago and oil palm were incurred only in the first year of the planting cycle and depreciated or amortized over the respective crop cycles.
Table 2. Annual GHG emissions from fertilizer use and peat oxidation, and the corresponding SC-CO2 values from all crop production.
Emissions SourceUnitCassavaCornSagoOil Palm
Manuret CO2eq/ha0.51.000.0
Ureat CO2eq/ha1.52.300.5
NPKt CO2eq/ha0.20.800.2
Dolomitet CO2eq/ha0000.1
Peat oxidationt CO2eq/ha--2.248.6
Total emissionst CO2eq/ha2.23.62.249.5
SC-CO2EUR/ha95.1174.391.72105.0
Table 3. Costs and revenues in value-added analysis.
Initial Costs Fixed CostsVariable CostsOutputReference
Cassava starch processing
BuildingEUR15,170Fuel and maintenanceEUR/year615Cassava inputkg/year480,000Starch outputkg/year120,000This study
Washing machineEUR152Starch transportEUR/year1129Cassava priceEUR/kg0.10Starch priceEUR/kg0.55
Rasping and sieving machinesEUR379 Mill’s operationEUR/year4733
Grinding machineEUR440 Cassava peeling and carryingEUR/year7565
WhitenerEUR/year328
Starch bagEUR/year386
Sago starch processing
Building, machinesEUR15,777MaintenanceEUR/year728Sago log inputtrunk/year2808Wet starch outputkg/year640,224This study
Mill operationEUR/year6022Sago log costEUR/trunk24.43Wet starch priceEUR/kg0.18
FuelEUR/year2314Wet starch transportEUR/year1942
Rental scenario costEUR/year10,295
Log peelingEUR/year2726
Log handlingEUR/year1363
Wet starch packingEUR/year2758
CPO processing
Building, machinesEUR5,662,830Production costsEUR/year2,461,485FFB inputkg/year150,000,000CPO outputkg/year36,000,000[48,49,50,51]
FFB costEUR/kg0.14CPO priceEUR/kg0.78
PK outputkg/year7,050,000
PK priceEUR/kg0.33
FFB collection and transport
Operation and maintenanceEUR/year30FFB quantitykg/year15,426FFB selling priceEUR/kg0.14[39]
Transport costsEUR/year84FFB buying priceEUR/kg0.09
Disclaimer/Publisher’s Note: The statements, opinions and data contained in all publications are solely those of the individual author(s) and contributor(s) and not of MDPI and/or the editor(s). MDPI and/or the editor(s) disclaim responsibility for any injury to people or property resulting from any ideas, methods, instructions or products referred to in the content.