Article

Coordinative Scheduling Method for Source–Load–Storage Integrated Systems Considering the Utilization of Energy-Intensive Industry Loads for Regulation

1
Economic and Technological Research Institute, State Grid Xinjiang Electric Power Co., Ltd., Urumqi 830002, China
2
School of Electric Power Engineering, Xinjiang University, Urumqi 830017, China
*
Author to whom correspondence should be addressed.
Sustainability 2025, 17(16), 7321; https://doi.org/10.3390/su17167321
Submission received: 25 May 2025 / Revised: 10 August 2025 / Accepted: 11 August 2025 / Published: 13 August 2025

Abstract

With the increasing penetration of renewable energy in power systems, it is vital to adopt methods to enhance the acceptance capacity of renewable energy. Energy-intensive loads have excellent potential for regulating the utilization of renewable energy. Existing studies have often overlooked the regulatory potential of energy-intensive industrial loads. The coordinated optimization of source, load, and storage can improve the matching degree between power supply and load demand and achieve on-site consumption of renewable energy. This paper proposes a coordinated optimization method for source–load–storage integrated systems, utilizing for regulation energy-intensive industrial loads such as electrolytic aluminum load and polysilicon load. The operational characteristics and regulatory ability of electrolytic aluminum load and polysilicon load were analyzed in the production process. Operation models of energy-intensive loads are proposed. A coordinated operation model of a source–load–storage integrated system is established. The operation schemes of thermal units, energy storage, and energy-intensive loads are jointly optimized to guarantee power supply capacity and renewable energy consumption. In addition, power purchase from the bulk power system and the time-of-use electricity price are considered to ensure a reliable power supply for energy-intensive loads. The case results showed that on the premise of ensuring that the production meets the requirements, the flexibility and economy of system operation were effectively improved. Reasonably rated power and capacity for the energy storage system can improve the regulation ability and reduce the operating costs of regional systems.

1. Introduction

The path of green and sustainable energy has become a worldwide development trend. In 2021, China proposed the “dual carbon goals” of achieving a carbon peak by 2030 and carbon neutrality by 2060. Many countries, such as the United States and the United Kingdom, have set development goals to achieve zero carbon emissions by 2050. In recent years, the deployment of zero-carbon technologies such as renewable energy generation, electric vehicles, and green hydrogen has significantly accelerated. To achieve the “dual carbon goals”, China is promoting the construction of a new power system with renewable energy as the main component [1]. In China, the installed capacity of wind and photovoltaic power reached 521 gigawatts (GW) and 887 GW, respectively, by the end of 2024. With the increasing penetration rate of intermittent renewable power in the power system, the demand for regulation capabilities in power systems from both the supply and demand ends is gradually increasing. The source–load–storage integrated system in industrial parks rich in renewable energy is an effective way to promote the transformation of regional energy structures [2]. Renewable energy can be consumed on-site. In this context, the full utilization of the flexible resources in the source–load–storage integrated system is vital to achieving efficient consumption of renewable energy and economic operation.
Many studies have been conducted on the characteristics of load regulation and participation in demand response. Load users can utilize their regulation capacity to participate in the demand response. Combined with the conventional units and energy storage, the flexibility resources can reduce the peak valley difference of net load and broaden the space for renewable energy consumption [3]. In [4], a demand-side response method considering the shifting characteristics was proposed and embedded in a scheduling model. The incentive-based demand side can adjust the load demand to reduce the fluctuation of the net load. To promote the participation of the distributed users in demand response, a scheduling method was proposed to optimize the load demand plan and increase the users’ benefits in [5]. In [6], an optimization method for a distribution network was proposed to formulate a demand response plan and mitigate the influence of intermittent generation. Compared with conventional loads, energy-intensive enterprise can consume massive amounts of electricity and has significant advantages in terms of scale. Therefore, energy-intensive enterprise loads have a strong ability to participate in demand response and can coordinate with energy storage and generators to improve the adjustability of a system [7]. In [8], the flexibility of typical energy-intensive loads, including cement production and electrolytic aluminum, was analyzed, and these industry loads were utilized to provide ancillary services for the power system. The current control method for electrolytic aluminum smelter loads was proposed to support the primary frequency regulation of the power system in [9]. Considering the operational characteristics of aluminum smelter load, a power system scheduling model was formulated to coordinate industrial load and energy storage to accommodate renewable energy in [10]. In [11], a scenario-based stochastic dispatch model was established to utilize the adjustment capacity of industry load and energy storage to reduce the curtailment of wind generation and keep the operation of the power supply reliable. A robust unit commitment considering two types of energy-intensive loads was established in [12]. In [13,14], a source–load collaborative day-ahead scheduling method was proposed to fully utilize the regulation characteristics of electrolytic aluminum load. In addition, the industry load and thermal units were jointly optimized to enhance the utilization level of renewable energy. Electric arc furnace production can control the electrode current, and it is also a typical adjustable industrial load. In [15,16], an electric arc furnace operation model was established to depict the regulation capacity of such furnaces. The above studies analyzed the operating characteristics of typical energy-intensive loads, such as electrolytic aluminum and electric arc furnaces, and explored their regulation capacity. However, the above studies focused on the perspective of the bulk power system, achieving supply–demand balance through long-distance transmission, which makes it difficult to achieve nearby consumption of renewable energy. Compared with large-scale power systems, source–load–storage integrated systems can achieve precise matching between supply and demand for on-site consumption of wind power and photovoltaic power. However, there is still a lack of research on the coordinative scheduling of source–load–storage integrated systems that combine energy-intensive loads with other flexibility resources.
Wind power and photovoltaics can be integrated with a power system through centralized large-scale stations or distributed small-scale power sources. For the utilization of renewable energy, one mode is connecting to the bulk power system for large-scale and long-distance transmission, and the other is the establishment of a regionally integrated power system to achieve on-site consumption. Source–load–storage integrated regional systems have been established in China. This paper focuses on source–load–storage integrated regional systems with energy-intensive loads, including electrolytic aluminum and polysilicon. Compared with microgrids, source–load–storage integrated systems have the characteristics of high levels of source–load matching and high proportions of renewable energy. By optimizing the regulation of resources within the system, maximum local utilization of clean energy can be achieved. In [17], a distributionally robust optimization model for an electric–hydrogen–ammonia–methanol coupling system was established to utilize renewable energy to produce hydrogen and ammonia products. An optimization model considering the adjustment characteristic of the iron and steel industry was established in [18]. In [19], conventional generators, energy storage, and renewable energy were coordinated to maintain the load demand of aluminum smelters. In [20], an optimization planning model for the energy base was established to obtain increased capacity of thermal units, renewable generation, and energy storage. In addition, the flexibility of coal-to-methanol production was considered in [20]. In [21,22], conventional units, renewable energy, and energy storage were jointly optimized to supply industrial loads and interact with the bulk grid. Meanwhile, time-of-use electricity prices could be utilized to motivate the industrial park to participate in system operations and increase profits. Electrolytic aluminum load was utilized to smooth the volatility of wind generation in [23]. The frequency control method was proposed for an isolated industrial power system in [24]. In [25,26], a control strategy for energy-intensive load was proposed to improve the utilization level of wind generation. The above studies researched optimization methods for isolated regional power systems to achieve localized utilization of renewable energy. The source–load–storage integrated regional system is facing significant pressure in the consumption of renewable energy. Polysilicon load is a typical energy-intensive load, and the existing literature mainly focuses on the regulation ability of electrolytic aluminum load to improve system flexibility. However, there is little research on the coordination of polysilicon load and electrolytic aluminum load. On the other hand, specific research has yet to identify the joint mechanisms for conventional units, energy storage, and multiple energy-intensive loads, which makes it difficult to ensure the economic efficiency of the regional system power demand while improving efficiency.
In summary, this paper proposes a day-ahead coordinated scheduling method for source–load–storage integrated systems with energy-intensive loads. The operational flexibility of energy-intensive loads is formulated to characterize the regulation ability of these loads. A joint optimization model is established to improve the coordination level of flexibility resources and ensure a reliable power supply. The main contributions in this paper are summarized as follows.
On the one hand, a flexible operation model of energy-intensive loads is established, including the electrolytic aluminum loads and polysilicon loads. The flexibility in the load side can be utilized to improve the consumption capacity of renewable energy. Compared with [26,27], the hydrogen consumption characteristics of the polysilicon production load are considered. Through the combination of wind–solar–thermal–storage and support from the bulk power system, the power reliability of energy-intensive loads can be guaranteed while the system operating costs are reduced and the system’s operating efficiency is improved. On the other hand, a collaborative scheduling model is established that combines multiple flexible resources. Considering the comprehensive cost, the model optimizes the day-ahead operation schemes of energy-intensive loads, thermal units, renewable energy, energy storage, and electricity purchase. Hydrogen production is optimized to satisfy the hydrogen demand of energy-intensive loads and smooth the fluctuation of the net load. Electrical and hydrogen energy storage are utilized to smooth the fluctuation of renewable energy. Power purchase and time-of-use price are considered in the proposed model to strengthen the power supply capacity and operational economy.
The rest of this paper is organized as follows. Section 2 formulates the operation model of the energy-intensive loads. In Section 3, a coordinated optimization model of the source–load–storage integrated system is established. Case studies are shown in Section 4. Conclusions are given in Section 5.

2. Operation Model of Energy-Intensive Loads

2.1. Operating Framework

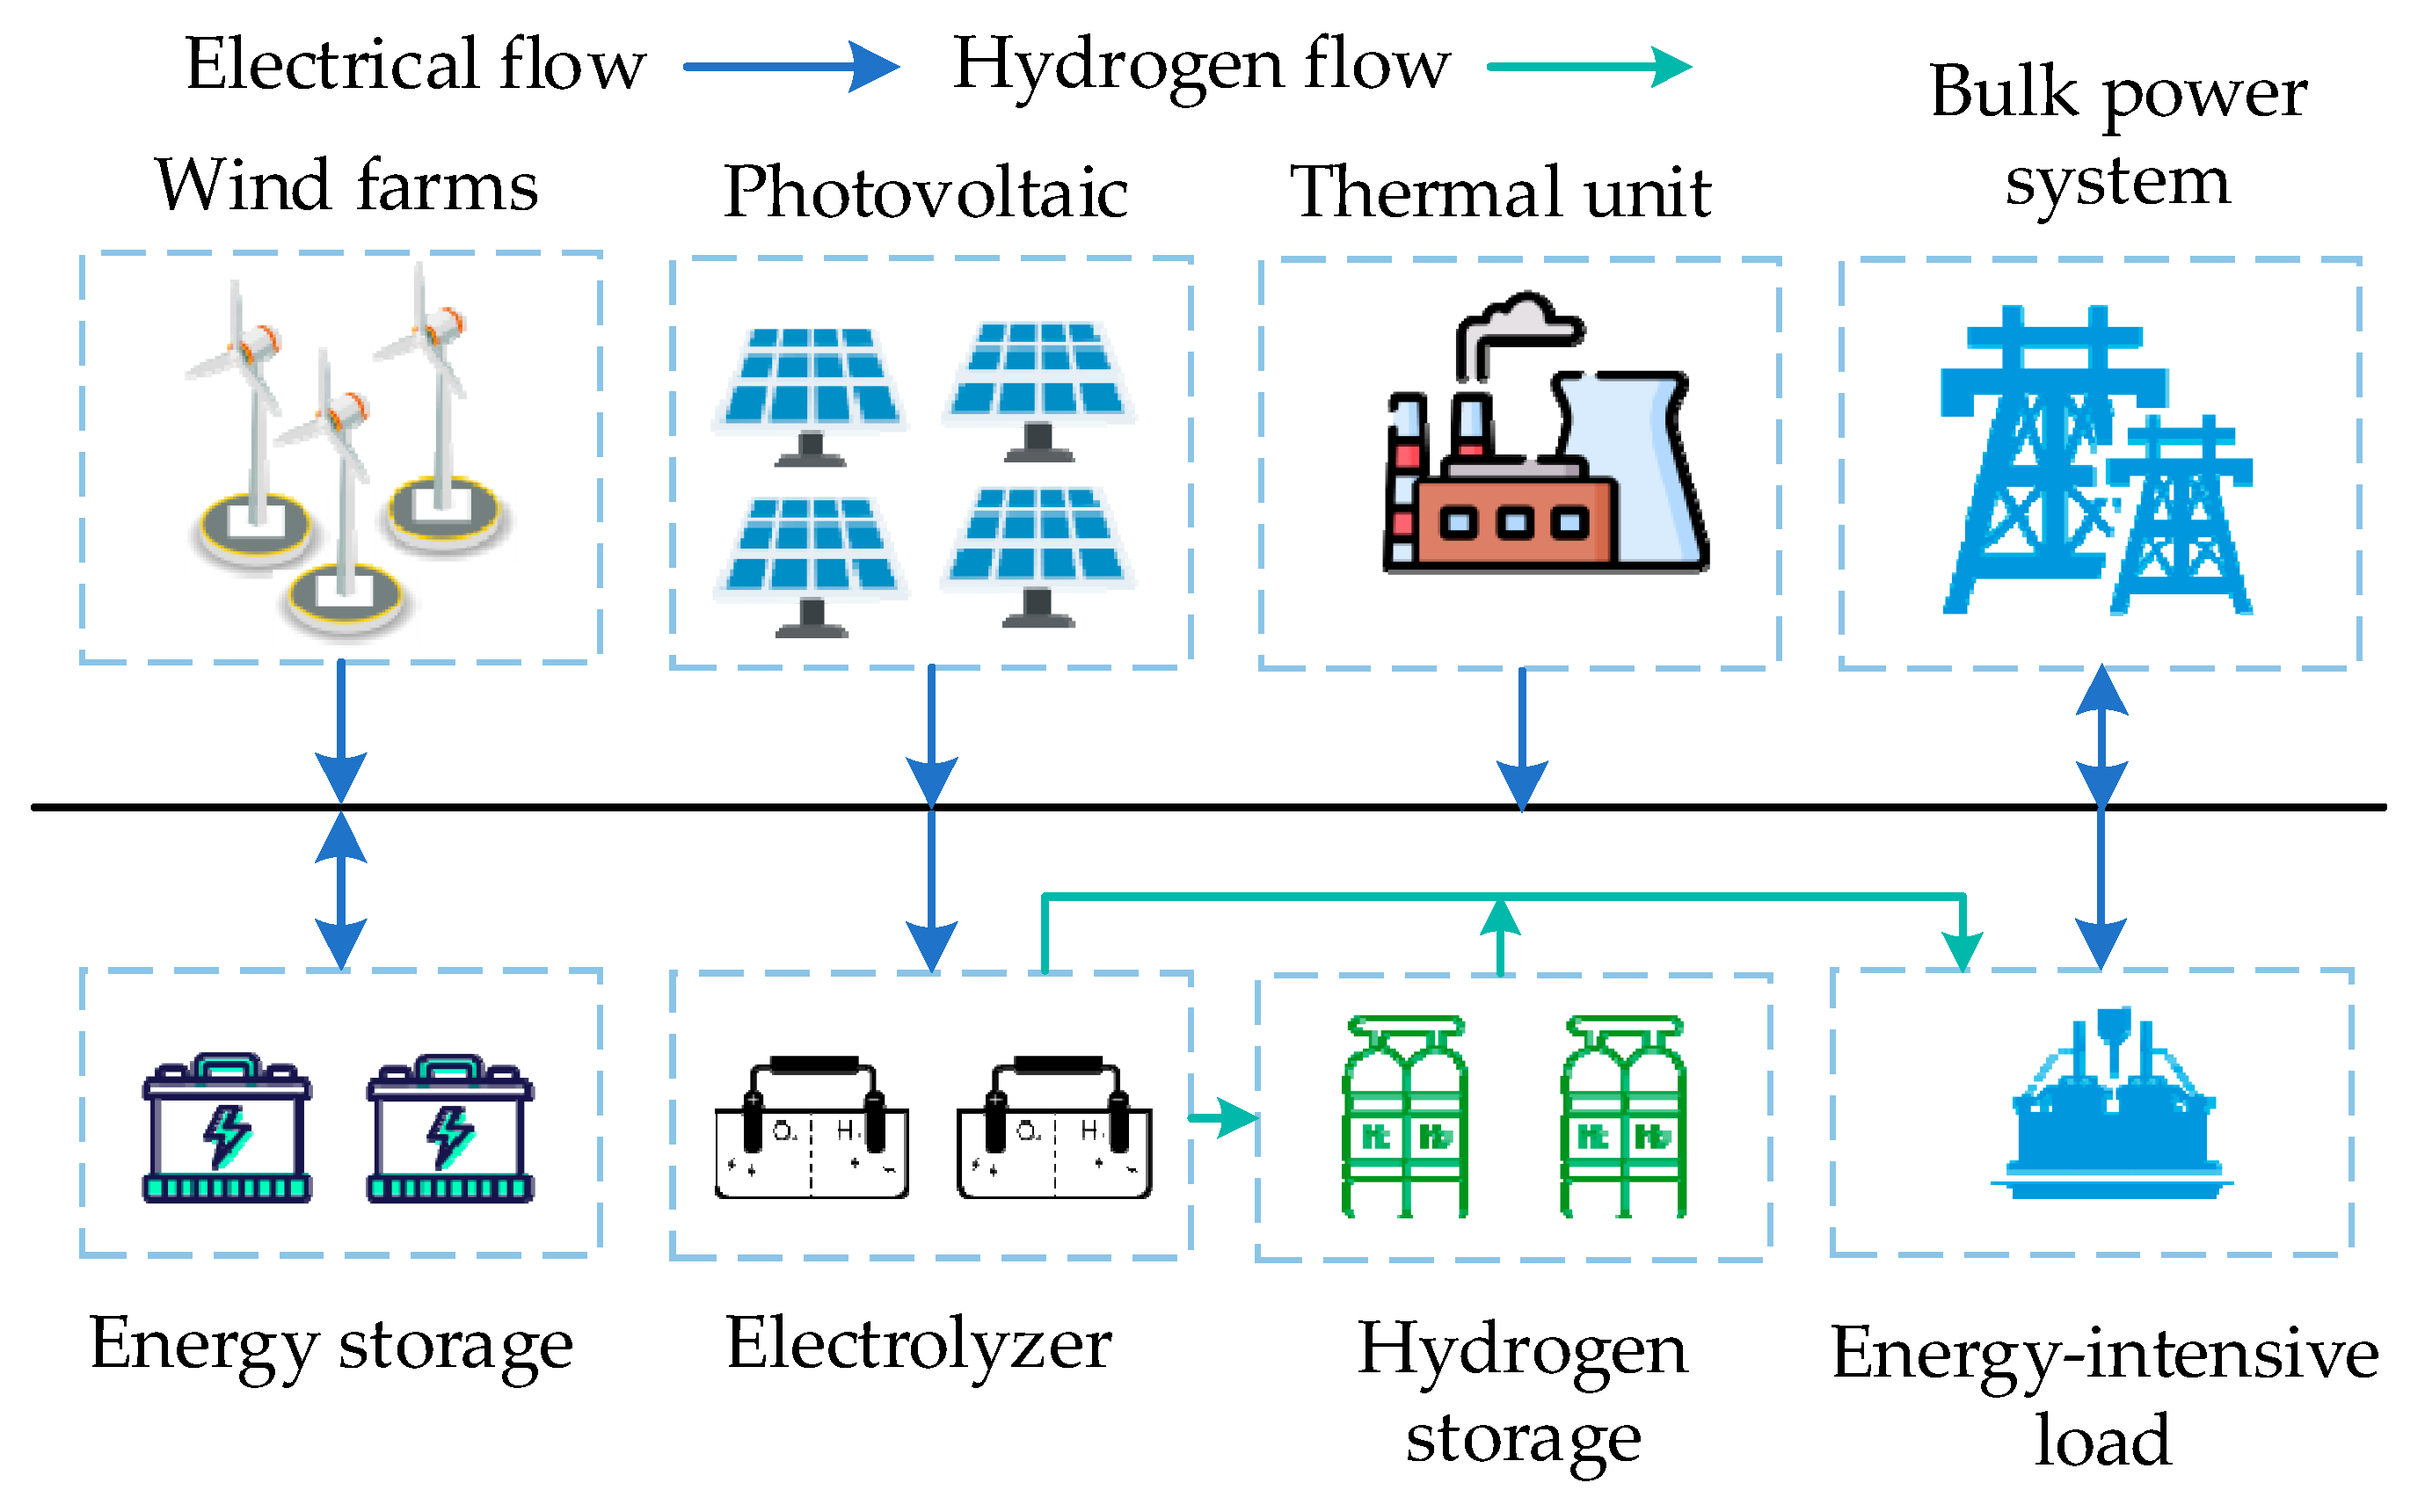
The operation framework is depicted in Figure 1. The regional system includes electrolytic aluminum plants, polysilicon plants, wind farms, photovoltaic cells, thermal units, electrical energy storage, electrolytic cells, and hydrogen energy storage. In addition, it is connected to the bulk power grid through transmission lines. Renewable energy and thermal power units jointly meet the electricity load demand, and the system can purchase electricity from the power grid. Hydrogen production and storage equipment meet the demand for polysilicon load. Meanwhile, surplus hydrogen can be sold for profit. By adjusting the operation plan of energy-intensive loads, the energy consumption can be adjusted to respond to system regulation needs and enhance system operational flexibility.

2.2. Operating Model of Polysilicon Loads

With the rapid development of photovoltaic generation, the demand for polysilicon used in the photovoltaic industry is growing rapidly. Polysilicon production has high power consumption and stable load demand, making it a typical energy-intensive load. At present, the production of polysilicon mostly adopts the improved Siemens method, which requires the consumption of hydrogen gas during the production process. Traditional polysilicon enterprises mainly produce hydrogen through their self-owned power plants and electricity purchase. To effectively reduce carbon emissions and hydrogen production costs, this paper mainly uses renewable energy to produce green hydrogen.
1.
Power consumption constraints for polysilicon load
The production of the reduction furnace in polysilicon load is the main part of electricity consumption, and the remaining part is considered as the auxiliary operating load.
P t SI = n = 1 N SI x n , t SI ( P n , t SI , res + P n , t SI , other )
where x n , t SI is the state variable of the reduction furnace in the polysilicon load, with 1 indicating that the reduction furnace is working during period t; P n , t SI , res and P n , t SI , other are the power demand of the reduction furnace n and auxiliary equipment, respectively; and N SI is the number of reduction furnaces for the polysilicon load.
2.
Operating status constraints
Equation (2) represents the relationship between the working state of the reduction furnace and the variables of start-up and shutdown. Equations (3) and (4) represent the minimum operating time and minimum shutdown time limits of the reduction furnace. Equation (5) represents the constraint on the start-up sequence of the reduction furnace.
x n , t SI x n , t 1 SI = u n , t SI v n , t SI u n , t SI + v n , t SI 1
x n , t SI x n , t 1 SI x n , τ SI ,   τ t + 1 , min ( t + T n , on SI , min 1 , T )
x n , t 1 SI x n , t SI 1 x n , τ SI ,   τ t + 1 , min ( t + T n , off SI , min 1 , T )
x n , t SI x n 1 , t SI , n = 2 , 3 , , N SI
where u n , t SI and v n , t SI are the starting and shutdown variables of the reduction furnace n, respectively. When the value is 1, they represent that the smelting furnace is starting and shutting down during period t, respectively. T n , on SI , min and T n , off SI , min are the minimum operating time and shutdown time of the reduction furnace.
3.
Polysilicon load yield constraints
c SI = t = 1 T c t SI = 1 η SI n = 1 N SI x n , t SI P n , t SI , res
c order SI c SI c max SI
where η SI is the power consumption of the unit product in the reduction process; c t SI and c SI are the polysilicon production in period t and daily total production, respectively; and c order SI and   c max SI are the minimum and maximum production limitations of polysilicon, respectively.
4.
Hydrogen consumption constraints
P t SI , H 2 = η SI , H 2 c t SI
where P t SI , H 2 is the hydrogen consumption during period t and η SI is the hydrogen consumption per unit product of polysilicon.

2.3. Operation Model of Electrolytic Aluminum Loads

Electrolytic aluminum (AI) load consumes a large amount of electricity and is a typical energy-intensive industrial load with good regulation capability. The inertia time constant of electrolytic aluminum production is large, and reducing or increasing the power supply in a short period does not have a significant impact on the production process. Therefore, it can provide good regulation capability for the power system while ensuring operational safety. The more electrolytic aluminum produced in a single furnace, the greater the power consumption. The total power of the electrolytic aluminum load is shown in Equation (9).
P t AI = i = 1 N AI P i , t AI
where P i , t AI and P t AI are the electrical consumption of a single smelting furnace and the total electrical power of electrolytic aluminum, respectively.
1.
Electrolytic aluminum power constraints
P i , t AI = P i AI , rated + P i , t AI , adjust
P i , min AI , adjust P i , t AI , adjust P i , max AI , adjust
M ξ i , t AI P i , t AI , adjust M ξ i , t AI
where P i AI , rated and P i , t AI , adjust represent the rated power and regulated power of the electrolytic aluminum load, respectively; P i , max AI , adjust and P i , min AI , adjust are the upper and lower limits of adjustable power, respectively; ξ i , t AI is the regulation state variable of electrolytic aluminum load, with 1 representing the power regulation state and 0 representing the normal working state; N AI is the number of electrolytic aluminum production lines; and M is a constant with a large numerical value.
2.
Adjustment time constraints
To ensure the safe operation of the equipment and the quality of the product, the adjustment time and frequency of the electrolytic cell should be limited. Equation (13) is the constraint on the maximum adjustment duration of the electrolytic aluminum load. Equation (14) represents the constraint on the minimum adjustment time interval. As shown in Equation (14), T i , t 1 AI , OFF is the cumulative normal working time for T i , min AI , OFF before the t-1 period.
t = τ τ + T i , max AI , ON ξ i , t AI T i , max AI , ON , τ = 1 , 2 , , T T i , max AI , ON
( ξ i , t 1 AI ξ i , t AI ) ( T i , t 1 AI , OFF T i , min AI , OFF ) 0 , T i , t 1 AI , OFF = τ = t T i , min AI , OFF t 1 ξ i , t AI
where T i , max AI , ON is the maximum duration of power regulation for the electrolytic aluminum load and T i , t 1 AI , OFF and T i , min AI , OFF represent the cumulative normal working time and minimum adjustment interval time, respectively.
3.
Constraints on number of adjustments
Equation (15) depicts the constraint on the number of times adjustment can occur during the scheduling period.
t = 1 T ξ i , t AI ( 1 ξ i , t 1 AI ) N i , max AI , adjust
where N i , max AI , adjust is the maximum number of times adjustment can occur.
4.
Electrolytic aluminum production constraints
θ AI t = 1 T P t AI c order AI
where θ AI is the production output corresponding to the unit power and c order AI is the minimum production of electrolytic aluminum to meet the order demand.

3. Coordinated Scheduling Model

3.1. Objective Function

Considering the electricity and hydrogen balance constraints and the operational constraints of flexibility resources, the source–load–storage scheduling is jointly optimized to meet the energy-intensive load demand. The comprehensive cost consists of the operational cost of the thermal units, the penalty cost for renewable energy abandonment, and the cost of power purchase from bulk power systems. The objective function is shown in Equations (17)–(19).
F = min t = 1 T g = 1 N g C g , t + g = 1 N g C g , t ud + λ re ( P pv , t lim it + P wind , t limit ) + λ net , t P t net λ H 2 P t H 2 , sell
C g , t = a g P g , t 2 + b g P g , t + c g
C g , t ud = c u , g y g , t + c d , g z g , t
where C g , t is the operating cost of the thermal unit; a g ,   b g ,   c g are the power generation cost coefficients; P g , t is the output of thermal unit g in period t; C g , t ud is the cost of starting and stopping the thermal units; c u , g and c d , g are the start-up cost and shutdown cost of the thermal units, respectively; y g , t and z g , t are the start-up and shutdown action variables of the thermal units, respectively; P wind , t limit and P pv , t lim it are the abandoned power of wind power and photovoltaic power, respectively; λ re is the penalty cost coefficient for renewable energy curtailment; λ net , t and λ H 2 are the purchase price of electricity from the grid and the price of hydrogen sales; P t net is the purchased power; P t H 2 , sell is the power of selling hydrogen energy; T is the number of scheduling periods; and N g is the number of thermal units.

3.2. Operation Constraints

3.2.1. System Operation Constraints

The source–load–storage integrated system needs to strike a balance between the electric power supply and demand. Equation (20) represents the electric power balance constraint, and Equation (21) is the power supply limit from the bulk power grid.
g = 1 N g P g , t + P wind , t + P pv , t + s = 1 N s P s , t + P t net = P t AI + P t SI + k = 1 N k P k , t EL
P t net 0
where P wind , t and P pv , t are the power generation of wind power and photovoltaic power in period t, respectively; P s , t is the power output of the energy storage s, with positive values indicating discharge and negative values indicating charging; P k , t EL is the electric power consumed by electrolytic cell k to produce hydrogen during period t; and N s and N k are the numbers of electric energy storage units and power-to-hydrogen equipment, respectively.
The reserve capacity constraints for the system are shown in Equation (22).
r s , t u , ES + r g , t ur υ ( P wind , t + P pv , t ) r s , t d , ES + r g , t dr υ ( P wind , t + P pv , t )
where r g , t ur and r g , t dr are the upward and downward reserve capacities provided from unit g, respectively; r s , t u , ES and r s , t d , ES are the upward and downward reserve capacities of energy storage, respectively; and υ is the reserve coefficient based on the power output of renewable energy.

3.2.2. Thermal Units

1.
Power output limit constraint
x g , t P g , min P g , t x g , t P g , max
where x g , t is the operating state of the thermal unit, with 1 indicating normal operation and 0 indicating off state, and P g , min and P g , max are the minimum and maximum limits of power output, respectively.
2.
Operation state constraints
Equation (24) depicts the relation of the start-up variable, shutdown variable, and commitment status. Equation (25) indicates that the thermal unit cannot operate in both start-up and shutdown states simultaneously.
y g , t z g , t = x g , t x g , t 1
y g , t + z g , t 1
3.
Unit start–stop time constraints
( U g , t 1 on T g on ) × ( x g , t 1 x g , t ) 0
( U g , t 1 off T g off ) × ( x g , t x g , t 1 ) 0
where U g , t on and U g , t off are the continuous operation time and continuous shutdown time of the thermal unit, respectively, and T g on and T g off are the minimum operation and shutdown time of the thermal unit, respectively.
4.
Ramp capacity constraints
P g , t P g , t 1 R g up Δ T ( 1 y g , t ) + P g , min y g , t
P g , t 1 P g , t R g dw Δ T ( 1 z g , t ) + P g , min z g , t
where R g up and R g dw represent the ramp-up and ramp-down capacities for the thermal units, respectively, and Δ T represents the scheduling time interval.
5.
Thermal unit reserve constraints
min ( P g , max P g , t , R g up Δ T ) r g , t ur min ( P g , t P g , min , R g dn Δ T ) r g , t dr

3.2.3. Electric Energy Storage

1.
Energy storage capacity constraints
E s , t = E s , t 1 + η c P s , t c P s , t d / η d
E s , min E s , t E s , max
E s , T = E s , 0
where E s , t , E s , min , E s , max are the state of charge (SOC), the lower electricity limit, and the upper electricity limit, respectively; η c and η d are the charging and discharge efficiency, respectively; and P s , t c and P s , t d represent the charge and discharge power, respectively.
2.
Power output constraints
0 P s , t c u s , t c P s , max c
0 P s , t d u s , t d P s , max d
P s , t = P s , t d P s , t c
u s , t c + u s , t d 1
where P s , max c and P s , max d are the charging and discharging power limits, respectively, and u s , t c and u s , t d are the state variables of charging and discharging, respectively.
3.
Reserve capacity constraints
Considering the constraints of charging/discharging power and capacity, Equations (38) and (39) limit the upward and downward reserve capacity for energy storage, respectively.
0 r s , t u , ES min P s , max d P s , t , ( E s , t E s , min ) η D P s , t Δ T Δ T
0 r s , t d , ES min P s , max c + P s , t , ( E s , max E s , t ) + η C P s , t Δ T η C Δ T

3.2.4. Hydrogen Energy Equipment

1.
Operation constraints of hydrogen production in the electrolytic cell
Electrolytic water to the hydrogen of the electrolytic cell meets the hydrogen demand for polysilicon production. When the renewable energy generation is surplus, the surplus power can be converted into hydrogen and stored in the hydrogen storage tank. The hydrogen energy outside the production demand can be sold to obtain income. The operation constraints of the electrolytic cell are shown in Equation (40).
P k , t TH = η TH P k , t EL u k , t EL P k , min EL P k , t EL u k , t EL P k , max EL P k , t EL P k , t 1 EL P k , rp EL
where P k , t EL is the power consumption of electrolytic cell k; u k , t EL is the operating state of the electrolytic cell in period t; P k , min EL and P k , max EL are the minimum and maximum electric power demand of electrolytic cell k, respectively; P k , rp EL is the ramp rate limit; and η TH is the power consumption coefficient of unit hydrogen production.
2.
Operation constraints of hydrogen energy storage
M min hst M t hst M max hst M t hst = M t 1 hst + η IN , hs P t H 2 , in P t H 2 , out / η out , hs 0 P t H 2 , in ζ t H 2 , in M 0 P t H 2 , out ζ t H 2 , out M ζ t H 2 , out + ζ t H 2 , in 1
where M t hst is the hydrogen storage capacity of the hydrogen storage equipment in period t; M min hst and M max hst are the minimum and maximum hydrogen storage capacity, respectively; P t H 2 , in and P t H 2 , out denote the hydrogen input and output, respectively; η IN , hs and η out , hs are the hydrogen input and output efficiency of the hydrogen storage, respectively; and ζ t H 2 , in and ζ t H 2 , out are hydrogen input and output state variables, respectively.
3.
Hydrogen energy supply and demand balance constraints
The hydrogen production of the electrolytic cell and storage equipment jointly meet the hydrogen demand of polysilicon production and the hydrogen sales demand. When hydrogen is abundant, it is stored in the hydrogen storage equipment. When the renewable energy is low, the hydrogen output from the hydrogen storage equipment meets the demand. Equation (42) is the hydrogen energy balance constraint.
P t H 2 , in P t H 2 , out = P k , t TH P t SI , H 2 P t H 2 , sell

3.2.5. Renewable Energy

Equations (43) and (44) represent the output constraints of photovoltaic and wind power. Equations (45) and (46) represent photovoltaic and wind generation curtailment.
0 P pv , t P pv , t predict
0 P wind , t P wind , t predict
P pv , t lim it = P pv , t predict P pv , t
P wind , t limit = P wind , t predict P wind , t
where P wind , t predict and P pv , t predict are the predicted power of wind generation and photovoltaic generation, respectively.

4. Example Analysis

In this section, case studies are discussed based on the source–load–storage integrated regional system in Xinjiang, China. The system includes wind farms, photovoltaic cells, thermal units, electrolytic aluminum and polysilicon load, electricity/hydrogen energy storage, and power-to-energy equipment. It is connected to the bulk power grid for electricity exchange. The system purchases electricity only from the grid. The regional system includes a 660 megawatt (MW) thermal unit, with detailed parameters in Table 1. The installed capacity of wind and photovoltaic power is 1000 MW, and the predicted information is shown in Figure 2. The polysilicon load can produce 100,000 tons of polysilicon every year and has 100 reduction furnaces. The rated power is 800 MW. The detailed operating parameters are shown in Table 2. The electrolytic aluminum load includes three electrolytic cell series, with rated powers of 200, 336, and 50 MW. The detailed operating parameters are shown in Table 3. The rated power of electric energy storage is 200 MW and 100 MW, respectively. The energy storage duration is 4 h, and the charging and discharging efficiency is 95%. There are 10 units of electric hydrogen production equipment, each with a rated power of 20 MW and a minimum power of 4 MW. The electric hydrogen conversion coefficient is 44 kW·h/kg. The selling price of hydrogen is 30 CNY/kg, and the maximum selling capacity is 3500 kg. The full name of CNY is Chinese yuan. The maximum and minimum capacities of the hydrogen energy storage device are 20 tons and 2 tons, respectively. The hydrogen charging and discharging efficiency is 95%, and the initial hydrogen storage capacity is 5 t. The time-of-use electricity price in the bulk power grid is shown in Figure 3. The penalty price for renewable energy curtailment was set at 600 CNY/MWh. On the MATLAB R2023b platform, Gurobi 11.0 was utilized to solve the proposed model and optimize the system operation schemes.

4.1. Analysis of Operation Results

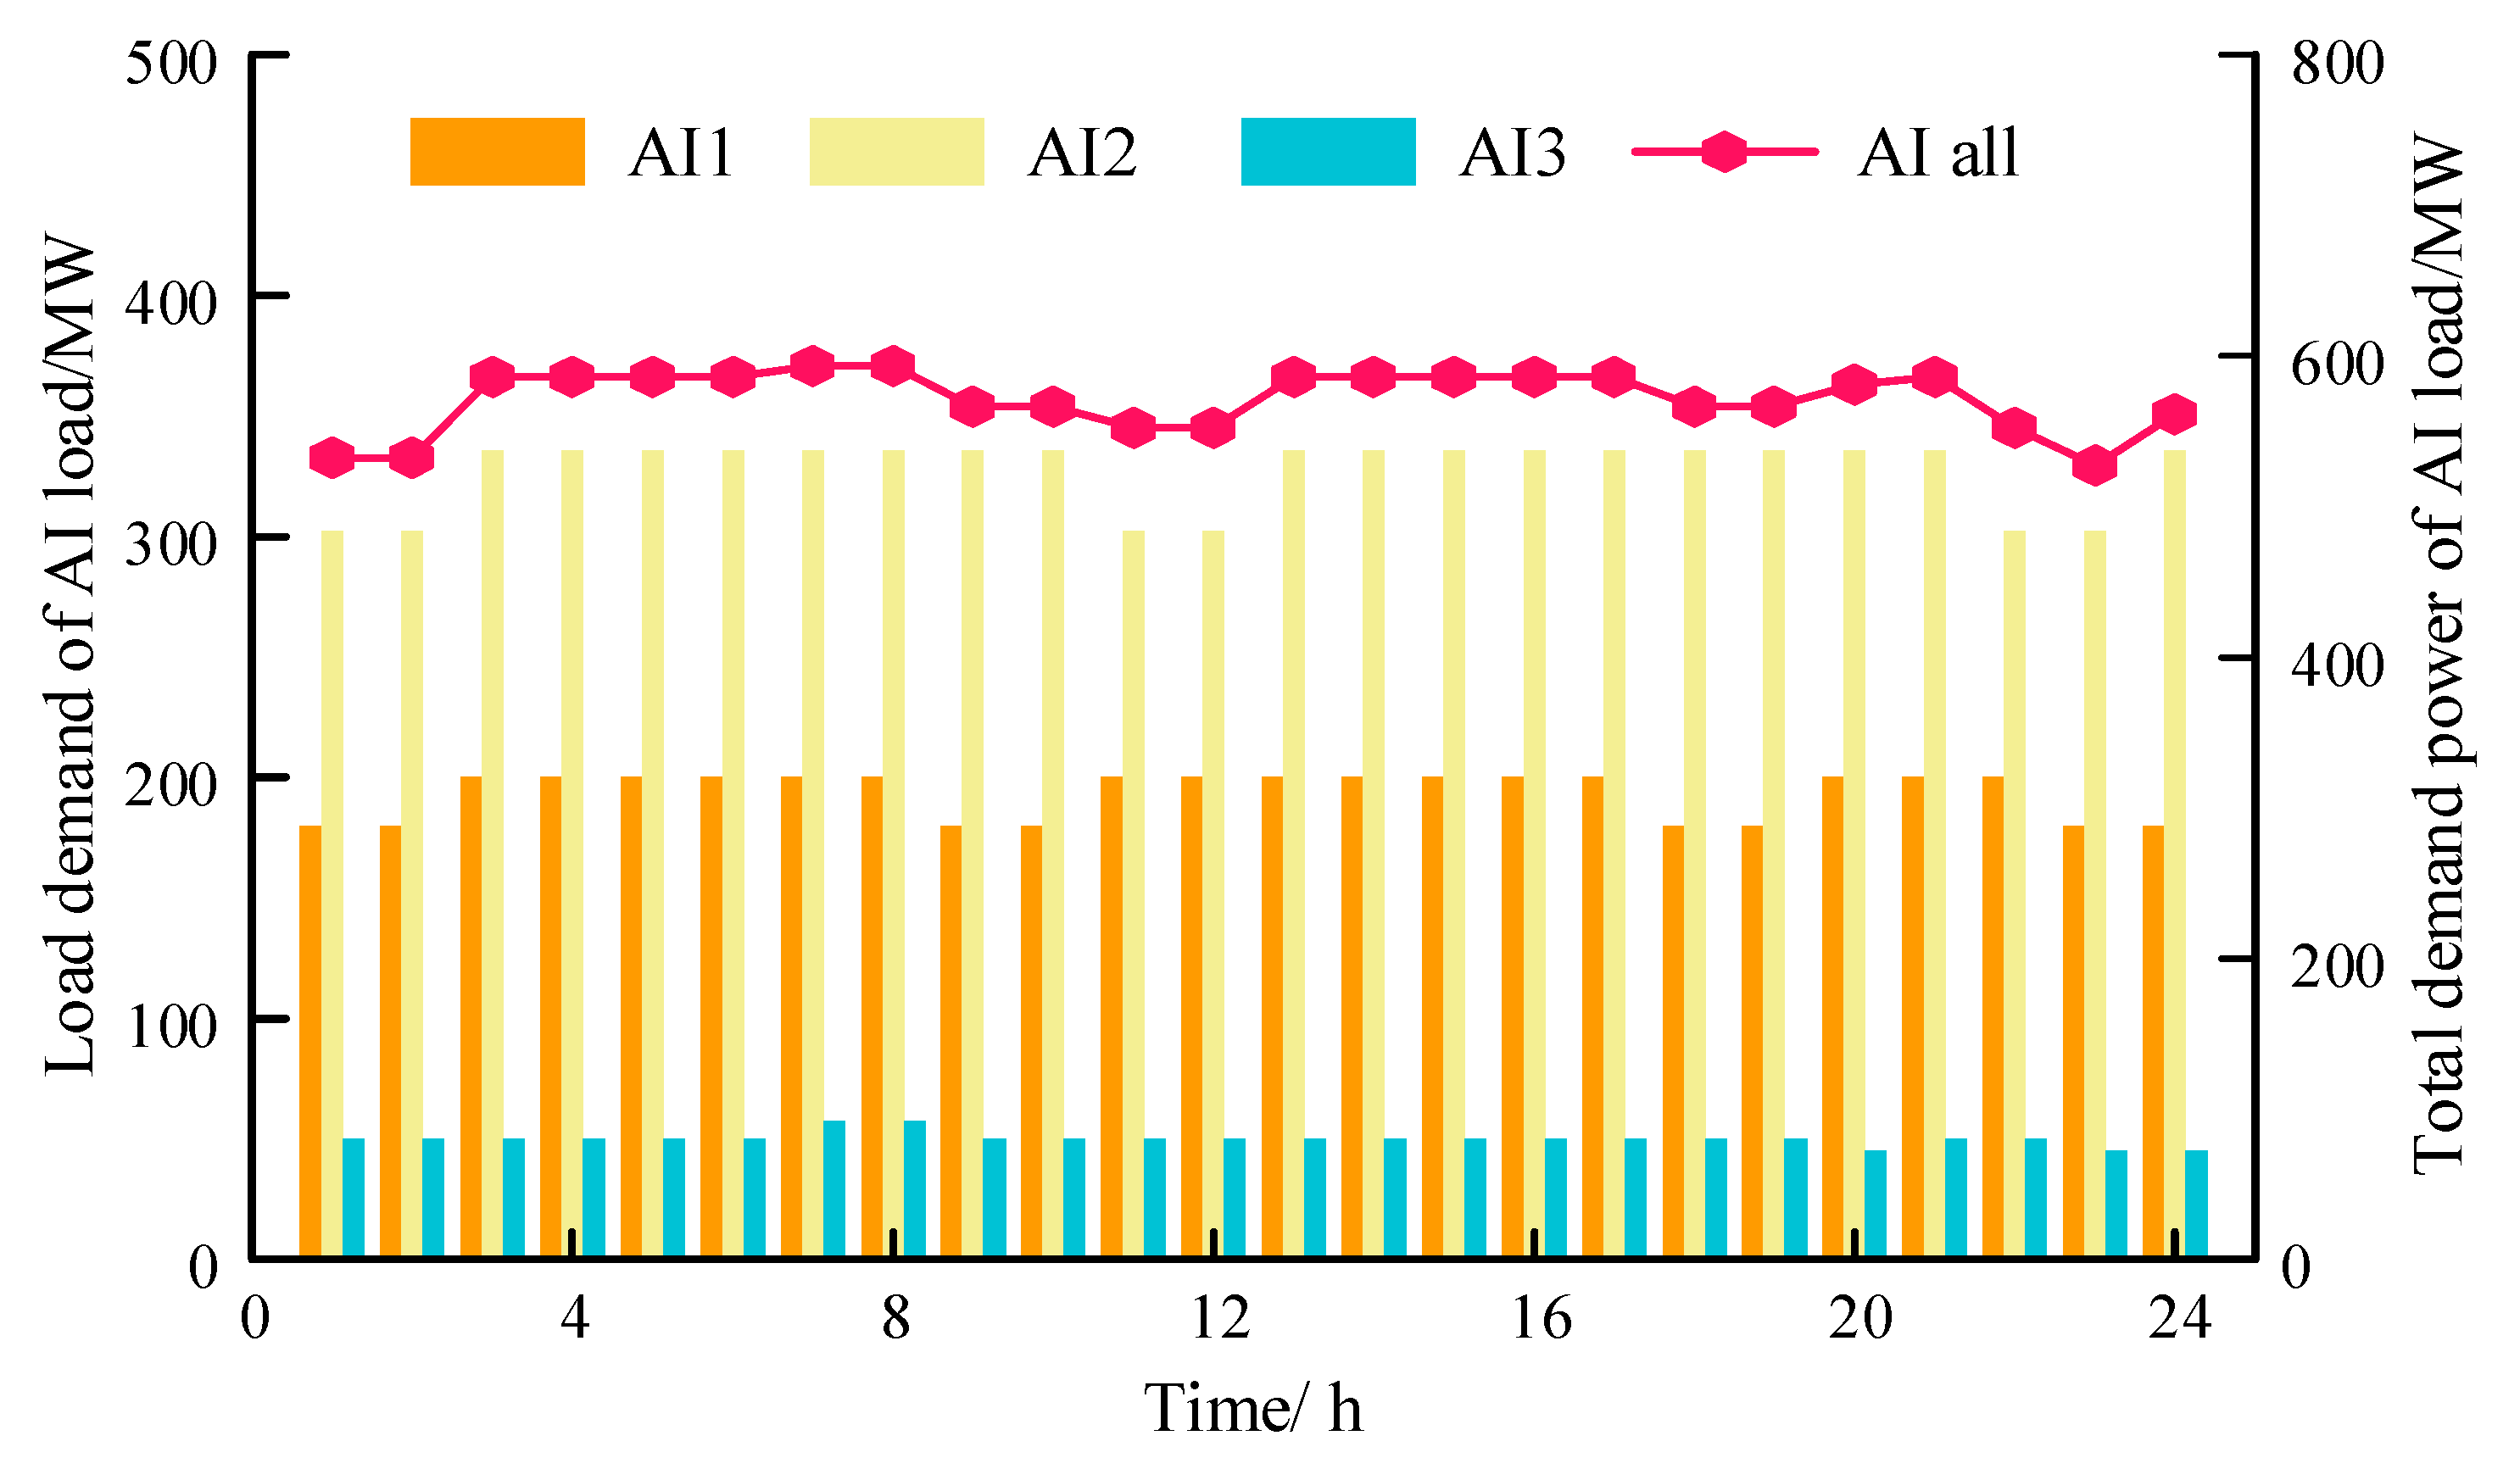
Considering the comprehensive cost, the optimized scheduling scheme of the regional system is shown in Figure 4. As shown in Figure 4, the output of wind power and photovoltaic power fluctuated. The output of photovoltaic power was the greatest at noon and became zero at night. The output of wind power was larger at night and smaller at noon. The overall industrial load was relatively stable, and the fluctuation was small. To ensure reliable power supply for the industrial load, the thermal unit and power purchase from the bulk power system suppressed the fluctuation of the renewable energy output. Meanwhile, the energy storage charged during the low-electricity-price period and discharged during the high-electricity-price period, which reduced the power purchase cost from the power grid. In addition, the energy storage could alleviate the peak–valley difference in the net load and alleviate the adjustment pressure on the thermal unit. As shown in Figure 5, on the premise of ensuring production, the electrolytic aluminum load could flexibly adjust the electricity demand and appropriately reduce electricity demand during high-electricity-price periods, which could alleviate power supply pressure. Therefore, through the coordinated optimization of multiple regulation resources, the power reliability of energy-intensive loads could be guaranteed while the system operating cost was reduced and the system operating efficiency was improved.

4.2. Analysis of the Influence of Energy-Intensive Loads

To analyze the role of energy-intensive loads in regulation, two cases were set up for comparative analysis. Case 1 did not consider the participation of electrolytic aluminum in regulation, while Case 2 did. The results are shown in Table 4 and Figure 6. As shown in Table 4 and Figure 6, the regulation characteristics of the electrolytic aluminum load were ignored in Case 1, and the electric power was maintained at the rated power of 586 MW. Case 2 considered the participation of electrolytic aluminum load, which can adjust its load demand according to the price of electricity purchase from the bulk power system and the output of renewable energy, in system regulation. Compared with Case 1, the electricity purchase cost in Case 2 was reduced by 99,811 CNY, the power generation cost of thermal units was reduced by 45,936 CNY, and the total cost was reduced by 4.7%. The generation cost of the thermal unit in Case 2 was reduced by 1.9%. This was because the flexibility characteristic of energy-intensive loads increases the consumption space for renewable energy, and the regional system can utilize more low-carbon renewable energy and less generation power from the thermal units to improve economic efficiency. The startup costs of thermal power units in both cases were zero. The test system had only one 660 MW thermal unit. The start-up time was long, and the start-up cost was high. In the optimization process, to ensure the supply reliability and operational economy of the system, the thermal unit maintained power generation operation during the scheduling period. Neither Case 1 nor 2 incurred the startup costs. Therefore, the regulation ability of energy-intensive loads can improve the flexibility and economy of system operation.

4.3. Analysis of the Influence of Electric Energy Storage

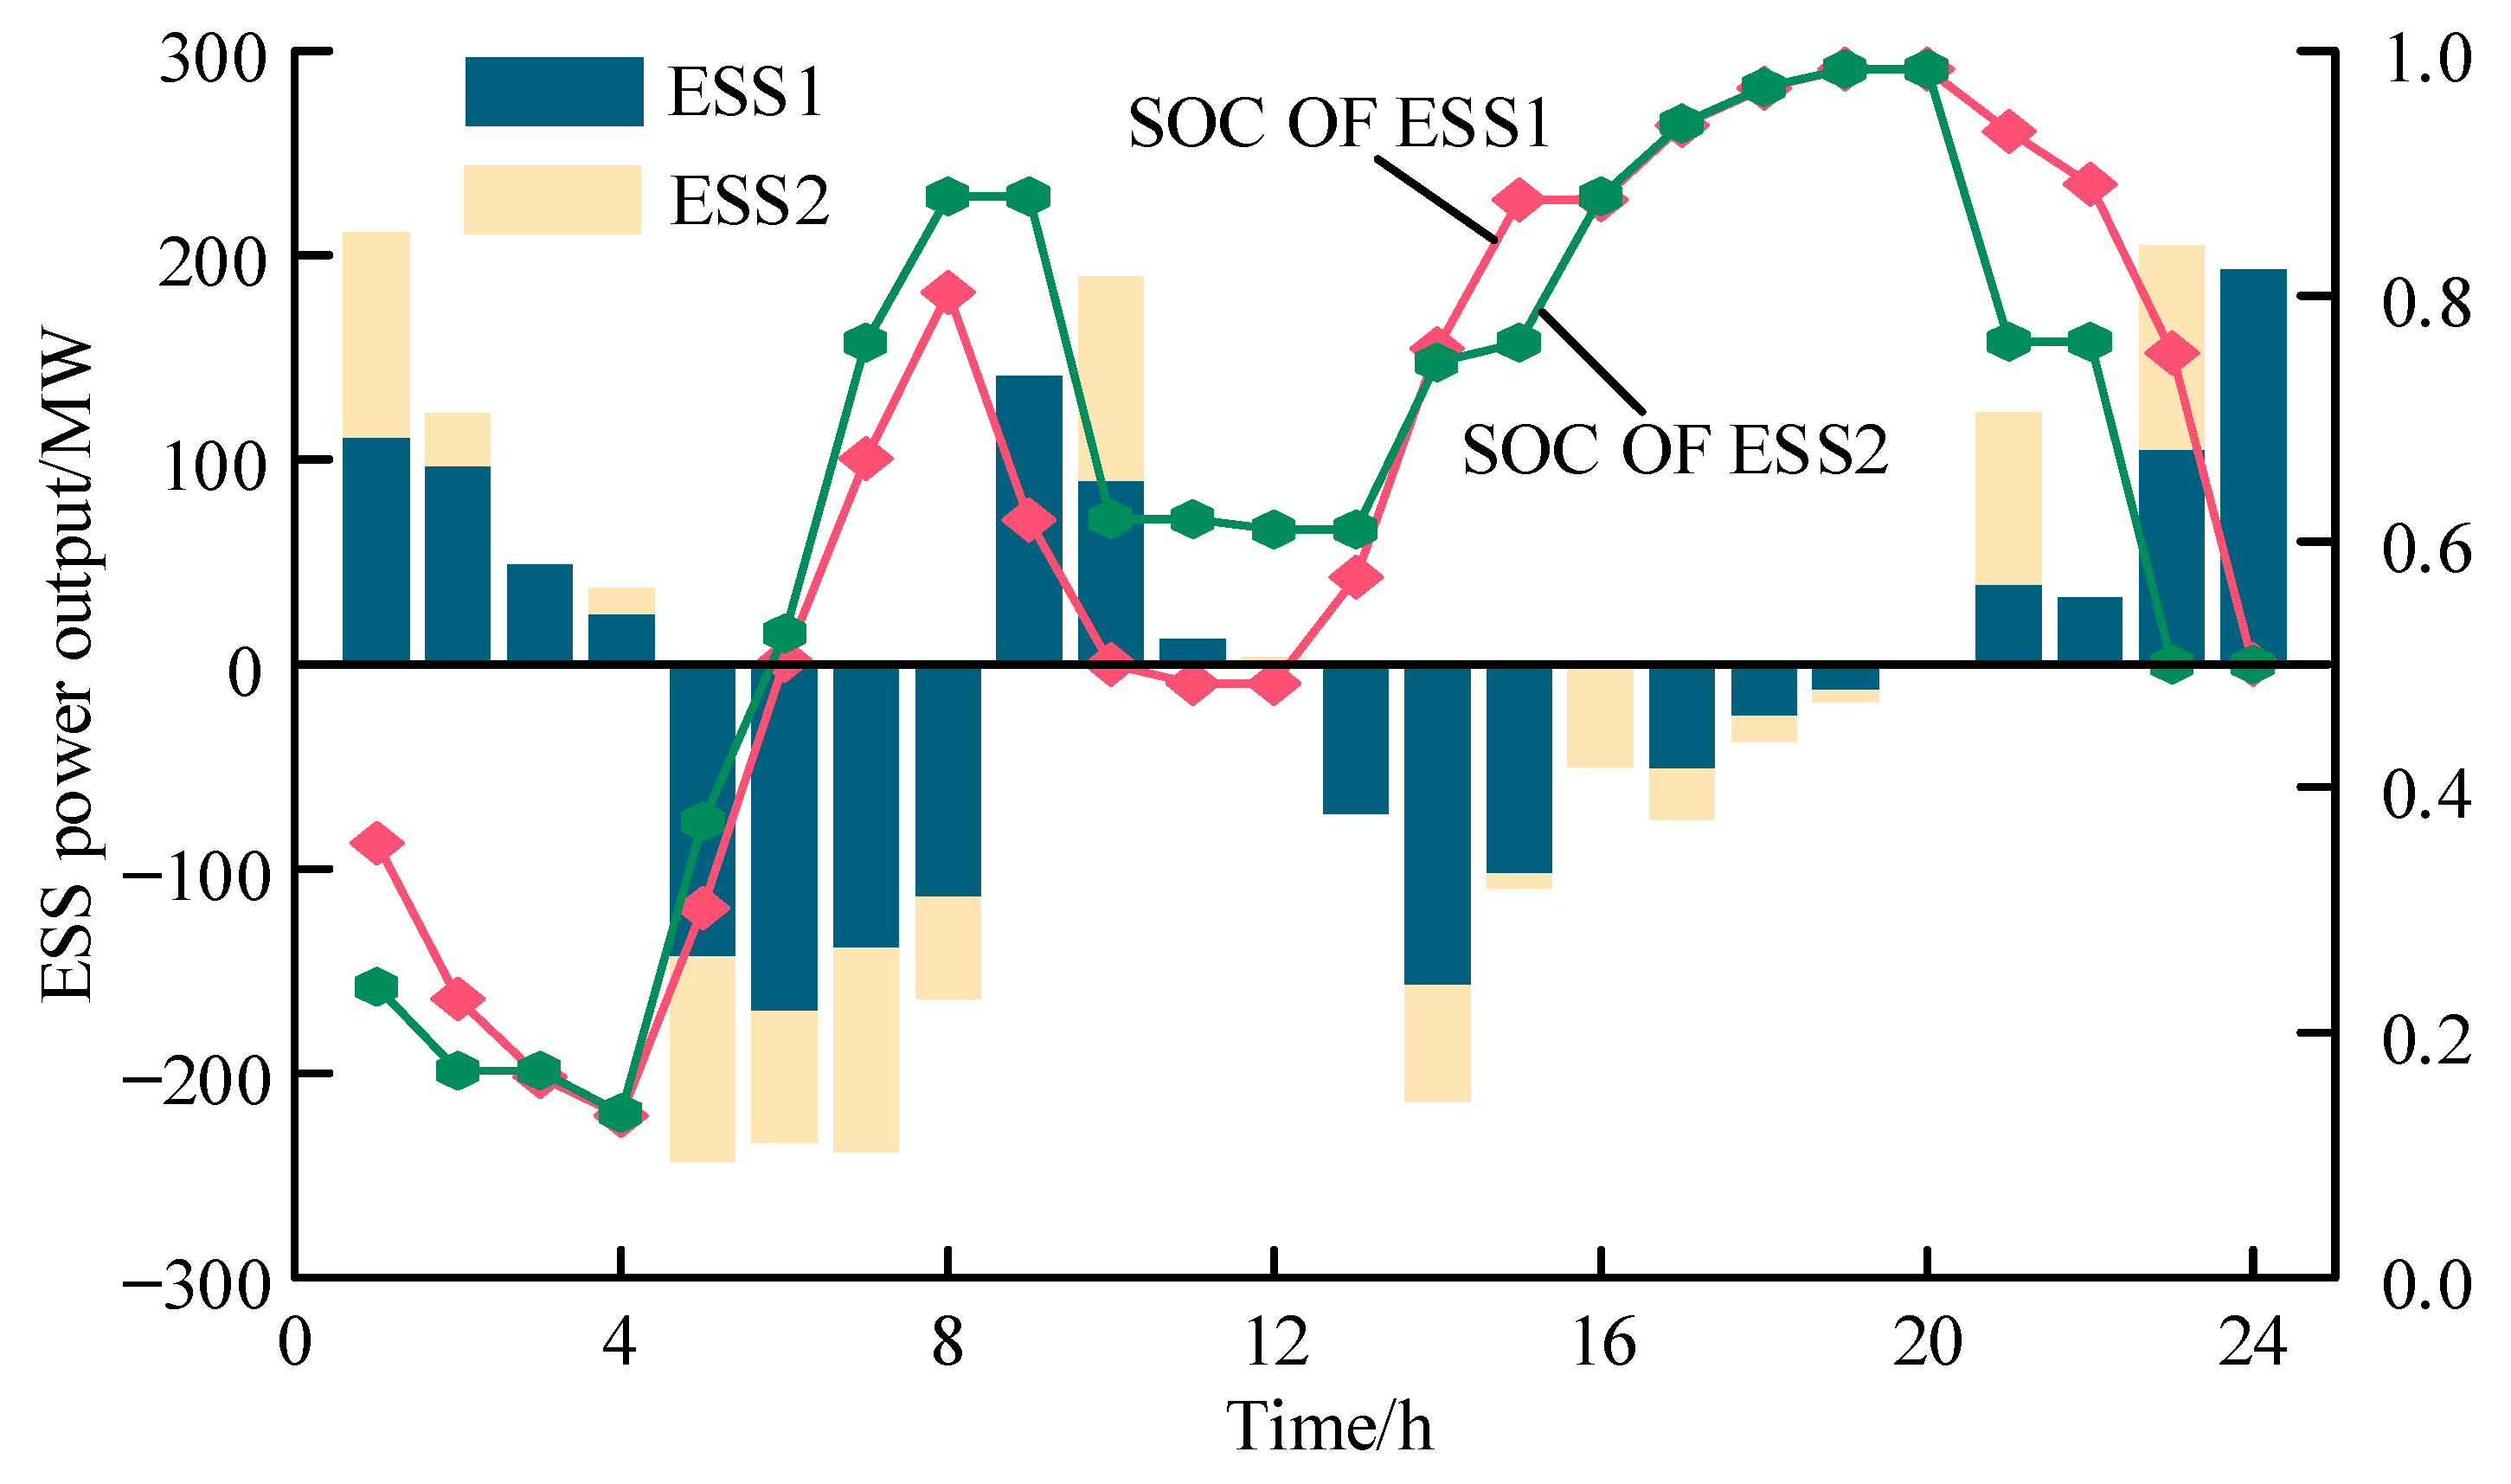
The energy storage scheduling results are shown in Figure 7. As shown in Figure 7, during the period from 13:00 to 17:00, renewable energy generation was at a high level, and the energy storage was charged. During the period from 21:00 to 24:00, wind and photovoltaic power generation were at a low level, and the energy storage was discharged. Energy storage could effectively smooth out fluctuations in the power output of renewable energy and alleviate the regulation pressure of the regional system. On the other hand, the energy storage discharged when the main grid electricity price was high. The energy storage stored cheap electricity when the main grid electricity price was low. The cost of purchasing electricity was reduced. Therefore, electrical energy storage could effectively smooth out the power output fluctuations in renewable energy and reduce system operating costs.
The optimization results under different rated powers and capacities of energy storage are shown in Table 5 and Figure 8. The duration represented the full power discharge time of the energy storage capacity. From Figure 8, it can be seen that as the capacity of energy storage increased, it had a long-lasting charging and discharging ability. The charging and discharging power increased during the periods of 5:00–8:00 and 14:00–16:00. The function of “high charging and low discharging” was achieved. That is, when the electricity price was high, it charged, and when the electricity price was low, it discharged. The output of thermal units and the system operating costs were reduced. Compared with the 2 h case, the system’s generation and purchase costs in the 4 h case were reduced by 55,343 CNY and 86,188 CNY, respectively, and the comprehensive cost was reduced by 4.6%. This was because the increase in energy storage capacity improved the system’s ability to transfer electrical energy across cycles. The energy storage stored electrical energy during periods of low electricity prices and discharged it during periods of high electricity prices. Meanwhile, the regional system could reduce the power output of thermal power units. Thereby, the cost of purchasing electricity from the bulk grid and the generation cost of thermal units were reduced. When the energy storage duration was maintained at 4 h and the rated power was increased from 100 MW to 300 MW, the ability of the energy storage to smooth out fluctuations in renewable energy and transfer electricity across periods were improved. The generation cost and purchase cost of the regional system were reduced by 166,762 CNY and 31,420 CNY, respectively, and the comprehensive cost was reduced by 6.7%. Therefore, reasonably rated power and capacity of energy storage could improve the regulation ability and reduce the operating costs of the regional system. In addition, the rated power of energy storage has a more significant impact on system flexibility and economy.

4.4. Analysis of the Influence of Hydrogen Energy

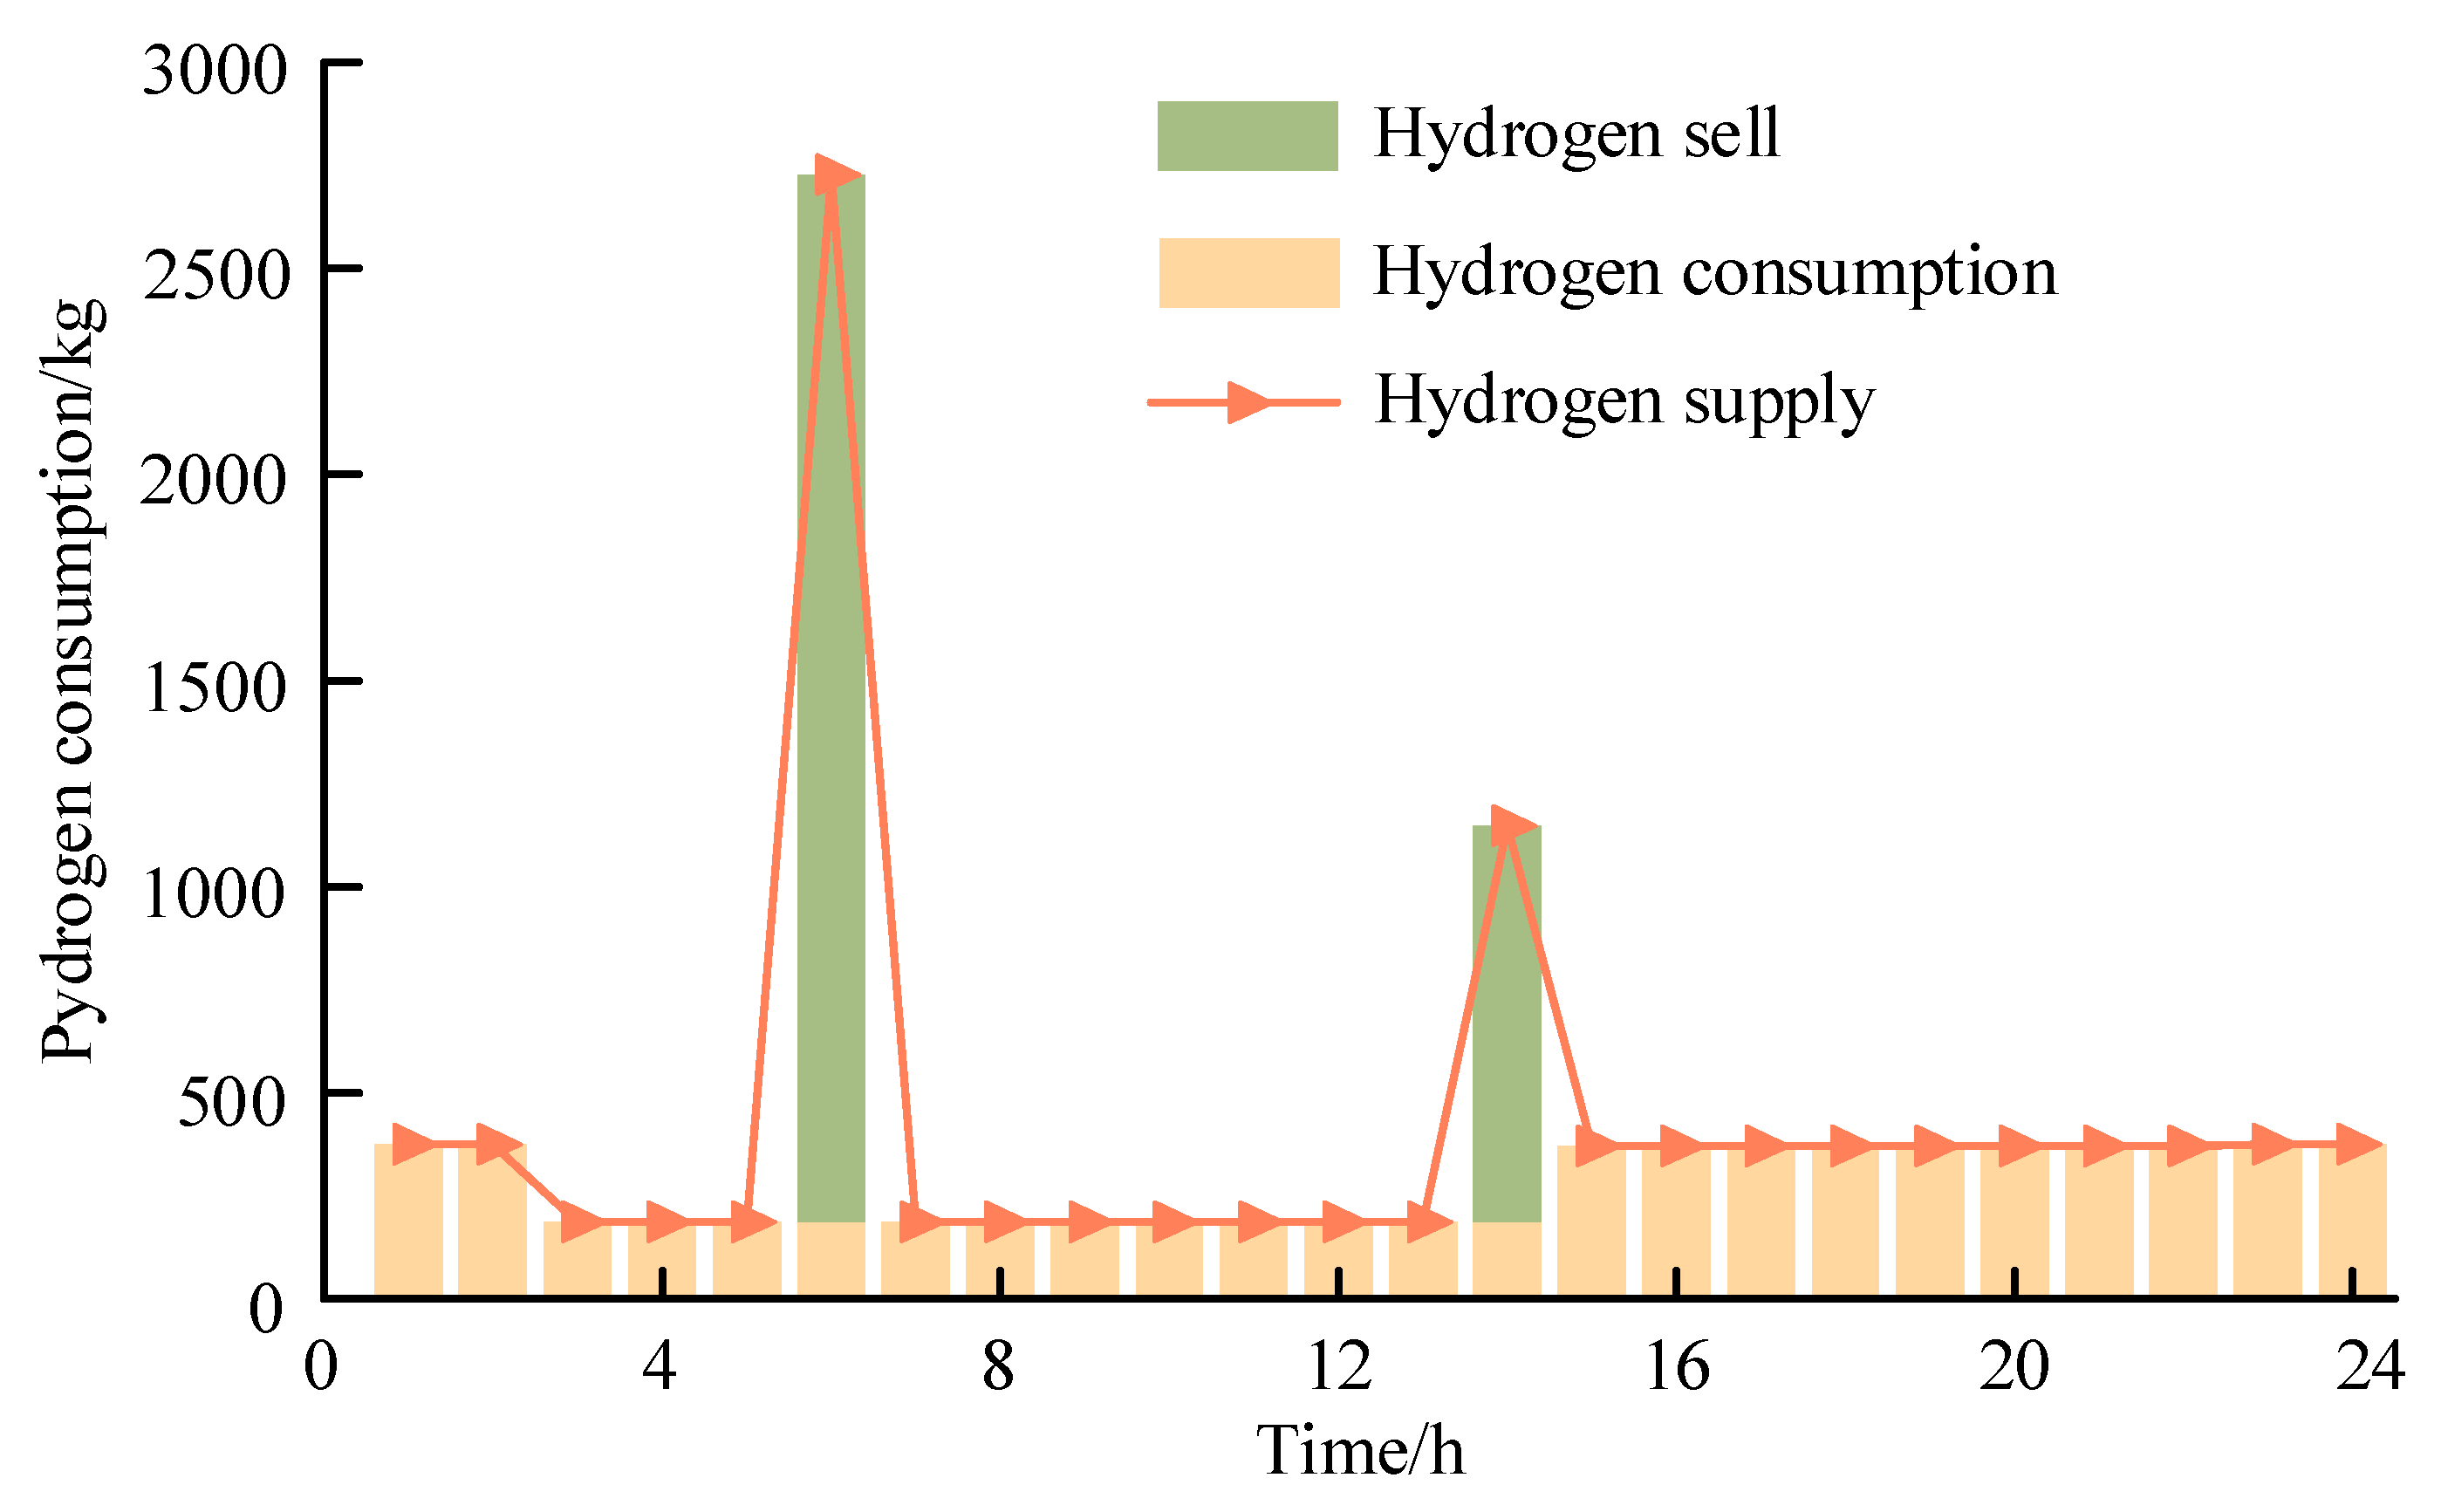
The hydrogen energy operation schemes are shown in Figure 9 and Figure 10. As shown in Figure 9, hydrogen energy consumption in the system was used for polysilicon production, and the hydrogen energy usage was relatively stable. During the period of 3:00–14:00, the hydrogen energy consumption was 187 kg/h. This was because the part of the reduction furnaces that had completed the production process needed to shut down to extract the produced polysilicon. The hydrogen energy consumption during other periods was 370 kg/h. The polysilicon load could not adjust the power consumption during the production process, and the power demand needed to be adjusted by optimizing the start–stop plan of the reduction furnace. The adjustment ability of the polysilicon load was weaker than that of the electrolytic aluminum load. As shown in Figure 10, the hydrogen demand for polysilicon production was mainly supplied by hydrogen storage equipment. During periods of low electricity prices from 5:00–8:00 and from 13:00–17:00, the hydrogen production equipment produced hydrogen to meet the demand for polysilicon loads. Excess hydrogen was stored in hydrogen energy storage equipment. Meanwhile, some hydrogen energy was sold for profit.

4.5. Sensitivity Analysis

4.5.1. Impact of Renewable Energy Capacity

The optimized results of the regional system under different installed capacities of wind and photovoltaic power are shown in Table 6. Based on the scenario where both wind and photovoltaic generation were 1000 MW, this study compared and analyzed situations with an increase of 1000 MW and a decrease of 500 MW in the installed capacity of renewable energy. Compared with the basic scenario, when the wind power capacity was increased by 1000 MW, the generation cost of thermal units was reduced by 35.1%, and the cost of purchasing electricity was 0 CNY. Meanwhile, the abandonment rate of renewable energy was 14.59%, resulting in a very high abandonment penalty cost, which increased the total cost by 2,505,864 CNY. This was because the increase in wind power installation exceeded the admissible capacity of the regional system. When the photovoltaic and wind capacity each increased by 500 MW, compared to the basic scenario, the renewable energy curtailment rate was 7.53%. The total cost also significantly increased. When the wind power capacity decreased by 500 MW, the wind power generation capacity decreased, resulting in increases of 584,109 CNY and 1,335,385 CNY in generation cost and purchased electricity cost, respectively, compared with the basic scenario. The total cost increased by 64.9%. When the installed capacity of wind and photovoltaic power were each decreased by 250 MW, the generation cost and purchased electricity cost also significantly increased, with the total cost increasing by 42.9%. It is necessary to avoid resource waste caused by excessive renewable energy installation and power supply capacity shortage caused by insufficient renewable energy installation. Therefore, reasonable capacity for renewable energy can improve the consumption rate of renewable energy and the matching degree between system supply and demand.

4.5.2. Impact of Power Purchase Limit

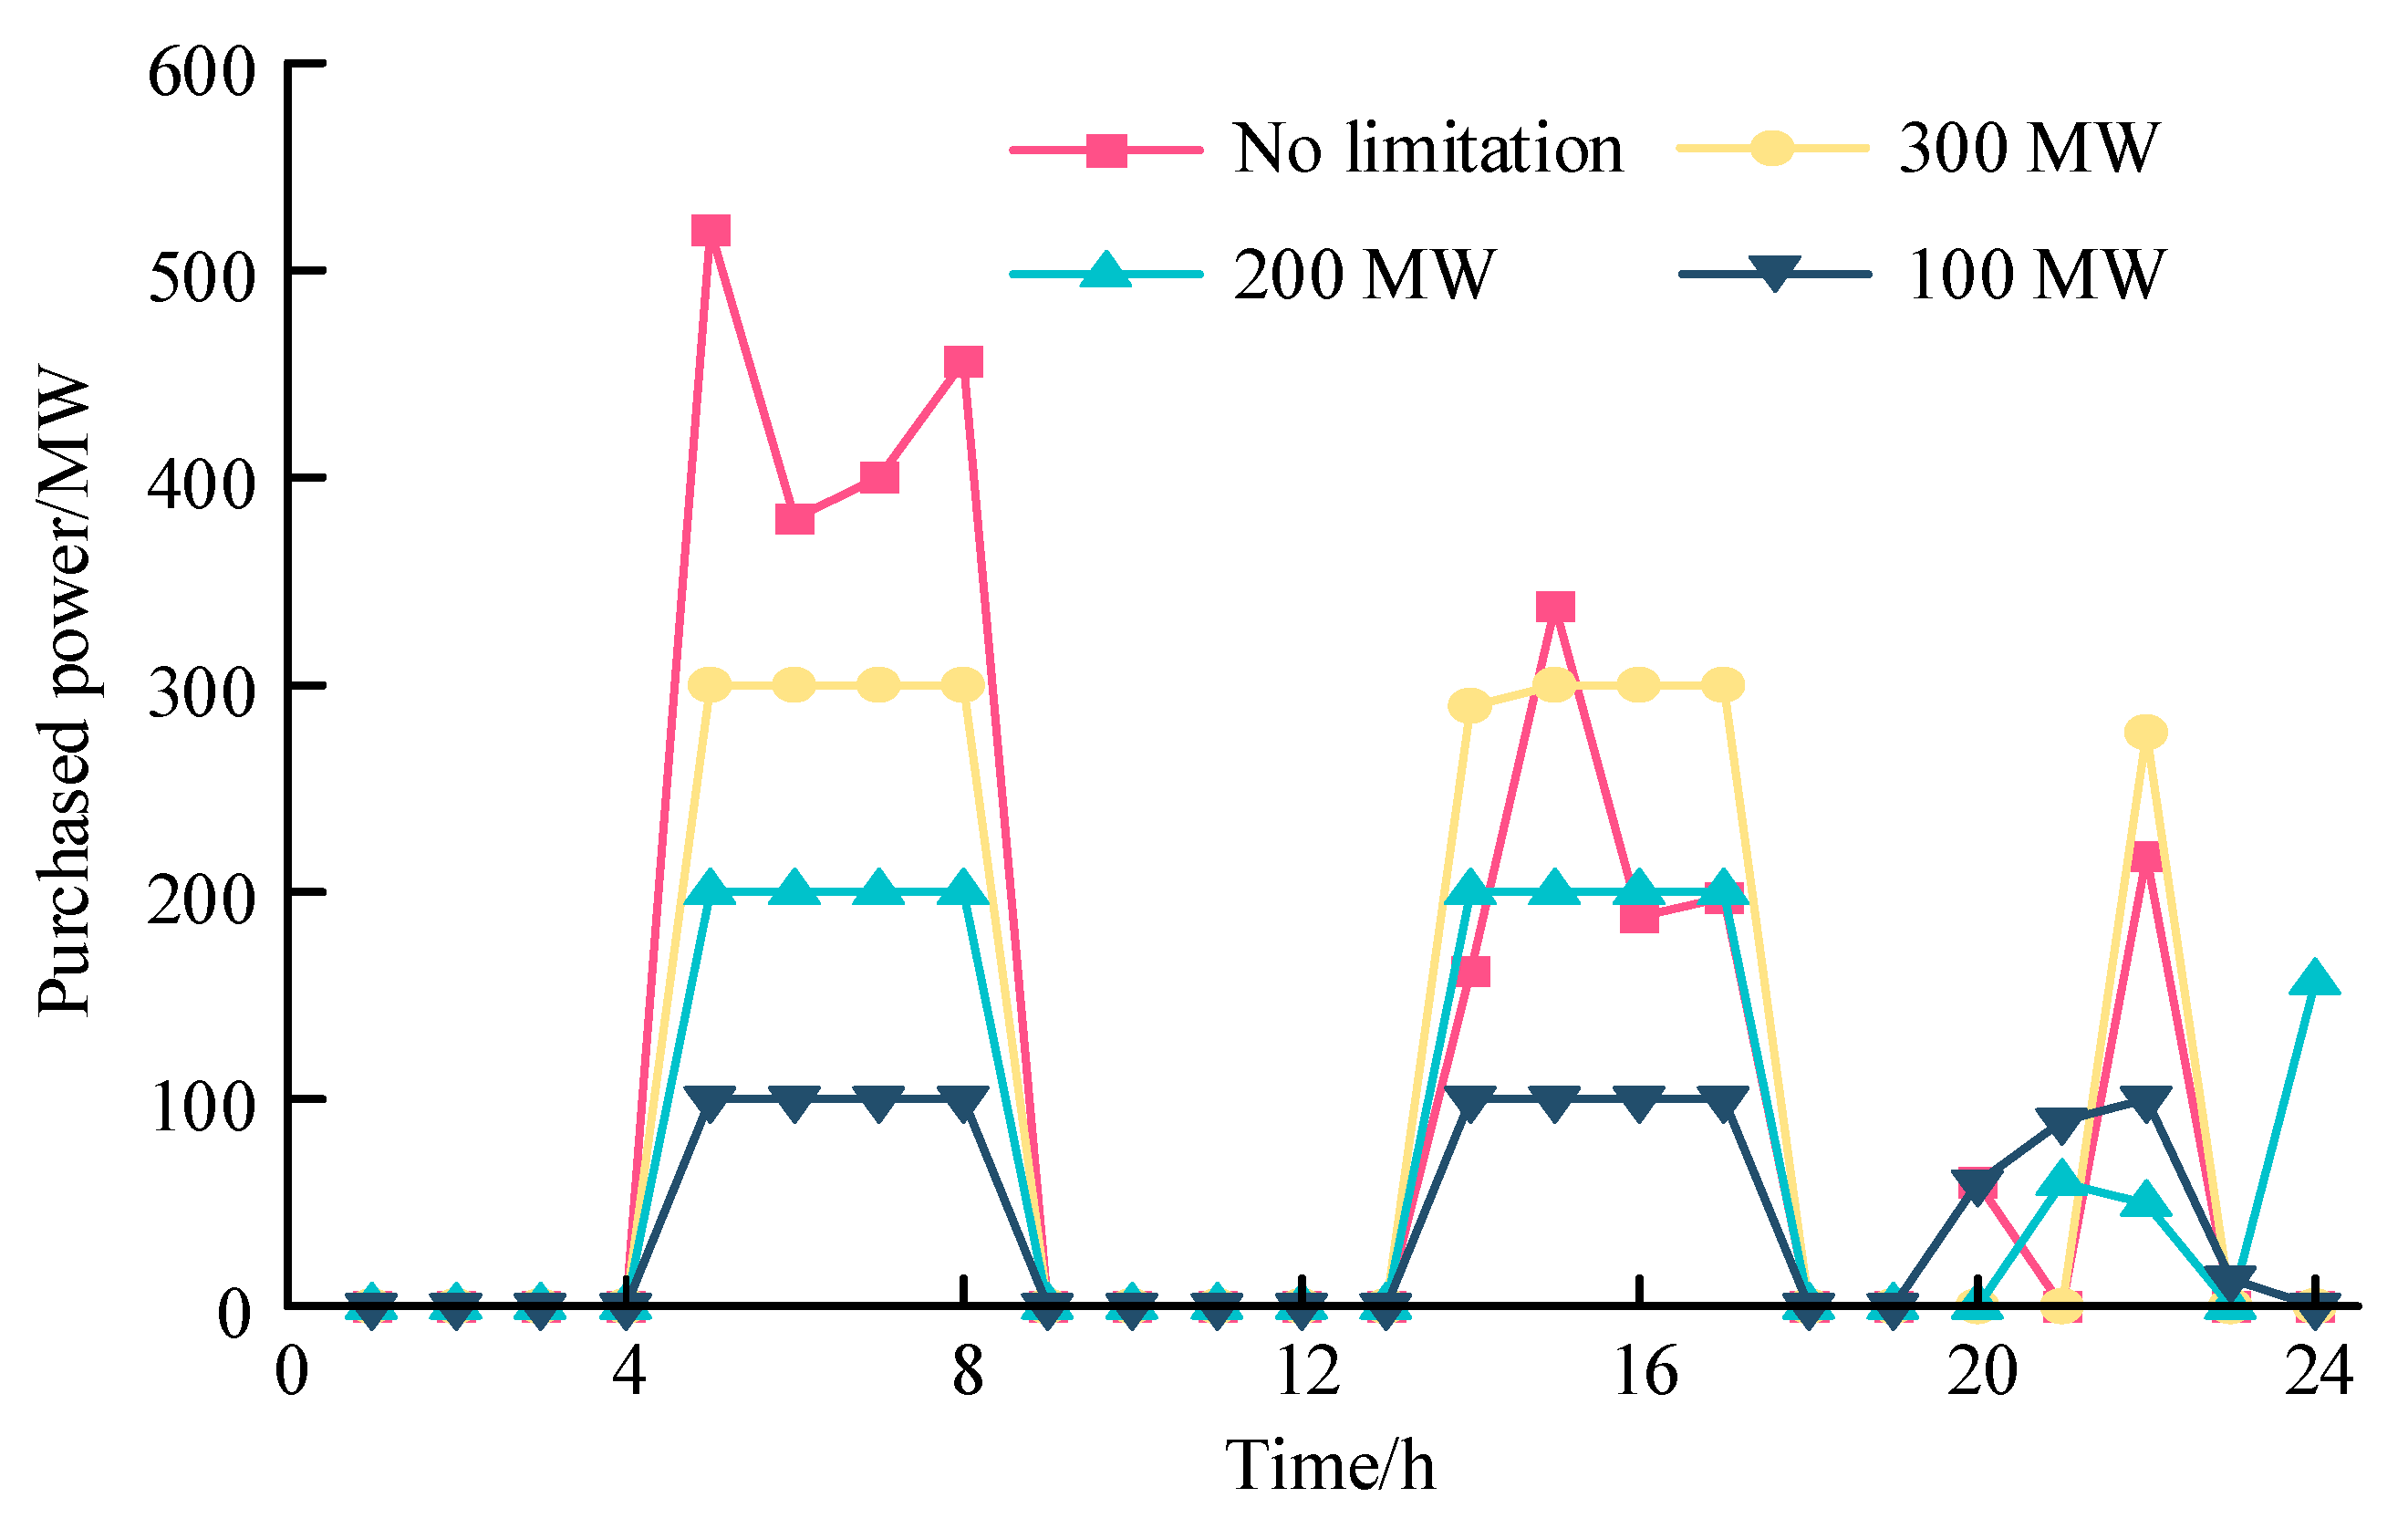
The optimization results under different power purchase restrictions are shown in Figure 11. As shown in Figure 11, as the allowed purchasing power gradually decreases, the source–load–storage integrated system significantly reduced the amount of purchased electricity during the period of 5:00–8:00, resulting in a decrease in the cost of purchasing electricity. However, this portion of electricity was provided by thermal units, increasing the cost of power generation, and the total cost continued to increase. Compared with no limitation for power purchase, when the power purchase was limited to 300 MW, 200 MW, and 100 MW, the cost of purchasing electricity was reduced by 89,621 CNY, 225,345 CNY, and 388,000 CNY, respectively. The total cost was increased by 9,253 CNY, 30,260 CNY, and 66,515 CNY, respectively. When the power purchase limit was set to 0 MW, operational solutions could not be obtained directly, and load shedding was required during certain periods to obtain feasible solutions. Therefore, the interaction with the bulk power grid could ensure a reliable electricity supply and reduce operating costs.

4.5.3. Impact of Polysilicon Loads

The polysilicon load can be adjusted by optimizing the number of operating reduction furnaces while maintaining production. When the production process is completed, reduction furnaces should shut down and extract polysilicon products. The number of operating reduction furnaces can be optimized. The polysilicon load curves under different adjustable numbers of reduction furnaces are shown in Figure 12. As shown in Figure 12, as the adjustable number of reduction furnaces increased, the load demand for polysilicon decreased during the period of 3:00–14:00, while the load demand during the period of 14:00–24:00 increased. The load difference between different periods increased. When the adjustable number of reduction furnaces was 30, the total system cost was the smallest at 2,803,651 CNY. This was because the polysilicon load curve matched better with the output of renewable energy, which reduced system operating costs. When the adjustable number of reduction furnaces was 20, the comprehensive cost was the highest at 3,120,924 CNY. In this case, the energy demand of polysilicon load from 3:00 to 24:00 was a straight line and remained at 640 MW. The regulation capacity of the polysilicon load was poor.

4.6. Comparison of Results with Other Methods

To further verify the effectiveness of the proposed method, a comparison between the proposed method and other methods in the literature [10,13,14,22] was conducted. The characteristics of different methods are shown in Table 7. Method 4 is the optimization method in this paper. The optimization results of the methods are given in Table 8.
As shown in Table 7, Method 1 utilized only thermal units and renewable energy to meet high energy load demands and had weak regulation capabilities. Relying solely on thermal power and electrolytic aluminum load regulation made it difficult to adapt to the random fluctuations of wind and photovoltaic power. During the period of 21:00–24:00, there was insufficient power supply capacity and load shedding, resulting in the highest total cost. Compared with Method 1, Method 2 introduced energy storage to participate in system regulation, which enhanced system flexibility through its bidirectional interaction capability. Although the generation cost increased by 45,936 CNY, there was no load shedding during the scheduling period, resulting in a 4.7% reduction in the total cost. Method 3 considered the electricity interaction between the source–load–storage integrated system and the bulk grid. Based on the operational situation and electricity prices, the system could purchase electricity from the grid at low prices and sell electricity at high prices, enhancing its self-regulation ability and increasing revenue. Compared with Method 2, the total cost of Method 3 was further reduced by 1.82%. Compared with method 3, method 4 utilized energy storage and polysilicon load to further improve its flexible adjustment capabilities. The total cost was reduced by 65,166 CNY. Meanwhile, the improvement in operational flexibility could increase the utilization of renewable energy and reduce the dependence on thermal power. Compared with Method 3, the generation cost of the thermal unit in Method 4 was reduced by 2.3%. The economic and environmental benefits of the proposed method were optimal.

5. Conclusions

This paper proposes a day-ahead coordinated optimization method for source–load–storage integrated systems with energy-intensive loads. The proposed method considers the operational characteristics of the electrolytic aluminum load and polysilicon load to improve the regulation capacity of the regional system. The regulation resources of the regional system are fully utilized to strengthen the power supply capacity and improve the admissibility region of renewable energy. The conclusions drawn are as follows:
(1) The energy-intensive loads had good regulation ability and could optimize load demand schemes with other flexible resources. Considering the flexible characteristics of electrolytic aluminum, the comprehensive cost could be reduced by 4.7%. On the premise of ensuring that the production meets the requirements, the flexibility and economy of system operation were effectively improved. Through the coordination of wind–solar–thermal–storage and energy-intensive load, the power reliability of energy-intensive load could be guaranteed, the system operating cost could be reduced, and the system operating efficiency could be improved.
(2) Reasonably rated power and capacity of energy storage can improve the regulation ability and reduce the operating costs of the regional system. In addition, reasonable capacity for wind and photovoltaic power can improve the consumption rate of renewable energy and the matching degree between system supply and demand. The interaction with the bulk power grid can ensure a reliable electricity supply and reduce operating costs.
The proposed optimization method can effectively utilize the flexible resources of source–load–storage in regional power grids and increase the proportion of green electricity in areas such as Xinjiang in China, which has abundant renewable energy and a large amount of energy-intensive loads. Meanwhile, the established model can reduce the operating costs of regional power grids and ensure economic efficiency. Our future research will focus on utilizing the stochastic or robust optimization framework to improve the optimization model and consider multiresource collaborative participation in different types of electricity market transactions to increase returns.
Author Contributions

Conceptualization, Z.L. and G.Z.; methodology, M.L.; software, G.Z.; validation, Z.L.; formal analysis, E.Z.; investigation, G.Z.; resources, Z.L.; data curation, G.Z.; writing—original draft preparation, G.Z.; writing—review and editing, Z.L.; visualization, E.Z.; supervision, E.Z.; project administration, Z.L.; funding acquisition, Z.L. All authors have read and agreed to the published version of the manuscript.

Funding

This research was funded by the Key Research Development Program of Xinjiang Uyghur Autonomous Region of China (No. 2022B01016).

Institutional Review Board Statement

Not applicable.

Informed Consent Statement

Not applicable.

Data Availability Statement

Data are contained within the article.

Conflicts of Interest

Zhongzheng Li, Mengke Liao and Erbiao Zhou were employed by the State Grid Xinjiang Electric Power Co., Ltd. The remaining authors declare that the research was conducted in the absence of any commercial or financial relationships that could be construed as a potential conflict of interest.

References

  1. Hu, J.; Qin, K.; Ma, R.; Liu, W.; Zhang, J.; Pang, L.; Zhang, J. A study on carbon emission flow tracking for new type power systems. Int. J. Electr. Power Energy Syst. 2025, 165, 110455. [Google Scholar] [CrossRef]
  2. Meng, X.; Fu, L.; Lai, X.; Sun, Y.; Yang, C.; Wen, F. Optimal configuration of “source-network-load-storage integrated project” considering source-load complementarity characteristics. Electr. Power Autom. Equip. 2024, 44, 123–131. [Google Scholar]
  3. Jordehi, A.R. Optimisation of demand response in electric power systems, a review. Renew. Sustain. Energy Rev. 2019, 103, 308–319. [Google Scholar] [CrossRef]
  4. El-Araby, E.E.; Yorino, N. A demand side response scheme for enhancing power system security in the presence of wind power. Int. J. Electr. Power Energy Syst. 2023, 146, 108714. [Google Scholar] [CrossRef]
  5. Roldán-Blay, C.; Escrivá-Escrivá, G.; Roldán-Porta, C. Improving the benefits of demand response participation in facilities with distributed energy resources. Energy 2019, 169, 710–718. [Google Scholar] [CrossRef]
  6. Park, B.; Chen, Y.; Olama, M.; Kuruganti, T.; Dong, J.; Wang, X.; Li, F. Optimal Demand Response Incorporating Distribution LMP with PV Generation Uncertainty. IEEE Trans. Power Syst. 2022, 37, 982–995. [Google Scholar] [CrossRef]
  7. Shoreh, M.H.; Siano, P.; Shafie-khah, M.; Loia, V.; Catalão, J.P.S. A survey of industrial applications of Demand Response. Electr. Power Syst. Res. 2016, 141, 31–49. [Google Scholar] [CrossRef]
  8. Yao, M.; Hu, Z.; Zhang, N.; Duan, W.; Zhang, J. Low-carbon benefits analysis of energy-intensive industrial demand response resources for ancillary services. J. Mod. Power Syst. Clean Energy 2015, 3, 131–138. [Google Scholar] [CrossRef]
  9. Bao, P.; Zhang, W.; Cheng, D.; Liu, M. Hierarchical control of aluminum smelter loads for primary frequency support considering control cost. Int. J. Electr. Power Energy Syst. 2020, 122, 106202. [Google Scholar] [CrossRef]
  10. Yang, Y.; Yan, H.; Wang, J.; Liu, W.; Yan, Z. System Optimization Scheduling Considering the Full Process of Electrolytic Aluminum Production and the Integration of Thermal Power and Energy Storage. Energies 2025, 18, 598. [Google Scholar] [CrossRef]
  11. Tian, C.; Li, J.; Wang, C.; Lin, L.; Yan, Y. Demand Response Strategy Considering Industrial Loads and Energy Storage with High Proportion of Wind-Power Integration. Sensors 2024, 24, 7335. [Google Scholar] [CrossRef]
  12. Jin, H.; Li, Z.; Sun, H.; Guo, Q.; Chen, R.; Wang, B. A robust aggregate model and the two-stage solution method to incorporate energy intensive enterprises in power system unit commitment. Appl. Energy 2017, 206, 1364–1378. [Google Scholar] [CrossRef]
  13. Yue, X.; Liao, S.; Xu, J.; Ke, D.; Wang, H.; Yang, J.; He, X. Collaborative optimization of renewable energy power systems integrating electrolytic aluminum load regulation and thermal power deep peak shaving. Appl. Energy 2024, 373, 123869. [Google Scholar] [CrossRef]
  14. Jiang, Y.; Wang, Z.; Bian, S.; Liao, S.; Lu, H. Source-Load Collaborative Optimization Method Considering Core Production Constraints of Electrolytic Aluminum Load. Energies 2024, 17, 6396. [Google Scholar] [CrossRef]
  15. Cai, G.; Zhou, J.; Wang, Y.; Zhang, H.; Sun, A.; Liu, C. Multi-objective coordinative scheduling of system with wind power considering the regulating characteristics of energy-intensive load. Int. J. Electr. Power Energy Syst. 2023, 151, 109143. [Google Scholar] [CrossRef]
  16. Zhao, X.; Wang, Y.; Liu, C.; Cai, G.; Ge, W.; Wang, B.; Wang, D.; Shang, J.; Zhao, Y. Two-stage day-ahead and intra-day scheduling considering electric arc furnace control and wind power modal decomposition. Energy 2024, 302, 131694. [Google Scholar] [CrossRef]
  17. Du, Y.; Li, X.; Tan, C.; Tan, Z. Two-stage multi-objective distributionally robust operation optimization and benefits equalization of an off-grid type electric-hydrogen-ammonia-methanol coupling system. Renew. Energy 2024, 236, 121433. [Google Scholar] [CrossRef]
  18. Lee, S.Y.; Lee, G.S.; Moon, S.I.; Yoon, Y.T. Optimization of iron and steel manufacturing plant considering electricity price tariff and electric arc furnace control. IET Gener. Transm. Distrib. 2023, 17, 5027–5040. [Google Scholar] [CrossRef]
  19. Sgouridis, S.; Ali, M.; Sleptchenko, A.; Bouabid, A.; Ospina, G. Aluminum smelters in the energy transition: Optimal configuration and operation for renewable energy integration in high insolation regions. Renew. Energy 2021, 180, 937–953. [Google Scholar] [CrossRef]
  20. Li, H.; Wang, J.; Shen, Z.; Gu, C.; Li, Q.; Ren, Q. Optimal energy base planning method with integrated industry high-consumption demand response and dynamic line rating. Electr. Power Syst. Res. 2023, 225, 109795. [Google Scholar] [CrossRef]
  21. Angizeh, F.; Parvania, M.; Fotuhi-Firuzabad, M.; Rajabi-Ghahnavieh, A. Flexibility Scheduling for Large Customers. IEEE Trans. Smart Grid 2019, 10, 371–379. [Google Scholar] [CrossRef]
  22. Lin, S.; He, T.; Shen, Y.; Qian, L.; Li, D.; Li, F. Bilevel optimal dispatch model for a peak regulation ancillary service in an industrial park of energy-intensive loads. Electr. Power Syst. Res. 2024, 230, 110272. [Google Scholar] [CrossRef]
  23. Liao, S.; Xu, J.; Sun, Y.; Bao, Y.; Tang, B. Control of Energy-Intensive Load for Power Smoothing in Wind Power Plants. IEEE Trans. Power Syst. 2018, 33, 6142–6154. [Google Scholar] [CrossRef]
  24. Xu, J.; Liao, S.; Sun, Y.; Ma, X.; Gao, W.; Li, X.; Gu, J.; Dong, J.; Zhou, M. An Isolated Industrial Power System Driven by Wind-Coal Power for Aluminum Productions: A Case Study of Frequency Control. IEEE Trans. Power Syst. 2015, 30, 471–483. [Google Scholar] [CrossRef]
  25. Liao, S.; Xu, J.; Sun, Y.; Bao, Y. Local utilization of wind electricity in isolated power systems by employing coordinated control scheme of industrial energy-intensive load. Appl. Energy 2018, 217, 14–24. [Google Scholar] [CrossRef]
  26. Xu, J.; Chen, Y.; Liao, S.; Sun, Y.; Yao, L.; Fu, H.; Jiang, X.; Ke, D.; Li, X.; Yang, J.; et al. Demand side industrial load control for local utilization of wind power in isolated grids. Appl. Energy 2019, 243, 47–56. [Google Scholar] [CrossRef]
  27. Zhang, G.; Li, F. Decentralized robust unit commitment for AC/DC interconnected power systems considering wind power uncertainty. Int. J. Electr. Power Energy Syst. 2022, 1411, 108203. [Google Scholar] [CrossRef]
Figure 1. The structural framework of the source–load–storage integrated system.
Sustainability 17 07321 g001
Figure 2. The predicted power curves of wind power and photovoltaic power.
Sustainability 17 07321 g002
Figure 3. The power prices purchased from the main grid in the dispatch periods.
Sustainability 17 07321 g003
Figure 4. The scheduling plan for the source–load–storage system in the dispatch periods.
Sustainability 17 07321 g004
Figure 5. The operation plan for the electrolytic aluminum load.
Sustainability 17 07321 g005
Figure 6. Load power curve of electrolytic aluminum under different cases.
Sustainability 17 07321 g006
Figure 7. Charging and discharging power and SOC curves of electrical energy storage.
Sustainability 17 07321 g007
Figure 8. Charging and discharging power under different rated capacities of energy storage.
Sustainability 17 07321 g008
Figure 9. Hydrogen supply and demand plan.
Sustainability 17 07321 g009
Figure 10. Electrolytic water hydrogen production plan and hydrogen storage charging and discharging plan.
Sustainability 17 07321 g010
Figure 11. Power purchase plan from the bulk power system under different power purchase restrictions.
Sustainability 17 07321 g011
Figure 12. Energy consumption curve of polysilicon load under different adjustable numbers of reduction furnaces.
Sustainability 17 07321 g012
Table 1. Operating parameters of thermal power units.
P g , max (MW) P g , min (MW) a g (CNY/MW2) b g (CNY/MW) c g
(CNY)
R g dw ,   R g up (MW/h) T g on ,   T g off (h) c u , g ,   c d , g (CNY)
6602400.00625002008600,000
Table 2. Operating parameters of the polysilicon load.
Number of Reduction Furnaces P n , t SI , res
(MW)
P n , t SI , other
(MW)
T n , off SI , min
(h)
η SI
(MWh/t)
c order SI (t) c max SI (t)
100621243250340
Table 3. Operating parameters of the electrolytic aluminum load.
P i AI , rated /MW P i , max AI , adjust /MW P i , min AI , adjust /MW T i , max AI , ON /h T i , min AI , OFF /h N i , max AI , adjust c order AI
20020−30234400
33633.6−50.4243600
505−7.5223100
Table 4. Operating results under different cases.
Total Cost/CNYGeneration Cost/CNYStartup Cost/CNYPurchased Power Cost/CNYHydrogen Sale Income/CNY
Case 13,102,4702,376,2040831,266105,000
Case 22,956,7232,330,2680731,455105,000
Table 5. Optimization results under different rated powers and capacities of energy storage.
Storage
Capacity
Total Cost/CNYGeneration Cost/CNYStartup Cost/CNYPurchased Power Cost/CNYHydrogen Sale Income/CNY
300 MW/2 h3,098,2542,385,6110817,643105,000
300 MW/3 h3,027,1992,357,5660774,633105,000
300 MW/4 h2,956,7242,330,2680731,455105,000
200 MW/4 h3,053,4862,380,9830777,503105,000
100 MW/4 h3,154,9042,497,0300762,875105,000
Table 6. Optimization results under different installed capacities of renewable energy.
Wind + Photovoltaic CapacityTotal Cost/CNYGeneration Cost/CNYPurchased Power Cost/CNYHydrogen Sale Income/CNYPower Abandonment Penalty Cost/CNYAbandoned Power Rate
1000 MW + 1000 MW2,956,7232,330,268731,455105,00000
2000 MW + 1000 MW5,462,5871,511,4140105,0004,056,17314.59%
1000 MW + 2000 MW3,966,2672,195,780280,071105,0001,595,4167.49%
1500 MW + 1500 MW3,510,7121,768,1040105,0001,847,6087.53%
500 MW + 1000 MW4,876,2172,914,3772,066,840105,00000
1000 MW + 500 MW3,604,4282,606,9031,102,525105,00000
750 MW + 750 MW4,225,8022,806,4591,524,343105,00000
Table 7. Optimization characteristics of different methods.
Thermal UnitRenewable
Energy
Energy
Storage
Polysilicon
Load
Electrolytic
Aluminum Load
Purchase
Power
Method 1 [13,14]×××
Method 2 [10]××
Method 3 [22]××
Method 4
Table 8. Comparison of optimization results of different methods.
Total Cost/CNYGeneration Cost/CNYPurchased Power Cost/CNYHydrogen Sale Income/CNY
Method 13,463,2593,019,3840105,000
Method 22,929,5883,034,5880105,000
Method 32,876,1352,616,824364,311105,000
Method 42,810,9692,274,378641,591105,000
Disclaimer/Publisher’s Note: The statements, opinions and data contained in all publications are solely those of the individual author(s) and contributor(s) and not of MDPI and/or the editor(s). MDPI and/or the editor(s) disclaim responsibility for any injury to people or property resulting from any ideas, methods, instructions or products referred to in the content.