Article

Improved DeepLabV3+ for UAV-Based Highway Lane Line Segmentation

1
School of Intelligent Manufacturing Modern Industry, Xinjiang University, Urumqi 830017, China
2
School of Traffic and Transportation Engineering, Xinjiang University, Urumqi 830017, China
3
Xinjiang Key Laboratory of Green Construction and Smart Traffic Control of Transportation Infrastructure, Xinjiang University, Urumqi 830017, China
4
Xinjiang Transportation Planning and Survey & Design Research Institute Co., Ltd., Urumqi 830017, China
*
Author to whom correspondence should be addressed.
Sustainability 2025, 17(16), 7317; https://doi.org/10.3390/su17167317
Submission received: 4 June 2025 / Revised: 4 August 2025 / Accepted: 11 August 2025 / Published: 13 August 2025
(This article belongs to the Section Sustainable Transportation)

Abstract

Sustainable highway infrastructure maintenance critically depends on precise lane line detection, yet conventional inspection approaches remain resource-depleting, carbon-intensive, and hazardous to personnel. To mitigate these constraints and address the low accuracy and high parameterization of existing models, this study utilizes unmanned aerial vehicle (UAV) imagery and proposes a UAV-based highway lane line segmentation method using an improved DeepLabV3+ model that resolves multi-scale lane line segmentation challenges in UAV imagery. MobileNetV2 is used as the backbone network to significantly reduce the number of model parameters. The Squeeze-and-Excitation (SE) attention mechanism is integrated to enhance feature extraction capabilities, particularly at lane line edges. A Feature Pyramid Network (FPN) is incorporated to improve multi-scale lane line feature extraction. We introduce a novel Waterfall Atrous Spatial Pyramid Pooling (WASPP) module, utilizing cascaded atrous convolutions with strategic dilation rate adjustments to progressively expand the receptive field and aggregate contextual information across scales. The improved model outperforms the original DeepLabV3+ by 5.04% mIoU (85.30% vs. 80.26%) and 3.35% F1-Score (91.74% vs. 88.39%) while cutting parameters by 85% (8.03 M vs. 54.8 M) and reducing training time by 2 h 50 min, thereby enhancing the model’s accuracy in lane line segmentation, reducing the number of parameters, and lowering the carbon footprint.

1. Introduction

As a crucial component of transportation infrastructure, lane lines play a significant role in ensuring traffic safety, advancing autonomous driving technology, and promoting sustainable development [1,2]. Efficient lane line detection technology can enhance the maintenance efficiency of highways, reduce traffic congestion and energy waste caused by poor road conditions, and consequently lower vehicle carbon emissions. Moreover, the optimized management of road infrastructure through precise lane line detection can extend the lifespan of roads and mitigate the resource consumption and environmental impacts associated with frequent repairs. Additionally, autonomous driving technology relies heavily on accurate lane line recognition, and its widespread application can improve the overall efficiency of the transportation system, reduce traffic accidents, and thereby provide strong support for the sustainable development of society and the economy. In addition, poor lane line visibility has been shown to increase accident rates [3]. Therefore, high-precision and high-efficiency lane line detection technology is not only an important research direction in the field of transportation but also a key element in driving sustainable transportation development and achieving resource conservation and environmental protection.
According to the different sources of sensing data, there are two main means of lane line detection: one is the LiDAR-based lane line detection method, and the other is the vision-based lane line detection method. LiDAR-based lane line detection technology mainly utilizes the high-precision 3D (three-dimensional) point cloud data acquired by LiDAR to accurately identify lane lines through feature extraction, clustering segmentation, curve fitting, and other steps, which tends to be characterized by high detection accuracy and a slow detection rate. Some researchers [4,5,6,7,8] use LiDAR to obtain lane line point cloud data and establish a lane line detection model for the extraction of lane lines. However, the price of radar equipment is generally high, which greatly increases the development costs, and there are obstacles in the view of the vehicle’s video that cannot be comprehensively detected on the complete roadway lane lines, leading to the phenomenon of occlusions and omissions in detection.
Vision-based lane line detection methods are gradually becoming mainstream; traditional vision-based lane line detection methods mainly include lane line feature-based or model-based methods. The basic principle of lane line detection based on lane line features utilizes the feature differences between the edge of the lane markings and the surrounding environment of the pavement image for detection. Typically, the feature differences include the texture of the image, the geometry of the lane edges, and the lane width. Rui et al. [9] used the Canny operator to detect the edges of the image region of interest, and then lane lines were detected by improving the Hough transform; Wei et al. [10] improved the speed of lane line detection by replacing the Canny operator in the Hough transform with a Robert operator. Duan et al. [11] proposed a threshold segmentation algorithm. The thresholding algorithm based on the median filter and the Flood Fill algorithm binarizes grayscale images to enhance lane line features. The basic principle of model-based lane line detection is to recognize lane lines by building corresponding lane line models for the geometric features of structured roads and identifying the road model parameters. For example, Chen et al. [12] solved the lane line occlusion problem in multi-lane scenarios based on the Gaussian Mixture Model (GMM). Li et al. [13] proposed a lane line detection method based on the Reformer model, which utilizes the Locally Sensitive Hashing (LSH) attention mechanism and the reversible Transformer structure to overcome the high-complexity problem of the traditional Transformer model. Some researchers modeled lane lines based on their geometry and fitted the model using least squares regression or the Random Sample Consensus (RANSAC) algorithm to estimate lane boundaries [14].
The current vision-based lane line detection method is mainly based on the deep learning lane line detection method. Through the construction of artificial neural networks and the use of massive datasets to train the network, the method can autonomously learn to obtain features, has a good robustness to complex environments, and has a more widespread application [15]. Scholars have conducted various studies on different neutral networks. In the field of target detection, Lu et al. [16] proposed an improved YOLOv5s (You Only Look Once version 5 small) model for lane line detection, which combines DWConv (Depthwise Separable Convolution) with GhostBottleneck to replace the CSP (Cross Stage Partial) structure in YOLOv5s, and dramatically improves the detection speed at the expense of accuracy. In the field of instance segmentation, Davy Neven et al. [17] proposed an end-to-end lane line detection method, LaneNet, which defines the lane line detection problem as an instance segmentation problem for the first time. Liu et al. [18] proposed a conditional convolution-based top-down lane line detection framework, CondLaneNet. Liu et al. [19] proposed a conditional convolution-based Mask R-CNN (Mask Region-based Convolutional Neural Network) lane line detection algorithm. In addition to the above two areas, deep learning-based semantic segmentation methods have also become the core research topic in the current computer vision field; semantic segmentation aims to categorize images or videos into semantic categories pixel by pixel. In recent years, deep learning-based semantic segmentation methods such as FCN (Fully Convolutional Network) [20], PSPNet (Pyramid Scene Parsing Network) [21], and DeepLab series [22,23,24,25] have made significant progress; these methods extract image features through convolutional neural networks and combine multi-scale information and contextual relationships to achieve the accurate segmentation of complex scenes. More and more researchers are applying these methods to lane line segmentation tasks [26,27,28,29]. Among them, DeepLabV3+, proposed by Google, is considered one of the classic structures for semantic segmentation. This method performs better in lane line detection, but the model parameter count is large, the prediction speed is slow, and it is affected by problems such as light changes, weather complexity, the serious wear and tear of lane lines in long-term service, and the complexity of the road scene leading to serious occlusion, etc., which results in loss of detailed lane line features and poor detection accuracy. The detection accuracy is not high. Moreover, the current lane line detection method only detects white lane lines and lacks research on lane lines of different shapes (solid lines, dashed lines) and colors (white lines, yellow lines).
Traditional lane line inspection is mainly performed by manual inspection or vehicle-assisted inspection [30], which is inefficient, unsafe, highly labor-intensive, and incurs substantial economic costs [31]. In recent years, Unmanned Aerial Vehicles (UAVs) have become a popular means of highway information collection due to their easy operation, high mobility, low cost, and ability to easily carry many types of sensors. Because UAVs are not affected by ground traffic, they are now widely used in the fields of traffic supervision, highway inspection, etc. [32,33], so high-resolution UAV highway images are a high-quality data source for lane line detection. However, UAV flights are affected by atmospheric turbulence [34] and adverse weather such as rain or snow [35], and the images they capture under low-light conditions are of poor quality [36]. Moreover, when using UAVs for lane line detection, the approach lacks robustness to shadow occlusion and snowy environments, and the model’s high parameter count makes it difficult to deploy on UAV systems [37].
To solve the above problems of highway lane line detection, this paper proposes a highway lane line segmentation algorithm based on improved DeepLabV3+ for UAV images. The contributions are fourfold:
  • Lightweight Backbone: MobileNetV2 replaces the original Xception-65 backbone, drastically reducing the parameters while maintaining its feature extraction ability;
  • Edge-Aware Attention: SE (Squeeze-and-Excitation) modules enhance channel-wise feature recalibration, prioritizing lane line edges;
  • Multi-Scale Fusion: FPN (Feature Pyramid Network) integrates shallow texture details and deep semantics for the improved detection of dashed lines and occluded regions.
  • Adaptive Receptive Fields: The WASPP (Waterfall Atrous Spatial Pyramid Pooling) module cascades atrous convolutions with dilation rates (2, 4, 6) to progressively expand receptive fields, capturing fine-grained lane structures.

2. Materials and Methods

2.1. Data Sources

The data used in this paper contains three main parts: (1) The data is sourced from the UAVDT (UAV Detection and Tracking) public dataset [38]. Some of the UAV ortho view images captured from an urban road are selected, which include two main parts: one part contains white solid line and yellow solid line lane line images in a normal environment with an image resolution of 1024 × 540, and the other part contains white solid line and white dashed line lane line images in a low-light environment with an image resolution of 640 × 640; (2) Acquired from a highway in Xinjiang, the data contains two videos of a UAV flight with a 45 m orthographic view, and one image is retained every 20 frames. This mainly consists of two parts: one part contains images of white solid lines and white dashed lane lines in a normal environment; the other part contains images of white solid lines and white dashed lane lines in a snowy environment, both with an image resolution of 5472 × 3648. (3) Collected from a highway in Xinjiang, the data contains two videos of a UAV flying at 10 m orthographic view, retaining one image every 20 frames, containing pictures of white solid lines and yellow dashed lane lines in a normal environment, with an image resolution of 3840 × 2160. The total number of images in all three parts is 864.
In order to improve the robustness of the model, random rotation (0–360°), scaling (0.5–1.5×), horizontal/vertical panning (0–15% of image dimensions), cropping (640 × 640), the addition of Gaussian noise (var = 200), and low-light simulation were used for image enhancement. The total number of enhanced images is 6048, which were divided into a training set, validation set, and test set in a ratio of 8:1:1, with the sets containing 4838, 605, and 605 images, respectively. Part of the dataset is shown in Figure 1.
The images were labeled using the open-source annotation software LabelMe 3.16.7 to classify the lane lines into four categories, and the number and color of the lane line categories and labels are shown in Table 1.

2.2. Traditional DeepLabV3+ Network Model

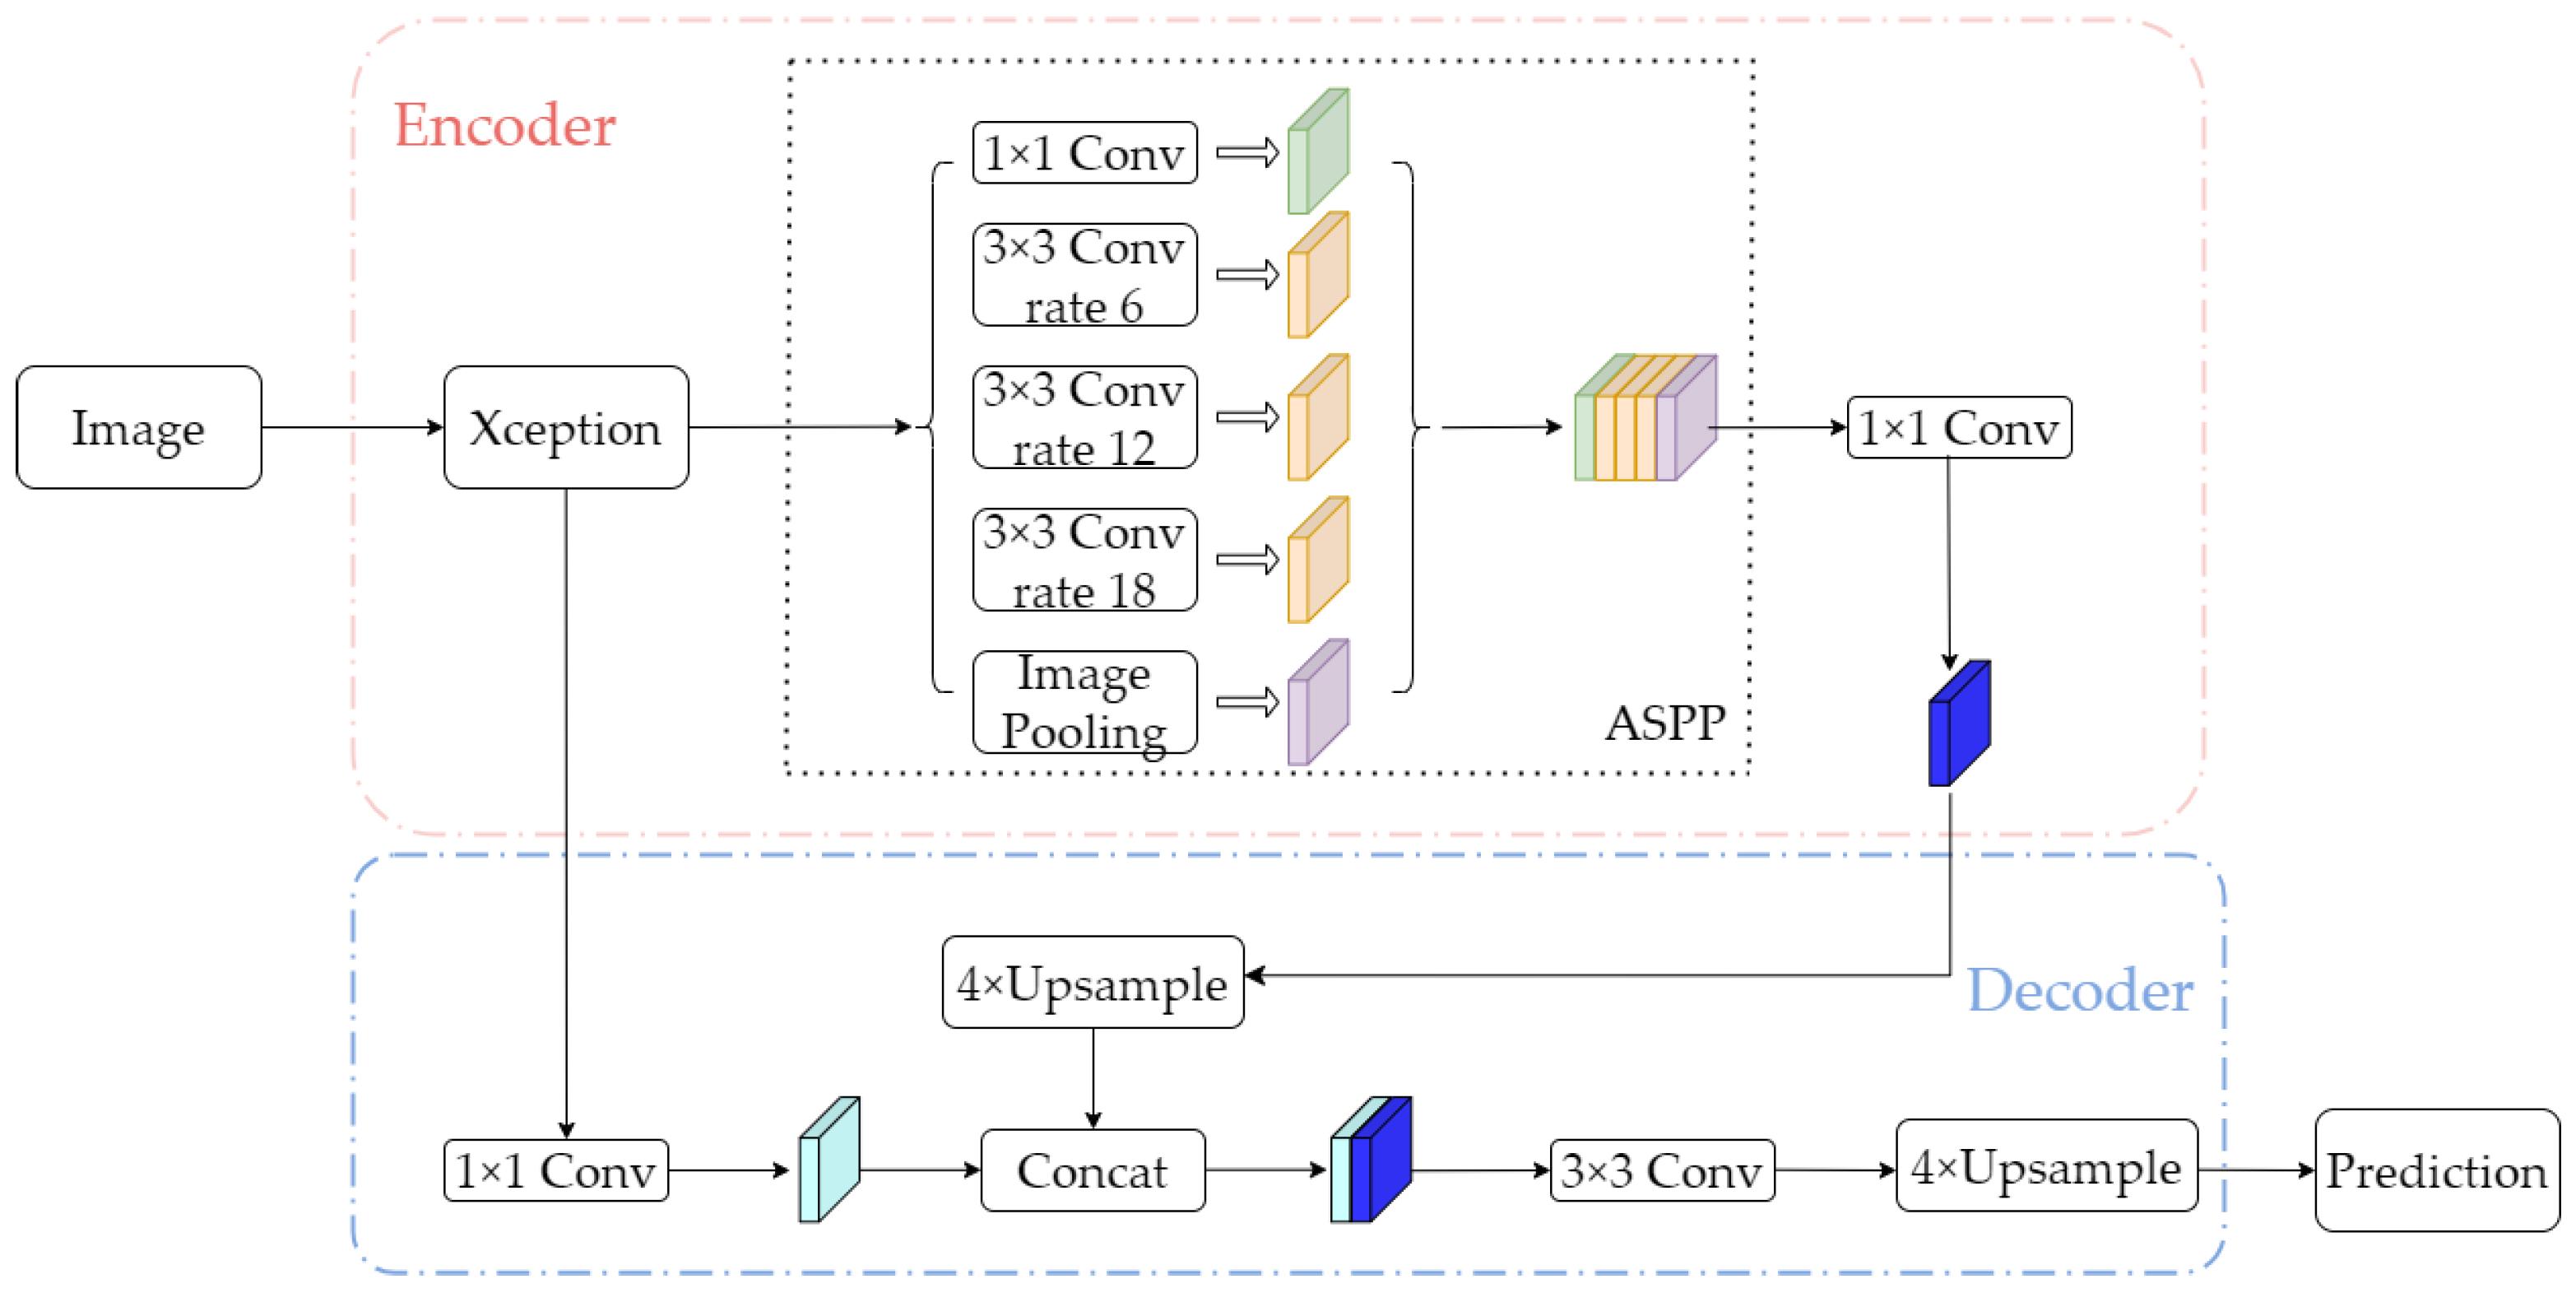
DeepLabV3+ [25] is a classical model of semantic segmentation introduced by Google, with a main structure of Encoder–Decoder (ED) [39]. The encoder part mainly consists of a backbone network (Xception-65 [40], etc.) and an Atrous Spatial Pyramid Pooling (ASPP) [23] module. Compared with standard convolutions, the depthwise separable convolutions inside Xception-65 decompose each convolution into a depthwise operation followed by a pointwise 1 × 1 convolution, cutting the parameter count by roughly 8–9× while preserving representational power. The backbone network obtains rich semantic information from the input image: the shallow semantic features output from the middle layer of the backbone network are fed into the decoder and the deeper features, which are extracted step-by-step by means of multilayer convolutional operations, are fed into the ASPP module, which contains multiple parallel atrous convolution branches with different dilation rates and a global average pooling branch. Atrous convolution expands the sensory field by inserting zeros between the convolution kernel elements, and can capture image features at different scales without increasing the number of parameters or computational effort. Convolutional branches with different dilated rates can capture both local details and global contextual information in the image, making the model more adaptable to targets of different sizes. Atrous convolution layers with different dilation rates yield varying receptive fields; this multi-scale design is particularly suitable for detecting lane lines of diverse widths and lengths. The global average pooling branch can provide the global semantic information of the image and enhance the model’s understanding of the image as a whole, and the output feature maps of these branches, after fusion, can represent the semantic information of the image more comprehensively and improve the accuracy of semantic segmentation. In the decoder part, the model fuses the shallow semantic features output from the middle layer of the backbone network with the deep semantic features output from the ASPP to gradually recover the spatial resolution of the image, and the decoder utilizes the up-sampling operation and the feature-fusion strategy to combine the high-level semantic features with the high-resolution features of the lower layer and recover the edge and detail information in the image while retaining the semantic information. The network structure is shown in Figure 2.

2.3. Improved DeepLabV3+ Model

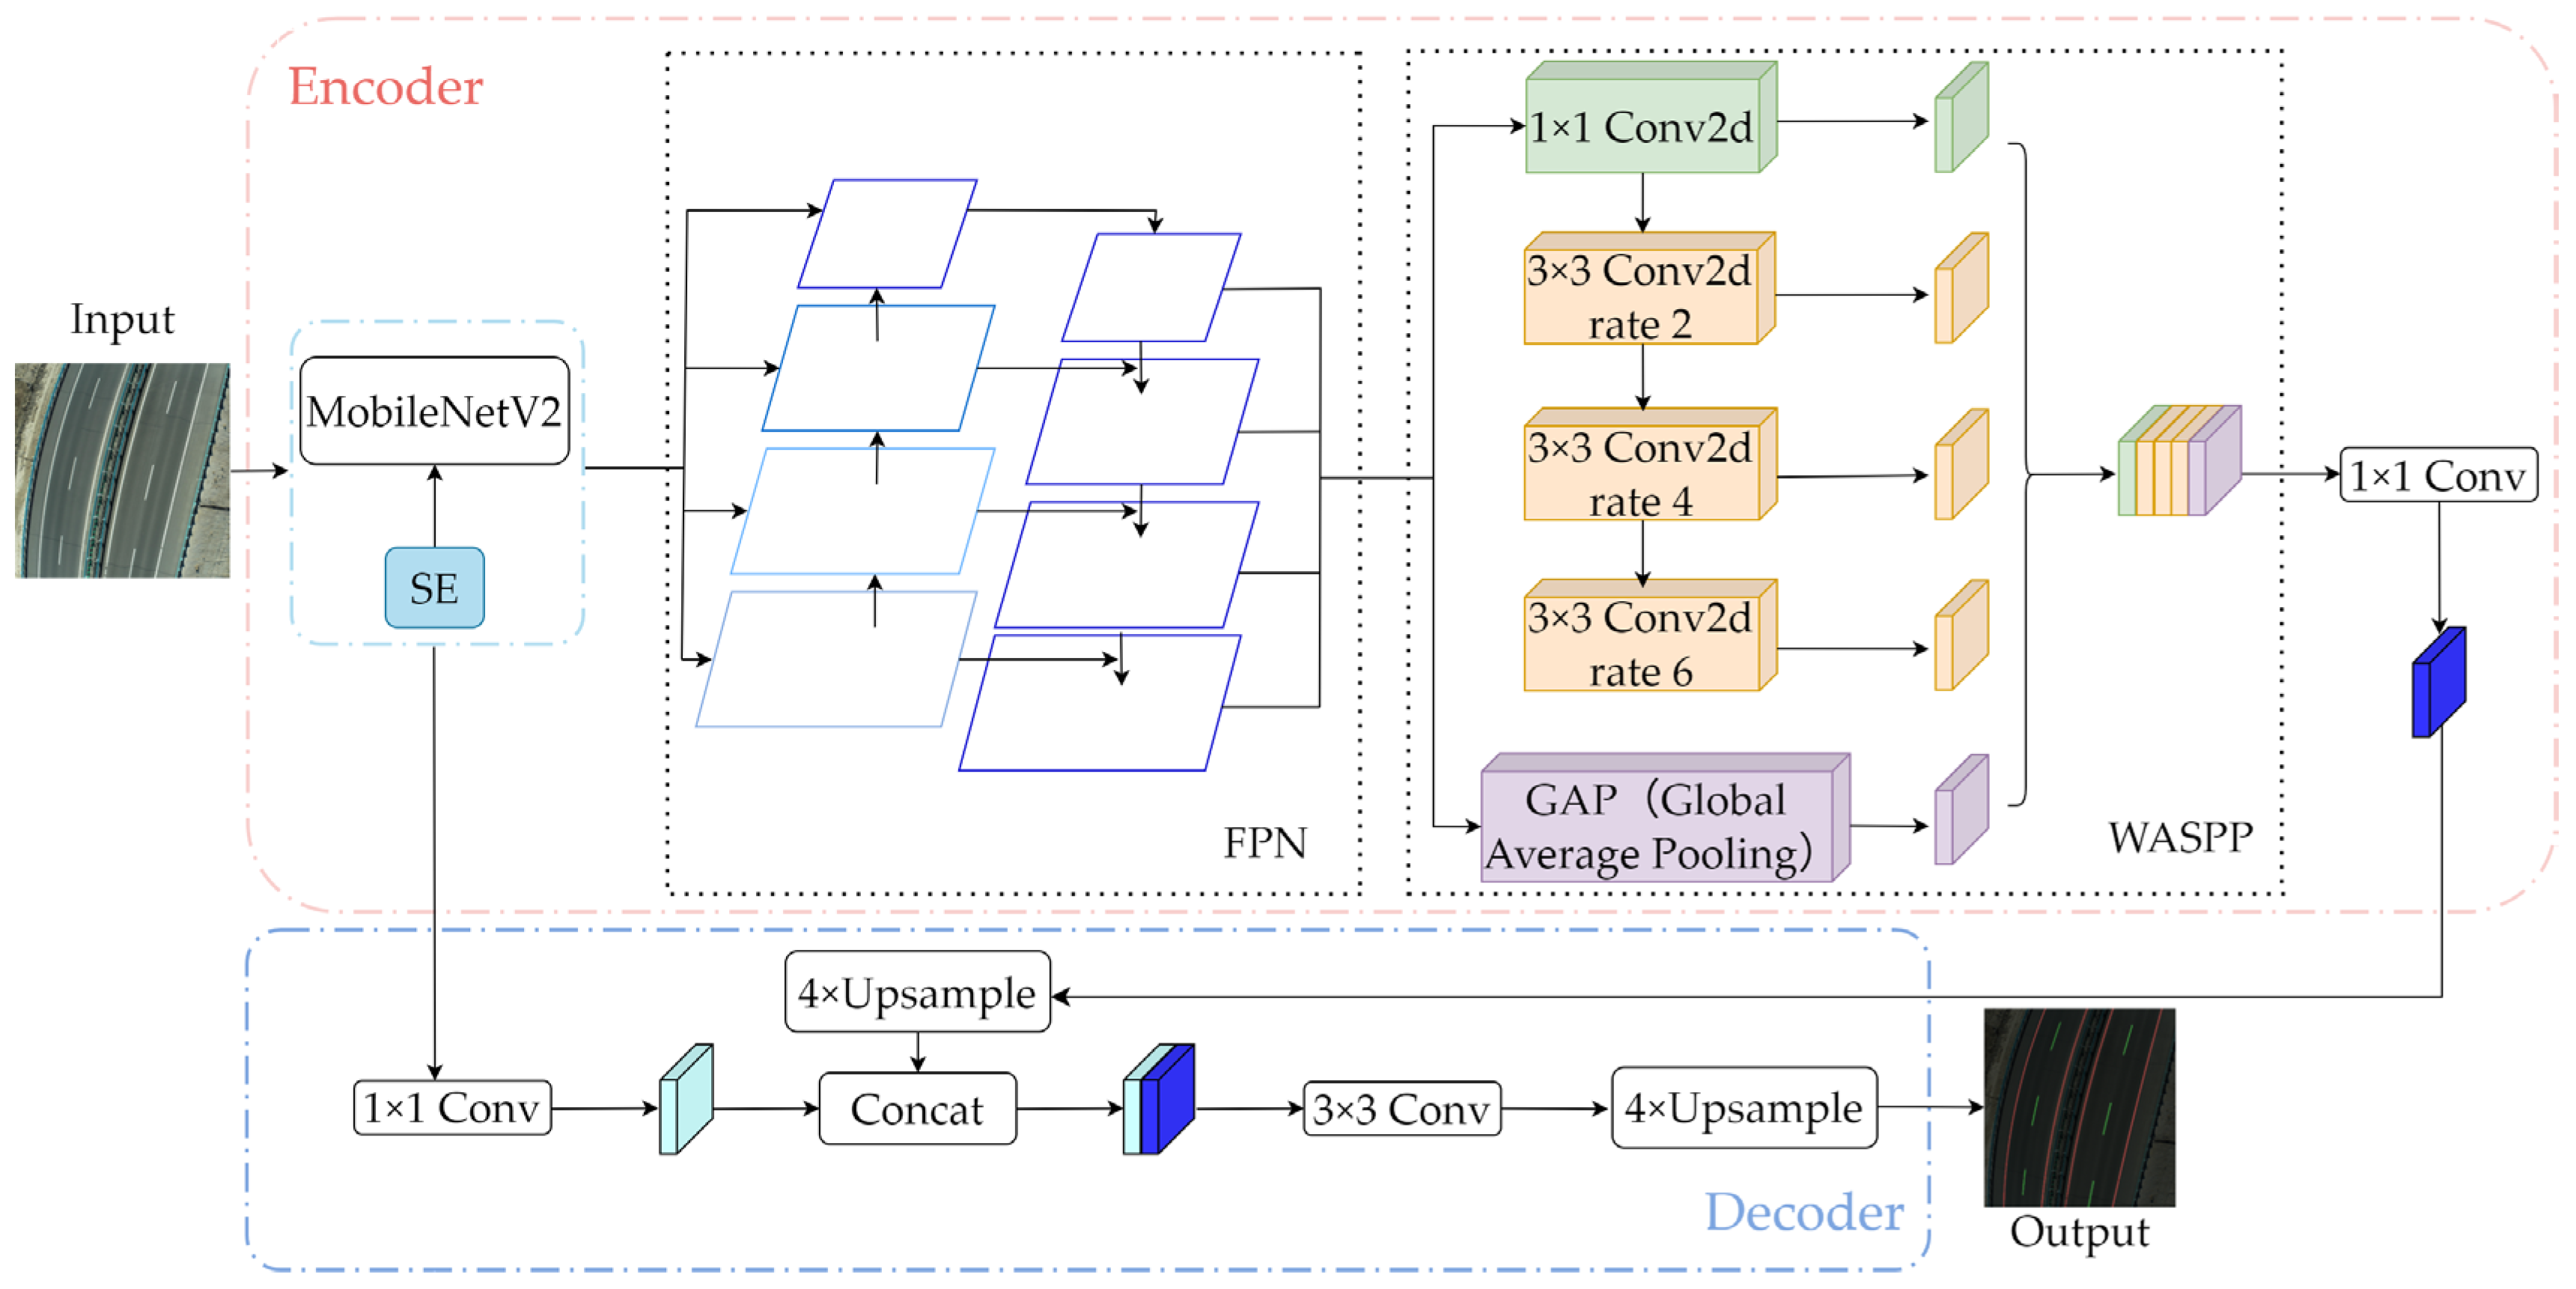
To improve the model’s detection accuracy for different kinds of lane lines and to reduce the number of parameters of the model, this paper improves the DeeplabV3+ model in the following four aspects. First, the MobileNetV2 [41] network is used to replace the backbone network to reduce the number of parameters of the model; second, the channel attention network SE (Squeeze-and-Excitation) [42] is introduced after each inverted residual block of the backbone network, which enhances the extraction of features from the output of each channel, and improves the model’s ability to extract features from the edges of lane lines; then, the FPN (Feature Pyramid Network) [43] is introduced to improve the detection accuracy of lane lines with different colors and scales; finally, the original model is replaced by the cascade-structured and improved WASPP (Waterfall Atrous Spatial Pyramid Pooling) module with the ASPP module and the dilation rates of atrous convolution are adjusted to enhance the ability to extract lane line edge features while improving the segmentation accuracy of small-scale dashed lane lines. The improved DeepLabV3+ model is shown in Figure 3.

2.3.1. Replacement of the Backbone Network

The backbone network Xception-65 of DeepLabV3+ has a large number of parameters and a long training time and prediction time. This is mainly attributed to its dual-branch residual structure and three-stage Entry–Middle–Exit layout, which collectively introduce a considerable parameter overhead. In this paper, we use a lightweight backbone network, MobileNetV2, to replace Xception-65, which effectively reduces the number of model parameters and the training time while improving the prediction speed. MobileNetV2 is a lightweight convolutional neural network model proposed by Google. We specifically adopt MobileNetV2-1.0 (the standard width multiplier α = 1.0) as the backbone [41], which adds linear bottlenecks and inverted residual structures based on the depth-separable convolution introduced in MobileNetV1 [44]. Bottlenecks and Inverted Residuals are added to MobileNetV1 to ensure a the number of model parameters is reduced while improving the feature representation. Layer 1 is a 3 × 3 convolutional layer, and layers 2 to 18 are the inverted residuals’ structure. Since MobileNetV2 only outputs the features of the last layer, this paper adapts the FPN by selecting feature layers 1, 3, 6, and 18 as outputs, with corresponding channel numbers of 24, 32, 96, and 320, respectively. Using the experimental data of a 640 × 640 × 3 image as the input, we use the 640 × 640 × 3 image as the input. The MobileNetV2 network structure in this paper is shown in Table 2, where t denotes the channel multiplier, c denotes the channel size, n denotes the number of repetitions, and s denotes the step size.

2.3.2. Introduction of the SE Attention Mechanism

The basic idea of the attention mechanism is to mimic the human visual attention mechanism by assigning different weights to different parts of the input data, so that the model can dynamically focus on the most important information for the current task, which is one of the most important means of improving the performance of semantic segmentation networks. Common attention mechanisms include spatial attention, channel attention, and convolutional attention. In this paper, after replacing the backbone network with MobileNetV2, channel attention network SE is introduced in the last part of each inverse residual block. The core idea is to increase the attention to lane line edge features by weighting the channels of the feature map so that the network can adaptively learn the importance of different channels. Its architecture is shown in Figure 4.
In Figure 4, X (W′ × H′ × C′) denotes the input feature map, Ftr is the transformation function, and U (W × H × C) is the feature map obtained after the convolutional transformation. Fsq is the squeeze function, Fex is the excitation function, and Fscale is the scale function. Finally, X   ~ (W × H × C) signifies the re-weighted output feature map produced by the SE module.
The SE attention mechanism consists of three main steps: Squeeze, Excitation and Scale.
The feature map X∈RC × H × W is input and then convolved by Ftr to generate the feature map U∈RC × H × W. Firstly, the feature map U (W × H × C) containing the global letter is directly compressed into a 1 × 1 × C feature vector Z by Fsq. The channel features of the C feature maps are all compressed into a single numerical value zc, defined as follows:
z c   =   1 H × W i = 1 H j = 1 W u c ( i , j )
where zc denotes the result of the c-th channel after global average pooling.
Then, there is an Excitation module consisting of two fully connected layers: the first fully connected layer reduces the number of channels and nonlinearly transforms the ReLU activation function, and the second fully connected layer combines the Sigmoid activation function to generate the attentional weights for each channel, which reflect the importance of the channel to the current task.
s 1 = ReLU W 1 · z
s 2 = Sigmoid W 2 · s 1
where s1 is the output of the first fully connected layer, W1 is a weight matrix of shape (C/r) × C, s2 is the final channel attention weight vector, and W2 is a weight matrix of shape C × (C/r), r denotes the reduction ratio.
Finally, the Scale module multiplies the channel weights obtained from the excitation operation with the original feature map U on a channel-by-channel basis, thus weighting the feature map, enhancing important features, suppressing unimportant features, and obtaining the final output of the SE module X ~ .
X ˜ C = F scale u c , s c = s c u c
Equations (1)–(4) are all derived from Reference [42].
Through the channel-wise adaptive feature re-weighting mechanism described above, the SE module significantly enhances the network’s perception of lane line edges features. The SE module appends only two fully connected layers after each inverted residual block of MobileNetV2, introducing an additional ΔParams = 2 Σ (C2/r) parameter with a reduction ratio r = 4. In the network used in this paper, the introduction of 17 SE modules increases the model parameters by only 0.22 M, corresponding to a relative increase of 3.78%.

2.3.3. Introduction of the FPN

The basic idea of FPN is to connect the rich edge, texture and other detail information of shallow feature maps with the rich semantic information of deeper feature maps to generate feature pyramids. The feature maps at different levels have both the detail characteristics of the corresponding scales and rich semantics, making them suitable for detecting targets of different sizes, and they can effectively improve the detection accuracy, especially for multi-scale targets with significant effect.
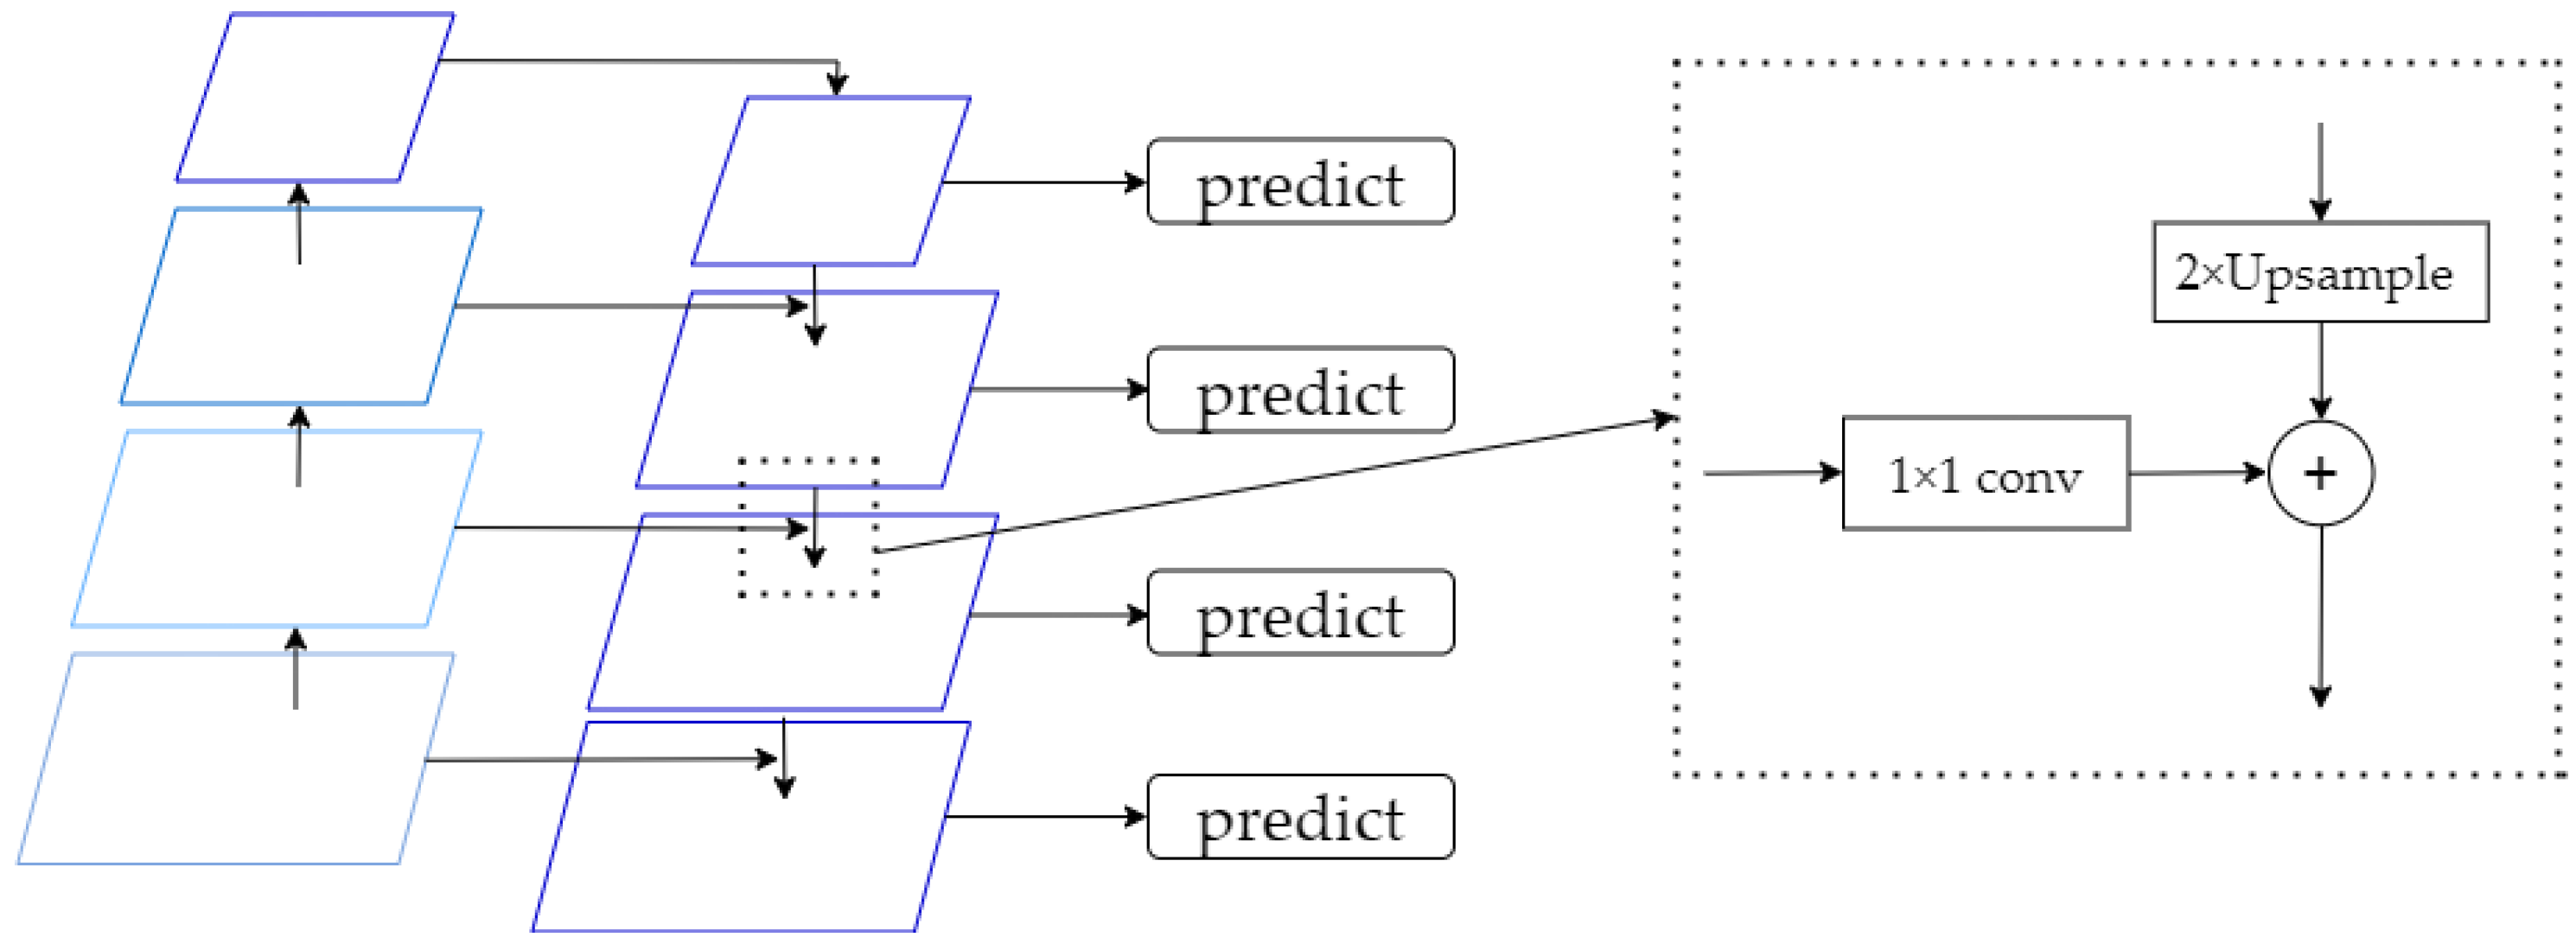
Based on the RPN [45], FPN extracts different levels of feature maps through multiple convolution and pooling operations, and then constructs a top-down path to fuse the high-level feature maps with the corresponding scales of the low-level feature maps through the up-sampling operation and generates a series of feature maps with different scales and richer semantic information through the 1 × 1 convolutional transverse connection, forming a feature pyramid. Its network architecture is shown in Figure 5.
In UAV aerial imagery, due to variations in flight altitude and camera parameters, and the fading of lane lines due to weathering, lane lines exhibit significant differences in color and scale. A single-scale feature extractor cannot simultaneously handle these multi-scale characteristics. Therefore, FPN is incorporated after the MobileNetV2 backbone. FPN receives four feature layers’ output from MobileNetV2, and each layer adjusts the number of channels to 256 by 1 × 1 convolution, and then performs top-down feature fusion. The shallow feature map of FPN contains rich subtle features, such as lane line edges, texture, and color, which help the model to identify the differences in lane lines in different locations and under different wear levels, thus realizing the fine segmentation of different kinds of lane lines; additionally, the deep feature map of FPN can help the model to understand the contextual environment in which the lane lines are located and therefore classify them more accurately. Its downward lateral connections fuse the aforementioned shallow features with deep features, enabling the integration of multi-scale lane line characteristics.

2.3.4. WASPP Module

Inspired by the WASP (Waterfall Atrous Spatial Pooling) module proposed by Artacho et al. [46], this paper proposes an improved Atrous Spatial Pyramid Pooling module, WASPP (Waterfall Atrous Spatial Pyramid Pooling). Unlike the original ASPP with its parallel multi-branch structure, WASPP is an enhanced multi-scale feature extraction module whose core idea is to progressively enlarge the receptive field through a cascaded atrous convolution structure. This cascade mechanism integrates context across scales in a smoother and more continuous manner, avoiding the abrupt or discontinuous context aggregation that can arise in ASPP when branches with large and sparsely spaced dilation rates (e.g., 6, 12, 18) are processed in parallel. A side-by-side illustration of the ASPP and WASPP architectures is provided in Figure 6.
The module first inputs a feature map, and then constructs five branches, including a 1 × 1 convolutional branch, three 3 × 3 atrous convolutional branches with dilation rates of 2, 4, and 6, respectively, and a Global Average Pooling (GAP) branch. These branches are concatenated in a waterfall fashion: the first branch receives the original feature map, the second, third, and fourth branches take the output of the preceding branch as their input, and the fifth branch receives the original feature map. Finally, the feature maps produced by all branches are fused along the channel dimension and forwarded as the output. The pseudocode for the WASPP module is shown in Table 3.
Due to the significant difference in the scale of lane lines due to the change in UAV flight altitude, it is difficult to capture the lane line features at different scales simultaneously with the convolution of traditional fixed receptive fields. In contrast, WASPP can adapt to the multi-scale characteristics of different types of lane lines by progressively expanding the receptive field through cascading atrous convolution. The global average pooling branch can obtain the global context information of lane lines from the overall image level and grasp the general layout of lane lines in the whole image, which provides the model with a better ability to perceive lane lines at different scales. Compared with the discrete expansion rate of ASPP, continuous expansion can avoid feature jumps and improve the detection accuracy of small-scale lane lines (e.g., fine dashed lines).
A smaller dilation rate can lead to a smaller sensory field, which can capture the local details in the image more finely, and performs notably better in the segmentation of edges and small objects [47]. Therefore, in this part, the dilation rates of the atrous convolution layer in the ASPP module are adjusted from (6, 12, 18) to (2, 4, 6) and applied to the WASPP module so that the convolution kernel has denser sampling points on the feature map, which helps it to capture the fine structure and edge information of lane lines, making the detection results finer and more accurate.

3. Experimental Results and Analysis

3.1. Experimental Environment

The experiments were conducted on a Windows 10 workstation equipped with an AMD Ryzen 9 5950X CPU, 32 GB RAM (Advanced Micro Devices, Inc., Santa Clara, CA, USA), and an NVIDIA GeForce RTX 3090 Ti GPU (NVIDIA Corporation, headquartered in Santa Clara, CA, USA). The code was developed in Python 3.8 using PyTorch 1.7 within the PyCharm 2021 IDE.
To reduce the training time of the model, this paper divides the training process into a freezing phase and an unfreezing phase through the transfer learning idea. The freezing training phase freezes the backbone weights of the model and uses more resources to train the network parameters of the later part of the mode. The Batchsize of the freezing phase is set to 16, and the number of training rounds is set to 50. In the unfreezing phase, the parameters of the model are adjusted; the Batchsize is set to 8 and the number of training rounds is set to 100. The downsample factor of the model is set to 16. The rest of the parameters in the two phases are the same. The maximum learning rate is set to 0.007 and the learning rate decreasing mode is cos; the weight decay is set to 0.0001 to prevent the model from overfitting; and the training loss function uses Dice-Loss to improve the robustness of the model to unbalanced data. It is worth noting that, to accurately verify the effectiveness of the algorithm in this paper, the parameter settings were the same for each comparison experiment.

3.2. Model Evaluation Metrics

The evaluation methods used in this paper are intersection over union (IoU) [48], mean intersection over union (MIoU) [49], and F1-Score [50], where the F1-Score is the reconciled average of Precision [51] and Recall [51]. These metrics are widely adopted and mature benchmarks in the computer-vision community. Formulas (5)–(9) show these calculations.
I o U = T P T P + F P + F N
M I o U = 1 N i = 1 N I o U
P r e c i s i o n = T P T P + F P
R e c a l l = T P T P + F N
F 1 - S c o r e = 2 × P r e c i s i o n × R e c a l l P r e c i s i o n + R e c a l l
where TP denotes the number of correctly predicted pixels, FP denotes the number of incorrectly predicted pixels, FN denotes the number of pixels not correctly predicted, and N is the total number of types.

3.3. Comparative Analysis of Experimental Results

The advancements made by the proposed algorithm in this paper are demonstrated through the six sets of experiments that were designed, which are presented in the following.
Firstly, design comparative experiments with different backbone networks were used to determine the suitable backbone; secondly, different attention modules were added to the feature output part of the model backbone network to verify the superiority of the SE attention module introduced in this paper; then, the WASPP module was compared with other improved ASPP modules to demonstrate the superiority of the WASPP module. After that, the appropriate dilation rates were determined by designing dilation rate experiments with different expansion rates of atrous convolutional layers for the WASPP module and FPN module; ablation experiments were designed according to the improved method proposed in this paper to verify the effectiveness of each module; and finally, a comparison of semantic segmentation models with the same hyperparameters was performed to verify the efficiency of the improved DeepLabV3+ model proposed in this paper.

3.3.1. Comparison Experiments of Backbone Network

To achieve a substantial reduction in the number of parameters without adversely affecting the segmentation performance, this paper selects different lightweight backbone networks (including MobileNetV2, MobileNetV3-Large [52], and MobileNetV3-Small [52]) to replace the original Xception network in the DeepLabV3+ model. The experimental results after the replacement are presented in Table 4.
From Table 4, it can be observed that after replacing the Xception backbone network with MobileNetV2 (MobileNetV3-Large, MobileNetV3-Small), the model’s parameter count reduced to only 5.81 M (11.73 M, 6.83 M), representing a reduction of approximately 89.4% (78.56%, 87.52%). The mIoU dropped by only 0.15% (0.24%, 0.51%) and the F1-Score decreased by only 0.34% (0.28%, 0.38%).
Through comparison, it can be concluded that MobileNetV2 achieved the highest parameter reduction while still maintaining reasonable segmentation accuracy. Therefore, after comprehensive consideration, we selected MobileNetV2 as the backbone network for the model in this study.

3.3.2. Comparative Experiments on Attentional Mechanisms

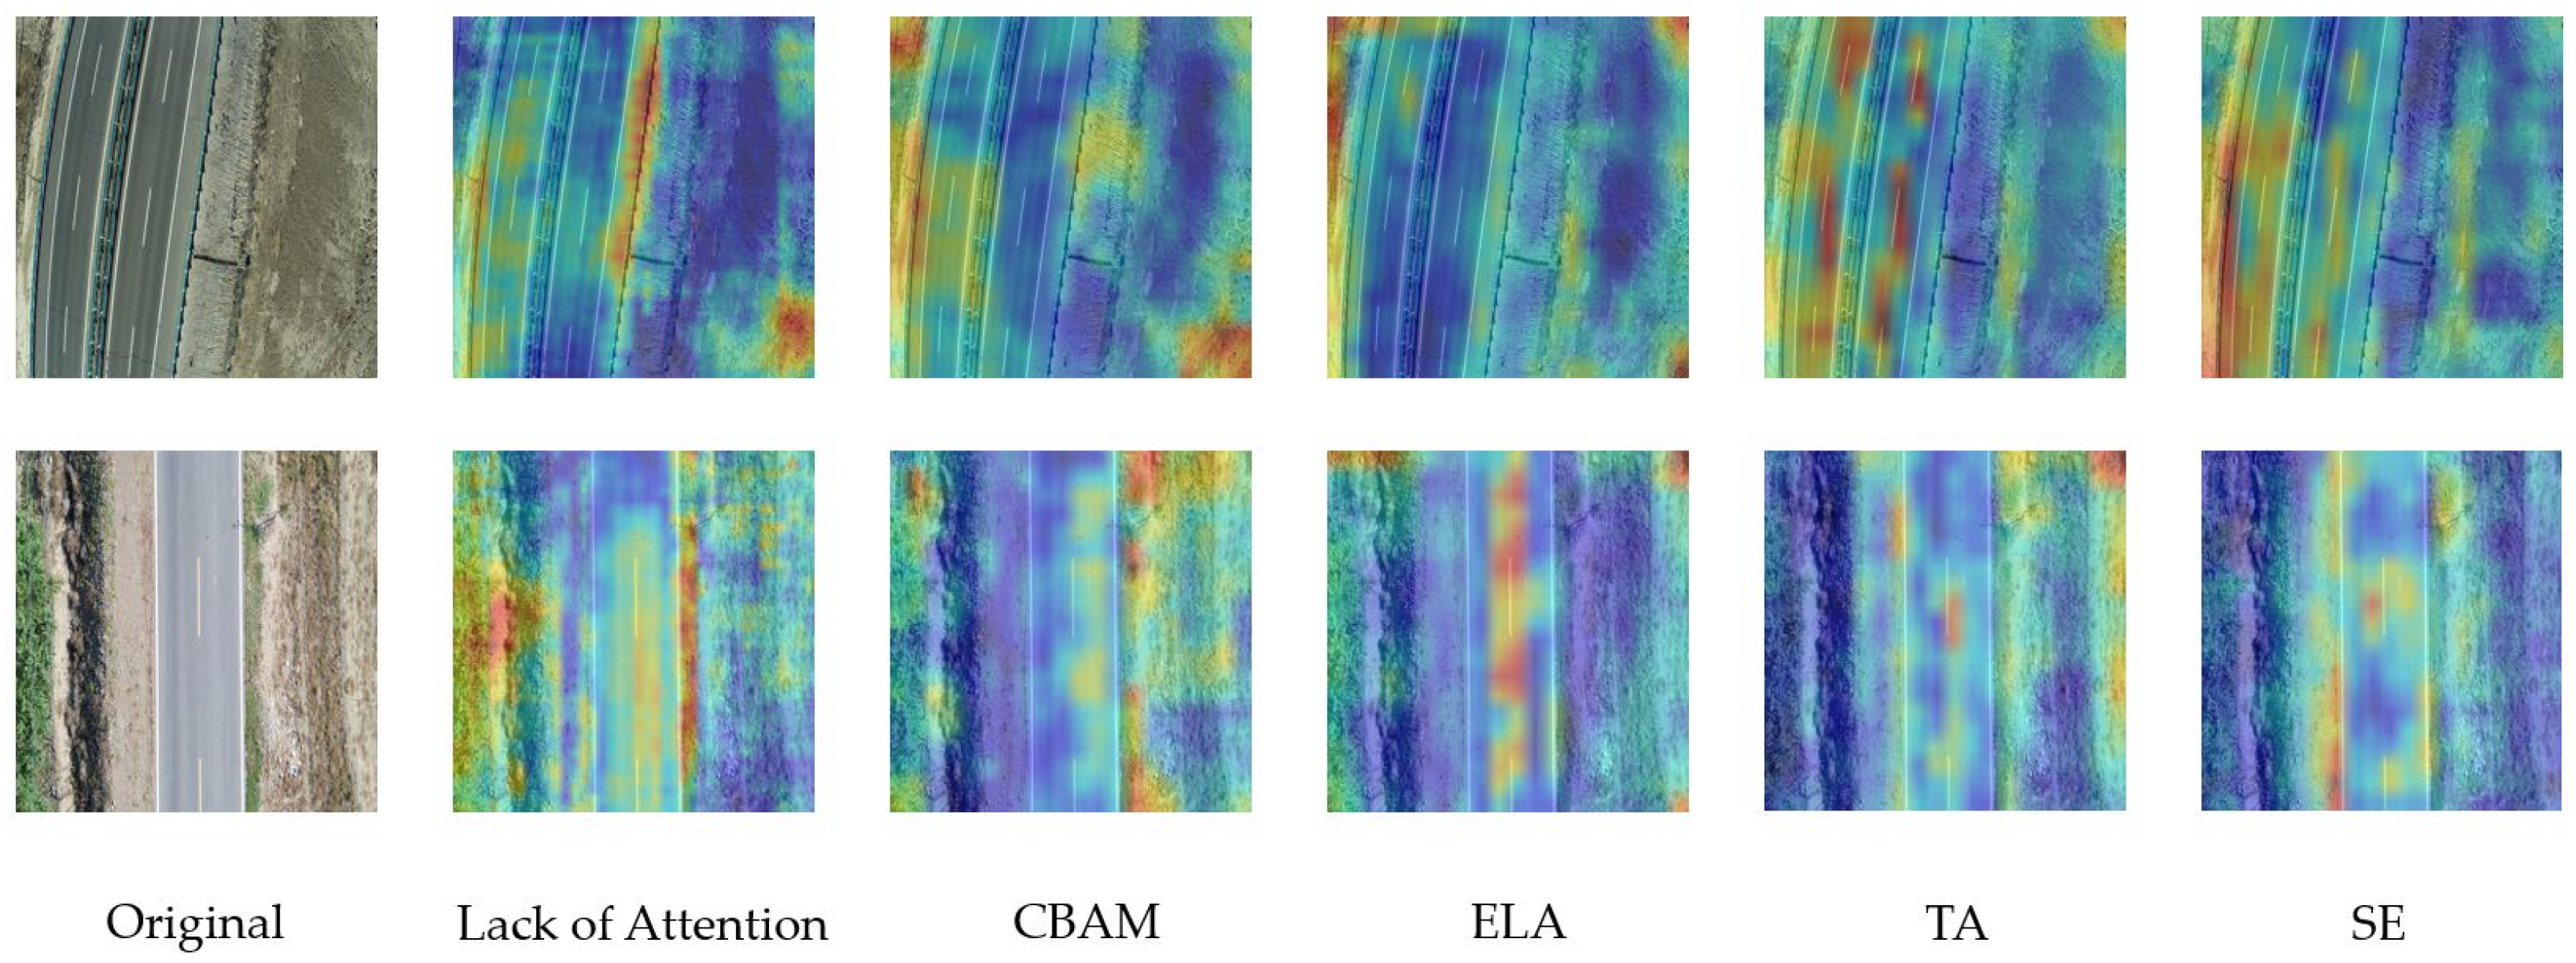
After adopting MobileNetV2 as the backbone network, we conducted a comparative experiment on attention mechanisms to enhance their feature extraction capabilities for lane lines, particularly at edge regions. CBAM [53], ELA [54], and TA [55], which are currently performing well in the semantic segmentation field, and SE, the channel attention mechanism used in this paper, were selected for comparison. The input image was a random test set image, and shallow features were selected for feature layer visualization and presented in the form of heat maps. The visualization results are shown in Figure 7.
As can be seen from Figure 7, the SE attention mechanism pays more attention to the region where lane lines exist. To visually validate the effect of the different attention mechanisms mentioned above, this paper compares the results after the model underwent 100 training rounds with the addition of different attention mechanisms, and the experimental results are shown in Table 5.
As can be seen from Table 5, although the number of model parameters introduced to the SE attention mechanism improved by 0.22 M, the various IoU types in the model also improved, and the MIoU and F1-Score improved by 0.89% and 0.43%, respectively, which are the most obvious improvements compared to the rest of the attention mechanism.

3.3.3. Comparative Experiments Between WASPP Module and Other Improved ASPP Modules

To verify the superiority of the WASPP module proposed in this paper, it was compared with other improved ASPP modules (the DenseASPP [56] module and the WASP module). Retaining their initial dilation rates (rates = 3/6/12/18), WASPP’s dilation rates were set (rates = 6/12/18). MobileNetV2 was employed as the backbone network. The experimental results are shown in Table 6.
As can be seen from Table 6, although introducing the WASP module reduces the model parameters, it also leads to a decrease in model accuracy (MIoU decreased by 0.81%; F1-Score decreased by 0.64%). Introducing the DenseASPP module improves model accuracy (MIoU increased by 0.81%; F1-Score increased by 0.61%), but incurs a significant increase in parameters (an increase of 8.02 M). In contrast, the WASPP module proposed in this paper improves accuracy (MIoU increased by 1.72%; F1-Score increased by 0.69%) while maintaining a relatively smaller increase in parameters (an increase of 0.93 M).

3.3.4. Comparative Ablation Experiments of WASPP Modules with Different Dilation Rates for Atrous Convolution

To improve the feature extraction ability of the model for different scales of lane lines, this paper introduces the FPN after the backbone network and replaces the original ASPP module with the WASPP module. To verify the fusion effect of different dilation rates of atrous convolutional layers in a WASPP module with an FPN module, this paper designs ablation experiments for a WASPP module and FPN module with dilation rates of (2, 4, 6) and (6, 12, 18), respectively, and compares the segmentation accuracy and parametric counts by using the prediction results of the model weights on the test set after 100 rounds of training. The experimental results are shown in Table 7.
Comparing the experiments in groups ② and ③ of Table 5, it can be seen that when not fused with the FPN module, the WASPP module with dilation rates of (6, 12, 18) has a better overall performance, and the MIoU and F1-Score are improved by 1.32% and 1.28%, respectively, compared with the dilation rates of (2, 4, 6); however, it can be seen through the experiments in groups ①, ④, and ⑤ that the WASPP module with dilation rates of (6, 12, 18) has a better overall performance, as the model’s MIoU drops by 0.08% and the F1-Score is only improved by 0.01% when compared with experiments that only introduced the FPN module. The WASPP module fused with the FPN module, the MIoU of the model decreased by 0.08%, and the F1-Score improved by 0.01% compared to the introduction of the FPN module only, whereas the F1-Score of the model after fusing the WASPP module with the FPN module with dilation rates of (2, 4, 6) decreased by 0.03%, but the MIoU improved by 0.20%. Adjusting the dilation rates does not affect the number of model parameters, so the combination with a better and more comprehensive performance is the combination of the WASPP module with the FPN module with dilation rates of (2, 4, 6), shown in group ⑤.

3.3.5. Ablation Experiments with Different Modules

To verify that the improvement strategy proposed in this paper optimizes lane line detection, nine sets of ablation experiments were designed using the control variable method. The replacement of the MobileNetV2 backbone network, addition of the SE attention mechanism, introduction of the FPN module, and improvement of the ASPP module to the WASPP module were carried out using the DeeplabV3+ model; then, each module was sequentially accumulated and compared with the base model. IoU, MIoU, F1-Score, and Params were used as the evaluation indexes for comparison, and the results are shown in Table 8.
Analysis of results from Table 8: (1) Backbone Replacement (① vs. ②): Substituting the backbone network with MobileNetV2 resulted in an 89.38% reduction in model parameters, albeit at the cost of reduced detection accuracy; (2) SE Attention Mechanism (①, ② vs. ③): Introducing the SE attention mechanism increased the parameter count by only 0.22 M. Critically, it enhanced the IoU for all lane line types compared to the original DeeplabV3+ (①), improving MIoU and F1-Score by 0.89% and 0.09%, respectively; (3) FPN Module (①, ② vs. ④): Incorporating the FPN module significantly boosted the IoU for all lane line types relative to the original model (①). This improvement corresponded to increases in MIoU and F1-Score of 4.11% and 3.04%, respectively, while the parameter count rose by 3.78%; (4) WASPP Module and Fusion: Solely upgrading the ASPP module to WASPP did not yield performance gains (①, ② vs. ⑤). However, fusing the WASPP module with either the SE attention mechanism or the FPN module (as indicated by comparisons involving Table 7 entries ②, ⑦, ⑧, and ⑨, and Table 6 entries ①, ②, ⑤ vs. ③, ④) demonstrably improved model performance. (5) Overall Improvement (① vs. ⑨): Compared to the baseline DeeplabV3+ model (①), the final integrated model proposed in this paper (⑨) achieved substantial improvements: IoU increased by 1.26% (yellow-dashed), 2.46% (yellow-solid), 12.93% (white-dashed), and 8.36% (white-solid), MIoU increased by 5.04%, and F1-Score increased by 3.35%, concurrently reducing the parameter count by 85.35%.
A comprehensive analysis of Table 8 demonstrates that the fusion of the four proposed improvement modules (MobileNetV2 backbone, SE attention, FPN, WASPP) significantly enhances algorithm accuracy (as evidenced by the MIoU and F1-Score gains across lane types) while drastically reducing model parameters. We individually evaluated the three modules (SE attention, FPN, and WASPP) that enhance model accuracy on the test set to quantify their impact; the results are shown in Figure 8.
Figure 8 shows that each module refines the lane line segmentation. When the white vehicle is present (Figure 8d), the original DeepLabV3+ fails to segment the lane line accurately, whereas all three modules mitigate this effect, with FPN performing best. Nevertheless, introducing any single module still leaves the model prone to missed and false segmentations.
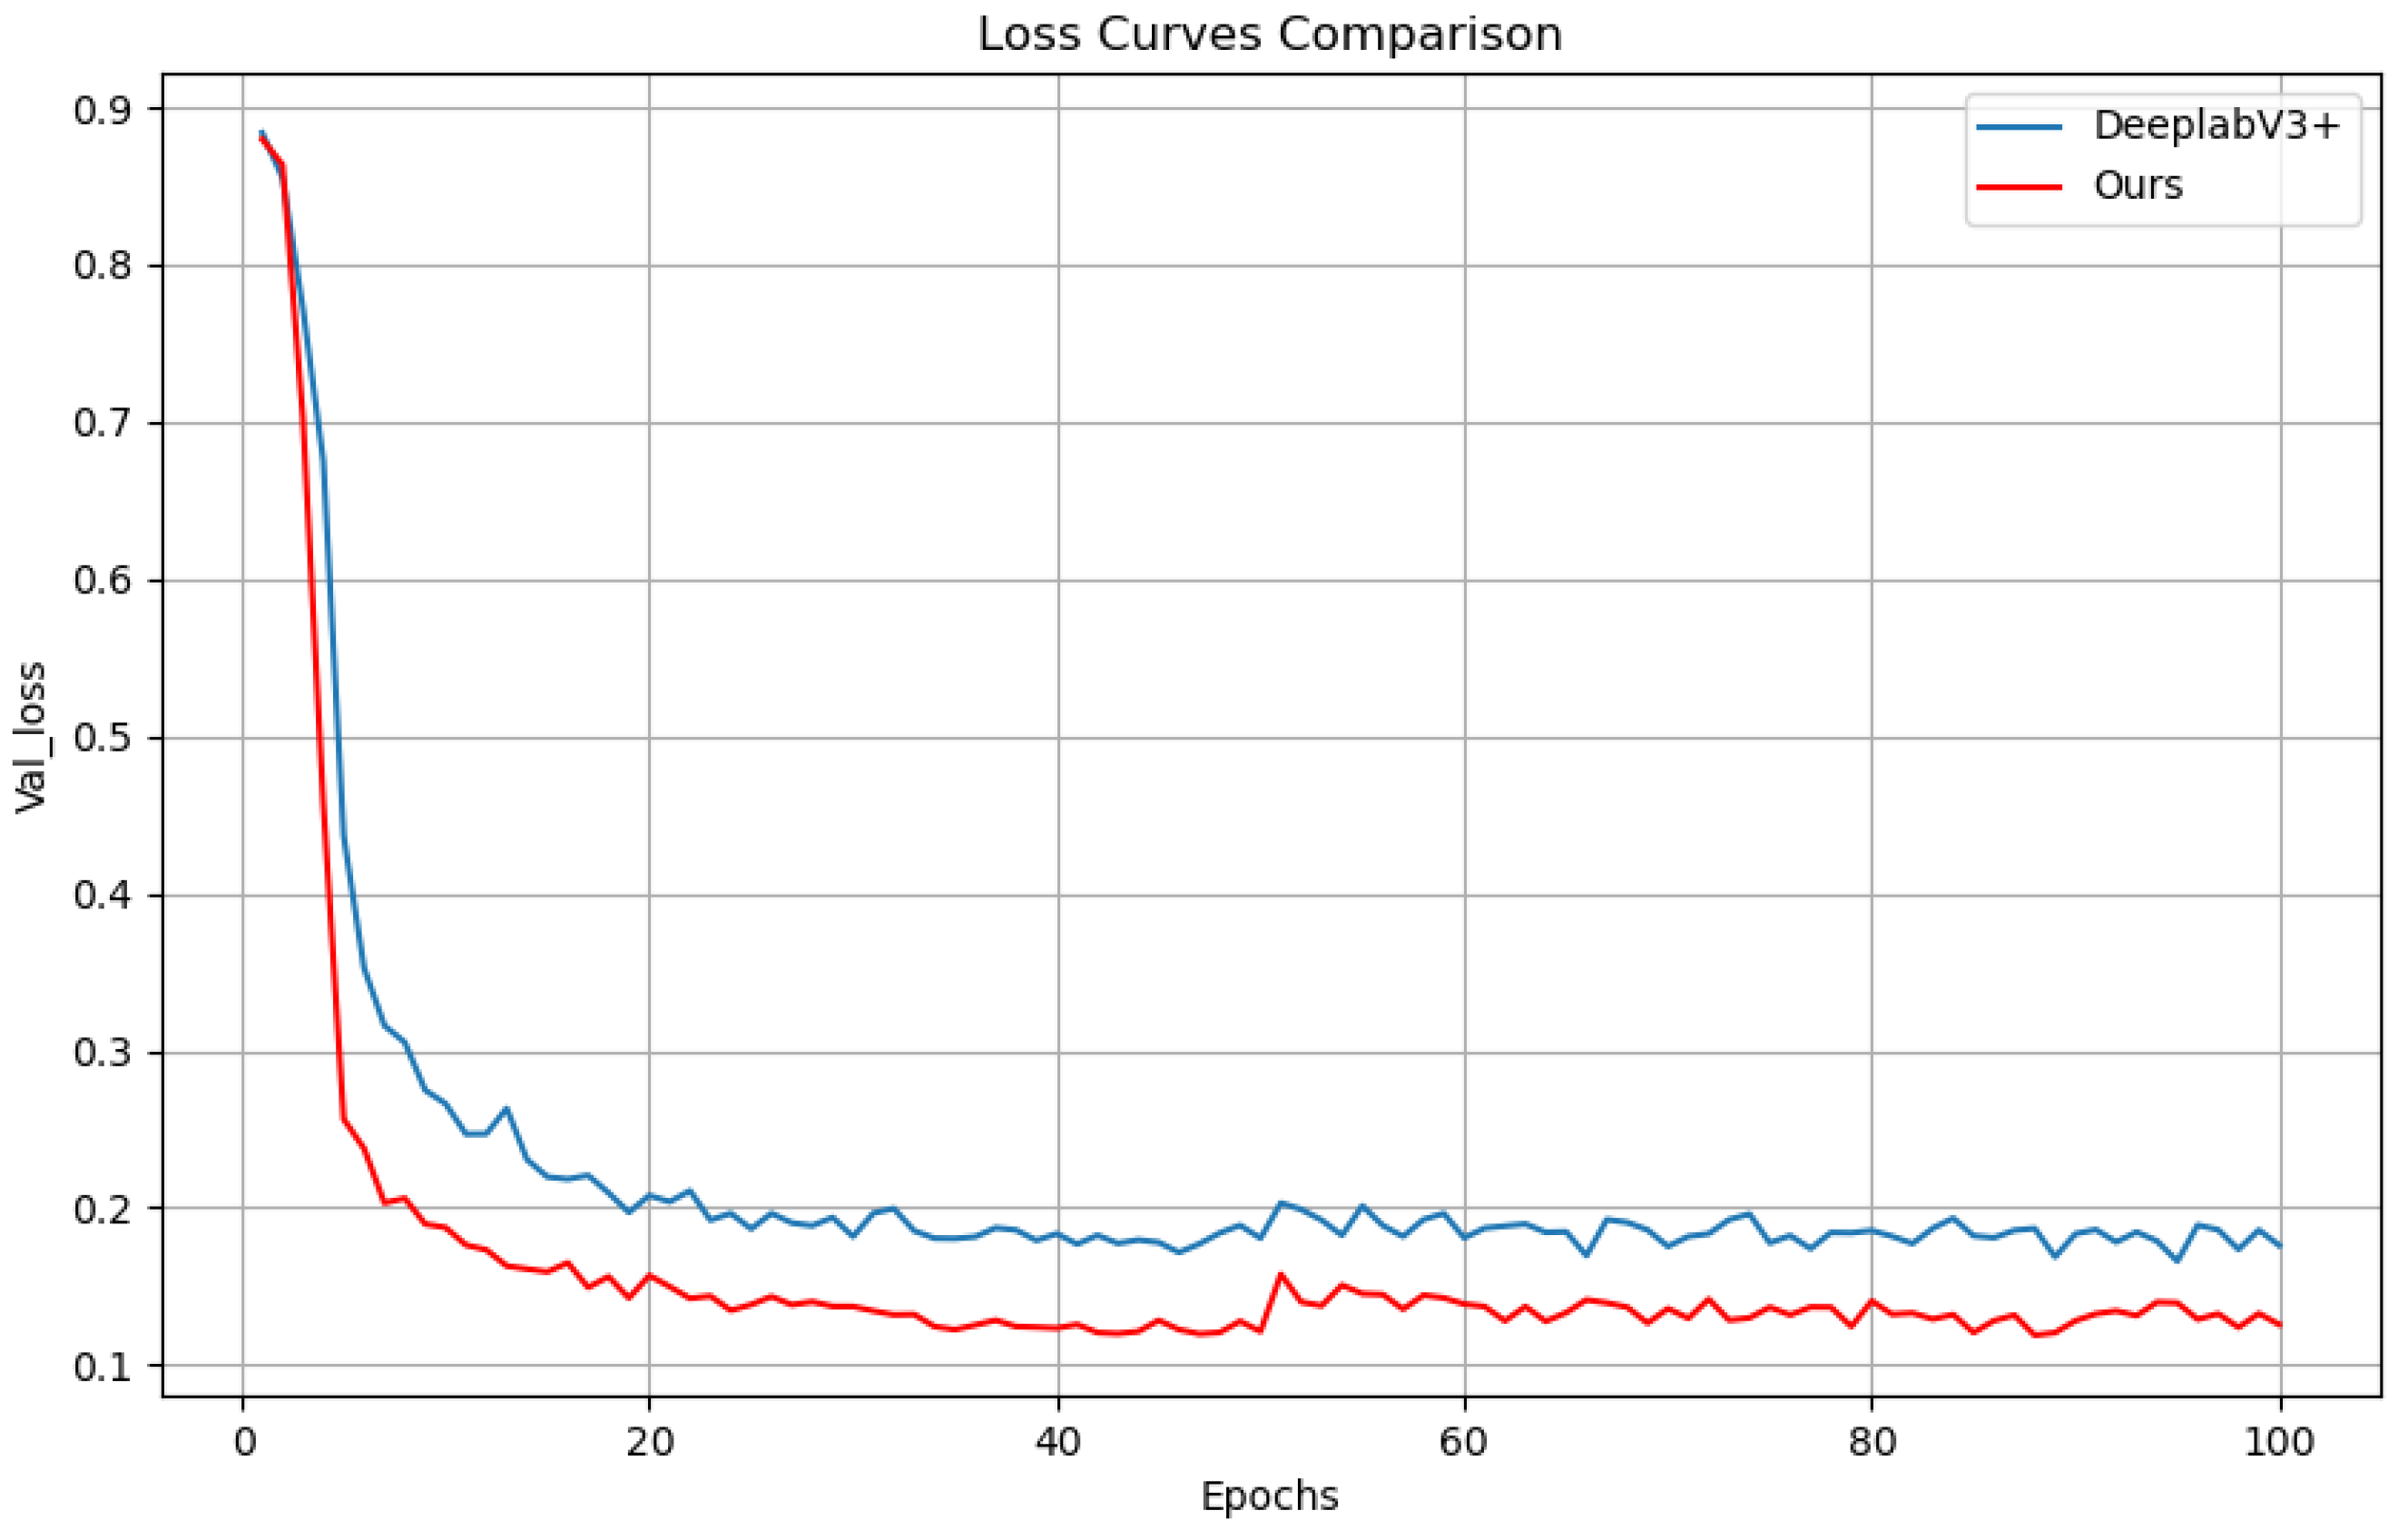
Figure 9 visualizes the loss curves on the validation set. The loss curve for the original DeeplabV3+ model (blue) is consistently higher than that of the improved model proposed herein (red), indicating that lower loss and superior predictive performance were achieved by the optimized model.

3.3.6. Comparative Experiments on Segmentation Network Models

To further verify the superiority of the model proposed in this paper, it was compared with other mainstream semantic segmentation models, and the experimental results are shown in Table 9.
As summarized in Table 9, the proposed algorithm achieves an MIoU of 85.30%, an F1-Score of 91.74%, and a training time of 14 h 53 m, and contains 8.03 M parameters. (1) Compared to the original DeeplabV3+, the proposed model exhibits significant improvements, with MIoU and F1-Score increasing by 5.04% and 3.35%, respectively. Additionally, training time is reduced by 2 h 50 min and the parameter count is decreased by 85.35%. (2) Compared to PSPNet (MobileNetV2), although utilizing the same lightweight backbone (MobileNetV2), the proposed algorithm demonstrates substantially higher performance, achieving 41.06% and 33.00% gains in MIoU and F1-Score, respectively, despite requiring more parameters and a longer training time. (3) Compared to PSPNet (ResNet50), the proposed model outperforms this variant by 38.57% in MIoU and 31.90% in F1-Score, while reducing the parameter count by 82.89%, despite a slight increase in training time (28 min). (4) Compared to HRNet, a superior performance is achieved, with MIoU and F1-Score improvements of 4.58% and 2.82%, alongside a 16.69% reduction in parameters, despite a longer training time (1 h 44 min). (5) Compared to UNet, modest gains in MIoU (+0.56%) and F1-Score (+0.27%) are observed, coupled with significant reductions in training time (2 h 32 min) and parameters (67.74%).
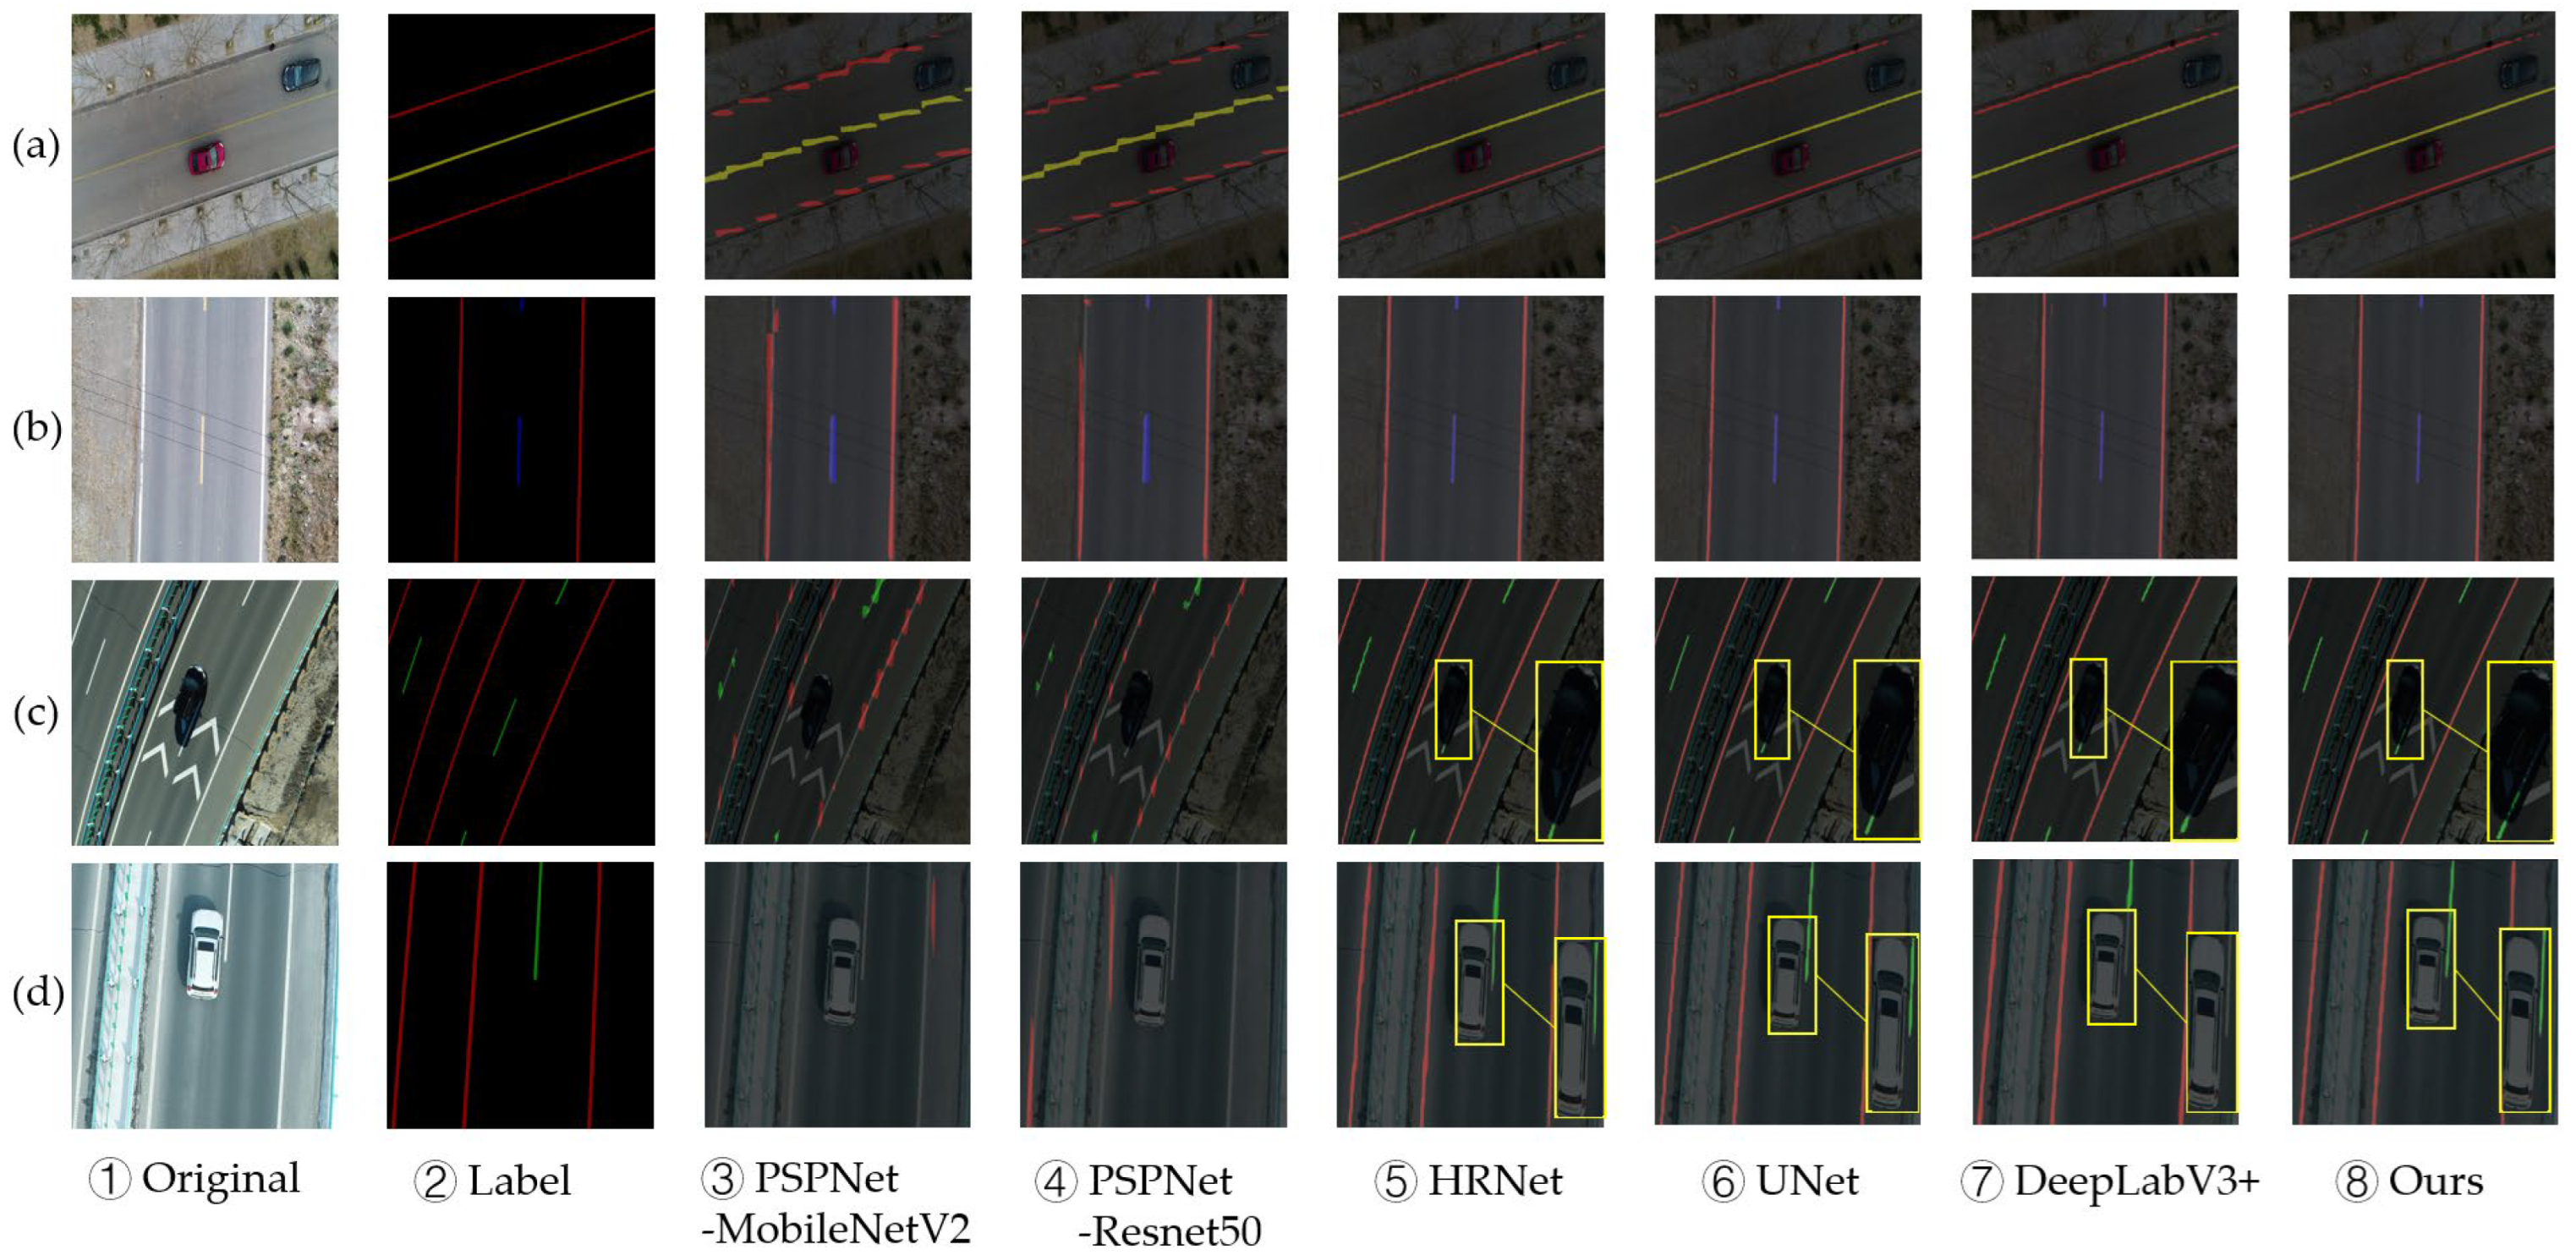
To qualitatively assess segmentation performance differences, visualization results comparing the outputs of all models are presented in Figure 10.
Figure 10 shows that the PSPNets of different backbone networks are all less effective in lane line segmentation, with obvious segmentation omission phenomena, and cannot guarantee the continuity of lane line segmentation. HRNet, UNet, DeepLabV3+ can better maintain the continuity of segmentation, but cannot guarantee the effectiveness of the segmentation when it is obstructed by the shadow of the vehicle, and there is also the phenomenon of segmentation omission when the color of the lane line is similar to the background color. The improved model proposed in this paper is more accurate and can better maintain the continuity of segmentation. When the lane line color is similar to the background color, there is also the phenomenon of segmentation omission, although the improved model proposed in this paper is more accurate in segmenting the lane lines and can better maintain the continuity of segmentation.
Due to the prohibitive flight risks, sensor vulnerability, and annotation difficulties involved in acquiring UAV-based lane line data under real rain or snow, publicly available datasets for such extreme weather remain extremely scarce. To mitigate the lack of data for robustness validation, we employed Albumentations [58] for data augmentation and synthesized rain and snow weather UAV lane line images from those originally captured in clear conditions. Additionally, we collected UAV lane line images of curved lanes and dark environments for testing; the results are shown in Figure 11.
As shown in Figure 11, under rainy and snowy conditions, the models exhibit a few punctate mis-segmentations. When negotiating curved roads, both the baseline and the improved models incorrectly segment white dashed lane lines and are also unable to produce accurate, continuous delineations of white solid lane lines. In dark and blurry environments, both models fail to achieve precise lane line segmentation.

4. Conclusions and Future Works

Considering the advantages of UAVs in highway inspection, this paper proposes a UAV highway lane line detection method based on improved DeepLabV3+, using UAV highway images as the data source. To improve the performance of the model, MobileNetV2 is used to replace the original model’s backbone, which significantly reduces the number of model parameters. By comparing different attention mechanisms, the SE channel attention mechanism is introduced after the inverse residual block of MobileNetV2, which improves the model’s ability to extract the edge features of the lane lines. The FPN is introduced, which improves the model’s feature extraction ability for multi-scale lane lines, and, finally, the ASPP module is improved and a Waterfall Atrous Spatial Pyramid Pooling (WASPP) module is proposed, which gradually expands the sensory field by cascading the atrous convolution structure and adjusts the dilation rates of the atrous convolution to efficiently integrate the contextual information of lane lines at different scales. The comparison and ablation experiments show that the improved DeepLabV3+ model improves the detection accuracy of various types of lane lines based on a significant reduction in the number of parameters; the problems of misclassification, omission, and discontinuity that existed in the model when segmenting highway lane lines are significantly improved; and clearer edge features are obtained.
For routine highway lane line inspections, a 30 min, 25 km flight with the DJI Phantom 4 RTK consumes 0.089 kWh and emits 0.051 kg CO2-eq (emission factor: 0.5703 kg CO2-eq kWh−1). A ground vehicle covering the same 15 km emits ≈ 1.8 kg CO2-eq (IPCC 2022) [59], yielding a 97% reduction (1.75 kg CO2-eq) per inspection distance when using the UAV. This study responds to UN Sustainable Development Goal (SDG) 9: “Build resilient infrastructure, promote inclusive and sustainable industrialization, and foster innovation” and offers practical value for sustaining road infrastructure maintenance.
The current study’s evaluation of lane line segmentation was limited by dataset biases—specifically, the scarcity of curved lane lines and the absence of extreme-weather samples such as heavy rain or snow. These constraints may restrict the model’s generalizability to diverse geographic and climatic contexts. To advance sustainable transportation infrastructure management, future work will focus on the following aspects.
Enhance Dataset Diversity: Collect and annotate curved lane line data across varied geographic contexts to improve model adaptability, supporting resilient road safety systems.
Strengthen Environmental Robustness: Investigate segmentation performance under challenging conditions (e.g., rain, snow, low light) and diverse UAV perspectives to ensure reliable all-weather inspection capabilities, which are critical for climate-resilient infrastructure.
Develop Adaptive Frameworks: Expand high-precision lane line datasets and refine the DeepLabV3+ architecture to enhance generalization across road ecosystems, promoting long-term maintenance efficiency.
Integrate with UAV Path Planning for Autonomous Inspections: Optimize the network for onboard UAV deployment, coupling real-time segmentation outputs with dynamic path-planning algorithms to enable fully autonomous, energy-efficient inspections. This integration directly supports SDG 9 by reducing carbon footprints compared to traditional ground surveys while enhancing worker safety through minimized human exposure to hazardous environments.

Author Contributions

Conceptualization, Y.W. (Yueze Wang) and D.G.; methodology, Y.W. (Yueze Wang) and Y.W. (Yang Wang); software, Y.W. (Yueze Wang) and H.S.; validation, Y.W. (Yueze Wang) and Z.L.; formal analysis, Y.W. (Yueze Wang) and D.G.; investigation, Y.W. (Yueze Wang); resources, D.G.; data curation, D.G.; writing—original draft preparation, Y.W. (Yueze Wang); writing—review and editing, Y.W. (Yueze Wang) and D.G.; visualization, Y.W. (Yueze Wang); supervision, J.R.; project administration, D.G.; funding acquisition, D.G. All authors have read and agreed to the published version of the manuscript.

Funding

This work was supported in part by the Autonomous Region Key Research and Development Program Project under Grant 2022B01015; in part by the Open Fund of the National Engineering Research Center for Road Traffic Safety Control Technology 2024GCZXKFKT05; and in part by the Science and Technology Program of the Ministry of Public Security 2024JSM04.

Institutional Review Board Statement

Not applicable.

Informed Consent Statement

Not applicable.

Data Availability Statement

All codes, data, and materials included in this research are available upon request from the corresponding author.

Acknowledgments

The authors thank their colleagues working with them at Xinjiang University and Xinjiang Transportation Planning and Survey & Design Research Institute. The authors would also like to thank the anonymous reviewers of this article for their constructive comments and suggestions.

Conflicts of Interest

Author Yang Wang was employed by the company Xinjiang Transportation Planning and Survey & Design Research Institute Co., Ltd. The remaining authors declare that the research was conducted in the absence of any commercial or financial relationships that could be construed as a potential conflict of interest.

Abbreviations

The following abbreviations are used in this manuscript:
UAVUnmanned Aerial Vehicle
FPNFeature Pyramid Network
WASPPWaterfall Atrous Spatial Pyramid Pooling
SESqueeze and Excitation
IoUIntersection over Union
MIoUMean Intersection over Union
ParamsParameters

References

  1. Babić, D.; Fiolić, M.; Ferko, M. Road Markings and Signs in Road Safety. Encyclopedia 2022, 2, 1738–1752. [Google Scholar] [CrossRef]
  2. Narote, S.P.; Bhujbal, P.N.; Narote, A.S.; Dhane, D.M. A review of recent advances in lane detection and departure warning system. Pattern Recognit. 2018, 73, 216–234. [Google Scholar] [CrossRef]
  3. Guan, Y.; Hu, J.; Wang, R.; Cao, Q.; Xie, F. Research on the Nighttime Visibility of White Pavement Markings. Heliyon 2024, 10, e36533. [Google Scholar] [CrossRef] [PubMed]
  4. Wang, H.; Liu, Q.; Liu, Z. Vehicle-Based LIDAR for Lane Line Detection. J. Phys. Conf. Ser. 2023, 2617, 012012. [Google Scholar] [CrossRef]
  5. Wu, J.; Xu, H.; Zheng, J. Automatic background filtering and lane identification with roadside LiDAR data. In Proceedings of the 2017 IEEE 20th International Conference on Intelligent Transportation Systems (ITSC), Yokohama, Japan, 16–19 October 2017; IEEE: Yokohama, Japan, 2017; pp. 1–6. [Google Scholar] [CrossRef]
  6. Jie, H.; Zuo, X.; Gao, J.; Liu, W.; Hu, J.; Cheng, S. LLFormer: An Efficient and Real-time LiDAR Lane Detection Method Based on Transformer. In Proceedings of the 2023 5th International Conference on Pattern Recognition and Intelligent Systems (PRIS’23), New York, NY, USA, 18–23 July 2023. [Google Scholar] [CrossRef]
  7. Cheng, Y.-T.; Lin, Y.-C.; Habib, A. Generalized LiDAR Intensity Normalization and Its Positive Impact on Geometric and Learning-Based Lane Marking Detection. Remote Sens. 2022, 14, 4393. [Google Scholar] [CrossRef]
  8. Zhao, R.; Heng, Y.; Wang, H.; Gao, Y.; Liu, S.; Yao, C.; Chen, J.; Cai, W. Advancements in 3D Lane Detection Using LiDAR Point Clouds: From Data Collection to Model Development. arXiv 2023. [Google Scholar] [CrossRef]
  9. Rui, R. Lane line detection technology based on machine vision. In Proceedings of the 2022 4th International Conference on Artificial Intelligence and Advanced Manufacturing (AIAM), Hamburg, Germany, 7–9 October 2022; pp. 562–566. [Google Scholar] [CrossRef]
  10. Wei, Y.; Xu, M. Detection of Lane Line Based on Robert Operator. J. Meas. Eng. 2021, 9, 156–166. [Google Scholar] [CrossRef]
  11. Duan, J.; Zhang, Y.; Zheng, B. Lane Line Recognition Algorithm Based on Threshold Segmentation and Continuity of Lane Line. In Proceedings of the 2016 2nd IEEE International Conference on Computer and Communications (ICCC), Chengdu, China, 14–17 October 2016; IEEE: Chengdu, China, 2016; pp. 680–684. [Google Scholar] [CrossRef]
  12. Chen, J.; Ruan, Y.; Chen, Q. A Precise Information Extraction Algorithm for Lane Lines. China Commun. 2018, 15, 210–219. [Google Scholar] [CrossRef]
  13. Li, D.; Yang, Z.; Nai, W.; Xing, Y.; Chen, Z. A Road Lane Detection Approach Based on Reformer Model. Egypt. Inform. J. 2025, 29, 100625. [Google Scholar] [CrossRef]
  14. Hao, W. Review on lane detection and related methods. Cogn. Robot. 2023, 3, 135–141. [Google Scholar] [CrossRef]
  15. Lee, Y.; Kim, J. Robustness of Deep Learning Models for Vision Tasks. Appl. Sci. 2023, 13, 4422. [Google Scholar] [CrossRef]
  16. Lu, X.; Lv, X.; Jiang, J.; Li, S. An Improved YOLOv5s for Lane Line Detection. In Proceedings of the 2022 5th International Conference on Robotics, Control and Automation Engineering (RCAE), Changchun, China, 28 October 2022; IEEE: Changchun, China, 2022; pp. 326–330. [Google Scholar] [CrossRef]
  17. Neven, D.; Brabandere, B.D.; Georgoulis, S.; Proesmans, M.; Gool, L.V. Towards End-to-End Lane Detection: An Instance Segmentation Approach. In Proceedings of the 2018 IEEE Intelligent Vehicles Symposium (IV), Changshu, China, 26–30 June 2018; IEEE: Changshu, China, 2018; pp. 286–291. [Google Scholar]
  18. Liu, L.; Chen, X.; Zhu, S.; Tan, P. CondLaneNet: A Top-to-down Lane Detection Framework Based on Conditional Convolution. In Proceedings of the 2021 IEEE/CVF International Conference on Computer Vision (ICCV), Montreal, QC, Canada, 10–17 October 2021; IEEE: Montreal, QC, Canada, 2021; pp. 3753–3762. [Google Scholar] [CrossRef]
  19. Liu, B.; Liu, H.; Yuan, J. Lane Line Detection Based on Mask R-CNN. In Proceedings of the 3rd International Conference on Mechatronics Engineering and Information Technology (ICMEIT 2019), Dalian, China, 29–30 March 2019; Atlantis Press: Dalian, China, 2019. [Google Scholar]
  20. Long, J.; Shelhamer, E.; Darrell, T. Fully Convolutional Networks for Semantic Segmentation. In Proceedings of the 2015 IEEE Conference on Computer Vision and Pattern Recognition (CVPR), Boston, MA, USA, 7–12 June 2015; IEEE: Boston, MA, USA, 2015; pp. 3431–3440. [Google Scholar] [CrossRef]
  21. Zhao, H.; Shi, J.; Qi, X.; Wang, X.; Jia, J. Pyramid Scene Parsing Network. In Proceedings of the 2017 IEEE Conference on Computer Vision and Pattern Recognition (CVPR), Honolulu, HI, USA, 21–26 July 2017; IEEE: Honolulu, HI, USA, 2017; pp. 6230–6239. [Google Scholar]
  22. Chen, L.-C.; Papandreou, G.; Kokkinos, I.; Murphy, K.; Yuille, A.L. Semantic Image Segmentation with Deep Convolutional Nets and Fully Connected CRFs. arXiv 2016, arXiv:1412.7062. [Google Scholar] [CrossRef]
  23. Chen, L.-C.; Papandreou, G.; Kokkinos, I.; Murphy, K.; Yuille, A.L. DeepLab: Semantic Image Segmentation with Deep Convolutional Nets, Atrous Convolution, and Fully Connected CRFs. IEEE Trans. Pattern Anal. Mach. Intell. 2018, 40, 834–848. [Google Scholar] [CrossRef] [PubMed]
  24. Chen, L.-C.; Papandreou, G.; Schroff, F.; Adam, H. Rethinking Atrous Convolution for Semantic Image Segmentation. arXiv 2017, arXiv:1706.05587. [Google Scholar] [CrossRef]
  25. Chen, L.-C.; Zhu, Y.; Papandreou, G.; Schroff, F.; Adam, H. Encoder-Decoder with Atrous Separable Convolution for Semantic Image Segmentation. In Computer Vision—ECCV 2018; Ferrari, V., Hebert, M., Sminchisescu, C., Weiss, Y., Eds.; Lecture Notes in Computer Science; Springer International Publishing: Cham, Switzerland, 2018; Volume 11211, pp. 833–851. ISBN 978-3-030-01233-5. [Google Scholar]
  26. Zakaria, N.J.; Shapiai, M.I.; Abdul Rahman, M.A.; Yahya, W.J. Lane Line Detection via Deep Learning Based- Approach Applying Two Types of Input into Network Model. J. Soc. Automot. Eng. Malays. 2020, 4, 208–220. [Google Scholar] [CrossRef]
  27. Chen, L.; Xu, X.; Pan, L.; Cao, J.; Li, X. Real-Time Lane Detection Model Based on Non Bottleneck Skip Residual Connections and Attention Pyramids. PLoS ONE 2021, 16, e0252755. [Google Scholar] [CrossRef]
  28. Li, J.; Jiang, F.; Yang, J.; Kong, B.; Gogate, M.; Dashtipour, K.; Hussain, A. Lane-DeepLab: Lane Semantic Segmentation in Automatic Driving Scenarios for High-Definition Maps. Neurocomputing 2021, 465, 15–25. [Google Scholar] [CrossRef]
  29. Wang, Z.; Zhao, Y.; Tian, Y.; Zhang, Y.; Gao, L. The Improved Deeplabv3plus Based Fast Lane Detection Method. Actuators 2022, 11, 197. [Google Scholar] [CrossRef]
  30. Zhang, Y.; Zuo, Z.; Xu, X.; Wu, J.; Zhu, J.; Zhang, H.; Wang, J.; Tian, Y. Road Damage Detection Using UAV Images Based on Multi-Level Attention Mechanism. Autom. Constr. 2022, 144, 104613. [Google Scholar] [CrossRef]
  31. Burghardt, T.E.; Popp, R.; Helmreich, B.; Reiter, T.; Böhm, G.; Pitterle, G.; Artmann, M. Visibility of Various Road Markings for Machine Vision. Case Stud. Constr. Mater. 2021, 15, e00579. [Google Scholar] [CrossRef]
  32. Kiss, B.; Ballagi, Á.; Kuczmann, M. Overview Study of the Applications of Unmanned Aerial Vehicles in the Transportation Sector. Eng. Proc. 2024, 79, 11. [Google Scholar] [CrossRef]
  33. Butilă, E.V.; Boboc, R.G. Urban Traffic Monitoring and Analysis Using Unmanned Aerial Vehicles (UAVs): A Systematic Literature Review. Remote Sens. 2022, 14, 620. [Google Scholar] [CrossRef]
  34. Hayal, M.R.; Elsayed, E.E.; Kakati, D.; Singh, M.; Elfikky, A.; Boghdady, A.I.; Grover, A.; Mehta, S.; Mohsan, S.A.H.; Nurhidayat, I. Modeling and Investigation on the Performance Enhancement of Hovering UAV-Based FSO Relay Optical Wireless Communication Systems under Pointing Errors and Atmospheric Turbulence Effects. Opt. Quantum Electron. 2023, 55, 625. [Google Scholar] [CrossRef]
  35. Munir, A.; Siddiqui, A.J.; Anwar, S.; El-Maleh, A.; Khan, A.H.; Rehman, A. Impact of Adverse Weather and Image Distortions on Vision-Based UAV Detection: A Performance Evaluation of Deep Learning Models. Drones 2024, 8, 638. [Google Scholar] [CrossRef]
  36. Feng, H.; Zhang, L.; Zhang, S.; Wang, D.; Yang, X.; Liu, Z. RTDOD: A Large-Scale RGB-Thermal Domain-Incremental Object Detection Dataset for UAVs. Image Vis. Comput. 2023, 140, 104856. [Google Scholar] [CrossRef]
  37. Yang, Y. A Review of Lane Detection in Autonomous Vehicles. J. Adv. Eng. Technol. 2024, 1, 30–36. [Google Scholar] [CrossRef]
  38. Du, D.; Qi, Y.; Yu, H.; Yang, Y.; Duan, K.; Li, G.; Zhang, W.; Huang, Q.; Tian, Q. The Unmanned Aerial Vehicle Benchmark: Object Detection and Tracking. In Proceedings of the European Conference on Computer Vision (ECCV 2018), Munich, Germany, 8–14 September 2018; Part IV. Ferrari, V., Hebert, M., Sminchisescu, C., Weiss, Y., Eds.; Lecture Notes in Computer Science. Springer: Cham, Switzerland, 2018; 11210, pp. 370–386. [Google Scholar]
  39. Ronneberger, O.; Fischer, P.; Brox, T. U-Net: Convolutional Networks for Biomedical Image Segmentation. In Proceedings of the Medical Image Computing and Computer-Assisted Intervention—MICCAI 2015, Munich, Germany, 5–9 October 2015; Proceedings, Part III. Navab, N., Hornegger, J., Wells, W.M., Frangi, A.F., Eds.; Lecture Notes in Computer Science. Springer International Publishing: Cham, Switzerland, 2015; Volume 9351, pp. 234–241, ISBN 978-3-319-24573-7. [Google Scholar]
  40. Chollet, F. Xception: Deep Learning with Depthwise Separable Convolutions. In Proceedings of the 2017 IEEE Conference on Computer Vision and Pattern Recognition (CVPR), Honolulu, HI, USA, 21–26 July 2017; IEEE: Honolulu, HI, USA, 2017; pp. 1800–1807. [Google Scholar]
  41. Sandler, M.; Howard, A.; Zhu, M.; Zhmoginov, A.; Chen, L.-C. MobileNetV2: Inverted Residuals and Linear Bottlenecks. In Proceedings of the 2018 IEEE/CVF Conference on Computer Vision and Pattern Recognition, Salt Lake City, UT, USA, 18–23 June 2018; IEEE: Salt Lake City, UT, USA, 2018; pp. 4510–4520. [Google Scholar]
  42. Hu, J.; Shen, L.; Sun, G. Squeeze-and-Excitation Networks. In Proceedings of the 2018 IEEE/CVF Conference on Computer Vision and Pattern Recognition, Salt Lake City, UT, USA, 18–23 June 2018; IEEE: Salt Lake City, UT, USA, 2018; pp. 7132–7141. [Google Scholar]
  43. Lin, T.-Y.; Dollar, P.; Girshick, R.; He, K.; Hariharan, B.; Belongie, S. Feature Pyramid Networks for Object Detection. In Proceedings of the 2017 IEEE Conference on Computer Vision and Pattern Recognition (CVPR), Honolulu, HI, USA, 21–26 July 2017; IEEE: Honolulu, HI, USA, 2017; pp. 936–944. [Google Scholar]
  44. Howard, A.G.; Zhu, M.; Chen, B.; Kalenichenko, D.; Wang, W.; Weyand, T.; Andreetto, M.; Adam, H. MobileNets: Efficient Convolutional Neural Networks for Mobile Vision Applications. arXiv 2017, arXiv:1704.04861. [Google Scholar] [CrossRef]
  45. Ren, S.; He, K.; Girshick, R.; Sun, J. Faster R-CNN: Towards Real-Time Object Detection with Region Proposal Networks. IEEE Trans. Pattern Anal. Mach. Intell. 2017, 39, 1137–1149. [Google Scholar] [CrossRef]
  46. Artacho, B.; Savakis, A. Waterfall Atrous Spatial Pooling Architecture for Efficient Semantic Segmentation. Sensors 2019, 19, 5361. [Google Scholar] [CrossRef]
  47. Yu, F.; Koltun, V. Multi-Scale Context Aggregation by Dilated Convolutions. In Proceedings of the International Conference on Learning Representations (ICLR 2016), San Juan, Puerto Rico, 2–4 May 2016; pp. 1–13. [Google Scholar]
  48. Jaccard, P. Étude Comparative de la Distribution Florale dans Une Portion des Alpes et du Jura. Bull. Soc. Vaudoise Sci. Nat. 1901, 37, 547–579. [Google Scholar] [CrossRef]
  49. Everingham, M.; Van Gool, L.; Williams, C.K.I.; Winn, J.; Zisserman, A. The Pascal Visual Object Classes (VOC) Challenge. Int. J. Comput. Vis. 2010, 88, 303–338. [Google Scholar] [CrossRef]
  50. Van Rijsbergen, C.J. A non-classical logic for information retrieval. Comput. J. 1986, 29, 481–485. [Google Scholar] [CrossRef]
  51. Sokolova, M.; Lapalme, G. A systematic analysis of performance measures for classification tasks. Inf. Process. Manag. 2009, 45, 427–437. [Google Scholar] [CrossRef]
  52. Howard, A.; Sandler, M.; Chu, G.; Chen, L.-C.; Chen, B.; Tan, M.; Wang, W.; Zhu, Y.; Pang, R.; Vasudevan, V.; et al. Searching for MobileNetV3. In Proceedings of the IEEE/CVF International Conference on Computer Vision (ICCV), Seoul, Republic of Korea, 27 October–2 November 2019. [Google Scholar]
  53. Woo, S.; Park, J.; Lee, J.-Y.; Kweon, I.S. CBAM: Convolutional Block Attention Module. In Proceedings of the Computer Vision—ECCV 2018: 15th European Conference, Munich, Germany, 8–14 September 2018; Proceedings, Part VII. Springer: Berlin/Heidelberg, Germany, 2018; pp. 3–19. [Google Scholar]
  54. Xu, W.; Wan, Y. ELA: Efficient local attention for deep convolutional neural networks. arXiv 2024, arXiv:2403.01123. [Google Scholar] [CrossRef]
  55. Gao, S.; Qin, Y.; Zhu, R.; Zhao, Z.; Zhou, H.; Zhu, Z. SGSAFormer: Spike Gated Self-Attention Transformer and Temporal Attention. Electronics 2024, 14, 43. [Google Scholar] [CrossRef]
  56. Yang, M.; Yu, K.; Zhang, C.; Li, Z.; Yang, K. DenseASPP for Semantic Segmentation in Street Scenes. In Proceedings of the 2018 IEEE/CVF Conference on Computer Vision and Pattern Recognition, Salt Lake City, UT, USA, 18–23 June 2018; IEEE: Salt Lake City, UT, USA, 2018; pp. 3684–3692. [Google Scholar]
  57. Wang, J.; Sun, K.; Cheng, T.; Jiang, B.; Deng, C.; Zhao, Y.; Liu, D.; Mu, Y.; Tan, M.; Wang, X.; et al. Deep High-Resolution Representation Learning for Visual Recognition. IEEE Trans. Pattern Anal. Mach. Intell. 2021, 43, 3349–3364. [Google Scholar] [CrossRef] [PubMed]
  58. Buslaev, A.; Parinov, A.; Khvedchenya, E.; Iglovikov, V.I.; Kalinin, A.A. Albumentations: Fast and Flexible Image Augmentations. Information 2020, 11, 125. [Google Scholar] [CrossRef]
  59. IPCC. Climate Change 2022-Mitigation of Climate Change: Working Group III Contribution to the Sixth Assessment Report of the Intergovernmental Panel on Climate Change, 1st ed.; Intergovernmental Panel on Climate Change (IPCC); Cambridge University Press: Cambridge, UK, 2022; ISBN 978-1-009-15792-6. [Google Scholar]
Figure 1. Dataset Sample. (a,b) are from Dataset (1); (c,d) are from Dataset (2); (e) is from Dataset (3).
Sustainability 17 07317 g001
Figure 2. DeepLabV3+ network architecture.
Sustainability 17 07317 g002
Figure 3. Improved DeepLabV3+ network architecture.
Sustainability 17 07317 g003
Figure 4. SE attention network architecture.
Sustainability 17 07317 g004
Figure 5. FPN architecture.
Sustainability 17 07317 g005
Figure 6. ASPP and WASPP module architecture.
Sustainability 17 07317 g006
Figure 7. Comparison of attentional mechanisms.
Sustainability 17 07317 g007
Figure 8. Segmentation performance of individual modules. The yellow boxes are used to enlarge and highlight specific regions of the images.
Sustainability 17 07317 g008
Figure 9. Loss curves comparison before and after improvement.
Sustainability 17 07317 g009
Figure 10. Comparison of segmentation performance among mainstream segmentation networks. The yellow boxes are used to enlarge and highlight specific regions of the images.
Sustainability 17 07317 g010
Figure 11. Comparative segmentation results under rainy, snowy, curved lane, and dark conditions.
Sustainability 17 07317 g011
Table 1. The number and colors of four types of lane line labels.
Types of Lane LinesNumber of LabelsColors of Labels
white-solid-lane-line2522red
white-dashed-lane-line2930green
yellow-solid-lane-line238yellow
yellow-dashed-lane-line685blue
Table 2. MobileNetV2 network architecture.
OperatortcnsOutput
Conv2d 3 × 3-32123202 × 32
Bottleneck116113202 × 16
Bottleneck624221602 × 24
Bottleneck63232802 × 32
Bottleneck66442402 × 64
Bottleneck69631402 × 96
Bottleneck616032202 × 160
Bottleneck632011202 × 320
Table 3. The pseudocode for the WASPP module.
MODULE WASPP:
    INPUT:
        x: input feature map [batch, channels, height, width]
        base_dilation_rate: integer dilation rate
    // Cascaded branches
    branch1 = Conv1 × 1 (x) → BN → ReLU
    branch2 = Conv3 × 3 (branch1, dilation = 2 * rate) → BN → ReLU
    branch3 = Conv3 × 3 (branch2, dilation = 4 * rate) → BN → ReLU
    branch4 = Conv3 × 3 (branch3, dilation = 6 * rate) → BN → ReLU
    // branch5: Global context
    global_feature = GlobalAveragePooling (x) → [batch, channels, 1, 1]
    global_feature = Conv1 × 1 (global_feature, kernel = 1 × 1) → BN → ReLU
    global_feature = BilinearUpsample (global_feature, size = (height, width))
// Feature aggregation
    concatenated = ChannelwiseConcat (branch1, branch2, branch3, branch4, global feature)
// Feature fusion
    output = Conv1 × 1 (concatenated, kernel = 1 × 1) → BN → ReLU
    RETURN output
Table 4. Comparison experiments of backbone network.
Backbone NetworkIoU (%)F1-Score (%)Params
(M)
Yellow-Dashed-Lane-LineYellow-Solid-Lane-LineWhite-Dashed-Lane-LineWhite-Solid-Lane-LineMIoU
Xception84.4277.8764.1175.4080.2688.3954.71
MobileNetV284.1276.7764.2375.9380.1188.055.81
MobileNetV3-Large82.6370.7569.0378.1680.0288.1111.73
MobileNetV3-Small83.2070.6767.8277.5579.7588.016.83
Table 5. Comparison experiments of attentional mechanisms.
MethodIoU (%)F1-Score (%)Params
(M)
Yellow-Dashed-Lane-LineYellow-Solid-Lane-LineWhite-Dashed-Lane-LineWhite-Solid-Lane-LineMIoU
MobileNetV284.1276.7764.2375.9380.1188.055.81
+CBAM82.9075.4263.2374.6278.7487.865.95
+ELA84.1476.0463.4175.1979.6587.845.93
+TA84.2677.9864.4475.9380.4288.075.95
+SE84.5678.9265.1976.8481.0088.486.03
Table 6. Comparison experiments between WASPP module and other improved ASPP modules.
MethodIoU (%)F1-Score (%)Params
(M)
Yellow-Dashed-Lane-LineYellow-Solid-Lane-LineWhite-Dashed-Lane-LineWhite-Solid-Lane-LineMIoU
MobileNetV284.1276.7764.2375.9380.1188.055.81
+WASP
(rates = 3/6/12/18)
83.6275.6863.3474.4179.3087.413.53
+DenseASPP
(rates = 3/6/12/18)
84.5578.6065.1576.8280.9288.6611.55
+WASPP
(rates = 6/12/18)
84.6878.6265.3976.9081.0288.746.74
Table 7. Comparison of ablation experimental results of the WASPP module and the FPN module with different sets of dilation rates.
GroupMobileNetV2FPNWASPP
(Rates = 2/4/6)
WASPP
(Rates = 6/12/18)
MIoU(%)F1-Score (%)Params
(M)
84.3791.437.81
79.7087.466.74
81.0288.746.74
84.2991.447.92
84.5791.407.92
“√” indicates that the module is included; “—” indicates that it is not.
Table 8. Comparison of experimental results of ablation.
GroupMobileNetV2SEFPNWASPPIoU(%)F1-Score (%)Params
(M)
Yellow-Dashed-Lane-LineYellow-Solid-Lane-LineWhite-Dashed-Lane-LineWhite-Solid-Lane-LineMIoU
84.4277.8764.1175.4080.2688.3954.71
84.1276.7764.2375.9380.1188.055.81
84.5678.9265.1976.8481.0088.486.03
85.6777.8075.7582.9484.3791.437.81
83.6976.2763.9875.0879.7087.466.74
84.9676.8574.7882.4283.7490.698.03
85.4278.6776.0383.0484.5791.407.92
84.5578.5765.3376.5680.9188.836.96
85.6880.3377.0483.7685.3091.748.03
“√” indicates that the module is included; “—” indicates that it is not.
Table 9. Comparison with the experimental results of mainstream semantic segmentation models.
Network ModelBackbone
Network
MIoU (%)F1-Score (%)Training TimeParams (M)
PSPNet [21]MobileNetV244.2458.7414 h 15 min2.38
Resnet5046.7359.8414 h 25 min46.71
HRNet [57]80.7288.9213 h 9 min9.64
UNet [39]VGG1684.7491.4715 h 11 min24.89
DeeplabV3+Xception-6580.2688.3917 h 43 min54.71
OursMobileNetV285.3091.7414 h 53 min8.03
Disclaimer/Publisher’s Note: The statements, opinions and data contained in all publications are solely those of the individual author(s) and contributor(s) and not of MDPI and/or the editor(s). MDPI and/or the editor(s) disclaim responsibility for any injury to people or property resulting from any ideas, methods, instructions or products referred to in the content.