Article

Impact of Urban Green Space Patterns on Carbon Emissions: A Gray BP Neural Network and Geo-Detector Analysis

1
College of Art and Design, Nanjing Forestry University, Nanjing 210037, China
2
College of Landscape Architecture, Nanjing Forestry University, Nanjing 210037, China
*
Author to whom correspondence should be addressed.
Sustainability 2025, 17(16), 7245; https://doi.org/10.3390/su17167245
Submission received: 23 July 2025 / Revised: 6 August 2025 / Accepted: 8 August 2025 / Published: 11 August 2025

Abstract

Rapid urbanization has altered the land use pattern, reducing urban green space and increasing carbon emissions, and it is critical to scientifically examine the interaction mechanism between green space and carbon emissions in order to drive low-carbon urban development. Using Nanjing as an example, this study examined the spatiotemporal evolution characteristics of urban green space patterns and carbon emissions between 2000 and 2020. Carbon emissions at the city and county levels were estimated with great precision using a gray BP neural network model and a downscaling decomposition method. Using urban green space landscape pattern indices and geographic detectors, significant driving factors were discovered and their impact on carbon emissions examined. The results show the following: (1) Carbon emissions are mostly influenced by socioeconomic factors, and the gray BP neural network model (R2 = 0.9619, MAPE = 1.68%) can predict outcomes accurately. (2) Between 2000 and 2020, Nanjing’s overall carbon emissions increased by 118.9%, demonstrating a “core–periphery” pattern of spatial divergence, with significant emissions from industrial districts and emission reductions in the central urban region. (3) The urban green space exhibits “quantity decreasing and quality increasing” characteristics, with the total area falling by 4.84% but the structure optimized to form a networked pattern with huge ecological patches as the backbone. (4) The primary drivers are the LPI, COHESION, and AI. This study reveals the complex relationship mechanism between the spatial configuration of urban green space and carbon emissions and, based on the results, proposes a green space optimization framework with three dimensions, protection of core ecological patches, enhancement of connectivity through ecological corridors, and implementation of low-carbon maintenance measures, which will provide a scientific basis for the planning of urban green space and the construction of low-carbon cities in the Yangtze River Delta region.

1. Introduction

The low-carbon transformation of cities is now a topic of global consensus in the context of climate change. In accordance with the Ministry of Housing and Urban–Rural Development, China’s “dual-carbon” goal was incorporated in the “14th Five-Year Plan”. The National Urban Infrastructure Construction Plan’s “14th Five-Year Plan” puts a particular emphasis on developing urban green space systems as efficiently as conceivable. The National Urban Infrastructure Construction Plan for the “14th Five-Year Plan” of the Ministry of Housing and Urban–Rural Development specifically asks for the promotion of low-carbon and green city development, as well as the optimization and progression of urban green space systems. The establishment of a monitoring system for greenfield carbon sinks and the inclusion of greenfield construction as a key avenue for urban low-carbon development have been suggested by the National Development and Reform Commission’s Carbon Peak Implementation Program in the Field of Urban and Rural Construction. However, the current conflict between ecological preservation and urban growth is becoming more apparent, and the new urbanization strategy calls for the creation of a regulatory framework that works in tandem with the green space system to control carbon emissions. Global programs, including the European Union’s “Green Cities Accord”, highlight how crucial developing green space is to accomplishing carbon reduction goals. It is critical to conduct a thorough analysis of the mechanisms that connect patterns of urban green space and carbon emissions in light of these policy frameworks.
Three main aspects of the interaction mechanism between urban green space and carbon emissions have been the subject of systematic research in recent years by both domestic and international scholars. These include the assessment of the carbon sink’s function, the influence of landscape patterns, and the innovation of accounting methods. Research demonstrates that the type of vegetation and spatial arrangement of urban green spaces significantly impact the capacity to store carbon when assessing the effectiveness of carbon sinks. For instance, the rate of carbon sequestration in subsidiary green spaces can reach 2.54 t·hm−2·a−1, which is significantly higher than that of other types of green spaces [1]. In contrast, protected green spaces can reduce carbon-neutral years by up to 44% when compared to open ones, according to a spatial performance assessment model for vegetation [2]. Research on coastal urban agglomerations has shown that the effective grid size has the strongest explanatory power (q = 0.32) for carbon emissions in the context of landscape pattern analysis [3]. Additionally, a study in Luohe City discovered a strong exponential correlation (R2 = 0.65) between carbon sink efficiency and green space connectivity [4]. And the edge density (ED) and maximum patch index (LPI) count as the primary landscape indicators influencing the carbon budget using bibliometrics [5]. From the traditional inventory technique to the integration of different models, the methodological level shows a developmental trend. Through a comparison analysis, experts demonstrate the superiority of the CASA model in high-density metropolitan regions, resulting in an error reduction of up to 23% [6]. However, there are a number of notable limitations to the current research. According to related research, provincial energy data are difficult to support at the city and county levels, which leads to an insufficient spatial resolution [7]. In terms of methodology, most research has used static cross-sectional data analysis, which is unable to capture the dynamic evolutionary features of the urban system [8]. Effective quantitative tools addressing the nonlinear link between green space morphology and carbon emissions are lacking in the area of mechanism resolution. Furthermore, accurate evaluation of the factor interaction effects may be impossible with some multi-scale synergistic frameworks [9]. It is crucial to remember that current research does not fully comprehend the dynamic response mechanism of carbon emissions in intricate urban systems. The mutation features may not be adequately identified by conventional linear models [10]. Furthermore, the conversion of novel ideas—like Gao’s “service radius of the carbon sinks”—into workable planning techniques is hampered by the absence of spatially explicit analytical frameworks. The lack of a methodological framework makes it more difficult to incorporate novel ideas into operational planning [11]. The entire potential of urban green spaces to be carbon neutral is directly limited by these methodological flaws, and new analytical methods are desperately needed to address important scientific problems like the trade-off between biodiversity and carbon sequestration [12].
This study represents a significant advancement in both theoretical methodology and practical application dimensions. At the methodological level, a dynamic carbon emission prediction model is built by combining a gray BP neural network with the downscaling decomposition technique. This overcomes the limitation of the traditional linear model, which is unable to capture the nonlinear evolution characteristics of carbon emissions. In contrast to the static cross-section analysis or single-scale modeling commonly used in existing studies, this model can realize carbon emission estimations at the district and county level by combining the benefits of gray system theory in processing small-sample data with the potent nonlinear fitting ability of neural networks. This will enable local governments to implement fine carbon management at a low cost. In terms of mechanism analysis, the spatial manifestation of green land form indicators and carbon emissions is correlated, and the spatial correlation characteristics of different green land form indicators and carbon emissions are systematically examined using geo-detector methods, which compensates for the deficiencies of previous research, which is mostly limited to the correlation analysis of single indicators. At the practical application level, the carbon emission prediction model proposed in this study has strong operability and practical value, and it can quickly generate regional carbon emission estimation results by integrating conventional socioeconomic statistical data, providing a convenient and reliable technical means for government departments to conduct carbon emission accounting. Compared to the previous sophisticated techniques of carbon emission inventory, this model greatly decreases data gathering and calculation costs, making carbon emission monitoring and evaluation at the district and county levels more realistic. For the purpose of planning applications, this study indicates a correlation rule between urban green space patterns and carbon emissions, providing a scientific basis for optimizing the spatial layout of urban green space. Based on the study results, the planning department can make targeted adjustments to the scale, form, and spatial configuration of the green space, promoting the city’s low-carbon growth by improving the carbon regulation function of the green space system.

2. Materials and Methods

2.1. Overview of the Study Area

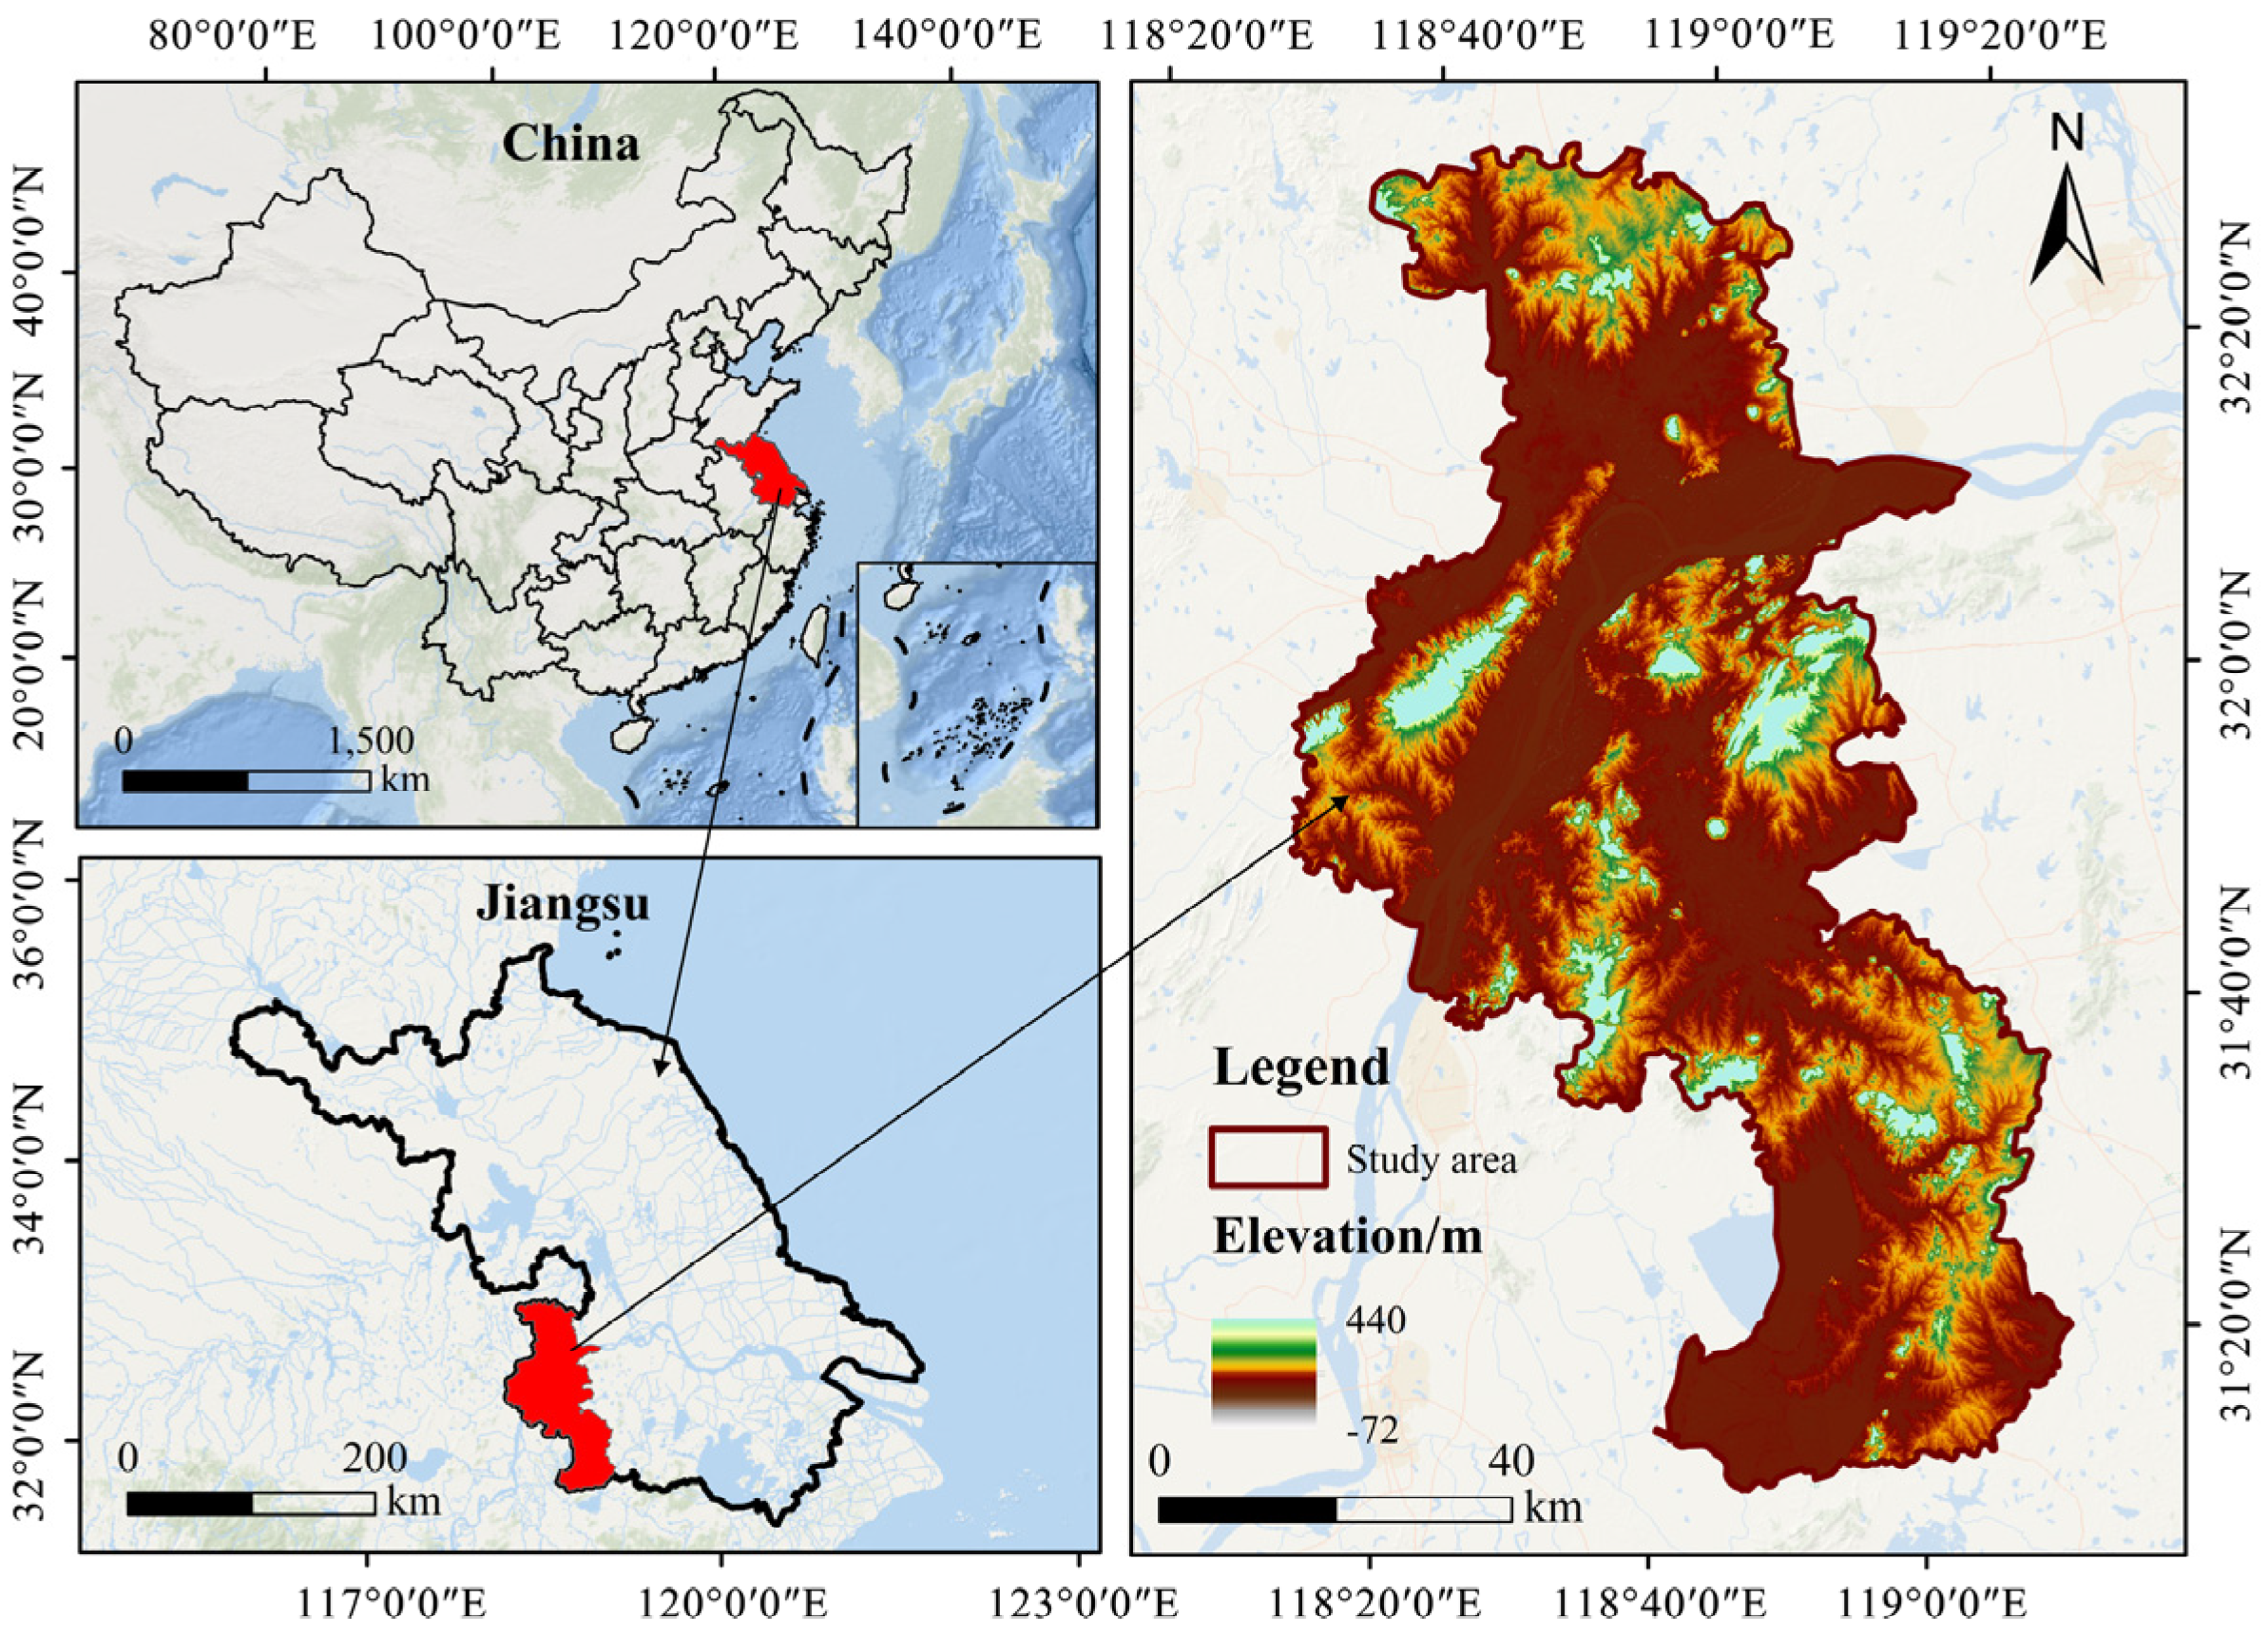
Nanjing is located on the south bank of the Yangtze River’s lower reaches, in the southwestern section of Jiangsu Province, near the confluence of the northern wing of the Yangtze River Delta and the Yangtze River Economic Belt (Figure 1). The city’s administrative division consists of 11 districts that occupy a combined area of approximately 6587.04 km2. This relatively compact and diverse urban spatial structure reflects a well-planned urban growth. The city’s terrain is defined by low hills and plains, with the Yangtze River running from southwest to northeast, resulting in a natural landscape of “mountains, water, cities, and forests”. This natural habitat forms a solid foundation for the creation of an urban green space system. The Yangtze River Delta, which includes Nanjing, is a region in China with considerable differences in economic growth and energy resources. Additionally, it is the area most affected by legislation pertaining to macro-carbon emissions. The high population density, industrial intensity, and well-developed transportation infrastructure all contribute to a large increase in regional carbon emissions. As a result, Nanjing has exhibited substantial research value and practical relevance in reducing the intensity of carbon emissions, increasing the carbon sink capacity of green space, and investigating the relationship between urban spatial patterns’ evolution and carbon emissions.

2.2. Data Sources

The data used in the study primarily included the following: ① The statistical yearbooks of Nanjing and Jiangsu Province served as the primary data sources for this study. Particularly pertinent data categories include transportation, economic, population, and energy consumption data. ② The mean annual temperature, precipitation, and wind speed were acquired from the National Meteorological Science Data Center. ③ The land use categorization system is based on the first level of land use classification provided by the Chinese Academy of Sciences’ Resource and Environment Science Data Center (http://www.resdc.cn (accessed on 8 November 2024)). The classification system is divided into six major categories: arable land, forest land, grassland, water, urban and rural building land, and unused land. ④ The Harvard Dataverse platform provided the DMSP-LOS evening light data. However, the platform has now been superseded by NPP-VIIRS, and radiometric normalization and image element correction processes were used to maintain data consistency across time.

2.3. Categorization of Influencing Factors

The approach used in this study to analyze the factors influencing carbon emissions focuses on three important variables, meteorological environment, social economy, and urban green space, while taking into account the complexity of the metropolitan system and data availability. This variable system is essentially built on the following theoretical and practical considerations: First, meteorological climatic elements (such as average yearly air temperature, wind speed, and precipitation) have a direct impact on urban energy consumption patterns and plants’ carbon absorption effectiveness, making them the most important natural factors influencing carbon emissions. It has been demonstrated that changes in air temperature considerably alter the demand for cooling and heating in buildings, while wind speed and precipitation influence the efficiency of renewable energy consumption and vegetation growth [13,14,15]. Second, socioeconomic factors (e.g., nighttime lighting index, population density, industrial structure, etc.) that directly characterize the intensity of anthropogenic activities can reflect the structure and total amount of energy consumed in the region, and the proportion of secondary industry and energy intensity are directly related to carbon emissions [16,17]. It is particularly noteworthy that nighttime light data has been widely proven to be a reliable indicator to characterize the spatial distribution of human activities, and it can effectively compensate for the lack of spatial resolution of traditional statistical data. Furthermore, this study treats the urban green space factor as an independent dimension of analysis, owing to its unique location in the urban carbon cycle system and the requirements of planning practice. In terms of biological mechanisms, the green space system not only contributes to the carbon fixation process through vegetation photosynthesis, but it also indirectly influences regional carbon emissions in a variety of ways. A well-planned green space network can effectively mitigate the urban heat island effect and reduce building cooling energy consumption; meanwhile, the structure of the green space network influences residents’ modes of travel and leisure activities, which in turn affects transportation and community energy consumption. In terms of planning applications, analyzing the green space factor separately can more precisely quantify the correlation strength between different landscape pattern indicators (such as patch size, connectivity, and so on) and carbon emissions, providing a targeted design basis for the optimization of the urban green space system and allowing the research results to directly guide low-carbon green space planning practice. This classification method not only takes into account the interaction of natural and social systems, but it also emphasizes the green space system’s distinct status, laying the scientific groundwork for a more in-depth investigation of the relationship between urban green space patterns and carbon emissions.

2.4. Research Methods

2.4.1. Calculation of Urban Carbon Emissions

This study uses a multi-scale nested carbon emission accounting system to create a comprehensive carbon measurement framework, with Nanjing as the research object. Municipal carbon emission accounting is based on official statistical data from the China Urban Statistical Yearbook and the China Urban Construction Statistical Yearbook. The measurement method divides carbon emissions into three categories and calculates each separately [18]. Table 1 outlines the specific classification and calculation methods.
The land use classification method, together with a downscaling model of nighttime lighting data, was used to compute carbon emissions at the district and county levels using municipal accounting. The emission sources were divided into direct emissions (cropland, forest land, grassland, waterways, and unutilized land) and indirect emissions (construction land) [19,20,21,22,23]. The following formula was used to determine direct carbon emissions (1). Indirect carbon emissions were defined as energy carbon emissions [24], and inverse algorithms for district- and county-level carbon emissions were developed using a downscaling model based on nighttime lighting data [25]. The quantitative association between evening illumination brightness and municipal-level energy carbon emissions in Nanjing from 2000 to 2020 has been calibrated (R2 > 0.80). The quantitative association between district–county–municipal luminance ratio and energy carbon emissions was estimated using DMSP-OLS nighttime illumination data [21]. This modeling allowed for the spatial subdivision of energy carbon emissions in Nanjing districts and counties, which were estimated using Equation (2).
C E d i r e c t = A i · E F i
In the equation, C E d i r e c t is the direct carbon emission (t CO2e), A i is the area of the ith land use type (hm2), and E F i is the carbon emission factor of the ith land use type (t CO2e/hm2) [26].
C E i n d i r e c t = D N c o u n t r y D N c i t y × C E c i t y
In the equation, C E i n d i r e c t is the indirect carbon emissions of districts and counties; C E c i t y is the municipal energy consumption carbon emissions (t CO2e); D N c o u n t r y and D N c i t y are the nighttime light brightness values of districts and counties and municipalities, respectively; and the discounted standard coal coefficients and carbon emission coefficients of different energy sources in the process of calculating are referred to the research results [27].

2.4.2. Carbon Emission Estimation Model

  • GM (1,1)
The GM (1,1) model is a time series forecasting model based on gray system theory that has a wide range of applications and performs particularly well when dealing with insufficient or complete data. The model’s main idea encompasses a number of critical processes, beginning with the generation of a series by accumulating raw time series data to show the general trend. The cumulative series are then mathematically described by producing a first-order difference equation, also known as a linear first-order differential equation, which displays the data’s pattern of evolution. The next phase in the model’s creation is parameter estimation, which is often accomplished using mathematical approaches such as least squares to get the unknown parameters in the differential equations that correspond to the essential properties of the time series data. Following the completion of the model’s creation, the model test becomes a critical link in ensuring the model’s fitting quality and prediction influence on future data by examining and testing the residuals. The GM (1,1) model is superior due to its simplicity and ease of use, as well as its relatively low computing cost, making it particularly ideal for dealing with easy and irregular time series data, as well as in the context of more scarce or incomplete data. The specific steps and calculation formulas are as follows (Table 2):
Table 2. GM (1,1) model step.
ProcedureFormulaParameter DescriptionNumber
1. Preprocessing of dataHypothesized original sequence: x 0 = x 0 1 , x 0 2 , x 0 3 , , x 0 n x 1 denotes the new sequence obtained by accumulating the original sequence x 0 /
Accumulation sequence: x 1 = x 1 1 , x 1 2 , x 1 3 , , x 1 n
x 1 k = i = 1 k x i 0 , k = 1,2 , 3 n x 1 k represents the data obtained by accumulating the first k data items of the original sequence(3)
2. Create a first-order differential equation for x 1 d x 1 d k + a x 1 = b /(4)
3. Solve for Equation (3) x 1 k + 1 = x 0 1 b a e a k + b a /(5)
4. Use the least squares method for the values of a and b in Equation (4): a , b T = B T B 1 B T Y /(6)
B = z ( 1 ) ( 2 ) 1 z ( 1 ) ( 3 ) 1 z ( 1 ) ( n ) 1   Y = x ( 0 ) ( 2 ) x ( 0 ) ( 3 ) x ( 0 ) ( n )
5. Solve for the GM(1,1) model x 0 k + 1 = x 1 k + 1 x 1 k ,
k = 1 , 2 , 3 n
Equation (4) can be solved for the values of a and b to obtain the value of k. Finally, the predicted values can be solved(7)
Once the formula is established, the original data series can be fitted and predicted. After the residual model is established, the results need to be taken to the residual test method for diagnostic testing of the model’s effectiveness, based on the original data and calculated data for comparison to calculate the residuals; the use of the mean squared deviation ratio c and the probability of a small error P are two indicators of the integrated test to evaluate the accuracy of the indicator prediction model. Let the residuals ε i 0 at i moment be
ε i 0 = χ i 0 χ ^ i 0
In the above equation, χ i 0 is the original sequence and χ ^ i 0 is the sequence obtained after prediction. The subsequent C and P are calculated in the following Table 3:
Table 3. Calculation method of mean square difference ratio c and small error probability P.
ProcedureFormulaNumber
Mean value of residuals ε ¯ = 1 k i = 1 k ε i 0 (9)
Residual variance S 1 2 = 1 k i = 1 k ε i 0 ε ¯ 2 (10)
Original sequence mean x ¯ = 1 k i = 1 k x i 0 (11)
Average relative residuals e = 1 n ε i 0 x i 0 (12)
Raw series variance S 2 2 = 1 k i = 1 k x i 0 x ¯ 2 (13)
Mean square ratio C c = S 1 S 2 (14)
The small error probability P P = ξ i 0 ξ < 0.6745 S 1 (15)
  • BP Neural Network
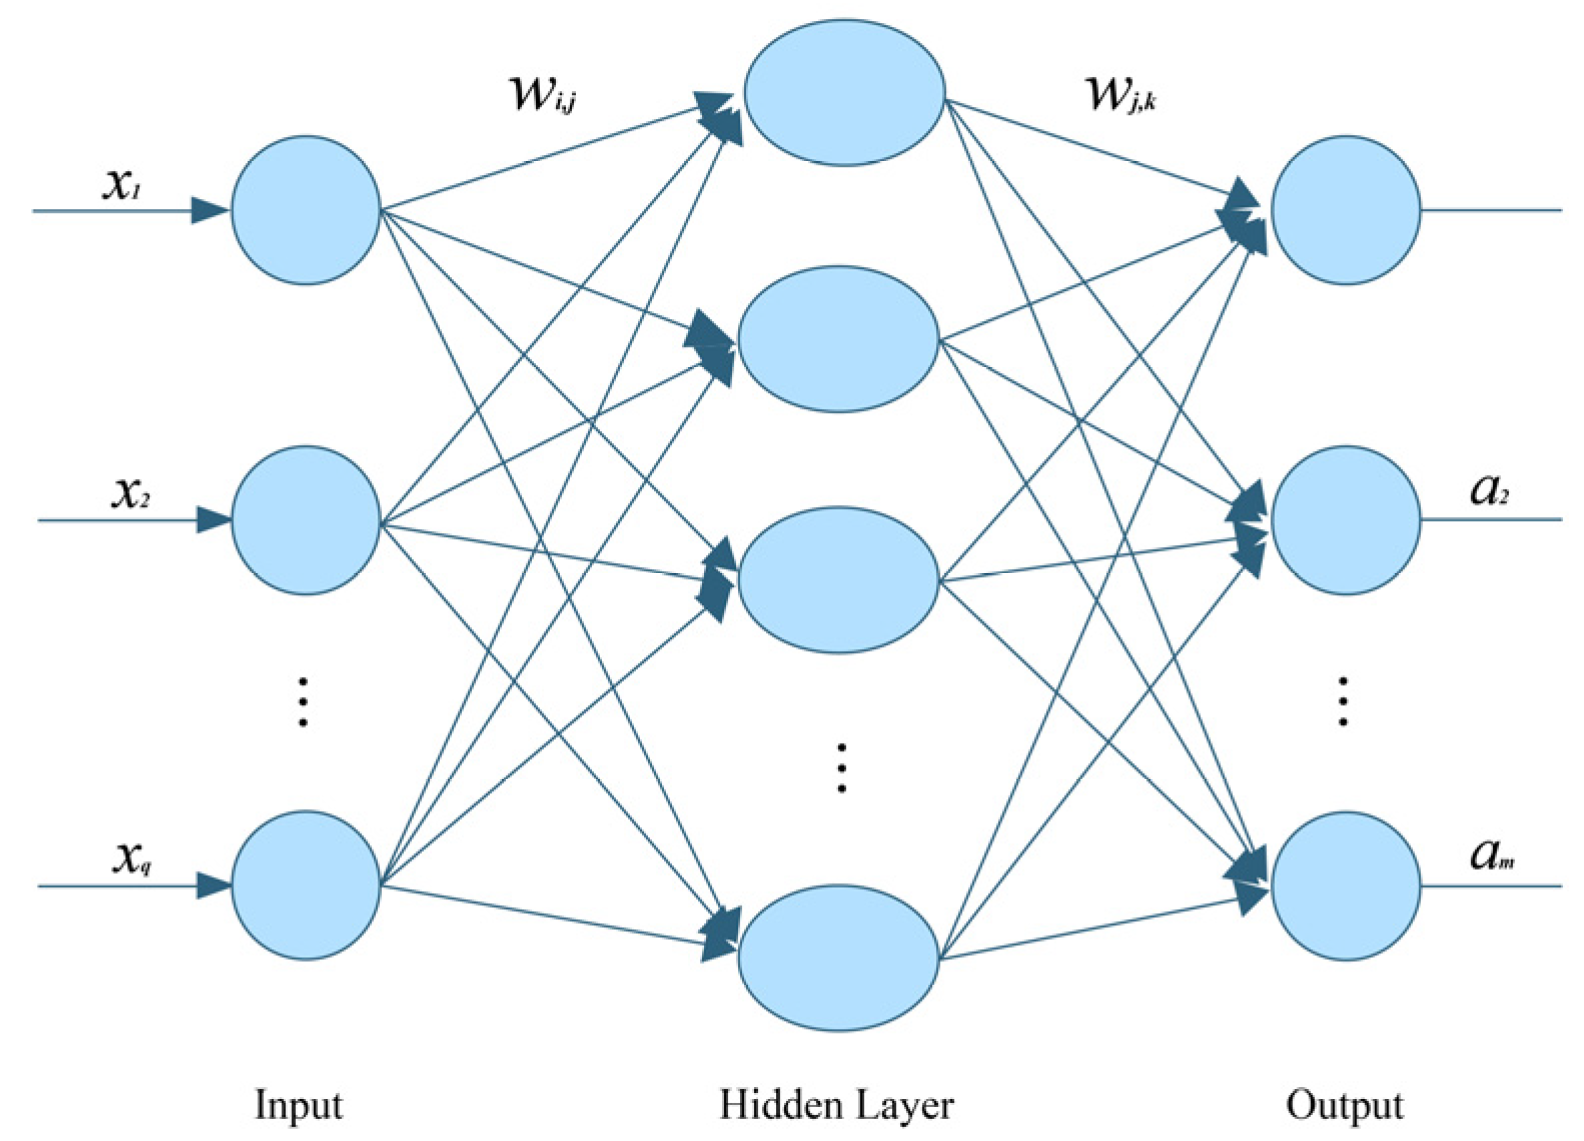
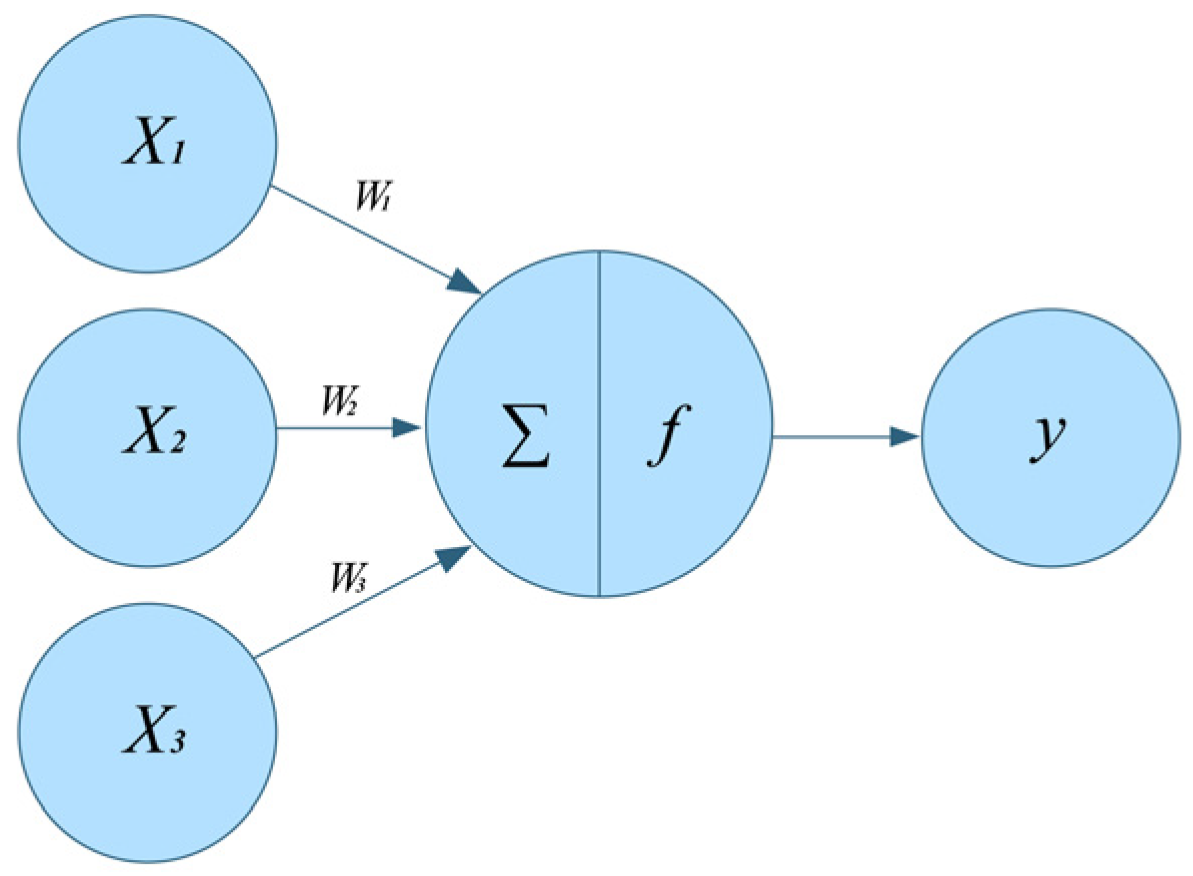
The structure and basic operation concept of neural networks are based on the organization and activity law of the human brain, and they are a simple copy of some of the complex neural network’s particular functions. Neurons are the fundamental building blocks of neural networks, and a large number of synchronized, simple neurons form a complex neural network through signal transmission and processing. A neuron has many basic parallel operation modules, each neuron has an output to which one or more neurons are connected, and each neuron has numerous connection pathways, each of which correlates to a weight, or connection weight. In Figure 2, X represents the signal transferred from other neurons, also known as the input signal. W represents the connection weights between higher-level neurons and lower-level neurons. Typically, there is an additional parameter, θ. Thus, the relationship between neuron output and input can be stated as follows:
y = j = 1 n W i j X j θ
The BP neural network is the most widely used model of neural network; its main operation principle is that for “n” input learning samples “x1 x2 x3 x4 x5⋯xn”, and its corresponding “m” output samples are “p1, p2, p3…pm”. The error between the actual output of the network (z1 z2 z3 z4 z5…zm) and the target vector (p1, p2, p3…pm) is used to modify its weights, so that the predicted “z” is as close as possible to the desired “t”. Even if the error in the Output Layer of the network is minimized, a BP neural network model with an error within the allowable range of the error can be obtained after repeated corrections of weights. Assuming that the Input Layer of the neural network is x = (x1 x2 x3 x4 x5…xn) T, the number of neurons in the Hidden Layer is is “h”; then the output value of the Hidden Layer is y = (y1, y2, y3…yh) T, and the number of neurons in the Output Layer is “m”; then the output value of the Output Layer is z = (z1 z2 z3 z4 z5…zm) T. Figure 3 shows the structure of this three-layer typical BP neural network model. In addition, the activation function of Hidden Layer to Input Layer is “f”, and the activation function of the Output Layer is “g”. Thus, there is the following:
The output value of the j-th neuron of the Hidden Layer:
y j = f i = 1 n W i j x i θ = f i = 1 n W i j x i
The output value of the k-th neuron of the Output Layer:
z k = g j = 0 h w j k y j
The error between the output value and the target value is
ε = 1 2 k = 1 m t k z k 2
The weight adjustment formula is
Δ w p q = η δ ε δ w p q
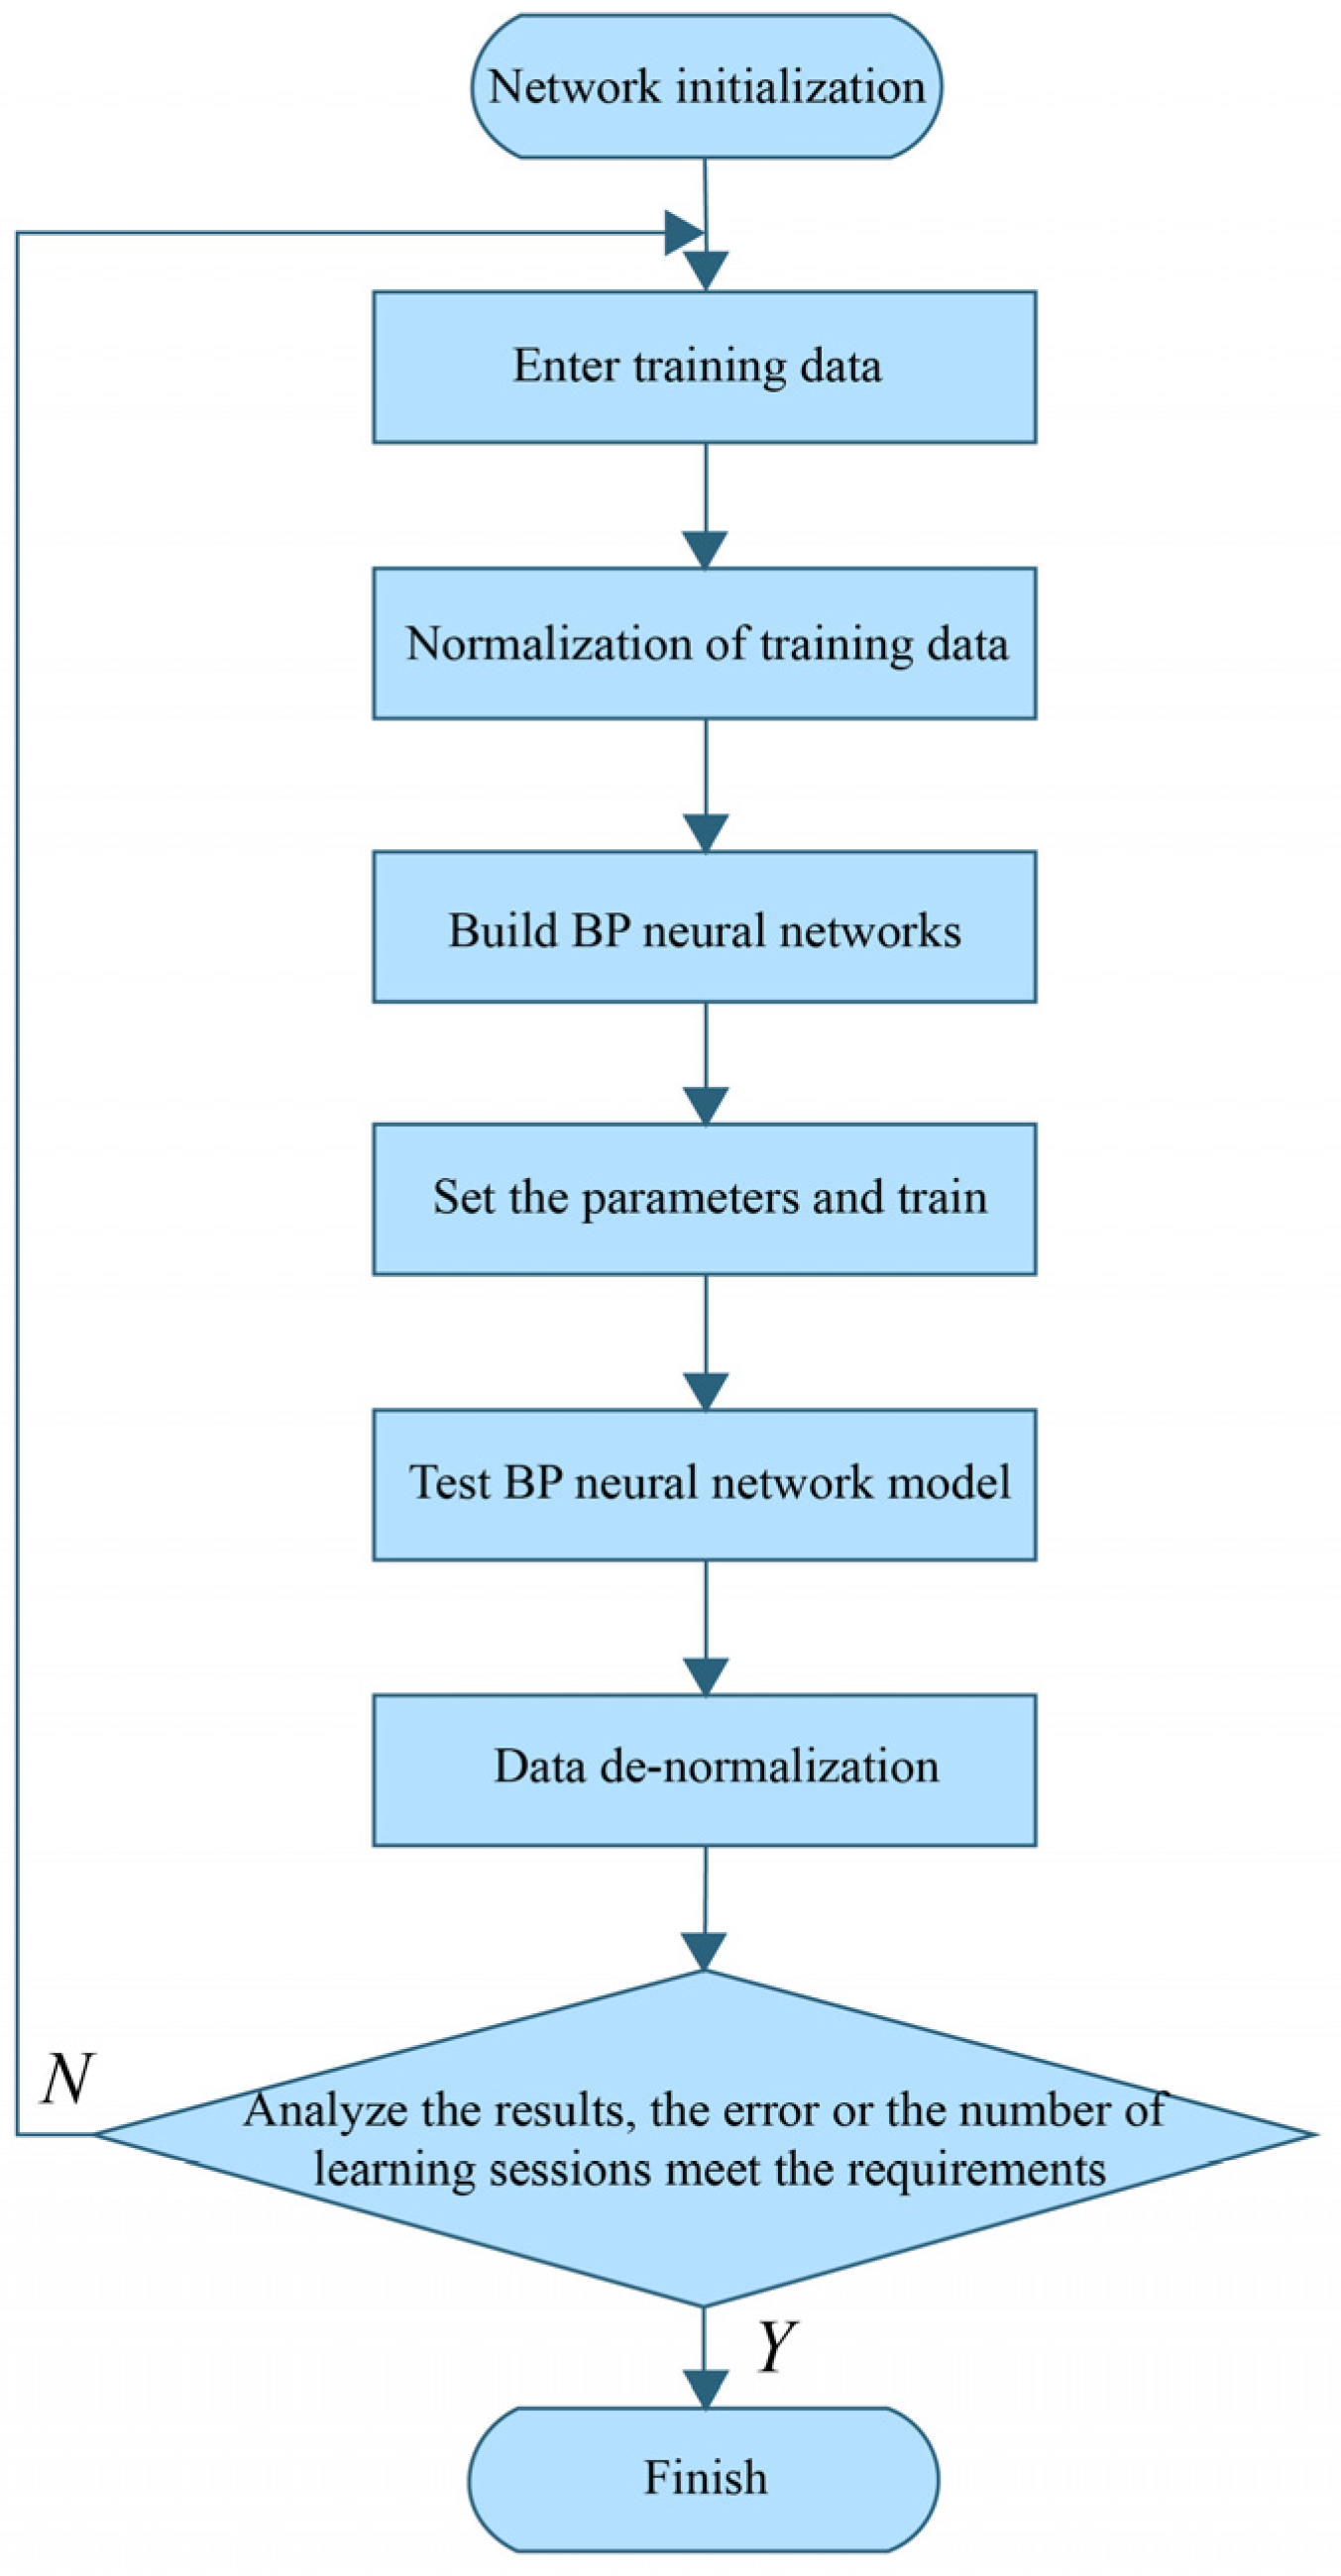
The specific operation flow of the BP neural network is shown in Figure 4:
  • Gray BP Neural Network
The gray BP neural network estimate model is a more advanced and novel engineering cost estimating model that combines the benefits and drawbacks of two algorithmic models: gray theory and the BP neural network. The BP neural network offers significant computer information processing capabilities, including massively parallel, distributed processing, self-organization, self-learning, self-adaptation, prediction, and fault tolerance. With all of these advantages, BP neural networks can improve efficiency and accuracy in prediction applications. Nevertheless, the BP neural network does not include a local self-optimization mechanism in the modeling process. In order to solve some complex nonlinear problems, the BP neural network must constantly adjust and correct the thresholds between the nodes. However, this type of operation is prone to causing the neural network to fall into local minima, which eventually leads to neural network training failure. Furthermore, because the BP neural network algorithm is fundamentally a gradient descent approach, the algorithm process is more complex, resulting in a sawtooth phenomenon, which reduces the BP neural network’s learning efficiency significantly. As a result, the focus of using the BP neural network for modeling is on selecting and processing the beginning values of the training samples to establish the neural network in line with their expected target direction to process and calculate the information data [28]. The gray system in the modeling process has no hard constraints on the distribution pattern of samples, the quantity of samples, or other information, and the model can be built even with a limited number of data samples. The gray system model also allows for some errors, which can be decreased by modifying the model’s relevant parameters. However, the gray system has flaws as well. This model has few constant parameters, a weak fault tolerance, and quick decreasing and increasing features, making it unsuitable for long-term data analysis and prediction [29,30]. Additionally, the gray system lacks the adaptive and self-learning ability of the BP neural network, its information data processing ability is insufficient, and, most importantly, there are serious flaws in error learning during the data and information processing process, which can directly reduce the prediction model’s accuracy.
Based on the above advantages of the gray system and BP neural network and their defects, in the spirit of complementary advantages and disadvantages, the gray system and BP neural network are fused to establish a new algorithmic model; this algorithmic model has been put into automation technology, economic management, the electric power industry, building construction, transportation, and energy use, and other related research and has important uses. The gray BP neural network operates as follows.
Firstly, the original data sequence is input into the GM (1,1) model to generate the first-order cumulative sequence based on the original sequence, the growth trend of the sequence is reflected through the transformation, and the data sequence generated by the cumulative is modeled by the gray difference and gray differential equations, and the prediction of the cumulative sequence is obtained by solving the parameters using the method of least squares, and finally the simulation and prediction of the original sequence are generated by the cumulative. The number of layers of each neuron are determined, and a BP neural network model is built. Considering that gray simulation values as feature inputs to neural networks can improve prediction stability, both the original data and the data fitted by the gray model are normalized in the neural network. Through forward propagation and error backpropagation in the neural network, the randomly generated initial weights and thresholds are adjusted until the error is less than the preset accuracy, and the prediction results are output. During this process, unspecified hyperparameters (such as the loss function using mean square error (MSE) and the optimizer using gradient descent) follow the standard default configuration of BP neural networks to maintain the model’s simplicity and reduce the risk of overfitting. Combining the outputs of the gray model and neural network, the coefficient of determination (R2) and mean absolute percentage error (MAPE) metrics are used to verify the prediction performance. For assessing the linear correlation between predicted and actual values, the formula is
R 2 = 1 i = 1 n y i z i 2 i = 1 n y i y ¯ 2
M A P E = 100 % n i = 1 n y i z i y i
where y i is the i-th actual observation, z i is the neural network prediction, and y ¯ is the average of the actual observations.

2.4.3. Quantitative Characterization of Green Space Morphology

This study quantitatively characterizes the spatial patterns of urban green spaces, with the core objective of revealing how their spatial patterns influence carbon cycling processes within urban ecosystems, ultimately impacting regional carbon emission levels. This analysis is grounded in an interdisciplinary perspective that integrates landscape ecology, ecosystem services, and urban metabolism theory. Based on land use classification standards and the relevant research consensus [31], this study adopts a citywide coverage approach to define urban green spaces, encompassing all forest and grassland types within the Nanjing municipal area [9].
The “pattern–process–scale” paradigm [31,32] at the core of landscape ecology theory provides key support for this study. This theory emphasizes that landscape spatial patterns profoundly influence ecological flows (such as carbon flows) and ecological processes (such as photosynthetic carbon fixation and respiratory release). Green spaces, as key ecological elements in urban landscapes, have morphological characteristics (such as patch size, shape, connectivity, and aggregation) that directly determine the efficiency of internal ecological processes and the intensity of interactions with the surrounding environment, thereby influencing their carbon sequestration function and ability to regulate external carbon emissions [5,33]. For example, large core patches (LPI) may have a higher photosynthetic efficiency and lower edge effects, which are conducive to carbon sequestration, while highly connected (COHESION) green space networks may promote the transmission and integration of ecological flows (including carbon), enhancing the overall resilience and carbon sink capacity of ecosystems [34].
In addition, the ecosystem services’ theoretical framework clearly defines the important role of urban green spaces in providing key regulatory services [35,36]. Green spaces sequester CO2 from the atmosphere through photosynthesis and indirectly reduce carbon emissions associated with building cooling energy consumption by regulating microclimates (such as mitigating the heat island effect). However, the construction and maintenance of green spaces also involve energy consumption and carbon emissions. Therefore, their net carbon benefits (the net value after carbon sinks offset carbon sources) are key to assessing their impact on regional carbon emissions [37,38]. Landscape pattern indices are important tools for quantifying the “potential” and “efficiency” of green spaces in providing carbon regulation services. For example, indicators such as AREA_MN and AI can reflect the scale and spatial organization efficiency of carbon sink core areas, while PLADJ may influence the convenience and energy consumption of maintenance and management.
The theory of urban metabolism views cities as complex systems that continuously input (energy, materials), transform (production, consumption), and output (waste, emissions) [39]. Within this framework, the urban green space system itself is also a component of urban metabolism. It not only participates in the biogeochemical cycle of carbon (assimilation and absorption), but its spatial characteristics also profoundly influence the carbon emission intensity of other metabolic processes within the city. For example, the distribution pattern of green spaces influences residents’ travel choices (e.g., proximity to parks may encourage walking or cycling, reducing transportation carbon emissions) and the energy consumption of recreational activities; their morphological structure (e.g., large green spaces or ecological corridors) directly impacts the effectiveness of mitigating the urban heat island effect, which in turn affects building energy consumption (particularly cooling); meanwhile their spatial configuration (e.g., highly fragmented or located in high-density built-up areas) is closely related to the material and energy inputs required for their construction and maintenance (implicit carbon emissions) (Dai, 2011; Wang et al., 2021) [29,40]. Therefore, analyzing the relationship between green space form indicators (such as TA and PD) and carbon emissions is key to understanding how urban material and energy flows (particularly carbon flows) are spatially regulated by the form of green infrastructure.
Based on the above theoretical foundations, this study selected 10 landscape pattern indices with clear ecological significance, which respectively assess patch area and shape (e.g., TA, LPI, AREA_MN, PARA_MN, CONTIG_MN), spatial configuration (e.g., PD, PLADJ, COHESION, AI), and overall connectivity (MESH). The specific ecological implications and calculation methods of these indices are detailed in references [41,42,43,44]. These indices are calculated using FRAGSTATS 4.2 to systematically investigate the following: how green space patterns influence regional carbon emissions by regulating interactions between internal and surrounding environments; which morphological features are more conducive to enhancing the carbon regulation service efficiency of green spaces; and how green space morphology interacts spatially and feeds back with other carbon-emitting processes such as urban energy consumption, transportation, and maintenance management.
2.4.4. Optimal Parameter Geo-Probe

The optimal parameter geo-probe has been shown to efficiently solve the shortcomings of classic geo-probes, which are prone to human subjective variables while discretizing impact factor data, resulting in unsatisfactory discretization. The method under examination uses five discretization strategies: natural breakpoints, quartiles, equal intervals, geometric intervals, and standard deviations. The ideal parameter combinations are discovered through screening using the maximum q-value criterion [45,46,47]. The factor identification function evaluates explanatory variables’ contribution to dependent variables’ geographically distinctive features quantitatively. The module was used in this study to look into the patterns of geographical and temporal differentiation in the impact of urban green space morphological features on carbon emissions in Nanjing. The equation is
q = 1 h = 1 L N h h 2 σ N σ 2
In this equation, the q value is indicative of the extent to which a specific influence factor can explain carbon emissions, with a value ranging from 0 to 1. A higher q value signifies that the driver exerts a more substantial influence on carbon emissions; conversely, a lower q value denotes a comparatively modest influence. h = 1, …, L represents the number of natural factor classifications; N h and h 2 σ denote the number of cells and the variance of the layer h, respectively; and N and σ 2 represent the number of cells and the variance of the whole.

3. Results

3.1. Model for Estimating Urban Carbon Emissions

3.1.1. Importance Assessment of Variables

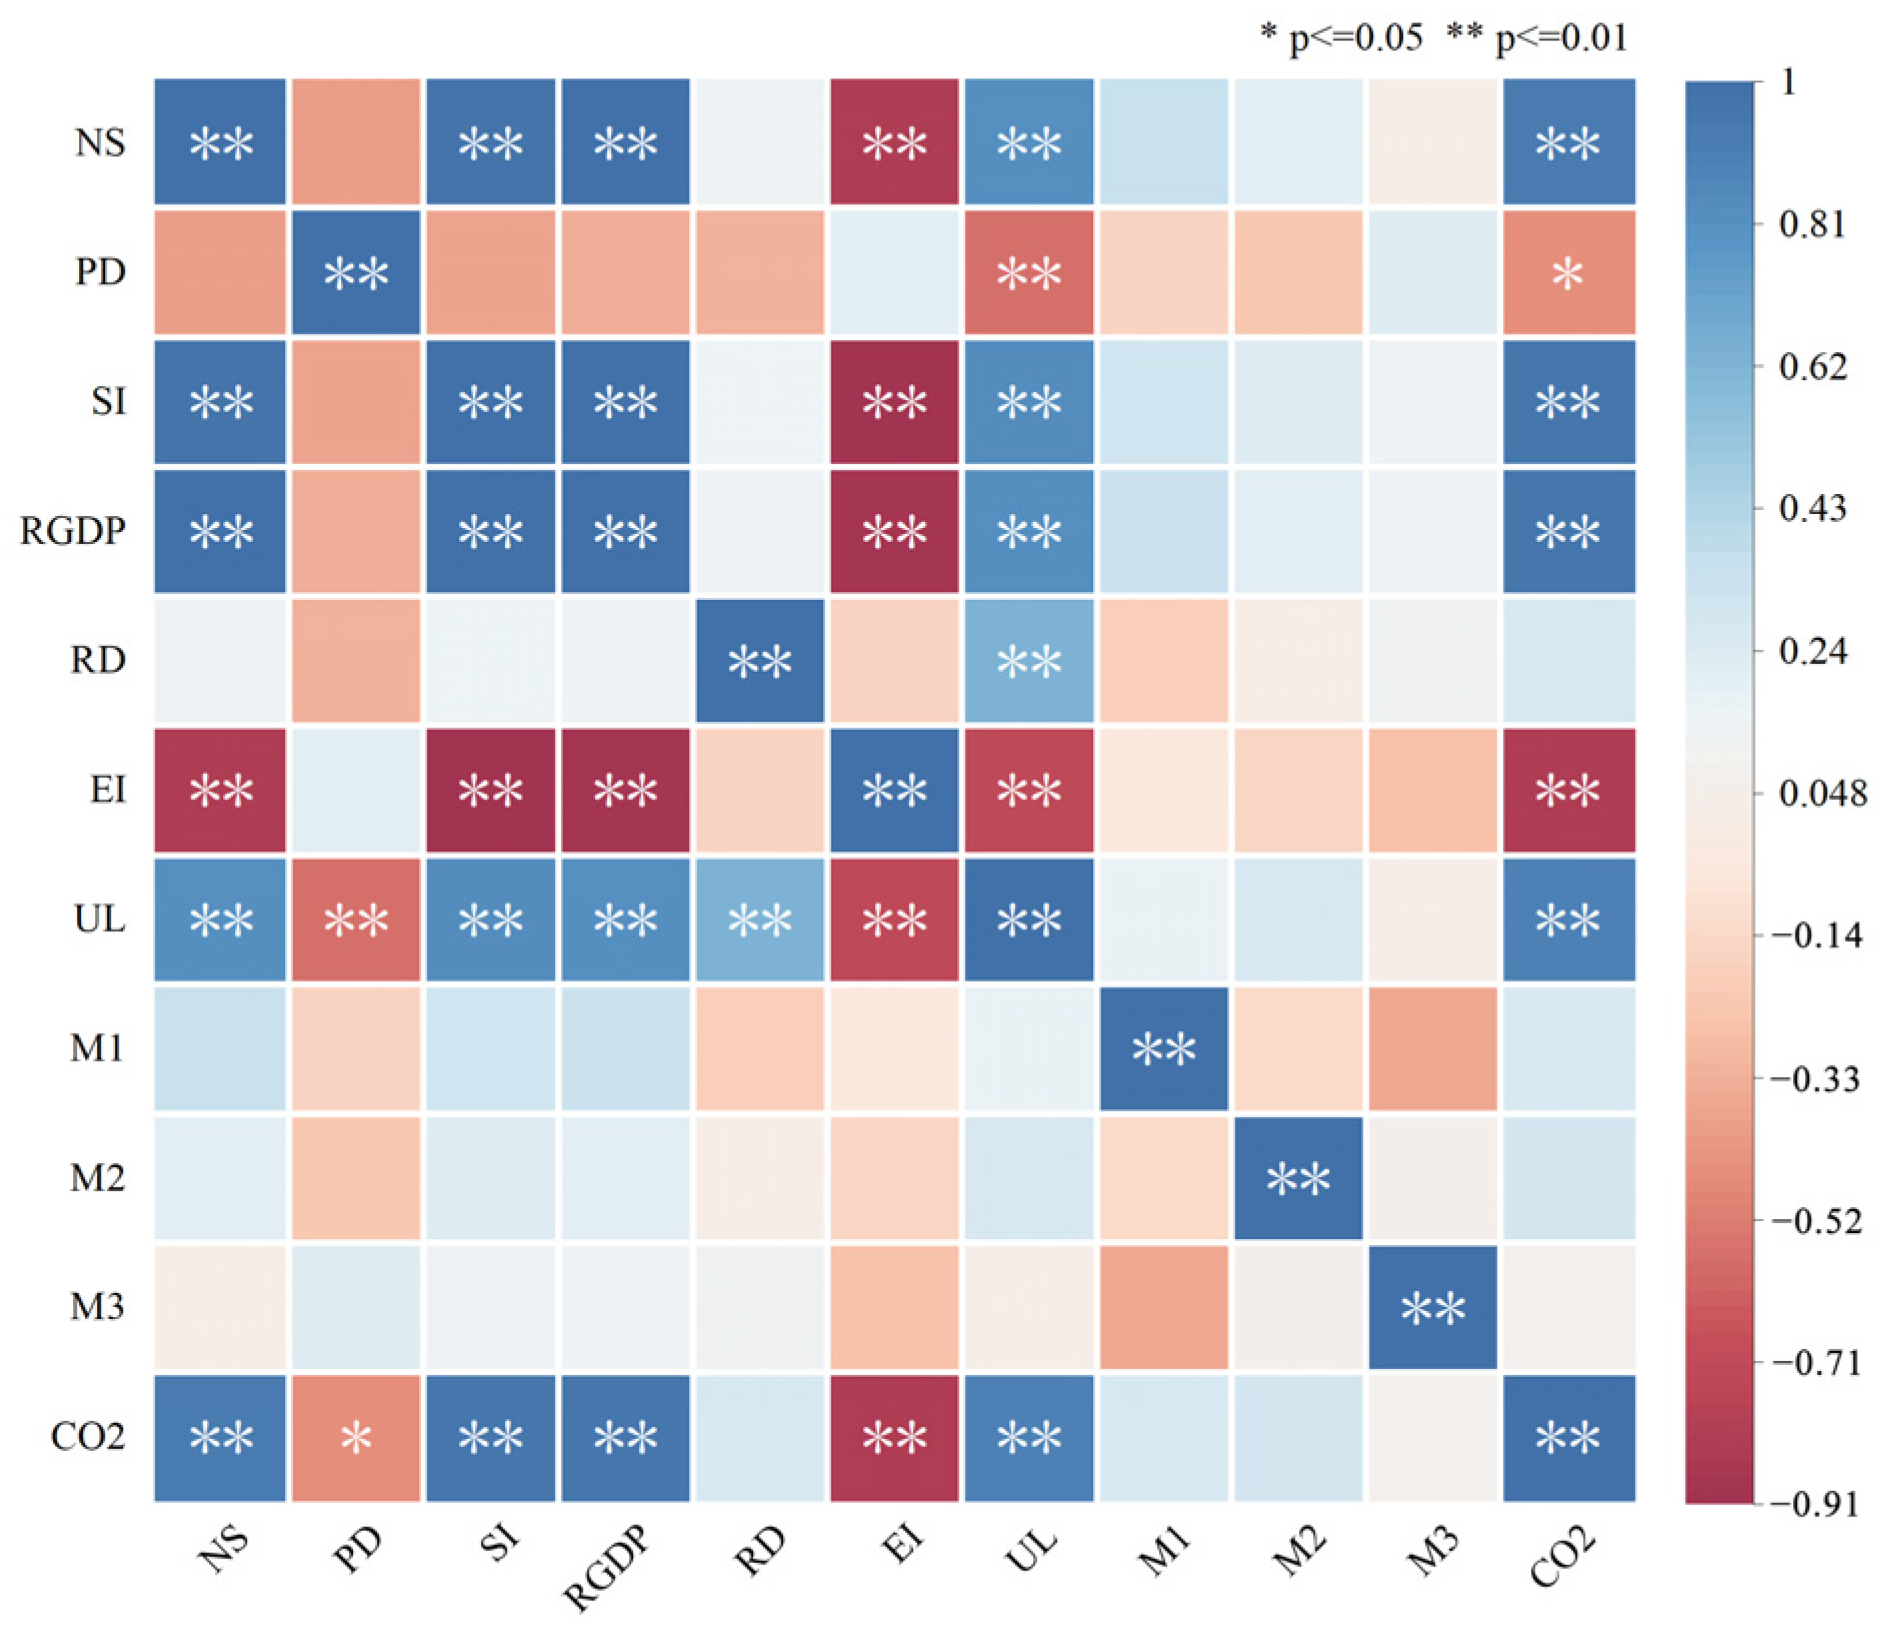
Multiple regression analyses were used in this study to identify variables suitable for estimating carbon emissions. Based on existing studies [48], the socioeconomic factor independent variables of nighttime light sum (NS), population density (PD), secondary industry output (SI), regional gross domestic product (RGDP) per capita, road density (RD), energy intensity (EI), and urbanization rate (UL), as well as meteorological and environmental factor independent variables of mean annual temperature (M1), precipitation (M2), and wind speed (M3), were selected as the independent variables of the study and carbon emissions (CO2) as the dependent variable. The results of the analysis (Figure 5) show that carbon emissions and the NS, PD, SI, RGDP, EI, and UL are significantly correlated, with a p-value of less than 0.05, while the correlation of road density and meteorological environmental factors on carbon emissions is not significant.
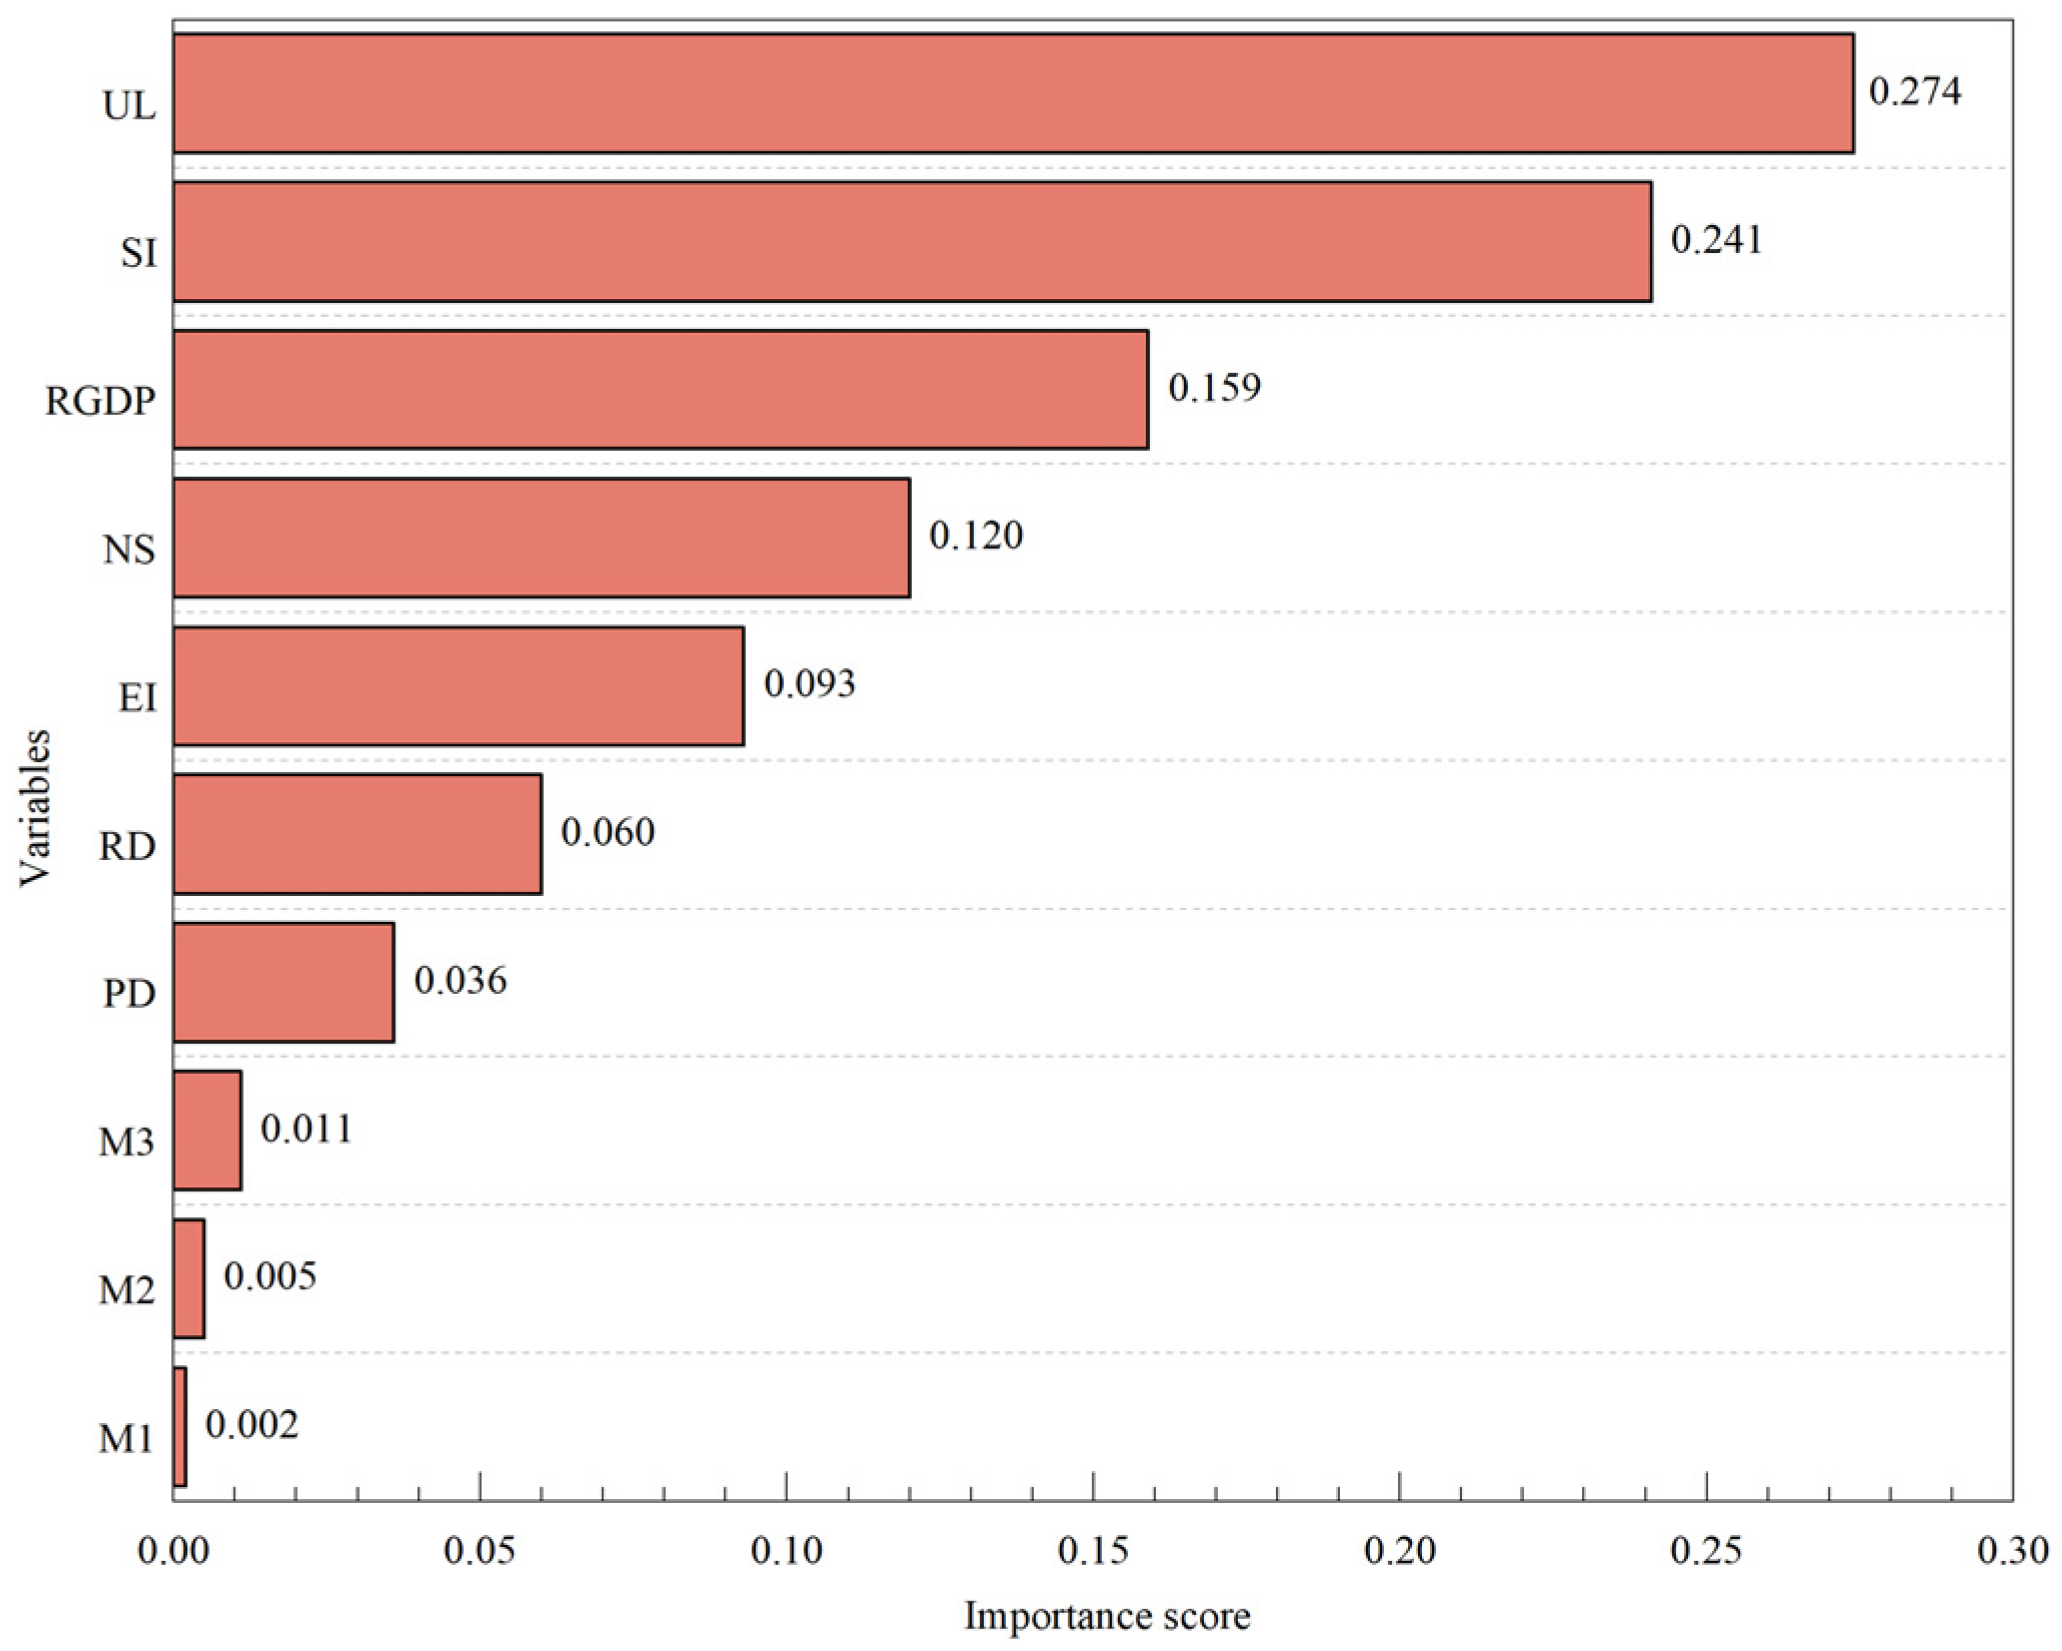
The remaining independent variables were subjected to multiple linear regression analysis after excluding meteorological and road density factors. The analysis revealed a significant multicollinearity problem (i.e., the VIF value was well above 10) for the selected independent variables, implying that the linear model may not fully capture the complexity of the relationship, resulting in instability in the model’s parameter estimation, an increase in standard error, and a decrease in the model’s explanatory power. To address this issue and screen out the independent variables that are most important to the target variable, the random forest algorithm was used for feature selection. These five variables were finally chosen for the modeling of carbon emission estimations because, as Figure 6 illustrates, the importance scores of UL, SI, RGDP, NS, and EI on carbon emissions add up to 0.886, indicating that they have covered the majority of the factors that have an impact on carbon emissions.
The key variables screened are highly consistent with the findings of established studies: UL, RGDP, RGDP, NS, and EI all have a significant positive driving effect on carbon emissions [49]. They are also in line with the conclusions of scholars such as Wang Ying et al. that carbon emissions in Jiangsu Province, of which Nanjing is a part, are more susceptible to the structure of energy sources, economic development, and population size [50]. The meteorological factors have no significant correlation in the model, and in-depth analysis reveals that this is closely related to Nanjing’s unique climatic characteristics: the coefficient of variation of the average annual temperature is only 2.29%, and the interannual fluctuation of precipitation is 23.9% during the study period, and the relative stability of the climatic conditions weakens their regulatory effect on energy consumption. Furthermore, the urban heat island effect’s homogenization of the climate may weaken the influence of natural climate variables, and the microclimatic changes caused by human intervention may be the reasons for the meteorological factors’ insignificant influence.

3.1.2. Construction and Analysis of Gray BP Neural Network Model

  • Construction of gray BP neural network
In this study, a strategy combining the gray prediction model and BP neural network was employed to make predictions. First, this study employed the gray prediction model to generate a preliminary prediction of carbon dioxide data for a total of 21 years from 2000 to 2020, resulting in simulated carbon dioxide levels from 2000 to 2020. This step is based on gray system theory, which constructs differential equations to expose the underlying patterns of the data and generates the corresponding prediction series.
Subsequently, to increase the accuracy and stability of the predictions, this study incorporated the simulated values created by the gray prediction model as eigenvalues to the raw data, resulting in six eigenvalues and one output for each dataset. The eigenvalues are NS, SI, RGDP, EI, and UL and gray prediction values, and the output value is CO2. Based on this information, this study selected to build a three-layer BP neural network model using the first 16 sets of data as the training set. This research employs the backpropagation technique to continually change the weights and thresholds of the neural network to minimize the prediction error after feeding these data into the neural network and determining the error between the network’s output and the true value. This method is repeated until the error hits a predetermined threshold or the number of iterations reaches a maximum.
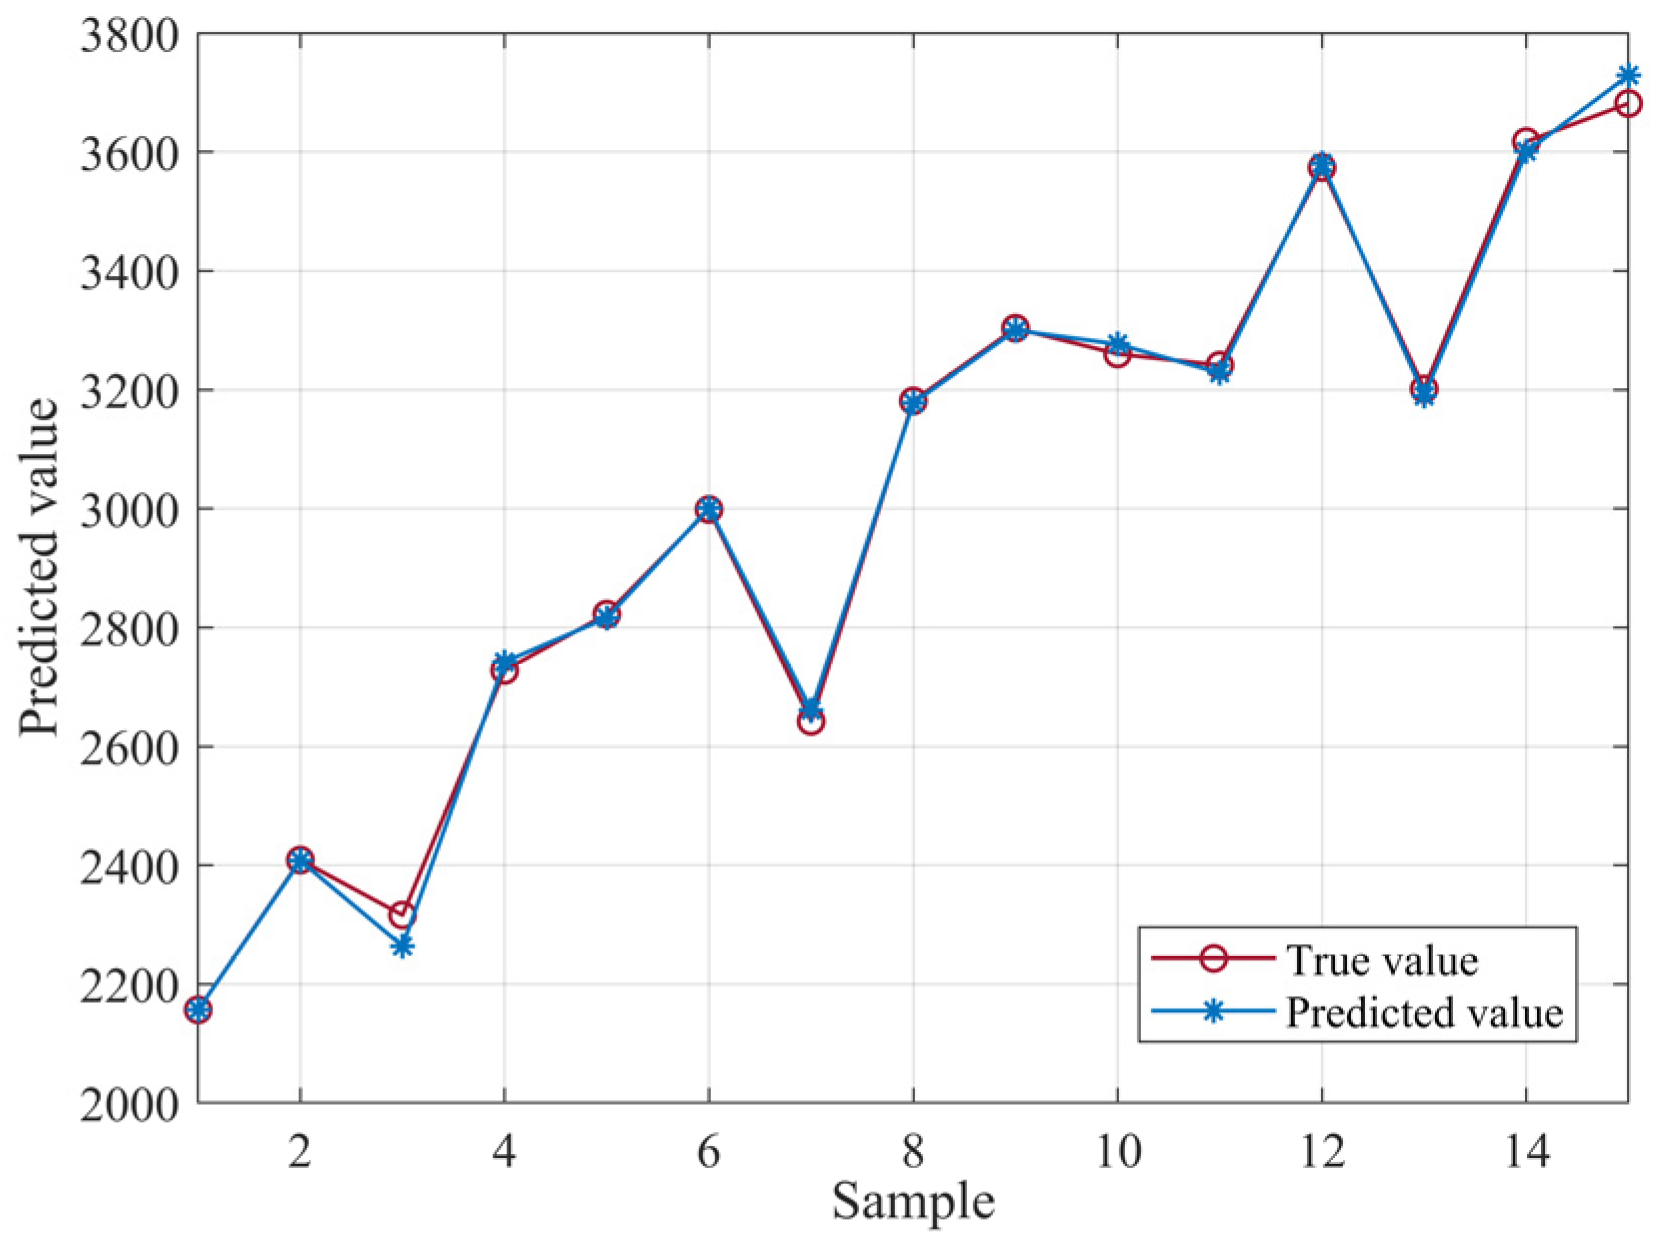
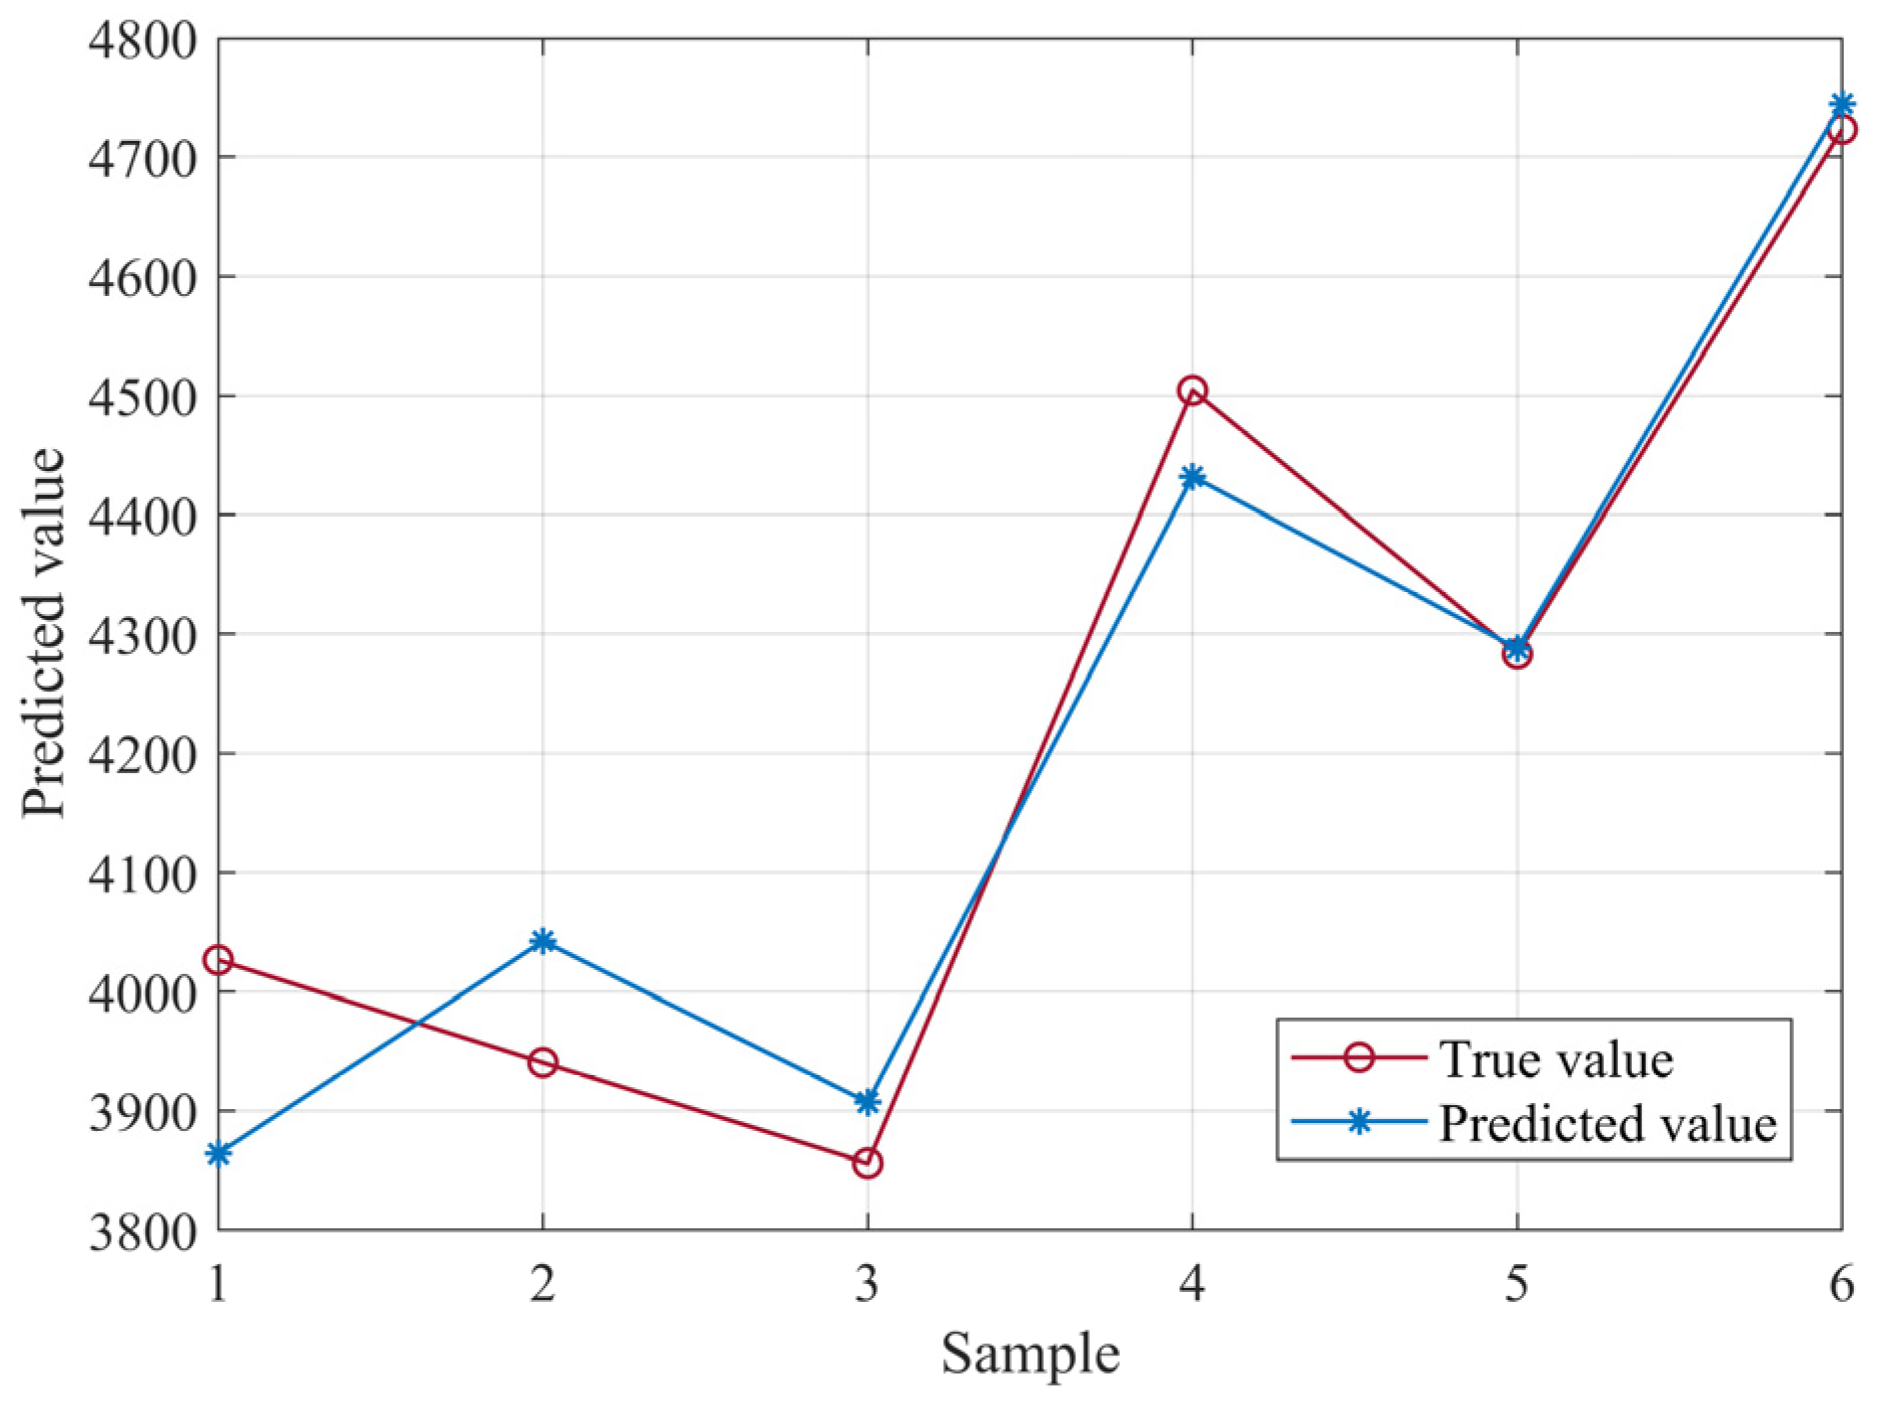
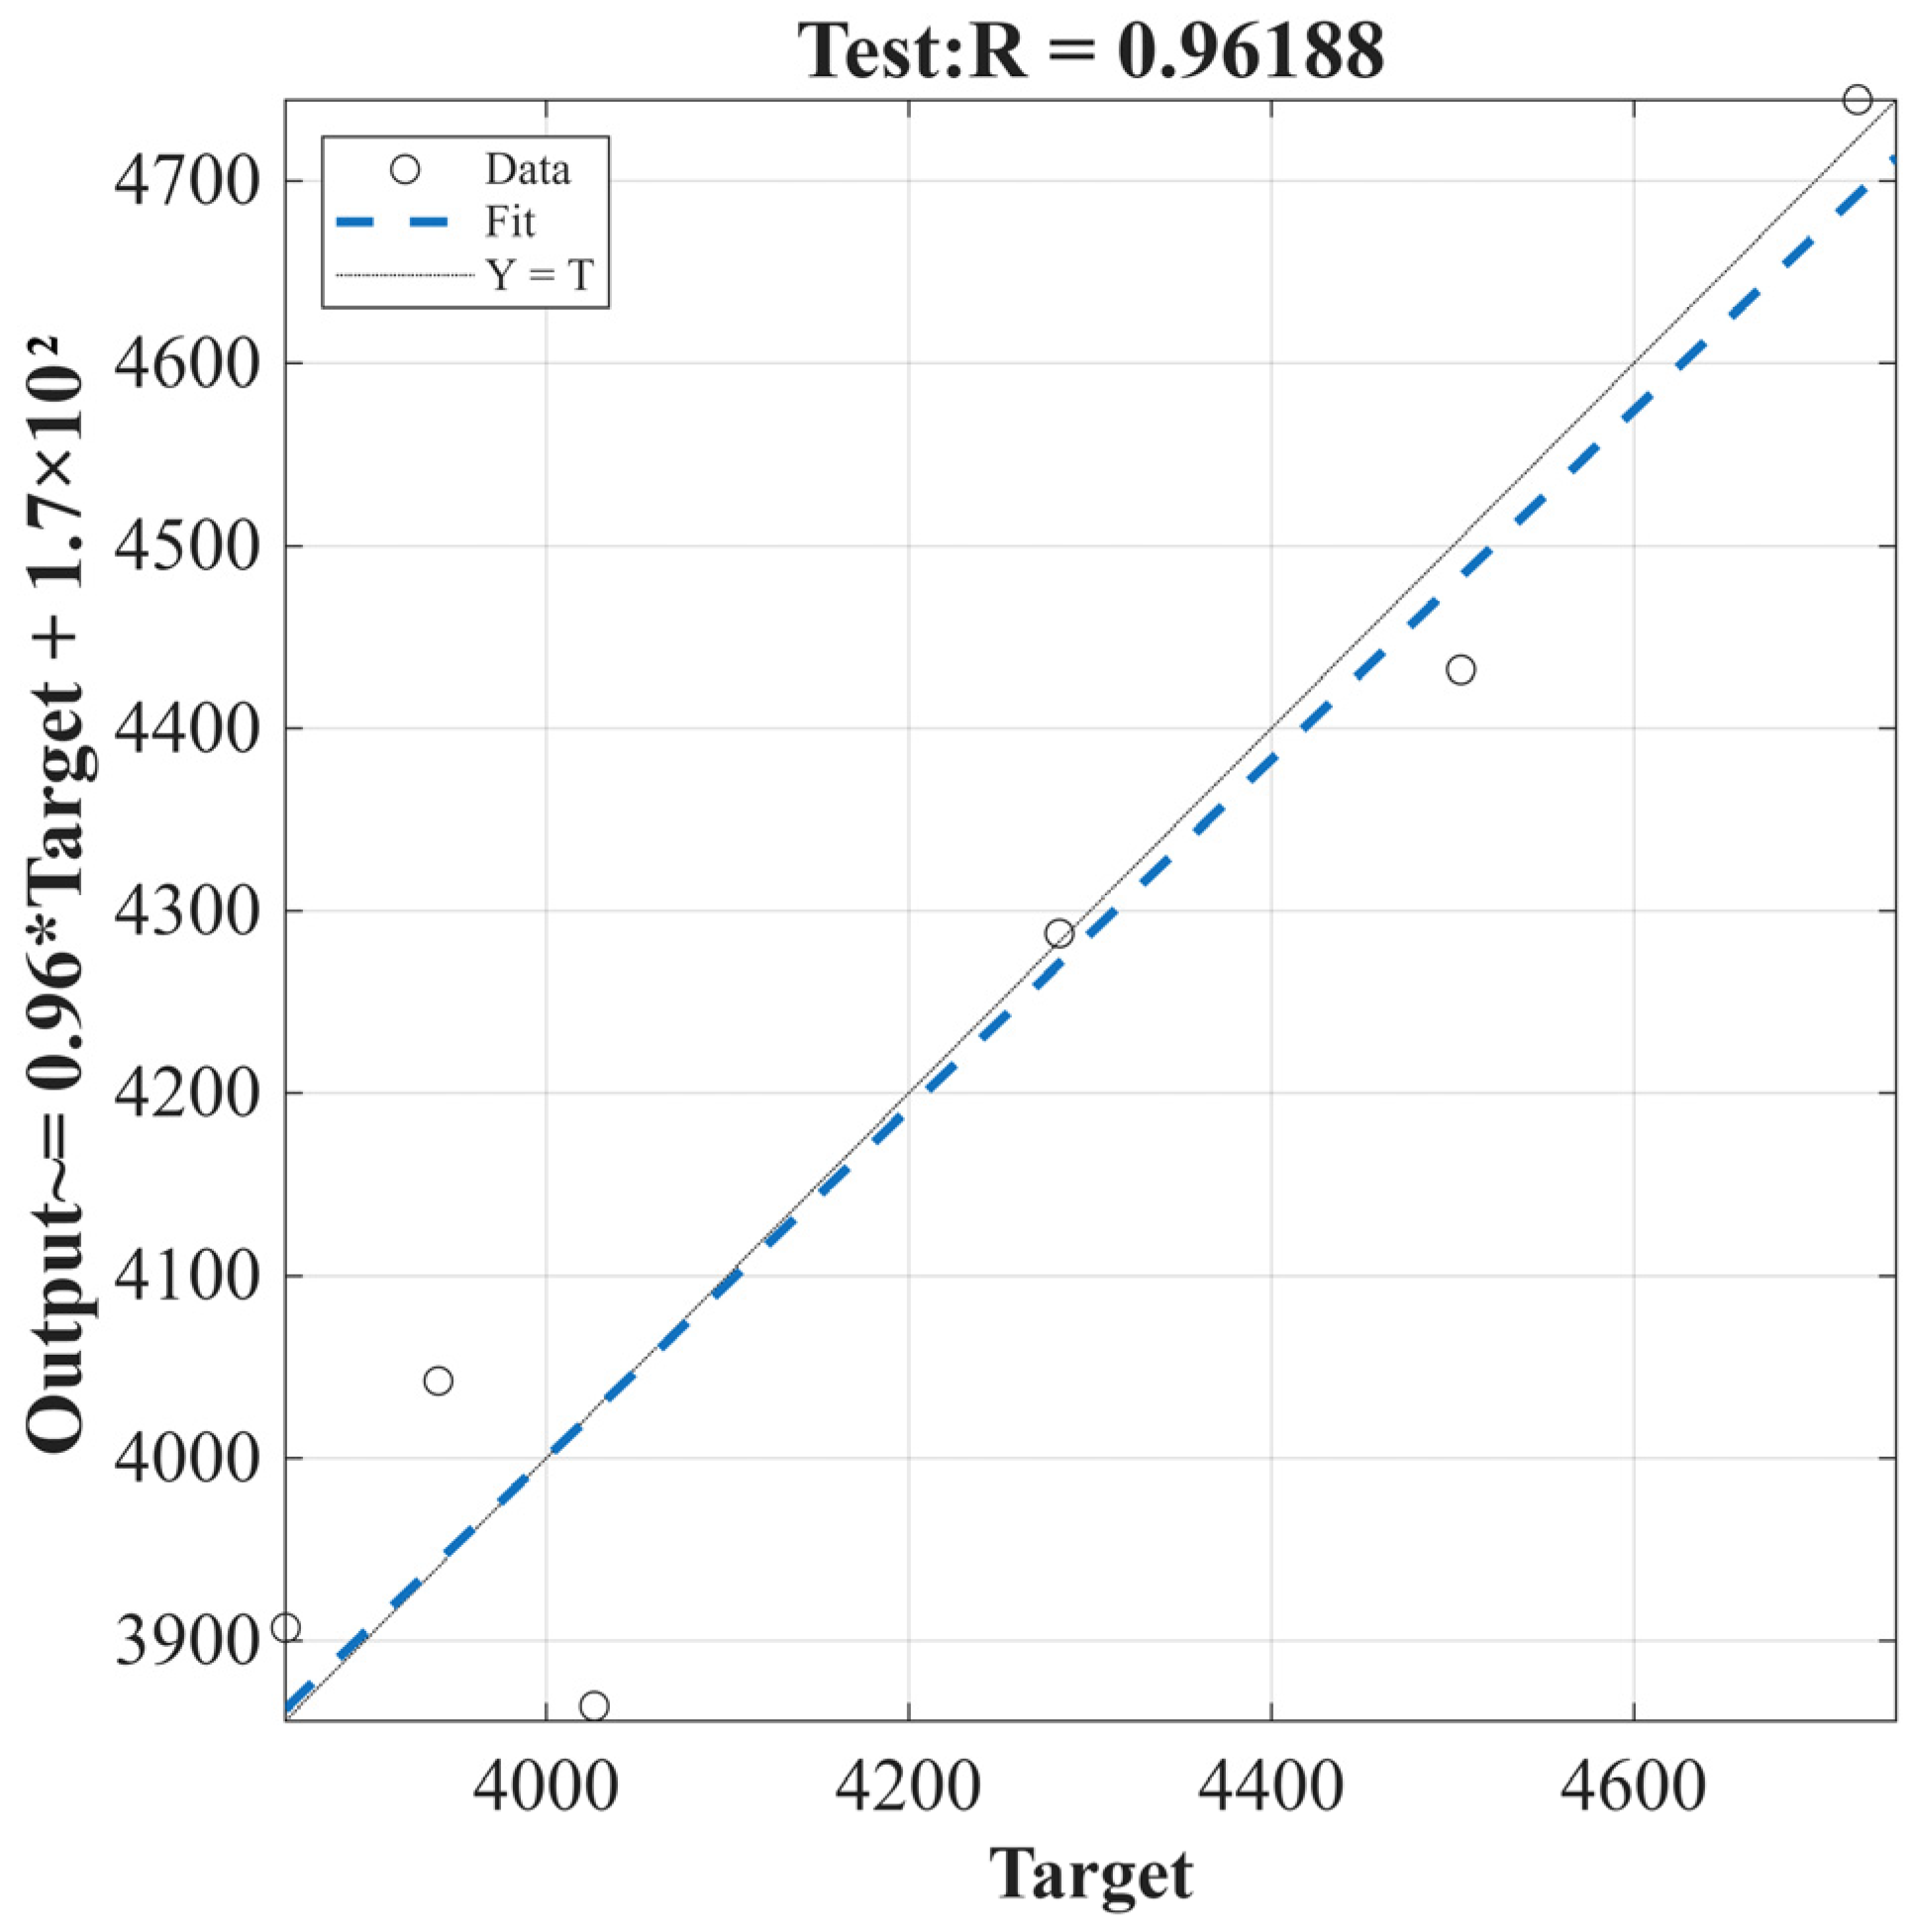
After training, this study used the remaining five sets of data as a test set to assess the neural network’s fit and prediction ability. This study produced the anticipated values by feeding the test set data into the trained neural network and calculating the error between the expected and real values. This stage allows this study to better comprehend the neural network’s performance on unknown data and evaluate the model’s generalization capacity. The structure of the built neural network is presented in Figure 7. The figure shows that there are six Input Layers, five Hidden Layers, and one Output Layer, and the output represents the output value. After the model is built, it must be trained to ensure that the prediction results are reliable and accurate. The key to the training phase is to modify the network’s weights and bias terms so that the model can learn the mapping relationship between the input data and the target value. Table 4 displays the training parameters of the prediction model created in this study, which are based on the model’s efficiency and synergy as well as its own characteristics [28,51]. The values used for these hyperparameters are consistent with previous application studies of gray BP neural network models [51,52,53]. After configuring the settings, the neural network prediction model may be trained in MATLAB R2020a, and the training results are displayed in Figure 8. Figure 9 and Figure 10 demonstrate the outcomes of model training and testing, with the red line representing the true value and the blue line representing the model’s predicted value based on the sample data prediction. Figure 11 and Figure 12 illustrate the R coefficients for the model’s training and testing sets, and the high R values imply that the model has a high degree of goodness of fit and accurately represents the data trend.
  • Model validation and comparison
The training set has an R coefficient of 0.9975, which is near to one. This shows that the model fits well on the training data. The high R coefficient suggests that the model has captured the majority of the patterns and information in the training data. Figure 6 shows the model testing results, with the test set’s R coefficient of 0.9619, which is still a quite high value. This suggests that the model has a good generalization capacity on unknown data and may be used on new datasets. The R2 score remains above 0.9 on the test set, indicating the model’s stability and prediction accuracy. The MAE and MAPE of the training and test sets reveal that the model performs well. The MAE is 29.86 for the training set and 68.88 for the test set, with the latter being much lower, showing that the model makes fewer errors when predicting unknown data. Similarly, the MAPE of the training set is 0.83%, while the MAPE of the test set is even lower, at 1.68%, demonstrating the model’s great precision and accuracy. In addition, RMSE is another evaluation metric that shows the model’s prediction performance. The training set’s RMSE is 49.50, whereas the test set’s is 86.60. The RMSE is low in both the training and test sets, indicating that the difference between predicted and actual values is minor. Since both the training error (MAPE = 0.83%) and the testing error (MAPE = 1.68%) converged stably, and the prediction results were well-fitted to the actual values (R2 > 0.96), indicating that no overfitting occurred, no regularization techniques (such as L1/L2 penalty terms) were introduced into the model.
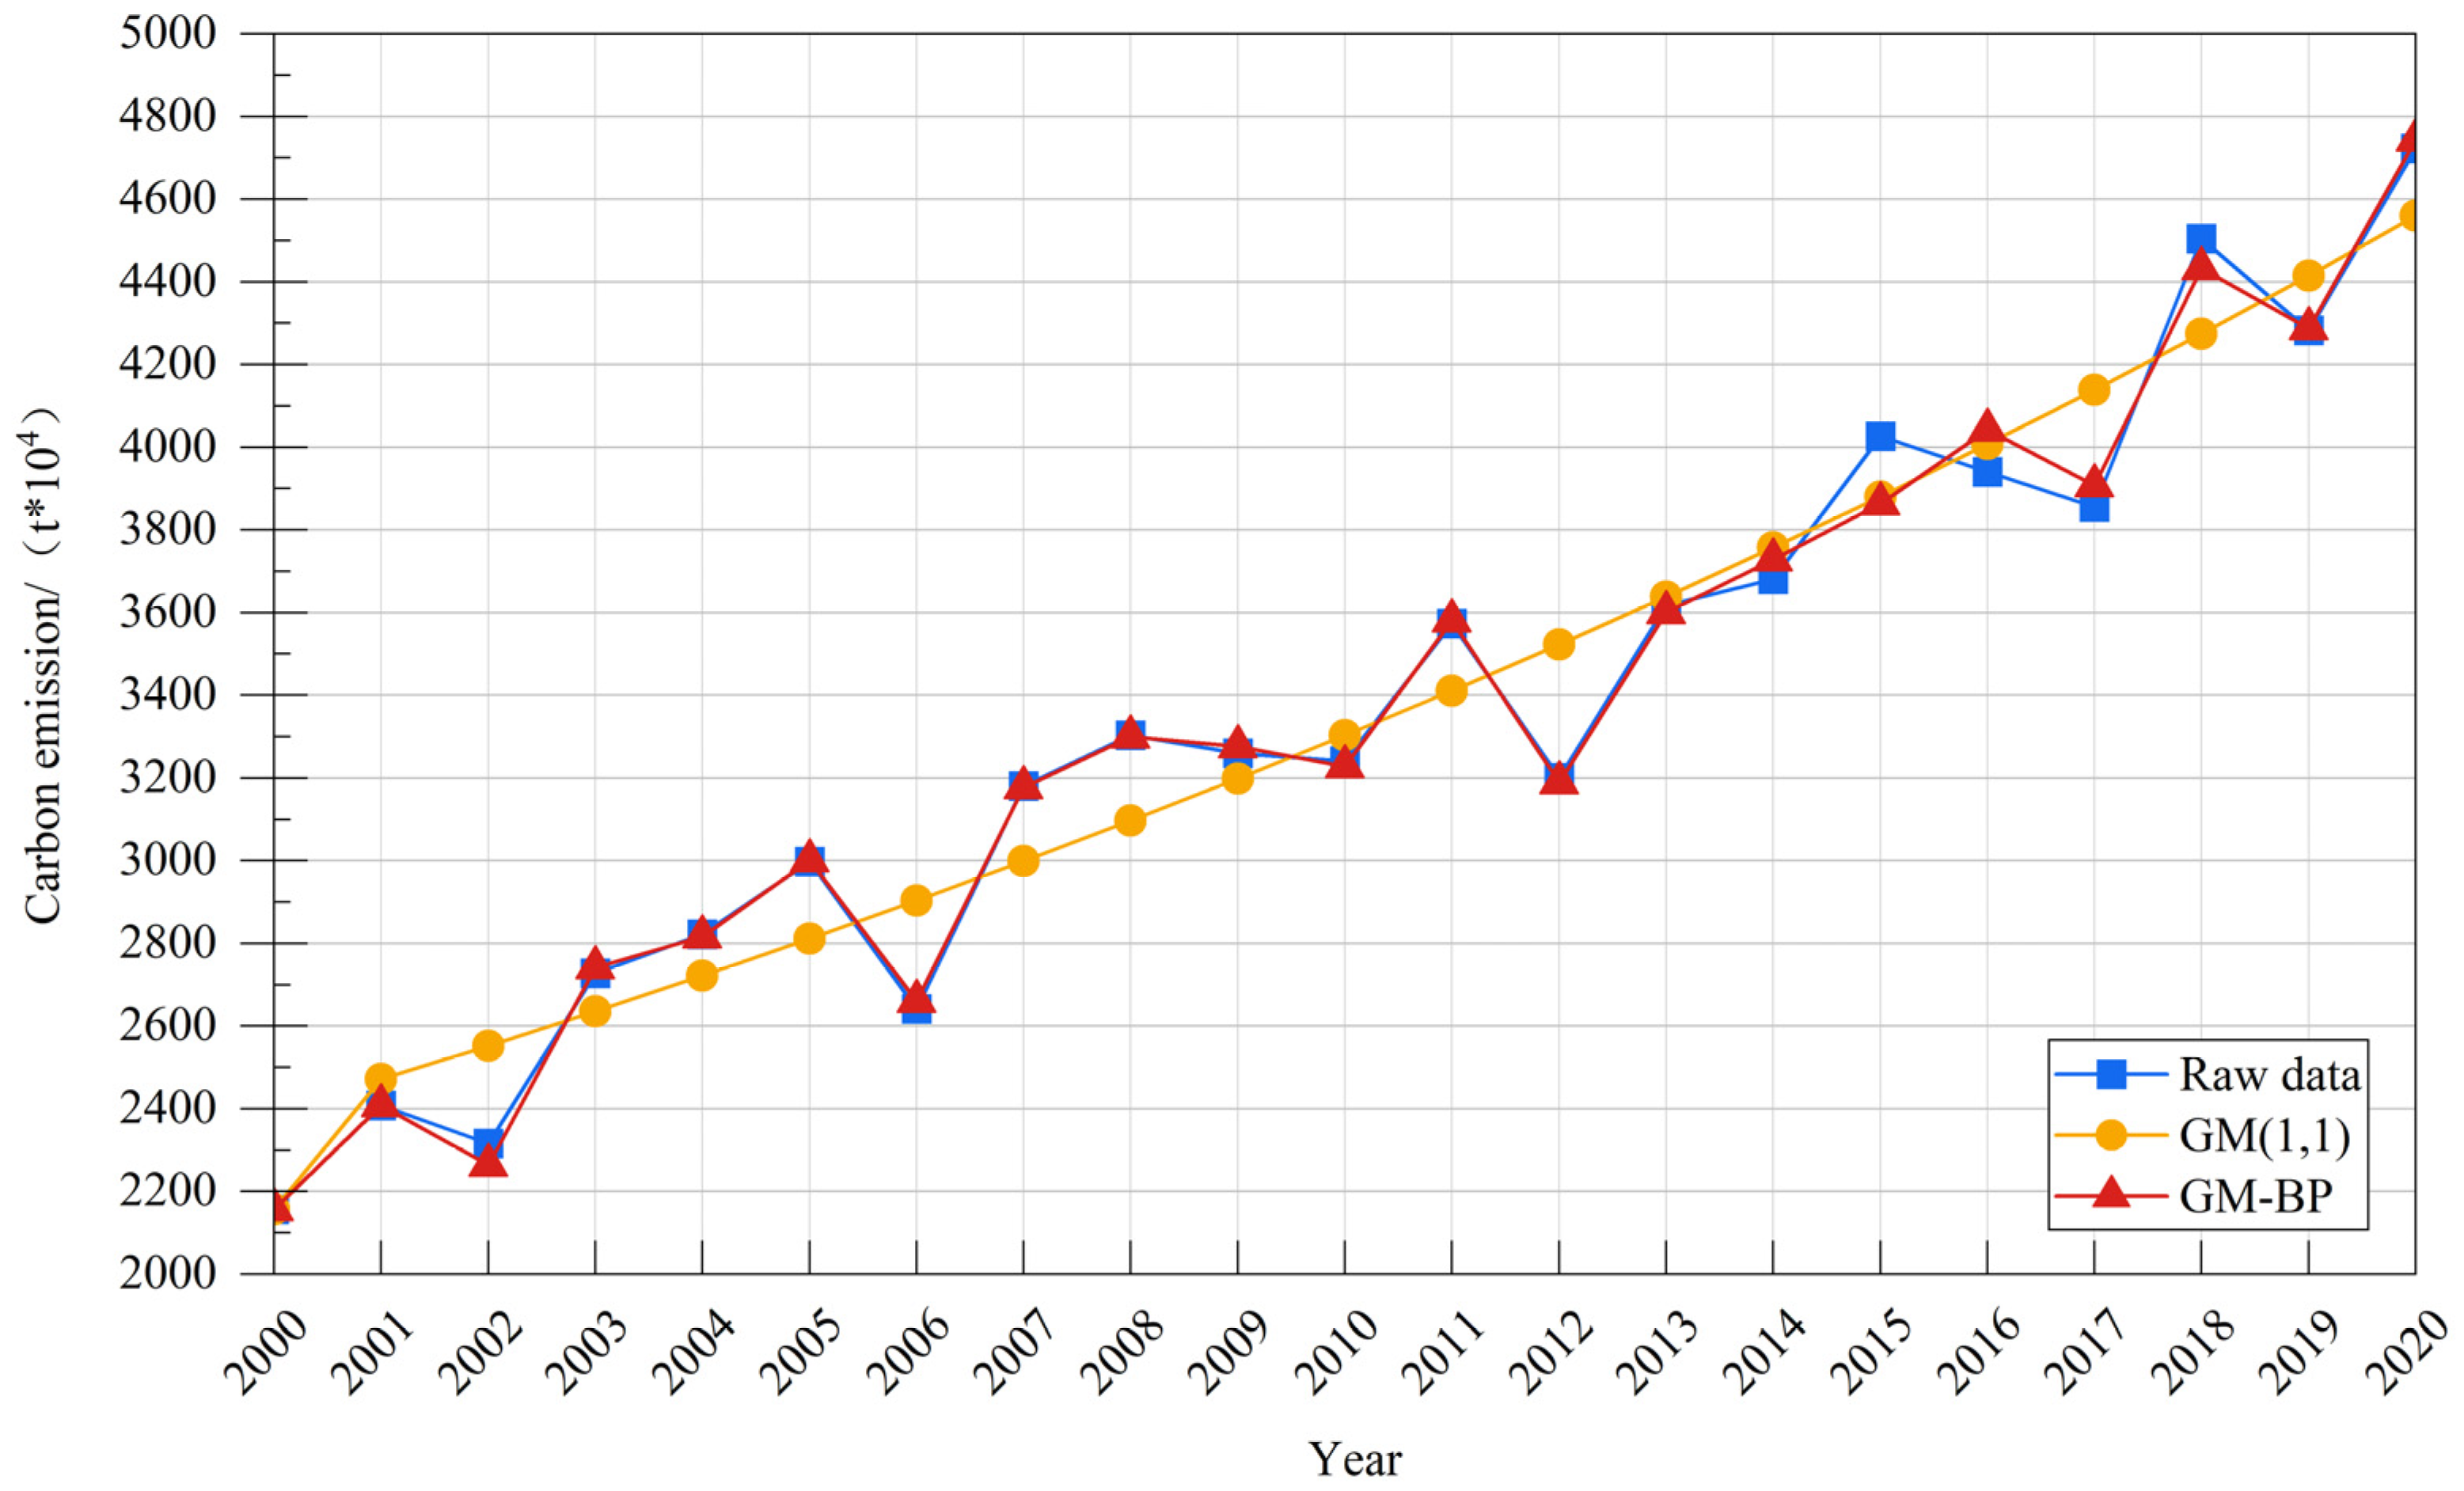
To summarize, the gray neural network model performed well on both the training and testing sets. Several evaluation criteria, including the R coefficient, MAE, MAPE, and RMSE, show that the model is highly predictive and stable. This demonstrates that the gray neural network model is highly accurate and reliable when dealing with economic prediction problems, indicating significant support for practical applications. The model comparison results (Figure 13) show that the hybrid GM-BP neural network model outperforms the traditional GM (1,1) model in terms of prediction accuracy, with an average prediction error reduction of 42.7%. The GM-BP model has an excellent ability to capture nonlinear features, especially at critical nodes such as the turning points in 2012 and 2020, with a prediction error of only 0.45%. This result not only confirms the hybrid model’s superiority but also demonstrates that the decoupling trend between economic development and carbon emissions in Nanjing has not yet fully formed, and there is still a strong push to reduce emissions.
To comprehensively evaluate the performance of the gray BP neural network, this study selected two advanced models, XG-Boost and LSTM, for comparative analysis. All models used the same dataset (trained from 2000 to 2015 and tested from 2016 to 2020) and underwent standardized preprocessing. The XG-Boost model was configured with a maximum tree depth of 9 and 200 ensemble trees; the LSTM model used the Adam optimizer with 3000 iteration rounds and an initial learning rate of 0.01 (the learning rate was adjusted to 0.01 × 0.1 after 1200 training iterations). As shown in Table 5, the gray BP neural network outperforms the others on the test set, with an R2 value of 0.9619, significantly higher than XG-Boost (0.9060) and LSTM (0.9136). Additionally, the mean absolute percentage error (MAPE) of 1.68% is 75% and 73% lower than that of the other two models, respectively.
A detailed analysis revealed that XG-Boost exhibits severe overfitting, with a low MAE of 1.49 on the training set but a skyrocketing MAE of 215.53 on the test set; LSTM has slightly better generalization capabilities but requires 3000 iterations, resulting in low computational efficiency; the gray BP neural network exhibits reasonable error differences between the training set (MAE = 29.86) and the test set (MAE = 68.88), and its prediction error at critical inflection points is only 0.45%, fully demonstrating its ability to capture nonlinear sudden changes. This advantage stems from the neural network’s robust nonlinear fitting capability and gray theory’s unique adaptability to small-sample data, enabling it to achieve the optimal balance between accuracy and efficiency in scenarios with limited carbon emissions data. This provides a more reliable technical pathway for city-level dynamic monitoring of carbon emissions.

3.2. Spatial and Temporal Evolution of Carbon Emissions

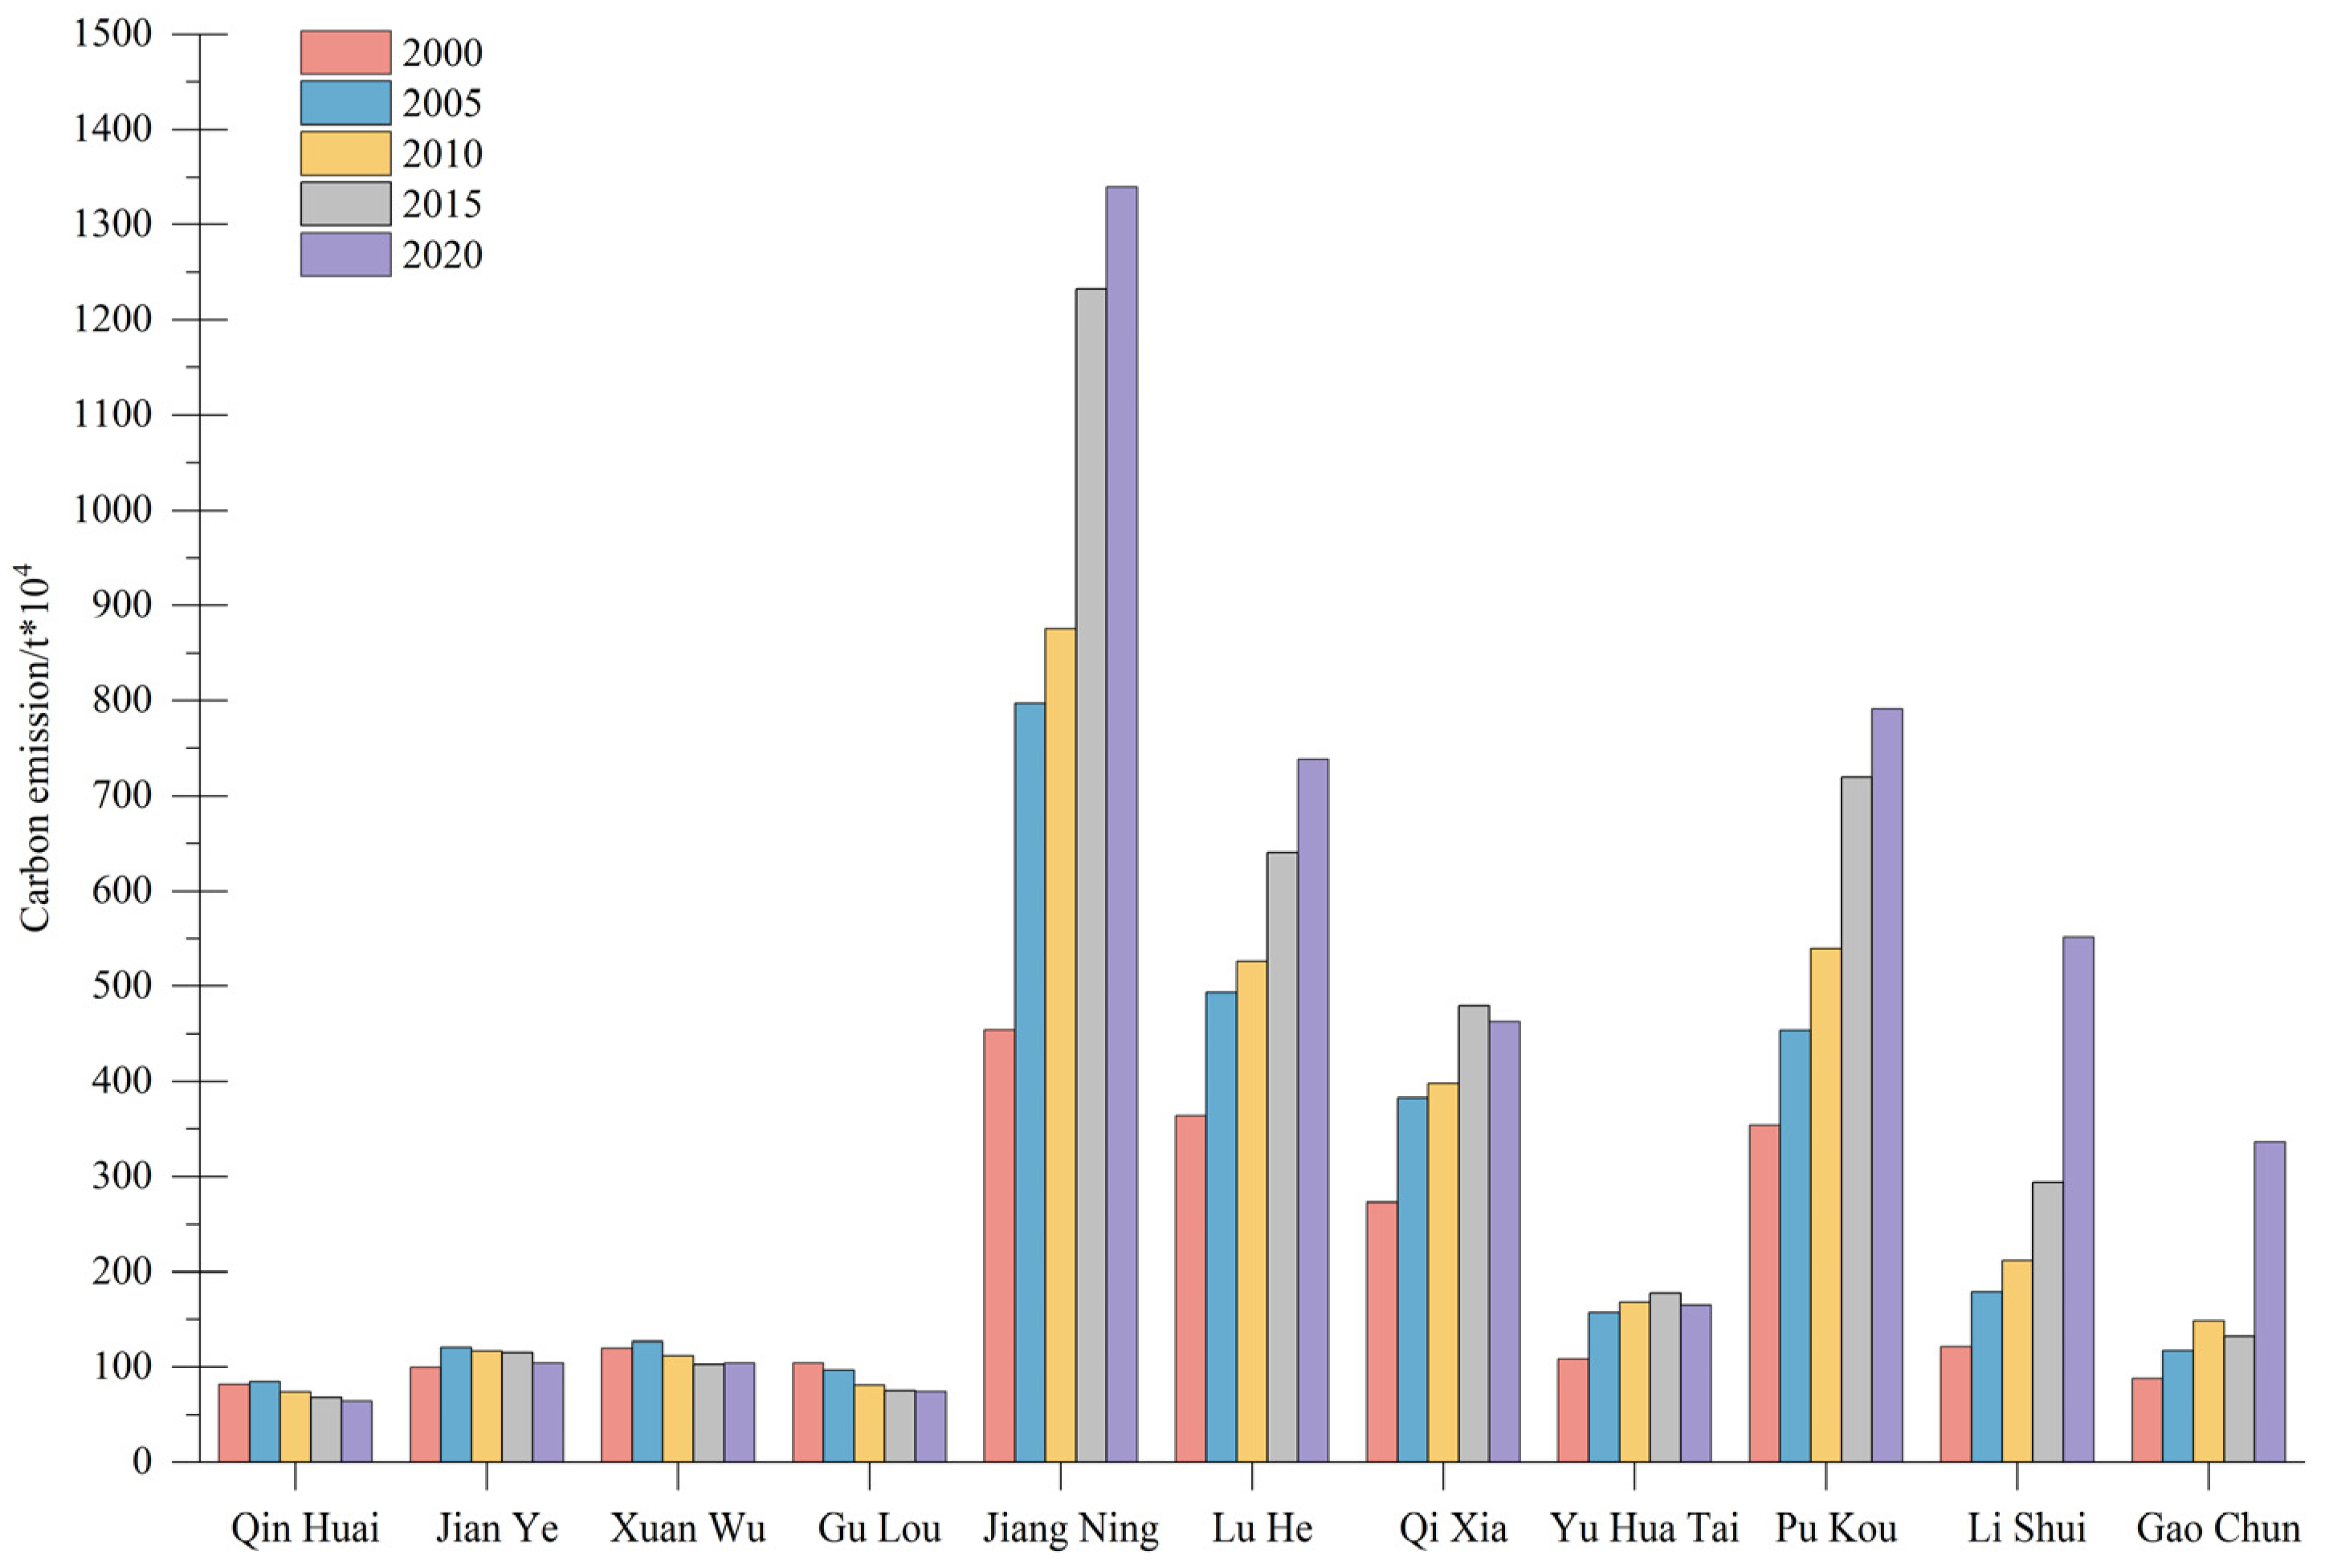
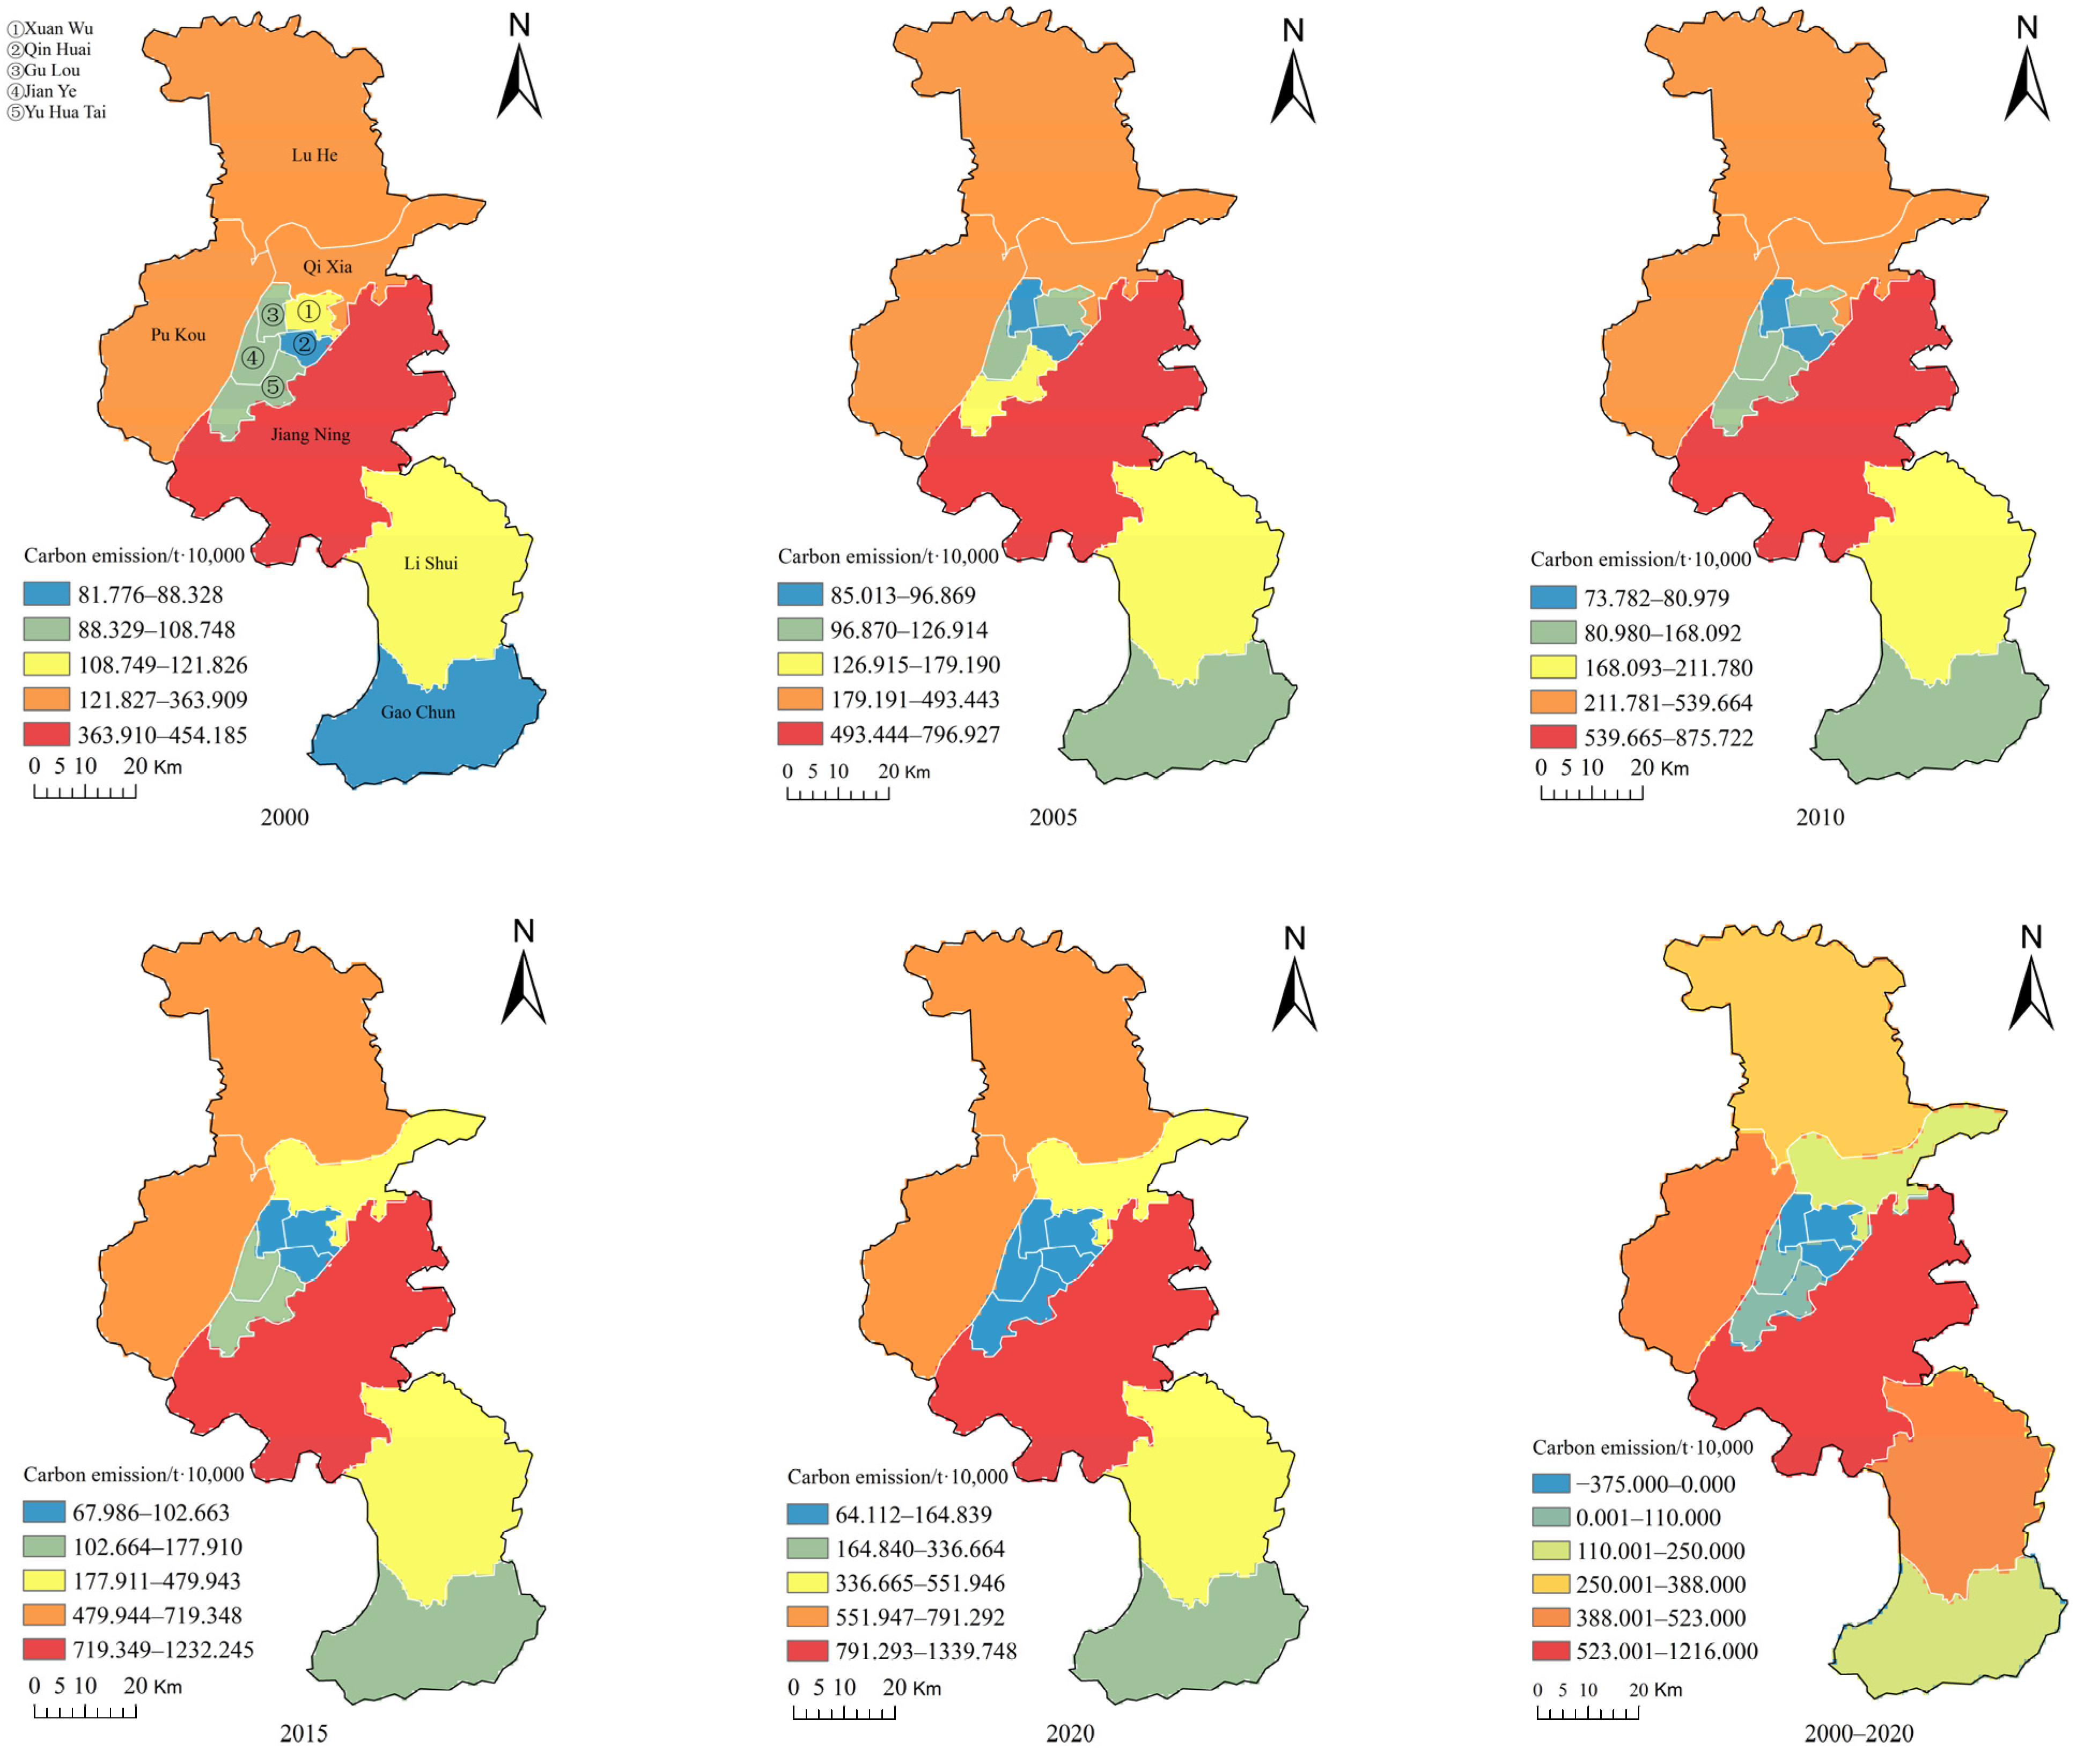
An analysis of carbon emissions in Nanjing during the period of 2000−2020 at the municipal scale reveals a clear stage-by-stage evolution at the municipal level (Figure 14). This study’s findings indicate a substantial increase in total carbon emissions, from 21.568 million tons to 47.232 million tons, representing a cumulative growth of 118.9% and an average annual growth rate of 4.0%. A thorough examination of its evolutionary trajectory reveals three distinct development phases, each with substantial disparities. The initial phase, spanning from 2000 to 2007, exhibited a rapid growth rate of 5.6% per annum, including an exceptional surge of 17.8% in 2003. This was followed by a period of adjustment, from 2007 to 2015, during which the annual growth rate averaged 3.2%, accompanied by a notable decline of 10.4% in 2012. Variability and stabilization in the increase in carbon emissions were characteristics of the next phase, which lasted from 2015 to 2020 and had an average annual growth rate of 3.9%. In contrast, unusually high levels were noted in 2020 and 2018. At the district scale, the spatial differentiation of carbon emissions is characterized significantly (Figure 15). The districts of Qin Huai and Gu Lou are distinguished by lower emission levels, whereas Jiang Ning, Pu Kou, and Lu He are classified as the core area with the highest emissions. According to the time series evolution, the growth rate of emissions decreased in most counties and districts between 2000 and 2020. In particular, there was a steady decline in emissions in the districts of Qin Huai, Xuan Wu, and Gu Lou. However, beginning in 2015, the districts of Jian Ye, Qi Xia, and Yu Hua Tai showed an inflection point in their emissions. In 2020, there was a notable rise in emissions in the districts of Li Shui and Gao Chun. Upon closer examination of the spatial pattern (Figure 4), it is evident that Nanjing’s carbon emissions exhibit a “core–periphery” circle structure. The central urban areas (Qin Huai, Jian Ye, Gu Lou, Xuan Wu, and Yu Hua Tai) form a core area with low carbon emissions, while the peripheral areas (Jiang Ning, Qi Xia, Pu Kou, and Lu He) form a ring belt with high emissions. The emission intensity of Jiang Ning and its northern regions was substantially higher than that of Li Shui and Gao Chun in the south, and the spatial distribution simultaneously revealed regional disparities of high in the north and low in the south.

3.3. Spatial and Temporal Evolution of Urban Green Space Patterns

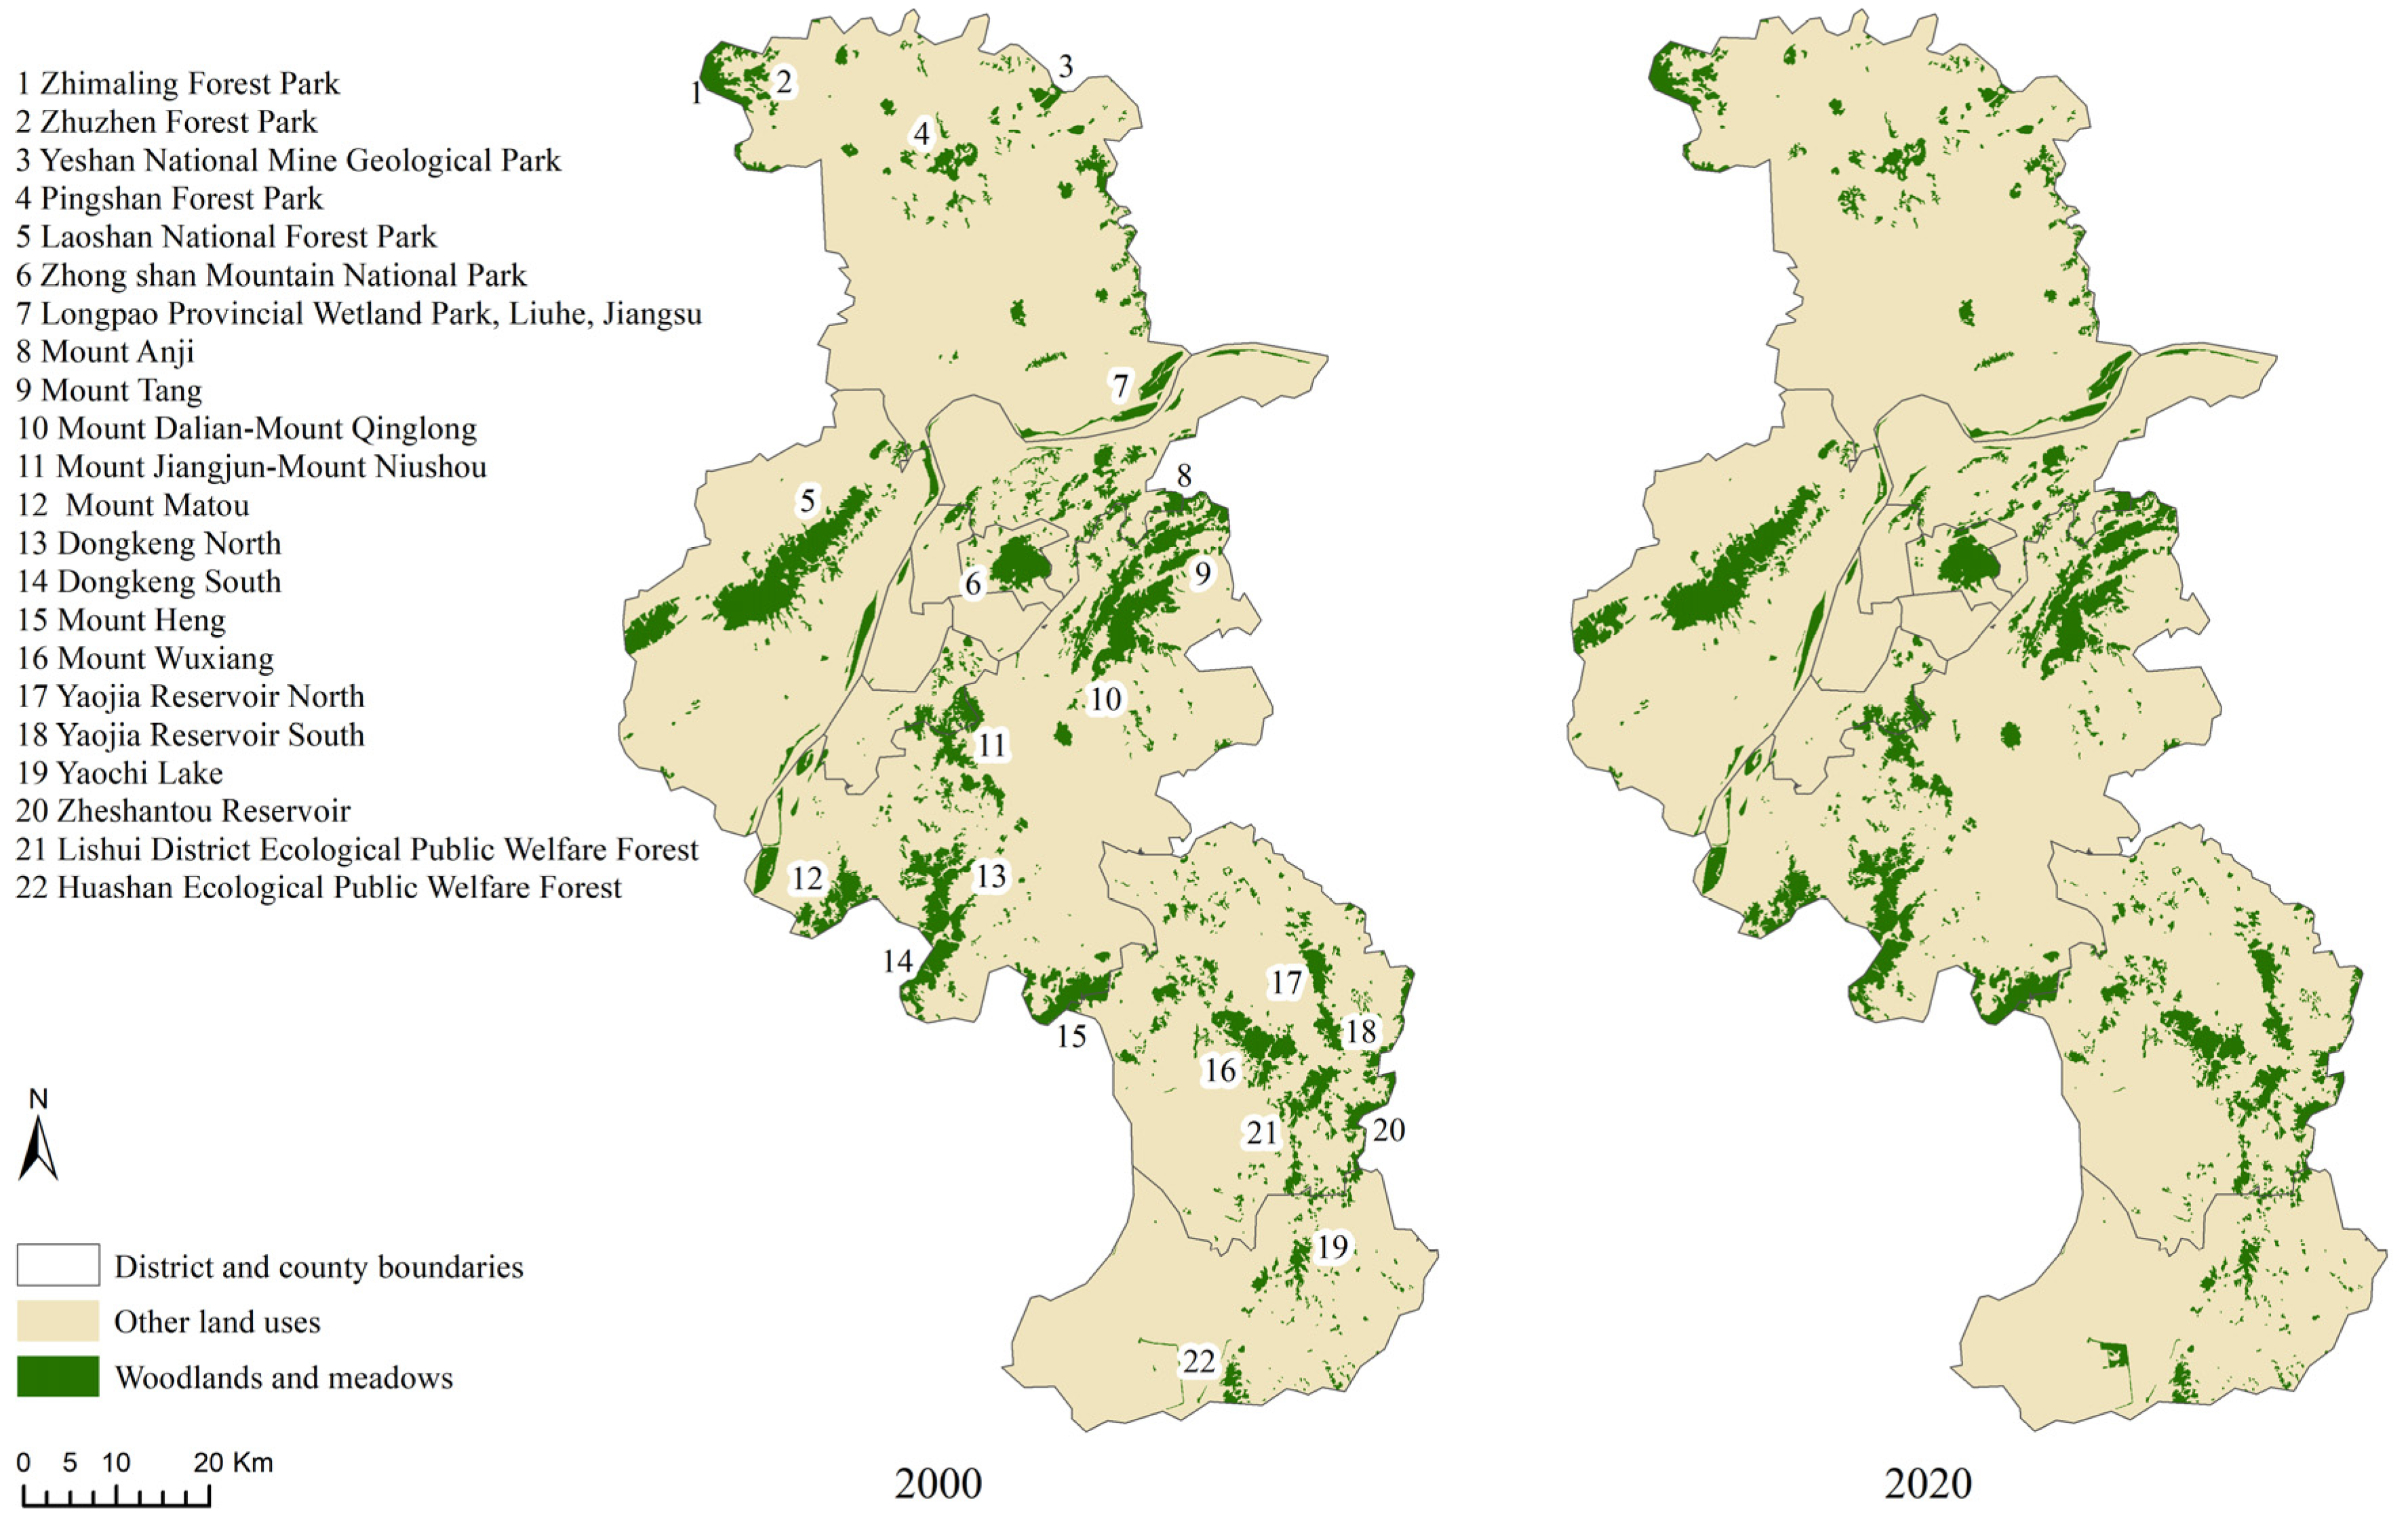
During the study period, the scale of urban green space in Nanjing demonstrated a conspicuous stage-by-stage reduction (Table 6). The total area of green space underwent a substantial decrease of 4.84% from 2000 to 2010, after which the rate of reduction experienced a notable decline. Among these elements, the transition of the woodland component, as the primary element of the green space system, was highly consistent with the prevailing trend, resulting in a 4.98% synchronous drop. The grassland area fluctuated less, declining by 9.43% between 2000 and 2015, then recovering with an average annual growth rate of 1.34% after 2015. Overall, the rapid urbanization process is inextricably connected to the continuous reduction in urban green space. The gradual invasion of the green space system has been caused by the increase in construction land, which has been attributed to urban population growth and economic development. The central Nanjing region has experienced the most loss of green space between 2000 and 2020, according the spatial study (Figure 16). While the boundaries of large-scale green spaces are becoming more regular, small pockets of green space are disappearing; for example, in Figure 16, the fragmented green space in the central area of Nanjing, the northern part of Zhongshan, and the southwest of Anji Mountain has decreased significantly, and the same is true for other large green space patches. This spatial pattern, which also illustrates the gradual impacts of urban growth on the green space system, is a direct reflection of the expansion of land use and the regulation of urban planning.
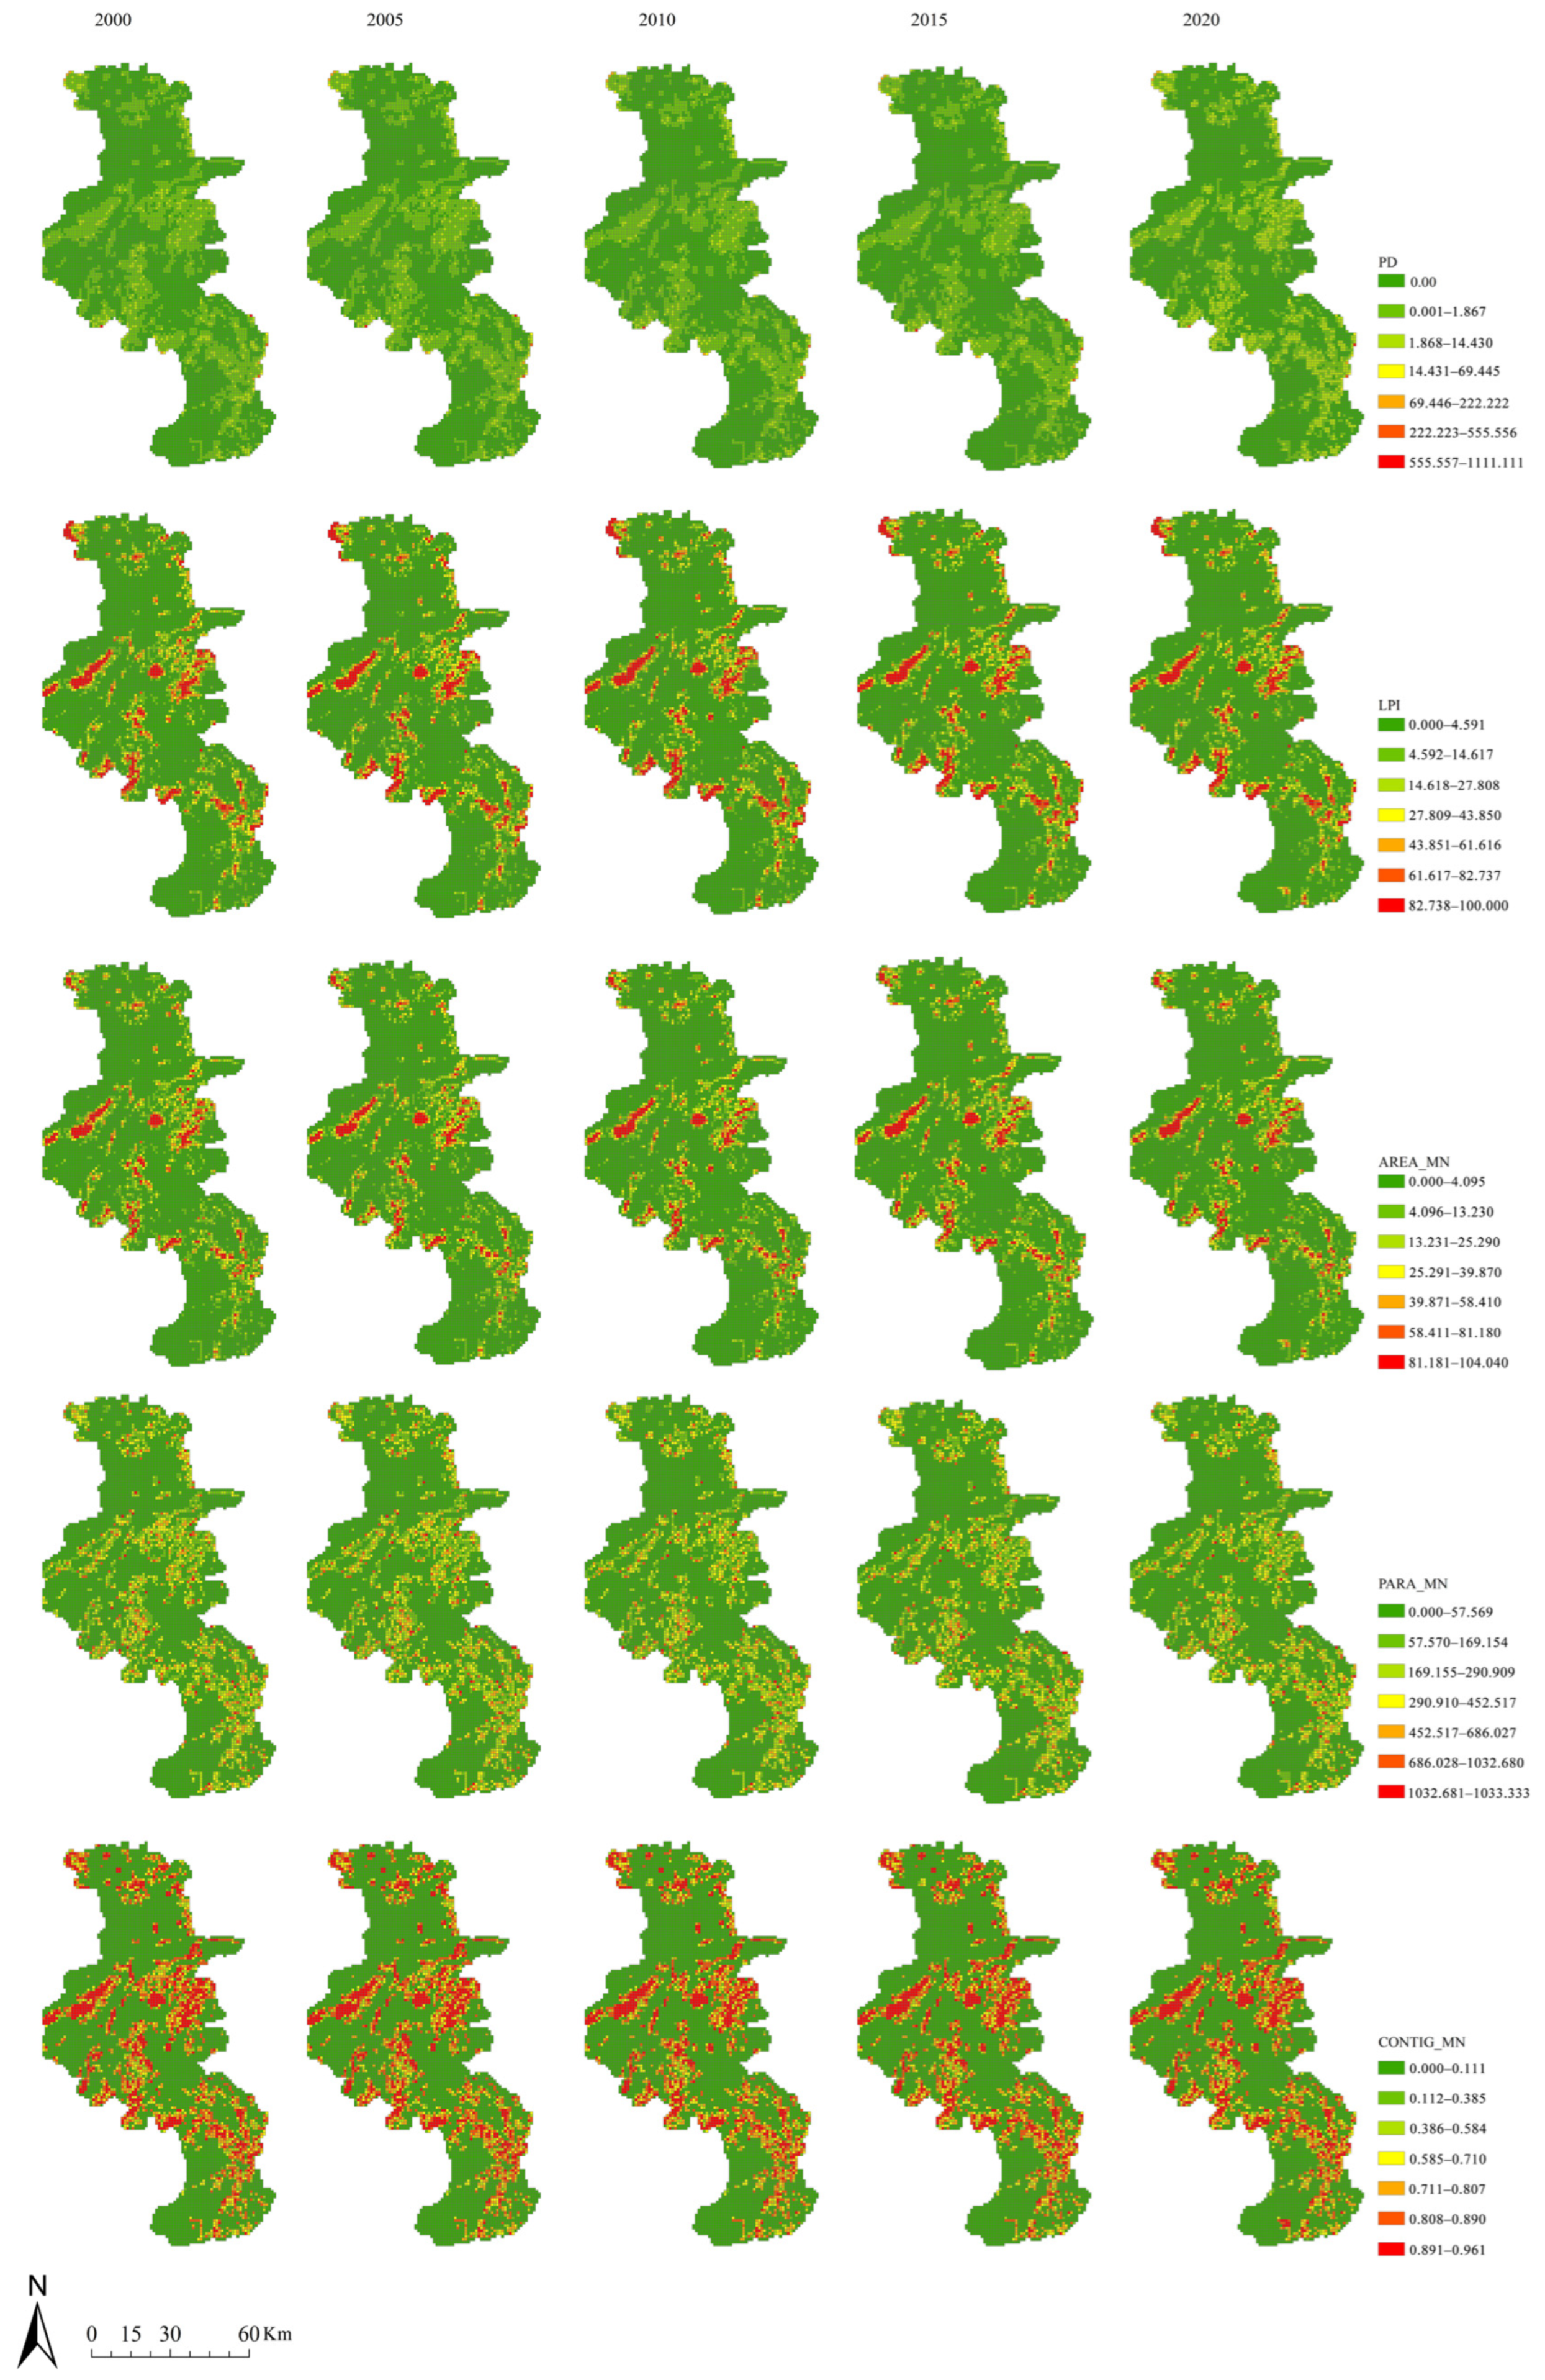
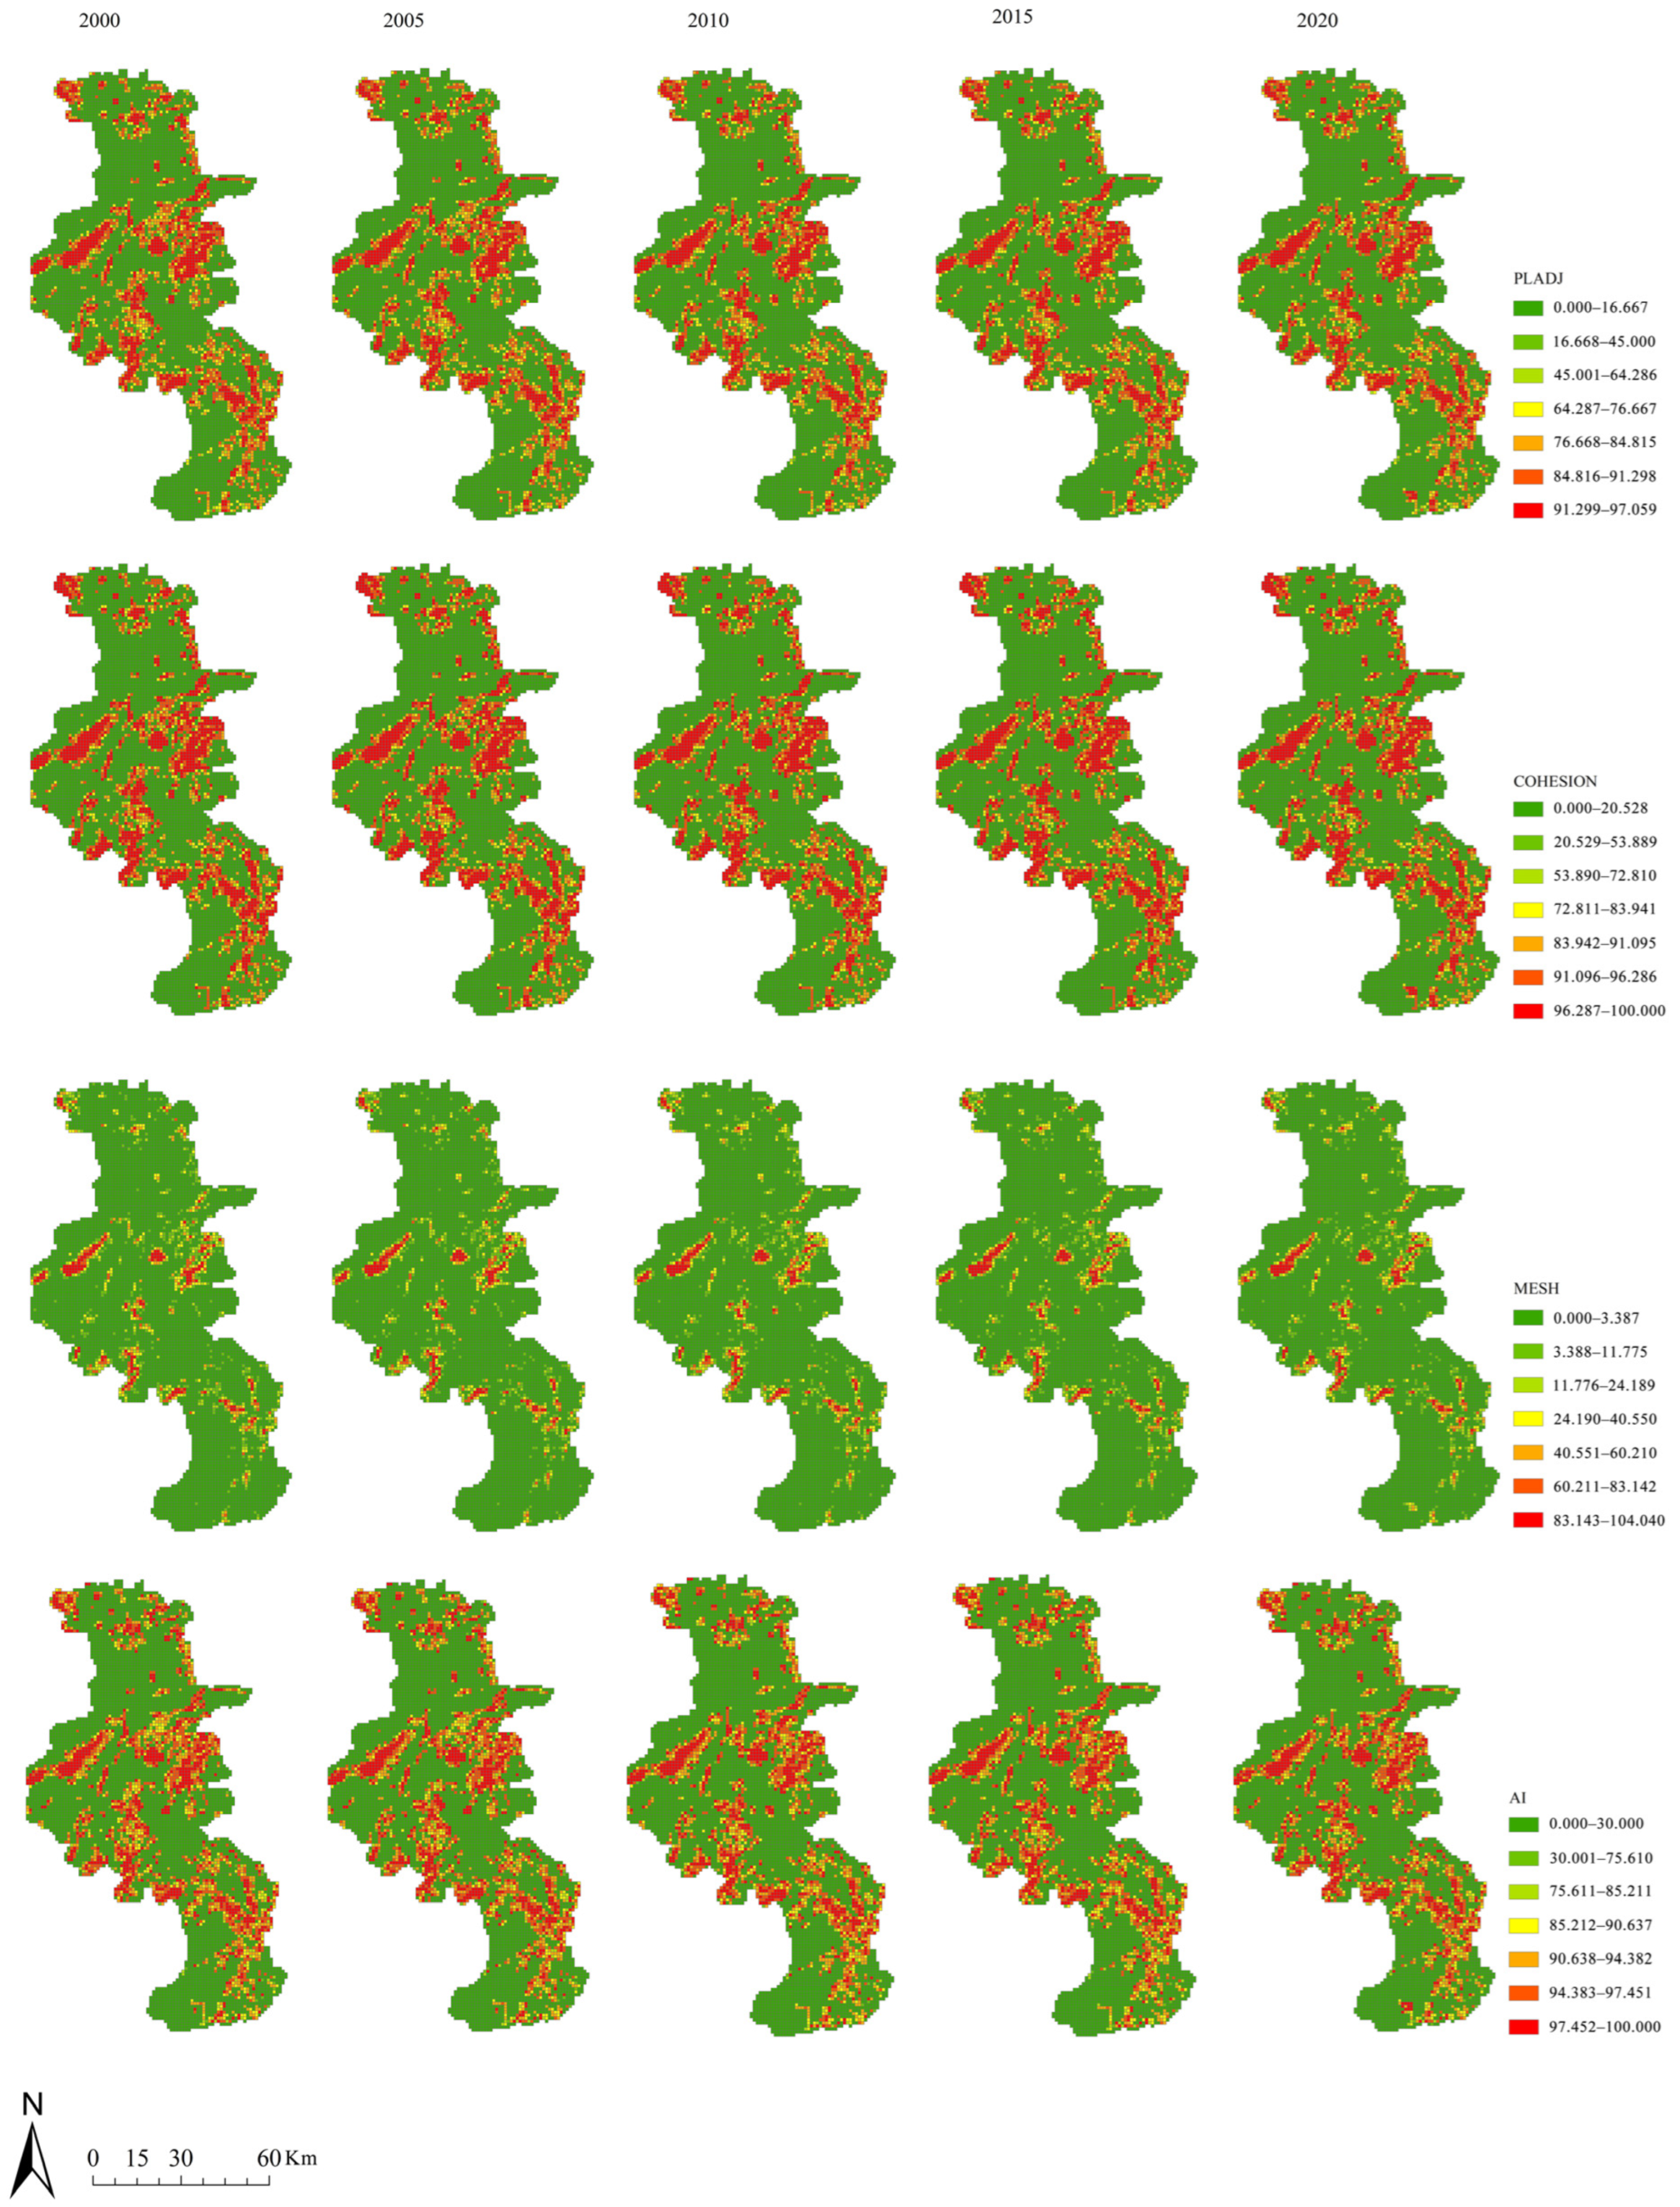
Figure 17 and Figure 18 show the change in the landscape index of Nanjing’s urban green space pattern from 2000 to 2020. Because the original landscape index value range is small, it is difficult to visually identify its change trend in the distribution chart in Figure 18, so the data are transformed into a line graph in Figure 17 for visualization and expression, thereby improving the recognizability of the time-order change. In Figure 17a, from 2010 to 2015, the decline rate of PD slowed down significantly, which was closely related to a series of ecological protection policies implemented during the same period, such as the Nanjing Urban Master Plan (2011−2020), the Nanjing Ecological Green Space Protection Plan (2012−2020), and the Nanjing Ecological Civilization Construction Plan (2013−2020). Measures such as standardizing land approval have effectively slowed down the loss of green space. After 2015, the increase in patch density was accompanied by a decrease in the total area and average area (Table 6, Figure 17c), indicating that the green space system showed obvious fragmentation characteristics, and the original continuous green space was divided into multiple small patches, reflecting the continuous impact of urbanization on the green space system [54].
The growth rate of LPI decelerated, following a period of accelerated growth from 2000 to 2010 (Figure 17b). This finding suggests that, despite the contraction of the total area of regional green space, the substantial ecological patches centered on Lao Shan (Figure 16. 5), Zhong Shan (Figure 16. 6), Mount An Ji-Mount Tang-Mount Da Lian-Mount Qing Long (Figure 16. 8-9-10), Mount Niu Shou (Figure 16. 11), Mount Ma Tou (Figure 16. 12), Dong Keng North and Dong Keng South (Figure 16. 13-14), Mount Heng (Figure 16. 15), and Mount Wu Xiang (Figure 16. 16) maintain their dominant position in the landscape (Figure 16). These patches form the skeletal structure of the green space system, which plays a critical role in ensuring the functionality of the city’s ecosystem services.
From 2000 to 2015, according to Figure 17c and Table 6, the AREA_MN increased, although the total area decreased steadily. This shift can be ascribed to the government’s activities aimed at increasing the efficiency of urban green space distribution by combining many smaller, dispersed green space areas into bigger, consolidated green space patches. However, this process would necessitate the encroachment or restructuring of some green spaces, resulting in a decrease in the total green space area. Following 2015, due to rapid urban expansion and intensification of human–land conflicts, the original green space has been gradually occupied, thus leading to a downward trend in both the average patch area and the total area. Furthermore, an antithetical relationship is exhibited by the trends of PARA_MN and CONTIG_MN (Figure 17d,e), and the change process is characterized by complexity and tortuousness. However, a general decrease in the average patch perimeter area ratio was observed in 2020 compared to 2000, while the average patch connectivity exhibited an increase. This suggests that the degree of landscape fragmentation has been mitigated, and ecological function has been enhanced. Concurrently, these findings also signify that endeavors aimed at ecological restoration and reconstruction have yielded notable outcomes. The observed increase in PLADJ and AI supports the improvement in aggregation and continuity among green space patches (Figure 17f,i). A considerable amount of the urban green space pattern’s stability is reflected in COHESION’s low numerical fluctuations during the course of the study (Figure 17g). Conversely, in Figure 17h, the observed rise in MESH indicates that the green space landscape has benefited from development operations, and that the urban green space layout has been optimized.

3.4. Correlation Analysis Between Urban Green Space Form Factors and Carbon Emissions

This study is predicated on a comprehensive array of multi-source data concerning Nanjing from 2000 to 2020. Employing a meticulous 1 km × 1 km grid sampling method, this study systematically analyzed the influence mechanism of urban green space landscape patterns on carbon emissions. This study’s methodology was further augmented by the integration of ArcGIS 10.8 spatial analysis and the geo-detector model. In Table 7, the statistical test results demonstrated that the explanatory power of each morphological factor attained a significant level (p < 0.01). In this regard, the q-value of LPI, COHESION, and AI exceeded 0.5, thereby identifying the core landscape factors that significantly influence carbon emission. Pearson’s correlation analysis (Table 8) further quantified the characteristics of the relationship between green space morphology and carbon emissions, and the results showed that carbon emissions showed significant associations with TA, LPI, AREA_MN, and PLADJ.
In particular, the dominance of green space as defined by LPI is significantly correlated negatively with carbon emissions, and large-scale continuous vegetation patches enhance the ecosystem’s capacity to absorb carbon through efficient photosynthesis and decreased marginal effects. This supports the correlation analysis’s negative correlation results between LPI and AREA_MN and jointly validates the carbon sequestration benefit of large-scale continuous green patches. Although the landscape connectivity reflected by COHESION does not reach the statistically significant level, its negative coefficient suggests that the improvement of the green space ecological corridor network may indirectly enhance the regional carbon sequestration function by reducing the degree of habitat fragmentation. Studies have shown that habitat network connectivity is positively correlated with carbon sequestration benefits [34], because it can effectively integrate ecological resources and improve the overall carbon sequestration efficiency of ecosystems.
TA, PLADJ, and AI all significantly positively correlate with carbon emissions, indicating the intricacy of the role that urban green spaces play in sequestering carbon and the impact that human activity has on it. The embodied carbon emissions produced during the building and maintenance life cycle of green spaces, including energy-intensive operations like vegetation cultivation, irrigation systems’ operation, and mechanized maintenance, are the cause of the positive correlation between TA and carbon emissions. These human interventions greatly outweigh the carbon sequestration benefits of green space itself [38]. The positive correlation of PLADJ indicates the critical effect of spatial configuration. Theoretically, high neighborhood patches can improve ecological connection, but in reality, they are primarily found in the central region of metropolitan built-up areas. These areas are continuously exposed to composite stresses, including traffic pollution emissions, thermal radiation from the firm subsurface, and human activity, which leads to a decrease in photosynthetic efficiency and enhancement of soil respiration in vegetation. Additionally, it also brings some problems like a decrease in photosynthesis efficiency and increase in soil respiration, resulting in an inhibition of the expected enhancement of the carbon sink function [55]. The positive correlation between artificial intelligence (AI) and carbon emissions reflects an ecological paradox concerning urban landscape patterns. Although high agglomeration is theoretically conducive to the ecological connectivity of green spaces, in reality such patterns overlap with high-intensity built-up areas. The process of vegetation canopy fragmentation and edge effects, induced by building intensification, has the potential to induce substantial alterations to the local microclimate. These alterations are characterized by an increase in nighttime heat retention and a decrease in air mobility, consequently leading to a weakening of the photosynthetic carbon sequestration efficiency of vegetation and an exacerbation of soil respiratory carbon emissions [33]. This phenomenon suggests that the pursuit of green space aggregation in isolation may be counterproductive due to its spatial coupling with urban development intensity. To optimize landscape configuration patterns and achieve a balance between ecological benefits and human interference, further research is necessary.

4. Discussion

4.1. Estimation of Urban Carbon Emissions

Urban carbon emission estimates have progressed from static accounting to dynamic modeling. Because of its distinct advantages in small-sample data processing and nonlinear relationship modeling, the gray BP neural network, a hybrid model that combines gray system theory and artificial neural networks, has been successfully applied in a variety of fields, including automation control and electric power load prediction. In recent years, the technique has been steadily integrated into the field of environmental science, with particular promise in land use change and carbon emission prediction for energy use. Traditional methods, such as the IPCC-recommended top-down inventory methodologies (e.g., Zhang et al., 2023) [56], are simple, but they have limited geographical resolution and temporal lag, making it difficult to capture rapid urbanization dynamics. Bottom-up techniques (e.g., Deng et al., 2023) [57] have significant data collecting costs and restricted coverage, especially at micro-scales. The gray BP neural network, a hybrid model that combines gray system theory and artificial neural networks, fills some gaps and makes operations easier by using its unique capacity to analyze small-sample data and simulate nonlinear relationships. In contrast to prevalent ecological models (e.g., CASA utilized by Zhang et al. 2023 for forest carbon sinks) [58], the gray BP neural network dynamically combines human activity intensity and natural carbon cycles. This synergy addresses a fundamental shortcoming in pure ecological models such as CASA, which ignores anthropogenic influences, while surpassing the GM (1,1) model in accuracy—particularly at inflection points—and is marginally stronger than XG-Boost and LSTM in overall performance. At district/county scales, the study introduces a novel downscaling technique for nighttime lighting data, resolving grassroots data scarcity issues that plague inventory-based studies (e.g., Deng et al., 2023’s reliance on aggregated statistics) [57]. Geographic superposition analysis with land use data allows for precise direct/indirect emission classification at the micro-scale, which is not possible with IPCC-tiered approaches or geographic allocation based on POI density.
The approach of this study has advantages over the list-based “top-down” and model-based “bottom-up” approaches, mainly because it dynamically integrates the intensity of human activity and the natural carbon cycle. The gray BP neural network’s socioeconomic module compensates for the shortcomings of the pure ecological model, which fails to account for anthropogenic factors, whereas nighttime lighting data provides spatially detailed information that traditional statistics cannot. Of course, there is still room to improve the method’s sensitivity to small and scattered emission sources. This can be done in the future by integrating high-resolution remote sensing data with real-time monitoring via the Internet of Things (IoT). This multi-source data fusion and multi-scale nested accounting methodology pave the way for more accurate monitoring and dynamic assessment of urban carbon emissions.

4.2. Spatio-Temporal Characteristics of Carbon Emissions in Nanjing

The spatial and temporal distribution characteristics of carbon emissions in Nanjing, with differences between districts and counties, show a significant response relationship with the local government’s macro-control measures, such as industrial layout adjustment and environmental protection policies.
The spatial and temporal evolution of carbon emissions in Nanjing reveals the interaction between urbanization and policy regulation. At the municipal level, there is a considerable phase difference in carbon emissions between 2000 and 2020: The period from 2000 to 2007 saw a tremendous increase, highlighted by an exceptional peak in 2003. This phenomenon is due to the execution of Jiangsu Province’s “accelerated development strategy along the Yangtze River”, which prioritized the advancement of industrial projects and related efforts. During this time, the city of Nanjing placed a strong emphasis on promoting industrial agglomeration, particularly the Nanjing Chemical Industry Park, which has been classified as a National Park. This initiative has resulted in a substantial increase in energy consumption. The “State Council’s Decision on Accelerating the Cultivation and Development of Strategic and Emerging Industries” and the “Industrial Transformation and Upgrading Plan (2011−2015)” were directly linked to the growth rate’s fall from 2007 to 2015. Based on these facts, it appears that the industrial structural adjustment program was starting to work. The growth rate was expected to climb by 20% between 2015 and 2020. From 2015 to 2020, the average annual carbon emission growth rate rebounded slightly but fluctuated due to air pollution mitigation efforts and a greater promotion of ecological civilization. The increased carbon emissions values found in 2018 and 2020 are consistent with the widely accepted assumption that carbon emissions in developing districts fluctuate during the industrialization process in response to economic volatility.
At the district level, spatial heterogeneity reflects differences in regional development policies and industrial layout. The Jiang Ning, Pu Kou, and Lu He districts create a high-emission ring, which corresponds to their categorization as advanced industrial bases under the Nanjing Urban Master Plan (2011−2020). The continuous rapid expansion of the Jiang Ning Development Zone has resulted in a large increase in energy demand, while the city center is rapidly developing, particularly in the areas of modern service and high-tech businesses. The increase in carbon emissions in Li Shui District and Gao Chun District in 2020 was directly related to the spatial strategy of “southern expansion and northern extension” in the development plan of the Nanjing metropolitan area, as well as the gradual development of the Southern Nanjing Economic Demonstration Zone. This echoes the findings of Tong Wenlu et al. on the spatiotemporal dynamics of carbon emissions in Jiangsu Province [59], indicating that planners need to be vigilant about the possibility that peripheral areas may become new emission growth poles. Compared with the study on carbon emissions in county-level regions of Jiangsu Province (Tong et al., 2023) [59], this study found that the “high-emission ring zone” in the industrial areas of Nanjing (Jiang Ning, Pu Kou, and Lu He) aligns with the “industry-dominated emission” model proposed in the related study. However, the central urban areas (Qin Huai, Jian Ye, Gu Lou, Xuan Wu, and Yu Hua Tai) achieved significantly better emission reduction outcomes through industrial transformation compared to Suzhou during the same period (Deng et al., 2023) [57]—the latter still adopts a strategy of prioritizing the governance of regions with higher carbon emissions. This comparison highlights the role of Nanjing’s urban planning policies in promoting low-carbon transformation.

4.3. The Impact of Urban Green Space Patterns on Carbon Emissions

This study is based on an integrated theoretical framework of urban metabolism and ecosystem services, which, combined, provide a comprehensive approach to understanding the complicated relationships between urban green space patterns and carbon emissions. Urban metabolism theory views the city as a dynamic system of energy and material flows [39], with green space serving as a critical node in regulating spatial-scale carbon flux and emissions. Meanwhile ecosystem service theory focuses on the core regulatory service efficiency provided by green space through carbon sequestration functions [35,36]. In this investigation, LPI was discovered to be strongly negatively linked with carbon emissions, validating the “carbon sequestration advantage of large continuous vegetation patches” claimed by Liu et al. (2024) [5]. Large continuous patches considerably improved the capability of carbon sink regulation services due to higher photosynthetic efficiency and reduced edge effects [36]. At the same time, the positive correlation between TA and carbon emissions reveals the ecological services paradox: despite the carbon sequestration services provided by green spaces, their construction and maintenance processes (irrigation, mechanical maintenance) generate large amounts of implied carbon emissions [38,40,60], demonstrating that net carbon benefits are dependent on the balance of natural processes and anthropogenic inputs.
Spatial configuration indicators reveal more complicated metabolic linkages, and the positive relationship between AI and carbon emissions reflects the “spatial dislocation” phenomena. In theory, high agglomeration increases ecological connectedness [34], but according to the metabolic theory of urban regeneration, such places tend to overlap spatially with densely populated areas [39]. This overlap has led to a number of negative effects: first, the enhancement of heat islands due to microclimatic changes triggered by building densification, which weakens the efficiency of photosynthetic carbon sequestration by vegetation [42]; second, the exacerbation of soil respiration carbon emissions due to traffic pollution and human activities [33]; and, third, the energy-intensive maintenance of manmade greenspaces that can counteract the gains in carbon sinks [38]. This finding modifies Yuan et al.’s (2024) [33] conclusion based on a morphology optimization model, proposes a new principle that the green space layout should avoid the core area of the heat island, and highlights some of the factors to consider when designing an urban green space system. For Nanjing, the “decreasing quantity and increasing quality” of the green space system contrasts with the “increasing fragmentation” of coastal urban agglomerations (Fan et al., 2024) [3]. This suggests that protecting and optimizing core ecological patches such as Zhongshan and Laoshan is critical to maintaining regional carbon sink capacity; however, the carbon cost–benefit ratio of high-density artificial green space in urban areas should be reconsidered. The positive connection between PLADJ and carbon emissions, the high q-value association between AI and carbon emissions, and the positive relationship between PLADJ and AI all contribute to the paradox of ecosystem service efficacy in highly artificial green environments. According to ecosystem service theory, the great regularity exhibited by PLADJ (for example, neat green belts, park boundaries) is frequently coupled with a high degree of artificial planning and administration. Combined with the theory of urban regeneration metabolism, this kind of highly regular and aggregated green space, especially in the core area of built-up areas, tends to be embedded in the high-intensity urban material energy flow. This exacerbates the previously described suppression of the photosynthetic efficiency of vegetation by the heat island effect, and it means that its maintenance processes require continuous inputs of exogenous energy and resources, leading to significant implied carbon emissions. This essentially reflects the dependence of highly artificial green spaces on urban material metabolism and their potential offsetting effect on carbon sink ecosystem services. It was also found that, while COHESION did not approach statistical significance, its negative coefficient indicated that the regional carbon sink’s function might be indirectly improved by reducing habitat fragmentation to increase the quality of the ecological corridor network. As confirmed by the study, ecological network connectivity is positively correlated with carbon sink benefits [34].
In terms of policy implementation, the findings of this study have significant implications for the establishment of an urban green space system. First, large natural vegetation patches with significant carbon sink advantages should be protected and spatially optimized. Second, in densely populated regions, the overall benefits of high-density artificial green spaces must be carefully assessed, and low-maintenance native plant arrangements should be explored. Furthermore, by building a multi-level ecological corridor network, scattered green space resources can be efficiently connected, resulting in increased total carbon sink efficiency. It is worth emphasizing that the carbon regulatory effect of green space patterns is clearly scale-dependent, and future research should incorporate finer vegetation index data to thoroughly investigate the mechanism of action at various geographical scales. These findings provide a scientific foundation for developing varied carbon-neutral development plans for urban green areas, particularly in terms of balancing ecological conservation with urban development in the context of growing urbanization.

4.4. Planning Strategies

Carbon emissions in Nanjing follow specific geographical patterns, demanding specialized solutions to reduce emissions and improve urban green spaces. The reduction in carbon emissions in core metropolitan regions such as Qin Huai, Gu Lou, Jian Ye, Xuan Wu, and Yu Hua Tai is the result of the ongoing transition to modern service and high-tech industries. To expedite this trend, these regions should prioritize industrial structure optimization by promoting low-carbon sectors and green technologies. Given the limited capacity for growing green areas, the emphasis should be on improving the quality of existing green spaces. Introducing native, low-maintenance vegetation and vertical greening systems can increase carbon sequestration while reducing maintenance emissions. Furthermore, improving connectivity between fragmented green areas via ecological corridors can boost carbon sink efficiency and reduce the urban heat island effect, which is especially evident in densely urbanized regions.
In contrast, peripheral high-emission zones like Jiang Ning, Pu Kou, and Lu He confront substantial issues due to their industrial dominance and high energy consumption. Stricter emission rules, the use of renewable energy, and the promotion of circular economy principles are all crucial to reducing carbon emissions in these locations. To maximize the carbon sink potential of green space, vast continuous green zones such as Lao Shan and Zhong Shan should be protected and expanded as a top priority. Mixed use of land can also play an important role in lowering transportation-related emissions by reducing the demand for long-distance travel. The southern expansion areas, including Li Shui and Gao Chun, are emerging development zones where eco-friendly urbanization strategies can be used from the start. To combine development with ecological sustainability, low-carbon infrastructure such as green buildings and renewable energy systems must be implemented, as well as a multi-level green space network with interconnected patches and corridors. To integrate green space planning with larger carbon reduction goals, a comprehensive approach is required at the municipal scale. Planning green spaces with carbon sink benefits that prioritize natural vegetation over high-maintenance artificial landscapes has the potential to dramatically cut overall emissions. Furthermore, integrating these techniques with existing policies, such as the “dual-carbon” aim and ecological civilization programs, will enable a consistent and successful implementation throughout Nanjing.

4.5. Limitations and Improvements

Despite the insights provided by this study, several limitations must be addressed to guide future research and practical applications. First, the core limitation lies in the challenge of causal inference. The positive and negative correlations between urban green space landscape indices and carbon emissions revealed in this study mainly reflect statistical associations rather than definitive causal relationships. Observational data-driven research approaches are susceptible to endogeneity concerns (such as omitted variable bias), limiting our ability to directly infer potential causal mechanisms between the two. For example, the observed positive correlation between agglomeration index and carbon emissions may be partly due to uncontrolled confounding factors. High-density green spaces (such as huge parks) are frequently found in specific metropolitan regions (such as suburbs, fringe areas, or planned new districts). These areas may have specific land use characteristics (such as low-density residential areas, increased transportation corridors, or infrastructure), or they may be concentrated with energy-intensive activities (such as lighted sports fields, amusement parks, maintenance equipment warehouses, large parking lots, and supporting commercial facilities within or around the park). Furthermore, macro-level factors driving the planning and layout of urban green spaces (particularly large-scale concentrated green spaces), such as specific urban development strategies, ecological city objectives, large-scale event infrastructure, and the development of specific functional zones, may influence the region’s energy consumption patterns and carbon emissions levels at the same time, constituting potential confounding factors. Although the analysis attempted to include key control variables (such as population density, economic development level, and primary land use types), it is impossible to completely rule out the impact of these unobserved complex spatial processes or macro-level factors on the results.
Although the gray BP neural network model performs well in small-sample predictions, its applicability in other regions has yet to be demonstrated. To increase its applicability, the model must be evaluated in a variety of urban situations. Although 1 km × 1 km grid analysis is appropriate for macro-level assessment, it may overlook micro-scale variations in carbon emissions and green space patterns, ignoring local dynamics. Data restrictions also provide difficulties. While adding nighttime light data to the estimation process is viable, it may not catch all small or dispersed emission sources. Future studies could improve their accuracy by combining high-resolution remote sensing with IoT-based real-time monitoring systems. Similarly, improving vegetation carbon sink estimations using advanced indices such as NDVI may provide a more detailed understanding of plant-specific carbon sequestration capacity.
At the practical level, this study emphasizes the complexities of urban ecosystems. The paradoxical relationship between green space aggregation and emissions is especially striking: while high aggregation theoretically promotes ecological connectivity, it frequently overlaps with high-density built-up areas, and microclimate changes and human intervention may actually reduce carbon sequestration benefits. Addressing this issue demands creative planning solutions that strike a balance between environmental benefits and urban development pressures.
In the future, research should be expanded in the following areas: First, multi-scale research should be looked into, particularly at the community level, to uncover more specific links between carbon emissions and green space patterns. Then, causal mechanism research should be strengthened using more rigorous research designs, such as leveraging “natural experiments” before and after the construction of large-scale green space projects, collecting long-term panel data for dynamic analysis, or applying advanced causal inference methods to better control for endogeneity and confounding factors, thus more accurately assessing causal effects. Additionally, integrating dynamic modeling with scenario analysis is essential. Dynamic modeling that integrates real-time climate and human activity data can further enhance predictive accuracy. Additionally, scenario analysis evaluating the effects of planning initiatives (such as green corridor building or industrial reforms) would provide significant evidence to decision-makers (to ensure that Nanjing and other cities achieve sustainable low-carbon growth).

5. Conclusions

Taking Nanjing as an example, this study constructed a multi-scale carbon emission estimation model by combining gray BP neural network and geo-detector methods and integrating spatial correlation analysis to systematically study the spatial–temporal evolution pattern of carbon emissions and urban green space patterns in Nanjing from 2000 to 2020. The main conclusions are as follows:
(1)
Socioeconomic factors (urbanization rate, secondary industry output, and energy intensity) dominated carbon emissions, collectively explaining 88.6% of variations. Meteorological factors had a negligible influence due to Nanjing’s stable climate and urban heat island effects. The gray BP neural network model achieved superior prediction accuracy (R2 = 0.9619, MAPE = 1.68%), outperforming XG-Boost and LSTM models.
(2)
Carbon emissions increased by 118.9% over two decades, exhibiting a “core–periphery” spatial pattern. Industrial districts (Jiang Ning, Pu Kou, Lu He) formed high-emission rings, while central urban areas (Qin Huai, Gu Lou) reduced emissions through industrial restructuring. Southern districts (Li Shui, Gao Chun) emerged as new emission hotspots post-2015 due to urban expansion policies.
(3)
Urban green space showed “quantity decrease but quality improvement”: total area declined by 4.84%, while connectivity (COHESION) and aggregation (AI) increased. A networked structure anchored by large ecological patches (e.g., Zhong Shan, Lao Shan) formed. LPI negatively correlated with emissions, confirming the carbon sequestration advantage of continuous green spaces, while TA and PLADJ showed positive correlations, revealing trade-offs between artificial green space maintenance and carbon costs.
(4)
Planning strategies were proposed: (a) Protect core ecological patches to enhance carbon sinks. (b) Optimize connectivity through ecological corridors in fragmented areas. (c) Implement low-carbon maintenance measures in high-density built-up zones. Future studies should integrate IoT and high-resolution remote sensing for micro-scale analysis.

Author Contributions

Conceptualization, Y.X., Y.S. and Y.Y.; methodology, Y.X., Y.S. and Y.Y.; software, Y.S. and Y.X.; validation, Y.X., Y.S. and Y.Y.; formal analysis, Y.X. and Y.Y.; investigation, Y.S.; resources, Y.X. and Y.Y.; data curation, Y.X. and Y.S.; writing—original draft preparation, Y.S.; writing—review and editing, Y.X., Y.S. and Y.Y.; visualization, Y.S.; supervision, Y.X. and Y.Y.; project administration, Y.X. and Y.Y.; funding acquisition, Y.X. and Y.Y. All authors have read and agreed to the published version of the manuscript.

Funding

This research was funded by the National Natural Science Foundation of China (Grant No. 32171859), the Humanities and Social Science Research Project of the Ministry of Education (Grant No. 21YJCZH187), the Qing Lan Project, and the Postgraduate Research and Practice Innovation Program of Jiangsu Province (Grant No. KYCX24_1334).

Institutional Review Board Statement

Not applicable.

Informed Consent Statement

Not applicable.

Data Availability Statement

The data used in this study can be requested from the authors.

Conflicts of Interest

The authors declare no conflicts of interest.

References

  1. Chen, J.; Li, X.; Li, Y.; Mu, C.; Xie, C.; Liu, Y.; Xie, T.; Jian, Y. Assessment of carbon sequestration capacity and carbon offsetting effect of arbors in urban green spaces. J. Chin. Urban For. 2024, 22, 26–33. [Google Scholar]
  2. Yang, Y.; Yu, C. Effects of vegetation spatial types on carbon neutrality performance of urban green space. J. Nanjing For. Univ. (Nat. Sci. Ed.) 2024, 48, 209–218. [Google Scholar]
  3. Fan, S.; Liu, H.; Wang, X.; He, W. Spatial-temporal correlation between green space landscape pattern and carbon emission in three major coastal urban agglomerations. Environ. Sci. 2024, 1–20. [Google Scholar] [CrossRef]
  4. Huang, J.; Song, P.; Liu, X.; Li, A.; Wang, X.; Liu, B.; Feng, Y. Carbon Sequestration and Landscape Influences in Urban Greenspace Coverage Variability: A High-Resolution Remote Sensing Study in Luohe, China. Forests 2024, 15, 17. [Google Scholar] [CrossRef]
  5. Liu, Y.; Fan, C.; Xue, D. A Review of the Effects of Urban and Green Space Forms on the Carbon Budget Using a Landscape Sustainability Framework. Sustainability 2024, 16, 29. [Google Scholar] [CrossRef]
  6. Wang, R.; Mo, X.; Ji, H.; Zhu, Z.; Wang, Y.; Bao, Z.; Li, T. Comparison of the CASA and InVEST models’ effects for estimating spatiotemporal differences in carbon storage of green spaces in megacities. Sci. Rep. 2024, 14, 13. [Google Scholar] [CrossRef] [PubMed]
  7. Hu, J.; Sha, Q.e.; Liu, H.; Zhang, X.; Zheng, J. Evolution characteristics and driving forces of carbon dioxide emissions and sinks in the Pearl River Delta Region, China. Environ. Sci. 2023, 44, 6643–6652. [Google Scholar] [CrossRef]
  8. Dong, Z.; Sun, S.; Xia, C.; Zhou, C.; Zhao, j.; Zhang, W. The effect of “ecological restoration and urban repair” strategy on urban carbon emission. Acta Ecol. Sin. 2024, 44, 6142–6153. [Google Scholar] [CrossRef]
  9. Liu, S.; Zhang, H. Research progress of the mechanism and approach of carbon sink in urban green space at multiple scales. Landsc. Archit. 2022, 29, 55–59. [Google Scholar] [CrossRef]
  10. Yang, F.; Yousefpour, R.; Hu, Y.; Zhang, Y.; Li, J.; Wang, H. Assessing the efficiency of urban blue-green space in carbon-saving: Take a high-density urban area in a cold region as an example. J. Clean. Prod. 2024, 479, 13. [Google Scholar] [CrossRef]
  11. Gao, S.; Tao, P.; Zhao, Z.; Dong, X.; Li, J.; Yao, P. Estimation and Differential Analysis of the Carbon Sink Service Radius of Urban Green Spaces in the Beijing Plain Area. Sustainability 2024, 16, 15. [Google Scholar] [CrossRef]
  12. Niu, T.; Liu, W. The trade-off between biodiversity and carbon sink of urban ecosystem under the carbon peaking and carbon neutrality strategy. Biodivers. Sci. 2022, 30, 205–210. [Google Scholar] [CrossRef]
  13. Liu, J.; Ren, Y.; Tao, H.; Liu, T.; Chen, H. The resonse of heatwave to carbon emission in China. China Environ. Sci. 2022, 42, 415–424. [Google Scholar] [CrossRef]
  14. Randazzo, N.; Michalak, A.; Desai, A. Synoptic Meteorology Explains Temperate Forest Carbon Uptake. J. Geophys. Res.-Biogeosci. 2020, 125, e2019JG005476. [Google Scholar] [CrossRef]
  15. Li, S.; Hou, K.; Zhou, S.; Sun, J. Research on synergistic optimization of spatial morphology and carbon emission effects of settlements under the influence of cold micorclimate. Shanghai Urban Plan. Rev. 2024, 4, 31–39. [Google Scholar]
  16. Zhang, W.; Li, K.; Zhou, D.; Zhang, W.; Gao, H. Decomposition of intensity of energy-related CO2 emission in Chinese provinces using the LMDI method. Energy Policy 2016, 92, 369–381. [Google Scholar] [CrossRef]
  17. Zheng, X.; Lu, Y.; Yuan, J.; Baninla, Y.; Zhang, S.; Stenseth, N.; Hessen, D.; Tian, H.; Obersteiner, M.; Chen, D. Drivers of change in China’s energy-related CO2 emissions. Proc. Natl. Acad. Sci. USA 2020, 117, 29–36. [Google Scholar] [CrossRef]
  18. Cong, J.; Liu, x.; Zhao, X. Demarcation problems and the corresponding measurement methods of the urban carbon accounting. China Popul. Resour. Environ. 2014, 24, 19–26. [Google Scholar]
  19. Li, Y.; Wei, W.; Zhou, J.; Hao, R.; Chen, D. Changes in Land Use Carbon Emissions and Coordinated Zoning in China. Environ. Sci. 2023, 44, 1267–1276. [Google Scholar] [CrossRef]
  20. Lu, C.; Wang, Z. ENA-model based carbon metabolism analysis of the Yellow River Delta. China Environ. Sci. 2023, 43, 6090–6101. [Google Scholar] [CrossRef]
  21. Niu, Y.; Zhao, X.; Hu, Y. Spatial variation of carbon emission from county land use in Chang-Zhu-Tan area based on NPP-VIIRS night light. Acta Sci. Circumstantiae 2021, 41, 3847–3856. [Google Scholar] [CrossRef]
  22. Shan, Y.; Guan, Y.; Hang, Y.; Zheng, H.; Li, Y.; Guan, D.; Li, J.; Zhou, Y.; Li, L.; Hubacek, K. City-level emission peak and drivers in China. Sci. Bull. 2022, 67, 1910–1920. [Google Scholar] [CrossRef]
  23. Wang, Z.; Lu, C.; Cai, X.; Zhao, X. Spatio-temporal Interactions Between “Spatial-economic-demographic” Carbon Strength and Ecosystem Services in the Shandong Section of the Yellow River Basin. Environ. Sci. 2025, 46, 1573–1584. [Google Scholar] [CrossRef]
  24. Ji, X.; Liu, H.; Zhang, Y. Spatiotemporal Evolution and Driving Factors of Spatial Correlation Network Structure of China’s Land-use Carbon Emission. Econ. Geogr. 2023, 43, 190–200. [Google Scholar] [CrossRef]
  25. Wang, Z.; Zhou, K.; Fan, J.; Zhao, H. Progress of research on energy-related carbon emission accounting methods at the prefectural and county levels. Prog. Geogr. 2023, 42, 1406–1419. [Google Scholar] [CrossRef]
  26. Fan, J.; Yu, X.; Zhou, L. Carbon emission efficiency growth of land use structure and its spatial correlation: A case study of Nanjing city. Geogr. Res. 2018, 37, 2177–2192. [Google Scholar]
  27. Yu, B.; Yang, X.; Wu, X. Study on spatial spillover effects and influencing factors of carbon emissions in county areas of Ha-Chang city group: Evidence from NPP-VIIRS nightlight data. Acta Sci. Circumstantiae 2020, 40, 697–706. [Google Scholar] [CrossRef]
  28. Ji, G. Application of BP neural network model in the prediction of China’s carbon emissions based on grey correlation analysis. Math. Pract. Theory 2014, 44, 243–249. [Google Scholar]
  29. Wang, Y.; Xie, Y.; Liu, R.; Zhang, H. Population prediction and resource allocation in megacities from the optimum population perspective: A case study of Beijing, Shanghai, Guangzhou and Shenzhen. Acta Geogr. Sin. 2021, 76, 352–366. [Google Scholar]
  30. Weng, X. Research and Application on Prediction Method Based on Gray Theory and Neural Network. Master’s Thesis, South-Central Minzu University, Wuhan, China, 2009. Available online: https://kns.cnki.net/kcms2/article/abstract?v=79O6ZE_Rn2qDjKt5y_LNmGfyIBd30dFSUZ8feZ1OruOsdzEgzVV8ARIi0fH7uy2mZuzcj52pNA0VYBBd8d8r_2EpNinP8E3JKAXD9lNIzdFfJmdlnoSY1j0Zsk_9GkOlj0_LLRdPzB6uKFFvP1LzuEaUy32ZVeNgsuTKxC8O3Ieiv_Q84dOxnRAjNvd2qQVtXaNwpFGBalk=&uniplatform=NZKPT&language=CHS (accessed on 15 June 2025).
  31. Forman, R.T.T.; Godron, M. Landscape Ecology. Environ. Conserv. 1989, 16, 90. [Google Scholar] [CrossRef]
  32. Wu, J. Chapter 2 Formation, Structure and Functional Characteristics of Landscape Pattern. In Landscape Ecology—Pattern, Process, Scale and Hierarchy, 2nd ed.; Higher Education Press: Beijing, China, 2007; pp. 25–41. [Google Scholar]
  33. Yuan, Y.; Guo, W.; Tang, S.; Zhang, J. Effects of patterns of urban green-blue landscape on carbon sequestration using XGBoost-SHAP model. J. Clean. Prod. 2024, 476, 14. [Google Scholar] [CrossRef]
  34. Wang, J.; Wang, Y.; Zhang, T.; Fan, L.; Sun, T. Research on Spatial Pattern of Green Space in Urban Block Units and Optimization of Carbon Sink Benefits of Plant Communities. Landsc. Archit. 2024, 31, 37–45. [Google Scholar] [CrossRef]
  35. Zhang, J.; Yu, Z.; Zhao, B. Impact Mechanism of Urban Green Spaces in Promoting Public Health: Theoretical Framework and Inspiration for Practical Experiences. Landsc. Archit. Front. 2020, 8, 104–113. [Google Scholar] [CrossRef]
  36. Yu, Y.; Wang, X. Estimation of urban green space carbon sink for ecosystem service function. J. Xi’an Univ. Archit. Technol. (Nat. Sci. Ed.) 2021, 53, 95–102. [Google Scholar] [CrossRef]
  37. Chang, X.; Li, H.; Junqi, W.; Zhuangbo, F.; Prashant, K.; Shi-Jie, C. How can greenery space mitigate urban heat island? An analysis of cooling effect, carbon sequestration, and nurturing cost at the street scale. J. Clean. Prod. 2023, 419, 138230. [Google Scholar] [CrossRef]
  38. Ji, Y.; Luo, J.; Wang, T.; Liang, X. Research on carbon source and carbon sink of landscape life circle based on low carbon concept- a case study of Shilinyuan residential area in Tianjin. Chin. Landsc. Archit. 2020, 36, 68–72. [Google Scholar] [CrossRef]
  39. Pincetl, S.; Bunje, P.; Holmes, T. An expanded urban metabolism method: Toward a systems approach for assessing urban energy processes and causes. Landsc. Urban Plan. 2012, 107, 193–202. [Google Scholar] [CrossRef]
  40. Dai, X. Critical relations of city construction and carbon emission. Mod. Urban Res. 2011, 26, 7–9. [Google Scholar]
  41. Aytuerxun, S.; Gulimire, A.; Shi, Y. Carbon emission change of land use landscape pattern evolution in Karamay city. Southwest China J. Agric. Sci. 2024, 37, 852–859. [Google Scholar] [CrossRef]
  42. Bao, L.; Liu, Y. Spatio-temporal changes of urban form in Beijing under the carbon emissions peak and carbon neutrality targets and its impact on carbon emissions. Acta Ecol. Sin. 2024, 44, 7507–7519. [Google Scholar] [CrossRef]
  43. Wu, Y.; Luo, M.; Ding, S.; Han, Q. Using a Light Gradient-Boosting Machine-Shapley Additive Explanations Model to Evaluate the Correlation Between Urban Blue-Green Space Landscape Spatial Patterns and Carbon Sequestration. Land 2024, 13, 21. [Google Scholar] [CrossRef]
  44. Zeng, X.; Fan, D.; Zheng, Y.; Li, S. Exploring the Differentiated Impact of Urban Spatial Form on Carbon Emissions: Evidence from Chinese Cities. Land 2024, 13, 19. [Google Scholar] [CrossRef]
  45. Li, Y.; Luo, H. Trade-off/synergistic changes in ecosystem services and geographical detection of its driving factors in typical karst areas in southern China. Ecol. Indic. 2023, 154, 16. [Google Scholar] [CrossRef]
  46. Wang, J.; Xu, C. Geodetector: Principle and prospective. Acta Geogr. Sin. 2017, 72, 116–134. [Google Scholar]
  47. Wang, J.; Zhang, T.; Fu, B. A measure of spatial stratified heterogeneity. Ecol. Indic. 2016, 67, 250–256. [Google Scholar] [CrossRef]
  48. Chen, T.; Li, X.; Chen, B. Decomposition of influencing factors, and peak prediction of carbon emissions in China. J. Saf. Environ. Sci. 2024, 24, 396–406. [Google Scholar] [CrossRef]
  49. Pengfei, X.; Guangyao, Z.; Qiuhao, Z.; Yiqing, L.; Jingling, C. Spatial-temporal dynamics and influencing factors of city level carbon emission of mainland China. Ecol. Indic. 2024, 167, 14. [Google Scholar] [CrossRef]
  50. Wang, Y.; He, Y. Spatiotemporal dynamics and influencing factors of provincial carbon emissions in China. World Reg. Stud. 2020, 29, 512–522. [Google Scholar]
  51. Sheng, J.; Liu, L.; Liu, Z.; Pan, Y. Asphalt mixture performance prediction method based on BP Neural Network optimized by genetic algorithm. Sci. Technol. Eng. 2025, 25, 1214–1224. [Google Scholar]
  52. Zhang, J. Research on Forecast of Cold Chain LOGISTICS demand for Fresh Agricultural Products in Shanxi province. Master’s Thesis, North University of China, Taiyuan, China, 2023. [Google Scholar]
  53. Wang, X.; Li, S.; Liu, Y.; Jing, T.; Gao, X. Ultra-Short-Team wind power prediction based on variable feature weight. ACTA Energiae Solaris Sin. 2023, 44, 52–58. [Google Scholar] [CrossRef]
  54. Wu, L.; Zhou, L.; Wang, X.; Li, J. Landscape diversity of urban greenland system in Beijing. J. Beijing For. Univ. 2007, 29, 88–93. [Google Scholar]
  55. Li, K.; Wang, H.; Zhang, X.; Su, H.; Xu, J.; Hua, X. Assessing the divergent effects of green infrastructure landscape patterns on carbon emission and sequestration in 31 cities across China. Build. Environ. 2025, 280, 13. [Google Scholar] [CrossRef]
  56. Zhang, Z.; Hou, Y.; Sun, H. Calculation of carbon emissions and the difference of low-carbon development efficiency on city territorial space. J. Nat. Resour. 2023, 38, 1464–1481. [Google Scholar] [CrossRef]
  57. Deng, X.; Jiang, L.; Liu, C. Assessment and Regulation of Carbon Emission in Territorial Space Detailed Planning: The Detailed Planning of the Core Area in Suzhou Taihu Science City. Planners 2023, 39, 117–122. [Google Scholar]
  58. Zhang, S.; Xia, F.; Zhou, L.; Wang, X.; Xie, Y. Assessment and Scenario Prediction of the Offsetting Effect of Forest Carbon Sequestration on the Energy Carbon Emission in Sanjianghui Area of Hangzhou. Chin. Landsc. Archit. 2023, 39, 113–119. [Google Scholar] [CrossRef]
  59. Tong, W.; Li, D.; Li, T.; Lu, L.; Huang, Q. Spatial-temporal dynamics of county carbon emissions in Jiangsu province. Environ. Sci. Technol. 2023, 46, 165–173. [Google Scholar] [CrossRef]
  60. Wang, J.; Xiang, Z.; Wang, W.; Chang, W.; Wang, Y. Impacts of strengthened warming by urban heat island on carbon sequestration of urban ecosystems in a subtropical city of China. Urban Ecosyst. 2021, 24, 1165–1177. [Google Scholar] [CrossRef]
Figure 1. Overview of the study area.
Sustainability 17 07245 g001
Figure 2. Artificial neuron model.
Sustainability 17 07245 g002
Figure 3. Three-layer typical BP neural network model.
Sustainability 17 07245 g003
Figure 4. BP neural network operation process.
Sustainability 17 07245 g004
Figure 5. Variable correlation heatmap.
Sustainability 17 07245 g005
Figure 6. Random forest variable importance ranking.
Sustainability 17 07245 g006
Figure 7. Diagram of the structure of the gray neural network model.
Sustainability 17 07245 g007
Figure 8. Model training parameters.
Sustainability 17 07245 g008
Figure 9. Training set fitting plot.
Sustainability 17 07245 g009
Figure 10. Test set fitting plot.
Sustainability 17 07245 g010
Figure 11. Coefficients of training set R.
Sustainability 17 07245 g011
Figure 12. Coefficients of test set R.
Sustainability 17 07245 g012
Figure 13. Comparison of carbon emission forecasts.
Sustainability 17 07245 g013
Figure 14. Carbon emission at the urban and county levels in Nanjing from 2000 to 2020.
Sustainability 17 07245 g014
Figure 15. Spatial distribution of carbon emissions at the urban and county levels in Nanjing from 2000 to 2020.
Sustainability 17 07245 g015
Figure 16. Comparison of urban green space distribution in 2000 and 2020.
Sustainability 17 07245 g016
Figure 17. Urban green space landscape index of Nanjing from 2000 to 2020.
Sustainability 17 07245 g017
Figure 18. Spatiotemporal variation in urban green space morphological factors from 2000 to 2020.
Sustainability 17 07245 g018aSustainability 17 07245 g018b
Table 1. Definition and calculation method of the scope of the three types of carbon emissions.
Scope of Carbon EmissionsDefinition of ScopeMethods of Calculation
Scope1Within the urban jurisdiction, direct greenhouse gas emissions come from a number of sources, such as energy-related activities, industrial sector energy consumption, transportation sector energy consumption, building sector energy consumption, industrial processes, agricultural activities, emissions associated with forestry and land use change, and waste disposal emissions.Scope1 = ∑(Activity level data i × Emission factors i)Activity level data i represents the activity level of the ith direct emission source (e.g., energy consumption, industrial production, etc.). Emission factor i represents the emission factor of the ith direct emission source (e.g., CO2 emissions per unit of energy consumption).
Scope2The subject of this investigation pertains to energy-related emissions resulting from the production and supply of heat occurring beyond the municipal boundaries of the city.Scope2 = Electricity usage × Electricity emission factors + Heat usage × Thermal emission factors
Scope3Cross-regional indirect emissions from urban economic activities consist primarily of greenhouse gases from the full life cycle of purchased goods.Hybrid-EIO-LCA mixed method
Table 4. Gray neural network training parameters.
Parameter NameParameter Setting
Number of iterations1000
Target error0.000001
Learning rate0.01
Table 5. Comparison of carbon emission prediction model performance.
ModelTest Set-R2Test Set-MAPETraining Set-MAETest Set-MAE
Gray BP Neural network0.96191.68%29.8668.88
XG-Boost0.90606.84%1.49215.53
LSTM0.91366.14%115.26201.83
Table 6. Classification and area of urban green space.
YearArea of Forest Land/km2Area of Grassland/km2Total Area/km2
2000695.80961.915757.724
2005691.96561.903753.868
2010669.61656.348725.964
2015668.86356.074724.937
2020661.17459.833721.007
Table 7. Detection results of potential drivers.
Potential Driving Factors20002005201020152020
p-Valueq-Valuep-Valueq-Valuep-Valueq-Valuep-Valueq-Valuep-Valueq-Value
X1TA0.0000.1090.0000.1150.0000.1130.0000.1050.0000.109
X2PD0.0130.0030.0000.0050.0020.0040.0010.0050.0280.005
X3LPI0.0000.6480.0000.6410.0000.6620.0000.6600.0000.673
X4AREA_MN0.1210.0020.0000.0740.0000.0720.0000.0730.0000.077
X5PARA_MN0.0190.0030.0010.0040.0010.0040.0010.0050.0220.005
X6CONTIG_MN0.0000.0690.0000.0710.0000.0700.0000.0700.0000.073
X7PLADJ0.0000.0680.0600.0020.3250.0020.1630.0020.0610.002
X8COHESION0.2720.0010.0000.6410.0000.6620.0000.6600.0000.673
X9MESH0.0000.0680.0000.0720.0000.0710.0000.0720.0000.075
X10AI0.2580.0010.0000.6320.0000.6470.0000.6330.0000.642
Table 8. Correlation analysis between morphological factors and carbon emissions of urban green space.
X1X2X3X4X5X6X7X8X9X10Y
X11
X2−0.293 **1
X3−0.001−0.028 **1
X40.325 **−0.140 **0.700 **1
X5−0.186 **0.296 **−0.413 **−0.783 **1
X60.222 **−0.276 **0.449 **0.797 **−0.974 **1
X70.558 **−0.641 **0.437 **0.516 **−0.442 **0.548 **1
X80.224 **−0.538 **0.336 **0.275 **−0.238 **0.387 **0.763 **1
X90.573 **−0.202 **0.790 **0.822 **−0.492 **0.515 **0.637 **0.310 **1
X100.361 **−0.533 **0.457 **0.428 **−0.347 **0.483 **0.880 **0.941 **0.509 **1
Y0.031 **−0.009−0.029 **−0.013 *0.005−0.0040.011*−0.002−0.0060.0071
** The correlation is deemed to be significant at the 0.01 level (two-tailed). * The correlation is deemed to be significant at the 0.05 level (two-tailed).
Disclaimer/Publisher’s Note: The statements, opinions and data contained in all publications are solely those of the individual author(s) and contributor(s) and not of MDPI and/or the editor(s). MDPI and/or the editor(s) disclaim responsibility for any injury to people or property resulting from any ideas, methods, instructions or products referred to in the content.