
Daily Green Exposure, Mobility, and Health: A Scoping Review


Abstract
1. Introduction
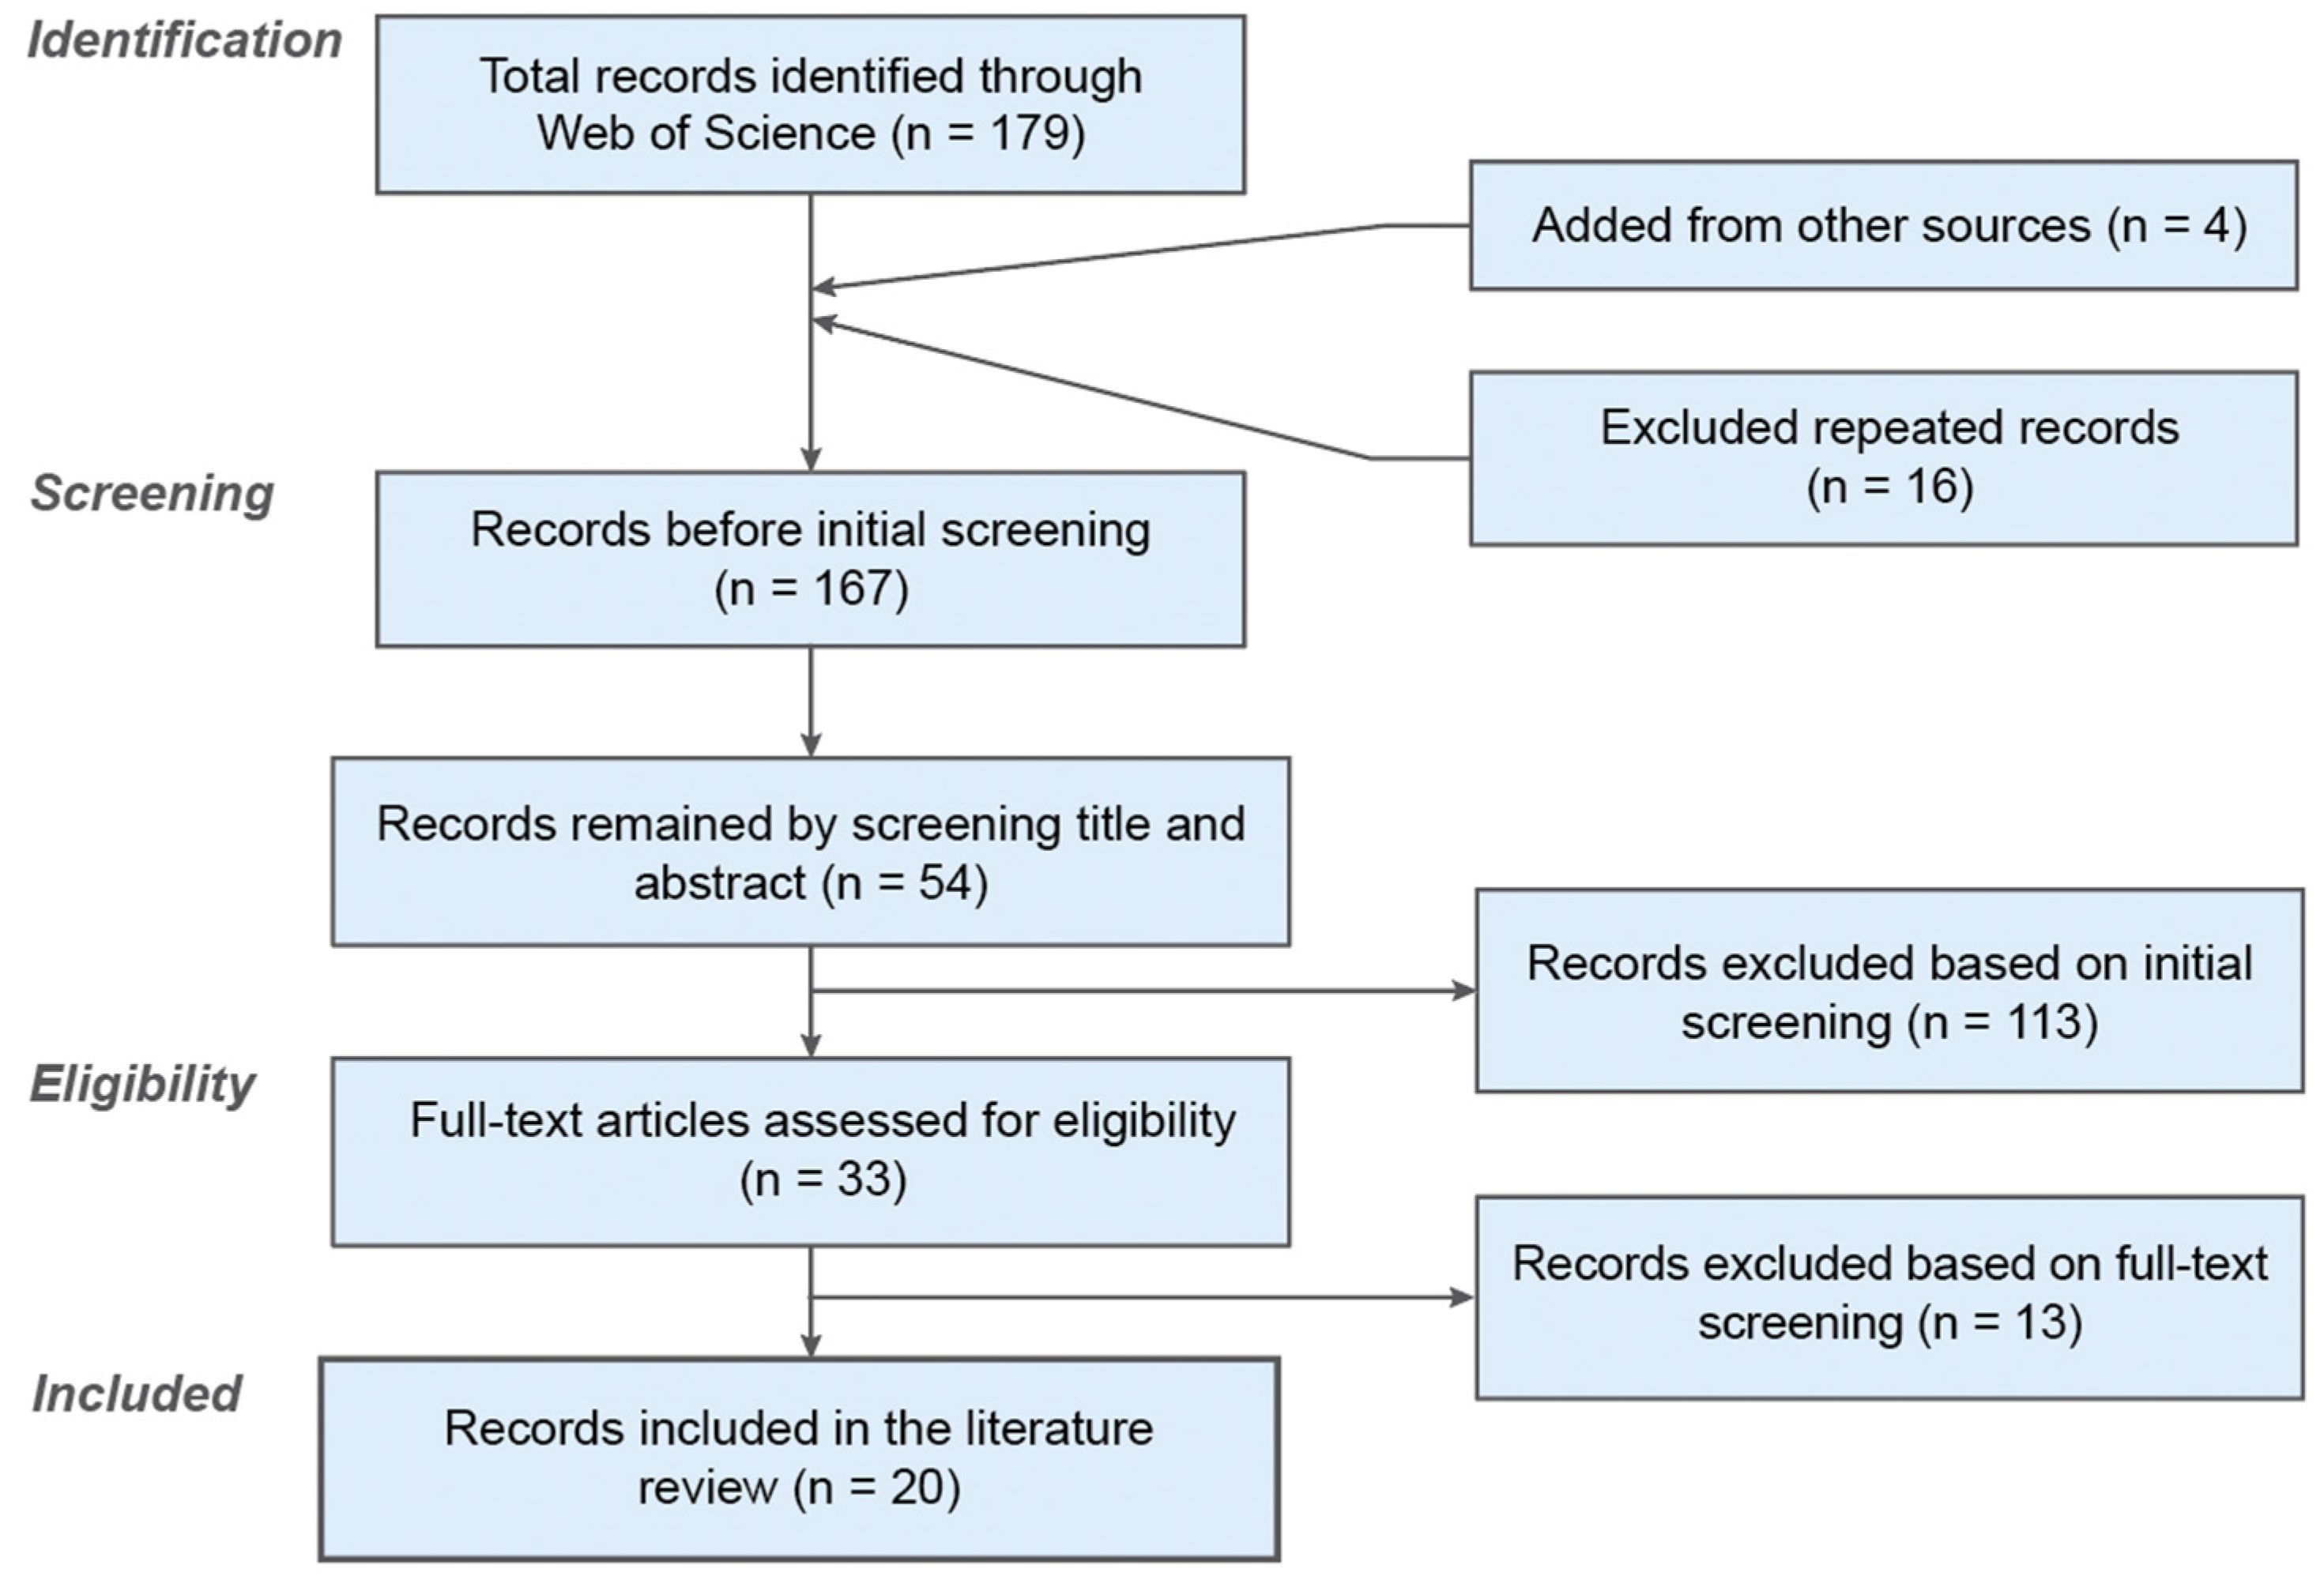
2. Methods
3. Results
3.1. Ecological Momentary Assessment
3.2. Effect Assessment: Usage, Activity Space, and Travel Route Assessment
3.3. Spatiotemporal Assessment: Integrated Assessment
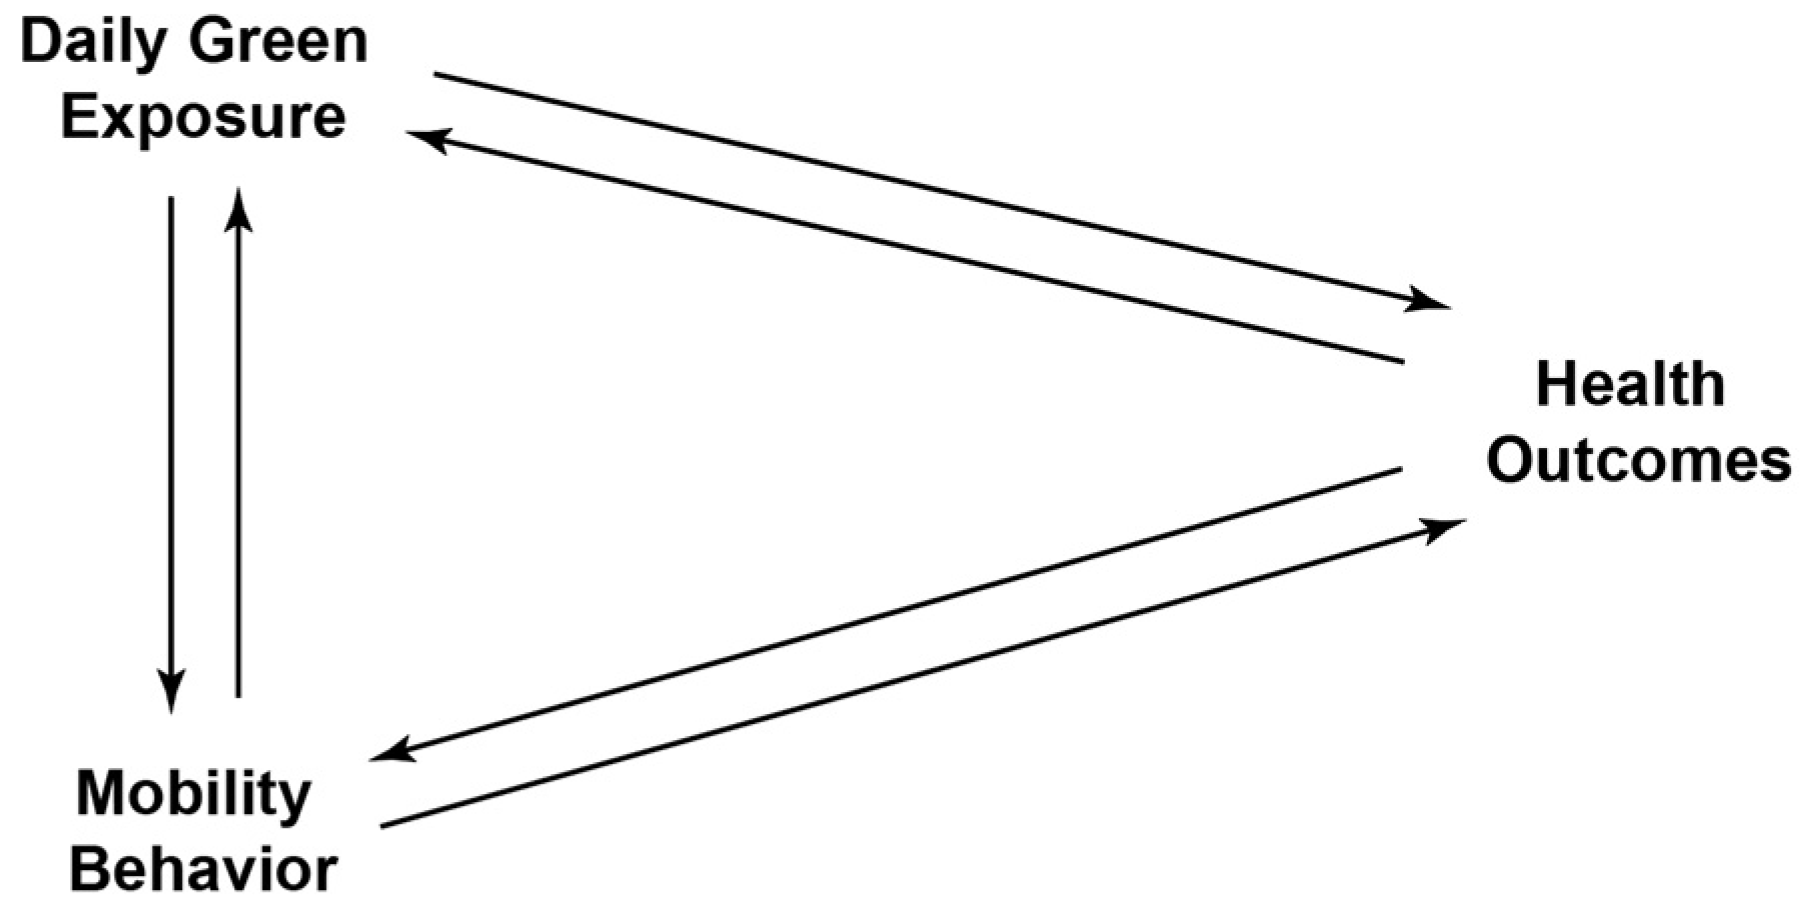
3.4. Modeling Relationships between DGE, Mobility Behavior, and Health
4. Discussion and Future Directions
Author Contributions
Funding
Institutional Review Board Statement
Informed Consent Statement
Data Availability Statement
Acknowledgments
Conflicts of Interest
References
- World Health Organization. Global Health Risks: Mortality and Burden of Disease Attributable to Selected Major Risks; WHO: Geneva, Switzerland, 2009. [Google Scholar]
- CDC. Active People Healthy Nation at A Glance. Available online: https://www.cdc.gov/physicalactivity/activepeoplehealthynation/index.html (accessed on 17 September 2021).
- Jeong, I.; Choi, M.; Kwak, J.; Ku, D.; Lee, S. A Comprehensive Walkability Evaluation System for Promoting Environmental Benefits. Sci. Rep. 2023, 13, 16183. [Google Scholar] [CrossRef] [PubMed]
- Lawrence, F.; Engelke, P.; Schmid, T. Health and Community Design: The Impact of the Built Environment on Physical Activity; Island Press: Washington, DC, USA, 2003. [Google Scholar]
- Eisenman, T.S. Frederick Law Olmsted, Green Infrastructure, and the Evolving City. J. Plan. Hist. 2013, 12, 287–311. [Google Scholar] [CrossRef]
- Wilson, E. Biophilia; Harvard University Press: Cambridge, MA, USA, 1986. [Google Scholar]
- Kaplan, S. The Restorative Benefits of Nature: Toward an Integrative Framework. J. Environ. Psychol. 1995, 15, 169–182. [Google Scholar]
- Ulrich, R.S. Effects of Interior Design on Wellness: Theory and Recent Scientific Research. Symp. Health Care Inter. Des. 1991, 3, 97–109. [Google Scholar]
- Beatley, T. Biophilic Cities: Integrating Nature into Urban Design and Planning; Island Press: Washington, DC, USA, 2011. [Google Scholar]
- Markevych, I.; Schoierer, J.; Hartig, T.; Chudnovsky, A.; Hystad, P.; Dzhambov, A.M.; de Vries, S.; Triguero-Mas, M.; Brauer, M.; Nieuwenhuijsen, M.J.; et al. Exploring Pathways Linking Greenspace to Health: Theoretical and Methodological Guidance. Environ. Res. 2017, 158, 301–317. [Google Scholar] [CrossRef] [PubMed]
- Koohsari, M.J.; Mavoa, S.; Villanueva, K.; Sugiyama, T.; Badland, H.; Kaczynski, A.T.; Owen, N.; Giles-Corti, B. Public Open Space, Physical Activity, Urban Design, and Public Health: Concepts, Methods and Research Agenda. Health Place 2015, 33, 75–82. [Google Scholar] [CrossRef] [PubMed]
- Lachowycz, K.; Jones, A.P. Greenspace and Obesity: A Systematic Review of the Evidence: Greenspace and Obesity Review. Obes. Rev. 2011, 12, e183–e189. [Google Scholar] [CrossRef] [PubMed]
- McCormack, G.R.; Rock, M.; Toohey, A.M.; Hignell, D. Characteristics of Urban Parks Associated with Park Use and Physical Activity: A Review of Qualitative Research. Health Place 2010, 16, 712–726. [Google Scholar] [CrossRef] [PubMed]
- Chaix, B. Geographic Life Environments and Coronary Heart Disease: A Literature Review, Theoretical Contributions, Methodological Updates, and a Research Agenda. Annu. Rev. Public Health 2009, 30, 81–105. [Google Scholar] [CrossRef] [PubMed]
- James, P.; Wilt, G.E.; Jimenez, M.P. Invited Perspective: Can My Smartphone Assess My Exposure? The Potential to Retroactively Estimate Personalized Exposures Using Smartphone Location Data. Environ. Health Perspect. 2022, 130, 111304. [Google Scholar] [CrossRef]
- Vich, G.; Marquet, O.; Miralles-Guasch, C. Green Streetscape and Walking: Exploring Active Mobility Patterns in Dense and Compact Cities. J. Transp. Health 2019, 12, 50–59. [Google Scholar] [CrossRef]
- Akpinar, A. How Is Quality of Urban Green Spaces Associated with Physical Activity and Health? Urban For. Urban Green. 2016, 16, 76–83. [Google Scholar] [CrossRef]
- Coppel, G.; Wüstemann, H. The Impact of Urban Green Space on Health in Berlin, Germany: Empirical Findings and Implications for Urban Planning. Landsc. Urban Plan. 2017, 167, 410–418. [Google Scholar] [CrossRef]
- Heo, S.; Lim, C.C.; Bell, M.L. Relationships between Local Green Space and Human Mobility Patterns during COVID-19 for Maryland and California, USA. Sustainability 2020, 12, 9401. [Google Scholar] [CrossRef]
- McCracken, D.S.; Allen, D.A.; Gow, A.J. Associations between Urban Greenspace and Health-Related Quality of Life in Children. Prev. Med. Rep. 2016, 3, 211–221. [Google Scholar] [CrossRef] [PubMed]
- Nutsford, D.; Pearson, A.L.; Kingham, S. An Ecological Study Investigating the Association between Access to Urban Green Space and Mental Health. Public Health 2013, 127, 1005–1011. [Google Scholar] [CrossRef] [PubMed]
- Richardson, E.A.; Pearce, J.; Mitchell, R.; Kingham, S. Role of Physical Activity in the Relationship between Urban Green Space and Health. Public Health 2013, 127, 318–324. [Google Scholar] [CrossRef]
- Richardson, E.A.; Mitchell, R. Gender Differences in Relationships between Urban Green Space and Health in the United Kingdom. Soc. Sci. Med. 2010, 71, 568–575. [Google Scholar] [CrossRef]
- Schipperijn, J.; Stigsdotter, U.K.; Randrup, T.B.; Troelsen, J. Influences on the Use of Urban Green Space—A Case Study in Odense, Denmark. Urban For. Urban Green. 2010, 9, 25–32. [Google Scholar] [CrossRef]
- Venter, Z.S.; Barton, D.N.; Gundersen, V.; Figari, H.; Nowell, M. Urban Nature in a Time of Crisis: Recreational Use of Green Space Increases during the COVID-19 Outbreak in Oslo, Norway. Environ. Res. Lett. 2020, 15, 104075. [Google Scholar]
- Chaix, B.; Kestens, Y.; Perchoux, C.; Karusisi, N.; Merlo, J.; Labadi, K. An Interactive Mapping Tool to Assess Individual Mobility Patterns in Neighborhood Studies. Am. J. Prev. Med. 2012, 43, 440–450. [Google Scholar] [CrossRef] [PubMed]
- Munn, Z.; Peters, M.D.J.; Stern, C.; Tufanaru, C.; McArthur, A.; Aromataris, E. Systematic Review or Scoping Review? Guidance for Authors When Choosing between a Systematic or Scoping Review Approach. BMC Med. Res. Methodol. 2018, 18, 143. [Google Scholar] [CrossRef]
- Almanza, E.; Jerrett, M.; Dunton, G.; Seto, E.; Ann Pentz, M. A Study of Community Design, Greenness, and Physical Activity in Children Using Satellite, GPS and Accelerometer Data. Health Place 2012, 18, 46–54. [Google Scholar] [CrossRef]
- Ambrey, C.L. An Investigation into the Synergistic Wellbeing Benefits of Greenspace and Physical Activity: Moving beyond the Mean. Urban For. Urban Green. 2016, 19, 7–12. [Google Scholar] [CrossRef]
- Burgoine, T.; Jones, A.P.; Namenek Brouwer, R.J.; Benjamin Neelon, S.E. Associations between BMI and Home, School and Route Environmental Exposures Estimated Using GPS and GIS: Do We See Evidence of Selective Daily Mobility Bias in Children? Int. J. Health Geogr. 2015, 14, 8. [Google Scholar] [CrossRef]
- Cherrie, M.; Shortt, N.; Ward Thompson, C.; Deary, I.; Pearce, J. Association Between the Activity Space Exposure to Parks in Childhood and Adolescence and Cognitive Aging in Later Life. Int. J. Environ. Res. Public Health 2019, 16, 632. [Google Scholar] [CrossRef] [PubMed]
- He, H.; Shen, Y.; Jiang, C.; Li, T.; Guo, M.; Yao, L. Spatiotemporal Big Data for PM2.5 Exposure and Health Risk Assessment during COVID-19. Int. J. Environ. Res. Public Health 2020, 17, 7664. [Google Scholar] [CrossRef] [PubMed]
- Holt, E.; Lombard, Q.; Best, N.; Smiley-Smith, S.; Quinn, J. Active and Passive Use of Green Space, Health, and Wellbeing amongst University Students. Int. J. Environ. Res. Public Health 2019, 16, 424. [Google Scholar] [CrossRef]
- Honold, J.; Lakes, T.; Beyer, R.; van der Meer, E. Restoration in Urban Spaces: Nature Views From Home, Greenways, and Public Parks. Environ. Behav. 2016, 48, 796–825. [Google Scholar] [CrossRef]
- Jiang, X.; Larsen, L.; Sullivan, W. Connections Between Daily Greenness Exposure and Health Outcomes. Int. J. Environ. Res. Public Health 2020, 17, 3965. [Google Scholar] [CrossRef]
- Li, D.; Deal, B.; Zhou, X.; Slavenas, M.; Sullivan, W.C. Moving beyond the Neighborhood: Daily Exposure to Nature and Adolescents’ Mood. Landsc. Urban Plan. 2018, 173, 33–43. [Google Scholar] [CrossRef]
- MacKerron, G.; Mourato, S. Happiness Is Greater in Natural Environments. Glob. Environ. Change 2013, 23, 992–1000. [Google Scholar] [CrossRef]
- Maes, M.J.A.; Pirani, M.; Booth, E.R.; Shen, C.; Milligan, B.; Jones, K.E.; Toledano, M.B. Benefit of Woodland and Other Natural Environments for Adolescents’ Cognition and Mental Health. Nat. Sustain. 2021, 4, 851–858. [Google Scholar] [CrossRef]
- Mennis, J.; Mason, M.; Ambrus, A. Urban Greenspace Is Associated with Reduced Psychological Stress among Adolescents: A Geographic Ecological Momentary Assessment (GEMA) Analysis of Activity Space. Landsc. Urban Plan. 2018, 174, 1–9. [Google Scholar] [CrossRef] [PubMed]
- Robinson, O.; Tamayo, I.; De Castro, M.; Valentin, A.; Giorgis-Allemand, L.; Hjertager Krog, N.; Marit Aasvang, G.; Ambros, A.; Ballester, F.; Bird, P.; et al. The Urban Exposome during Pregnancy and Its Socio-economic Determinants. Environ. Health Perspect. 2018, 126, 077005. [Google Scholar] [CrossRef] [PubMed]
- Wang, R.; Feng, Z.; Pearce, J.; Zhou, S.; Zhang, L.; Liu, Y. Dynamic Greenspace Exposure and Residents’ Mental Health in Guangzhou, China: From over-Head to Eye-Level Perspective, from Quantity to Quality. Landsc. Urban Plan. 2021, 215, 104230. [Google Scholar] [CrossRef]
- Xie, X.; Zhou, H.; Gou, Z.; Yi, M. Spatiotemporal Patterns of the Use of Green Space by White-Collar Workers in Chinese Cities: A Study in Shenzhen. Land 2021, 10, 1006. [Google Scholar] [CrossRef]
- Zhang, L.; Zhou, S.; Kwan, M.-P.; Chen, F.; Lin, R. Impacts of Individual Daily Greenspace Exposure on Health Based on Individual Activity Space and Structural Equation Modeling. Int. J. Environ. Res. Public Health 2018, 15, 2323. [Google Scholar] [CrossRef] [PubMed]
- Wang, B.; Xu, T.; Gao, H.; Ta, N.; Chai, Y.; Wu, J. Can Daily Mobility Alleviate Green Inequality from Living and Working Environments? Landsc. Urban Plan. 2021, 214, 104179. [Google Scholar] [CrossRef]
- Shiffman, S. Designing Protocols for Ecological Momentary Assessment. In The Science of Real-Time Data Capture: Self-Reports in Health Research; Oxford Academic: Oxford, UK, 2007; pp. 27–53. [Google Scholar]
- Kajosaari, A.; Pasanen, T.P. Restorative Benefits of Everyday Green Exercise: A Spatial Approach. Landsc. Urban Plan. 2021, 206, 103978. [Google Scholar] [CrossRef]
- van den Berg, M.; van Poppel, M.; Smith, G.; Triguero-Mas, M.; Andrusaityte, S.; van Kamp, I.; van Mechelen, W.; Gidlow, C.; Gražulevičiene, R.; Nieuwenhuijsen, M.J.; et al. Does Time Spent on Visits to Green Space Mediate the Associations between the Level of Residential Greenness and Mental Health? Urban For. Urban Green. 2017, 25, 94–102. [Google Scholar] [CrossRef]


| Parameter | Criteria |
|---|---|
| Population | Any age, gender, race, and health condition |
| Interest | Peer-reviewed articles in English. Reviews and Protocols excluded |
| Context | Urban |
| Study Design | Experimental, observational, ecological study designs with objectively measured urban greenness and objectively or subjectively assessed mobility behaviors |
| Timing | No restrictions on date of publication |
| Author, Year | Description | Data Source | Measurement | Size |
|---|---|---|---|---|
| Richardson et al., 2013 [22] | They included natural areas (e.g., parks, beaches, and fields). Marine areas and private gardens were excluded. | 3 Land use datasets | The proportion of greenspace within each census area unit (n = 1927) in New Zealand | ≥0.02 ha (200 m2) |
| Richardson and Mitchell, 2010 [23] | A wide range of greenspace, from transport, verges, and neighborhood greens to parks, playing fields, and woodlands. | 2 Land use datasets | The proportion of greenspace within each UK Census Area Statistic ward (n = 6432). | ≥5 m2 |
| McCracken et al., 2016 [20] | Included all vegetated open space areas. Water areas were excluded. | Central Scotland Green Network dataset | Greenspace availability within a 500 m buffer radius around the residence (n = 276; clustered in 46 spatial groups). | Not specified |
| Coppel and Wüstemann, 2017 [18] | Inclusion: city administration’s definition of urban green areas. Exclusion: street trees or private backyards/allotment gardens | 1 Land use dataset (Urban Atlas) | Proximity (Euclidean distance between home locations and the nearest edge of green spaces); Coverage of greenspace within a 250 m buffer around the residence (n = 874) in Berlin, Germany. | ≥0.5 ha (5000 m2) |
| Nutsford et al., 2013 [21] | They categorized total greenspace (including privately owned land) and usable greenspace (like parks and sports fields). Private gardens were excluded. | Greenspace dataset (generated from 2008 Land Class Database II) | Proximity (distance between each PWC * and nearest greenspace): the proportion of total and usable greenspace within 300 m and 30 km buffer areas around each PWC * in Auckland, New Zealand. | ≥500 m2 |
| Vich et al., 2019 [16] | Street trees, parks, beaches, squares, and boulevards were included. | City’s land use map, street tree map, and street network shapefile | Tree density: the proportion of green areas with a 20 m buffer around the walking trajectories (Barcelona, Spain) | ≥16.88 m2 |
| Schipperijin et al., 2010 [24] | Greenspaces, parks, woodlands, and nature areas | Greenspace datasets from the Municipality of Odense | Proximity (self-reported distance, Euclidean, and network distance to nearest green space). (Odense, Denmark) | >5 ha; 1–5 ha; <1 ha |
| Heo et al., 2020 [19] | Parks (state parks and local-scale parks) and forests | Satellite imagery with 250 m resolution; park data from Esri and OpenStreetMap | Enhanced Vegetation Index (EVI) for each MCD * in Maryland and each CCD * in California, US; greenspace locations. | Not specified |
| Akpinar, 2016 [17] | Seven selected UGS (3 neighborhood parks, one urban park, and three urban greenways). | Aydin Metropolitan Municipality Master Plan | Proximity (distance from home to nearest UGS); Quality factors (like aesthetics and maintenance). (Aydin Turkey). | Not specified |
| Venter et al., 2020 [25] | Tree cover, vegetation greenness, and trail remoteness | Land use and land cover datasets; DSM and DTM with 1 m resolution; satellite imagery with 10 m resolution | Tree cover; normalized difference vegetation index (NDVI) in Oslo, Norway | Not specified |
| Assessment Category | Subcategory | Description |
|---|---|---|
| Ecological momentary assessment | Real-time assessment | Collecting real-time self-reported or recorded data in daily life |
| Effect assessment | Usage assessment | Calculating the “dose” of greenspace exposure based on usage patterns, like frequency and duration of active and passive use of greenspace |
| Activity space assessment | Calculating average daily exposure to environments from the proportion of time spent in different activity locations | |
| Travel route assessment | Calculating people’s actual route exposure from their mobility patterns | |
| Spatiotemporal assessment | Integrated assessment | Calculating people’s spatiotemporal exposure with varied exposure types, like time-weighted mobility route exposure in combination with activity space exposure |
Disclaimer/Publisher’s Note: The statements, opinions and data contained in all publications are solely those of the individual author(s) and contributor(s) and not of MDPI and/or the editor(s). MDPI and/or the editor(s) disclaim responsibility for any injury to people or property resulting from any ideas, methods, instructions or products referred to in the content. |
© 2024 by the authors. Licensee MDPI, Basel, Switzerland. This article is an open access article distributed under the terms and conditions of the Creative Commons Attribution (CC BY) license (https://creativecommons.org/licenses/by/4.0/).
Share and Cite
Liu, T.; Newman, W.E.; Browning, M.H.E.M. Daily Green Exposure, Mobility, and Health: A Scoping Review. Sustainability 2024, 16, 3412. https://doi.org/10.3390/su16083412
Liu T, Newman WE, Browning MHEM. Daily Green Exposure, Mobility, and Health: A Scoping Review. Sustainability. 2024; 16(8):3412. https://doi.org/10.3390/su16083412
Chicago/Turabian StyleLiu, Tong, Winifred E. Newman, and Matthew H. E. M. Browning. 2024. "Daily Green Exposure, Mobility, and Health: A Scoping Review" Sustainability 16, no. 8: 3412. https://doi.org/10.3390/su16083412
APA StyleLiu, T., Newman, W. E., & Browning, M. H. E. M. (2024). Daily Green Exposure, Mobility, and Health: A Scoping Review. Sustainability, 16(8), 3412. https://doi.org/10.3390/su16083412